Embed Size (px)
Citation preview
NYIT Annual Program Assessment Report, June 2017
41
ELECTRICAL & COMPUTER ENGINEERING (ECE)
Rishabh Dudheria
NYIT Annual Program Assessment Report, June 2017
42
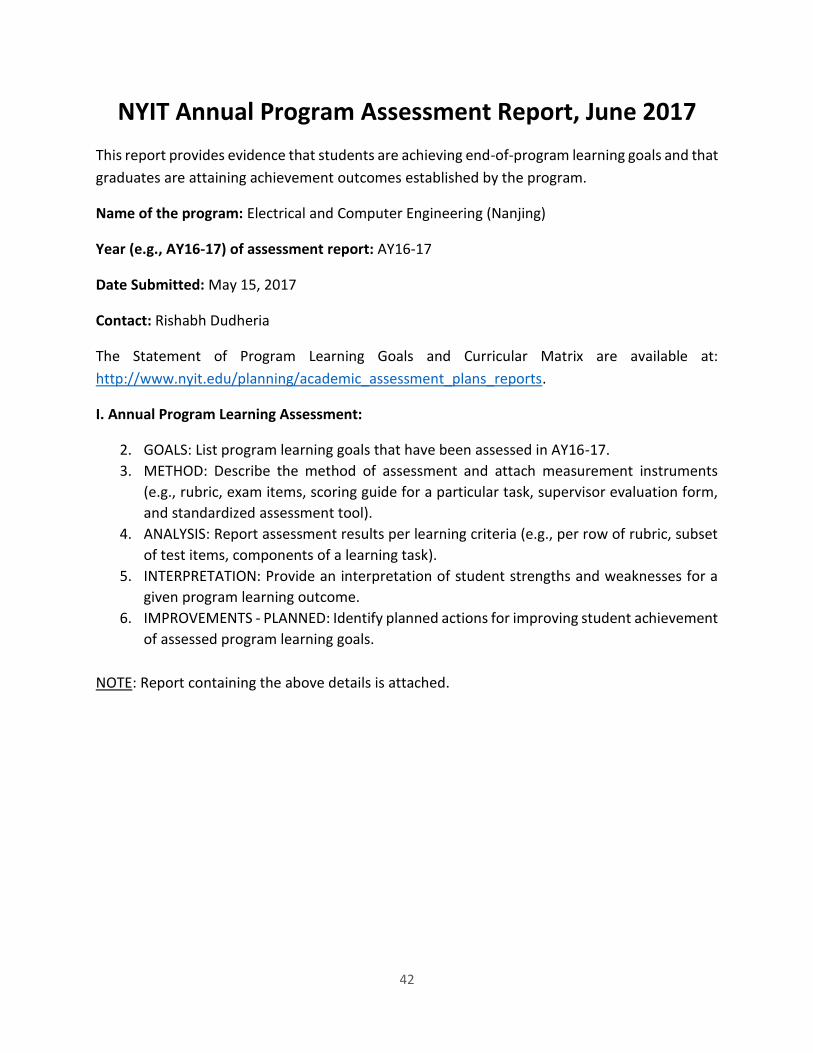
This report provides evidence that students are achieving end-of-program learning goals and that
graduates are attaining achievement outcomes established by the program.
Name of the program: Electrical and Computer Engineering (Nanjing)
Year (e.g., AY16-17) of assessment report: AY16-17
Date Submitted: May 15, 2017
Contact: Rishabh Dudheria
The Statement of Program Learning Goals and Curricular Matrix are available at:
http://www.nyit.edu/planning/academic_assessment_plans_reports.
I. Annual Program Learning Assessment:
2. GOALS: List program learning goals that have been assessed in AY16-17.
3. METHOD: Describe the method of assessment and attach measurement instruments
(e.g., rubric, exam items, scoring guide for a particular task, supervisor evaluation form,
and standardized assessment tool).
4. ANALYSIS: Report assessment results per learning criteria (e.g., per row of rubric, subset
of test items, components of a learning task).
5. INTERPRETATION: Provide an interpretation of student strengths and weaknesses for a
given program learning outcome.
6. IMPROVEMENTS - PLANNED: Identify planned actions for improving student achievement
of assessed program learning goals.
NOTE: Report containing the above details is attached.
NYIT Annual Program Assessment Report, June 2017
43
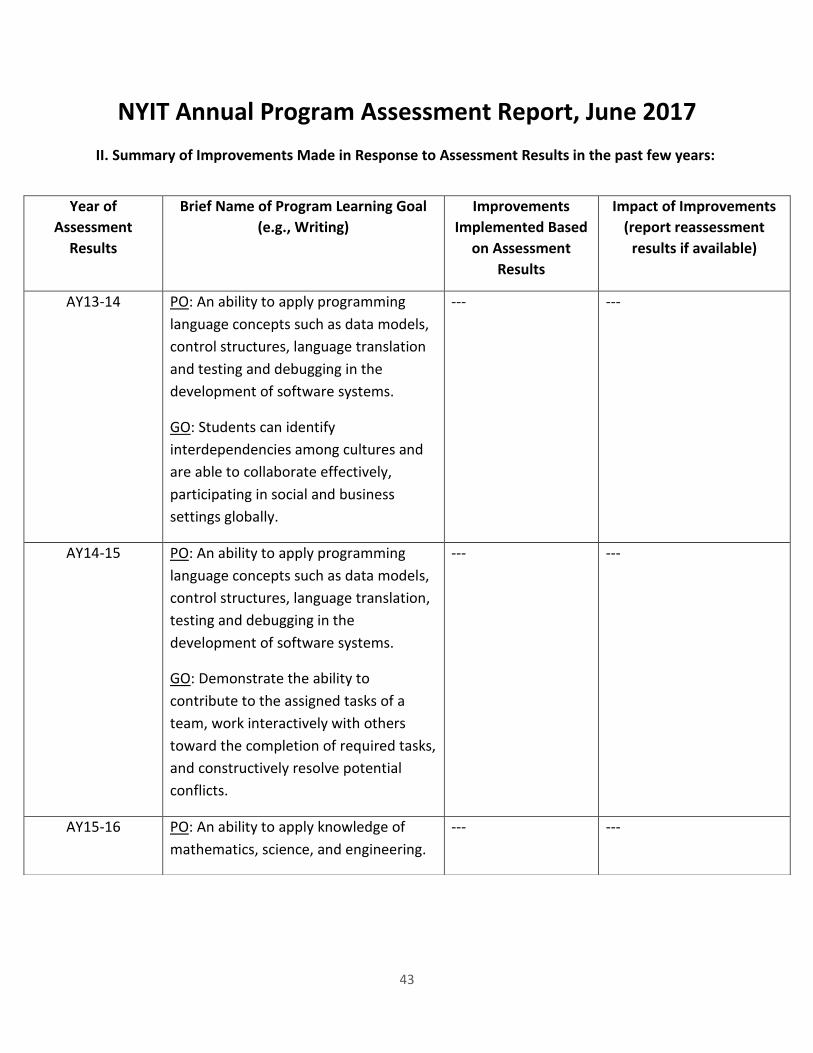
II. Summary of Improvements Made in Response to Assessment Results in the past few years:
Year of
Assessment
Results
Brief Name of Program Learning Goal
(e.g., Writing)
Improvements
Implemented Based
on Assessment
Results
Impact of Improvements
(report reassessment
results if available)
AY13-14 PO: An ability to apply programming
language concepts such as data models,
control structures, language translation
and testing and debugging in the
development of software systems.
GO: Students can identify
interdependencies among cultures and
are able to collaborate effectively,
participating in social and business
settings globally.
--- ---
AY14-15 PO: An ability to apply programming
language concepts such as data models,
control structures, language translation,
testing and debugging in the
development of software systems.
GO: Demonstrate the ability to
contribute to the assigned tasks of a
team, work interactively with others
toward the completion of required tasks,
and constructively resolve potential
conflicts.
--- ---
AY15-16 PO: An ability to apply knowledge of
mathematics, science, and engineering.
--- ---
NYIT Annual Program Assessment Report, June 2017
44
III. Brief Description of Faculty Engagement in the Current Annual Assessment Report:
The assessment report was shared with the ECE faculty members at Nanjing on 10 March 2017
requesting them to provide feedback. They thought that the overall report was satisfactory and
did not make any specific comments/suggestions regarding it.
IV. Annual Program Achievement Goals:
Please provide examples of readily available data on program student achievement (e.g., first-
year retention rates, six-year graduation rates, average time to degree completion, certification
exam pass rate, student satisfaction survey results, employer satisfaction results, % pursuing an
advanced degree, % of job placement, etc.)
---
NYIT Annual Program Assessment Report, June 2017
45
Assessment Report AY 2016-2017
Electrical and Computer Engineering Department
Contributing Committee Member: Rishabh Dudheria
Program Outcome Assessment
Comments: Mathematics is an important component of a lot of courses in the Electrical and
Computer Engineering department. Thus, sound mathematical skills provide a key foundation for
succeeding in the ECE program.
Description
1. Goals
Program Outcome: “An ability to apply knowledge of mathematics, science, and engineering.”
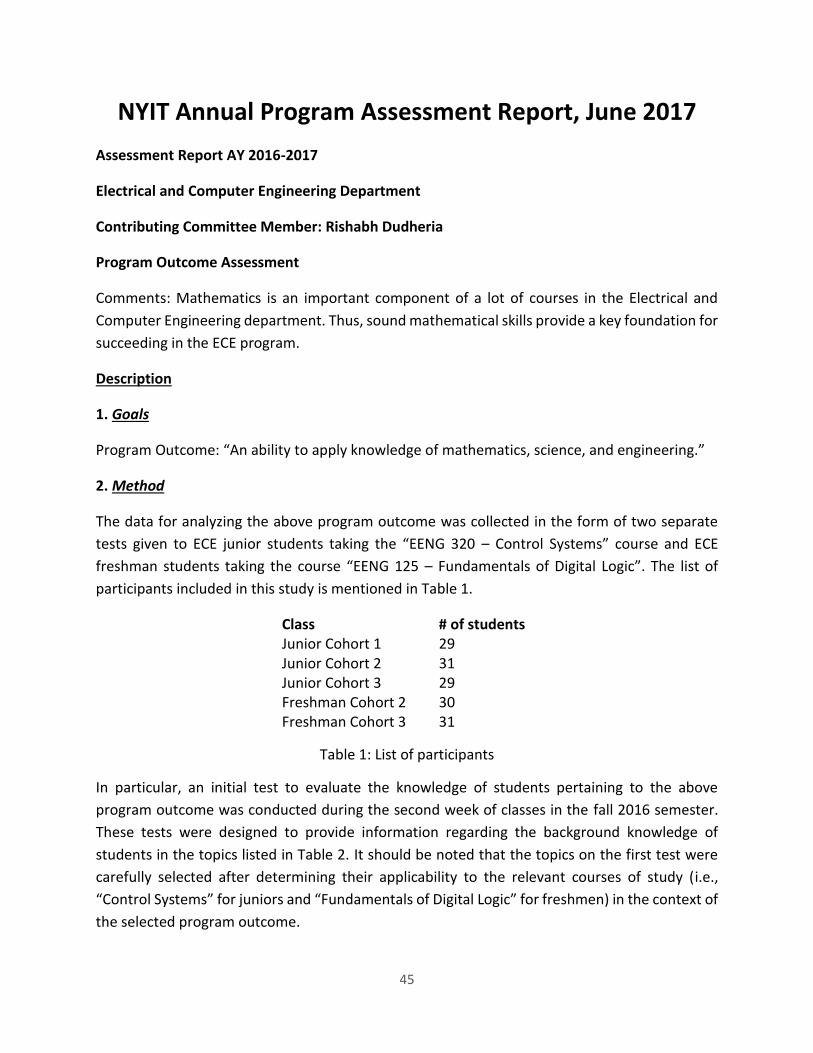
2. Method
The data for analyzing the above program outcome was collected in the form of two separate
tests given to ECE junior students taking the “EENG 320 – Control Systems” course and ECE
freshman students taking the course “EENG 125 – Fundamentals of Digital Logic”. The list of
participants included in this study is mentioned in Table 1.
Class # of students Junior Cohort 1 29 Junior Cohort 2 31 Junior Cohort 3 29 Freshman Cohort 2 30 Freshman Cohort 3 31
Table 1: List of participants
In particular, an initial test to evaluate the knowledge of students pertaining to the above
program outcome was conducted during the second week of classes in the fall 2016 semester.
These tests were designed to provide information regarding the background knowledge of
students in the topics listed in Table 2. It should be noted that the topics on the first test were
carefully selected after determining their applicability to the relevant courses of study (i.e.,
“Control Systems” for juniors and “Fundamentals of Digital Logic” for freshmen) in the context of
the selected program outcome.
NYIT Annual Program Assessment Report, June 2017
46
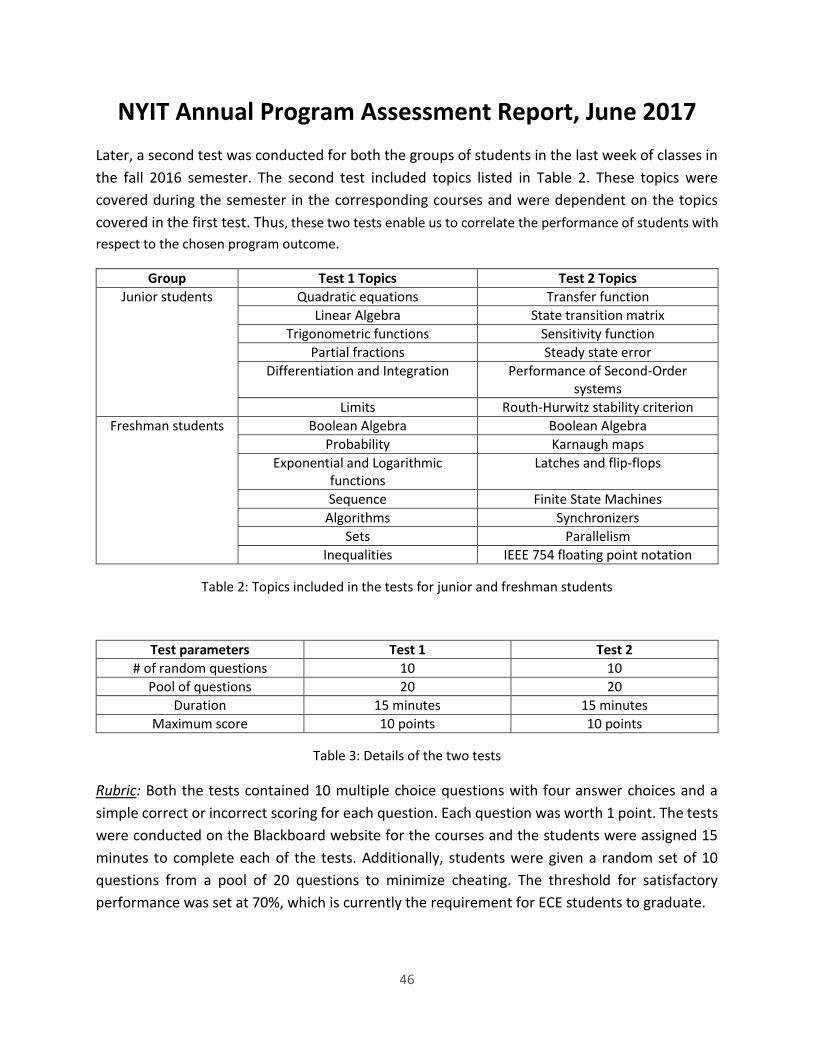
Later, a second test was conducted for both the groups of students in the last week of classes in
the fall 2016 semester. The second test included topics listed in Table 2. These topics were
covered during the semester in the corresponding courses and were dependent on the topics
covered in the first test. Thus, these two tests enable us to correlate the performance of students with
respect to the chosen program outcome.
Group Test 1 Topics Test 2 Topics
Junior students Quadratic equations Transfer function
Linear Algebra State transition matrix
Trigonometric functions Sensitivity function
Partial fractions Steady state error
Differentiation and Integration Performance of Second-Order systems
Limits Routh-Hurwitz stability criterion
Freshman students Boolean Algebra Boolean Algebra
Probability Karnaugh maps
Exponential and Logarithmic functions
Latches and flip-flops
Sequence Finite State Machines
Algorithms Synchronizers
Sets Parallelism
Inequalities IEEE 754 floating point notation
Table 2: Topics included in the tests for junior and freshman students
Test parameters Test 1 Test 2
# of random questions 10 10
Pool of questions 20 20
Duration 15 minutes 15 minutes
Maximum score 10 points 10 points
Table 3: Details of the two tests
Rubric: Both the tests contained 10 multiple choice questions with four answer choices and a
simple correct or incorrect scoring for each question. Each question was worth 1 point. The tests
were conducted on the Blackboard website for the courses and the students were assigned 15
minutes to complete each of the tests. Additionally, students were given a random set of 10
questions from a pool of 20 questions to minimize cheating. The threshold for satisfactory
performance was set at 70%, which is currently the requirement for ECE students to graduate.
NYIT Annual Program Assessment Report, June 2017
47
3. Analysis
(Note: For convenience, percentage values in this report have been rounded to 1 decimal place)
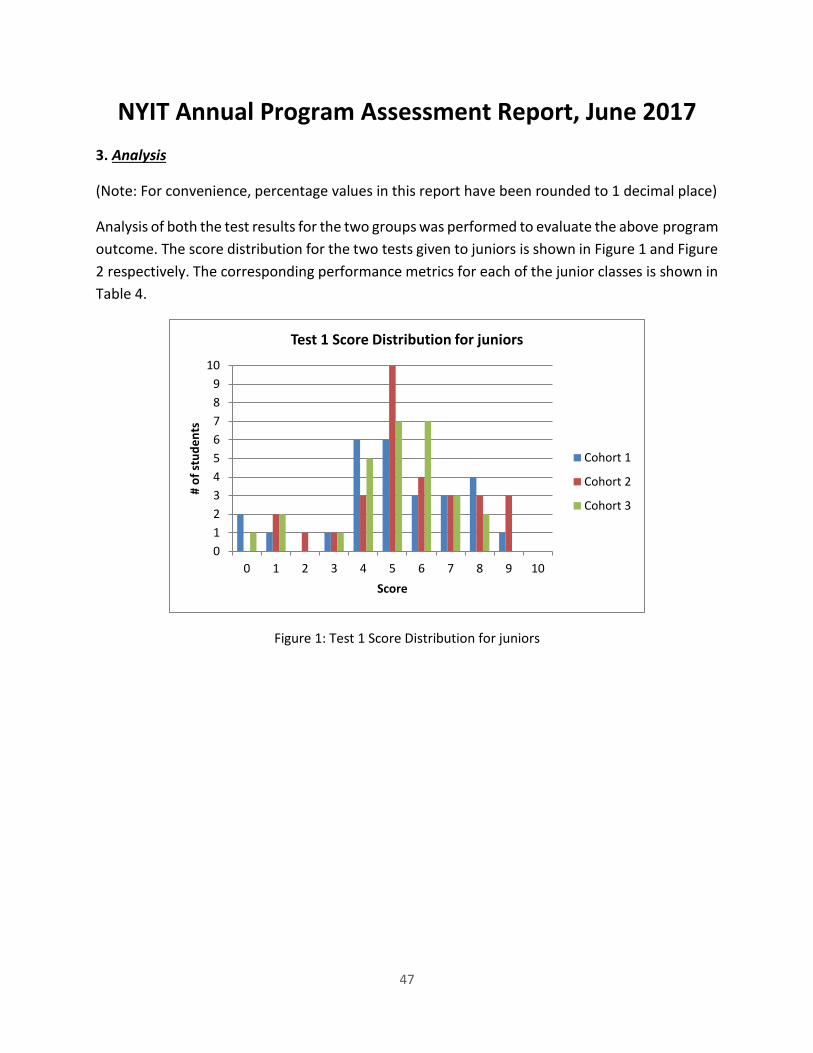
Analysis of both the test results for the two groups was performed to evaluate the above program
outcome. The score distribution for the two tests given to juniors is shown in Figure 1 and Figure
2 respectively. The corresponding performance metrics for each of the junior classes is shown in
Table 4.
Figure 1: Test 1 Score Distribution for juniors
0
1
2
3
4
5
6
7
8
9
10
0 1 2 3 4 5 6 7 8 9 10
# o
f st
ud
en
ts
Score
Test 1 Score Distribution for juniors
Cohort 1
Cohort 2
Cohort 3
NYIT Annual Program Assessment Report, June 2017
48
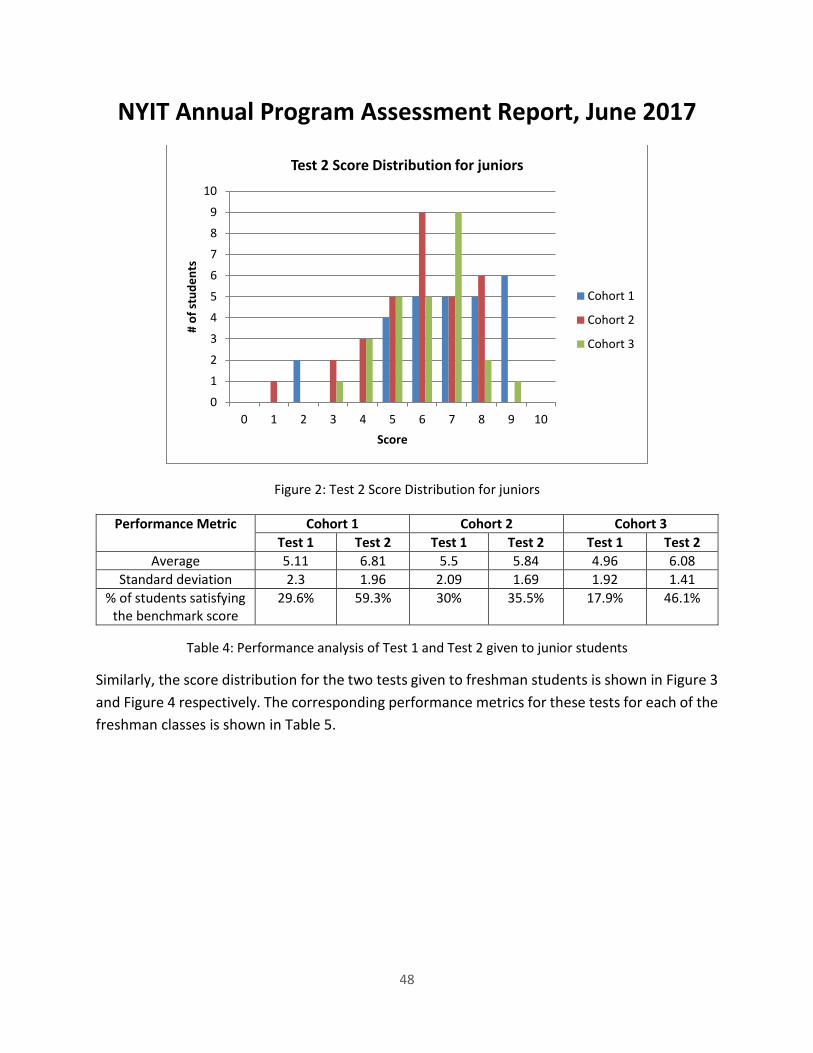
Figure 2: Test 2 Score Distribution for juniors
Performance Metric Cohort 1 Cohort 2 Cohort 3
Test 1 Test 2 Test 1 Test 2 Test 1 Test 2
Average 5.11 6.81 5.5 5.84 4.96 6.08
Standard deviation 2.3 1.96 2.09 1.69 1.92 1.41
% of students satisfying the benchmark score
29.6% 59.3% 30% 35.5% 17.9% 46.1%
Table 4: Performance analysis of Test 1 and Test 2 given to junior students
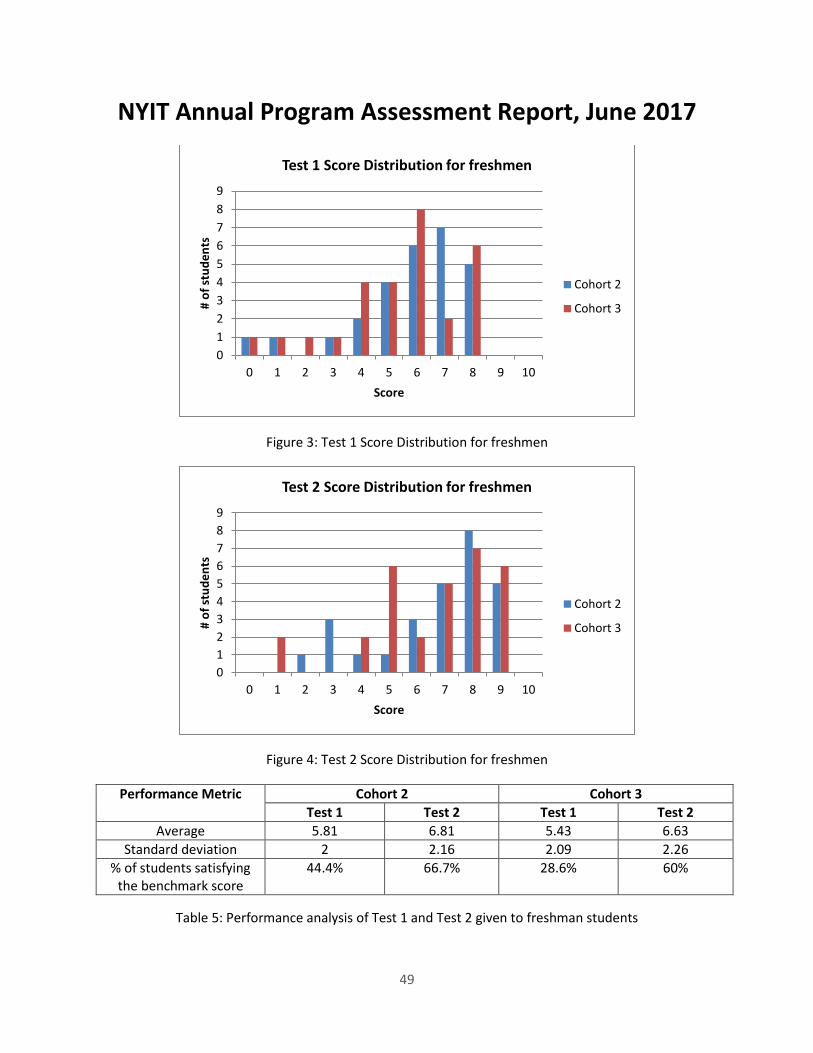
Similarly, the score distribution for the two tests given to freshman students is shown in Figure 3
and Figure 4 respectively. The corresponding performance metrics for these tests for each of the
freshman classes is shown in Table 5.
0
1
2
3
4
5
6
7
8
9
10
0 1 2 3 4 5 6 7 8 9 10
# o
f st
ud
en
ts
Score
Test 2 Score Distribution for juniors
Cohort 1
Cohort 2
Cohort 3
NYIT Annual Program Assessment Report, June 2017
49
Figure 3: Test 1 Score Distribution for freshmen
Figure 4: Test 2 Score Distribution for freshmen
Performance Metric Cohort 2 Cohort 3
Test 1 Test 2 Test 1 Test 2
Average 5.81 6.81 5.43 6.63
Standard deviation 2 2.16 2.09 2.26
% of students satisfying the benchmark score
44.4% 66.7% 28.6% 60%
Table 5: Performance analysis of Test 1 and Test 2 given to freshman students
0
1
2
3
4
5
6
7
8
9
0 1 2 3 4 5 6 7 8 9 10
# o
f st
ud
en
ts
Score
Test 1 Score Distribution for freshmen
Cohort 2
Cohort 3
0
1
2
3
4
5
6
7
8
9
0 1 2 3 4 5 6 7 8 9 10
# o
f st
ud
en
ts
Score
Test 2 Score Distribution for freshmen
Cohort 2
Cohort 3
NYIT Annual Program Assessment Report, June 2017
50
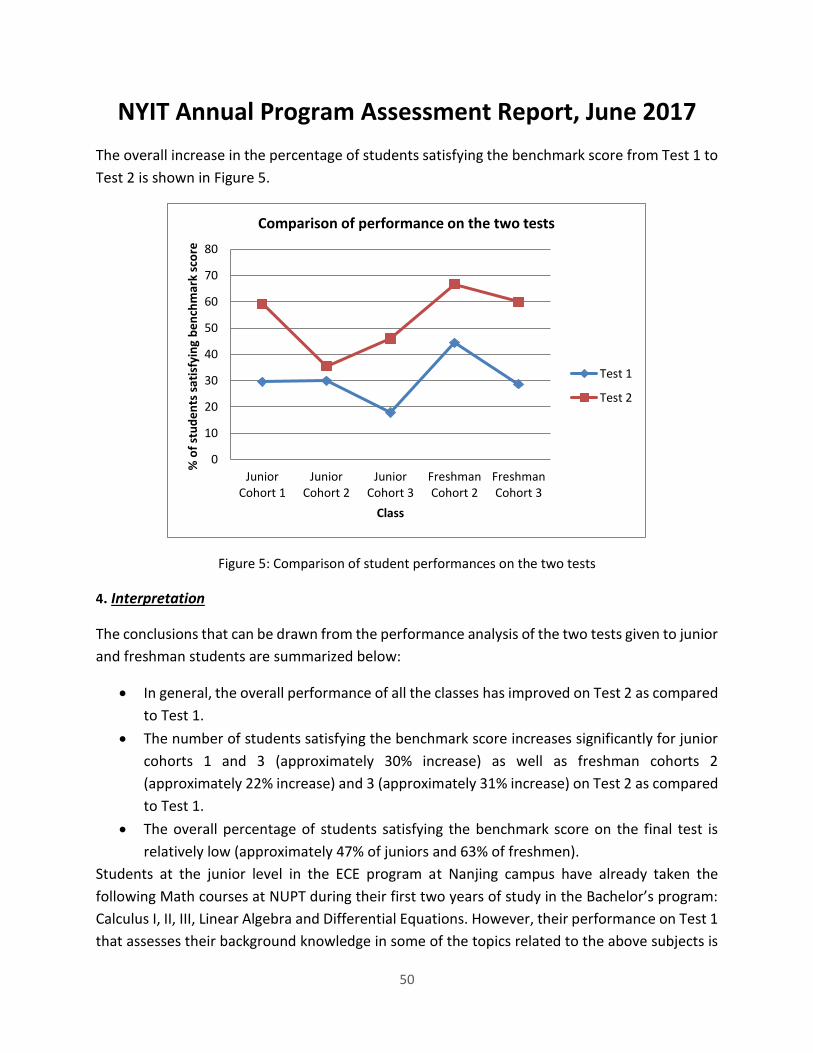
The overall increase in the percentage of students satisfying the benchmark score from Test 1 to
Test 2 is shown in Figure 5.
Figure 5: Comparison of student performances on the two tests
4. Interpretation
The conclusions that can be drawn from the performance analysis of the two tests given to junior
and freshman students are summarized below:
In general, the overall performance of all the classes has improved on Test 2 as compared
to Test 1.
The number of students satisfying the benchmark score increases significantly for junior
cohorts 1 and 3 (approximately 30% increase) as well as freshman cohorts 2
(approximately 22% increase) and 3 (approximately 31% increase) on Test 2 as compared
to Test 1.
The overall percentage of students satisfying the benchmark score on the final test is
relatively low (approximately 47% of juniors and 63% of freshmen).
Students at the junior level in the ECE program at Nanjing campus have already taken the
following Math courses at NUPT during their first two years of study in the Bachelor’s program:
Calculus I, II, III, Linear Algebra and Differential Equations. However, their performance on Test 1
that assesses their background knowledge in some of the topics related to the above subjects is
0
10
20
30
40
50
60
70
80
JuniorCohort 1
JuniorCohort 2
JuniorCohort 3
FreshmanCohort 2
FreshmanCohort 3
% o
f st
ud
en
ts s
atis
fyin
g b
en
chm
ark
sco
re
Class
Comparison of performance on the two tests
Test 1
Test 2
NYIT Annual Program Assessment Report, June 2017
51
poor. Since their background knowledge is weak, they find it difficult to cope with the new
material being taught in the course resulting in low scores on Test 2. This should be a serious
matter of concern as many of these students plan to apply for Graduate school and some of them
go to NY to finish their final year of Bachelor’s program.
5. Improvements - Planned
i) Action Items
The following suggestions may help in improving the overall knowledge and performance of
students related to mathematics, science and engineering in the future:
a) Students in both the groups seem to have weak mathematical skills, which is evident from the low average scores on Test 1. One way of improving this situation would be to open a “Math Center”, where students can get help in clarifying their doubts related to basic mathematical concepts. Senior students with good Math skills could be hired on an hourly basis to work at such centers.
b) Another remedial action that may improve this situation would be to allocate all
mathematical courses in SoECS to NYIT faculty members rather than NUPT faculty members.
ii) Future Assessment Plan
If the assessment committee member decides to test the same program outcome next year, then it is recommended that he/she use a similar testing strategy for other courses in the ECE department to contribute further to such analysis.
NYIT Annual Program Assessment Report, June 2017
52
Global Outcome Assessment
Description
1. Goals
Global Outcome: “Ethical/Moral and Civic Engagement: Students understand ethical concepts,
how different cultures define ethical or moral behavior, and gain a fuller understanding of the
responsibilities of citizenship.”
2. Method
A short survey of 10 minute duration with 6 multiple choice questions was administered to the
ECE junior and freshman students during the last week of classes in the fall 2016 semester. The
list of participants is the same as in the study for assessing the program outcome. The survey was
conducted on the Blackboard website for the individual courses. The survey was divided into the
following two parts:
A) Civic Engagement Questions
The first three questions of the survey focused on the civic engagement aspect of the global
outcome. These questions required a simple yes or no answer. The corresponding questions are
mentioned below:
Q1) Have you participated in community service via internships and/or field placements?
Q2) Have you personally walked, ran, or bicycled for a charitable cause – this is separate from
sponsoring or giving money to this type of event?
Q3) Have you volunteered or done any voluntary community service for no pay?
(Note that the questions 1 and 2 above have been adapted from the “Civic Engagement Quiz”
[1])
B) Ethical/Moral Questions
The next three questions were based on the ethical/moral aspect of the global outcome and
required the students to select the most appropriate multiple-choice option. The corresponding
questions are mentioned below:
Q4) Attitude towards Cheating
NYIT Annual Program Assessment Report, June 2017
53
(a) I have cheated on my school work/exams while in high school/college
(b) It is acceptable for me to cheat in a non-major class
(c) I think cheating is a non-ethical way of earning more points
Q5) Shoplifting Dilemma
Your community has been plagued with stealing, and many small shops have had to close
recently. At the market one day you see an obviously poor person stealing food. No one else
seems aware of what this person is doing. A sign in the store window warns that shoplifters will
be fully prosecuted. The person sees you and realizes that you know what is happening. The
person begs you not to tell. What would you do?
(a) Call the manager right away
(b) Let person go, then tell manager later
(c) Threaten the person if they’re ever seen again
(d) Do nothing
Q6) Luddite Dilemma
You are employed by a company that is replacing many jobs with computerized systems. Even
though you are not at risk, fellow employees in your department are losing their jobs. You
discover that a good friend of yours is part of a group that is intentionally damaging the computer
systems in order to try to save jobs. What would you do?
(a) Tell the friend to confess or you will turn him/her in
(b) Tell the manager without exposing your friend
(c) Hide evidence of your friend’s guilt
(d) Do nothing
(Note that the questions 5 and 6 above are based on the “Maricopa Values and Ethics Survey”
[2])
NYIT Annual Program Assessment Report, June 2017
54
3. Analysis
A) Civic Engagement Results
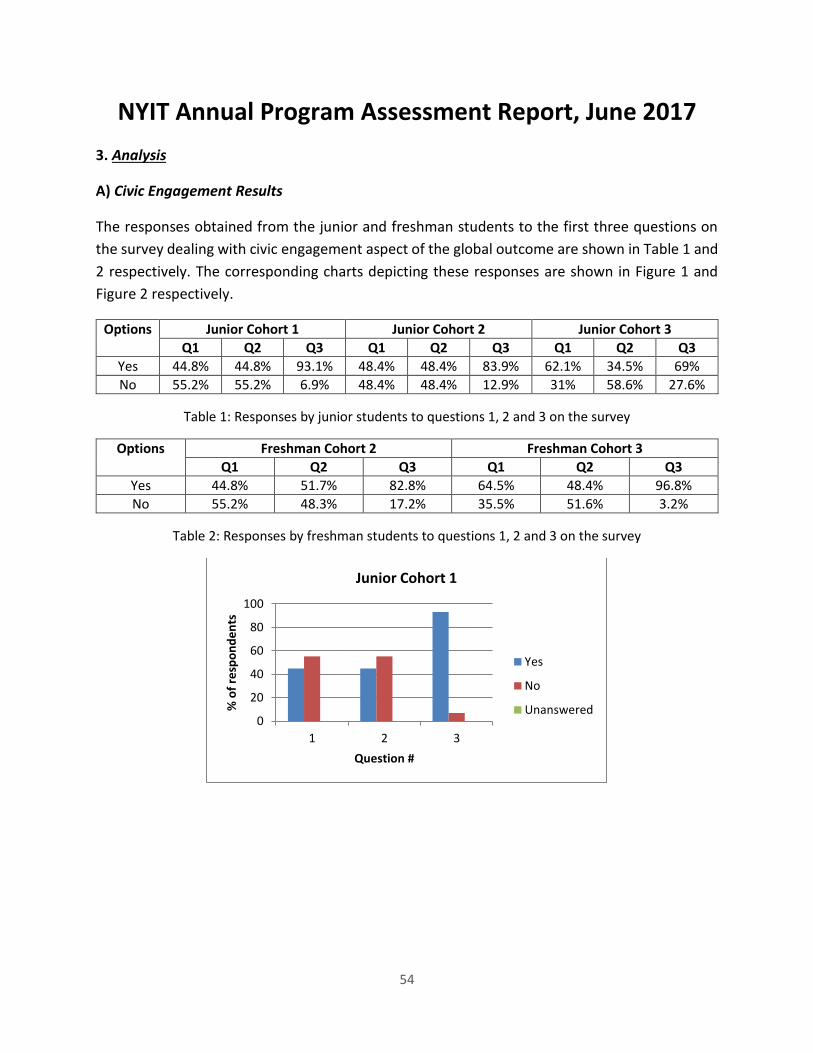
The responses obtained from the junior and freshman students to the first three questions on
the survey dealing with civic engagement aspect of the global outcome are shown in Table 1 and
2 respectively. The corresponding charts depicting these responses are shown in Figure 1 and
Figure 2 respectively.
Options Junior Cohort 1 Junior Cohort 2 Junior Cohort 3
Q1 Q2 Q3 Q1 Q2 Q3 Q1 Q2 Q3
Yes 44.8% 44.8% 93.1% 48.4% 48.4% 83.9% 62.1% 34.5% 69%
No 55.2% 55.2% 6.9% 48.4% 48.4% 12.9% 31% 58.6% 27.6%
Table 1: Responses by junior students to questions 1, 2 and 3 on the survey
Options Freshman Cohort 2 Freshman Cohort 3
Q1 Q2 Q3 Q1 Q2 Q3
Yes 44.8% 51.7% 82.8% 64.5% 48.4% 96.8%
No 55.2% 48.3% 17.2% 35.5% 51.6% 3.2%
Table 2: Responses by freshman students to questions 1, 2 and 3 on the survey
0
20
40
60
80
100
1 2 3
% o
f re
spo
nd
en
ts
Question #
Junior Cohort 1
Yes
No
Unanswered

NYIT Annual Program Assessment Report, June 2017
55
Figure 1: Charts depicting the responses by junior students to questions 1, 2 and 3 on the survey
0
20
40
60
80
100
1 2 3
% o
f re
spo
nd
en
ts
Question #
Junior Cohort 2
Yes
No
Unanswered
0
20
40
60
80
1 2 3
% o
f re
spo
nd
en
ts
Question #
Junior Cohort 3
Yes
No
Unanswered
0
10
20
30
40
50
60
70
80
90
1 2 3
% o
f re
spo
nd
en
ts
Question #
Freshman Cohort 2
Yes
No
Unanswered
NYIT Annual Program Assessment Report, June 2017
56
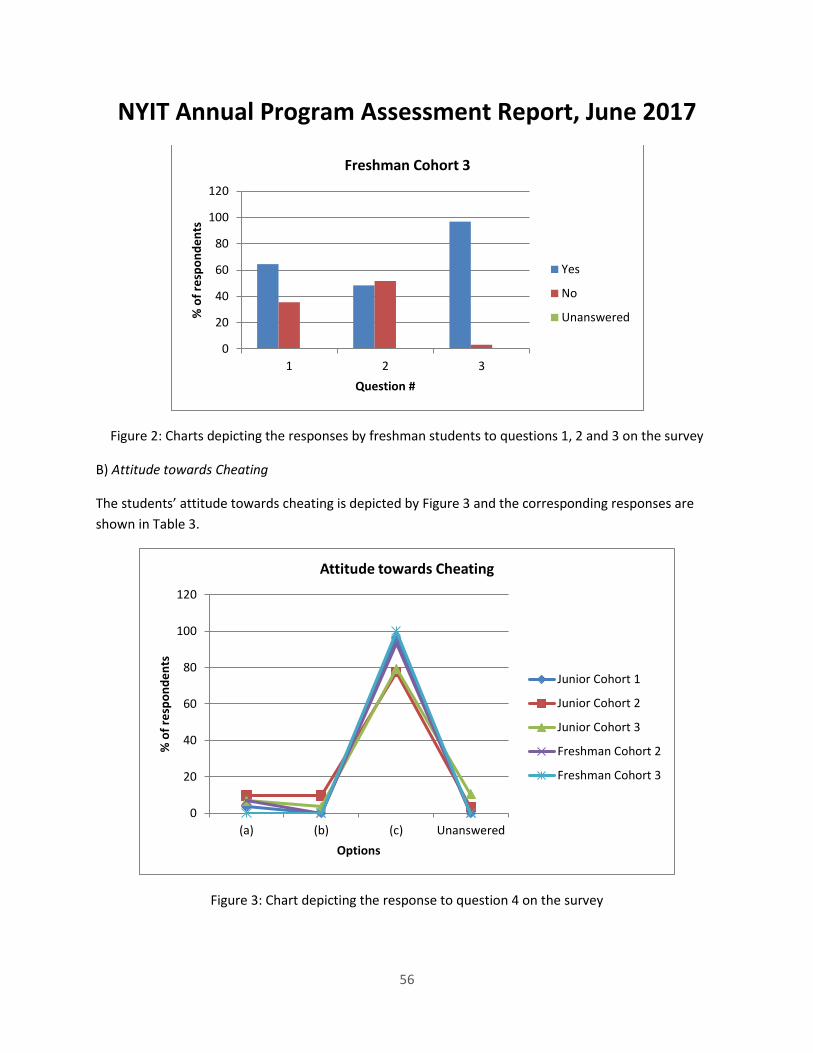
Figure 2: Charts depicting the responses by freshman students to questions 1, 2 and 3 on the survey
B) Attitude towards Cheating
The students’ attitude towards cheating is depicted by Figure 3 and the corresponding responses are
shown in Table 3.
Figure 3: Chart depicting the response to question 4 on the survey
0
20
40
60
80
100
120
1 2 3
% o
f re
spo
nd
en
ts
Question #
Freshman Cohort 3
Yes
No
Unanswered
0
20
40
60
80
100
120
(a) (b) (c) Unanswered
% o
f re
spo
nd
en
ts
Options
Attitude towards Cheating
Junior Cohort 1
Junior Cohort 2
Junior Cohort 3
Freshman Cohort 2
Freshman Cohort 3
NYIT Annual Program Assessment Report, June 2017
57
Options Junior Cohort 1
Junior Cohort 2
Junior Cohort 3
Freshman Cohort 2
Freshman Cohort 3
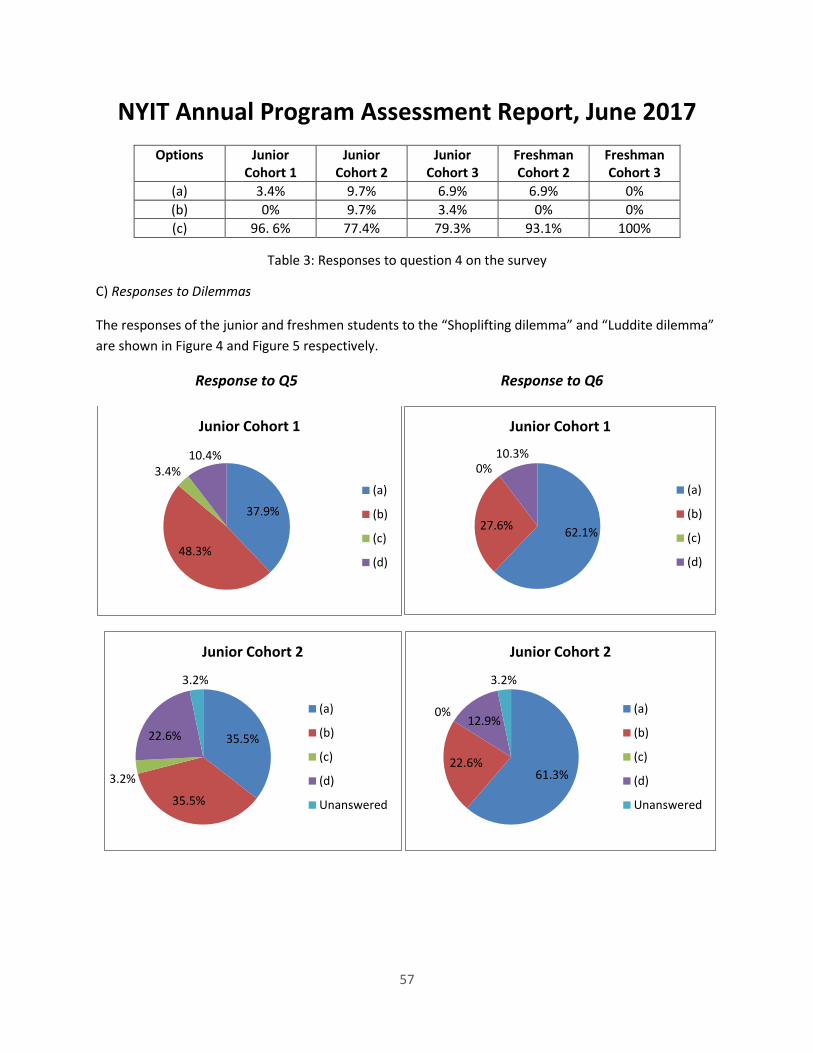
(a) 3.4% 9.7% 6.9% 6.9% 0%
(b) 0% 9.7% 3.4% 0% 0%
(c) 96. 6% 77.4% 79.3% 93.1% 100%
Table 3: Responses to question 4 on the survey
C) Responses to Dilemmas
The responses of the junior and freshmen students to the “Shoplifting dilemma” and “Luddite dilemma”
are shown in Figure 4 and Figure 5 respectively.
Response to Q5 Response to Q6
37.9%
48.3%
3.4%10.4%
Junior Cohort 1
(a)
(b)
(c)
(d)
62.1%27.6%
0%10.3%
Junior Cohort 1
(a)
(b)
(c)
(d)
35.5%
35.5%
3.2%
22.6%
3.2%
Junior Cohort 2
(a)
(b)
(c)
(d)
Unanswered
61.3%22.6%
0%12.9%
3.2%
Junior Cohort 2
(a)
(b)
(c)
(d)
Unanswered
NYIT Annual Program Assessment Report, June 2017
58
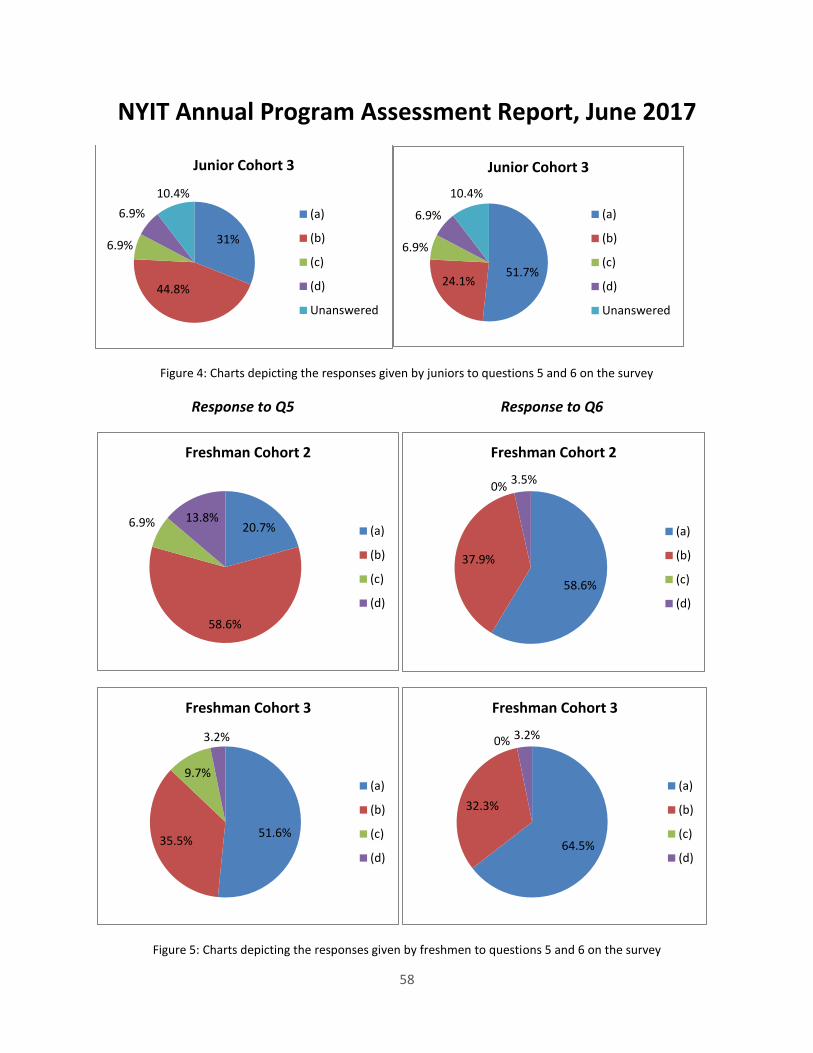
Figure 4: Charts depicting the responses given by juniors to questions 5 and 6 on the survey
Response to Q5 Response to Q6
Figure 5: Charts depicting the responses given by freshmen to questions 5 and 6 on the survey
31%
44.8%
6.9%
6.9%
10.4%
Junior Cohort 3
(a)
(b)
(c)
(d)
Unanswered
51.7%24.1%
6.9%
6.9%
10.4%
Junior Cohort 3
(a)
(b)
(c)
(d)
Unanswered
20.7%
58.6%
6.9% 13.8%
Freshman Cohort 2
(a)
(b)
(c)
(d)
58.6%
37.9%
0%3.5%
Freshman Cohort 2
(a)
(b)
(c)
(d)
51.6%35.5%
9.7%
3.2%
Freshman Cohort 3
(a)
(b)
(c)
(d)64.5%
32.3%
0% 3.2%
Freshman Cohort 3
(a)
(b)
(c)
(d)
NYIT Annual Program Assessment Report, June 2017
59
4. Interpretation
The following conclusions can be drawn based on the responses to the survey questions:
Most of the survey respondents (approximately 80% of juniors and 90% of freshmen)
have done voluntary community service.
However, only a small fraction of these students (approximately 50% of juniors and
freshmen) have been involved in community service via internship/externship or have
walked, ran or bicycled for a charitable cause.
Freshman students think more strongly about cheating as a non-ethical way of earning
more points as compared to junior students.
Junior students are more involved in cheating and think that cheating is an acceptable
way to earn more points (approximate 11% of juniors) as compared to freshman students.
A majority of the students select either option (a) or (b) for both these dilemmas. Note
that option (a) for both these questions seems to be the most justice oriented response,
while option (b) represents a middle ground approach.
5. Improvements - Planned
i) Action Items
a) A set of guidelines and options for community service via internships/externships in Nanjing should be developed and disseminated to all the students to educate them as well as to assist them in understanding the importance of such work.
b) NYIT Nanjing campus could arrange a “Community Day” for all its students, where
students are given a day off from their regular classes to participate in community service.
c) A significant percentage of junior students have either been involved in cheating or think
that it is acceptable to cheat in order to earn more points. A shift in this attitude can be
brought about by informing the students about the pitfalls of cheating and educating
them on the importance of one’s original work.
NYIT Annual Program Assessment Report, June 2017
60
ii) Future Assessment Plan
If the assessment committee decides to test the same global outcome next year, then it is recommended that they use a similar set of questions for civic engagement to assess if the student involvement in community service via internships/externships has increased. Additionally, testing students’ attitude towards cheating would provide valuable data for the NYIT-Nanjing program.
References
[1] “Civic Engagement Quiz”, Center for Information and Research on Civic Learning and
Engagement, Tufts University, 2006.
[2] “Maricopa Values and Ethics Survey”, The Institute of Global Ethics, Maricopa Community
Colleges, 2001.