Embed Size (px)
Citation preview

NWEA 2015 MAP Norms for Student and School Achievement
Status and Growth
Yeow Meng Thum Carl H. Hauser
July 1, 2015

Suggested Citation:
Thum Y. M., & Hauser, C. H. (2015). NWEA 2015 MAP Norms for Student and School Achievement Status and Growth. NWEA Research Report. Portland, OR: NWEA
COPYRIGHT © 2015 NORTHWEST EVALUATION ASSOCIATION
All rights reserved. No part of this document may be reproduced or utilized in any form or by any means, electronic or mechanical, including photocopying, recording, or by any information storage and retrieval system, without written permission from NWEA.
MAP and Measures of Academic Progress are registered trademarks and Northwest Evaluation Association and NWEA are trademarks of Northwest Evaluation Association in the U.S. and other countries. The names of other companies and their products mentioned in this paper are the trademarks of their respective owners.

NWEA 2015 MAP Norms
for Student and School Achievement Status and Growth
Yeow Meng ThumCarl H. Hauser
Northwest Evaluation AssociationPortland, Oregon
July 1, 2015

Foreword
On its face the concept of norms is fairly straightforward - take a distribution of scores, calculate the
mean and characterize each score in terms of its relative direction and distance from the mean. However,
the reality of norms and their utility for a widely used assessment system such as Northwest Evaluation
AssociationTM
(NWEATM
) Measures of Academic Progress R© (MAP R©) is highly complex.
The complexity found in the NWEA 2015 norming study is intended to improve the utility, accuracy, and
generalizability of the norms for our partners. In these norms, we have continued to refine the use of school
calendars to provide growth information that better reflects the number of instructional days available to
the student between tests. We have modeled the norms in a way that is more sensitive to the impact of
summer vacations on learning. Finally, while we have calculated student level norms and school norms
separately, they are included in the same study, a feature that should be more convenient for end users.
More important than convenience, however, is quality - both in terms of accuracy and utility. In addition to
the careful creation of this study, we have subjected the findings and report to numerous internal reviews
and have engaged external experts to review and critique the report. Its release represents our assurance
that the report is ready for use by NWEA partners with confidence and that the numbers and the inferences
can be trusted.
We note that norms reflect the performance of students and are sensitive to changes in student popula-
tions. Readers may notice differences in the patterns of student status and growth from the 2011 norms,
including some higher or lower growth patterns in various grades. This should not be interpreted as evi-
dence of any instability in the NWEA RIT Scale for MAP, changes in the accuracy of test results, or low
quality in previous norms. The scale remains stable, the measurement model for status and growth re-
mains valid and reliable, and the series of norming studies, while continually improving, has been strong
from the outset.
NWEA is pleased to make this study available to you, and stands ready to assist in using and interpreting
these norms in our shared quest to help all students learn.
Dr. Raymond Yeagley, Ed.D.
Vice-President of Research and Chief Academic Officer
Northwest Evaluation Association
i

Acknowledgments
As with past efforts, the research on NWEA 2015 MAP norms, and this report specifically, has benefitted
from the interest, contributions, and patience of many colleagues in Research, attesting to the importance
attached to this effort to support users of MAP. We feel confident that readers will find this document
invaluable to their understanding of how students attending US public schools learn over time as measured
by NWEA Measures of Academic Progress.
The 2015 MAP Norms project began almost a year ago, picked up pace this past winter when preliminary
results were shared with colleagues in Product Management and Product Engineering. Reviews and
conversations with key Professional Development and Partner Accounts stakeholders, and major NWEA
partners, occurred as this report rolled to its completion this spring.
The authors are grateful for the leadership and support of Raymond Yeagley, V.P. of Research and Chief
Academic Officer, and Wei He, Sr. Manager of Psychometric Services, throughout this period. Very
special thanks are due to Pamela Woodrow for her expert management of the project. Pamela Woodrow
also directed a secondary data collection effort to improve the accuracy of the instructional calendar
information. Rebecca Moore managed the release and publication of the report.
Dr. Yeow Meng Thum, Ph.D.
Dr. Carl H. Hauser, Ph.D.
July 1, 2015
Authors
Yeow Meng Thum, Ph.D., Senior Research Fellow at NWEA, is a research methodologist with
substantive interests surrounding the use of testing results in formulating public educational
policy. His methodological research focuses on multivariate, multilevel models for behavioral
and educational data, with a strong emphasis on methods for describing growth and change.
Carl H. Hauser, Ph.D., Senior Research Scientist at NWEA, is a psychometrician with interests
covering test development to scaling and the specials forms they take in the context of real-
world computerized adaptive testing.
ii

Contents
Foreword i
Acknowledgements ii
1 MAP Norms for Status and Growth 1
1.1 Approaches to Norming . . . . . . . . . . . . . . . . . . . . . . . . . . . . . . . . . . . . . . 2
1.2 NWEA Norming Approach . . . . . . . . . . . . . . . . . . . . . . . . . . . . . . . . . . . . . 3
1.2.1 Status and Growth . . . . . . . . . . . . . . . . . . . . . . . . . . . . . . . . . . . . . 3
1.2.2 Test Scale and Student Scores . . . . . . . . . . . . . . . . . . . . . . . . . . . . . . 4
1.2.3 Variation in Testing Schedule and Instructional Time . . . . . . . . . . . . . . . . . . 4
1.2.4 Student vs. School Norms . . . . . . . . . . . . . . . . . . . . . . . . . . . . . . . . . 5
1.2.5 Design and Analysis . . . . . . . . . . . . . . . . . . . . . . . . . . . . . . . . . . . . 5
1.3 Common Uses of Achievement and Growth Norms . . . . . . . . . . . . . . . . . . . . . . . 6
1.4 Why Norms Change . . . . . . . . . . . . . . . . . . . . . . . . . . . . . . . . . . . . . . . . 7
1.5 Expected and Actual Changes . . . . . . . . . . . . . . . . . . . . . . . . . . . . . . . . . . 8
1.6 Outline of Report . . . . . . . . . . . . . . . . . . . . . . . . . . . . . . . . . . . . . . . . . . 9
2 Item and Test Events Pools, and Instructional Time 10
2.1 MAP Basics . . . . . . . . . . . . . . . . . . . . . . . . . . . . . . . . . . . . . . . . . . . . . 11
2.2 Test Event Pools . . . . . . . . . . . . . . . . . . . . . . . . . . . . . . . . . . . . . . . . . . 13
iii
2.3 Instructional Time . . . . . . . . . . . . . . . . . . . . . . . . . . . . . . . . . . . . . . . . . 15
2.4 Constructing Instructional Calendars . . . . . . . . . . . . . . . . . . . . . . . . . . . . . . . 16
3 Reference Populationand Post-Stratification Weighting 22
3.1 School Challenge Index (SCI) . . . . . . . . . . . . . . . . . . . . . . . . . . . . . . . . . . . 24
3.2 Constructing Post-stratification Weights . . . . . . . . . . . . . . . . . . . . . . . . . . . . . 28
4 Achievement Status and Growth Normsfor Students and Schools 31
4.1 Mixed-effects Growth Model . . . . . . . . . . . . . . . . . . . . . . . . . . . . . . . . . . . . 32
4.1.1 Additive Polynomials . . . . . . . . . . . . . . . . . . . . . . . . . . . . . . . . . . . . 32
4.1.2 Using Scores as Outcomes . . . . . . . . . . . . . . . . . . . . . . . . . . . . . . . . 35
4.1.3 Estimation . . . . . . . . . . . . . . . . . . . . . . . . . . . . . . . . . . . . . . . . . . 36
4.2 Deriving Achievement and Growth Norms . . . . . . . . . . . . . . . . . . . . . . . . . . . . 36
4.2.1 Achievement Status Norms . . . . . . . . . . . . . . . . . . . . . . . . . . . . . . . . 36
4.2.2 Growth Norms . . . . . . . . . . . . . . . . . . . . . . . . . . . . . . . . . . . . . . . 37
Marginal Growth Norms . . . . . . . . . . . . . . . . . . . . . . . . . . . . . . . . . . 37
Conditional Growth Norms . . . . . . . . . . . . . . . . . . . . . . . . . . . . . . . . 38
5 Results and Discussion 40
5.1 The 2015 Achievement Status Norms . . . . . . . . . . . . . . . . . . . . . . . . . . . . . . 40
5.2 School Norms . . . . . . . . . . . . . . . . . . . . . . . . . . . . . . . . . . . . . . . . . . . . 42
5.2.1 Growth and Starting RIT . . . . . . . . . . . . . . . . . . . . . . . . . . . . . . . . . . 44
5.3 Differences between the 2011 and 2015 Student Status Norms . . . . . . . . . . . . . . . . 45
5.3.1 Implications of New Procedures . . . . . . . . . . . . . . . . . . . . . . . . . . . . . 46
References 49
iv

Appendices 53
Appendix A - School and Student Status Norms . . . . . . . . . . . . . . . . . . . . . . . . . . . 54
Appendix B - School and Student Growth Norms . . . . . . . . . . . . . . . . . . . . . . . . . . . 57
Appendix C - School and Student Status Percentiles . . . . . . . . . . . . . . . . . . . . . . . . . 66
Student . . . . . . . . . . . . . . . . . . . . . . . . . . . . . . . . . . . . . . . . . . . . . . . 67
School . . . . . . . . . . . . . . . . . . . . . . . . . . . . . . . . . . . . . . . . . . . . . . . . 91
Appendix D - Student and School Conditional Growth Distributions . . . . . . . . . . . . . . . . . 115
Mathematics . . . . . . . . . . . . . . . . . . . . . . . . . . . . . . . . . . . . . . . . . . . . 116
Reading . . . . . . . . . . . . . . . . . . . . . . . . . . . . . . . . . . . . . . . . . . . . . . . 137
Language Usage . . . . . . . . . . . . . . . . . . . . . . . . . . . . . . . . . . . . . . . . . . 158
General Science . . . . . . . . . . . . . . . . . . . . . . . . . . . . . . . . . . . . . . . . . . 176
Appendix E - Student and School Conditional Growth Percentiles . . . . . . . . . . . . . . . . . . 188
Mathematics . . . . . . . . . . . . . . . . . . . . . . . . . . . . . . . . . . . . . . . . . . . . 189
Reading . . . . . . . . . . . . . . . . . . . . . . . . . . . . . . . . . . . . . . . . . . . . . . . 253
Language Usage . . . . . . . . . . . . . . . . . . . . . . . . . . . . . . . . . . . . . . . . . . 317
General Science . . . . . . . . . . . . . . . . . . . . . . . . . . . . . . . . . . . . . . . . . . 371
Appendix F - End-of-course Tests . . . . . . . . . . . . . . . . . . . . . . . . . . . . . . . . . . . 407
v

List of Tables
2.1 Number of Items per Test by Content Area . . . . . . . . . . . . . . . . . . . . . . . . . . . 12
2.2 Norming Study Age Cohorts . . . . . . . . . . . . . . . . . . . . . . . . . . . . . . . . . . . 13
2.3 Content Area Test Record Pools . . . . . . . . . . . . . . . . . . . . . . . . . . . . . . . . 14
2.4 2015 RIT Norms Content Area Coverage . . . . . . . . . . . . . . . . . . . . . . . . . . . . 15
2.5 Count of Students Reading Test Events Fall 2012-Spring 2013 . . . . . . . . . . . . . . . 18
2.6 Count of Students Mathematics Test Events Fall 2012-Spring 2013 . . . . . . . . . . . . . 19
2.7 Count of Students Language Usage Test Events Fall 2012-Spring 2013 . . . . . . . . . . 20
2.8 Count of Students General Science Test Events Fall 2012-Spring 2013 . . . . . . . . . . . 21
3.1 NCES Variables Used in Post-stratification Weighting . . . . . . . . . . . . . . . . . . . . . 23
3.2 Distributions of Continuous NCES Variables . . . . . . . . . . . . . . . . . . . . . . . . . . 24
3.3 Distributions of Categorical NCES Variables . . . . . . . . . . . . . . . . . . . . . . . . . . 26
3.4 Post-stratification Weights for Mathematics Norms by Grade and SCI Decile . . . . . . . . 29
3.5 Post-stratification Weights for Reading Norms by Grade and SCI Decile . . . . . . . . . . 30
A.1 Mathematics and Reading Achievement Status Norms . . . . . . . . . . . . . . . . . . . . 55
A.2 Language Usage and General Science Achievement Status Norms . . . . . . . . . . . . 56
B.1 Student Mathematics Growth Norms . . . . . . . . . . . . . . . . . . . . . . . . . . . . . . 58
B.2 School Mathematics Growth Norms . . . . . . . . . . . . . . . . . . . . . . . . . . . . . . 59
vi
B.3 Student Reading Growth Norms . . . . . . . . . . . . . . . . . . . . . . . . . . . . . . . . 60
B.4 School Reading Growth Norms . . . . . . . . . . . . . . . . . . . . . . . . . . . . . . . . . 61
B.5 Student Language Usage Growth Norms . . . . . . . . . . . . . . . . . . . . . . . . . . . 62
B.6 School Language Usage Growth Norms . . . . . . . . . . . . . . . . . . . . . . . . . . . . 63
B.7 Student General Science Growth Norms . . . . . . . . . . . . . . . . . . . . . . . . . . . 64
B.8 School General Science Growth Norms . . . . . . . . . . . . . . . . . . . . . . . . . . . . 65
C.1.1 Fall Mathematics Student Achievement Percentiles . . . . . . . . . . . . . . . . . . . . . . 67
C.1.1 Fall Mathematics Student Achievement Percentiles , continued . . . . . . . . . . . . . . . 68
C.1.2 Winter Mathematics Student Achievement Percentiles . . . . . . . . . . . . . . . . . . . . 69
C.1.2 Winter Mathematics Student Achievement Percentiles , continued . . . . . . . . . . . . . . 70
C.1.3 Spring Mathematics Student Achievement Percentiles . . . . . . . . . . . . . . . . . . . . 71
C.1.3 Spring Mathematics Student Achievement Percentiles , continued . . . . . . . . . . . . . . 72
C.1.4 Fall Reading Student Achievement Percentiles . . . . . . . . . . . . . . . . . . . . . . . . 73
C.1.4 Fall Reading Student Achievement Percentiles , continued . . . . . . . . . . . . . . . . . . 74
C.1.5 Winter Reading Student Achievement Percentiles . . . . . . . . . . . . . . . . . . . . . . 75
C.1.5 Winter Reading Student Achievement Percentiles , continued . . . . . . . . . . . . . . . . 76
C.1.6 Spring Reading Student Achievement Percentiles . . . . . . . . . . . . . . . . . . . . . . 77
C.1.6 Spring Reading Student Achievement Percentiles , continued . . . . . . . . . . . . . . . . 78
C.1.7 Fall Language Usage Student Achievement Percentiles . . . . . . . . . . . . . . . . . . . 79
C.1.7 Fall Language Usage Student Achievement Percentiles , continued . . . . . . . . . . . . . 80
C.1.8 Winter Language Usage Student Achievement Percentiles . . . . . . . . . . . . . . . . . 81
C.1.8 Winter Language Usage Student Achievement Percentiles , continued . . . . . . . . . . . 82
C.1.9 Spring Language Usage Student Achievement Percentiles . . . . . . . . . . . . . . . . . 83
C.1.9 Spring Language Usage Student Achievement Percentiles , continued . . . . . . . . . . . 84
vii

C.1.10Fall General Science Student Achievement Percentiles . . . . . . . . . . . . . . . . . . . 85
C.1.10Fall General Science Student Achievement Percentiles , continued . . . . . . . . . . . . . 86
C.1.11Winter General Science Student Achievement Percentiles . . . . . . . . . . . . . . . . . . 87
C.1.11Winter General Science Student Achievement Percentiles , continued . . . . . . . . . . . 88
C.1.12Spring General Science Student Achievement Percentiles . . . . . . . . . . . . . . . . . . 89
C.1.12Spring General Science Student Achievement Percentiles , continued . . . . . . . . . . . 90
C.2.1 Fall Mathematics School Achievement Percentiles . . . . . . . . . . . . . . . . . . . . . . 91
C.2.1 Fall Mathematics School Achievement Percentiles , continued . . . . . . . . . . . . . . . . 92
C.2.2 Winter Mathematics School Achievement Percentiles . . . . . . . . . . . . . . . . . . . . 93
C.2.2 Winter Mathematics School Achievement Percentiles , continued . . . . . . . . . . . . . . 94
C.2.3 Spring Mathematics School Achievement Percentiles . . . . . . . . . . . . . . . . . . . . 95
C.2.3 Spring Mathematics School Achievement Percentiles , continued . . . . . . . . . . . . . . 96
C.2.4 Fall Reading School Achievement Percentiles . . . . . . . . . . . . . . . . . . . . . . . . . 97
C.2.4 Fall Reading School Achievement Percentiles , continued . . . . . . . . . . . . . . . . . . 98
C.2.5 Winter Reading School Achievement Percentiles . . . . . . . . . . . . . . . . . . . . . . . 99
C.2.5 Winter Reading School Achievement Percentiles , continued . . . . . . . . . . . . . . . . . 100
C.2.6 Spring Reading School Achievement Percentiles . . . . . . . . . . . . . . . . . . . . . . . 101
C.2.6 Spring Reading School Achievement Percentiles , continued . . . . . . . . . . . . . . . . . 102
C.2.7 Fall Language Usage School Achievement Percentiles . . . . . . . . . . . . . . . . . . . . 103
C.2.7 Fall Language Usage School Achievement Percentiles , continued . . . . . . . . . . . . . 104
C.2.8 Winter Language Usage School Achievement Percentiles . . . . . . . . . . . . . . . . . . 105
C.2.8 Winter Language Usage School Achievement Percentiles , continued . . . . . . . . . . . . 106
C.2.9 Spring Language Usage School Achievement Percentiles . . . . . . . . . . . . . . . . . . 107
C.2.9 Spring Language Usage School Achievement Percentiles , continued . . . . . . . . . . . . 108
viii

C.2.10Fall General Science School Achievement Percentiles . . . . . . . . . . . . . . . . . . . . 109
C.2.10Fall General Science School Achievement Percentiles , continued . . . . . . . . . . . . . . 110
C.2.11Winter General Science School Achievement Percentiles . . . . . . . . . . . . . . . . . . 111
C.2.11Winter General Science School Achievement Percentiles , continued . . . . . . . . . . . . 112
C.2.12Spring General Science School Achievement Percentiles . . . . . . . . . . . . . . . . . . 113
C.2.12Spring General Science School Achievement Percentiles , continued . . . . . . . . . . . . 114
D.1.1 Mathematics Grade K Conditional Growth Distributions . . . . . . . . . . . . . . . . . . . 116
D.1.2 Mathematics Grade 1 Conditional Growth Distributions . . . . . . . . . . . . . . . . . . . 117
D.1.3 Mathematics Grade 2 Conditional Growth Distributions . . . . . . . . . . . . . . . . . . . 119
D.1.4 Mathematics Grade 3 Conditional Growth Distributions . . . . . . . . . . . . . . . . . . . 121
D.1.5 Mathematics Grade 4 Conditional Growth Distributions . . . . . . . . . . . . . . . . . . . 123
D.1.6 Mathematics Grade 5 Conditional Growth Distributions . . . . . . . . . . . . . . . . . . . 125
D.1.7 Mathematics Grade 6 Conditional Growth Distributions . . . . . . . . . . . . . . . . . . . 127
D.1.8 Mathematics Grade 7 Conditional Growth Distributions . . . . . . . . . . . . . . . . . . . 129
D.1.9 Mathematics Grade 8 Conditional Growth Distributions . . . . . . . . . . . . . . . . . . . 131
D.1.10Mathematics Grade 9 Conditional Growth Distributions . . . . . . . . . . . . . . . . . . . 133
D.1.11Mathematics Grade 10 Conditional Growth Distributions . . . . . . . . . . . . . . . . . . . 135
D.2.1 Reading Grade K Conditional Growth Distributions . . . . . . . . . . . . . . . . . . . . . . 137
D.2.2 Reading Grade 1 Conditional Growth Distributions . . . . . . . . . . . . . . . . . . . . . . 138
D.2.3 Reading Grade 2 Conditional Growth Distributions . . . . . . . . . . . . . . . . . . . . . . 140
D.2.4 Reading Grade 3 Conditional Growth Distributions . . . . . . . . . . . . . . . . . . . . . . 142
D.2.5 Reading Grade 4 Conditional Growth Distributions . . . . . . . . . . . . . . . . . . . . . . 144
D.2.6 Reading Grade 5 Conditional Growth Distributions . . . . . . . . . . . . . . . . . . . . . . 146
D.2.7 Reading Grade 6 Conditional Growth Distributions . . . . . . . . . . . . . . . . . . . . . . 148
ix

D.2.8 Reading Grade 7 Conditional Growth Distributions . . . . . . . . . . . . . . . . . . . . . . 150
D.2.9 Reading Grade 8 Conditional Growth Distributions . . . . . . . . . . . . . . . . . . . . . . 152
D.2.10Reading Grade 9 Conditional Growth Distributions . . . . . . . . . . . . . . . . . . . . . . 154
D.2.11Reading Grade 10 Conditional Growth Distributions . . . . . . . . . . . . . . . . . . . . . 156
D.3.1 Language Usage Grade 2 Conditional Growth Distributions . . . . . . . . . . . . . . . . . 158
D.3.2 Language Usage Grade 3 Conditional Growth Distributions . . . . . . . . . . . . . . . . . 160
D.3.3 Language Usage Grade 4 Conditional Growth Distributions . . . . . . . . . . . . . . . . . 162
D.3.4 Language Usage Grade 5 Conditional Growth Distributions . . . . . . . . . . . . . . . . . 164
D.3.5 Language Usage Grade 6 Conditional Growth Distributions . . . . . . . . . . . . . . . . . 166
D.3.6 Language Usage Grade 7 Conditional Growth Distributions . . . . . . . . . . . . . . . . . 168
D.3.7 Language Usage Grade 8 Conditional Growth Distributions . . . . . . . . . . . . . . . . . 170
D.3.8 Language Usage Grade 9 Conditional Growth Distributions . . . . . . . . . . . . . . . . . 172
D.3.9 Language Usage Grade 10 Conditional Growth Distributions . . . . . . . . . . . . . . . . 174
D.4.1 General Science Grade 3 Conditional Growth Distributions . . . . . . . . . . . . . . . . . 176
D.4.2 General Science Grade 4 Conditional Growth Distributions . . . . . . . . . . . . . . . . . 178
D.4.3 General Science Grade 5 Conditional Growth Distributions . . . . . . . . . . . . . . . . . 180
D.4.4 General Science Grade 6 Conditional Growth Distributions . . . . . . . . . . . . . . . . . 182
D.4.5 General Science Grade 7 Conditional Growth Distributions . . . . . . . . . . . . . . . . . 184
D.4.6 General Science Grade 8 Conditional Growth Distributions . . . . . . . . . . . . . . . . . 186
E.1.1 Mathematics Grade K From Fall To N Fall Conditional Growth Percentile . . . . . . . . . . 189
E.1.2 Mathematics Grade K From Fall To Spring Conditional Growth Percentile . . . . . . . . . 190
E.1.3 Mathematics Grade K From Fall To Winter Conditional Growth Percentile . . . . . . . . . 191
E.1.4 Mathematics Grade K From Winter To Spring Conditional Growth Percentile . . . . . . . 192
E.1.5 Mathematics Grade 1 From Last Winter To Winter Conditional Growth Percentile . . . . . 193
x

E.1.6 Mathematics Grade 1 From Last Spring To Spring Conditional Growth Percentile . . . . . 194
E.1.7 Mathematics Grade 1 From Fall To N Fall Conditional Growth Percentile . . . . . . . . . . 195
E.1.8 Mathematics Grade 1 From Fall To Spring Conditional Growth Percentile . . . . . . . . . 196
E.1.9 Mathematics Grade 1 From Fall To Winter Conditional Growth Percentile . . . . . . . . . 197
E.1.10Mathematics Grade 1 From Winter To Spring Conditional Growth Percentile . . . . . . . . 198
E.1.11Mathematics Grade 2 From Last Winter To Winter Conditional Growth Percentile . . . . . 199
E.1.12Mathematics Grade 2 From Last Spring To Spring Conditional Growth Percentile . . . . . 200
E.1.13Mathematics Grade 2 From Fall To N Fall Conditional Growth Percentile . . . . . . . . . . 201
E.1.14Mathematics Grade 2 From Fall To Spring Conditional Growth Percentile . . . . . . . . . 202
E.1.15Mathematics Grade 2 From Fall To Winter Conditional Growth Percentile . . . . . . . . . 203
E.1.16Mathematics Grade 2 From Winter To Spring Conditional Growth Percentile . . . . . . . . 204
E.1.17Mathematics Grade 3 From Last Winter To Winter Conditional Growth Percentile . . . . . 205
E.1.18Mathematics Grade 3 From Last Spring To Spring Conditional Growth Percentile . . . . . 206
E.1.19Mathematics Grade 3 From Fall To N Fall Conditional Growth Percentile . . . . . . . . . . 207
E.1.20Mathematics Grade 3 From Fall To Spring Conditional Growth Percentile . . . . . . . . . 208
E.1.21Mathematics Grade 3 From Fall To Winter Conditional Growth Percentile . . . . . . . . . 209
E.1.22Mathematics Grade 3 From Winter To Spring Conditional Growth Percentile . . . . . . . . 210
E.1.23Mathematics Grade 4 From Last Winter To Winter Conditional Growth Percentile . . . . . 211
E.1.24Mathematics Grade 4 From Last Spring To Spring Conditional Growth Percentile . . . . . 212
E.1.25Mathematics Grade 4 From Fall To N Fall Conditional Growth Percentile . . . . . . . . . . 213
E.1.26Mathematics Grade 4 From Fall To Spring Conditional Growth Percentile . . . . . . . . . 214
E.1.27Mathematics Grade 4 From Fall To Winter Conditional Growth Percentile . . . . . . . . . 215
E.1.28Mathematics Grade 4 From Winter To Spring Conditional Growth Percentile . . . . . . . . 216
E.1.29Mathematics Grade 5 From Last Winter To Winter Conditional Growth Percentile . . . . . 217
xi

E.1.30Mathematics Grade 5 From Last Spring To Spring Conditional Growth Percentile . . . . . 218
E.1.31Mathematics Grade 5 From Fall To N Fall Conditional Growth Percentile . . . . . . . . . . 219
E.1.32Mathematics Grade 5 From Fall To Spring Conditional Growth Percentile . . . . . . . . . 220
E.1.33Mathematics Grade 5 From Fall To Winter Conditional Growth Percentile . . . . . . . . . 221
E.1.34Mathematics Grade 5 From Winter To Spring Conditional Growth Percentile . . . . . . . . 222
E.1.35Mathematics Grade 6 From Last Winter To Winter Conditional Growth Percentile . . . . . 223
E.1.36Mathematics Grade 6 From Last Spring To Spring Conditional Growth Percentile . . . . . 224
E.1.37Mathematics Grade 6 From Fall To N Fall Conditional Growth Percentile . . . . . . . . . . 225
E.1.38Mathematics Grade 6 From Fall To Spring Conditional Growth Percentile . . . . . . . . . 226
E.1.39Mathematics Grade 6 From Fall To Winter Conditional Growth Percentile . . . . . . . . . 227
E.1.40Mathematics Grade 6 From Winter To Spring Conditional Growth Percentile . . . . . . . . 228
E.1.41Mathematics Grade 7 From Last Winter To Winter Conditional Growth Percentile . . . . . 229
E.1.42Mathematics Grade 7 From Last Spring To Spring Conditional Growth Percentile . . . . . 230
E.1.43Mathematics Grade 7 From Fall To N Fall Conditional Growth Percentile . . . . . . . . . . 231
E.1.44Mathematics Grade 7 From Fall To Spring Conditional Growth Percentile . . . . . . . . . 232
E.1.45Mathematics Grade 7 From Fall To Winter Conditional Growth Percentile . . . . . . . . . 233
E.1.46Mathematics Grade 7 From Winter To Spring Conditional Growth Percentile . . . . . . . . 234
E.1.47Mathematics Grade 8 From Last Winter To Winter Conditional Growth Percentile . . . . . 235
E.1.48Mathematics Grade 8 From Last Spring To Spring Conditional Growth Percentile . . . . . 236
E.1.49Mathematics Grade 8 From Fall To N Fall Conditional Growth Percentile . . . . . . . . . . 237
E.1.50Mathematics Grade 8 From Fall To Spring Conditional Growth Percentile . . . . . . . . . 238
E.1.51Mathematics Grade 8 From Fall To Winter Conditional Growth Percentile . . . . . . . . . 239
E.1.52Mathematics Grade 8 From Winter To Spring Conditional Growth Percentile . . . . . . . . 240
E.1.53Mathematics Grade 9 From Last Winter To Winter Conditional Growth Percentile . . . . . 241
xii

E.1.54Mathematics Grade 9 From Last Spring To Spring Conditional Growth Percentile . . . . . 242
E.1.55Mathematics Grade 9 From Fall To N Fall Conditional Growth Percentile . . . . . . . . . . 243
E.1.56Mathematics Grade 9 From Fall To Spring Conditional Growth Percentile . . . . . . . . . 244
E.1.57Mathematics Grade 9 From Fall To Winter Conditional Growth Percentile . . . . . . . . . 245
E.1.58Mathematics Grade 9 From Winter To Spring Conditional Growth Percentile . . . . . . . . 246
E.1.59Mathematics Grade 10 From Last Winter To Winter Conditional Growth Percentile . . . . 247
E.1.60Mathematics Grade 10 From Last Spring To Spring Conditional Growth Percentile . . . . 248
E.1.61Mathematics Grade 10 From Fall To N Fall Conditional Growth Percentile . . . . . . . . . 249
E.1.62Mathematics Grade 10 From Fall To Spring Conditional Growth Percentile . . . . . . . . . 250
E.1.63Mathematics Grade 10 From Fall To Winter Conditional Growth Percentile . . . . . . . . . 251
E.1.64Mathematics Grade 10 From Winter To Spring Conditional Growth Percentile . . . . . . . 252
E.2.1 Reading Grade K From Fall To N Fall Conditional Growth Percentile . . . . . . . . . . . . 253
E.2.2 Reading Grade K From Fall To Spring Conditional Growth Percentile . . . . . . . . . . . . 254
E.2.3 Reading Grade K From Fall To Winter Conditional Growth Percentile . . . . . . . . . . . . 255
E.2.4 Reading Grade K From Winter To Spring Conditional Growth Percentile . . . . . . . . . . 256
E.2.5 Reading Grade 1 From Last Winter To Winter Conditional Growth Percentile . . . . . . . 257
E.2.6 Reading Grade 1 From Last Spring To Spring Conditional Growth Percentile . . . . . . . 258
E.2.7 Reading Grade 1 From Fall To N Fall Conditional Growth Percentile . . . . . . . . . . . . 259
E.2.8 Reading Grade 1 From Fall To Spring Conditional Growth Percentile . . . . . . . . . . . . 260
E.2.9 Reading Grade 1 From Fall To Winter Conditional Growth Percentile . . . . . . . . . . . . 261
E.2.10Reading Grade 1 From Winter To Spring Conditional Growth Percentile . . . . . . . . . . 262
E.2.11Reading Grade 2 From Last Winter To Winter Conditional Growth Percentile . . . . . . . 263
E.2.12Reading Grade 2 From Last Spring To Spring Conditional Growth Percentile . . . . . . . 264
E.2.13Reading Grade 2 From Fall To N Fall Conditional Growth Percentile . . . . . . . . . . . . 265
xiii
E.2.14Reading Grade 2 From Fall To Spring Conditional Growth Percentile . . . . . . . . . . . . 266
E.2.15Reading Grade 2 From Fall To Winter Conditional Growth Percentile . . . . . . . . . . . . 267
E.2.16Reading Grade 2 From Winter To Spring Conditional Growth Percentile . . . . . . . . . . 268
E.2.17Reading Grade 3 From Last Winter To Winter Conditional Growth Percentile . . . . . . . 269
E.2.18Reading Grade 3 From Last Spring To Spring Conditional Growth Percentile . . . . . . . 270
E.2.19Reading Grade 3 From Fall To N Fall Conditional Growth Percentile . . . . . . . . . . . . 271
E.2.20Reading Grade 3 From Fall To Spring Conditional Growth Percentile . . . . . . . . . . . . 272
E.2.21Reading Grade 3 From Fall To Winter Conditional Growth Percentile . . . . . . . . . . . . 273
E.2.22Reading Grade 3 From Winter To Spring Conditional Growth Percentile . . . . . . . . . . 274
E.2.23Reading Grade 4 From Last Winter To Winter Conditional Growth Percentile . . . . . . . 275
E.2.24Reading Grade 4 From Last Spring To Spring Conditional Growth Percentile . . . . . . . 276
E.2.25Reading Grade 4 From Fall To N Fall Conditional Growth Percentile . . . . . . . . . . . . 277
E.2.26Reading Grade 4 From Fall To Spring Conditional Growth Percentile . . . . . . . . . . . . 278
E.2.27Reading Grade 4 From Fall To Winter Conditional Growth Percentile . . . . . . . . . . . . 279
E.2.28Reading Grade 4 From Winter To Spring Conditional Growth Percentile . . . . . . . . . . 280
E.2.29Reading Grade 5 From Last Winter To Winter Conditional Growth Percentile . . . . . . . 281
E.2.30Reading Grade 5 From Last Spring To Spring Conditional Growth Percentile . . . . . . . 282
E.2.31Reading Grade 5 From Fall To N Fall Conditional Growth Percentile . . . . . . . . . . . . 283
E.2.32Reading Grade 5 From Fall To Spring Conditional Growth Percentile . . . . . . . . . . . . 284
E.2.33Reading Grade 5 From Fall To Winter Conditional Growth Percentile . . . . . . . . . . . . 285
E.2.34Reading Grade 5 From Winter To Spring Conditional Growth Percentile . . . . . . . . . . 286
E.2.35Reading Grade 6 From Last Winter To Winter Conditional Growth Percentile . . . . . . . 287
E.2.36Reading Grade 6 From Last Spring To Spring Conditional Growth Percentile . . . . . . . 288
E.2.37Reading Grade 6 From Fall To N Fall Conditional Growth Percentile . . . . . . . . . . . . 289
xiv

E.2.38Reading Grade 6 From Fall To Spring Conditional Growth Percentile . . . . . . . . . . . . 290
E.2.39Reading Grade 6 From Fall To Winter Conditional Growth Percentile . . . . . . . . . . . . 291
E.2.40Reading Grade 6 From Winter To Spring Conditional Growth Percentile . . . . . . . . . . 292
E.2.41Reading Grade 7 From Last Winter To Winter Conditional Growth Percentile . . . . . . . 293
E.2.42Reading Grade 7 From Last Spring To Spring Conditional Growth Percentile . . . . . . . 294
E.2.43Reading Grade 7 From Fall To N Fall Conditional Growth Percentile . . . . . . . . . . . . 295
E.2.44Reading Grade 7 From Fall To Spring Conditional Growth Percentile . . . . . . . . . . . . 296
E.2.45Reading Grade 7 From Fall To Winter Conditional Growth Percentile . . . . . . . . . . . . 297
E.2.46Reading Grade 7 From Winter To Spring Conditional Growth Percentile . . . . . . . . . . 298
E.2.47Reading Grade 8 From Last Winter To Winter Conditional Growth Percentile . . . . . . . 299
E.2.48Reading Grade 8 From Last Spring To Spring Conditional Growth Percentile . . . . . . . 300
E.2.49Reading Grade 8 From Fall To N Fall Conditional Growth Percentile . . . . . . . . . . . . 301
E.2.50Reading Grade 8 From Fall To Spring Conditional Growth Percentile . . . . . . . . . . . . 302
E.2.51Reading Grade 8 From Fall To Winter Conditional Growth Percentile . . . . . . . . . . . . 303
E.2.52Reading Grade 8 From Winter To Spring Conditional Growth Percentile . . . . . . . . . . 304
E.2.53Reading Grade 9 From Last Winter To Winter Conditional Growth Percentile . . . . . . . 305
E.2.54Reading Grade 9 From Last Spring To Spring Conditional Growth Percentile . . . . . . . 306
E.2.55Reading Grade 9 From Fall To N Fall Conditional Growth Percentile . . . . . . . . . . . . 307
E.2.56Reading Grade 9 From Fall To Spring Conditional Growth Percentile . . . . . . . . . . . . 308
E.2.57Reading Grade 9 From Fall To Winter Conditional Growth Percentile . . . . . . . . . . . . 309
E.2.58Reading Grade 9 From Winter To Spring Conditional Growth Percentile . . . . . . . . . . 310
E.2.59Reading Grade 10 From Last Winter To Winter Conditional Growth Percentile . . . . . . . 311
E.2.60Reading Grade 10 From Last Spring To Spring Conditional Growth Percentile . . . . . . . 312
E.2.61Reading Grade 10 From Fall To N Fall Conditional Growth Percentile . . . . . . . . . . . 313
xv

E.2.62Reading Grade 10 From Fall To Spring Conditional Growth Percentile . . . . . . . . . . . 314
E.2.63Reading Grade 10 From Fall To Winter Conditional Growth Percentile . . . . . . . . . . . 315
E.2.64Reading Grade 10 From Winter To Spring Conditional Growth Percentile . . . . . . . . . 316
E.3.1 Language Usage Grade 2 From Last Winter To Winter Conditional Growth Percentile . . 317
E.3.2 Language Usage Grade 2 From Last Spring To Spring Conditional Growth Percentile . . 318
E.3.3 Language Usage Grade 2 From Fall To N Fall Conditional Growth Percentile . . . . . . . 319
E.3.4 Language Usage Grade 2 From Fall To Spring Conditional Growth Percentile . . . . . . . 320
E.3.5 Language Usage Grade 2 From Fall To Winter Conditional Growth Percentile . . . . . . . 321
E.3.6 Language Usage Grade 2 From Winter To Spring Conditional Growth Percentile . . . . . 322
E.3.7 Language Usage Grade 3 From Last Winter To Winter Conditional Growth Percentile . . 323
E.3.8 Language Usage Grade 3 From Last Spring To Spring Conditional Growth Percentile . . 324
E.3.9 Language Usage Grade 3 From Fall To N Fall Conditional Growth Percentile . . . . . . . 325
E.3.10Language Usage Grade 3 From Fall To Spring Conditional Growth Percentile . . . . . . . 326
E.3.11Language Usage Grade 3 From Fall To Winter Conditional Growth Percentile . . . . . . . 327
E.3.12Language Usage Grade 3 From Winter To Spring Conditional Growth Percentile . . . . . 328
E.3.13Language Usage Grade 4 From Last Winter To Winter Conditional Growth Percentile . . 329
E.3.14Language Usage Grade 4 From Last Spring To Spring Conditional Growth Percentile . . 330
E.3.15Language Usage Grade 4 From Fall To N Fall Conditional Growth Percentile . . . . . . . 331
E.3.16Language Usage Grade 4 From Fall To Spring Conditional Growth Percentile . . . . . . . 332
E.3.17Language Usage Grade 4 From Fall To Winter Conditional Growth Percentile . . . . . . . 333
E.3.18Language Usage Grade 4 From Winter To Spring Conditional Growth Percentile . . . . . 334
E.3.19Language Usage Grade 5 From Last Winter To Winter Conditional Growth Percentile . . 335
E.3.20Language Usage Grade 5 From Last Spring To Spring Conditional Growth Percentile . . 336
E.3.21Language Usage Grade 5 From Fall To N Fall Conditional Growth Percentile . . . . . . . 337
xvi

E.3.22Language Usage Grade 5 From Fall To Spring Conditional Growth Percentile . . . . . . . 338
E.3.23Language Usage Grade 5 From Fall To Winter Conditional Growth Percentile . . . . . . . 339
E.3.24Language Usage Grade 5 From Winter To Spring Conditional Growth Percentile . . . . . 340
E.3.25Language Usage Grade 6 From Last Winter To Winter Conditional Growth Percentile . . 341
E.3.26Language Usage Grade 6 From Last Spring To Spring Conditional Growth Percentile . . 342
E.3.27Language Usage Grade 6 From Fall To N Fall Conditional Growth Percentile . . . . . . . 343
E.3.28Language Usage Grade 6 From Fall To Spring Conditional Growth Percentile . . . . . . . 344
E.3.29Language Usage Grade 6 From Fall To Winter Conditional Growth Percentile . . . . . . . 345
E.3.30Language Usage Grade 6 From Winter To Spring Conditional Growth Percentile . . . . . 346
E.3.31Language Usage Grade 7 From Last Winter To Winter Conditional Growth Percentile . . 347
E.3.32Language Usage Grade 7 From Last Spring To Spring Conditional Growth Percentile . . 348
E.3.33Language Usage Grade 7 From Fall To N Fall Conditional Growth Percentile . . . . . . . 349
E.3.34Language Usage Grade 7 From Fall To Spring Conditional Growth Percentile . . . . . . . 350
E.3.35Language Usage Grade 7 From Fall To Winter Conditional Growth Percentile . . . . . . . 351
E.3.36Language Usage Grade 7 From Winter To Spring Conditional Growth Percentile . . . . . 352
E.3.37Language Usage Grade 8 From Last Winter To Winter Conditional Growth Percentile . . 353
E.3.38Language Usage Grade 8 From Last Spring To Spring Conditional Growth Percentile . . 354
E.3.39Language Usage Grade 8 From Fall To N Fall Conditional Growth Percentile . . . . . . . 355
E.3.40Language Usage Grade 8 From Fall To Spring Conditional Growth Percentile . . . . . . . 356
E.3.41Language Usage Grade 8 From Fall To Winter Conditional Growth Percentile . . . . . . . 357
E.3.42Language Usage Grade 8 From Winter To Spring Conditional Growth Percentile . . . . . 358
E.3.43Language Usage Grade 9 From Last Winter To Winter Conditional Growth Percentile . . 359
E.3.44Language Usage Grade 9 From Last Spring To Spring Conditional Growth Percentile . . 360
E.3.45Language Usage Grade 9 From Fall To N Fall Conditional Growth Percentile . . . . . . . 361
xvii
E.3.46Language Usage Grade 9 From Fall To Spring Conditional Growth Percentile . . . . . . . 362
E.3.47Language Usage Grade 9 From Fall To Winter Conditional Growth Percentile . . . . . . . 363
E.3.48Language Usage Grade 9 From Winter To Spring Conditional Growth Percentile . . . . . 364
E.3.49Language Usage Grade 10 From Last Winter To Winter Conditional Growth Percentile . . 365
E.3.50Language Usage Grade 10 From Last Spring To Spring Conditional Growth Percentile . . 366
E.3.51Language Usage Grade 10 From Fall To N Fall Conditional Growth Percentile . . . . . . 367
E.3.52Language Usage Grade 10 From Fall To Spring Conditional Growth Percentile . . . . . . 368
E.3.53Language Usage Grade 10 From Fall To Winter Conditional Growth Percentile . . . . . . 369
E.3.54Language Usage Grade 10 From Winter To Spring Conditional Growth Percentile . . . . 370
E.4.1 General Science Grade 3 From Last Winter To Winter Conditional Growth Percentile . . . 371
E.4.2 General Science Grade 3 From Last Spring To Spring Conditional Growth Percentile . . . 372
E.4.3 General Science Grade 3 From Fall To N Fall Conditional Growth Percentile . . . . . . . 373
E.4.4 General Science Grade 3 From Fall To Spring Conditional Growth Percentile . . . . . . . 374
E.4.5 General Science Grade 3 From Fall To Winter Conditional Growth Percentile . . . . . . . 375
E.4.6 General Science Grade 3 From Winter To Spring Conditional Growth Percentile . . . . . 376
E.4.7 General Science Grade 4 From Last Winter To Winter Conditional Growth Percentile . . . 377
E.4.8 General Science Grade 4 From Last Spring To Spring Conditional Growth Percentile . . . 378
E.4.9 General Science Grade 4 From Fall To N Fall Conditional Growth Percentile . . . . . . . 379
E.4.10General Science Grade 4 From Fall To Spring Conditional Growth Percentile . . . . . . . 380
E.4.11General Science Grade 4 From Fall To Winter Conditional Growth Percentile . . . . . . . 381
E.4.12General Science Grade 4 From Winter To Spring Conditional Growth Percentile . . . . . 382
E.4.13General Science Grade 5 From Last Winter To Winter Conditional Growth Percentile . . . 383
E.4.14General Science Grade 5 From Last Spring To Spring Conditional Growth Percentile . . . 384
E.4.15General Science Grade 5 From Fall To N Fall Conditional Growth Percentile . . . . . . . 385
xviii
E.4.16General Science Grade 5 From Fall To Spring Conditional Growth Percentile . . . . . . . 386
E.4.17General Science Grade 5 From Fall To Winter Conditional Growth Percentile . . . . . . . 387
E.4.18General Science Grade 5 From Winter To Spring Conditional Growth Percentile . . . . . 388
E.4.19General Science Grade 6 From Last Winter To Winter Conditional Growth Percentile . . . 389
E.4.20General Science Grade 6 From Last Spring To Spring Conditional Growth Percentile . . . 390
E.4.21General Science Grade 6 From Fall To N Fall Conditional Growth Percentile . . . . . . . 391
E.4.22General Science Grade 6 From Fall To Spring Conditional Growth Percentile . . . . . . . 392
E.4.23General Science Grade 6 From Fall To Winter Conditional Growth Percentile . . . . . . . 393
E.4.24General Science Grade 6 From Winter To Spring Conditional Growth Percentile . . . . . 394
E.4.25General Science Grade 7 From Last Winter To Winter Conditional Growth Percentile . . . 395
E.4.26General Science Grade 7 From Last Spring To Spring Conditional Growth Percentile . . . 396
E.4.27General Science Grade 7 From Fall To N Fall Conditional Growth Percentile . . . . . . . 397
E.4.28General Science Grade 7 From Fall To Spring Conditional Growth Percentile . . . . . . . 398
E.4.29General Science Grade 7 From Fall To Winter Conditional Growth Percentile . . . . . . . 399
E.4.30General Science Grade 7 From Winter To Spring Conditional Growth Percentile . . . . . 400
E.4.31General Science Grade 8 From Last Winter To Winter Conditional Growth Percentile . . . 401
E.4.32General Science Grade 8 From Last Spring To Spring Conditional Growth Percentile . . . 402
E.4.33General Science Grade 8 From Fall To N Fall Conditional Growth Percentile . . . . . . . 403
E.4.34General Science Grade 8 From Fall To Spring Conditional Growth Percentile . . . . . . . 404
E.4.35General Science Grade 8 From Fall To Winter Conditional Growth Percentile . . . . . . . 405
E.4.36General Science Grade 8 From Winter To Spring Conditional Growth Percentile . . . . . 406
F.1 End-of-Course Tests . . . . . . . . . . . . . . . . . . . . . . . . . . . . . . . . . . . . . . . 407
F.2 End-of-Course Upper Level Mathematics RIT Score to Percentile Rank Conversion . . . . 408
xix

List of Figures
2.1 Common Core tests as percentages of all MAP tests by content area by term and grade . 11
2.2 Instructional Calendar Entry Tool . . . . . . . . . . . . . . . . . . . . . . . . . . . . . . . . 16
3.1 SCI by State and NWEA Affiliation . . . . . . . . . . . . . . . . . . . . . . . . . . . . . . . 28
4.1 Data layout by Instructional Days . . . . . . . . . . . . . . . . . . . . . . . . . . . . . . . . 31
4.2 Illustrative comparison of an additive polynomial model . . . . . . . . . . . . . . . . . . . . 33
5.1 Predicted Means of Reading and Mathematics Norm . . . . . . . . . . . . . . . . . . . . . 41
5.2 Predicted Student and School Standard Deviations of Mathematics Norms . . . . . . . . . 42
5.3 Predicted Student and School Standard Deviations of Reading Norms . . . . . . . . . . . 43
5.4 School Grade-level Intra-class Correlations by Grade . . . . . . . . . . . . . . . . . . . . . 43
5.5 Conditional Growth for Students and Schools . . . . . . . . . . . . . . . . . . . . . . . . . 44
5.6 Difference in Predicted Means (Additive vs. Regular Polynomial) . . . . . . . . . . . . . . 45
5.7 Difference in Standard Errors (Additive vs. Regular Polynomial) . . . . . . . . . . . . . . . 46
5.8 Comparing 2011 and 2015 Student Norms . . . . . . . . . . . . . . . . . . . . . . . . . . . 47
xx

1 MAP Norms for Status and Growth
When educators and parents speak of improvement, progress, or growth in learning, normative perfor-
mance is probably not the first thing that comes to mind. It is always important to hear about what, and
how much more of the curricular content, a student has learned; but knowing how much a student has
learned compared with the attainment of the student’s peers is probably a close second. For meeting this
purpose, norms are critical. Norms indicate the levels of achievement and growth that are attainable for
identifiable populations of students or schools.
At their most fundamental level, norming studies are designed and conducted in pursuit of a common
goal: to foster valid inferences about specific characteristics of a population based on members sampled
from that population. Norms are invaluable precisely because they indicate the levels of achievement
and growth which are attainable for identifiable populations of students or schools. A good set of norms
will help pinpoint how students achieve. Subsequent norming studies will also tell us a lot about where
students are headed, in addition to where they are at follow-up. The present study is consistent with
these objectives, all aimed at describing pertinent aspects of performance on MAP assessments for the
population of U.S. English-speaking, school-age (grades K-11) population.
In addition, several motivations prompt this study. The first two are carried forward from the 2011 RIT1
Scale norming study (Northwest Evaluation Association, 2011a), namely,
1. to provide a way for users of MAP achievement tests to consistently and accurately reference the
performance of present and future examinees to performance expected in the population, and
2. to develop stronger statistical support for inferences about student achievement status and growth
so as to maximize the utility of the information contained in a vast and growing longitudinal database
of MAP assessment results.
To these motivations, we further aimed
3. to consolidate, refine, and enhance methodology developed for and introduced in the 2011 study,
4. to introduce methodological advances that will substantively reduce error and strengthen norm-
referenced inferences about growth from one grade to another,
1“RIT” stands for Rasch Unit and is 200 + 10× θ, where θ refers to the logit scale units of the Rasch Model.
1
5. to extend support for norm-referenced inferences for the school when it is treated as the unit-of-
analysis, and
6. to document and discuss the anticipated changes in the new norms relative to the 2011 figures.
As we have pointed out in the 2011 RIT scale norms study, contemporary school realities and policies can,
and often do, require test scores to be used for different purposes, effectively changing their intended
interpretations and uses. Practices and policies aimed at accountability, evaluating school or program
effectiveness, tracking student progress, informing high-level instructional decisions, selecting students
into programs, or making promotion or graduation decisions are among the more common uses of test
scores. In these and other similar situations, test scores may take on not only interpretations that differ
from those intended, but carry varying, sometimes unintended, consequences as well. While it is unlikely
that any set of achievement test norms can fully accommodate such a broad range of uses and score
interpretations, it is a reasonable challenge to develop norms that can optimize the quality of information
that is available to be used in these contexts.
1.1 Approaches to Norming
Throughout this study we focused on developing norms that are flexible and would be useful to profes-
sionals in schools, school districts, and research settings as they are asked to translate test performance
to inform educational issues and decision making that rely on achievement data. In this regard, little has
changed from the 2011 study. Retaining this focus, however, brought into sharp relief the landscape of
challenges posed to the “flexible” and “useful” criteria. These challenges are embodied in a wide range of
issues from incorporating traditional practices and conventions for producing quality norms (e.g., Angoff,
1984) to recognizing and accommodating the issues posed by changes in school environments, practices,
policies, resources and expectations that have emerged over the past four decades. Each of these areas
have had an important influence in framing the methodological strategy employed in this study.
Traditional norming practices have been in use for quite some time. Much of this tradition was detailed
more than four decades ago in Scales, Norms, and Equivalent Scores (Angoff, 1984). Not only did
this work illuminate and discuss many of the perpetual issues facing educational measurement up to its
original publication in Thorndike (1971), but it perceptively anticipated many of the measurement issues
facing us today. While advancements in measurement and analyses have certainly been made over the
ensuing decades, corresponding advances in the development of norms that move beyond issues raised
by Angoff have been less apparent.
Throughout that time period, development of achievement test norms has followed a fairly common pat-
tern - one that is largely consistent with the general approach Angoff encouraged. In this approach, a
single reference test form, perhaps with several additional parallel test forms, is administered to randomly
selected students or groups of students within a pre-specified timeframe of 3 to 4 weeks. Sampling plans
are designed to yield a sample that is representative of the target population for the test. Tests are scaled
using the same sample. Results from these norming studies can be referred to as test-form-centric. That
is, the test or test form and the performance scale used for reporting are borne of the same scaling pro-
cess and so are inextricably linked; the representativeness of the sample notwithstanding, scale score
references (e.g., grade-level mean, standard deviation, percentile ranks) apply only to the reference test
form and its associated parallel forms. Norms from such studies are technically only applicable as refer-
2
ences to test performance that come from those tests administered in a timeframe that corresponds to the
one used for the study (e.g., Sept. 15 through Oct. 15).
We find no theoretical fault with this general approach. Assuming that threats to a test’s measurement
validity have been sufficiently neutralized, the procedure is likely to result in defensible norms. However,
use of the resulting norms would be constrained at least to the test form (or forms parallel to it) that were
administered in the designated time period(s) of the school year.
Furthermore, such constraints are particularly challenging to the idea of student growth norms. Even
assuming that forms are vertically equated, there is, until recently, strong hesitance in the use of the raw
change or gain score (see, e.g., the contributions in Harris (1963)) and hence the development of growth
norms. Consequently, if growth was addressed, the answer seemed to lie in inference about differences
between cross-sectional status norms. Thanks to the work of Bryk and Weisberg (1976), Rogosa, Brandt,
and Zimowski (1982), Rogosa (1995), Willett (1988), and Williams and Zimmerman (1996), among many
others, the notion that raw gain scores are inherently unreliable for measuring change is considerably
weakened (Thum, 2003). With the right longitudinal data and new developments in growth modeling, we
now recognize that growth may be reliably measured. Additionally, norms for individual growth may now
be developed, displacing the practice of using differences in grade-level cross-sectional distributions for
inferences about individual student growth, an approach that is still evident in the recent effort by Hill,
Bloom, Black, and Lipsey (2008) to provide empirical benchmarks for educational evaluation purposes.
1.2 NWEA Norming Approach
NWEA’s approach to MAP achievement and growth norms differs from the more traditional approach on
several dimensions. It has also been greatly facilitated by the vertical scales underlying MAP assessments
and by the availability, from strong NWEA partner commitment, of a vast archive of longitudinal student
test data. Collectively, these differences arise in response to what we perceive as limitations of both the
interpretations and uses of norms developed thus far. A brief overview of these differences will help to
highlight the challenges they pose to ensuring appropriate interpretations across a wide range of use
conditions as well as to foreshadow some of the procedures used to address those challenges. Here, we
offer a brief discussion of each of these essential characteristics of NWEA norms, leading to the choice
of statistical design and analytical method. More details follow in the succeeding chapters.
1.2.1 Status and Growth
The strength of NWEA norms from 2005 on has been to support valid normative inferences about achieve-
ment status and growth. The principle we take to measuring learning growth hinges on a strong description
of how individual student scores change over time. Much attention is paid to the scaling of the test scores,
the criterion, and the meter of time, the predictor, of this essential relationship. This description is lever-
aged in inferences about how students grow academically. Most frequently the focus of user attention are
the descriptions of achievement status that are conditional on when an assessment occurred, such as the
mathematics achievement norms for the spring term for 4th graders.
Using standard statistical arguments, marginal growth norms for any arbitrary two testing occasions may
be inferred. Furthermore, growth norms that also condition on the starting performance of the student may
be achieved through direct conditioning of the joint distribution of growth and initial status. This approach
3

results in a normative measure of growth called the conditional growth index (CGI), and its corresponding
population percentile called the conditional growth percentile (CGP) (NWEA, 2011a; Thum, 2015). Similar
metrics are available for schools represented as grade-level aggregates. In theory, these metrics facilitate
reporting and secondary analyses. But, most relevant to the user, is that they present better ways to
achieve fair (“apples-to-apples”) comparisons, whether within or beyond grade-levels or subject matter.2
1.2.2 Test Scale and Student Scores
MAP assessments are computerized adaptive tests (CAT). Individual tests are constructed based on the
student’s performance while responding to items constrained in content to a set of standards (usually
defined by a state). As each test proceeds, items are selected from a large pool of Rasch-calibrated items
(1,800 to 4,500 items depending on each test’s content specification), based on the test-taker’s interim
ability estimate. For this study, well over 1,900 different item pools across the four content domains of
reading, language usage, mathematics, and general science provided the items. Since all items in a
single content domain are calibrated to the same scale, different tests that may be constructed in that
domain are all children of the same parent, and scores from different tests constructed from that domain
can be interpreted in the same manner. Results from this norming study, therefore, reference performance
related to scales of measurement, rather than to any particular test.
All test event records used in this study were from operational MAP tests. Only tests that were rou-
tinely used in schools during the study’s 3-year timeframe (fall 2011 through spring 2014) were included.
Restricting the study to operational tests is, of course, accompanied by the threats that convenience sam-
ples pose for studies intended to generalize to a population (Angoff, 1984; Kolen, 2006). To counter these
threats and to achieve sample representativeness to the target (U.S. English-speaking school-age) popu-
lation, a post-stratification procedure was employed. This approach avoids the time and expense needed
to recruit special samples to achieve sample representativeness.
1.2.3 Variation in Testing Schedule and Instructional Time
Test administration schedules were, in practice, decided entirely by the schools and school districts using
them; no test administration schedule was imposed by NWEA. While this feature of the tests allows a
great deal of flexibility for test users, it also demands that test administration occasions be accounted for
at a much more granular level than term or season. If, for example, set “schedules” for test administration
were to be imposed to filter out test records not falling into narrowly defined test administration windows,
a number of biasing factors would be introduced, weakening the basis for valid inferences and uses of the
norming results. In fact, there is fortuitous benefit to have the broad variation in MAP testing schedules
because the description of achievement over time is improved when variation in the measure of time,
functioning as the predictor in a regression model, is increased.
Rather than use testing dates on the general calender to mark time, we sought to re-construct instructional
time to be employed in describing changes in achievement. To account for the time at which tests were
administered and for the time separating test occasions, school district calendars were retrieved. From
2The CGI is similar in principle to the conditional growth percentile of the Colorado Growth Model (Betebenner, 2008), except
that student achievement is assumed to be measured on an interval cross-grade scale rather than on an ordinal scale. Because
short-term growth is the focus of the CGI, i.e., inferences are made only within a five-term wide instructional time span about a
focal grade-level, we are confident that vertical scale assumptions are appropriate under such circumstances (see Braun, 1988).
4

these calendars, an intended instructional-days calendar was created for each individual school across
the 3-year study time span. These individual calendars allowed varying test administration times that were
anchored to instructional time to be taken into account in the analysis. (Details are found in Section 2.4.)
1.2.4 Student vs. School Norms
A vast literature on the problems of ecological or cross-level inference, from Robinson (1950) to Rauden-
bush and Willms (1995) and King (1997), cautions that what we know about individuals may not always
be mirrored directly in what we see among groups of individuals, and vice versa. In the school setting, for
example, that students may behave differently from schools is not what is at issue. The problem arises
when the behavior of one is mistaken for the behavior of the other, leading to an error termed “aggrega-
tion bias” in cross-level inference. This phenomenon has particular relevance to our effort to provide both
students and school grade-level norms.
When norms for schools were unavailable, student norms have been employed to evaluate student grade-
level aggregate performance. This practice is invalid because of the mismatch between the object of the
evaluation and the empirical reference benchmark of the evaluation construct. Because schools do not
vary as much as students do in their achievement status or in growth, comparing most aspects of school
performance against benchmarks drawn from student norms produces a generally pessimistic view of
school effectiveness. When high stakes are attached to such evaluations, the results grossly misinform
policy and can be unfair and even harmful to students, educators, and schools alike.3
Student and school grade-level norms are also important to the design of evaluation studies employing
assessment outcomes. In addition to providing empirical benchmarks for evaluation studies (see above),
the 2015 RIT scale norms produces school grade-level intra-class correlations, or ICCs4, estimates that
may be exploited in designing group randomized evaluation studies. In a discussion of results to follow
(Chapter 5), we report results for mathematics and reading and compare them to the important findings
from a compilation of existing nationally representative datasets by Hedges and Hedberg (2007).
1.2.5 Design and Analysis
To incorporate the explicit and implied decisions from the above list, while accounting for the unique
characteristics and challenges of the testing model, an integrated conceptual and analytic framework
was adopted. The framework was originally developed for and implemented in the 2011 norms study
(NWEA, 2011a; Thum, 2015). Its implementation here includes major refinements to accommodate the
added dimensions introduced in this study. The framework provides necessary conceptual and statistical
support because it
• acknowledges and incorporates each score’s measurement error in the analyses to improve the
3If the grade-level average score is intended to represent the performance of the average student of a grade and knowledge
of his normative performance is desired, then use of student norms is appropriate. However, if the grade-level average is meant
to represent all students in the grade-level, as is sometimes the practice in naive accountability structures, then the school
grade-level norms should be used.4The ICC, which ranges from 0 to 1.0, is a ratio expressing the extent to which cluster or group means vary against background
variation. A sizeable ICC value indicates that observations within the same cluster or group are more highly correlated than the
observations from different clusters or groups, signalling the presence of “cluster effects.”
5

precision of model estimates,
• employs a 3-level HLM to separate score variation within students, and within and between schools,
• deploys model estimates in secondary statistical manipulations to provide the relevant norms,
• increases to 9 terms instead of 5, spanning 3 grade-levels for each student cohort with one grade
below and another above the focal grade-level, which provides a more accurate description of the
change in scores over time,
• accommodates a needed increase in the time span for building the growth model which, in turn,
requires the adoption of a new additive polynomial regression model to avoid over-smoothing of
known seasonal drops (spring to fall) in test score trends (Thum & Matta, 2015), and
• employs a sample post-stratification procedure to ensure that inferences about test performance
relative to the population of interest are made based on a representative sample of that population.
Also a major procedural improvement is the use of a 3-level HLM to separate score variation within stu-
dents, and within and between schools. In 2012, NWEA provided school grade-level norms for use with
partners upon request. Like the 2011 student norms, a 2-level hierarchical linear model (HLM) was used.
In both studies therefore, estimates of variation between students contain undifferentiated amounts of
between-school variance for the student norms. By the same token, the 2012 school norms did not ade-
quately deal with the variation of student performance within schools. The result may have engendered
some degree of bias in both sets of norms.
The present study takes the opportunity to improve on the past norms by estimating both student perfor-
mance and school performance in the same 3-level HLM analysis based on the same data, which affords
a more coherent set of references than if student and aggregate school performance were treated inde-
pendently. To support this decision, random samples were drawn at the school level. All student test
records (i.e., each student’s testing history in the content area over a 3-year period) for a selected school
were included in the analysis. A student with a single valid test score during the 3-year period was in-
cluded along with grade-level peers who had multiple test scores (i.e., longer test histories) over the same
period.
Working within this framework allowed norms for MAP measurement scales to be developed that largely
satisfies the key motivations for this study. We contend that the major threats and challenges posed by
the issues and differences with traditional approaches to norms development outlined above have been
sufficiently met. As a result, the basis for drawing valid normative inferences is broader than it was with
the 2011 RIT scale norms study.
1.3 Common Uses of Achievement and Growth Norms
Norms presented in this document can help to answer many of the questions teachers and parents com-
monly ask about student test performance and achievement estimates provided from MAP tests. The
types of questions cited in the 2011 RIT scale norms study document that refer to student performance
are still relevant. For example,
6

• How can this child’s mathematics performance, that was estimated six weeks later than her peers,
be compared to her peers?
• How much progress might be expected of this grade 7 student after 42 weeks of instruction, who
had a RIT score of 212 in the fall of the previous year? And since the rate of change is related to the
initial achievement status, how does this expectation compare with those of her peers who scored
about 15 RITs higher in the fall?
In addition, teachers and parents can now use the norms presented in this document to help answer
questions that pertain to school performance and change. Such questions might include:
• How does the mathematics progress made by grade 6 students in this school compare to the same
grade students in other schools across the country?
• The growth goal we have set for our school’s grade 5 students over the course of the year is to be
at or above the 70th percentile compared to grade 5 students in other schools. Given our students’
current RIT scores, what average score would they need to have to meet this goal? Does this seem
reasonable?
• Our district’s two middle schools have grade 7 average beginning-of-year RIT scores that differ by
12 RITs. The school that scores lower had to test four weeks after the other school. Given they had
different average starting RITs and will have different amounts of instructional time between tests,
how do we set comparable growth expectations that are fair to both schools?
1.4 Why Norms Change
The release of each RIT scale norms study is commonly followed immediately with the question, “What
has changed from the previous study?” More generally, “Why do norms change?” is a very important
question, but it is sometimes raised with some belief that norms should not change unless they are either
wrong or inaccurate. So, before we discuss what kinds of changes we may reasonably anticipate with the
2015 norms, let us embrace the idea that norms will change. But changes in norms do not imply a change
in the underlying RIT scales in any way.
Numerical differences at several superficial levels will likely be visible, especially at the edges of norm-
ing distributions, even if population behavior, instrumentation, data, and norming procedures remain un-
changed. Consider, for example, the situation in which a new sample is drawn and analyzed with the
same set of procedures. Numerically identical results is a statistical impossibility. Statistical equivalence
does not imply numerical coincidence.
In addition, there are good reasons why norms change. The most important reason, and a positive
one if the result is also welcomed, is that the population has grown or improved in the characteristic of
interest. In a typically complex environment, differences directly attributable to the real changes in the
population characteristic are much harder to isolate. When changes to instrumentation or analyses are
clearly warranted, or there are changes in other aspects of the population that may affect the characteristic
of interest, such as a marked increase in limited-English speakers among primary grade students in the
U.S., changes should be expected. From the discussion of the 2015 goals above and the enhanced
7

procedures that followed, the new study made clear and warranted changes to the data used and to the
analytical strategy employed. With these sources of likely changes acknowledged, the new norms become
“the new normal,” differences from the 2011 norms notwithstanding.
Still, changes to the norms remain a major issue for some users if policy or placement decisions have
used standard scores or percentiles as decision cut-points. Users understand of course that changes
in the norms reflect a change in the standard, not a change in student performance. If these decisions
had been made on the basis of points on the score scale (e.g., RIT) instead, changes in percentiles that
almost invariably accompany changes in the norms would be far easier to explain to stakeholders.
1.5 Expected and Actual Changes
While there are many aspects to a comprehensive answer for why norms would change as it pertains
to the 2015 norms reported in this study, we can at least point to several areas where differences in
results will be most apparent and offer some possible, yet unverified, explanations for them. We expected
that changes in status norms would be relatively minor. This was partially the case. While status norms
for grades 1 through 5, minimally changed, the status norms for kindergarten and grade 6 and above,
changed a bit more than anticipated. Where differences were observed, the grade-level status means for
the 2015 norms tended to be lower than the corresponding norms for 2011.
In addition to slightly lower grade-level status means for 2015, the 2015 status norms also contained
greater variance around their means than was the case for the 2011 status norms. The combined effect
of these differences was that the percentile distributions, particularly in grades 6 and above, were shifted
up. Thus, the same RIT score for the same grade-level, for the same season, in the same content area
would be associated with a higher status percentile rank in the 2015 norms than in the 2011 norms.
These differences would appear to be partially due to the use of a more sensitive analytic model. For
example, the 2015 model has been shown to provide more accurate fall grade-level status estimates.
In addition, the fall status estimates for kindergarten in the 2011 norms were obtained from a post hoc
procedure performed independent of the analytic model used for all other results. In the current norms,
fall kindergarten scores were incorporated into the model.
Two additional areas appear promising for helping to explain differences. The one of most immediate
interest is the effects of the Common Core State Standards (CCSS). There would seem to be several
categories of effects but all revolve around the relationship and sequencing of adoption of CCSS, the
implementation of CCSS in the classroom, and administering CCSS-aligned tests. While we know that
CCSS-aligned tests were administered with increasing frequency over the 3 year study period, we know
only very little about adoption and implementation practices within individual schools and school districts.
The second area is more nebulous. It concerns the possibilities of underlying and unobserved differences
between the samples used for the two norms studies. Such differences may be attributable to a changing
NWEA partner base. Changes in the partner base that are not adequately captured carry with them the
potential for changes in the composition of the target population.
Changes in mean grade-level growth were anticipated due largely to better estimation of status with the
additive polynomial model, which has reduced effectively the over-smoothing effect of the standard poly-
nomial curve used in 2011. As a result, growth from fall to spring terms were modestly higher in the 2015
norms all across grade-levels and content areas. In reading and language usage, growth from winter to
spring was slightly lower in the 2015 norms. In mathematics, grade-level growth from winter to spring was
8

slightly higher across grades in 2015. The general direction of these differences suggest that under the
same conditions (content area, grade, starting position (RIT), instructional weeks before the initial test, in-
structional weeks between tests) an equal amount of observed growth will result in a slightly lower growth
percentile rank.
1.6 Outline of Report
The remainder of this document is organized into four chapters and a large set of tables in six appendices.
In Chapter 2, we introduce the reader to key elements of MAP assessments for use in our norming studies,
discuss the nature of their item pools, and detail the construction of a key independent variable in this study
– instructional time. Chapter 3 describes the approach to assembling test records for the study. It then
details the new School Challenge Index (SCI) that is to be employed for constructing post-stratification
weights. Post-stratification weights for grades K to 11 for NWEA partners in different SCI national deciles
are presented for MAP reading and mathematics. Given the goals of the new norming study, the statistical
growth models used to compute status and growth norms for both students and schools are identified and
detailed in Chapter 4. We introduce the additive polynomial for use in the 3-level HLM for describing growth
for score trends with known seasonality, to be followed by details of marginal and conditional inference
procedures for status and growth. Chapter 5 provides a summary of basic results of the new 2015 status
norms and their properties. We then present selected results that address the changes we have found.
Further remarks address the development and utility of the new school norms. The report concludes with
six appendices consisting of tables of key aspects of the new 2015 RIT scale norms. Tables in Appendix
A display student and school status norms. Appendix B contains tables that show marginal term-to-term
growth norms for students and schools at each focal grade. Appendix C consists of a large (though not
exhaustive) set of achievement percentile tables for both students and schools. The tables in Appendix
D provide conditional growth norms while the tables in Appendix E provide the corresponding conditional
growth percentiles. Finally, Appendix F consists of tables that give the status norms and percentiles for
the MAP end-of-course tests: Algebra 1, Algebra 2, and Geometry.
9

2 Item and Test Events Pools,
and Instructional Time
This chapter familiarizes the reader with the principal ingredients of the NWEA achievement and growth
norms. All norms reported in this document are based on student performance on the Measures of
Academic Progress (MAP) achievement tests. MAP content areas included reading, language usage,
mathematics, and general science. All assessments were delivered as set-length computerized adaptive
tests (CAT). Sub-scores (goal scores) as well as overall scores were reported. Norms were developed
exclusively using overall scores.
The content frameworks for MAP tests have undergone dramatic shifts over the three year period covered
by this study (academic years 2011-2012, 2012-2013, and 2013-2014). During year 1, roughly 90% of all
MAP test events in reading, language usage, and mathematics were based on item pools that had been
content-aligned to specific state content standards. During year 2, slightly less than 50% of MAP test
events used item pools aligned to state content standards; the remaining tests were content-aligned to
the specifications of the Common Core State Standards (CCSS) (National Governors Association Center
for Best Practices, and Council of Chief State School Officers, 2010). In the final year, only slightly more
than 10% of all MAP test events were based on item pools that were aligned to specific state content
standards; the remaining nearly 90% of all test events were aligned to the CCSS. This shift to the CCSS
is illustrated in Figure 2.1. Over the same time period, items employed in all MAP science tests were
aligned to specific state content standards.
Regardless of the specific content specifications used to align item content, all MAP tests over the three
year study period had a common number of items depending on the content area and the grade levels of
the intended test takers. When a school district used all of the tests available for their state, there would be
a minimum of 11 tests. These are shown nominally in Table 2.1. Occasionally, the grade level breakdown
in a content area is specified differently in a state. This would result in different groupings of items and
possibly in the number of tests in a content area. For example, in a particular state, it may be considered
to be more consistent with curricular emphases adopted by the state to break general science into two
grade groupings rather than the single grouping shown in Table 2.1. Such content reorganizations can be
readily accommodated.
When content specifications call for the same knowledge, understandings, or skills, test items are typically
shared across different tests. For any particular test in a content area for a specific grade range that
requires a new set of content specifications, an item pool based on those specifications is created. Pool
sizes can range from 1,500 to 4,500 items. Inclusion of CCSS-aligned tests along with state content-
aligned tests, often in the same state, coupled with the three year time span covered by the study involved
10

Figure 2.1: Common Core tests as percentages of all MAP tests by content area by term and grade
�
��
��
��
��
��
��
��
�
�
���
� ��� ��� � ��� � ��� ��� � ��� � ��� ��� � ���
����
���� ������� ��������
the use of 1,907 separate item pools for the test results used in this study.
The tests in Table 2.1 that do not adhere to a standard grade or grade range designation are the end-of-
course mathematics tests for Algebra 1, Algebra 2 and Geometry. As their names suggest, they are to be
administered following formal instruction specific to their content. Except for their more focused, higher
level content, these tests are structured in the same manner as the other mathematics tests for grades
2-5 and grades 6 and above. All items in these tests are calibrated to the NWEA mathematics RIT scale,
thus they are employed in the estimation of growth in mathematics.
2.1 MAP Basics
While MAP tests may differ in their content and content structure, they all share a set of common features.
All items in a common content area are calibrated to the same underlying scale using a one parameter
logistic (1-PL) or Rasch model. The single parameter of the Rasch model refers to item difficulty. It
supposes that an examinee with a specified ability will answer an item of a given difficulty level with a
probability that is a function of the difference between examinee ability and item difficulty, both of which
are measured on the same scale. With both items and persons occupying positions on the same scale,
the task of selecting appropriately difficult items for a person whose ability is well-estimated is made much
easier.
MAP is a computerized adaptive test, or CAT, in which items are administered sequentially and each item
is selected to yield maximum information about the examinee’s ability. MAP tests capitalize on the simple
relationship between examinee ability and item difficulty - select and present an item of known difficulty,
collect the examinee’s response, use a Bayesian procedure (Owen, 1975) to estimate the examinee’s
ability from that response in conjunction with their responses to all previously administered items, and
select another item that is closest to that estimate. As this cycle is repeated, each successive ability
11

Table 2.1: Number of Items per Test by Content Area
Number
Content Area Grades of Items
Reading K-1 54
2-5 40
6+ 40
Mathematics K-1 54
2-5 50
6+ 50
Algebra 1 50
Algebra 2 50
Geometry 50
Language Usage 2-11 50
General Science 3-8 30
estimate is slightly more precise than the previous one until the error associated with the estimate is as
small as it is likely to be in the test session. The result (final ability estimate, RIT score) is the person’s
location on the additive scale (RIT scale) that is qualified by a standard error of measurement (SEM).
Characteristically, MAP tests yield ability estimates with SEMs that are less than .3 of a typical large
sample standard deviation (Kingsbury & Hauser, 2004). Standard errors vary minimally across over 90%
of the achievement range of a grade level. This makes MAP scores well suited for use in growth models
as well as other statistical procedures that assume additive measures.
Tests can be administered to the same student up to four times per calendar year or three times per
academic year. To control multiple presentations of the same items to the same examinee, an item lockout
period is imposed. The lockout period prevents an item presented to an examinee during a test event from
being presented in subsequent test events that occur over a specified period. For all tests events that make
up this study, a item lockout period governs item exposure. There are no restrictions concerning specific
timeframes or even times of the year in which tests may be administered. Test administration schedules
are left entirely to schools and/or school districts or agencies.
Prior to releasing a MAP test for publication, it is subjected to a series of simulations to ensure that it
operates as intended. These simulations allow test behavior to be evaluated for several characteristics
deemed critical to its intended functioning. The primary characteristics include: a) the accuracy of recovery
of true ability estimates of the simulated test takers, especially low and high ability test takers; b) the
presence of any item pool weaknesses - depth and breadth; c) goal balancing; and d) success of item
targeting given the simulated test taker’s interim ability estimate.
Further details about the background, development, technical, and operational characteristics of MAP
tests appear in the Technical Manual for Measures of Academic Progress (MAP) and Measures of Aca-
demic Progress for Primary Grades (MPG) (NWEA, 2011b).
12

Table 2.2: Age Cohorts K-11 in 2015 Norming Study
School Year
Grade 2011-12 2012-13 2013-14
12 11
11 11 10
10 11 10 9
9 10 9 8
8 9 8 7
7 8 7 6
6 7 6 5
5 6 5 4
4 5 4 3
3 4 3 2
2 3 2 1
1 2 1 K
K 1 K
2.2 Test Event Pools
Data source. The source for candidate test event records was the Growth Research Database (GRD).
The GRD is a repository of test event information (e.g., score, SEM, duration, test item pool, test date);
accompanying information about demographics of the test taker (e.g., school, grade, gender, ethnic
group membership); collateral information about items taken and their characteristics; as well as links
to datasets from external agencies such as the National Center for Education Statistics’ Common Core
of Data (NCES-CCD). Created and maintained by Northwest Evaluation Association, the GRD currently
holds over 370 million test event records, dating back to spring 2002. Roughly 99% of these records are
from MAP tests.
Timeframe. The study timeframe included the testing terms of fall 2011, winter 2012, spring 2012, fall
2012, winter 2013, spring 2013, fall 2013, winter 2014, and spring 2014. Norms were built for a total
of 12 cohorts (see Table 2.2), one each from kindergarten to grade 11, and labeled by students’ grade
level during the 2012-2013 school year. Any test event falling into one of these terms was treated as a
candidate for inclusion if it met several eligibility criteria:
• Test was a survey with goals test as opposed to a survey test
• Test terminated normally - was full length and was not terminated by a proctor
• For RIT scores < 240, 2 < SEM ≤ 4.5; for RIT scores > 240, SEM > 2
These criteria were applied to all test event records falling in the study timeframe. In addition to the RIT
score, several additional data elements were retrieved for each test record. These included:
• the test’s scale key - e.g., mathematics, language usage
• SEM of the score
13

Table 2.3: Content Area Test Record Pools Broken Down by Size and Unduplicated Counts of Students,
Schools, and School Districts
Districts Schools Students Test Events
Content Area N % N % N % N %
Reading 6,627 31.9 23,530 34.4 10,231,031 38.9 46,363,348 40.9
Mathematics 6,207 29.8 23,712 34.7 10,292,641 39.1 46,375,330 40.9
Language Usage 5,333 25.6 14,604 21.4 4,128,780 15.7 15,328,518 13.5
General Science 2,639 12.7 6,540 9.6 1,663,004 6.3 5,216,168 4.6
Totals 20,806 68,386 26,305,456 113,283,364
• the district identifier key
• the school identifier key
• the GRD-assigned student identifier key
• the student’s grade when the test was taken
• the student’s gender and ethnic group membership
• the term the test was taken
• the date the test was taken
• the district-specific instructional day on which the test was taken
• the summary of the test taker’s response times to items relative to items’ mean response times
• the specific test version that was taken
• the test’s Common Core status
• all relevant school-specific variables from the NCES-CCD Public School Universe dataset for the
test taker’s school (see Chapter 3 for specific variables)
The structures of the resulting test record pools varied primarily by content area and, to a lesser extent by
testing term. Table 2.3 provides a breakdown of the entire pool of test records, across all terms for each
content area. This tables points out the differences in percentages of test records available by content
area. It also shows that the sizes of differences between the contents areas shrinks when the origins of
the test records (i.e., schools, districts) are taken into account.
Table 2.4 provides the focal grade by content area structure of the norms provided in this document by
the type of norms (i.e., status and/or growth). These structures are broken down further in Table 2.5 to
Table 2.8 which summarize the test records pools by state and grade level for each content area and the
fall 2012 and spring 2013 testing terms - the focal year.
14

Table 2.4: 2015 RIT Norms Content Area Coverage
Grade
Content Area K 1 2 3 4 5 6 7 8 9 10 11
Reading △ △ △ △ △ △ △ △ △ △ △ �
Language Usage △ △ △ △ △ △ △ △ △ �
Mathematics △ △ △ △ △ △ △ △ △ △ △ �
General Science △ △ △ △ △ △
△ Status and Growth Norms � Status Norms only
2.3 Instructional Time
MAP tests are administered on schedules determined by test users in schools, school districts and other
educational entities. As a natural consequence of this feature, test administration can vary considerably
between and even within school districts. Status and growth norms based on term or season designations
for test administration are likely to be biased the further actual test administration times are from the modal
testing time in the term. Moreover, even if test administration time periods had been mandated by NWEA,
differences in instructional time for groups of test takers would not be accounted for. Both of these issues
can be resolved when instructional time is explicitly taken into account in creating norms.
To capture instructional time, school district calendars were used to establish when schools’ instructional
years began, when they ended, and which days were non-instructional days. District calendars from the
2013-2014 academic year were retrieved from targeted school districts that had administered a MAP test
during the fall term. The districts targeted for the retrieval effort were those in the highest 80% of total
tests administered. To ensure coverage across each state, a minimum of five district calendars was set
for each state.
Default state calendars. To account for missing calendars and calendars that were not retrieved as
part of the targeted limit imposed, state level default calendars were constructed form all other districts in
the state. To construct each state calendar, the first day of school from all districts in the state for which
calendars were available was retrieved. The “mean” of these starting dates was taken as the starting
date for the default calendar. The number of instructional days mandated by the state was also retrieved.
National holidays, specifically, Labor Day, Thanksgiving (Thursday and Friday), Martin Luther King Day,
President’s Day, and Memorial Day) were flagged as non-instructional days. A set of two weeks was
assumed associated with Christmas (Dec. 23 - Jan. 3) and was flagged as a non-instructional period. A
one week spring break was flagged as non-instructional days, using the dates most common associated
with the break in the available calendars from the state. Finally, state authorized non-instructional days
(such as a day for professional development) were also flagged as non-instructional days. The final state
default calendar was determined by using the starting date, adding successive days that were not flagged
as non-instructional days until the number of instructional days that equaled the number of mandated
instructional days was attained.
District and default state calendars were entered into a database using a custom designed entry screen
(see Figure 2.2, below). The entry application required a data specialist to simply point to and click on
a date of interest to either indicate that the date was the district starting school day for the year, the last
15

Figure 2.2: Instructional Calendar Entry Tool
��� !���" #$%&'()$ *'%+
,-./0 , 12 3 10 4 , 12 3 10 4 , 12 3 10 4 , 12 3 10 4 , 12 3 10 4
#2526/ � � 7 8 9 : ; �� � �" �7 �8 �; �� �� �� � �8 �9 �: �; �
<'=/'(>'+ � " 7 8 ; �� �� �� � �8 �9 �: �; �� � �" �7 �8 �9 �
?$/->'+ � � " 9 : ; �� �� �" �7 �8 �9 �: �� �� � �" �7 �: �; � �
@-A'(>'+ � " 7 8 9 : �� �� � �" �7 �: �; �� �� �� �7 �8 �9 �: �;
B'$'(>'+ � " 7 8 ; �� �� �� � �8 �9 �: �; �� � �" �7 �8 �9 � �
C%.2%+D � � 8 9 : ; �� � �" �7 �8 �9 �� �� �� � �" �9 �: �; � �
4'>+2%+D " 7 8 9 �� �� �� � �" �9 �: �; �� �� �" �7 �8 �9 �:
,%+$0 " 7 8 9 �� �� �� � �" �9 �: �; �� �� �" �7 �8 �9 �: �
#=+)E � � " 9 : ; �� �� �" �7 �8 �9 �: �� �� � �" �7 �: �; �
,%D � � 7 8 9 : ; �� � �" �7 �8 �; �� �� �� � �8 �9 �: �; �
C2.' � " 7 8 ; �� �� �� � �8 �9 �: �; �� � �" �7 �8 �9 �
C2ED � � " 9 : ; �� �� �" �7 �8 �9 �: �� �� � �" �7 �: �; � �
4)+6/ ).6/+2$/)-.%E &%D @-.!).6/+2$/)-.%E &%D F%6/ ).6/+2$/)-.%E &%D
day of the school year, or a non-instructional day. Errors could be corrected by re-clicking on a previously
clicked (activated) day. Figure 2.2 shows a replica of the entry screen.
2.4 Constructing Instructional Calendars
These calendars, both actual and constructed defaults, served as templates for extrapolating calendars
for the same district for the two prior academic years. The extrapolation process essentially identified
non-instructional days in the “extrapolated” calendar that corresponded to non-instructional days in the
template calendar. For example, a non-instructional day on the template calendar that occurred on the
second Tuesday of October, would be used to set the second Tuesday of October on the extrapolated
calendars as non-instructional days. Similarly, the number of days devoted to seasonal breaks (winter and
spring) on the template calendar were used to specify these break times in the extrapolated calendars.
Details of the process follow.
1. Build a list of common holidays used for the majority of breaks during the school year. The list
should include Labor Day, Veterans Day, Thanksgiving, Christmas, New Years and Easter. All
holidays occurring between January 1, 2010 and December 31, 2014 should be included. Assign
each holiday a category code to reflect if the holiday is:
a) a specific date (e.g., Veterans day is November 11th);
b) relative to a specific day of week (e.g., Thanksgiving is the 4th Thursday of November); or
c) a special date (e.g., Easter which is dependent on a date based on the lunar cycle).
2. Build a reference school year table for each district and each state from files containing the instruc-
tional calendar records. For each district and state, count the number of weekdays that were not
excluded by the above procedure. Assign these the name of “instructional days.”
16

3. As a first step for projecting the school year calendar to prior years, record the day of week of the
start date and end date. The assumption going forward in the procedure is that the school year for
a district will always start on the same day of week for each year.
4. Build the list of contiguous breaks for each district and state.
a) Save the start date and end date of each break.
b) Tally the number of days and number of weekdays for each break and assign an “outage
number” to each. This ensures that a particular type of outage contains the same number or
weekdays.
c) Join two breaks if one ends on a Friday and the other starts on the following Monday. Assign
this the name “break list.”
5. Determine the date offsets needed for the prior years. Determine the differences in the day of week
for January 1 between the reference school year and the other school years.
a) Repeat this for March 1.
b) Add these offsets to the dates from the reference year to translate them to the date that corre-
sponds to the same day of week. (Example: the 2011-2012 school year has a fall adjustment of
3 days in relation to the 2013-2014 school year. Labor Day falls on September 2, 2013, adding
3 days for the 2011 year gives September 5, 2011.)
c) Apply the offsets for the year based on January 1 to dates in that year before March 1. Apply
the adjustments for the year based on March 1 to dates on or after March 1. These steps also
accommodate leap years.
6. Link the “break list” (step 4) to the “date adjustments list” (step 5) to obtain the breaks for the prior
years. Link the resulting list to the holiday list (step 1) to create a holiday break list. If a break starts
on a Monday, treat the break as starting on the prior Saturday. If a break ends on a Friday, treat it as
ending on the following Sunday for linking purposes. The expanded start and end times are there
for holidays that fall on the weekend and are celebrated on the following Monday/preceding Friday.
7. Build the school year table by linking the reference school year table (step 2) to the date adjustments
list (step 5). This provides a way to set the start and end dates of each school year. Compute the
number of days, the number of weekdays and the number of instructional days for each school year
by counting the weekdays that are not in the holiday break list.
8. Build the district date list by linking the school year table to the list of every day between January 1,
2011 and December 1, 2014. Use the holiday breaks list to mark each holiday contained in a break.
9. Assign a sequential number for each instructional day (non-weekend/non-outage days) beginning
on January 1 through December 31, 2014.
10. Repeat step 9 for each school year.
17

Table 2.5: Unduplicated Count of Students with Reading Test Events in the Fall 2012 and Spring 2013 Terms by Grade by State
Grade State Percent
State K 1 2 3 4 5 6 7 8 9 10 11 Total Students Schools State
AK 1627 2087 2182 2716 2563 2776 2644 2839 2598 2403 1920 970 27325 23.2 39.6 AK
AR 7540 7711 7688 7395 7548 7701 7365 7657 6185 6408 4509 4191 81898 18.7 24.1 AR
AZ 1926 3647 4581 4819 4653 4313 4333 4139 4100 1368 792 674 39345 4.0 5.4 AZ
CA 13711 16822 22873 22944 22758 23085 23004 20753 19508 12297 8929 7711 214395 3.8 9.1 CA
CO 12897 14255 24553 25323 25234 25420 27080 25758 23536 18591 16029 4677 243353 32.0 54.4 CO
CT 2401 4871 5521 5622 6566 6615 7018 7442 7754 5661 4265 1921 65657 13.4 24.7 CT
DE 820 1549 2963 803 764 900 610 608 598 371 334 133 10453 9.3 19.6 DE
FL 520 509 533 562 440 532 696 643 461 221 2258 192 7567 0.3 1.6 FL
GA 5899 5815 5719 4695 4591 4950 5007 4680 4337 1274 922 209 48098 3.1 7.7 GA
HI 562 577 585 493 462 477 178 130 122 312 120 91 4109 2.4 10.4 HI
IA 2642 3744 9580 14113 14903 14676 15307 15841 15894 13092 12520 8998 141310 32.8 47.4 IA
ID 1153 2894 2883 2935 2936 2882 2858 2883 2887 2911 87 40 27349 10.6 8.6 ID
IL 44887 53981 80846 87697 86325 87321 90669 91294 87144 30290 23694 10482 774630 41.9 46.8 IL
IN 10919 13065 14921 13134 12405 12966 13553 12614 11882 9315 4428 2279 131481 13.8 25.1 IN
KS 7069 8346 12699 14963 15007 15148 15675 16239 15685 14318 10740 4741 150630 35.1 47.1 KS
KY 27677 29175 29506 30083 29712 28847 32887 32200 31615 22039 15109 8375 317225 52.1 63.9 KY
LA 1559 1474 1327 958 1108 1192 1204 1121 829 449 263 265 11749 1.9 4.9 LA
MA 2987 3504 5250 7249 7365 7227 7098 7163 7109 5080 2738 135 62905 7.6 13.4 MA
MD 5341 5853 5684 17372 16852 16566 17320 17462 17070 5477 3123 989 129109 17.0 33.4 MD
ME 1886 2288 6443 9253 9420 9845 10883 10959 10756 8024 5409 788 85954 53.5 77.1 ME
MI 27534 28494 35787 38388 38009 37731 37927 35039 33112 20773 17848 11429 362071 25.8 37.6 MI
MN 14942 23482 52544 54896 53189 52181 51575 49926 44972 31065 16975 5296 451043 59.9 71.9 MN
MO 2092 2576 4081 2774 4029 2816 2644 2467 2200 1747 1387 300 29113 3.6 7.2 MO
MS 11413 11411 11899 11412 9473 10234 9594 9401 8698 4339 3646 1074 102594 22.9 35.2 MS
MT 2413 3057 4483 6360 6272 6288 6867 6756 6511 5518 4515 2106 61146 46.9 56.2 MT
NC 7758 10418 11009 10694 11340 11457 9369 8718 8213 3586 268 237 93067 6.8 12.1 NC
ND 4421 5076 7738 7802 7644 7411 7392 7106 7155 7414 6805 2612 78576 88.8 100.0 ND
NE 3530 4038 5329 8409 8106 8077 8190 8109 8024 5972 5675 4197 77656 29.2 63.2 NE
NH 1892 4217 7135 8394 8692 8835 9092 9168 8773 5669 4463 522 76852 44.4 74.4 NH
NJ 6140 9258 12712 15759 15125 15245 17000 15044 14408 5002 3937 1470 131100 11.4 20.9 NJ
NM 2523 3704 5168 5632 5488 5508 5672 5742 5664 5149 4456 3018 57724 18.8 74.5 NM
NV 3537 6270 7234 8669 8654 8649 8730 8256 8202 7898 1655 562 78316 19.4 43.8 NV
NY 18306 20590 21640 22711 22989 23836 24919 22753 22140 11487 9078 4776 225225 9.3 14.2 NY
OH 10649 14457 16011 13319 15615 14679 13891 13625 12722 16874 10226 3126 155194 9.8 25.1 OH
OK 2524 2897 2776 3200 3083 3114 3030 1896 2481 535 736 467 26739 4.6 8.3 OK
OR 440 647 1006 1070 968 998 856 774 717 565 293 316 8650 1.7 8.0 OR
PA 4220 8156 10385 10502 11839 11241 12586 11258 10628 7291 5796 2910 106812 6.7 14.1 PA
RI 278 466 1011 1064 1309 1732 2009 2054 2072 1946 1695 456 16092 12.6 19.1 RI
SC 23111 37833 51923 52032 51603 51732 52196 52290 50108 29312 12567 3018 467725 71.1 94.5 SC
SD 806 996 852 797 821 858 799 859 844 814 552 399 9397 8.1 9.4 SD
TN 727 670 735 670 669 1037 1237 668 606 421 348 104 7892 0.9 3.3 TN
TX 7343 8513 13971 13230 12277 13261 14915 15022 10606 5613 3047 2519 120317 2.7 6.0 TX
UT 4235 4627 4673 4878 4849 4712 4488 2909 2808 2944 2512 1111 44746 8.2 13.1 UT
VA 2865 2989 3006 3154 3077 3083 3347 3341 2723 1265 984 510 30344 2.7 8.2 VA
VT 265 444 436 605 577 596 772 754 671 856 616 175 6767 9.0 19.1 VT
WA 9368 13169 22240 31496 30756 32802 35297 34835 34238 21388 11850 3705 281144 29.6 45.1 WA
WI 13875 24679 35216 41650 41548 42041 44475 44372 42840 28654 16685 8687 384722 51.5 64.1 WI
WV 827 864 904 841 834 783 889 850 903 535 473 341 9044 3.6 4.4 WV
WY 8117 7837 7598 7250 7256 6888 6911 6926 6900 6597 5119 2211 79610 95.8 100.0 WY
Total 350174 444002 605839 660787 657703 661264 682058 663343 630009 401130 272396 125515 6154220 14.1 25.0
18

Table 2.6: Unduplicated Count of Students with Mathematics Test Events in the Fall 2012 and Spring 2013 Terms by Grade by State
Grade State Percent
State K 1 2 3 4 5 6 7 8 9 10 11 Total Students Schools State
AK 1611 2097 2173 2723 2573 2786 2675 2850 2622 2449 1822 1077 27458 23.3 39.6 AK
AR 7490 7683 7697 7435 7587 7709 7380 7728 6503 5735 3095 2284 78326 17.9 25.3 AR
AZ 1928 3641 4586 4821 4650 4305 4339 4150 4098 1490 890 667 39565 4.0 5.4 AZ
CA 13516 16699 22825 23070 22992 23768 24154 21484 18954 10291 8576 7062 213391 3.7 9.9 CA
CO 12913 13939 24475 25352 25257 25460 27041 25648 23490 18430 15352 4525 241882 31.8 54.1 CO
CT 2398 4884 5646 5672 6565 6642 7065 7383 7726 5707 4216 2016 65920 13.5 25.3 CT
DE 986 1722 1694 805 769 901 616 607 602 338 310 70 9420 8.3 13.9 DE
FL 520 510 539 518 441 531 696 659 464 249 2214 210 7551 0.3 1.6 FL
GA 5652 5592 8786 7402 7371 7648 7549 7111 6718 1158 892 185 66064 4.3 10.2 GA
HI 566 583 587 487 433 494 179 129 113 905 278 128 4882 2.9 10.1 HI
IA 2650 3811 9670 14164 15205 14963 15446 15861 15863 12026 12003 8789 140451 32.6 48.5 IA
ID 2687 2903 2881 3099 3166 3074 3025 3223 3038 2928 2542 42 32608 12.6 15.7 ID
IL 44614 54876 81708 87764 86239 87294 90687 91265 86938 28155 23610 10849 773999 41.8 47.0 IL
IN 10929 13019 14884 13108 12396 12953 13444 12470 11616 4934 2602 1314 123669 13.0 24.7 IN
KS 7325 9104 12479 14996 15024 15148 15577 16073 15515 13957 10274 4917 150389 35.1 46.7 KS
KY 27551 29107 29467 30127 29698 28837 32946 32242 31601 21443 14258 8585 315862 51.9 64.2 KY
LA 1558 1468 1326 972 1108 1194 1205 1116 832 415 322 281 11797 1.9 4.9 LA
MA 2371 3001 5530 7031 7109 7012 6773 6662 6681 4621 2324 171 59286 7.1 13.5 MA
MD 16951 17568 17210 15925 14233 13969 10696 10009 9446 1948 1212 657 129824 17.1 31.1 MD
ME 2166 2581 6758 9335 9682 9931 10802 10980 10793 8191 6036 1093 88348 54.9 77.1 ME
MI 27605 28745 36209 38774 38443 38052 38022 35302 32923 20611 17908 11671 364265 25.9 37.7 MI
MN 15301 24055 52560 53436 51612 50348 49518 47971 43926 29977 16340 9599 444643 59.0 71.0 MN
MO 2121 2631 4308 2990 4230 3023 2857 2703 2335 1638 1210 481 30527 3.7 7.0 MO
MS 11402 11395 11873 11403 9460 10206 9552 9385 8711 4216 3486 1021 102110 22.7 35.2 MS
MT 2394 3045 4737 6610 6509 6415 6987 6804 6629 5786 4932 2238 63086 48.4 57.1 MT
NC 7760 10505 10985 10699 11293 11767 9377 8696 8215 3459 332 228 93316 6.8 12.7 NC
ND 4393 5040 7728 7823 7623 7416 7373 7113 7170 7500 6620 2531 78330 88.5 100.0 ND
NE 3553 4041 5330 8397 8101 8087 8167 8142 8040 6013 5714 4182 77767 29.2 63.3 NE
NH 1818 4126 7203 8448 8742 8875 9133 9206 8824 6010 4690 677 77752 44.9 74.4 NH
NJ 5959 8935 12394 15349 14712 14522 17435 15295 14554 5580 4320 2027 131082 11.4 20.7 NJ
NM 2576 4343 5233 5441 5410 5496 5688 5752 5622 5080 4497 3110 58248 18.9 74.4 NM
NV 3531 9133 8689 8669 8662 8670 8734 8262 8253 7753 1572 503 82431 20.4 43.8 NV
NY 19078 21339 21825 22708 22888 24126 24740 22284 21325 7945 6369 3720 218347 9.0 14.3 NY
OH 10544 14240 15829 14895 17186 16016 14026 14020 13127 16453 10035 3343 159714 10.0 24.8 OH
OK 2527 2916 2789 3204 3154 3077 3017 1862 2483 813 702 468 27012 4.6 8.3 OK
OR 499 655 1095 1169 1051 1069 849 747 755 688 407 348 9332 1.8 8.8 OR
PA 4257 8378 10394 10532 11855 11413 12188 10566 9901 7018 5913 2958 105373 6.6 13.8 PA
RI 279 465 1014 1118 1360 1790 2060 2069 2136 2400 2224 861 17776 14.0 20.4 RI
SC 22817 37728 51894 52092 51608 51731 52258 52320 50428 28447 12079 3385 466787 70.9 94.2 SC
SD 801 993 853 793 821 852 798 885 871 853 561 398 9479 8.2 9.0 SD
TN 725 672 736 665 670 1029 1252 622 600 321 278 34 7604 0.9 3.4 TN
TX 7368 8490 14082 15555 14865 16436 18437 18301 13233 6515 3043 2488 138813 3.1 6.2 TX
UT 4230 4630 4668 4865 4832 4710 4483 2923 2805 3003 2512 718 44379 8.1 13.1 UT
VA 2972 2985 3015 3155 3074 3082 3330 3130 2358 794 147 56 28098 2.5 8.4 VA
VT 263 446 502 656 610 633 783 784 692 870 626 195 7060 9.4 20.7 VT
WA 9469 13101 22333 31327 30679 32799 35101 34665 33631 20146 11310 5081 279642 29.5 45.3 WA
WI 18746 24772 35161 41656 41548 42114 44550 44442 42901 28338 16480 8582 389290 52.1 63.9 WI
WV 826 865 907 840 838 786 896 856 908 561 450 191 8924 3.6 4.4 WV
WY 8112 7837 7597 7245 7256 6889 6918 6930 6894 6387 5177 2127 79369 95.5 100.0 WY
Total 368308 461294 622864 665320 661590 666048 680824 659687 623863 380545 262762 128143 6181248 14.1 25.2
19

Table 2.7: Unduplicated Count of Students with Language Usage Test Events in the Fall 2012 and Spring 2013 Terms by Grade by
State
Grade State Percent
State K 1 2 3 4 5 6 7 8 9 10 11 Total Students Schools State
AK 1939 2595 2508 2750 2589 2769 2532 2409 1913 915 22919 23.6 37.8 AK
AR 2109 4197 4253 4713 4644 4967 3408 3060 2054 2170 35575 9.8 20.7 AR
AZ 685 1778 1744 1661 2959 2883 2865 678 484 430 16167 2.0 4.3 AZ
CA 13269 15005 15228 15255 11080 10529 10513 3253 3029 3068 100229 2.1 6.8 CA
CO 9570 12602 13482 15383 16146 14372 13209 8532 6994 2658 112948 18.0 44.7 CO
CT 775 4025 4086 3829 3785 3938 4402 3691 3087 1277 32895 8.0 17.7 CT
DE . 16 . 16 . . . 1 1 . 34 0.0 4.8 DE
FL 79 179 205 207 401 396 333 128 1614 99 3641 0.2 0.6 FL
GA 2572 3803 3648 4120 4384 4028 3885 511 489 169 27609 2.2 4.7 GA
HI 179 251 229 213 89 34 30 209 36 22 1292 0.9 4.9 HI
IA 2091 5684 6166 6452 7004 6815 7030 6270 6542 5395 59449 16.8 30.0 IA
ID 883 1220 1190 898 434 661 527 3 38 49 5903 2.8 8.1 ID
IL 10938 15388 15412 16387 18506 20358 20499 8216 6913 3275 135892 8.7 17.7 IL
IN 11516 11379 10911 11818 12060 11009 10510 7493 2759 1304 90759 11.4 20.8 IN
KS 1468 2413 2551 2744 2544 3254 3180 3583 3202 1549 26488 7.5 19.9 KS
KY 13995 19442 20860 19940 23072 21431 20626 11925 9866 6184 167341 33.2 55.9 KY
LA 264 461 438 731 724 569 256 76 48 . 3567 0.7 2.8 LA
MA 376 605 483 398 438 535 568 302 178 65 3948 0.6 5.9 MA
MD 468 1278 1221 1231 335 356 299 582 388 319 6477 1.0 3.5 MD
ME 1753 2446 2786 3049 3951 4224 4158 2764 1905 269 27305 20.3 42.4 ME
MI 13643 25868 25926 26277 27688 26082 24126 16202 13789 8406 208007 17.5 30.2 MI
MN 2819 4026 3805 4508 4862 4847 3756 3231 1960 825 34639 5.5 20.5 MN
MO 1069 1444 1751 1440 1296 1937 1725 964 574 126 12326 1.8 4.1 MO
MS 9454 10710 9160 10003 9259 9002 8396 4068 3480 1051 74583 20.2 33.2 MS
MT 1299 3879 3836 3961 4601 4227 4203 3462 3218 1900 34586 32.1 48.3 MT
NC 1667 4466 4762 4896 4782 4434 4033 2737 50 37 31864 2.8 4.9 NC
ND 4249 5302 5257 5269 4995 4692 4752 4753 4404 1362 45035 61.9 85.3 ND
NE 2195 6118 5682 5848 6010 5846 5781 5019 4906 3484 50889 23.2 52.8 NE
NH 2244 3240 3550 3992 4271 4700 4962 2568 1794 280 31601 21.4 50.0 NH
NJ 3201 6221 5690 6050 6505 5523 5080 2476 2159 1014 43919 4.6 13.2 NJ
NM 1573 1959 1799 1855 1929 1743 1755 2668 2364 1603 19248 7.6 60.5 NM
NV 1067 1360 1526 1680 1386 2033 1957 918 406 89 12422 3.7 25.6 NV
NY 3030 6658 6626 7037 6433 6286 5856 4101 3762 1529 51318 2.5 6.2 NY
OH 2775 6549 6478 6604 7101 6489 6293 7831 5179 2276 57575 4.3 13.6 OH
OK 284 455 477 378 416 192 190 250 376 215 3233 0.7 5.2 OK
OR 31 71 91 97 80 98 94 102 137 161 962 0.2 3.9 OR
PA 770 1109 1093 1457 2203 1822 1693 897 364 230 11638 0.9 4.9 PA
RI . 206 483 455 452 422 420 981 959 192 4570 4.3 10.2 RI
SC 20774 23972 23815 23840 25412 26238 25158 11710 4820 1266 187005 34.3 72.6 SC
SD 34 230 256 313 305 324 338 335 151 126 2412 2.6 4.8 SD
TN 371 421 431 849 1043 452 444 167 145 21 4344 0.6 2.4 TN
TX 3707 7763 7691 7904 6365 5852 2945 1036 755 258 44276 1.2 4.3 TX
UT 2619 4654 4557 4409 4217 2913 2809 2956 2512 1120 32766 7.3 12.9 UT
VA 379 1040 1328 1672 1406 1349 1332 682 437 104 9729 1.0 4.9 VA
VT 348 503 507 539 597 474 518 716 457 70 4729 7.6 17.4 VT
WA 519 1375 1333 1335 2179 2524 2488 2476 2061 1116 17406 2.2 16.0 WA
WI 10584 18813 18792 19205 24266 23757 21705 9926 6918 1770 155736 24.9 40.2 WI
WV 578 729 711 690 530 519 526 130 112 102 4627 2.2 4.1 WV
WY 4426 4544 4723 4845 5254 4895 5024 4831 3945 1522 44009 64.8 79.7 WY
Total 170638 258452 259537 269203 280988 272800 257189 161879 123734 61472 2115892 5.8 15.4
20
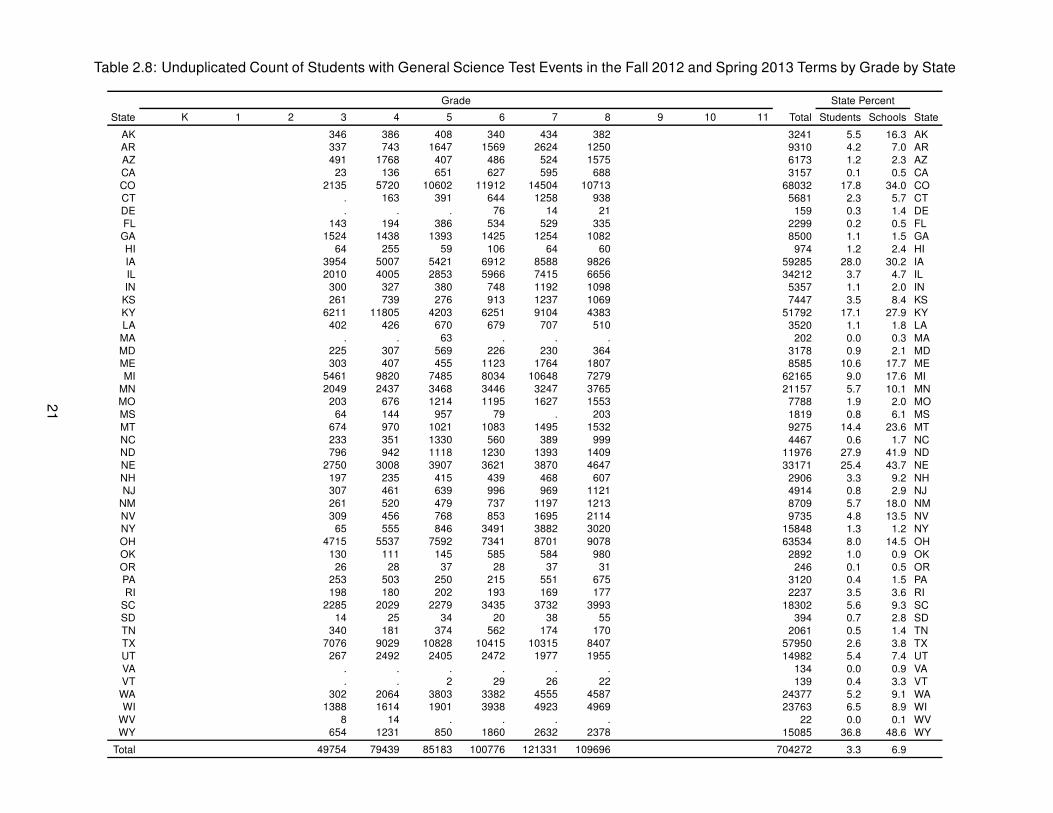
Table 2.8: Unduplicated Count of Students with General Science Test Events in the Fall 2012 and Spring 2013 Terms by Grade by State
Grade State Percent
State K 1 2 3 4 5 6 7 8 9 10 11 Total Students Schools State
AK 346 386 408 340 434 382 3241 5.5 16.3 AK
AR 337 743 1647 1569 2624 1250 9310 4.2 7.0 AR
AZ 491 1768 407 486 524 1575 6173 1.2 2.3 AZ
CA 23 136 651 627 595 688 3157 0.1 0.5 CA
CO 2135 5720 10602 11912 14504 10713 68032 17.8 34.0 CO
CT . 163 391 644 1258 938 5681 2.3 5.7 CT
DE . . . 76 14 21 159 0.3 1.4 DE
FL 143 194 386 534 529 335 2299 0.2 0.5 FL
GA 1524 1438 1393 1425 1254 1082 8500 1.1 1.5 GA
HI 64 255 59 106 64 60 974 1.2 2.4 HI
IA 3954 5007 5421 6912 8588 9826 59285 28.0 30.2 IA
IL 2010 4005 2853 5966 7415 6656 34212 3.7 4.7 IL
IN 300 327 380 748 1192 1098 5357 1.1 2.0 IN
KS 261 739 276 913 1237 1069 7447 3.5 8.4 KS
KY 6211 11805 4203 6251 9104 4383 51792 17.1 27.9 KY
LA 402 426 670 679 707 510 3520 1.1 1.8 LA
MA . . 63 . . . 202 0.0 0.3 MA
MD 225 307 569 226 230 364 3178 0.9 2.1 MD
ME 303 407 455 1123 1764 1807 8585 10.6 17.7 ME
MI 5461 9820 7485 8034 10648 7279 62165 9.0 17.6 MI
MN 2049 2437 3468 3446 3247 3765 21157 5.7 10.1 MN
MO 203 676 1214 1195 1627 1553 7788 1.9 2.0 MO
MS 64 144 957 79 . 203 1819 0.8 6.1 MS
MT 674 970 1021 1083 1495 1532 9275 14.4 23.6 MT
NC 233 351 1330 560 389 999 4467 0.6 1.7 NC
ND 796 942 1118 1230 1393 1409 11976 27.9 41.9 ND
NE 2750 3008 3907 3621 3870 4647 33171 25.4 43.7 NE
NH 197 235 415 439 468 607 2906 3.3 9.2 NH
NJ 307 461 639 996 969 1121 4914 0.8 2.9 NJ
NM 261 520 479 737 1197 1213 8709 5.7 18.0 NM
NV 309 456 768 853 1695 2114 9735 4.8 13.5 NV
NY 65 555 846 3491 3882 3020 15848 1.3 1.2 NY
OH 4715 5537 7592 7341 8701 9078 63534 8.0 14.5 OH
OK 130 111 145 585 584 980 2892 1.0 0.9 OK
OR 26 28 37 28 37 31 246 0.1 0.5 OR
PA 253 503 250 215 551 675 3120 0.4 1.5 PA
RI 198 180 202 193 169 177 2237 3.5 3.6 RI
SC 2285 2029 2279 3435 3732 3993 18302 5.6 9.3 SC
SD 14 25 34 20 38 55 394 0.7 2.8 SD
TN 340 181 374 562 174 170 2061 0.5 1.4 TN
TX 7076 9029 10828 10415 10315 8407 57950 2.6 3.8 TX
UT 267 2492 2405 2472 1977 1955 14982 5.4 7.4 UT
VA . . . . . . 134 0.0 0.9 VA
VT . . 2 29 26 22 139 0.4 3.3 VT
WA 302 2064 3803 3382 4555 4587 24377 5.2 9.1 WA
WI 1388 1614 1901 3938 4923 4969 23763 6.5 8.9 WI
WV 8 14 . . . . 22 0.0 0.1 WV
WY 654 1231 850 1860 2632 2378 15085 36.8 48.6 WY
Total 49754 79439 85183 100776 121331 109696 704272 3.3 6.9
21
3 Reference Population
and Post-Stratification Weighting
As was shown in Chapter 2 (Table 2.5 to Table 2.8), MAP tests are administered in virtually all states
in the U.S. The vast majority of tests are administered in reading, language usage, and mathematics in
grades kindergarten through 10. These facts were taken as justification for focusing on the U.S. school-
age K-10 population as the reference population for the study. As we have also discussed in Chapter 2,
the pool of examinees in our data archive represents the NWEA partner base in the 2012-2013 school
year. It is reasonable to expect that the available examinees at any point in time reflect to some unknown
changes in MAP usage patterns, in addition to an evolving make-up of the U.S. English-speaking school-
age population. By itself, it is questionable whether data from our examinee pool adequately informs
the patterns of performance of all U.S. school-age students, which is the population targeted in the 2015
norms. Norming results that are based on such data alone would reflect baselines specific to the NWEA
partner base. Thus, a first step towards building nationally representative norms from the convenience
sample represented by the NWEA examinee pool is to consider how NWEA examinees differ from the
students in the target population on factors that might influence their achievement.
To extend inferences to the U.S. English-speaking school-age population, knowledge about differences
in the joint distributions of NWEA (sampled) and non-NWEA (un-sampled) schools, certain key observed
features in the population can be exploited to construct “population weights.” Applying such weights
to the available sample of schools achieve results which better reflect those key school features in the
population. This approach to post-stratification adjustment of the data in hand is a common strategy in
cases where stratification prior to sample selection is impossible (Holt & Smith, 1979; Pike, 2007). This
is the case when large convenience samples, such as those from the NWEA client data-base (in the
GRD), are the primary data source. Post-stratification is also often applied when one suspects that simple
random sampling or systematic sampling, upon comparing sample and population distributions of key
attributes describing the units, may not have been entirely satisfactory.
Generally speaking, suppose that the student i is individually selected with a uniform probability of pi and
the population weight for the student’s school j from a suitable post-stratification analysis is Wj . The
total weight for a student i’s observed score in an analysis would be Wj/pi. In the 2011 NWEA norms
study, post-stratification of examinees was accomplished using a composite index constructed from 13
school level variables extracted from the National Center for Education Statistics’ Common Core of Data
in the Public School Universe (NCES-CCD-PSU) dataset (Sable & Plotts, 2010). Post-stratification in that
study was focused on estimating population weights for post-stratifying the available NWEA schools in
each state to better represent schools in the state. The weights were employed in a statistical model to
estimate achievement and growth norms simultaneously for the U.S. school age population.
22

Table 3.1: NCES Variables Used in Post-stratification Weighting
NCES Variable SCI Variable NCES Description Notes / Codes
ULOCAL11 School locale urban-centric locale Used only the portion of the variable
without the size/distance portion, re-
sulting in the categories of
code 1 = city
2 = suburb
3 = town
4 = rural
TYPE11 School type code for school type 1 = Regular
2 = Special education
3 = Vocational (not included)
4 = Other/alternative
5 = Reportable program (not included)
LEVEL11 School level School level by low and
high grades served
1=Primary (Low=PreK-3; High=PreK-
8)
2=Middle (Low=4-7; High=4-9)
3=High (Low=7-12; High=12 only)
4=any other (e.g., 2-10)
TITLEI11 Title I Title I Eligible 1=Yes
2=No
MAGNET11 Magnet Regardless of the source of funding, a magnet school or pro-
gram is a special school or program designed to attract students
of different racial/ethnic backgrounds for the purpose of reduc-
ing, preventing, or eliminating racial isolation and/or to provide
an academic or social focus on a particular theme
1=Yes
2=No
CHART11 Charter A school that provides free elementary and/or secondary educa-
tion to eligible students under a specific charter granted by the
state legislature or other appropriate authority
1=Yes
2=No
MEMBER11 - Total students, all grades Used for calculation only, not used di-
rectly in SCI
TOTFRL11 Prop. FRL Total of free lunch eligible
and reduced-price lunch
eligible.
Used for calculation only, not used di-
rectly in SCI
AM11 - Total American Indian,
Alaska Native students
Used for calculation only, not used di-
rectly in SCI, used to calculate the pro-
portion of ethnic variable
BLACK11 - Total Black students Used for calculation only, not used di-
rectly in SCI, used to calculate the pro-
portion of ethnic variable
- Proportion of ethnic minority - Proportion of “ethnic” students calcu-
lated as (AM11 + HISP11 + Black11)
/ MEMBER11
FTE11 Staff FTE Total full-time equivalent
classroom teachers
23

Table 3.2: Distributions of Continuous NCES Variables Contributing to the School Challenge Index by
NWEA School Affiliation
NWEA Percentile
SCI Variable Affiliated Mean SD Median 5th 95th N
Proportion Free/Reduced Lunch Eligible Yes 0.48 0.29 0.45 0.05 0.95 22,347
No 0.50 0.95 0.50 0.01 0.94 69,426
Proportion of Ethnic Students Yes 0.33 0.32 0.19 0.02 0.96 22,447
(African Amer., Hispanic, Native Amer.) No 0.40 0.33 0.30 0.02 0.97 70,268
Staff Full Time Equivalents Yes 3.15 0.79 3.26 1.71 4.23 22,447
No 3.18 0.93 3.33 1.22 4.39 70,268
3.1 School Challenge Index (SCI)
The school-level variables employed in the 2011 study were selected for the longstanding attention they
have received in the research literature, and discussions of educational policy1. Each variable had been
the topic of or accounted for in hundreds of research studies ranging from their effects on achievement and
learning to their inclusion in policy development. In view of their relevance as well as their well-established
history in the research literature, the variables used in the 2011 study were brought forward for use in the
current study. These variables or the combinations of variables created from them, are presented in Table
3.1. All data were taken from the NCES-CCD-PSU datasets for 2008 through 2011.
It should be noted that, while the variables listed in Table 3.1 are common across states, state-specific
demographics and adopted policies can and do cause their definitions, and as a result their distributions,
to vary, sometimes widely, between states. The distributions of these variables across schools by NWEA
affiliation are provided in Table 3.2 and Table 3.3. These results show that, among public schools in the
U.S. in 2011, NWEA served a lower proportion of minority students on average, more rural schools, less
special educational-focused schools, and more charters. Overall the differences between NWEA and
other U.S. public schools at large do not appear to be dramatic. However, the factors on which NWEA
schools are different are known to be strongly related to student achievement and school effectiveness.
In constructing norms that are useful for all U.S. public schools, prudence dictates that these differences
be addressed.
A common approach for developing population weights for schools may be illustrated by assuming that
post-stratifying will be based on two school-level variables measuring student ethnic and free-and-reduced-
priced lunch status composition. Both are categorical variables and many cells in the resulting joint dis-
tribution may contain no students of interest. In practice, some collapsing of the categories is needed to
attain workable cell numbers. The concern, therefore, is that the post-stratification weights take on differ-
ent meanings as cells in the joint distribution are collapsed, or if a category needs to be deleted in one
margin or another. This is a frequently encountered problem, and one that becomes more likely as the
number of categorical variables that is required to achieve accurate weights increases. It is often difficult
to produce weights to reflect adequately a multi-factor distribution, a situation that is made more difficult
when both continuous and categorical variables need to be considered.
1This section draws heavily from Chapter 3 of the 2011 RIT Scale Norms Study.
24

If post-stratification is to be based on comparing the distributions of sampled units and units in the pop-
ulation on a large number of factors, three approaches are plausible. The first is to work with the joint
distribution of the factors, as indicated above, if all factors are categorical or categorized (if it is originally a
continuous variable). The problems with empty cells noted above can be a huge stumbling block when the
numbers of variables and categories increase. A second approach is to employ a dimensional reduction
analysis, such as the Mahalanobis distance metric (Mahalanobis, 1936), or factor scores from a one-factor
factor analysis model. These methods are generally available for continuous variables but working with a
mix of both continuous and categorical variables would require a far greater level of sophistication. Fur-
thermore, it is often hard to explain what the resulting dimension represents. This has persuaded some
users to consider approaches akin to the third alternative.
A strategy for using as much of the information from a large number of variables, categorical or continuous,
in post-stratification might draw upon the idea of the propensity score as a solution to matching units on a
large number of dimensions (Rosenbaum & Rubin, 1983). The probability that a unit receives treatment is
the propensity score for that unit. This probability is generally based on a logistic regression of treatment
status for a group of units (treated and untreated) on a number of relevant covariates (whether categorical
or continuous). The idea is that treatment and control units within a suitable range on their propensity
score are considered “similar” in terms of their shared covariate profiles and so the difference on their
outcomes can be more justifiably attributed to the treatment in question.
While the original intent of propensity score analysis is to support causal inference in observational studies
and quasi-experiments, its key methodological insight has far greater application. At the core of the
propensity score proposal is the insight that units can be matched efficiently on a large number of factors,
once the information from a regression among those same factors may be reduced to a single dimension.
This third approach is exemplified by the Similar Schools Index (SSI) designed by the State of California
to facilitate the ranking of their schools (State of California DOE, 2000). It employed school-level testing
results as the outcome in a regression on a large number of school-level demographic, community, and
structural information to characterise the performance of schools in relation to the factors under which they
operate. Deriving a single dimension on which schools may be compared in this way serves to effectively
compare the schools across multiple dimensions. We believe that post-stratifying schools on such an
index can lead to norming results that better represent the U.S. school-age population. Thus, the SSI is a
useful point of departure for understanding the School Challenge Index (SCI).
It is well understood that schools serve students with wide ranging needs. As schools operate within an
even wider range of conditions, evaluators are rightly skeptical about comparisons of school effectiveness
that do not also take into account well-known differences in the challenges schools individually face every
day. The SCI was introduced in the 2011 NWEA norming study as a new measure of how schools in a
state compare in terms of the challenges and opportunities they operate under as reflected by an array
of factors they do not control. This school measure generally taps the collective economic circumstance
of its students. It also offers a broader view of the “economic strain” schools experience as seen through
a relevant set of socio-demographic, organizational, and educational policy programming factors. Unlike
the California SSI, however, no achievement data enter into its definition. This decision was made to avoid
potentially prejudicing schools across strata when they are later evaluated on their student’s achievement
results.
The SCI is based on school-level variables (see Table 3.1). Examination of the (2008 to 2011) year-to-year
variation in the distributions of these variables suggested that the latest dataset (2011) may not always
25

Table 3.3: Distributions of Categorical NCES Variables Contributing to the School Challenge Index by
NWEA School Affiliation
NWEA Affliated
Yes No
SCI Variable Category N % N % Total
School Locale City 5,321 23.7 18,945 27.0 24,266
Suburb 5,700 25.4 20,070 28.6 25,770
Town 3,318 14.8 8,992 12.8 12,310
Rural 8,108 36.1 22,261 31.7 30,369
School Type Regular 21,578 96.1 65,514 93.2 87,092
Special Ed 191 0.9 1,337 1.9 1,528
Alternative/Other 678 3.0 3,417 4.9 4,095
School Level Primary (PreK-Grade 8) 12,999 57.9 39,336 56.0 52,335
Middle (Grades 4 - 9) 4,243 18.9 12,156 17.3 16,399
High (Grades 7 - 12) 4,146 18.5 14,334 20.4 18,480
Other 1,059 4.7 4,442 6.3 5,501
Title 1 Eligible Yes 16,343 72.8 51,033 72.6 67,376
No 5,525 24.6 16,438 23.4 21,963
Missing/Not reported 579 2.6 2,797 4.0 3,376
Magnet School Yes 702 3.1 2,188 3.1 2,890
No 15,740 70.1 52,207 74.3 67,947
Missing/Not reported 6,005 26.8 15,873 22.6 21,878
Charter School Yes 1,603 7.1 3,843 5.5 5,446
No 16,940 75.5 60,951 86.7 77,891
Missing/Not reported 3,904 17.4 5,474 7.8 9,378
provide the best representation of the school’s level of challenge, due principally to missing or unreported
data. The distributions for these variables are presented in Table 3.2 and Table 3.3 for all schools in the
NCES-CCD-PSU dataset for 2011.
The SCI aims to measure the level of challenge a school faces in terms of the socio-economic composition
of its student body and as moderated by other related factors such as the ethnic make-up of its students,
the kind of assistance they receive (e.g., Title 1), or the environment it operates within such as its location
(e.g., city, rural), size, school level (e.g., elementary, high school), and emphasis (e.g., magnet, charter).
Broadly, four steps were followed in constructing an SCI estimate for a school for each of the years 2008-
2011. For each year, these steps included:
Step 1: Transformation of Variables The variables in Table 3.1 are first transformed. The general ap-
proach is to turn categorical variables into a set of dummy variables, variables representing counts
with known baseline numbers (such as the number of White students in a school) are converted into
log-odds, or logit units, and variables showing dramatic skew such as the number of full-time staff
and pupil-teacher ratio are log-transformed. The key variable for the SCI is of course the proportion
of students who received free-or-reduced-priced lunch and it is analyzed in its logit transform as
well.
Step 2: Data Completeness Data are first cleaned. Some variables, such as whether a school is a char-
26
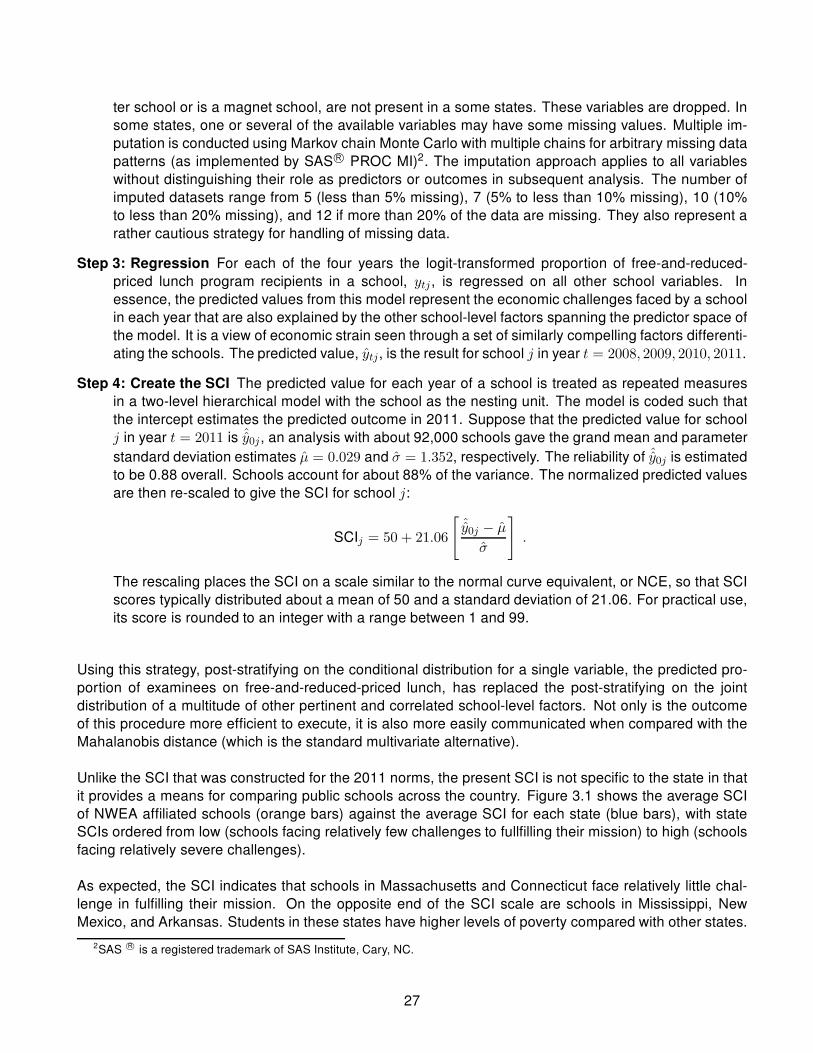
ter school or is a magnet school, are not present in a some states. These variables are dropped. In
some states, one or several of the available variables may have some missing values. Multiple im-
putation is conducted using Markov chain Monte Carlo with multiple chains for arbitrary missing data
patterns (as implemented by SAS R© PROC MI)2. The imputation approach applies to all variables
without distinguishing their role as predictors or outcomes in subsequent analysis. The number of
imputed datasets range from 5 (less than 5% missing), 7 (5% to less than 10% missing), 10 (10%
to less than 20% missing), and 12 if more than 20% of the data are missing. They also represent a
rather cautious strategy for handling of missing data.
Step 3: Regression For each of the four years the logit-transformed proportion of free-and-reduced-
priced lunch program recipients in a school, ytj , is regressed on all other school variables. In
essence, the predicted values from this model represent the economic challenges faced by a school
in each year that are also explained by the other school-level factors spanning the predictor space of
the model. It is a view of economic strain seen through a set of similarly compelling factors differenti-
ating the schools. The predicted value, ytj, is the result for school j in year t = 2008, 2009, 2010, 2011.
Step 4: Create the SCI The predicted value for each year of a school is treated as repeated measures
in a two-level hierarchical model with the school as the nesting unit. The model is coded such that
the intercept estimates the predicted outcome in 2011. Suppose that the predicted value for school
j in year t = 2011 is ˆy0j, an analysis with about 92,000 schools gave the grand mean and parameter
standard deviation estimates µ = 0.029 and σ = 1.352, respectively. The reliability of ˆy0j is estimated
to be 0.88 overall. Schools account for about 88% of the variance. The normalized predicted values
are then re-scaled to give the SCI for school j:
SCIj = 50 + 21.06
[
ˆy0j − µ
σ
]
.
The rescaling places the SCI on a scale similar to the normal curve equivalent, or NCE, so that SCI
scores typically distributed about a mean of 50 and a standard deviation of 21.06. For practical use,
its score is rounded to an integer with a range between 1 and 99.
Using this strategy, post-stratifying on the conditional distribution for a single variable, the predicted pro-
portion of examinees on free-and-reduced-priced lunch, has replaced the post-stratifying on the joint
distribution of a multitude of other pertinent and correlated school-level factors. Not only is the outcome
of this procedure more efficient to execute, it is also more easily communicated when compared with the
Mahalanobis distance (which is the standard multivariate alternative).
Unlike the SCI that was constructed for the 2011 norms, the present SCI is not specific to the state in that
it provides a means for comparing public schools across the country. Figure 3.1 shows the average SCI
of NWEA affiliated schools (orange bars) against the average SCI for each state (blue bars), with state
SCIs ordered from low (schools facing relatively few challenges to fullfilling their mission) to high (schools
facing relatively severe challenges).
As expected, the SCI indicates that schools in Massachusetts and Connecticut face relatively little chal-
lenge in fulfilling their mission. On the opposite end of the SCI scale are schools in Mississippi, New
Mexico, and Arkansas. Students in these states have higher levels of poverty compared with other states.
2SAS R© is a registered trademark of SAS Institute, Cary, NC.
27

Figure 3.1: SCI by State and NWEA Affiliation
GH IJ KH LK MN IO PHLQGMHRGNMS KN OT UK VNGS MPGOPJ WJ GJ RV KM NS TK JX HY ZH OR M[ LH\H KZ JM GK MTOU IH MQ RQ HZ MI ]Z VI LP^H HUMGGVHZZ __ _` ab ab ac ac a_ a_ a_ aa ad a` a` ae ae ae ae af af af af af af af af dg dg dg dg db db db db db db db db db db db d_ d_ d_ d_ d` d` dh `d eg ehMLSH ae ae _h a_ ac ab dg a_ ad dc a_ ad a_ db _e `g ae dg de ah de af ae ah dg dd dg dd `e dh a` dd ad d_ dh d_ dg a` db ac d_ g dg `g d` d` dh `g ec ee\ij b_ cd ah `c fa d_ h fe ec _h _c `b bd cd cb f e` ag e bf b_ da ae cd cg bc ` d ` h cb a` b_ ae _ _` eb h h ba `c g bc c fb a f c_ e_ _`
g
bg
cg
_g
ag
dg
`g
eg
hg
fg
bgg
VIK
Therefore, we would expect schools in these states to be at the high end of the SCI scale. These results
suggest that the SCI is functioning as intended, and should be a suitable candidate for creating school-
level weights for any sizable subgroup of schools in the target population. Also strongly suggested by
Figure 3.1 is that weighting appears to be necessary because the proportions of NWEA partners among
public schools in a state, as represented by the green bars, do not mirror those of public school in the
state.
3.2 Constructing Post-stratification Weights
Unlike the weights employed in the 2011 RIT Scale Norms Study, weighting is specifically aimed at the
school-level. All students within a selected school are included in the study. The reasons are two-fold.
First, it is often the case that not all students at a grade level are tested at an NWEA partner school.
Second, we lack information, at both the national level and in the GRD, at about the students themselves
to appropriately sample at the student level.
To construct school-level weights from the SCI, we first identify schools by their SCI deciles. If PNWEAd is
the proportion of NWEA schools and PALLd is the proportion of all schools in SCI decile d, the population
weight for a school j in SCI decile d is
Wj =PNWEAd
PALLd
.
This procedure is repeated for each subject and grade-level because not all NWEA partners test on the
same subjects or serve the same grade-levels.
Finally, it was desirable to maintain a large and relatively constant number of schools, of about 1,500
28

Table 3.4: Post-stratification Weights for Mathematics Norms by Grade and SCI Decile
School Challenge Index (SCI) Decile
Grade Statistic 1 2 3 4 5 6 7 8 9 10 Summary
K N 80 105 140 143 157 171 188 133 166 145 1428
Weight 1.015 1.303 1.112 1.196 1.117 1.025 0.883 1.128 0.822 0.555 1.015
1 N 87 125 134 169 149 162 190 147 152 110 1425
Weight 0.932 1.092 1.159 1.010 1.174 1.079 0.872 1.018 0.896 0.730 0.996
2 N 83 112 135 163 166 198 177 152 162 105 1453
Weight 0.996 1.243 1.173 1.067 1.075 0.900 0.954 1.004 0.857 0.780 1.005
3 N 96 137 137 166 186 172 157 148 149 110 1458
Weight 0.864 1.019 1.160 1.052 0.962 1.040 1.080 1.035 0.935 0.747 0.989
4 N 78 144 124 178 169 173 170 156 131 121 1444
Weight 1.053 0.961 1.269 0.971 1.049 1.024 0.988 0.972 1.053 0.672 1.001
5 N 93 119 132 185 196 156 183 137 144 98 1443
Weight 0.883 1.162 1.192 0.934 0.904 1.135 0.917 1.106 0.958 0.829 1.002
6 N 73 147 173 188 198 138 174 142 127 92 1452
Weight 1.131 0.946 0.915 0.925 0.900 1.291 0.970 1.074 1.093 0.889 1.013
7 N 64 124 165 187 183 153 151 121 128 139 1415
Weight 1.258 1.093 0.935 0.906 0.949 1.135 1.089 1.228 1.056 0.573 1.022
8 N 72 148 198 189 169 147 124 98 115 119 1379
Weight 1.089 0.893 0.759 0.874 1.002 1.151 1.293 1.478 1.146 0.653 1.034
9 N 60 154 212 203 206 151 116 114 113 82 1411
Weight 1.338 0.878 0.725 0.832 0.841 1.147 1.414 1.300 1.193 0.969 1.064
10 N 70 163 229 191 185 145 112 97 106 69 1367
Weight 1.111 0.803 0.651 0.857 0.907 1.157 1.419 1.480 1.232 1.116 1.073
11 N 28 145 218 184 198 150 130 104 104 75 1336
Weight 2.714 0.883 0.668 0.869 0.828 1.093 1.195 1.349 1.228 1.003 1.183
schools (unweighted), out of a total NTotal NWEA schools eligible for each grade by subject analysis. To
achieve this result, a sampling fraction f = 1, 500/NTotal is defined so that the school weight employed for
the analysis is
wj =Wj
f.
The results, for mathematics and reading, are reported in Table 3.4 and Table 3.5, respectively. The clear
variation from grade-to-grade, decile-to-decile, and across the two subjects validates the recognition in
this study that a single set of weights would not adequately meet the challenges posed by the data.
29

Table 3.5: Post-stratification Weights for Reading Norms by Grade and SCI Decile
School Challenge Index (SCI) Decile
Grade Statistic 1 2 3 4 5 6 7 8 9 10 Summary
K N 70 99 134 150 162 168 194 155 154 141 1427
Weight 1.160 1.381 1.161 1.139 1.081 1.042 0.855 0.967 0.885 0.570 1.024
1 N 84 125 134 172 150 184 182 137 151 118 1437
Weight 0.973 1.101 1.169 1.000 1.176 0.958 0.918 1.102 0.909 0.686 0.999
2 N 73 126 144 178 176 183 174 168 135 97 1454
Weight 1.133 1.105 1.101 0.978 1.014 0.975 0.971 0.909 1.029 0.844 1.006
3 N 75 130 150 161 201 171 171 138 147 114 1458
Weight 1.106 1.074 1.059 1.084 0.890 1.046 0.991 1.110 0.948 0.720 1.003
4 N 80 122 142 175 185 171 178 144 143 116 1456
Weight 1.035 1.143 1.118 0.996 0.966 1.045 0.951 1.062 0.973 0.707 1.000
5 N 84 140 151 171 189 158 165 125 151 117 1451
Weight 0.983 0.993 1.047 1.016 0.942 1.127 1.022 1.219 0.918 0.699 0.997
6 N 65 147 178 209 162 167 159 144 121 102 1454
Weight 1.272 0.947 0.890 0.833 1.102 1.068 1.063 1.060 1.148 0.803 1.019
7 N 69 113 155 195 187 162 142 124 123 150 1420
Weight 1.171 1.204 0.999 0.872 0.932 1.076 1.163 1.203 1.103 0.533 1.025
8 N 78 169 200 172 190 136 120 95 125 113 1398
Weight 1.020 0.792 0.762 0.973 0.903 1.261 1.354 1.545 1.069 0.697 1.038
9 N 77 142 217 208 196 154 139 109 106 75 1423
Weight 1.051 0.960 0.715 0.819 0.891 1.134 1.190 1.371 1.283 1.069 1.048
10 N 59 157 239 186 183 145 137 90 107 61 1364
Weight 1.315 0.832 0.622 0.878 0.915 1.154 1.157 1.592 1.218 1.260 1.094
11 N 30 140 220 193 197 144 127 101 105 74 1331
Weight 2.524 0.911 0.659 0.826 0.829 1.134 1.218 1.384 1.211 1.013 1.171
30

4 Achievement Status and Growth Norms
for Students and Schools
In previous chapters, we have discussed the construction of the time variable, instructional days (or weeks)
in Section 2.3, in the growth model. Similarly, we have shown in Sections 3.1-3.2 how school-level pop-
ulation weights are developed from the SCI. This chapter discusses the statistical models underlying the
2015 MAP achievement and growth norms for use with US school-age students.
Figure 4.1 provides a cross-sectional sketch of the data employed in the analyses for focal grade 5,
i.e. those students who attended 5th grade in the 2012-2013 school year. The ellipses represent the
joint distributions of MAP scores and instructional days for each of the 9 terms considered. The solid
blue line is a plausible fitted curve for the set of MAP scores employed to estimate growth for the focal
grade (which is grade 5, and ellipses are grey in color). However, the high-level view of the data shown
in Figure 4.1 should not mask the nested nature of the data employed. In settings where scores are
nested within students, and students within schools, and in which there is substantial variation between
student growth trajectories and between schools in the population, multi-level models provide a more
defensible description of the growth of achievement over time (Bryk & Raudenbush, 1987; Raudenbush,
2001; Raudenbush & Bryk, 2002).
As we shall show, our approach to estimating conditional growth norms largely avoids many of the con-
cerns scholars have regarding how gains in achievement might be defined, measured, or modeled (Braun,
Figure 4.1: Data layout by Instructional Days
������������������������������������������������������������������������������������������������������������������������������������������������������������������������������������������������������������������������������������������������������������������������������������������������������������������������������������������������������������������������������������������������������������������������������������������������������������������������������������������������������������������������������������������������������������������������������������������������������������������������������������������������������������������������������������������������������������������������������������������������������������������������������������������������������������������������������������������������������������������������������������������������������������������������������������������������������������������������������������������������������������������������������������������������
�������
�����
�������������������������������������������������������������������������������������������������������������������������������������������������������������������������������������������������������������������������������������������������������������������������������������������������������������������������������������������������������������������������������������������������������������������������������������������������������������������������������������������������������������������������������������������������������������������������������������������������������������������������������������������������������������������������������������������������������������������������������������������������������������������������������������������������������������������������������������������������������������������������������������������������������������������������������������������������������������������������������������
���
�����
���������������������������������������������������������������������������������������������������������������������������������������������������������������������������������������������������������������������������������������������������������������������������������������������������������������������������������������������������������������������������������������������������������������������������������������������������������������������������������������������������������������������������������������������������������������������������������������������������������������������������������������������������������������������������������������������������������������������������������������������������������������������������������������������������������������������������������������������������������������������������������������������������������������������������������������������������������������������������������������������������������������
�������
�����
������������������������������������������������������������������������������������������������������������������������������������������������������������������������������������������������������������������������������������������������������������������������������������������������������������������������������������������������������������������������������������������������������������������������������������������������������������������������������������������������������������������������������������������������������������������������������������������������������������������������������������������������������������������������������������������������������������������������������������������������������������������������������������������������������������������������������������������������������������������������������������������������������������������������������������������������������������������������
�������
�����
��������������������������������������������������������������������������������������������������������������������������������������������������������������������������������������������������������������������������������������������������������������������������������������������������������������������������������������������������������������������������������������������������������������������������������������������������������������������������������������������������������������������������������������������������������������������������������������������������������������������������������������������������������������������������������������������������������������������������������������������������������������������������������������������������������������������������������������������������������������������������������������������������������������������������������������������������������������������������������������������������
���
�����
�����������������������������������������������������������������������������������������������������������������������������������������������������������������������������������������������������������������������������������������������������������������������������������������������������������������������������������������������������������������������������������������������������������������������������������������������������������������������������������������������������������������������������������������������������������������������������������������������������������������������������������������������������������������������������������������������������������������������������������������������������������������������������������������������������������������������������������������������������������������������������������������������������������������������������������������������������������
������
�����
��������������������������������������������������������������������������������������������������������������������������������������������������������������������������������������������������������������������������������������������������������������������������������������������������������������������������������������������������������������������������������������������������������������������������������������������������������������������������������������������������������������������������������������������������������������������������������������������������������������������������������������������������������������������������������������������������������������������������������������������������������������������������������������������������������������������������������������������������������������������������������������������������������������������������������������������������������������������������������������������������������������������
������
�����
������������������������������������������������������������������������������������������������������������������������������������������������������������������������������������������������������������������������������������������������������������������������������������������������������������������������������������������������������������������������������������������������������������������������������������������������������������������������������������������������������������������������������������������������������������������������������������������������������������������������������������������������������������������������������������������������������������������������������������������������������������������������������������������������������������������������������������������������������������������������������������������������������������������������������������������������������������������������������������������������������������������������������������������������������������������������������������������������������������������������������������������������������������������������������������������������������������������������������������������������
������
�����
����������������������������������������������������������������������������������������������������������������������������������������������������������������������������������������������������������������������������������������������������������������������������������������������������������������������������������������������������������������������������������������������������������������������������������������������������������������������������������������������������������������������������������������������������������������������������������������������������������������������������������������������������������������������������������������������������������������������������������������������������������������������������������������������������������������������������������������������������������������������������������������������������������������������������������������������������������������������������������������������������������������������������������
���
�����
��������� ��������� ���������
���
���
���
����������������������������������������������������������������������������������������������������������������������������� �����������������������������������������������
������������� !�"���#"���"��$����%��
31

1988; Cronbach & Furby, 1970; Good, Biddle, & Brody, 1975; Harris,1963; Harris, 2007; Linn & Slinde,
1977; Mellenbergh, 1999; Rogosa, 1995; Seltzer, Frank, & Bryk, 1994; Thum, 2003; Willett, 1988;
Williams & Zimmerman, 1996; Yen, 2007). As we have argued in the 2011 RIT Scale Norms Study
(NWEA, 2011a, p. 26)
“... we measure achievement status and not growth. Growth is an inference, a result that is
based solely on an acceptable descriptive model of change in achievement status over time.”
This approach is further clarified in Thum (2015, p. 251). The details of our procedure are the focus of
the remaining sections of this chapter.
4.1 Mixed-effects Growth Model
Within each age-cohort (labeled g = 0, 1, . . . , 12), we estimate a mixed-effects growth model to describe
the growth of students nested within schools over time. The age-cohort label g is selected so that it also
identifies the “focal grade” of its students. To simplify notation however, we suppress reference to age-
cohort or focal grade in the remainder of this section. Each student i from school j within an age-cohort
obtains a RIT score Ytij at term t = 1, 2, . . . , t, . . . , nij . The multilevel model, specified by Equation 4.1,
Within Student : Ytij = a′tijπij + etij
Between Students : πij = βj + rijBetween Schools : βj = γ + uj
, (4.1)
along with the components of variance
etij ∼ N(0, σ2tij) rij ∼ MVN(0, Tπ) uj ∼ MVN(0, Tβ) ,
describes the distributions of student and school score trends in each age-cohort. As presented, Equa-
tion 4.1 specifies a random coefficient regression model. When only some of the coefficients vary within or
between schools, as is likely in our application, the more general mixed-effects formulation for the student
score vector Y ij is
Y ij ∼ MVN(Aijγ,Σij) , (4.2)
where
Σij = AijH3TβH′3A
′ij +AijH2TπH
′2A
′ij + diag
{
σ2ij
}
.
H2 and H3 are selection matrices which identify, respectively, the random coefficients among πij for
students and βj for schools with variance-covariances Tπ and Tβ. The elements of this model are
explained next, beginning with the choice of the growth model design Aij.
4.1.1 Additive Polynomials
Longitudinal growth data, such as the NWEA MAP student assessments, have clear seasonal or periodic
patterns. First, although student growth may be quite unique, there is the marked deceleration in the rate
of learning growth over grade levels when one takes a cross-sectional view of the data. Then, there is
also the ubiquitous discontinuity in the so-called “summer drop” between Spring and Fall. These features
combine to give MAP growth trends a multiphasic character for which additive polynomials are more
32

Figure 4.2: Illustrative comparison of an additive polynomial model to the regular polynomial model for
focal grade 2 MAP mathematics means
kl
km
kn
ko
kp
q
p
o
n
m
prq
psq
ptq
puq
oqq
opq
q lq pqq plq oqq olq nqq nlq mqq mlq lqq
vwxyz{|}v~�
~�x��{��y��|} �|�x
vw�� ��}����y|} vwxyz{|} �zz� ��}����y|} vwxyz{|} v~� �y�w|� ��
����� ����� ������ ������
����� ����� ������ ������
����� ����� ������ ������
suitable when compared with regular or piece-wise polynomial models. Thum and Matta (2015) have
shown that the additive polynomial model removes systematic biases and hence provides better fit to
such data, reduces auto-correlation among errors and thus better meets the distributional assumptions of
linear models. A sum of polynomials, which is at the core of the additive polynomial model, provides a
flexible approach to fitting essentially non-linear curves with periodic or seasonal patterns.
The illustrative example in Figure 4.2 compares the best-fitting polynomial (a linear) to the best-fitting
additive polynomial model for a single series of cross-sectional means of 1st, 2nd, and 3rd graders in
mathematics. In this example, the residual variance for the additive polynomial model is 0.30, which
is much smaller in magnitude than 6.27 for the linear model. The Bayesian Information Criteria (BIC)
for the models are 26.2 and 45.9, respectively. It is clear from this example that a regular polynomial
model would have over-smoothed the data series, resulting in over-predicted scores in the Fall and under-
predicted scores in the Spring. We have found that over-smoothing is more likely to occur in the lower
grade levels and, as a result, under-estimates of the drop in scores over the summer are also larger.
A useful starting point for understanding the additive polynomial is the piece-wise regression model
for three assessments (Fall, Winter, and Spring terms) from three adjacent school years (2011-2012,
2012-2013, 2013-2014), as illustrated in Figure 4.2. Generally, suppose that a suitable polynomial is
fitted to the data within each grade g, with the intercept, linear, quadratic, etc., model terms in X =diag[Xg−1,Xg,Xg+1] and the corresponding vectors of regression coefficients are denoted by
ζ = [ζg−1, ζg, ζg+1]
or
Xg−1 = Xg = Xg+1 and Xg =
ζ0,g ζ1,g ζ2,g
Fall 1 0 0Winter 1 1 1Spring 1 2 4
.
33

An additive polynomial is obtained by a reparameterization of ζ such that X · ζ = X · L · π. Suppose that
a rank-appropriate choice of L results in X ·L = A, where each row of A corresponds to a′tij , the additive
polynomial model vector for student i from school j at term t in Equation 4.1. For example, each column
in
L =
1 −1 1 0 0 00 0 0 1 −1 00 0 0 0 0 11 0 0 0 0 00 0 0 1 0 00 0 0 0 0 11 1 1 0 0 00 0 0 1 1 00 0 0 0 0 1
reparameterizes the regression coefficient describing the trajectories of Fall intercepts [ζ0,g−1, ζ0,g, ζ0,g+1],the within-grade linear [ζ1,g−1, ζ1,g, ζ1,g+1] and quadratic growth coefficients [ζ2,g−1, ζ2,g, ζ2,g+1], etc. sepa-
rately across the grade levels of the piece-wise regression model. Hence, post-multiplying X by L gives
the additive polynomial growth model matrix
A =
π0ij π1ij π2ij π3ij π4ij π5ij
a′1ij 1 −1 1 0 0 0
a′2ij 1 −1 1 1 −1 0
a′3ij 1 −1 1 2 −2 1
a′4ij 1 0 0 0 0 0
a′5ij 1 0 0 1 0 0
a′6ij 1 0 0 2 0 1
a′7ij 1 1 1 0 0 0
a′8ij 1 1 1 1 1 0
a′9ij 1 1 1 2 2 1
. (4.3)
πij in Equation 4.3 are regression coefficients describing the inter-phase changes in key aspects of the
regular polynomial model for each phase or segment that makes up the complete data series for student
i in school j. The reparameterization of ζtij by L results in regression coefficients measuring (a) π0ij , the
predicted gth grade Fall MAP score, (b) π1ij, the linear rate of change of Fall scores,(c) π2ij , the quadratic
rate of change of Fall scores, (d) π3ij, the predicted gth grade linear growth rate, and (e) π4ij, the linear
rate of change in within-grade linear growth rate, and (f) π5ij , the predicted gth grade quadratic growth
coefficient of student i from school j.
In this application, the elements in A reflect when, in terms of instructional day, student i is assessed.
That is, growth model design constants in X, and hence in A, depend on time (i.e., instructional day) or
the occasion on which a test actually occurs.
We employ iDay = 0, 1, 2, . . . , 540 to represent instructional days over three school years (assuming that
there are 180 instructional days each school year). To ease communication and, more importantly, to
mitigate against multi-collinearity due to scaling effects of the model matrix, we work with instructional
weeks, iWk = iDay/5, instead. Generally, the coding of iWk, and thus the additive polynomial growth
model constants, also depend on the school year, such that
1. iWktij = (iDaytij − 0.0× 180− 20)/5 if Grade = g − 1 and iDaytij ≤ 180, and
34

a′tij =
[
1.0 −1.0 1.0 iWktij −iWktij iWk2tij]
2. iWktij = (iDaytij − 1.0× 180− 20)/5 if Grade = g and 180 < iDaytij ≤ 360, and
a′tij =
[
1.0 −0.0 0.0 iWktij 0.0 iWk2tij]
3. iWktij = (iDaytij − 2.0× 180− 20)/5 if Grade = g + 1 and iDaytij > 360, and
a′tij =
[
1.0 1.0 1.0 iWktij iWktij iWk2tij]
where, within each school year, iDaytij is centered at 20 if g is not K or not 12; otherwise a regular
polynomial with
4. iWktij = (iDaytij − 200)/500, and
a′tij =
[
1.0 iWktij iWk2tij iWk3tij]
is employed instead. This is because the additive polynomial is unsuitable for the kindergarten and 12th
age-cohorts for lack of data. Note that, after taking when in the student’s instructional calendar the student
tested, a′tij now depends on iWktij .
4.1.2 Using Scores as Outcomes
A well-constructed test provides the student with a result that is both valid and accurate. It is useful to
think of the result as a measurement composed of an estimate of the student’s “true” achievement and the
standard error of measurement or SEM, which indicates the precision of the “true” achievement estimate.
Like many other testing programs, MAP reports scores along with their conditional SEMs1. Although
SEMs should be routinely reported and used when interpreting scores, score changes and differences
according to Standard 2.13 of the Standards for Educational and Psychological Testing (AERA, APA, &
NCME, 2014, p. 45), it is a practice that is sometimes ignored when test scores are evaluated or analyzed.
Consequences of such casual practice may be substantial.
For example, an observed score is often compared with a given cut-score in placement decisions or in
concluding that a student is, or is not, proficient. Unfortunately, the basis of such judgments is weak as
they only consider whether the comparative result is numerically different from zero. This practice is hard
to defend because it ignores the error in the observed score. In this example, the student has in fact
only a 50% chance meeting or exceeding the cut-score when the student’s score is numerically equal
to the benchmark. A clearer indication that the student meets or exceeds the cut-score, one which is
consistent with the psychometric quality of the student’s score, is when the student’s observed score is
nearly 2× SEM above, or below, the benchmark.
The problem is exacerbated when measurement error is ignored or, equivalently, is assumed to be absent
in more complex analyses. First, the error structure of a statistical model is misspecified because mea-
surement error is in fact assumed to be numerically zero and only sampling error enters into the model.
1Test reliability is often introduced in discussions about score quality although the meanings and values of these concepts
should not be conflated. Like Harvill (1991, p. 183), we agree that SEMs may be usefully employed to support statements about
the precision of individual examinee scores on a test in ways not supported by the reliability coefficient of the test.
35

Statistical inference under miss-specified models leads to misleading conclusions. Second, biased point
estimates and poor estimates of precision are also likely to occur whenever scores vary significantly in
precision (Thum & Xiang, 2010, Appendix A).
To account for measurement error in our analyses, we employ a well-worn strategy first introduced, in
the context of modeling assessments, by Bryk, Thum, Easton, and Luppescu (1998) and subsequently
deployed by Thum (2006, 2015) and NWEA (2011a). The approach is based on standard weighted least-
squares estimation of heteroscedastic errors when estimates of error variances are known (e.g., Pindyck
& Rubinfeld, 1981). It is also a strategy exploited by Raudenbush and Bryk’s (1985) “V-known” random-
effects model for meta-analysis.
This strategy assumes that the squared SEM provides a suitable estimate of measurement error variance.
Rescaling the true-score model for the observed score by the inverse of the score SEM and restricting the
model error variance to a value of 1.0 will have suitably incorporated measurement error into an analysis.
For example, suppose that the square of the SEM, s2tij, associated with the observed score Ytij for student
i from school j is an acceptable estimate of Var(etij) = σ2tij in the student growth model from Equation 4.1.
Rescaling the model by 1/stij gives
Y ∗tij = a∗′
tijπij + e∗tij (4.4)
where Y ∗tij = Ytij/stij , a
∗′tij = a′
tij/stij , and Var(e∗tij) = 1.0. Estimation of the rescaled model is easily
accomplished in programs that give users the ability to fix the values of variance-components.
4.1.3 Estimation
Estimation of the mixed-effects growth model implied by Equation 4.1 and Equation 4.4 was carried out
using HLM c© Version 7 (Raudenbush, Bryk, Cheong, Congdon, & duToit, 2011).
4.2 Deriving Achievement and Growth Norms
For the required combinations of subject and grade-level, we obtain the fixed-effect estimates γ and their
variance-covariance matrix Var(γ), as well as the between-student and between-school true-parameter
variance-covariance matrices Tπ and Tβ, respectively. Relying on asymptotic normality assumptions
(e.g., Newey & McFadden, 1994, p. 2143), we employ these results to construct marginal and conditional
inferences about individual students, as well as grade-level aggregates of achievement status and growth
that constitute what is generally referred to as “the norms.”
4.2.1 Achievement Status Norms
Writing atij at instructional week iWkt as at, the predicted achievement status for students and schools is
Yt = a′tγ (4.5)
with standard error
se(Yt) =√
a′tVar(γ)at . (4.6)
36

The predicted standard deviation of a student score Y with SEM st obtained at iWkt for any grade and
subject may be shown to be
SDs(Yt) =
√
a′tVar(γ)at + a′
tH3TβH′3at + a′
tH2TπH′2at + s2t . (4.7)
These results are employed in estimating the normative standing of a score Yt,
ps(Yt) = Pr(Yt ≤ yt) =
∫ yt
−∞
φ(z)dz
in probability, where z is the standard normal deviate. Here, z is defined as zs(Yt) = (Yt − Yt)/SDs(Yt),and 100× ps(Yt) gives the corresponding student normative percentile.
We propose similar results that are most pertinent to evaluating the performance of school grade-levels.
Specifically,
SDS(Yt) =
√
a′tVar(γ)at + a′
tH3TβH′3at (4.8)
is the predicted standard deviation for grade-level school (true) score at iWkt. Analogous to the student
achievement status percentile, we define zS(Yt) = (Yt − Yt)/SDS(Yt), and 100 × pS(Yt) gives the corre-
sponding school normative percentile.
Table A.1 shows the results for student and school achievement status norms in Mathematics and Read-
ing. Results for Language Usage and General Science are found in Table A.2. The corresponding student
achievement percentiles for fall, winter, and spring and all subjects are found in Table C.1.1 through Ta-
bles C.1.12. School achievement percentiles are found in Table C.2.1 through Tables C.2.12.
4.2.2 Growth Norms
We begin with the presumption that a student takes two tests, the first is called the pre-test at iWkt and the
second post-test at iWkt+1. The gain in scores between two tests may be compared with the gains made
for tests taken at the same times with marginal gain norms. More informative comparisons are conditional
growth norms. In such comparisons, the student’s gain (or more generically growth in the case when
more than two tests are available) during this period is to be evaluated against the performance of the
student’s academic peers, that is, students who have taken the same tests, at the same times, and who
have the same RIT score on the pre-tests. Aside from evaluation of a student’s specific gains, growth
norms are also useful when a prediction about the student’s future outcome is formed from knowledge
of the student’s first test score. Such projections for example are common in classroom “goal setting”
exercises.
Marginal Growth Norms
Suppose that student i receives pre-test and post-test scores Y = [Yt, Yt+1] on instructional weeks iWktand iWkt+1, such that iWkt < iWkt+1. In addition, let A = [a′
t,a′t+1] and the SEMs for the scores are the
diagonal elements of E = diag[s2t , s2t+1], respectively. Then, defining the contrast
C =
[
c′1c′2
]
=
[
1 0−1 1
]
,
37

we obtain
CYi =
[
Yt,1
Yt+1 − Yt
]
=
[
Yt
Gi
]
Starting RIT
Gain.
From this definition, the expected marginal predicted gain from iWkt to iWkt+1 is simply
G = c′2A · γ (4.9)
with standard error of G
se(G) =√
c′2AVar(γ)A′c2 .
The predicted student variance-covariance of Yt status score and G gain by
Vs = C[
AVar(γ)A′ +AH3TβH′3A
′ +AH2TπH′2A
′ + E]
C ′ (4.10)
and the corresponding result for schools is
VS = C[
AVar(γ)A′ +AH3TβH′3A
′]
C ′ . (4.11)
From Equation 4.10 and Equation 4.11, the marginal standard deviation of student gain G is given by the
square-root
SDs(Yt, Yt+1) =√
Vs[22]
and the marginal standard deviation for school gain is
SDS(Yt, Yt+1) =√
VS[22] ,
where w[mn] denotes the element in mth row and nth column of matrix W. Analogous to the achievement
status percentiles for students and schools for zs(Yt) and zS(Yt), respectively, marginal growth percentiles
may be defined through zs(Yt, Yt+1) and zS(Yt, Yt+1) accordingly.
In Appendix B, Tables B.1-B.8 show the term-to-term marginal growth results in Mathematics, Reading,
Language Usage, and General Science for students and schools.
Conditional Growth Norms
Although marginal growth norms are easily obtained (as shown above), conditional growth norms are
preferred in that they remove the dependency of gains on starting achievement levels. Assuming bivariate
normality and applying standard results for conditional expectation, we see that the expected growth for
student i from iWkt to iWkt+1 conditional on Yt is
G∗s = G+
(
Vs[21]
Vs[11]
)
[
Yt − Yt
]
. (4.12)
Additionally, the conditional standard deviation of gains for a student with Starting RIT Yt is
SD∗s =
√
Vs[22] −V2s[21]/Vs[11] (4.13)
and for schools
SD∗S =
√
VS[22] −V2S[21]/VS[11] . (4.14)
38

In this application, and also in the 2011 RIT Scale Norms Study (NWEA, 2011a), zs(G∗s) = (G∗
s− G∗s)/SD∗
s
is the student Conditional Growth Index or CGIs, and 100×ps is the student Conditional Growth Percentile
or CGPs(G∗s). Similarly, zs(G
∗S) = (G∗
S − G∗S)/SD∗
S is the school Conditional Growth Index or CGIS, and
100× pS is the school Conditional Growth Percentile or CGPS(G∗S).
Conditional growth results for students and growth are found in Appendix D, Table D.1.1 to Table D.4.6.
The corresponding conditional growth results, for selected values of CGP, are found in Appendix E, Ta-
ble E.1.1 to Table E.4.36.
39

5 Results and Discussion
All norms, with one exception, are based on procedures presented in Chapter 4. The sole exception is for
end-of-course tests in algebra and geometry (see Appendix F). We limit our attention here to secondary
estimates from those procedures, describing selected aspects of the 2015 norms which users have found
to be most useful. Only selected results for mathematics and reading are presented due to space con-
siderations. However, results from all four content areas are included in Appendix A through Appendix F.
Detailed results of the underlying statistical analyses, will be presented in a separate report.
5.1 The 2015 Achievement Status Norms
Recall from Equation 4.5 that predicted mean achievement status at a given point in time is identical for
both students and schools. Thus, achievement status norms apply to both students and schools. Fig-
ure 5.1 shows the reading and mathematics predicted means for the fall, winter, and spring terms of U.S.
public schools and public school students attending kindergarten through grade 11. For both mathematics
and reading, students and schools mean achievement increases rapidly in the lower grades, decelerates
over the middle grades, and plateaus into high school beginning in the 9th grade. The composite pattern
over grade levels is quite smooth in each case, especially given the fact that model smoothing is applied
“within” the grade level only. This pattern of decelerating achievement is characteristic of MAP, as a re-
view of previous norms studies will reveal, and is commonly encountered in large scale assessments. Its
re-occurrence here provides indirect validation of both data and current study procedures.
For mathematics, a pattern of steady increase in standard deviations over grade levels is evident for
both students and schools. Relatively large values for all terms in kindergarten, but especially for fall,
represent obvious anomalies (see Figure 5.2). As Figure 5.3 shows, the anomaly with fall kindergarten is
also evident for reading, although the trend of increasing standard deviations within grade-level is much
less pronounced for both students and schools. Note that, as expected, variability between schools is
typically lower by a half of that predicted for students. This pattern of results holds for both reading and
mathematics.
The comparatively high student and school standard deviations in fall and winter terms of kindergarten
are the consequence of one known factor and several plausible factors. From Table 2.2, it is clear that
we need to use a regular polynomial to describe the age-cohort data available for kindergarten. In this
model, predictions for fall leveraged students’ scores for winter and spring of their kindergarten year, as
well as their results when they attended first grade. When the standard deviations of the kindergarten
status norms are compared to the corresponding kindergarten raw score standard deviations, the values
from the norms are roughly 36% larger in the fall, roughly 7% larger in the winter, and 7% larger in spring
40

Figure 5.1: Predicted Means for Fall, Winter, and Spring Reading and Mathematics Norm Distributions
� �
� ¡
� ¢
� £
¤ �
¤ �
¤ ¡
¤ ¤ ¥ � ¦
§ ¨ © § ª « ¬
¨ ® ¯ ° ± ² ¯ ³ ´ « µ ¶ « ·
¸ « µ µ ¹ ³ ¯ ª ° º » ° ³ ¼
� �
� ¡
� ¢
� £
¤ �
¤ �
¤ ¡
¤ ¤ ¥ � ¦
§ ¨ © ½ « ¯ ¾
¨ ® ¯ ° ± ² ¯ ³ ´ « µ ¶ « ·
¿ � ¤ � ¦ ¡ À À ¥ £ � � �
¸ « µ µ ¹ ³ ¯ ª ° º » ° ³ ¼
Á ° « ¬ ª
for mathematics but do not differ in reading. When the same comparisons are made for other grades, in
any content area there are virtually no differences between the raw score standard deviations and those
from the norms.
This suggests that the transition from the fall term to winter or spring of the kindergarten school year,
in what is taught, learned, and elicited by the MAP/MPG tests, is dramatic. There are several plausible
reasons for this result that merit nominal, even speculative attention here. As a group, these points all
coalesce around the perceived qualitative differences of students experiencing more formal school for
the first time. While all students arrive with a wide variety of non-school-related experiences, students
entering kindergarten come to school with very little, if any, in-school experience. To the extent that in-
school experiences serve to “homogenize” on overall background that affects testing behavior, test score
variance could be reduced accordingly.
41

Figure 5.2: Predicted Student (top) and School Grade-level (bottom) Standard Deviations of Mathematics
Â
Ã
ÄÅ
ÄÆ
ÄÇ
ÂÂ
ÂÅÅ ÂÇÅ ÈÆÅ
ÉÊËÌÍÎÏÌÐÑÊÒÓ ÔÒÕ
ÖÒÓÓ × ÐÊÌØÍ ÙÚÍÐÊÛ
ÙÌÎÜØÊÌ
Â
Ã
ÄÅ
ÄÆ
ÄÇ
ÂÂ
ÂÅÅ ÂÇÅ ÈÆÅ
ÉÊËÌÍÎÏÌÐÑÊÒÓ ÔÒÕ
Ý Ä Â È Æ Þ Ã ß Ç à ÄÅ ÄÄ
ÖÒÓÓ × ÐÊÌØÍ ÙÚÍÐÊÛ
áÍÒÜØ
ÙÏâÑÑÓ
Also, for most kindergarten students, the MAP for Primary Grades tests are their first experience with
testing of any kind. The effects of such first encounters on the precision of score estimates are largely
unknown. We speculate that the timing of administering these tests for the first time is likely to have a much
greater impact on the performance of kindergarten students than it does for students in other grades. Not
only is the amount of content-relevant instruction likely to vary widely across schools, but early or even
mid-year kindergarten students are also likely to vary in their “readiness” to engage meaningfully with
a MAP for Primary Grades test. Finally, we suspect that it is common in kindergarten to place a greater
instructional emphasis on the development of reading and language skills than on mathematics skills. The
higher standard deviations observed for kindergarten mathematics across terms would seem to support
this possibility.
In sum, the marked volatility we have found in predicted fall kindergarten scores suggests that its use in
important educational decision is best tempered by other pertinent information that are available about the
student. We note that, by the winter and spring terms in kindergarten, estimates of means and standard
deviations are more in line with the orderly trend we expect to see in measures describing development
and growth.
5.2 School Norms
In this study, we seek school grade level norms that are more tightly linked to the norms for students in
that the sets of norms share the same evidence base and issue from a singular methodological treatment.
42

Figure 5.3: Predicted Student (top) and School Grade-level (bottom) Standard Deviations for Reading
ã
ä
åæ
åç
åè
ãã
ãææ ãèæ éçæ
êëìíîïðíñòëóô õóö
÷óôô ø ñëíùî úûîñëü
ã
ä
åæ
åç
åè
ãã
ãææ ãèæ éçæ
êëìíîïðíñòëóô õóö
ý å ã é ç þ ä ÿ è � åæ åå
÷óôô ø ñëíùî úûîñëü
îó!ù
úð"òòô
úíï!ùëí
Figure 5.4: School Grade-level Intra-class Correlations by Grade for Spring: (a) Mathematics and (b)
Reading
�
����
� ��
����
� ��
����
� ��
� � � � � � � �� ��
���
����
������� ������� ���� ����
Accordingly, we have argued that a 3-level HLM is the appropriate model for estimating the 2015 norms,
because school grade-level norms are sought and that the required data reflects a nesting of students
43

Figure 5.5: Conditional Growth for Students and Schools for Grades 2, 4, and 7 in Mathematics
within schools. The improvements to model specification when using this approach for the 2015 norms
analyses is validated by the more-nearly uniform school ICC estimates of 0.155 (about 16%) to 0.209
(about 21%) across grades for both reading and mathematics (see Figure 5.4). These ICC values indicate
that there is substantial variation between schools. We note that the values from the 2015 RIT Scale
Norms Study are generally lower than published figures, denoted as Math-HH and Read-HH, from Hedges
& Hedberg (2007)1. The lower figures from the present study is quite understandable because, unlike the
Hedges & Hedberg (2007) study, MAP is the only assessment employed.
5.2.1 Growth and Starting RIT
In Section 1.2.4 of Chapter 1, we discussed the dangers of aggregation effects. A school, represented
by the collective performance of students at a grade level, does not achieve or grow in the same ways
as the student. The pattern of smaller standard deviations for schools than for students from Table A.1
would mean that a score higher or lower than the average achievement is less likely for schools than for
students. Student growth, for the same terms and starting RIT, also vary more than schools (see tables
in Appendix B). As a result, it would be inappropriate to evaluate schools using achievement and growth
norms, benchmarks, or standards intended for use with the individual student. For evaluating schools
therefore, the school norms should be used instead.
Another important finding from the research literature on aggregation effects is that not only are the dis-
tributions of the means of individual units different from the means of groups in which they are nested,
relationships between outcomes and covariates or predictors among units within groups are likely to be
different from that observed among groups as well. This finding is quite pertinent to the general user,
for whom the perception that high growth invariably follows low initial performance is particularly strong.
While this prediction is prevalent it is by no means universal, even when it is explicitly a prediction about
how students generally perform.
Figure 5.5 shows examples attesting to the variety in the predictive relationships between starting RIT
and gains in mathematics for students (blue lines) for grade 2 (fall-to-spring), 4 (fall-to-spring), and 7 (fall-
to-fall). As plotted are the predictive relationships between starting RIT and growth for schools. Clearly,
it will be important for the user, whether a teacher, parent, or administrator, to understand the nature of
the predictive relationship specific to each test, grade, and terms, before expectations are set for either
1Further comparison of these results, including ICCs for term-to-term growth, should be of great interest but their discussion
is beyond the scope of this study.
44

Figure 5.6: Difference in Predicted Means (Additive Polynomial minus Regular Polynomial): (a) Mathe-
matics and (b) Reading
� � � � �
� # � � �
� $ � � �
� % � � �
� � � �
% � � �
$ � � �
# � � �
� � � �
& � � �
' � � �
% � ( $ � ) # � *
+ , -
- . / 0
1 2 3
� � � � �
� # � � �
� $ � � �
� % � � �
� � � �
% � � �
$ � � �
# � � �
� � � �
& � � �
' � � �
% � ( $ � ) # � *
+ , -
- . / 0
% $ # � & ' 4 5 6 % � % %7 8 2 9 :
1 ; 3
the student or the school. As we have noted in Section 1.2.4, failure to attend to such nuances in the
norms can grossly misinform policy and may lead to decisions with serious consequences for students
and schools.
5.3 Differences between the 2011 and 2015 Student Status Norms
In Section 1.4, we have provided some reasons for why successive MAP norms will likely change and
how these changes may reflect in part the new performance characteristics of U.S. public school students
in the 2012-2013 school year. We have also discussed changes that may have arisen from the adoption
and implementation of the Common Core State Standard (CCSS) in instruction, and the accompanying
45

Figure 5.7: Difference in Standard Errors of Predicted Means (Additive Polynomial minus Regular Poly-
nomial): (a) Mathematics and (b) Reading
< = > ? =
< = > @ A
< = > @ =
< = > = A
= > = =
= > = A
= > @ =
@ < B ? < C D < E
F G H
H I J K
L M N
< ? > = =
< @ > A =
< @ > = =
< = > A =
= > = =
@ < B ? < C D < E
F G H
H I J K
@ ? D O A P Q R S @ = @ @T U V W X
L Y N
switch over to Common Core State Standard versions of MAP. Transition towards CCSS testing has been
dramatic but, unfortunately, not enough is known about partner adoption and implementation of CCSS.
The result is that the gross impact of CCSS will remain a part of the unexplained variation of the statistical
models at this time.
5.3.1 Implications of New Procedures
Another important reason for expecting changes is that, at the outset, we have planned specific improve-
ments for the norms of 2015. These improvements respond to a planned increase of the utility of the
norms to include norms for schools. In addition, there is an expansion in scope to support growth eval-
46

Figure 5.8: Comparing (a) the predicted means and (b) standard deviations of the 2011 and 2015 Student
Norms. Plot-points for means are referred to the left vertical axis. Differences in means (2015 minus
2011) are referred to the right vertical axis.
Z [
Z \
Z ]
Z ^
Z _
`
_
^
]
\
[
_ \ `
_ a `
_ b `
^ ` `
^ ^ `
^ \ `
_ \ ` _ a ` _ b ` ^ ` ` ^ ^ ` ^ \ `
c d e f g h i j k
c d e e g h i j k
Z [
Z \
Z ]
Z ^
Z _
`
_
^
]
\
[
_ ^
_ ]
_ \
_ [
_ a
_ l
_ b
_ m
^ `
_ ^ _ ] _ \ _ [ _ a _ l _ b _ m ^ `
c d e f n o
c d e e n o
p q r s t u v v w x w y z w { w q | t u v v w x w y z w p q r s w } q r u z ~ { w q | u y �
� � �
� � �
� � �
� � �
uations over a wider seasonal horizon that requires an increase to the data span. Both these changes
required adopting procedures more suited to the data characteristics; a three-level growth model that uses
an additive polynomial to deal with known seasonality in the score trends. For these reasons, differences
47

from the 2011 results must be anticipated.
Although separating the impact of these changes in data and procedure will be difficult, focusing on the
impact of the additive polynomial will be very instructive because we have obtained similar results from
the regular polynomial growth model. Figure 5.6 shows the correction for systematic bias as a result of
using an additive polynomial. The plots of differences between 2015 and 2011 status means by grade
level indicated a pattern of over-prediction for 2011 fall means and under-prediction of 2011 spring means.
The pattern of correction appears to be the same for both mathematics and reading. Also expected is the
pattern of stronger correction in the lower grade levels. Finally, not only have the additive polynomial
substantially reduced seasonal bias, the plot of difference in standard errors in Figure 5.7 clearly indicate
that the means in the 2015 norms are better estimated, especially for mathematics.
Figure 5.8 plots the means and standard deviations of the mathematics and reading status norm, for fall,
winter, and spring terms, from 2015 against the results for 2011. On the whole, Panel (a) shows that the
predicted means from the 2015 norms are highly predictive of values from the 2011 norms. It displays
a pattern of differences which indicates that (1) means are more affected by the use of the additive
polynomial in the lower grades, and (2) means for 2015 are lower than those in 2011 from the middle to
the upper grade levels, with differences that range between -4 to +2 RITs. Panel (b) displays a pattern of
predicted standard deviations that suggests that scores are now more variable.
These differences are significant. Consistent with our expectations, they reflect the impact of a blend
of known data and procedural changes between 2011 and 2015. These differences are also likely to
be related to the adoption and implementation patterns of CCSS content, instruction, and testing. Due
to these differences in means and standard deviations, it is understandable that standard scores and
percentiles for a given RIT score will appear to be different for the two sets of norms. As we have argued
in Section 1.4, standard scores or percentiles reflect the relative standing of the student under each set
of norms. However, the student’s achievement level has not changed even when their ranking in the two
sets of norms are different.
48

References
American Educational Research Association, American Psychological Association, & National Council of
Measurement in Education (2014). Standards for educational and psychological testing. Washing-
ton, DC: AERA.
Angoff, W. H. (1984). Scales, norms, and equivalent scores. Princeton, N.J.: Educational Testing Service.
Bryk, A. S., & Raudenbush, S. W. (1987). Application of hierarchical linear models to assessing change.
Psychological Bulletin, 101, 147-158.
Bryk, A. S., Thum, Y. M., Easton, J. Q., & Luppescu, S. (1998). Assessing school academic productivity:
The case of Chicago School Reform. Social Psychology of Education, 2, 103-142.
Bryk, A. S., & Weisberg, H. I. (1976). Value-added analysis: A dynamic approach to the estimation of
treatment effects. Journal of Educational and Behavioral Statistics, 1, 127-155.
Betebenner, D. W. (2008). Toward a normative understanding of student growth. In K. E. Ryan & L. A.
Sheppard (Eds.), The Future of Test-based Educational Accountability (pp. 155-170). New York:
Taylor & Francis.
Braun, H. I. (1988). A new approach to avoiding problems of scale in interpreting trends in mental mea-
surement data. Journal of Educational Measurement, 25 (3), 171-191.
Cronbach, L. J., & Furby, L. (1970). How should we measure ’change’-or should we? Psychological
Bulletin, 74, 68-80.
Good, T. L., Biddle, B. J., & Brody, J. E. (1975). Teachers make a difference. Lanham, MD: University
Press of America.
Harris, C.W. 1963. Problems in the measurement of change. Madison: University of Wisconsin Press.
Harris, D. J. (2007). Practical Issues in vertical scaling. In N. J. Dorans, M. Pommerich, & P. W. Holland,
(Eds.), Linking and aligning scores and scales (pp. 233-251). New York, NY: Springer.
Harvill, L. M. (1991). Standard error of measurement. Educational Measurement: Issues and Practice,
10, 33–41.
Hedges, L. V., & Hedberg, E. C. (2007). Intraclass correlations for planning group-randomized experi-
ments in education. Educational Evaluation and Policy Analysis, 29, 60-87.
Hedges, L. V., & Hedberg, E. C. (2013). Intraclass Correlations and Covariate Outcome Correlations for
Planning Two- and Three-Level Cluster-Randomized Experiments in Education. Evaluation Review,
37 (6) 445-489.
49

Hill, C. J., Bloom, H. S., Black, A. R., & Lipsey, M. W. (2008). Empirical benchmarks for interpreting effect
sizes in research. Child Development Perspectives, 2, 172-177.
Holt, D., & Smith, T. M. F. (1979). Post-stratification. Journal of the Royal Statistical Society, Series A
(General), 142, 1, 33-46.
King, G. (1997). A Solution to the Ecological Inference Problem: Reconstructing Individual Behavior from
Aggregate Data. Princeton, NJ: Princeton University Press.
Kingsbury G. G. & Hauser, C. (2004, April). Computerized adaptive testing and No Child Left Behind.
Paper presented at the annual meeting of the American Educational Research Association, San
Diego, CA.
Kolen, M. J. (2006). Scaling and norming. In R. L. Brennan (Ed.), Educational measurement (4th ed., pp.
155-186). Westport, CT: Praeger.
Linn, R. L., & J. A. Slinde, J. A. (1977). The determination of the significance of change between pre- and
post-periods. Review of Educational Research, 47, 121-50.
Mahalanobis, P C (1936). On the generalised distance in statistics. Proceedings of the National Institute
of Sciences of India, 2 (1): 49-55. Retrieved 2008-11-05.
Mellenbergh, G. J. (1999). A note on simple gain score precision. Applied Psychological Measurement,
23, 87-89.
Newey, W. K., & McFadden, D. (1994). Large Sample Estimation And Hypothesis Testing. In R.F. Engle &
D.L. McFadden (Eds.), Handbook of Econometrics, Volume IV, (pp. 2113-2245), Amsterdam, The
Netherlands: Elsevier B. V.
Northwest Evaluation Association. (2011a). RIT Scale Norms Study: For Use with Measures of Academic
Progress (MAP R©) and MAP R© for Primary Grades. Portland, OR: Author.
Northwest Evaluation Association. (2011b). Technical manual: For Measures of Academic Progress
(MAP) and Measures of Academic Progress for Primary Grades (MPG). Portland, OR: Author.
Owen, R. J. (1975). A Bayesian sequential procedure for quantal response in the context of adaptive
testing. Journal of the American Statistical Association, 70, 229-244.
Pike, G. R. (2007). Adjusting for nonresponse in surveys. In J. C. Smart (Ed.), Higher Education: Hand-
book of Theory and Research (Vol. XXII, pp. 411-449). Dordrecht, The Netherlands: Springer.
Pindyck, R., & Rubinfeld, D. (1981). Econometric models and economic forecasts. New York: McGraw-Hill
Book Co.
Raudenbush, S. W. (2001). Toward a coherent framework for comparing trajectories of individual change.
Collins, L., & Sayer, A. (Eds.), Best Methods for Studying Change (pp. 33-64). Washington, DC:
The American Psychological Association.
Raudenbush, S. W., & Bryk, A. S. (1985). Empirical Bayes meta-analysis. Journal of Educational Statis-
tics, 10, 75-98.
Raudenbush, S. W., & Bryk, A. S. (2002). Hierarchical linear models: Applications and data analysis
methods (2nd ed.). Thousand Oaks, CA: Sage.
50

Raudenbush S. W., Bryk A. S., Cheong Y. F., Congdon R. T., du Toit, M. (2011). HLM 7: Hierarchical
linear and nonlinear modeling. Chicago, IL: Scientific Software International.
Raudenbush, S. W., & Willms, J. D. (1995). The estimation of school effects. Journal of Educational and
Behavioral Statistics, 20, 307U335.
Robinson, W. S. (1950) Ecological correlations and the behavior of individuals. American Sociological
Review, 15, 351-357.
Rogosa, D. R. (1995). Myths and methods: Myths about longitudinal research plus supplemental ques-
tions. In J. M. Gottman (Ed.), The Analysis of Change, (pp. 3-66). Mahwah, NJ: Lawrence Erlbaum.
Rogosa, D. R., Brandt, D., & Zimowski, M. (1982). A growth curve approach to the measurement of
change. Psychological Bulletin, 90, 726-48.
Sable, J., & Plotts, C. (2010). Documentation to the NCES Common Core of Data Public Elemen-
tary/Secondary School Universe Survey: School Year 2008-09 (NCES 2010-350 rev). U.S. Depart-
ment of Education. Washington, DC: National Center for Education Statistics. Retrieved November
16, 2010 from http://nces.ed.gov/pubsearch/pubs.info.asp?pubid=2010350.
Seltzer, M., Choi, K., & Thum. Y. M. (2003). Examining relationships between where students start and
how rapidly they progress. Using new developments in growth modeling to gain insight into the
distribution of achievement within schools. Educational Evaluation & Policy Analysis, 25, 263-286.
State of California, Department of Education.Construction of California’s 1999 school characteristics index
and similar schools ranks. PSAA Technical Report 00-1, April 2000, Office of Policy and Evaluation.
Retrieved May 2011 from http://www.cde.ca.gov/ta/ac/ap/documents/tdgreport0400.pdf.
Thorndike, R. L. (1971, Ed.). Educational measurement (2nd ed.). Washington, D.C.: American Council
on Education.
Thum, Y. M. (2003). Measuring progress towards a goal: Estimating teacher productivity using a multivari-
ate multilevel model for value-added analysis. Sociological Methods & Research, 32, 2, 153-207.
Thum, Y. M. (2006). Designing Gross Productivity Indicators: A proposal for Connecting Accountability
Goals, Data, and Analysis. In R. Lissitz (Ed.), Longitudinal and Value-Added Models of Student
Performance. (pp. 436 - 479). Maple Grove, MN: JAM Press.
Thum, Y. M. (2015). The Effective Use of Student and School Descriptive Indicators of Learning Progress:
From the Conditional Growth Index to the Learning Productivity Measurement System. In R. Lissitz
& H. Jiao (Eds.) Value Added Modeling and Growth Modeling with Particular Application to Teacher
and School Effectiveness. (pp. 237-269). Charlotte, NC: IAP.
Thum, Y. M., & Matta, T. (2015). Fitting Curves to Data Series with Seasonality using the Additive Polyno-
mial (AP) Growth Model. Manuscript in preparation.
Thum, Y. M., & Xiang, Y. (2010). Representing the learning productivity of students at a school with an
effect-size Indicator in a pay-for-performance application. Unpublished manuscript: NWEA.
Willett, J. B. (1988). Questions and answers in the measurement of change. Review of Research in
Education, 15, 345-422.
Williams, R. H., & Zimmerman, D. W. (1996). Are gain scores obsolete? Applied Psychological Measure-
ment, 20, 59-69.
51

Yen, W. M. (2007). Vertical scaling and No Child Left Behind. In N. J. Dorans, M. Pommerich, & P. W.
Holland, (Eds.), Linking and aligning scores and scales (pp. 273–282). New York, NY: Springer
52

Appendices
Important notes about these Appendices:
• The model employed to compute the norms incorporated instructional time as a continuous variable,
specifically, as instructional weeks. This allows status and growth norms to be estimated for any
number of instructional weeks preceding a test occasion or for any number of instructional weeks
separating test occasions. The simultaneous consideration of starting RIT score and instructional
weeks in computing growth norms suggests that a comprehensive presentation of norms can only
be accomplished using a smoothed regression surface. While this would allow very fine grained
estimates for norms for virtually any combination of starting RIT and instructional weeks, it would
not necessarily be practical for typical, everyday use.
Even though instructional weeks affords greater precision, traditional testing “terms” or “seasons” are
more commonly used in schools to refer to status and growth. For this reason, the tables presented
in these appendices use terms to represent the time dimension of norms. These terms have been
fixed to the number of instructional weeks that we have most commonly encountered for each term.
These values are fall = 4, winter = 20, and spring = 32. These values assume a 36 instructional week
school year. Therefore, in the tables that present term-to-term growth over a full instructional year
(e.g., Last Spring-to-Spring or Fall-to-Next Fall), the two terms are separated by 36 instructional
weeks. Similarly, Fall-to-Winter growth, Winter-to-Spring growth, and Fall-to-Spring entail growth
spans of 16, 12, and 28 instructional weeks, respectively. To the extent that actual spans between
testing occasions deviate more than three weeks from these spans, inferences about the results
should be drawn cautiously.
• Appendices D and E adopt a convention for reporting growth norms that is conditional on starting
RIT scores. Starting RIT scores are reported as a distribution employing a constant set of 18 per-
centile ranks. The percentiles were selected to detect smaller changes around the center of the
distribution relative to those toward the tails. The tables in Appendix E employ a similar convention
for Conditional Growth Percentiles. When using tables from either of these appendices, it is likely
that the exact values of interest will not appear in a table. In these cases, it will be necessary to use
some combination of rounding and interpolation. The NWEA reporting system should be employed
when exact values are required.
53

Appendix A - School and Student Status Norms
This appendix provides the status norms for each content area by grade and term. Table A.1 reports
norms for mathematics and reading; Table A.2 reports norms for language usage and general science.
Within each grade by content area cell cluster, the mean, and standard deviations for schools and for
students for are presented for each term. It should be noted that the means in each cell cluster are the
means for both schools and students. The set of three Ns in the last row of the cell cluster represent,
respectively, the number of schools, the number of students, and the number of scores employed in the
cluster. These Ns are only associated with the cell cluster; they have no relationship to the term headings.
54

Table A.1: Mathematics and Reading Achievement Status Norms
Mathematics Reading
Grade Statistic Fall Winter Spring Fall Winter Spring
K Mean 136.46 150.21 158.70 137.53 149.94 157.62School SD 15.50 8.97 6.86 13.47 7.69 6.12
Student SD 19.11 14.73 14.21 16.78 13.20 13.27Ns∗ 1428, 122364, 407381 1426, 120735, 388475
1 Mean 162.42 173.85 180.81 160.70 171.53 177.52School SD 5.73 5.89 6.32 5.82 6.17 6.67
Student SD 12.87 12.96 13.63 13.08 13.54 14.54Ns 1425, 132062, 511133 1437, 131136, 500918
2 Mean 176.90 186.39 192.11 174.72 184.17 188.69School SD 5.83 5.98 6.33 6.40 6.49 6.75
Student SD 13.22 13.11 13.54 15.52 14.98 15.21Ns 1453, 133623, 545946 1454, 128742, 530438
3 Mean 190.40 198.21 203.40 188.29 195.60 198.62School SD 5.88 6.12 6.46 6.70 6.59 6.63
Student SD 13.10 13.29 13.81 15.85 15.14 15.10Ns 1456, 135458, 609075 1457, 134519, 606602
4 Mean 201.94 208.71 213.49 198.16 203.60 205.92School SD 6.11 6.55 7.03 6.49 6.43 6.48
Student SD 13.76 14.27 14.97 15.53 14.96 14.92Ns 1443, 130077, 592305 1456, 134361, 615399
5 Mean 211.44 217.23 221.36 205.68 209.83 211.79School SD 7.00 7.57 8.16 6.27 6.23 6.31
Student SD 14.68 15.33 16.18 15.13 14.65 14.72Ns 1440, 148818, 518378 1448, 148564, 526716
6 Mean 217.62 222.06 225.32 210.99 214.21 215.75School SD 7.19 7.61 8.05 6.31 6.31 6.44
Student SD 15.53 16.00 16.71 14.94 14.53 14.66Ns 1451, 165541, 546568 1452, 162887, 554445
7 Mean 222.65 226.12 228.59 214.45 216.91 218.16School SD 7.71 8.06 8.43 6.57 6.57 6.69
Student SD 16.59 17.07 17.72 15.31 14.98 15.14Ns 1415, 190705, 781050 1418, 194033, 814818
8 Mean 226.30 229.15 230.93 217.24 219.09 220.07School SD 8.80 9.21 9.62 7.47 7.39 7.48
Student SD 17.85 18.31 19.11 15.72 15.37 15.73Ns 1377, 199759, 619604 1396, 206667, 664327
9 Mean 230.27 232.24 233.41 220.22 221.27 221.87School SD 9.14 9.60 10.05 7.13 7.20 7.42
Student SD 18.13 18.62 19.52 15.68 15.54 16.21Ns 1410, 202531, 495519 1422, 212539, 532620
10 Mean 230.06 231.52 232.37 220.44 221.01 221.18School SD 10.06 10.36 10.73 8.19 8.17 8.37
Student SD 19.60 20.01 20.96 16.85 16.70 17.48Ns 1365, 194965, 570206 1362, 205057, 593409
11 Mean 233.28 234.35 234.97 222.64 222.69 222.33School SD 10.27 10.54 10.88 7.68 7.67 7.92
Student SD 19.95 20.18 21.30 16.75 16.53 17.68Ns 1334, 158637, 378738 1330, 163513, 387304
∗ Ns indicates the number of schools, students, and scores employed.
55

Table A.2: Language Usage and General Science Achievement Status Norms
Language Usage General Science
Grade Statistic Fall Winter Spring Fall Winter Spring
2 Mean 174.51 184.94 189.68School SD 6.63 6.63 6.84
Student SD 16.58 15.34 15.47Ns∗ 1424, 110316, 332421
3 Mean 189.41 196.83 199.98 187.47 192.56 195.43School SD 6.29 6.16 6.23 5.44 5.30 5.37
Student SD 15.20 14.24 14.11 11.74 10.92 11.01Ns 1440, 120298, 457225 1391, 101250, 284799
4 Mean 198.83 204.41 206.69 194.58 198.73 201.00School SD 6.04 5.91 5.92 5.11 5.16 5.33
Student SD 14.66 13.83 13.64 11.16 10.75 10.92Ns 1438, 119456, 459160 1394, 107737, 325387
5 Mean 205.63 209.70 211.47 200.23 203.69 205.72School SD 5.60 5.55 5.63 5.10 5.14 5.32
Student SD 13.87 13.23 13.19 11.06 10.80 11.07Ns 1443, 132713, 421493 1400, 123779, 332065
6 Mean 210.73 213.94 215.26 204.31 207.06 208.65School SD 5.82 5.81 5.92 5.41 5.51 5.68
Student SD 13.79 13.30 13.38 11.54 11.40 11.73Ns 1457, 139078, 426104 1409, 144320, 410837
7 Mean 214.02 216.51 217.61 207.18 209.47 210.86School SD 5.84 5.88 6.04 5.30 5.43 5.60
Student SD 13.82 13.52 13.70 11.92 11.87 12.23Ns 1417, 169914, 623601 1373, 151095, 495433
8 Mean 216.17 218.08 219.04 210.29 212.28 213.53School SD 6.54 6.66 6.86 5.78 5.80 5.92
Student SD 14.17 13.92 14.26 12.28 12.19 12.63Ns 1368, 168791, 489891 1354, 148311, 398956
9 Mean 218.37 219.73 220.38School SD 6.73 6.80 6.99
Student SD 14.15 13.98 14.50Ns 1415, 172147, 410410
10 Mean 218.93 219.72 220.15School SD 7.29 7.32 7.52
Student SD 15.04 14.99 15.74Ns 1328, 149431, 426111
11 Mean 221.51 222.11 222.15School SD 6.79 6.83 7.07
Student SD 14.96 14.85 15.80Ns 1362, 133212, 321777
∗ Ns indicates the number of schools, students, and scores employed.
56

Appendix B - Student and School Growth Norms
Tables in this appendix provide the grade level term-to-term growth norms for mathematics, reading,
language usage and general science, respectively. For each content area there are two multi-part tables.
The first table for a content area (Tables B.1 B.3, B.5, and B.7) provides student growth norms. The
second table (Tables B.2 B.4, B.6, and B.8) provides school growth norms. Both tables have an identical
layout. The first group of columns from the left, after Grade, provides the mean starting status and
standard deviation for the grade level in the starting term indicated (e.g., Last Winter, Last Spring, Fall).
The next group of columns to the right (the To Term columns), provides the mean growth and standard
deviation from the starting term to the indicated ending term. It should be noted that all the means (starting
status and growth) in the student table and the corresponding means in the school table are identical within
a content area; only the standard deviations differ.
To determine, for example, the normative fall-to-spring growth in mathematics for schools at the grade 3
level, we would see from looking at Table B.2, under the Fall column, that the mean starting status for
grade 3 was 190.40 with a standard deviation of 5.88. Moving from these cells in the same row, we will
find under the To Spring column, that the mean grade 3, fall-to-spring growth for schools was 12.99 with
a standard deviation of 2.20. If we were also interested in determining the corresponding information from
the student table, we would see the same mean growth (12.99) with a standard deviation nearly three
times larger (6.47).
57

Table B.1: Student Mathematics Growth Norms
Status Growth Growth Growth
Current Last Win to Winter
Grade Mean SD Mean SD
1 151.34 14.45 22.51 6.882 172.79 14.30 13.60 6.433 185.76 12.98 12.44 5.954 198.17 13.36 10.54 5.815 208.09 14.74 9.14 6.156 216.43 16.10 5.63 6.257 220.76 16.74 5.36 5.808 224.66 17.73 4.48 6.449 229.26 19.10 2.98 7.31
10 229.27 19.69 2.25 7.01
Current Last Spr to Spring
Grade Mean SD Mean SD
1 159.62 15.95 21.19 7.722 179.42 15.29 12.68 7.353 191.59 13.62 11.81 6.764 203.54 14.12 9.95 6.635 212.74 15.77 8.62 7.016 220.44 17.35 4.88 7.157 223.68 17.78 4.92 6.598 226.92 18.55 4.00 7.779 230.89 20.16 2.52 8.50
10 230.23 20.68 2.14 8.95
Current Fall To Winter To Spring To Next Fall
Grade Mean SD Mean SD Mean SD Mean SD
K 136.46 19.11 13.75 10.38 22.23 14.70 27.42 16.571 162.42 12.87 11.43 5.50 18.40 7.45 14.59 8.122 176.90 13.22 9.50 5.35 15.21 7.11 13.23 7.043 190.40 13.10 7.81 5.08 12.99 6.47 11.36 6.414 201.94 13.76 6.77 5.05 11.55 6.41 9.89 6.125 211.44 14.68 5.79 5.22 9.92 6.80 5.99 6.506 217.62 15.53 4.44 5.20 7.71 6.75 6.70 6.677 222.65 16.59 3.47 5.11 5.95 6.55 5.47 6.268 226.30 17.85 2.85 5.59 4.63 7.66 3.96 7.169 230.27 18.13 1.96 5.81 3.13 8.15 2.40 7.38
10 230.06 19.60 1.46 6.18 2.31 8.92 2.00 7.76
Current Winter to Spring
Grade Mean SD Mean SD
K 150.21 14.73 8.49 6.321 173.85 12.96 6.97 4.992 186.39 13.11 5.72 4.903 198.21 13.29 5.19 4.734 208.71 14.27 4.78 4.725 217.23 15.33 4.13 4.826 222.06 16.00 3.26 4.807 226.12 17.07 2.47 4.758 229.15 18.31 1.78 5.059 232.24 18.62 1.17 5.19
10 231.52 20.01 0.85 5.42∗ Ns indicates ...
58

Table B.2: School Mathematics Growth Norms
Status Growth Growth Growth
Current Last Win to Winter
Grade Mean SD Mean SD
1 151.34 6.80 22.51 3.022 172.79 6.59 13.60 2.513 185.76 5.81 12.44 2.094 198.17 6.00 10.54 1.905 208.09 7.12 9.14 2.136 216.43 7.44 5.63 2.017 220.76 7.90 5.36 1.808 224.66 8.78 4.48 1.989 229.26 9.64 2.98 2.4610 229.27 10.32 2.25 2.06
Current Last Spr to Spring
Grade Mean SD Mean SD
1 159.62 7.67 21.19 3.572 179.42 7.45 12.68 3.273 191.59 6.29 11.81 2.744 203.54 6.48 9.95 2.445 212.74 7.78 8.62 2.856 220.44 8.11 4.88 2.537 223.68 8.50 4.92 2.208 226.92 9.18 4.00 2.509 230.89 10.24 2.52 3.0010 230.23 10.72 2.14 2.72
Current Fall To Winter To Spring To Next Fall
Grade Mean SD Mean SD Mean SD Mean SD
K 136.46 15.50 13.75 7.99 22.23 12.03 27.42 13.821 162.42 5.73 11.43 1.71 18.40 2.99 14.59 3.372 176.90 5.83 9.50 1.52 15.21 2.66 13.23 2.403 190.40 5.88 7.81 1.26 12.99 2.20 11.36 2.034 201.94 6.11 6.77 1.30 11.55 2.27 9.89 1.825 211.44 7.00 5.79 1.54 9.92 2.70 5.99 2.136 217.62 7.19 4.44 1.33 7.71 2.33 6.70 2.027 222.65 7.71 3.47 1.22 5.95 2.13 5.47 1.958 226.30 8.80 2.85 1.26 4.63 2.20 3.96 2.029 230.27 9.14 1.96 1.36 3.13 2.38 2.40 2.3710 230.06 10.06 1.46 1.53 2.31 2.67 2.00 2.22
Current Winter to Spring
Grade Mean SD Mean SD
K 150.21 8.97 8.49 4.071 173.85 5.89 6.97 1.282 186.39 5.98 5.72 1.143 198.21 6.12 5.19 0.944 208.71 6.55 4.78 0.975 217.23 7.57 4.13 1.166 222.06 7.61 3.26 1.007 226.12 8.06 2.47 0.928 229.15 9.21 1.78 0.949 232.24 9.60 1.17 1.0210 231.52 10.36 0.85 1.15
∗ Ns indicates ...
59

Table B.3: Student Reading Growth Norms
Status Growth Growth Growth
Current Last Win to Winter
Grade Mean SD Mean SD
1 151.82 13.75 19.71 7.872 171.67 15.75 12.50 7.233 183.80 15.98 11.81 6.524 195.30 15.69 8.30 6.085 203.32 15.32 6.50 6.396 209.60 15.40 4.61 6.637 212.94 15.59 3.97 6.148 215.56 15.54 3.53 6.899 219.37 15.90 1.90 7.57
10 219.06 16.83 1.95 7.42
Current Last Spr to Spring
Grade Mean SD Mean SD
1 158.76 16.01 18.76 8.542 177.75 16.89 10.94 8.053 188.15 16.25 10.47 7.254 198.39 15.97 7.54 6.835 205.83 15.57 5.96 7.196 211.55 15.92 4.20 7.487 214.33 16.19 3.83 7.058 216.99 15.89 3.09 8.309 220.40 16.62 1.48 8.75
10 219.47 17.84 1.72 9.59
Current Fall To Winter To Spring To Next Fall
Grade Mean SD Mean SD Mean SD Mean SD
K 137.53 16.78 12.41 10.13 20.09 14.14 24.79 15.911 160.70 13.08 10.84 6.00 16.82 8.09 14.02 9.642 174.72 15.52 9.45 6.05 13.97 8.20 13.65 8.343 188.29 15.85 7.31 5.79 10.33 7.59 9.92 7.514 198.16 15.53 5.43 5.56 7.76 7.05 7.43 6.775 205.68 15.13 4.15 5.60 6.11 7.15 5.45 7.146 210.99 14.94 3.22 5.62 4.76 7.19 4.62 7.247 214.45 15.31 2.46 5.58 3.71 7.11 3.93 6.828 217.24 15.72 1.85 6.05 2.83 8.19 3.12 7.839 220.22 15.68 1.05 6.35 1.66 8.87 1.93 7.84
10 220.44 16.85 0.57 6.72 0.74 9.66 0.87 8.35
Current Winter to Spring
Grade Mean SD Mean SD
K 149.94 13.20 7.68 6.461 171.53 13.54 5.99 5.462 184.17 14.98 4.52 5.493 195.60 15.14 3.02 5.334 203.60 14.96 2.33 5.195 209.83 14.65 1.97 5.216 214.21 14.53 1.54 5.227 216.91 14.98 1.25 5.208 219.09 15.37 0.99 5.499 221.27 15.54 0.60 5.68
10 221.01 16.70 0.17 5.91∗ Ns indicates ...
60

Table B.4: School Reading Growth Norms
Status Growth Growth Growth
Current Last Win to Winter
Grade Mean SD Mean SD
1 151.82 6.56 19.71 2.682 171.67 6.72 12.50 2.073 183.80 6.65 11.81 1.634 195.30 6.59 8.30 1.385 203.32 6.50 6.50 1.396 209.60 6.50 4.61 1.737 212.94 6.82 3.97 1.548 215.56 7.31 3.53 1.769 219.37 7.27 1.90 2.1910 219.06 8.49 1.95 2.11
Current Last Spr to Spring
Grade Mean SD Mean SD
1 158.76 7.62 18.76 3.042 177.75 7.44 10.94 2.533 188.15 6.85 10.47 1.954 198.39 6.80 7.54 1.745 205.83 6.63 5.96 1.806 211.55 6.80 4.20 2.207 214.33 7.16 3.83 2.098 216.99 7.36 3.09 2.249 220.40 7.59 1.48 2.7510 219.47 8.84 1.72 2.94
Current Fall To Winter To Spring To Next Fall
Grade Mean SD Mean SD Mean SD Mean SD
K 137.53 13.47 12.41 7.28 20.09 10.97 24.79 12.621 160.70 5.82 10.84 1.59 16.82 2.79 14.02 3.582 174.72 6.40 9.45 1.43 13.97 2.50 13.65 2.433 188.29 6.70 7.31 1.17 10.33 2.05 9.92 2.054 198.16 6.49 5.43 0.96 7.76 1.68 7.43 1.565 205.68 6.27 4.15 1.02 6.11 1.78 5.45 1.596 210.99 6.31 3.22 1.10 4.76 1.92 4.62 1.847 214.45 6.57 2.46 1.05 3.71 1.83 3.93 1.678 217.24 7.47 1.85 1.29 2.83 2.25 3.12 1.999 220.22 7.13 1.05 1.33 1.66 2.32 1.93 2.1810 220.44 8.19 0.57 1.59 0.74 2.78 0.87 2.27
Current Winter to Spring
Grade Mean SD Mean SD
K 149.94 7.69 7.68 3.721 171.53 6.17 5.99 1.202 184.17 6.49 4.52 1.073 195.60 6.59 3.02 0.884 203.60 6.43 2.33 0.725 209.83 6.23 1.97 0.776 214.21 6.31 1.54 0.827 216.91 6.57 1.25 0.798 219.09 7.39 0.99 0.979 221.27 7.20 0.60 1.0010 221.01 8.17 0.17 1.19
∗ Ns indicates ...
61
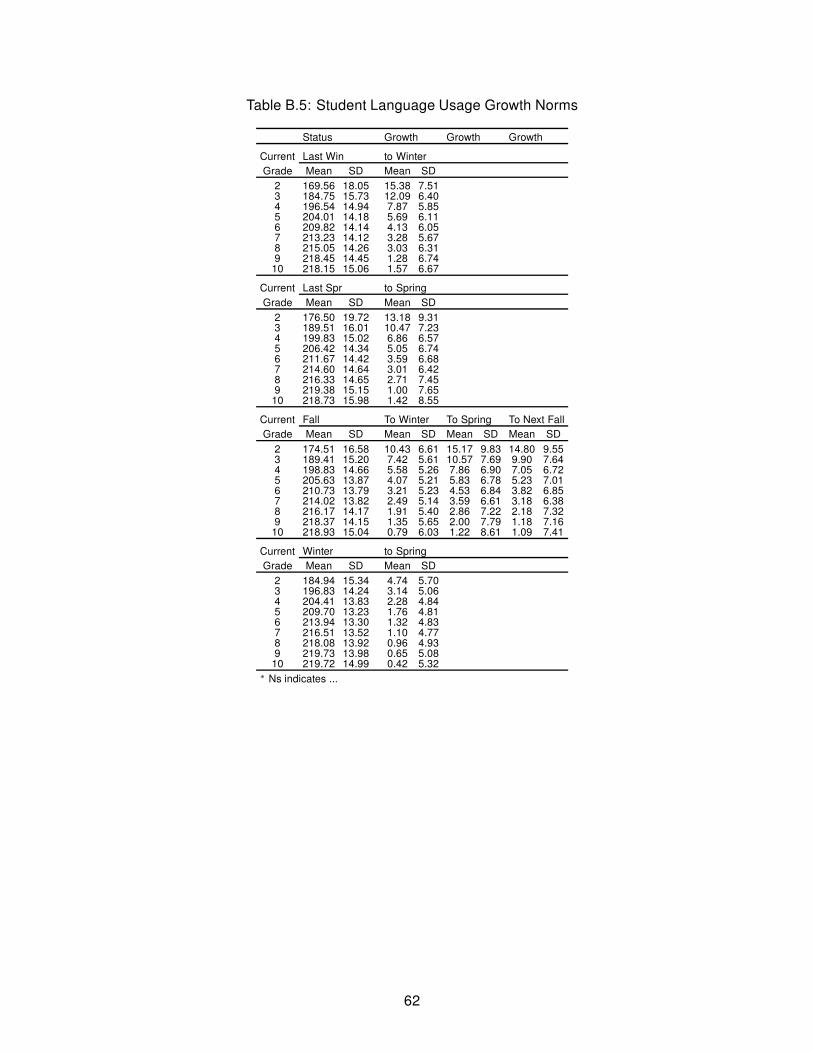
Table B.5: Student Language Usage Growth Norms
Status Growth Growth Growth
Current Last Win to Winter
Grade Mean SD Mean SD
2 169.56 18.05 15.38 7.513 184.75 15.73 12.09 6.404 196.54 14.94 7.87 5.855 204.01 14.18 5.69 6.116 209.82 14.14 4.13 6.057 213.23 14.12 3.28 5.678 215.05 14.26 3.03 6.319 218.45 14.45 1.28 6.7410 218.15 15.06 1.57 6.67
Current Last Spr to Spring
Grade Mean SD Mean SD
2 176.50 19.72 13.18 9.313 189.51 16.01 10.47 7.234 199.83 15.02 6.86 6.575 206.42 14.34 5.05 6.746 211.67 14.42 3.59 6.687 214.60 14.64 3.01 6.428 216.33 14.65 2.71 7.459 219.38 15.15 1.00 7.6510 218.73 15.98 1.42 8.55
Current Fall To Winter To Spring To Next Fall
Grade Mean SD Mean SD Mean SD Mean SD
2 174.51 16.58 10.43 6.61 15.17 9.83 14.80 9.553 189.41 15.20 7.42 5.61 10.57 7.69 9.90 7.644 198.83 14.66 5.58 5.26 7.86 6.90 7.05 6.725 205.63 13.87 4.07 5.21 5.83 6.78 5.23 7.016 210.73 13.79 3.21 5.23 4.53 6.84 3.82 6.857 214.02 13.82 2.49 5.14 3.59 6.61 3.18 6.388 216.17 14.17 1.91 5.40 2.86 7.22 2.18 7.329 218.37 14.15 1.35 5.65 2.00 7.79 1.18 7.1610 218.93 15.04 0.79 6.03 1.22 8.61 1.09 7.41
Current Winter to Spring
Grade Mean SD Mean SD
2 184.94 15.34 4.74 5.703 196.83 14.24 3.14 5.064 204.41 13.83 2.28 4.845 209.70 13.23 1.76 4.816 213.94 13.30 1.32 4.837 216.51 13.52 1.10 4.778 218.08 13.92 0.96 4.939 219.73 13.98 0.65 5.0810 219.72 14.99 0.42 5.32
∗ Ns indicates ...
62

Table B.6: School Language Usage Growth Norms
Status Growth Growth Growth
Current Last Win to Winter
Grade Mean SD Mean SD
2 169.56 7.42 15.38 2.643 184.75 6.48 12.09 1.714 196.54 6.21 7.87 1.515 204.01 5.84 5.69 1.686 209.82 5.85 4.13 1.657 213.23 6.08 3.28 1.488 215.05 6.51 3.03 1.679 218.45 6.84 1.28 1.92
10 218.15 7.45 1.57 1.94
Current Last Spr to Spring
Grade Mean SD Mean SD
2 176.50 8.07 13.18 3.223 189.51 6.78 10.47 2.294 199.83 6.33 6.86 1.975 206.42 6.02 5.05 2.066 211.67 6.01 3.59 1.947 214.60 6.50 3.01 1.848 216.33 6.70 2.71 2.149 219.38 7.24 1.00 2.29
10 218.73 7.70 1.42 2.54
Current Fall To Winter To Spring To Next Fall
Grade Mean SD Mean SD Mean SD Mean SD
2 174.51 6.63 10.43 1.49 15.17 2.61 14.80 2.573 189.41 6.29 7.42 1.29 10.57 2.26 9.90 1.984 198.83 6.04 5.58 1.02 7.86 1.79 7.05 1.635 205.63 5.60 4.07 0.98 5.83 1.71 5.23 1.836 210.73 5.82 3.21 1.04 4.53 1.82 3.82 1.797 214.02 5.84 2.49 1.07 3.59 1.88 3.18 1.768 216.17 6.54 1.91 1.09 2.86 1.90 2.18 1.839 218.37 6.73 1.35 1.25 2.00 2.18 1.18 2.04
10 218.93 7.29 0.79 1.44 1.22 2.52 1.09 1.88
Current Winter to Spring
Grade Mean SD Mean SD
2 184.94 6.63 4.74 1.123 196.83 6.16 3.14 0.974 204.41 5.91 2.28 0.775 209.70 5.55 1.76 0.746 213.94 5.81 1.32 0.787 216.51 5.88 1.10 0.818 218.08 6.66 0.96 0.829 219.73 6.80 0.65 0.94
10 219.72 7.32 0.42 1.08∗ Ns indicates ...
63
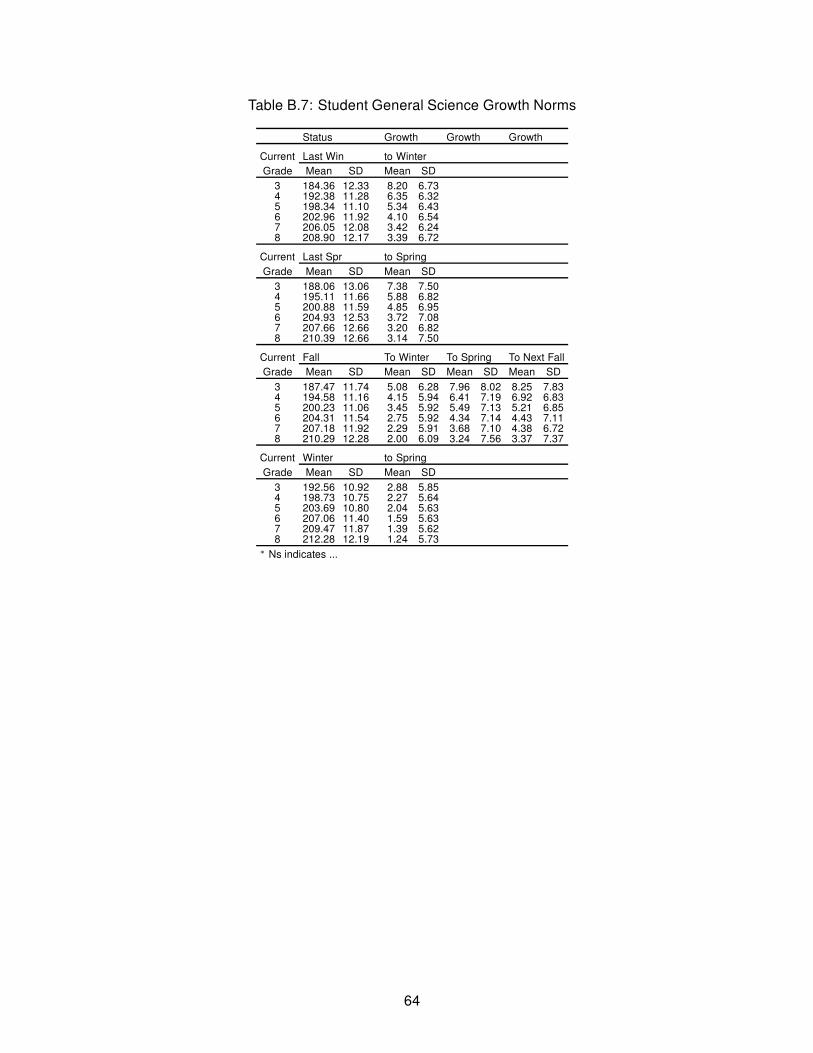
Table B.7: Student General Science Growth Norms
Status Growth Growth Growth
Current Last Win to Winter
Grade Mean SD Mean SD
3 184.36 12.33 8.20 6.734 192.38 11.28 6.35 6.325 198.34 11.10 5.34 6.436 202.96 11.92 4.10 6.547 206.05 12.08 3.42 6.248 208.90 12.17 3.39 6.72
Current Last Spr to Spring
Grade Mean SD Mean SD
3 188.06 13.06 7.38 7.504 195.11 11.66 5.88 6.825 200.88 11.59 4.85 6.956 204.93 12.53 3.72 7.087 207.66 12.66 3.20 6.828 210.39 12.66 3.14 7.50
Current Fall To Winter To Spring To Next Fall
Grade Mean SD Mean SD Mean SD Mean SD
3 187.47 11.74 5.08 6.28 7.96 8.02 8.25 7.834 194.58 11.16 4.15 5.94 6.41 7.19 6.92 6.835 200.23 11.06 3.45 5.92 5.49 7.13 5.21 6.856 204.31 11.54 2.75 5.92 4.34 7.14 4.43 7.117 207.18 11.92 2.29 5.91 3.68 7.10 4.38 6.728 210.29 12.28 2.00 6.09 3.24 7.56 3.37 7.37
Current Winter to Spring
Grade Mean SD Mean SD
3 192.56 10.92 2.88 5.854 198.73 10.75 2.27 5.645 203.69 10.80 2.04 5.636 207.06 11.40 1.59 5.637 209.47 11.87 1.39 5.628 212.28 12.19 1.24 5.73
∗ Ns indicates ...
64

Table B.8: School General Science Growth Norms
Status Growth Growth Growth
Current Last Win to Winter
Grade Mean SD Mean SD
3 184.36 5.53 8.20 1.834 192.38 5.15 6.35 1.675 198.34 5.05 5.34 1.396 202.96 5.51 4.10 1.587 206.05 5.41 3.42 1.398 208.90 5.62 3.39 1.41
Current Last Spr to Spring
Grade Mean SD Mean SD
3 188.06 5.86 7.38 2.344 195.11 5.40 5.88 2.185 200.88 5.33 4.85 1.916 204.93 5.74 3.72 1.827 207.66 5.53 3.20 1.678 210.39 5.66 3.14 1.83
Current Fall To Winter To Spring To Next Fall
Grade Mean SD Mean SD Mean SD Mean SD
3 187.47 5.44 5.08 1.24 7.96 2.16 8.25 1.964 194.58 5.11 4.15 1.07 6.41 1.87 6.92 1.615 200.23 5.10 3.45 1.07 5.49 1.87 5.21 1.496 204.31 5.41 2.75 0.91 4.34 1.58 4.43 1.787 207.18 5.30 2.29 0.79 3.68 1.39 4.38 1.488 210.29 5.78 2.00 0.99 3.24 1.72 3.37 1.51
Current Winter to Spring
Grade Mean SD Mean SD
3 192.56 5.30 2.88 0.934 198.73 5.16 2.27 0.805 203.69 5.14 2.04 0.806 207.06 5.51 1.59 0.687 209.47 5.43 1.39 0.608 212.28 5.80 1.24 0.74
∗ Ns indicates ...
65

Appendix C - Student and School Status Percentiles
Tables in this appendix provide percentile ranks for both student performance (Tables C.1.1 - C.1.12) and
school performance (Tables C.2.1 - C.2.12). In each set of tables, there is one table for each combina-
tion of content area (mathematics, reading, language usage, and general science) and term (fall, winter,
spring). As noted in the introduction to these appendices, the status estimates take into account the
number of instructional weeks preceding a test administration.
66

Appendix C.1 - Student Status Percentiles
Table C.1.1: Fall Mathematics Student Achievement Percentiles
Grade
Pct K 1 2 3 4 5 6 7 8 9 10 11 Pct
1 92 132 146 160 170 177 181 184 185 188 184 187 1
2 97 136 150 163 174 181 186 189 190 193 190 192 2
3 101 138 152 166 176 184 188 191 193 196 193 196 3
4 103 140 154 167 178 186 190 194 195 199 196 198 4
5 105 141 155 169 179 187 192 195 197 200 198 200 5
6 107 142 156 170 181 189 193 197 199 202 200 202 6
7 108 143 157 171 182 190 195 198 200 204 201 204 7
8 110 144 158 172 183 191 196 199 201 205 203 205 8
9 111 145 159 173 183 192 197 200 202 206 204 207 9
10 112 146 160 174 184 193 198 201 203 207 205 208 10
11 113 147 161 174 185 193 199 202 204 208 206 209 11
12 114 147 161 175 186 194 199 203 205 209 207 210 12
13 115 148 162 176 186 195 200 204 206 210 208 211 13
14 116 149 163 176 187 196 201 205 207 211 209 212 14
15 117 149 163 177 188 196 202 205 208 211 210 213 15
16 117 150 164 177 188 197 202 206 209 212 211 213 16
17 118 150 164 178 189 197 203 207 209 213 211 214 17
18 119 151 165 178 189 198 203 207 210 214 212 215 18
19 120 151 165 179 190 199 204 208 211 214 213 216 19
20 120 152 166 179 190 199 205 209 211 215 214 216 20
21 121 152 166 180 191 200 205 209 212 216 214 217 21
22 122 152 167 180 191 200 206 210 213 216 215 218 22
23 122 153 167 181 192 201 206 210 213 217 216 219 23
24 123 153 168 181 192 201 207 211 214 217 216 219 24
25 124 154 168 182 193 202 207 211 214 218 217 220 25
26 124 154 168 182 193 202 208 212 215 219 217 220 26
27 125 155 169 182 194 202 208 212 215 219 218 221 27
28 125 155 169 183 194 203 209 213 216 220 219 222 28
29 126 155 170 183 194 203 209 213 216 220 219 222 29
30 126 156 170 184 195 204 209 214 217 221 220 223 30
31 127 156 170 184 195 204 210 214 217 221 220 223 31
32 128 156 171 184 196 205 210 215 218 222 221 224 32
33 128 157 171 185 196 205 211 215 218 222 221 225 33
34 129 157 171 185 196 205 211 216 219 223 222 225 34
35 129 157 172 185 197 206 212 216 219 223 223 226 35
36 130 158 172 186 197 206 212 217 220 224 223 226 36
37 130 158 173 186 197 207 212 217 220 224 224 227 37
38 131 158 173 186 198 207 213 218 221 225 224 227 38
39 131 159 173 187 198 207 213 218 221 225 225 228 39
40 132 159 174 187 198 208 214 218 222 226 225 228 40
41 132 159 174 187 199 208 214 219 222 226 226 229 41
42 133 160 174 188 199 208 214 219 223 227 226 229 42
43 133 160 175 188 200 209 215 220 223 227 227 230 43
44 134 160 175 188 200 209 215 220 224 228 227 230 44
45 134 161 175 189 200 210 216 221 224 228 228 231 45
46 135 161 176 189 201 210 216 221 225 228 228 231 46
47 135 161 176 189 201 210 216 221 225 229 229 232 47
48 136 162 176 190 201 211 217 222 225 229 229 232 48
49 136 162 177 190 202 211 217 222 226 230 230 233 49
... continued on next page
67

Table C.1.1: Fall Mathematics Student Achievement Percentiles , continued
Pct K 1 2 3 4 5 6 7 8 9 10 11 Pct
50 136 162 177 190 202 211 218 223 226 230 230 233 50
51 137 163 177 191 202 212 218 223 227 231 231 234 51
52 137 163 178 191 203 212 218 223 227 231 231 234 52
53 138 163 178 191 203 213 219 224 228 232 232 235 53
54 138 164 178 192 203 213 219 224 228 232 232 235 54
55 139 164 179 192 204 213 220 225 229 233 233 236 55
56 139 164 179 192 204 214 220 225 229 233 233 236 56
57 140 165 179 193 204 214 220 226 229 233 234 237 57
58 140 165 180 193 205 214 221 226 230 234 234 237 58
59 141 165 180 193 205 215 221 226 230 234 235 238 59
60 141 166 180 194 205 215 222 227 231 235 235 238 60
61 142 166 181 194 206 216 222 227 231 235 236 239 61
62 142 166 181 194 206 216 222 228 232 236 236 239 62
63 143 167 181 195 207 216 223 228 232 236 237 240 63
64 143 167 182 195 207 217 223 229 233 237 237 240 64
65 144 167 182 195 207 217 224 229 233 237 238 241 65
66 144 168 182 196 208 217 224 229 234 238 238 242 66
67 145 168 183 196 208 218 224 230 234 238 239 242 67
68 145 168 183 197 208 218 225 230 235 239 239 243 68
69 146 169 183 197 209 219 225 231 235 239 240 243 69
70 146 169 184 197 209 219 226 231 236 240 240 244 70
71 147 170 184 198 210 220 226 232 236 240 241 244 71
72 148 170 185 198 210 220 227 232 237 241 241 245 72
73 148 170 185 198 210 220 227 233 237 241 242 246 73
74 149 171 185 199 211 221 228 233 238 242 243 246 74
75 149 171 186 199 211 221 228 234 238 243 243 247 75
76 150 172 186 200 212 222 229 234 239 243 244 247 76
77 151 172 187 200 212 222 229 235 239 244 245 248 77
78 151 172 187 201 213 223 230 235 240 244 245 249 78
79 152 173 188 201 213 223 230 236 241 245 246 249 79
80 153 173 188 201 214 224 231 237 241 246 247 250 80
81 153 174 189 202 214 224 231 237 242 246 247 251 81
82 154 174 189 202 215 225 232 238 243 247 248 252 82
83 155 175 190 203 215 225 232 238 243 248 249 252 83
84 155 175 190 203 216 226 233 239 244 248 250 253 84
85 156 176 191 204 216 227 234 240 245 249 250 254 85
86 157 176 191 205 217 227 234 241 246 250 251 255 86
87 158 177 192 205 217 228 235 241 246 251 252 256 87
88 159 178 192 206 218 229 236 242 247 252 253 257 88
89 160 178 193 206 219 229 237 243 248 253 254 258 89
90 161 179 194 207 220 230 238 244 249 254 255 259 90
91 162 180 195 208 220 231 238 245 250 255 256 260 91
92 163 180 195 209 221 232 239 246 251 256 258 261 92
93 165 181 196 210 222 233 241 247 253 257 259 263 93
94 166 182 197 211 223 234 242 248 254 258 261 264 94
95 168 184 199 212 225 236 243 250 256 260 262 266 95
96 170 185 200 213 226 237 245 252 258 262 264 268 96
97 172 187 202 215 228 239 247 254 260 264 267 271 97
98 176 189 204 217 230 242 250 257 263 268 270 274 98
99 181 192 208 221 234 246 254 261 268 272 276 280 99
68

Table C.1.2: Winter Mathematics Student Achievement Percentiles
Grade
Pct K 1 2 3 4 5 6 7 8 9 10 11 Pct
1 116 144 156 167 176 182 185 186 187 189 185 187 1
2 120 147 159 171 179 186 189 191 192 194 190 193 2
3 123 149 162 173 182 188 192 194 195 197 194 196 3
4 124 151 163 175 184 190 194 196 197 200 196 199 4
5 126 153 165 176 185 192 196 198 199 202 199 201 5
6 127 154 166 178 187 193 197 200 201 203 200 203 6
7 128 155 167 179 188 195 198 201 202 205 202 205 7
8 130 156 168 180 189 196 200 202 203 206 203 206 8
9 130 156 169 180 190 197 201 203 205 207 205 207 9
10 131 157 170 181 190 198 202 204 206 208 206 208 10
11 132 158 170 182 191 198 202 205 207 209 207 210 11
12 133 159 171 183 192 199 203 206 208 210 208 211 12
13 134 159 172 183 193 200 204 207 209 211 209 212 13
14 134 160 172 184 193 201 205 208 209 212 210 213 14
15 135 160 173 184 194 201 205 208 210 213 211 213 15
16 136 161 173 185 195 202 206 209 211 214 212 214 16
17 136 161 174 186 195 203 207 210 212 214 212 215 17
18 137 162 174 186 196 203 207 210 212 215 213 216 18
19 137 162 175 187 196 204 208 211 213 216 214 217 19
20 138 163 175 187 197 204 209 212 214 217 215 217 20
21 138 163 176 187 197 205 209 212 214 217 215 218 21
22 139 164 176 188 198 205 210 213 215 218 216 219 22
23 139 164 177 188 198 206 210 214 216 218 217 219 23
24 140 165 177 189 199 206 211 214 216 219 217 220 24
25 140 165 178 189 199 207 211 215 217 220 218 221 25
26 141 166 178 190 200 207 212 215 217 220 219 221 26
27 141 166 178 190 200 208 212 216 218 221 219 222 27
28 142 166 179 190 200 208 213 216 218 221 220 223 28
29 142 167 179 191 201 209 213 217 219 222 220 223 29
30 142 167 180 191 201 209 214 217 220 222 221 224 30
31 143 167 180 192 202 210 214 218 220 223 222 224 31
32 143 168 180 192 202 210 215 218 221 224 222 225 32
33 144 168 181 192 202 210 215 219 221 224 223 225 33
34 144 169 181 193 203 211 215 219 222 225 223 226 34
35 145 169 181 193 203 211 216 220 222 225 224 227 35
36 145 169 182 193 204 212 216 220 223 226 224 227 36
37 145 170 182 194 204 212 217 220 223 226 225 228 37
38 146 170 182 194 204 213 217 221 224 227 225 228 38
39 146 170 183 194 205 213 218 221 224 227 226 229 39
40 146 171 183 195 205 213 218 222 225 228 226 229 40
41 147 171 183 195 205 214 218 222 225 228 227 230 41
42 147 171 184 196 206 214 219 223 225 228 227 230 42
43 148 172 184 196 206 215 219 223 226 229 228 231 43
44 148 172 184 196 207 215 220 224 226 229 228 231 44
45 148 172 185 197 207 215 220 224 227 230 229 232 45
46 149 173 185 197 207 216 220 224 227 230 230 232 46
47 149 173 185 197 208 216 221 225 228 231 230 233 47
48 149 173 186 198 208 216 221 225 228 231 231 233 48
49 150 174 186 198 208 217 222 226 229 232 231 234 49
... continued on next page
69

Table C.1.2: Winter Mathematics Student Achievement Percentiles , continued
Pct K 1 2 3 4 5 6 7 8 9 10 11 Pct
50 150 174 186 198 209 217 222 226 229 232 232 234 50
51 151 174 187 199 209 218 222 227 230 233 232 235 51
52 151 174 187 199 209 218 223 227 230 233 233 235 52
53 151 175 187 199 210 218 223 227 231 234 233 236 53
54 152 175 188 200 210 219 224 228 231 234 234 236 54
55 152 175 188 200 211 219 224 228 231 235 234 237 55
56 152 176 188 200 211 220 224 229 232 235 235 237 56
57 153 176 189 201 211 220 225 229 232 236 235 238 57
58 153 176 189 201 212 220 225 230 233 236 236 238 58
59 154 177 189 201 212 221 226 230 233 236 236 239 59
60 154 177 190 202 212 221 226 230 234 237 237 239 60
61 154 177 190 202 213 222 227 231 234 237 237 240 61
62 155 178 190 202 213 222 227 231 235 238 238 241 62
63 155 178 191 203 213 222 227 232 235 238 238 241 63
64 155 178 191 203 214 223 228 232 236 239 239 242 64
65 156 179 191 203 214 223 228 233 236 239 239 242 65
66 156 179 192 204 215 224 229 233 237 240 240 243 66
67 157 180 192 204 215 224 229 234 237 240 240 243 67
68 157 180 193 204 215 224 230 234 238 241 241 244 68
69 158 180 193 205 216 225 230 235 238 241 241 244 69
70 158 181 193 205 216 225 230 235 239 242 242 245 70
71 158 181 194 206 217 226 231 236 239 243 243 246 71
72 159 181 194 206 217 226 231 236 240 243 243 246 72
73 159 182 194 206 217 227 232 237 240 244 244 247 73
74 160 182 195 207 218 227 232 237 241 244 244 247 74
75 160 183 195 207 218 228 233 238 241 245 245 248 75
76 161 183 196 208 219 228 233 238 242 245 246 249 76
77 161 183 196 208 219 229 234 239 243 246 246 249 77
78 162 184 197 208 220 229 234 239 243 247 247 250 78
79 162 184 197 209 220 230 235 240 244 247 248 251 79
80 163 185 197 209 221 230 236 240 245 248 248 251 80
81 163 185 198 210 221 231 236 241 245 249 249 252 81
82 164 186 198 210 222 231 237 242 246 249 250 253 82
83 164 186 199 211 222 232 237 242 247 250 251 254 83
84 165 187 199 211 223 232 238 243 247 251 251 254 84
85 165 187 200 212 223 233 239 244 248 252 252 255 85
86 166 188 201 213 224 234 239 245 249 252 253 256 86
87 167 188 201 213 225 234 240 245 250 253 254 257 87
88 168 189 202 214 225 235 241 246 251 254 255 258 88
89 168 190 202 215 226 236 242 247 252 255 256 259 89
90 169 190 203 215 227 237 243 248 253 256 257 260 90
91 170 191 204 216 228 238 244 249 254 257 258 261 91
92 171 192 205 217 229 239 245 250 255 258 260 263 92
93 172 193 206 218 230 240 246 251 256 260 261 264 93
94 173 194 207 219 231 241 247 253 258 261 263 266 94
95 174 195 208 220 232 242 248 254 259 263 264 268 95
96 176 197 209 221 234 244 250 256 261 265 267 270 96
97 178 198 211 223 236 246 252 258 264 267 269 272 97
98 180 200 213 226 238 249 255 261 267 270 273 276 98
99 184 204 217 229 242 253 259 266 272 276 278 281 99
70

Table C.1.3: Spring Mathematics Student Achievement Percentiles
Grade
Pct K 1 2 3 4 5 6 7 8 9 10 11 Pct
1 126 149 161 171 179 184 186 187 186 188 184 185 1
2 130 153 164 175 183 188 191 192 192 193 189 191 2
3 132 155 167 177 185 191 194 195 195 197 193 195 3
4 134 157 168 179 187 193 196 198 197 199 196 198 4
5 135 158 170 181 189 195 198 199 199 201 198 200 5
6 137 160 171 182 190 196 199 201 201 203 200 202 6
7 138 161 172 183 191 197 201 202 203 205 201 204 7
8 139 162 173 184 192 199 202 204 204 206 203 205 8
9 140 163 174 185 193 200 203 205 205 207 204 206 9
10 140 163 175 186 194 201 204 206 206 208 206 208 10
11 141 164 175 186 195 202 205 207 207 209 207 209 11
12 142 165 176 187 196 202 206 208 208 210 208 210 12
13 143 165 177 188 197 203 207 209 209 211 209 211 13
14 143 166 177 188 197 204 207 209 210 212 210 212 14
15 144 167 178 189 198 205 208 210 211 213 211 213 15
16 145 167 179 190 199 205 209 211 212 214 212 214 16
17 145 168 179 190 199 206 209 212 213 215 212 215 17
18 146 168 180 191 200 207 210 212 213 216 213 215 18
19 146 169 180 191 200 207 211 213 214 216 214 216 19
20 147 169 181 192 201 208 211 214 215 217 215 217 20
21 147 170 181 192 201 208 212 214 216 218 215 218 21
22 148 170 182 193 202 209 212 215 216 218 216 219 22
23 148 171 182 193 202 209 213 216 217 219 217 219 23
24 149 171 183 194 203 210 214 216 217 220 218 220 24
25 149 172 183 194 203 210 214 217 218 220 218 221 25
26 150 172 183 195 204 211 215 217 219 221 219 221 26
27 150 172 184 195 204 211 215 218 219 221 220 222 27
28 150 173 184 195 205 212 216 218 220 222 220 223 28
29 151 173 185 196 205 212 216 219 220 223 221 223 29
30 151 174 185 196 206 213 217 219 221 223 221 224 30
31 152 174 185 197 206 213 217 220 221 224 222 224 31
32 152 174 186 197 206 214 218 220 222 224 223 225 32
33 152 175 186 197 207 214 218 221 223 225 223 226 33
34 153 175 187 198 207 215 218 221 223 225 224 226 34
35 153 176 187 198 208 215 219 222 224 226 224 227 35
36 154 176 187 198 208 216 219 222 224 226 225 227 36
37 154 176 188 199 209 216 220 223 225 227 225 228 37
38 154 177 188 199 209 216 220 223 225 227 226 228 38
39 155 177 188 200 209 217 221 224 226 228 227 229 39
40 155 177 189 200 210 217 221 224 226 228 227 230 40
41 155 178 189 200 210 218 222 225 227 229 228 230 41
42 156 178 189 201 210 218 222 225 227 229 228 231 42
43 156 178 190 201 211 219 222 225 228 230 229 231 43
44 157 179 190 201 211 219 223 226 228 230 229 232 44
45 157 179 190 202 212 219 223 226 229 231 230 232 45
46 157 179 191 202 212 220 224 227 229 231 230 233 46
47 158 180 191 202 212 220 224 227 229 232 231 233 47
48 158 180 191 203 213 221 224 228 230 232 231 234 48
49 158 180 192 203 213 221 225 228 230 233 232 234 49
... continued on next page
71

Table C.1.3: Spring Mathematics Student Achievement Percentiles , continued
Pct K 1 2 3 4 5 6 7 8 9 10 11 Pct
50 159 181 192 203 213 221 225 229 231 233 232 235 50
51 159 181 192 204 214 222 226 229 231 234 233 236 51
52 159 181 193 204 214 222 226 229 232 234 233 236 52
53 160 182 193 204 215 223 227 230 232 235 234 237 53
54 160 182 193 205 215 223 227 230 233 235 234 237 54
55 160 183 194 205 215 223 227 231 233 236 235 238 55
56 161 183 194 205 216 224 228 231 234 236 236 238 56
57 161 183 194 206 216 224 228 232 234 237 236 239 57
58 162 184 195 206 217 225 229 232 235 237 237 239 58
59 162 184 195 207 217 225 229 233 235 238 237 240 59
60 162 184 196 207 217 225 230 233 236 238 238 240 60
61 163 185 196 207 218 226 230 234 236 239 238 241 61
62 163 185 196 208 218 226 230 234 237 239 239 241 62
63 163 185 197 208 218 227 231 234 237 240 239 242 63
64 164 186 197 208 219 227 231 235 238 240 240 243 64
65 164 186 197 209 219 228 232 235 238 241 240 243 65
66 165 186 198 209 220 228 232 236 239 241 241 244 66
67 165 187 198 209 220 228 233 236 239 242 242 244 67
68 165 187 198 210 220 229 233 237 240 243 242 245 68
69 166 188 199 210 221 229 234 237 240 243 243 246 69
70 166 188 199 211 221 230 234 238 241 244 243 246 70
71 167 188 200 211 222 230 235 238 242 244 244 247 71
72 167 189 200 211 222 231 235 239 242 245 245 247 72
73 167 189 200 212 223 231 236 239 243 245 245 248 73
74 168 190 201 212 223 232 236 240 243 246 246 249 74
75 168 190 201 213 224 232 237 241 244 247 246 249 75
76 169 190 202 213 224 233 237 241 244 247 247 250 76
77 169 191 202 214 225 233 238 242 245 248 248 251 77
78 170 191 203 214 225 234 238 242 246 248 249 251 78
79 170 192 203 215 226 234 239 243 246 249 249 252 79
80 171 192 204 215 226 235 239 244 247 250 250 253 80
81 171 193 204 216 227 236 240 244 248 251 251 254 81
82 172 193 205 216 227 236 241 245 248 251 252 254 82
83 172 194 205 217 228 237 241 245 249 252 252 255 83
84 173 194 206 217 228 237 242 246 250 253 253 256 84
85 173 195 206 218 229 238 243 247 251 254 254 257 85
86 174 196 207 218 230 239 243 248 252 254 255 258 86
87 175 196 207 219 230 240 244 249 252 255 256 259 87
88 175 197 208 220 231 240 245 249 253 256 257 260 88
89 176 198 209 220 232 241 246 250 254 257 258 261 89
90 177 198 209 221 233 242 247 251 255 258 259 262 90
91 178 199 210 222 234 243 248 252 257 260 260 264 91
92 179 200 211 223 235 244 249 253 258 261 262 265 92
93 180 201 212 224 236 245 250 255 259 262 263 266 93
94 181 202 213 225 237 247 251 256 261 264 265 268 94
95 182 203 214 226 238 248 253 258 262 266 267 270 95
96 184 205 216 228 240 250 255 260 264 268 269 272 96
97 185 206 218 229 242 252 257 262 267 270 272 275 97
98 188 209 220 232 244 255 260 265 270 273 275 279 98
99 192 213 224 236 248 259 264 270 275 279 281 285 99
72

Table C.1.4: Fall Reading Student Achievement Percentiles
Grade
Pct K 1 2 3 4 5 6 7 8 9 10 11 Pct
1 98 130 139 151 162 170 176 179 181 184 181 184 1
2 103 134 143 156 166 175 180 183 185 188 186 188 2
3 106 136 146 158 169 177 183 186 188 191 189 191 3
4 108 138 148 161 171 179 185 188 190 193 191 193 4
5 110 139 149 162 173 181 186 189 191 194 193 195 5
6 111 140 151 164 174 182 188 191 193 196 194 197 6
7 113 141 152 165 175 183 189 192 194 197 196 198 7
8 114 142 153 166 176 184 190 193 195 198 197 199 8
9 115 143 154 167 177 185 191 194 196 199 198 200 9
10 116 144 155 168 178 186 192 195 197 200 199 201 10
11 117 145 156 169 179 187 193 196 198 201 200 202 11
12 118 145 156 170 180 188 193 196 199 202 201 203 12
13 119 146 157 170 181 189 194 197 200 203 201 204 13
14 119 147 158 171 181 189 195 198 200 203 202 205 14
15 120 147 159 172 182 190 196 199 201 204 203 205 15
16 121 148 159 173 183 191 196 199 202 205 204 206 16
17 122 148 160 173 183 191 197 200 202 205 204 207 17
18 122 149 161 174 184 192 197 200 203 206 205 207 18
19 123 149 161 174 185 192 198 201 203 206 206 208 19
20 123 150 162 175 185 193 198 202 204 207 206 209 20
21 124 150 162 176 186 193 199 202 205 208 207 209 21
22 125 151 163 176 186 194 199 203 205 208 207 210 22
23 125 151 163 177 187 194 200 203 206 209 208 210 23
24 126 151 164 177 187 195 200 204 206 209 209 211 24
25 126 152 164 178 188 195 201 204 207 210 209 211 25
26 127 152 165 178 188 196 201 205 207 210 210 212 26
27 127 153 165 179 189 196 202 205 208 211 210 212 27
28 128 153 166 179 189 197 202 206 208 211 211 213 28
29 128 153 166 180 190 197 203 206 209 212 211 213 29
30 129 154 167 180 190 198 203 206 209 212 212 214 30
31 129 154 167 180 190 198 204 207 209 212 212 214 31
32 130 155 167 181 191 199 204 207 210 213 213 215 32
33 130 155 168 181 191 199 204 208 210 213 213 215 33
34 131 155 168 182 192 199 205 208 211 214 213 216 34
35 131 156 169 182 192 200 205 209 211 214 214 216 35
36 132 156 169 183 193 200 206 209 212 215 214 217 36
37 132 156 170 183 193 201 206 209 212 215 215 217 37
38 132 157 170 183 193 201 206 210 212 215 215 218 38
39 133 157 170 184 194 201 207 210 213 216 216 218 39
40 133 157 171 184 194 202 207 211 213 216 216 218 40
41 134 158 171 185 195 202 208 211 214 217 217 219 41
42 134 158 172 185 195 203 208 211 214 217 217 219 42
43 135 158 172 185 195 203 208 212 214 217 217 220 43
44 135 159 172 186 196 203 209 212 215 218 218 220 44
45 135 159 173 186 196 204 209 213 215 218 218 221 45
46 136 159 173 187 197 204 209 213 216 219 219 221 46
47 136 160 174 187 197 205 210 213 216 219 219 221 47
48 137 160 174 187 197 205 210 214 216 219 220 222 48
49 137 160 174 188 198 205 211 214 217 220 220 222 49
... continued on next page
73

Table C.1.4: Fall Reading Student Achievement Percentiles , continued
Pct K 1 2 3 4 5 6 7 8 9 10 11 Pct
50 138 161 175 188 198 206 211 214 217 220 220 223 50
51 138 161 175 189 199 206 211 215 218 221 221 223 51
52 138 161 175 189 199 206 212 215 218 221 221 223 52
53 139 162 176 189 199 207 212 216 218 221 222 224 53
54 139 162 176 190 200 207 212 216 219 222 222 224 54
55 140 162 177 190 200 208 213 216 219 222 223 225 55
56 140 163 177 191 201 208 213 217 220 223 223 225 56
57 140 163 177 191 201 208 214 217 220 223 223 226 57
58 141 163 178 191 201 209 214 218 220 223 224 226 58
59 141 164 178 192 202 209 214 218 221 224 224 226 59
60 142 164 179 192 202 210 215 218 221 224 225 227 60
61 142 164 179 193 203 210 215 219 222 225 225 227 61
62 143 165 179 193 203 210 216 219 222 225 226 228 62
63 143 165 180 194 203 211 216 220 222 225 226 228 63
64 144 165 180 194 204 211 216 220 223 226 226 229 64
65 144 166 181 194 204 212 217 220 223 226 227 229 65
66 144 166 181 195 205 212 217 221 224 227 227 230 66
67 145 166 182 195 205 212 218 221 224 227 228 230 67
68 145 167 182 196 205 213 218 222 225 228 228 230 68
69 146 167 182 196 206 213 218 222 225 228 229 231 69
70 146 168 183 197 206 214 219 222 225 228 229 231 70
71 147 168 183 197 207 214 219 223 226 229 230 232 71
72 147 168 184 198 207 214 220 223 226 229 230 232 72
73 148 169 184 198 208 215 220 224 227 230 231 233 73
74 148 169 185 198 208 215 221 224 227 230 231 233 74
75 149 170 185 199 209 216 221 225 228 231 232 234 75
76 149 170 186 199 209 216 222 225 228 231 232 234 76
77 150 170 186 200 210 217 222 226 229 232 233 235 77
78 150 171 187 201 210 217 223 226 229 232 233 236 78
79 151 171 187 201 211 218 223 227 230 233 234 236 79
80 152 172 188 202 211 218 224 227 230 233 235 237 80
81 152 172 188 202 212 219 224 228 231 234 235 237 81
82 153 173 189 203 212 220 225 228 232 235 236 238 82
83 154 173 190 203 213 220 225 229 232 235 237 239 83
84 154 174 190 204 214 221 226 230 233 236 237 239 84
85 155 174 191 205 214 221 226 230 234 236 238 240 85
86 156 175 191 205 215 222 227 231 234 237 239 241 86
87 156 175 192 206 216 223 228 232 235 238 239 241 87
88 157 176 193 207 216 223 229 232 236 239 240 242 88
89 158 177 194 208 217 224 229 233 237 239 241 243 89
90 159 177 195 209 218 225 230 234 237 240 242 244 90
91 160 178 196 210 219 226 231 235 238 241 243 245 91
92 161 179 197 211 220 227 232 236 239 242 244 246 92
93 162 180 198 212 221 228 233 237 240 243 245 247 93
94 164 181 199 213 222 229 234 238 242 245 247 249 94
95 165 182 200 214 224 231 236 240 243 246 248 250 95
96 167 184 202 216 225 232 237 241 245 248 250 252 96
97 169 185 204 218 227 234 239 243 247 250 252 254 97
98 172 188 207 221 230 237 242 246 250 252 255 257 98
99 177 191 211 225 234 241 246 250 254 257 260 262 99
74

Table C.1.5: Winter Reading Student Achievement Percentiles
Grade
Pct K 1 2 3 4 5 6 7 8 9 10 11 Pct
1 119 140 149 160 169 176 180 182 183 185 182 184 1
2 123 144 153 165 173 180 184 186 188 189 187 189 2
3 125 146 156 167 175 182 187 189 190 192 190 192 3
4 127 148 158 169 177 184 189 191 192 194 192 194 4
5 128 149 160 171 179 186 190 192 194 196 194 195 5
6 129 150 161 172 180 187 192 194 195 197 195 197 6
7 130 152 162 173 182 188 193 195 196 198 196 198 7
8 131 153 163 174 183 189 194 196 197 199 198 199 8
9 132 153 164 175 184 190 195 197 198 200 199 201 9
10 133 154 165 176 184 191 196 198 199 201 200 202 10
11 134 155 166 177 185 192 196 199 200 202 201 202 11
12 134 156 167 178 186 193 197 199 201 203 201 203 12
13 135 156 167 179 187 193 198 200 202 204 202 204 13
14 136 157 168 179 187 194 199 201 202 204 203 205 14
15 136 157 169 180 188 195 199 201 203 205 204 206 15
16 137 158 169 181 189 195 200 202 204 206 204 206 16
17 137 159 170 181 189 196 200 203 204 206 205 207 17
18 138 159 170 182 190 196 201 203 205 207 206 208 18
19 138 160 171 182 190 197 201 204 206 208 206 208 19
20 139 160 172 183 191 197 202 204 206 208 207 209 20
21 139 161 172 183 192 198 202 205 207 209 208 209 21
22 140 161 173 184 192 199 203 205 207 209 208 210 22
23 140 162 173 184 193 199 203 206 208 210 209 210 23
24 141 162 174 185 193 199 204 206 208 210 209 211 24
25 141 162 174 185 194 200 204 207 209 211 210 212 25
26 141 163 175 186 194 200 205 207 209 211 210 212 26
27 142 163 175 186 194 201 205 208 210 212 211 213 27
28 142 164 175 187 195 201 206 208 210 212 211 213 28
29 143 164 176 187 195 202 206 209 211 213 212 214 29
30 143 164 176 188 196 202 207 209 211 213 212 214 30
31 143 165 177 188 196 203 207 209 211 214 213 214 31
32 144 165 177 189 197 203 207 210 212 214 213 215 32
33 144 166 178 189 197 203 208 210 212 214 214 215 33
34 144 166 178 189 197 204 208 211 213 215 214 216 34
35 145 166 178 190 198 204 209 211 213 215 215 216 35
36 145 167 179 190 198 205 209 212 214 216 215 217 36
37 146 167 179 191 199 205 209 212 214 216 215 217 37
38 146 167 180 191 199 205 210 212 214 217 216 218 38
39 146 168 180 191 199 206 210 213 215 217 216 218 39
40 147 168 180 192 200 206 211 213 215 217 217 219 40
41 147 168 181 192 200 206 211 214 216 218 217 219 41
42 147 169 181 193 201 207 211 214 216 218 218 219 42
43 148 169 182 193 201 207 212 214 216 219 218 220 43
44 148 169 182 193 201 208 212 215 217 219 218 220 44
45 148 170 182 194 202 208 212 215 217 219 219 221 45
46 149 170 183 194 202 208 213 215 218 220 219 221 46
47 149 171 183 194 202 209 213 216 218 220 220 221 47
48 149 171 183 195 203 209 213 216 218 220 220 222 48
49 150 171 184 195 203 209 214 217 219 221 221 222 49
... continued on next page
75

Table C.1.5: Winter Reading Student Achievement Percentiles , continued
Pct K 1 2 3 4 5 6 7 8 9 10 11 Pct
50 150 172 184 196 204 210 214 217 219 221 221 223 50
51 150 172 185 196 204 210 215 217 219 222 221 223 51
52 151 172 185 196 204 211 215 218 220 222 222 224 52
53 151 173 185 197 205 211 215 218 220 222 222 224 53
54 151 173 186 197 205 211 216 218 221 223 223 224 54
55 152 173 186 198 205 212 216 219 221 223 223 225 55
56 152 174 186 198 206 212 216 219 221 224 224 225 56
57 152 174 187 198 206 212 217 220 222 224 224 226 57
58 153 174 187 199 207 213 217 220 222 224 224 226 58
59 153 175 188 199 207 213 218 220 223 225 225 226 59
60 153 175 188 199 207 214 218 221 223 225 225 227 60
61 154 175 188 200 208 214 218 221 223 226 226 227 61
62 154 176 189 200 208 214 219 221 224 226 226 228 62
63 154 176 189 201 209 215 219 222 224 226 227 228 63
64 155 176 190 201 209 215 219 222 225 227 227 229 64
65 155 177 190 201 209 215 220 223 225 227 227 229 65
66 155 177 190 202 210 216 220 223 225 228 228 230 66
67 156 177 191 202 210 216 221 224 226 228 228 230 67
68 156 178 191 203 211 217 221 224 226 229 229 230 68
69 156 178 192 203 211 217 221 224 227 229 229 231 69
70 157 179 192 204 211 218 222 225 227 229 230 231 70
71 157 179 192 204 212 218 222 225 228 230 230 232 71
72 158 179 193 204 212 218 223 226 228 230 231 232 72
73 158 180 193 205 213 219 223 226 229 231 231 233 73
74 158 180 194 205 213 219 224 227 229 231 232 233 74
75 159 181 194 206 214 220 224 227 229 232 232 234 75
76 159 181 195 206 214 220 224 227 230 232 233 234 76
77 160 182 195 207 215 221 225 228 230 233 233 235 77
78 160 182 196 207 215 221 225 228 231 233 234 235 78
79 161 182 196 208 216 222 226 229 231 234 234 236 79
80 161 183 197 208 216 222 226 230 232 234 235 237 80
81 162 183 197 209 217 223 227 230 233 235 236 237 81
82 162 184 198 209 217 223 228 231 233 235 236 238 82
83 163 184 198 210 218 224 228 231 234 236 237 238 83
84 163 185 199 211 218 224 229 232 234 237 238 239 84
85 164 186 200 211 219 225 229 232 235 237 238 240 85
86 164 186 200 212 220 226 230 233 236 238 239 241 86
87 165 187 201 213 220 226 231 234 236 239 240 241 87
88 165 187 202 213 221 227 231 235 237 240 241 242 88
89 166 188 203 214 222 228 232 235 238 240 241 243 89
90 167 189 203 215 223 229 233 236 239 241 242 244 90
91 168 190 204 216 224 229 234 237 240 242 243 245 91
92 168 191 205 217 225 230 235 238 241 243 244 246 92
93 169 192 206 218 226 231 236 239 242 244 246 247 93
94 170 193 207 219 227 233 237 240 243 245 247 248 94
95 172 194 209 221 228 234 238 242 244 247 248 250 95
96 173 195 210 222 230 235 240 243 246 248 250 252 96
97 175 197 212 224 232 237 242 245 248 251 252 254 97
98 177 199 215 227 234 240 244 248 251 253 255 257 98
99 181 203 219 231 238 244 248 252 255 257 260 261 99
76

Table C.1.6: Spring Reading Student Achievement Percentiles
Grade
Pct K 1 2 3 4 5 6 7 8 9 10 11 Pct
1 127 144 153 164 171 178 182 183 183 184 181 181 1
2 130 148 157 168 175 182 186 187 188 189 185 186 2
3 133 150 160 170 178 184 188 190 190 191 188 189 3
4 134 152 162 172 180 186 190 192 193 193 191 191 4
5 136 154 164 174 181 188 192 193 194 195 192 193 5
6 137 155 165 175 183 189 193 195 196 197 194 195 6
7 138 156 166 176 184 190 194 196 197 198 195 196 7
8 139 157 167 177 185 191 195 197 198 199 197 197 8
9 140 158 168 178 186 192 196 198 199 200 198 199 9
10 141 159 169 179 187 193 197 199 200 201 199 200 10
11 141 160 170 180 188 194 198 200 201 202 200 201 11
12 142 160 171 181 188 194 199 200 202 203 201 202 12
13 143 161 172 182 189 195 199 201 202 204 201 202 13
14 143 162 172 182 190 196 200 202 203 204 202 203 14
15 144 162 173 183 190 197 201 202 204 205 203 204 15
16 144 163 174 184 191 197 201 203 204 206 204 205 16
17 145 164 174 184 192 198 202 204 205 206 205 205 17
18 145 164 175 185 192 198 202 204 206 207 205 206 18
19 146 165 175 185 193 199 203 205 206 208 206 207 19
20 146 165 176 186 193 199 203 205 207 208 206 207 20
21 147 166 176 186 194 200 204 206 207 209 207 208 21
22 147 166 177 187 194 200 204 206 208 209 208 209 22
23 148 167 177 187 195 201 205 207 208 210 208 209 23
24 148 167 178 188 195 201 205 207 209 210 209 210 24
25 149 168 178 188 196 202 206 208 209 211 209 210 25
26 149 168 179 189 196 202 206 208 210 211 210 211 26
27 149 169 179 189 197 203 207 209 210 212 210 211 27
28 150 169 180 190 197 203 207 209 211 212 211 212 28
29 150 169 180 190 198 204 208 210 211 213 212 213 29
30 151 170 181 191 198 204 208 210 212 213 212 213 30
31 151 170 181 191 199 204 208 211 212 214 213 214 31
32 151 171 182 192 199 205 209 211 213 214 213 214 32
33 152 171 182 192 199 205 209 211 213 215 213 215 33
34 152 172 182 192 200 206 210 212 214 215 214 215 34
35 153 172 183 193 200 206 210 212 214 216 214 216 35
36 153 172 183 193 201 207 210 213 214 216 215 216 36
37 153 173 184 194 201 207 211 213 215 216 215 216 37
38 154 173 184 194 201 207 211 214 215 217 216 217 38
39 154 173 184 194 202 208 212 214 216 217 216 217 39
40 154 174 185 195 202 208 212 214 216 218 217 218 40
41 155 174 185 195 203 208 212 215 216 218 217 218 41
42 155 175 186 196 203 209 213 215 217 219 218 219 42
43 155 175 186 196 203 209 213 215 217 219 218 219 43
44 156 175 186 196 204 210 214 216 218 219 219 220 44
45 156 176 187 197 204 210 214 216 218 220 219 220 45
46 156 176 187 197 204 210 214 217 218 220 219 221 46
47 157 176 188 197 205 211 215 217 219 221 220 221 47
48 157 177 188 198 205 211 215 217 219 221 220 221 48
49 157 177 188 198 206 211 215 218 220 221 221 222 49
... continued on next page
77
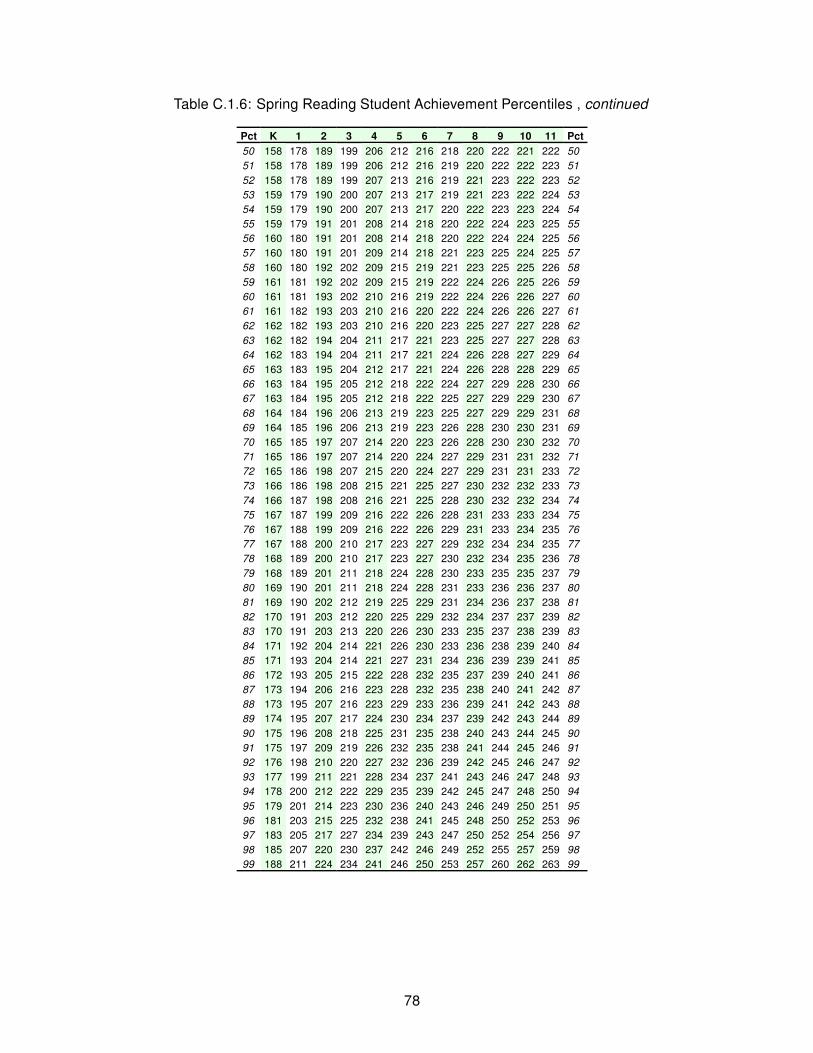
Table C.1.6: Spring Reading Student Achievement Percentiles , continued
Pct K 1 2 3 4 5 6 7 8 9 10 11 Pct
50 158 178 189 199 206 212 216 218 220 222 221 222 50
51 158 178 189 199 206 212 216 219 220 222 222 223 51
52 158 178 189 199 207 213 216 219 221 223 222 223 52
53 159 179 190 200 207 213 217 219 221 223 222 224 53
54 159 179 190 200 207 213 217 220 222 223 223 224 54
55 159 179 191 201 208 214 218 220 222 224 223 225 55
56 160 180 191 201 208 214 218 220 222 224 224 225 56
57 160 180 191 201 209 214 218 221 223 225 224 225 57
58 160 180 192 202 209 215 219 221 223 225 225 226 58
59 161 181 192 202 209 215 219 222 224 226 225 226 59
60 161 181 193 202 210 216 219 222 224 226 226 227 60
61 161 182 193 203 210 216 220 222 224 226 226 227 61
62 162 182 193 203 210 216 220 223 225 227 227 228 62
63 162 182 194 204 211 217 221 223 225 227 227 228 63
64 162 183 194 204 211 217 221 224 226 228 227 229 64
65 163 183 195 204 212 217 221 224 226 228 228 229 65
66 163 184 195 205 212 218 222 224 227 229 228 230 66
67 163 184 195 205 212 218 222 225 227 229 229 230 67
68 164 184 196 206 213 219 223 225 227 229 229 231 68
69 164 185 196 206 213 219 223 226 228 230 230 231 69
70 165 185 197 207 214 220 223 226 228 230 230 232 70
71 165 186 197 207 214 220 224 227 229 231 231 232 71
72 165 186 198 207 215 220 224 227 229 231 231 233 72
73 166 186 198 208 215 221 225 227 230 232 232 233 73
74 166 187 198 208 216 221 225 228 230 232 232 234 74
75 167 187 199 209 216 222 226 228 231 233 233 234 75
76 167 188 199 209 216 222 226 229 231 233 234 235 76
77 167 188 200 210 217 223 227 229 232 234 234 235 77
78 168 189 200 210 217 223 227 230 232 234 235 236 78
79 168 189 201 211 218 224 228 230 233 235 235 237 79
80 169 190 201 211 218 224 228 231 233 236 236 237 80
81 169 190 202 212 219 225 229 231 234 236 237 238 81
82 170 191 203 212 220 225 229 232 234 237 237 239 82
83 170 191 203 213 220 226 230 233 235 237 238 239 83
84 171 192 204 214 221 226 230 233 236 238 239 240 84
85 171 193 204 214 221 227 231 234 236 239 239 241 85
86 172 193 205 215 222 228 232 235 237 239 240 241 86
87 173 194 206 216 223 228 232 235 238 240 241 242 87
88 173 195 207 216 223 229 233 236 239 241 242 243 88
89 174 195 207 217 224 230 234 237 239 242 243 244 89
90 175 196 208 218 225 231 235 238 240 243 244 245 90
91 175 197 209 219 226 232 235 238 241 244 245 246 91
92 176 198 210 220 227 232 236 239 242 245 246 247 92
93 177 199 211 221 228 234 237 241 243 246 247 248 93
94 178 200 212 222 229 235 239 242 245 247 248 250 94
95 179 201 214 223 230 236 240 243 246 249 250 251 95
96 181 203 215 225 232 238 241 245 248 250 252 253 96
97 183 205 217 227 234 239 243 247 250 252 254 256 97
98 185 207 220 230 237 242 246 249 252 255 257 259 98
99 188 211 224 234 241 246 250 253 257 260 262 263 99
78

Table C.1.7: Fall Language Usage Student Achievement Percentiles
Grade
Pct K 1 2 3 4 5 6 7 8 9 10 11 Pct
1 136 154 165 173 179 182 183 185 184 187 1
2 140 158 169 177 182 186 187 189 188 191 2
3 143 161 171 180 185 188 190 192 191 193 3
4 145 163 173 181 187 190 191 194 193 195 4
5 147 164 175 183 188 191 193 195 194 197 5
6 149 166 176 184 189 193 194 196 196 198 6
7 150 167 177 185 190 194 195 197 197 199 7
8 151 168 178 186 191 195 196 198 198 200 8
9 152 169 179 187 192 195 197 199 199 201 9
10 153 170 180 188 193 196 198 200 200 202 10
11 154 171 181 189 194 197 199 201 200 203 11
12 155 172 182 189 195 198 200 202 201 204 12
13 156 172 182 190 195 198 200 202 202 205 13
14 157 173 183 191 196 199 201 203 203 205 14
15 157 174 184 191 196 200 201 204 203 206 15
16 158 174 184 192 197 200 202 204 204 207 16
17 159 175 185 192 198 201 203 205 205 207 17
18 159 175 185 193 198 201 203 205 205 208 18
19 160 176 186 193 199 202 204 206 206 208 19
20 161 177 186 194 199 202 204 206 206 209 20
21 161 177 187 194 200 203 205 207 207 209 21
22 162 178 188 195 200 203 205 207 207 210 22
23 162 178 188 195 201 204 206 208 208 210 23
24 163 179 188 196 201 204 206 208 208 211 24
25 163 179 189 196 201 205 207 209 209 211 25
26 164 180 189 197 202 205 207 209 209 212 26
27 164 180 190 197 202 206 207 210 210 212 27
28 165 181 190 198 203 206 208 210 210 213 28
29 165 181 191 198 203 206 208 211 211 213 29
30 166 181 191 198 203 207 209 211 211 214 30
31 166 182 192 199 204 207 209 211 211 214 31
32 167 182 192 199 204 208 210 212 212 215 32
33 167 183 192 200 205 208 210 212 212 215 33
34 168 183 193 200 205 208 210 213 213 215 34
35 168 184 193 200 205 209 211 213 213 216 35
36 169 184 194 201 206 209 211 213 214 216 36
37 169 184 194 201 206 209 211 214 214 217 37
38 169 185 194 201 207 210 212 214 214 217 38
39 170 185 195 202 207 210 212 214 215 217 39
40 170 186 195 202 207 211 213 215 215 218 40
41 171 186 195 202 208 211 213 215 216 218 41
42 171 186 196 203 208 211 213 216 216 218 42
43 172 187 196 203 208 212 214 216 216 219 43
44 172 187 197 204 209 212 214 216 217 219 44
45 172 187 197 204 209 212 214 217 217 220 45
46 173 188 197 204 209 213 215 217 217 220 46
47 173 188 198 205 210 213 215 217 218 220 47
48 174 189 198 205 210 213 215 218 218 221 48
49 174 189 198 205 210 214 216 218 219 221 49
... continued on next page
79
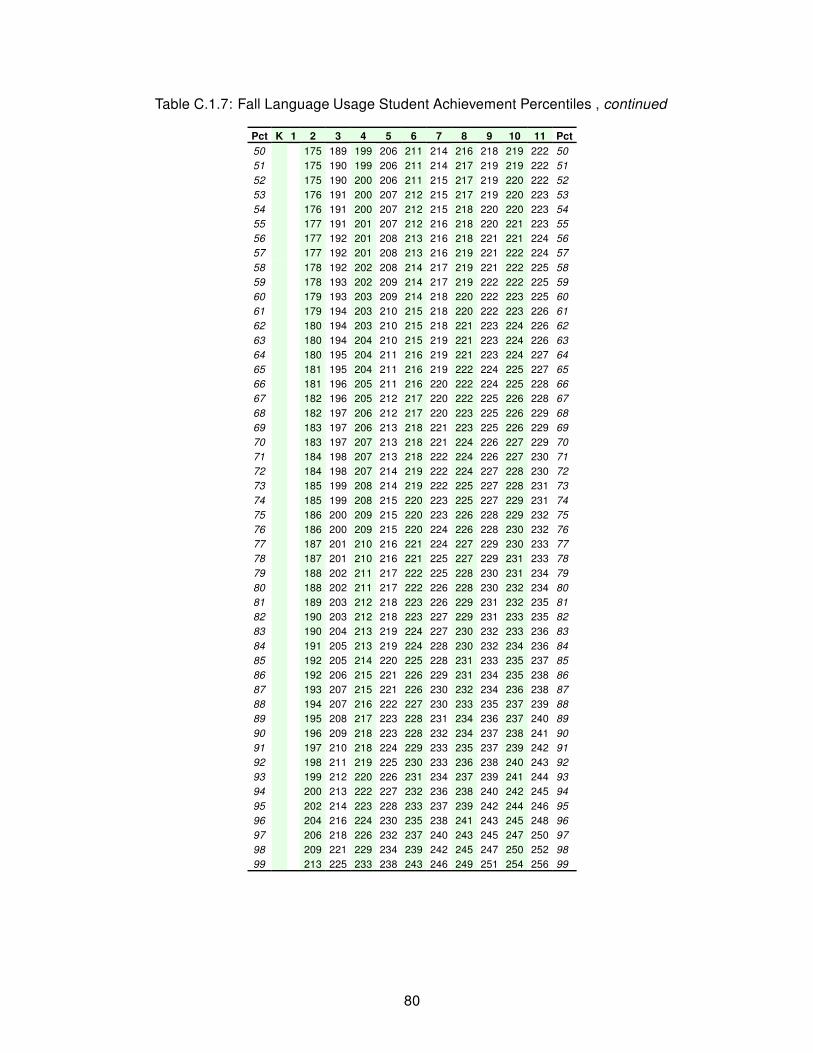
Table C.1.7: Fall Language Usage Student Achievement Percentiles , continued
Pct K 1 2 3 4 5 6 7 8 9 10 11 Pct
50 175 189 199 206 211 214 216 218 219 222 50
51 175 190 199 206 211 214 217 219 219 222 51
52 175 190 200 206 211 215 217 219 220 222 52
53 176 191 200 207 212 215 217 219 220 223 53
54 176 191 200 207 212 215 218 220 220 223 54
55 177 191 201 207 212 216 218 220 221 223 55
56 177 192 201 208 213 216 218 221 221 224 56
57 177 192 201 208 213 216 219 221 222 224 57
58 178 192 202 208 214 217 219 221 222 225 58
59 178 193 202 209 214 217 219 222 222 225 59
60 179 193 203 209 214 218 220 222 223 225 60
61 179 194 203 210 215 218 220 222 223 226 61
62 180 194 203 210 215 218 221 223 224 226 62
63 180 194 204 210 215 219 221 223 224 226 63
64 180 195 204 211 216 219 221 223 224 227 64
65 181 195 204 211 216 219 222 224 225 227 65
66 181 196 205 211 216 220 222 224 225 228 66
67 182 196 205 212 217 220 222 225 226 228 67
68 182 197 206 212 217 220 223 225 226 229 68
69 183 197 206 213 218 221 223 225 226 229 69
70 183 197 207 213 218 221 224 226 227 229 70
71 184 198 207 213 218 222 224 226 227 230 71
72 184 198 207 214 219 222 224 227 228 230 72
73 185 199 208 214 219 222 225 227 228 231 73
74 185 199 208 215 220 223 225 227 229 231 74
75 186 200 209 215 220 223 226 228 229 232 75
76 186 200 209 215 220 224 226 228 230 232 76
77 187 201 210 216 221 224 227 229 230 233 77
78 187 201 210 216 221 225 227 229 231 233 78
79 188 202 211 217 222 225 228 230 231 234 79
80 188 202 211 217 222 226 228 230 232 234 80
81 189 203 212 218 223 226 229 231 232 235 81
82 190 203 212 218 223 227 229 231 233 235 82
83 190 204 213 219 224 227 230 232 233 236 83
84 191 205 213 219 224 228 230 232 234 236 84
85 192 205 214 220 225 228 231 233 235 237 85
86 192 206 215 221 226 229 231 234 235 238 86
87 193 207 215 221 226 230 232 234 236 238 87
88 194 207 216 222 227 230 233 235 237 239 88
89 195 208 217 223 228 231 234 236 237 240 89
90 196 209 218 223 228 232 234 237 238 241 90
91 197 210 218 224 229 233 235 237 239 242 91
92 198 211 219 225 230 233 236 238 240 243 92
93 199 212 220 226 231 234 237 239 241 244 93
94 200 213 222 227 232 236 238 240 242 245 94
95 202 214 223 228 233 237 239 242 244 246 95
96 204 216 224 230 235 238 241 243 245 248 96
97 206 218 226 232 237 240 243 245 247 250 97
98 209 221 229 234 239 242 245 247 250 252 98
99 213 225 233 238 243 246 249 251 254 256 99
80

Table C.1.8: Winter Language Usage Student Achievement Percentiles
Grade
Pct K 1 2 3 4 5 6 7 8 9 10 11 Pct
1 149 164 172 179 183 185 186 187 185 188 1
2 153 168 176 183 187 189 189 191 189 192 2
3 156 170 178 185 189 191 192 193 192 194 3
4 158 172 180 187 191 193 194 195 193 196 4
5 160 173 182 188 192 194 195 197 195 198 5
6 161 175 183 189 193 195 196 198 196 199 6
7 162 176 184 190 194 197 198 199 198 200 7
8 163 177 185 191 195 198 199 200 199 201 8
9 164 178 186 192 196 198 199 201 200 202 9
10 165 179 187 193 197 199 200 202 201 203 10
11 166 179 187 193 198 200 201 203 201 204 11
12 167 180 188 194 198 201 202 203 202 205 12
13 168 181 189 195 199 201 202 204 203 205 13
14 168 181 189 195 200 202 203 205 204 206 14
15 169 182 190 196 200 202 204 205 204 207 15
16 170 183 191 197 201 203 204 206 205 207 16
17 170 183 191 197 201 204 205 206 205 208 17
18 171 184 192 198 202 204 205 207 206 209 18
19 171 184 192 198 202 205 206 207 207 209 19
20 172 185 193 199 203 205 206 208 207 210 20
21 173 185 193 199 203 206 207 208 208 210 21
22 173 186 194 199 204 206 207 209 208 211 22
23 174 186 194 200 204 207 208 209 209 211 23
24 174 187 195 200 205 207 208 210 209 212 24
25 175 187 195 201 205 207 209 210 210 212 25
26 175 188 196 201 205 208 209 211 210 213 26
27 176 188 196 202 206 208 210 211 211 213 27
28 176 189 196 202 206 209 210 212 211 213 28
29 176 189 197 202 207 209 210 212 211 214 29
30 177 189 197 203 207 209 211 212 212 214 30
31 177 190 198 203 207 210 211 213 212 215 31
32 178 190 198 204 208 210 212 213 213 215 32
33 178 191 198 204 208 211 212 214 213 216 33
34 179 191 199 204 208 211 212 214 214 216 34
35 179 191 199 205 209 211 213 214 214 216 35
36 179 192 199 205 209 212 213 215 214 217 36
37 180 192 200 205 210 212 213 215 215 217 37
38 180 192 200 206 210 212 214 215 215 218 38
39 181 193 201 206 210 213 214 216 216 218 39
40 181 193 201 206 211 213 215 216 216 218 40
41 181 194 201 207 211 213 215 217 216 219 41
42 182 194 202 207 211 214 215 217 217 219 42
43 182 194 202 207 212 214 216 217 217 219 43
44 183 195 202 208 212 214 216 218 217 220 44
45 183 195 203 208 212 215 216 218 218 220 45
46 183 195 203 208 213 215 217 218 218 221 46
47 184 196 203 209 213 215 217 219 219 221 47
48 184 196 204 209 213 216 217 219 219 221 48
49 185 196 204 209 214 216 218 219 219 222 49
... continued on next page
81

Table C.1.8: Winter Language Usage Student Achievement Percentiles , continued
Pct K 1 2 3 4 5 6 7 8 9 10 11 Pct
50 185 197 204 210 214 217 218 220 220 222 50
51 185 197 205 210 214 217 218 220 220 222 51
52 186 198 205 210 215 217 219 220 220 223 52
53 186 198 205 211 215 218 219 221 221 223 53
54 186 198 206 211 215 218 219 221 221 224 54
55 187 199 206 211 216 218 220 221 222 224 55
56 187 199 206 212 216 219 220 222 222 224 56
57 188 199 207 212 216 219 221 222 222 225 57
58 188 200 207 212 217 219 221 223 223 225 58
59 188 200 208 213 217 220 221 223 223 225 59
60 189 200 208 213 217 220 222 223 224 226 60
61 189 201 208 213 218 220 222 224 224 226 61
62 190 201 209 214 218 221 222 224 224 227 62
63 190 202 209 214 218 221 223 224 225 227 63
64 190 202 209 214 219 221 223 225 225 227 64
65 191 202 210 215 219 222 223 225 225 228 65
66 191 203 210 215 219 222 224 225 226 228 66
67 192 203 210 216 220 222 224 226 226 229 67
68 192 203 211 216 220 223 225 226 227 229 68
69 193 204 211 216 221 223 225 227 227 229 69
70 193 204 212 217 221 224 225 227 228 230 70
71 193 205 212 217 221 224 226 227 228 230 71
72 194 205 212 217 222 224 226 228 228 231 72
73 194 206 213 218 222 225 227 228 229 231 73
74 195 206 213 218 222 225 227 229 229 232 74
75 195 206 214 219 223 226 227 229 230 232 75
76 196 207 214 219 223 226 228 230 230 233 76
77 196 207 215 219 224 226 228 230 231 233 77
78 197 208 215 220 224 227 229 231 231 234 78
79 197 208 216 220 225 227 229 231 232 234 79
80 198 209 216 221 225 228 230 231 232 235 80
81 198 209 217 221 226 228 230 232 233 235 81
82 199 210 217 222 226 229 231 233 233 236 82
83 200 210 218 222 227 229 231 233 234 236 83
84 200 211 218 223 227 230 232 234 235 237 84
85 201 212 219 223 228 231 233 234 235 238 85
86 202 212 219 224 228 231 233 235 236 238 86
87 202 213 220 225 229 232 234 235 237 239 87
88 203 214 221 225 230 232 234 236 237 240 88
89 204 214 221 226 230 233 235 237 238 240 89
90 205 215 222 227 231 234 236 238 239 241 90
91 206 216 223 227 232 235 237 238 240 242 91
92 206 217 224 228 233 236 238 239 241 243 92
93 208 218 225 229 234 236 239 240 242 244 93
94 209 219 226 230 235 238 240 241 243 245 94
95 210 220 227 231 236 239 241 243 244 247 95
96 212 222 229 233 237 240 242 244 246 248 96
97 214 224 230 235 239 242 244 246 248 250 97
98 216 226 233 237 241 244 247 248 251 253 98
99 221 230 237 240 245 248 250 252 255 257 99
82

Table C.1.9: Spring Language Usage Student Achievement Percentiles
Grade
Pct K 1 2 3 4 5 6 7 8 9 10 11 Pct
1 154 167 175 181 184 186 186 187 184 185 1
2 158 171 179 184 188 189 190 191 188 190 2
3 161 173 181 187 190 192 192 193 191 192 3
4 163 175 183 188 192 194 194 195 193 194 4
5 164 177 184 190 193 195 196 197 194 196 5
6 166 178 185 191 194 196 197 198 196 198 6
7 167 179 187 192 196 197 198 199 197 199 7
8 168 180 188 193 196 198 199 200 198 200 8
9 169 181 188 194 197 199 200 201 199 201 9
10 170 182 189 195 198 200 201 202 200 202 10
11 171 183 190 195 199 201 202 203 201 203 11
12 172 183 191 196 200 202 202 203 202 204 12
13 172 184 191 197 200 202 203 204 202 204 13
14 173 185 192 197 201 203 204 205 203 205 14
15 174 185 193 198 201 203 204 205 204 206 15
16 174 186 193 198 202 204 205 206 204 206 16
17 175 187 194 199 202 205 205 207 205 207 17
18 176 187 194 199 203 205 206 207 206 208 18
19 176 188 195 200 204 206 207 208 206 208 19
20 177 188 195 200 204 206 207 208 207 209 20
21 177 189 196 201 204 207 208 209 207 209 21
22 178 189 196 201 205 207 208 209 208 210 22
23 178 190 197 202 205 207 209 210 209 210 23
24 179 190 197 202 206 208 209 210 209 211 24
25 179 190 197 203 206 208 209 211 210 211 25
26 180 191 198 203 207 209 210 211 210 212 26
27 180 191 198 203 207 209 210 211 211 212 27
28 181 192 199 204 207 210 211 212 211 213 28
29 181 192 199 204 208 210 211 212 211 213 29
30 182 193 200 205 208 210 212 213 212 214 30
31 182 193 200 205 209 211 212 213 212 214 31
32 182 193 200 205 209 211 212 214 213 215 32
33 183 194 201 206 209 212 213 214 213 215 33
34 183 194 201 206 210 212 213 214 214 216 34
35 184 195 201 206 210 212 214 215 214 216 35
36 184 195 202 207 210 213 214 215 215 216 36
37 185 195 202 207 211 213 214 216 215 217 37
38 185 196 203 207 211 213 215 216 215 217 38
39 185 196 203 208 212 214 215 216 216 218 39
40 186 196 203 208 212 214 215 217 216 218 40
41 186 197 204 208 212 214 216 217 217 219 41
42 187 197 204 209 213 215 216 217 217 219 42
43 187 197 204 209 213 215 217 218 217 219 43
44 187 198 205 209 213 216 217 218 218 220 44
45 188 198 205 210 214 216 217 219 218 220 45
46 188 199 205 210 214 216 218 219 219 221 46
47 189 199 206 210 214 217 218 219 219 221 47
48 189 199 206 211 215 217 218 220 219 221 48
49 189 200 206 211 215 217 219 220 220 222 49
... continued on next page
83

Table C.1.9: Spring Language Usage Student Achievement Percentiles , continued
Pct K 1 2 3 4 5 6 7 8 9 10 11 Pct
50 190 200 207 211 215 218 219 220 220 222 50
51 190 200 207 212 216 218 219 221 221 223 51
52 190 201 207 212 216 218 220 221 221 223 52
53 191 201 208 212 216 219 220 221 221 223 53
54 191 201 208 213 217 219 220 222 222 224 54
55 192 202 208 213 217 219 221 222 222 224 55
56 192 202 209 213 217 220 221 223 223 225 56
57 192 202 209 214 218 220 222 223 223 225 57
58 193 203 209 214 218 220 222 223 223 225 58
59 193 203 210 214 218 221 222 224 224 226 59
60 194 204 210 215 219 221 223 224 224 226 60
61 194 204 211 215 219 221 223 224 225 227 61
62 194 204 211 215 219 222 223 225 225 227 62
63 195 205 211 216 220 222 224 225 225 227 63
64 195 205 212 216 220 223 224 226 226 228 64
65 196 205 212 217 220 223 225 226 226 228 65
66 196 206 212 217 221 223 225 226 227 229 66
67 196 206 213 217 221 224 225 227 227 229 67
68 197 207 213 218 222 224 226 227 228 230 68
69 197 207 213 218 222 224 226 228 228 230 69
70 198 207 214 218 222 225 227 228 228 230 70
71 198 208 214 219 223 225 227 228 229 231 71
72 199 208 215 219 223 226 227 229 229 231 72
73 199 209 215 220 223 226 228 229 230 232 73
74 200 209 215 220 224 226 228 230 230 232 74
75 200 209 216 220 224 227 229 230 231 233 75
76 201 210 216 221 225 227 229 231 231 233 76
77 201 210 217 221 225 228 230 231 232 234 77
78 202 211 217 222 226 228 230 232 232 234 78
79 202 211 218 222 226 229 231 232 233 235 79
80 203 212 218 223 227 229 231 233 233 235 80
81 203 212 219 223 227 230 232 233 234 236 81
82 204 213 219 224 228 230 232 234 235 237 82
83 204 213 220 224 228 231 233 234 235 237 83
84 205 214 220 225 229 231 233 235 236 238 84
85 206 215 221 225 229 232 234 235 236 239 85
86 206 215 221 226 230 232 234 236 237 239 86
87 207 216 222 226 230 233 235 237 238 240 87
88 208 217 223 227 231 234 236 237 239 241 88
89 209 217 223 228 232 234 237 238 239 242 89
90 210 218 224 228 232 235 237 239 240 242 90
91 210 219 225 229 233 236 238 240 241 243 91
92 211 220 226 230 234 237 239 241 242 244 92
93 213 221 227 231 235 238 240 242 243 245 93
94 214 222 228 232 236 239 241 243 245 247 94
95 215 223 229 233 237 240 242 244 246 248 95
96 217 225 231 235 239 242 244 246 248 250 96
97 219 227 232 236 240 243 246 248 250 252 97
98 221 229 235 239 243 246 248 250 252 255 98
99 226 233 238 242 246 249 252 254 257 259 99
84

Table C.1.10: Fall General Science Student Achievement Percentiles
Grade
Pct K 1 2 3 4 5 6 7 8 9 10 11 Pct
1 160 169 175 177 179 182 183 181 1
2 163 172 178 181 183 185 186 185 2
3 165 174 179 183 185 187 188 187 3
4 167 175 181 184 186 189 190 189 4
5 168 176 182 185 188 190 191 191 5
6 169 177 183 186 189 191 193 192 6
7 170 178 184 187 190 192 194 193 7
8 171 179 185 188 190 193 194 194 8
9 172 180 185 189 191 194 195 195 9
10 172 180 186 190 192 195 196 196 10
11 173 181 187 190 193 195 197 196 11
12 174 181 187 191 193 196 197 197 12
13 174 182 188 191 194 196 198 198 13
14 175 183 188 192 194 197 199 198 14
15 175 183 189 192 195 198 199 199 15
16 176 183 189 193 195 198 200 200 16
17 176 184 190 193 196 199 200 200 17
18 177 184 190 194 196 199 201 201 18
19 177 185 191 194 197 200 201 201 19
20 178 185 191 195 197 200 202 202 20
21 178 186 191 195 198 200 202 202 21
22 178 186 192 195 198 201 203 203 22
23 179 186 192 196 198 201 203 203 23
24 179 187 192 196 199 202 203 204 24
25 180 187 193 197 199 202 204 204 25
26 180 187 193 197 200 202 204 204 26
27 180 188 193 197 200 203 205 205 27
28 181 188 194 198 200 203 205 205 28
29 181 188 194 198 201 203 205 206 29
30 181 189 194 198 201 204 206 206 30
31 182 189 195 199 201 204 206 206 31
32 182 189 195 199 202 205 206 207 32
33 182 190 195 199 202 205 207 207 33
34 183 190 196 200 202 205 207 208 34
35 183 190 196 200 203 206 208 208 35
36 183 191 196 200 203 206 208 208 36
37 184 191 197 200 203 206 208 209 37
38 184 191 197 201 204 207 209 209 38
39 184 191 197 201 204 207 209 209 39
40 185 192 197 201 204 207 209 210 40
41 185 192 198 202 204 207 210 210 41
42 185 192 198 202 205 208 210 210 42
43 185 193 198 202 205 208 210 211 43
44 186 193 199 203 205 208 211 211 44
45 186 193 199 203 206 209 211 212 45
46 186 193 199 203 206 209 211 212 46
47 187 194 199 203 206 209 211 212 47
48 187 194 200 204 207 210 212 213 48
49 187 194 200 204 207 210 212 213 49
... continued on next page
85
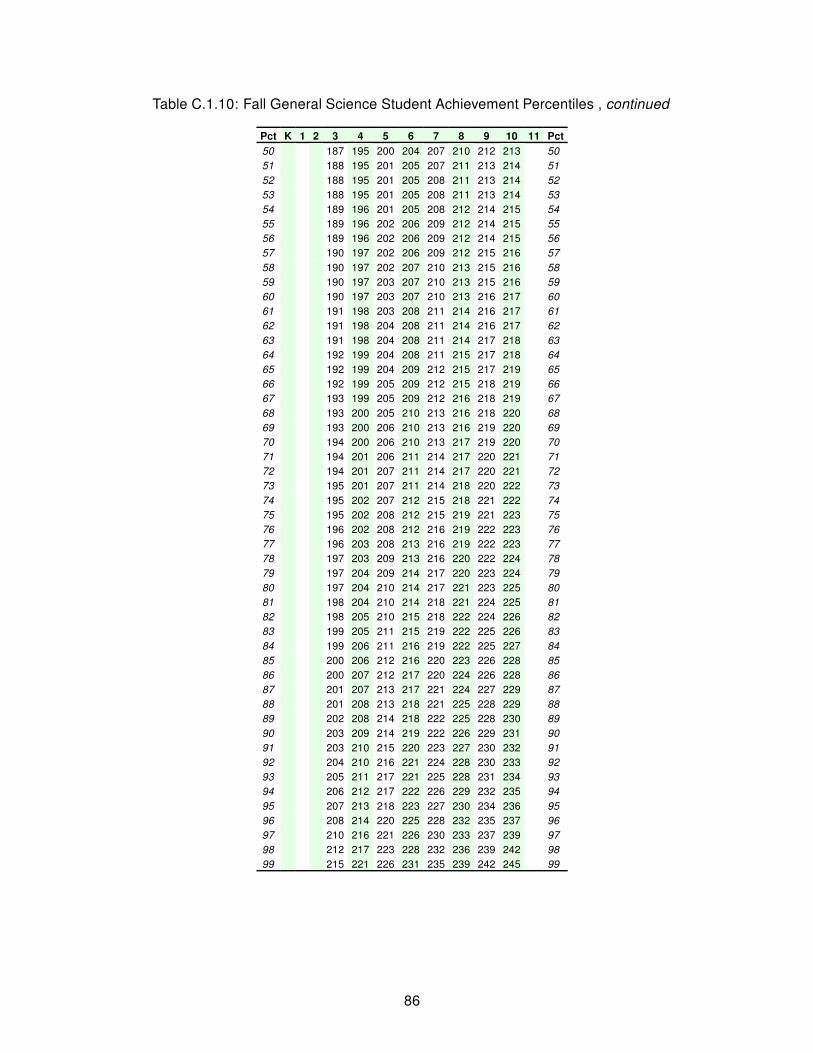
Table C.1.10: Fall General Science Student Achievement Percentiles , continued
Pct K 1 2 3 4 5 6 7 8 9 10 11 Pct
50 187 195 200 204 207 210 212 213 50
51 188 195 201 205 207 211 213 214 51
52 188 195 201 205 208 211 213 214 52
53 188 195 201 205 208 211 213 214 53
54 189 196 201 205 208 212 214 215 54
55 189 196 202 206 209 212 214 215 55
56 189 196 202 206 209 212 214 215 56
57 190 197 202 206 209 212 215 216 57
58 190 197 202 207 210 213 215 216 58
59 190 197 203 207 210 213 215 216 59
60 190 197 203 207 210 213 216 217 60
61 191 198 203 208 211 214 216 217 61
62 191 198 204 208 211 214 216 217 62
63 191 198 204 208 211 214 217 218 63
64 192 199 204 208 211 215 217 218 64
65 192 199 204 209 212 215 217 219 65
66 192 199 205 209 212 215 218 219 66
67 193 199 205 209 212 216 218 219 67
68 193 200 205 210 213 216 218 220 68
69 193 200 206 210 213 216 219 220 69
70 194 200 206 210 213 217 219 220 70
71 194 201 206 211 214 217 220 221 71
72 194 201 207 211 214 217 220 221 72
73 195 201 207 211 214 218 220 222 73
74 195 202 207 212 215 218 221 222 74
75 195 202 208 212 215 219 221 223 75
76 196 202 208 212 216 219 222 223 76
77 196 203 208 213 216 219 222 223 77
78 197 203 209 213 216 220 222 224 78
79 197 204 209 214 217 220 223 224 79
80 197 204 210 214 217 221 223 225 80
81 198 204 210 214 218 221 224 225 81
82 198 205 210 215 218 222 224 226 82
83 199 205 211 215 219 222 225 226 83
84 199 206 211 216 219 222 225 227 84
85 200 206 212 216 220 223 226 228 85
86 200 207 212 217 220 224 226 228 86
87 201 207 213 217 221 224 227 229 87
88 201 208 213 218 221 225 228 229 88
89 202 208 214 218 222 225 228 230 89
90 203 209 214 219 222 226 229 231 90
91 203 210 215 220 223 227 230 232 91
92 204 210 216 221 224 228 230 233 92
93 205 211 217 221 225 228 231 234 93
94 206 212 217 222 226 229 232 235 94
95 207 213 218 223 227 230 234 236 95
96 208 214 220 225 228 232 235 237 96
97 210 216 221 226 230 233 237 239 97
98 212 217 223 228 232 236 239 242 98
99 215 221 226 231 235 239 242 245 99
86

Table C.1.11: Winter General Science Student Achievement Percentiles
Grade
Pct K 1 2 3 4 5 6 7 8 9 10 11 Pct
1 167 174 179 181 182 184 184 182 1
2 170 177 181 184 185 187 188 186 2
3 172 179 183 186 187 189 190 188 3
4 173 180 185 187 189 191 192 190 4
5 175 181 186 188 190 192 193 192 5
6 176 182 187 189 191 193 194 193 6
7 176 183 188 190 192 194 195 194 7
8 177 184 189 191 193 195 196 195 8
9 178 184 189 192 194 196 197 196 9
10 179 185 190 192 194 197 198 197 10
11 179 186 190 193 195 197 198 197 11
12 180 186 191 194 196 198 199 198 12
13 180 187 192 194 196 199 199 199 13
14 181 187 192 195 197 199 200 199 14
15 181 188 192 195 197 200 201 200 15
16 182 188 193 196 198 200 201 201 16
17 182 188 193 196 198 201 202 201 17
18 183 189 194 197 199 201 202 202 18
19 183 189 194 197 199 202 203 202 19
20 183 190 195 197 199 202 203 203 20
21 184 190 195 198 200 202 204 203 21
22 184 190 195 198 200 203 204 204 22
23 184 191 196 199 201 203 204 204 23
24 185 191 196 199 201 204 205 205 24
25 185 191 196 199 201 204 205 205 25
26 186 192 197 200 202 204 206 205 26
27 186 192 197 200 202 205 206 206 27
28 186 192 197 200 203 205 206 206 28
29 187 193 198 201 203 206 207 207 29
30 187 193 198 201 203 206 207 207 30
31 187 193 198 201 204 206 208 208 31
32 187 194 199 202 204 207 208 208 32
33 188 194 199 202 204 207 208 208 33
34 188 194 199 202 205 207 209 209 34
35 188 195 200 203 205 208 209 209 35
36 189 195 200 203 205 208 209 209 36
37 189 195 200 203 206 208 210 210 37
38 189 195 200 204 206 209 210 210 38
39 190 196 201 204 206 209 210 210 39
40 190 196 201 204 206 209 211 211 40
41 190 196 201 204 207 210 211 211 41
42 190 197 202 205 207 210 211 212 42
43 191 197 202 205 207 210 212 212 43
44 191 197 202 205 208 210 212 212 44
45 191 197 202 206 208 211 212 213 45
46 191 198 203 206 208 211 213 213 46
47 192 198 203 206 209 211 213 213 47
48 192 198 203 206 209 212 213 214 48
49 192 198 203 207 209 212 214 214 49
... continued on next page
87

Table C.1.11: Winter General Science Student Achievement Percentiles , continued
Pct K 1 2 3 4 5 6 7 8 9 10 11 Pct
50 193 199 204 207 209 212 214 214 50
51 193 199 204 207 210 213 214 215 51
52 193 199 204 208 210 213 215 215 52
53 193 200 204 208 210 213 215 215 53
54 194 200 205 208 211 214 215 216 54
55 194 200 205 208 211 214 215 216 55
56 194 200 205 209 211 214 216 216 56
57 194 201 206 209 212 214 216 217 57
58 195 201 206 209 212 215 216 217 58
59 195 201 206 210 212 215 217 217 59
60 195 201 206 210 212 215 217 218 60
61 196 202 207 210 213 216 217 218 61
62 196 202 207 211 213 216 218 219 62
63 196 202 207 211 213 216 218 219 63
64 196 203 208 211 214 217 218 219 64
65 197 203 208 211 214 217 219 220 65
66 197 203 208 212 214 217 219 220 66
67 197 203 208 212 215 218 220 220 67
68 198 204 209 212 215 218 220 221 68
69 198 204 209 213 215 218 220 221 69
70 198 204 209 213 216 219 221 222 70
71 199 205 210 213 216 219 221 222 71
72 199 205 210 214 216 219 221 222 72
73 199 205 210 214 217 220 222 223 73
74 200 206 211 214 217 220 222 223 74
75 200 206 211 215 217 221 223 224 75
76 200 206 211 215 218 221 223 224 76
77 201 207 212 215 218 221 223 224 77
78 201 207 212 216 219 222 224 225 78
79 201 207 212 216 219 222 224 225 79
80 202 208 213 217 219 223 225 226 80
81 202 208 213 217 220 223 225 226 81
82 203 209 214 217 220 223 226 227 82
83 203 209 214 218 221 224 226 227 83
84 203 209 214 218 221 224 227 228 84
85 204 210 215 219 222 225 227 229 85
86 204 210 215 219 222 225 228 229 86
87 205 211 216 220 223 226 228 230 87
88 205 211 216 220 223 227 229 230 88
89 206 212 217 221 224 227 230 231 89
90 207 213 218 222 225 228 230 232 90
91 207 213 218 222 225 229 231 233 91
92 208 214 219 223 226 229 232 234 92
93 209 215 220 224 227 230 233 235 93
94 210 215 220 225 228 231 234 236 94
95 211 216 221 226 229 232 235 237 95
96 212 218 223 227 230 234 236 238 96
97 213 219 224 229 232 235 238 240 97
98 215 221 226 230 234 237 240 243 98
99 218 224 229 234 237 241 244 246 99
88

Table C.1.12: Spring General Science Student Achievement Percentiles
Grade
Pct K 1 2 3 4 5 6 7 8 9 10 11 Pct
1 170 176 180 181 182 184 184 182 1
2 173 179 183 185 186 188 187 185 2
3 175 180 185 187 188 190 190 188 3
4 176 182 186 188 189 191 192 190 4
5 177 183 188 189 191 193 193 191 5
6 178 184 189 190 192 194 194 193 6
7 179 185 189 191 193 195 195 194 7
8 180 186 190 192 194 196 196 195 8
9 181 186 191 193 194 197 197 196 9
10 181 187 192 194 195 197 198 197 10
11 182 188 192 194 196 198 198 197 11
12 182 188 193 195 196 199 199 198 12
13 183 189 193 195 197 199 200 199 13
14 184 189 194 196 198 200 200 199 14
15 184 190 194 196 198 200 201 200 15
16 184 190 195 197 199 201 202 201 16
17 185 191 195 197 199 201 202 201 17
18 185 191 196 198 200 202 203 202 18
19 186 191 196 198 200 202 203 202 19
20 186 192 196 199 201 203 204 203 20
21 187 192 197 199 201 203 204 203 21
22 187 193 197 200 201 204 205 204 22
23 187 193 198 200 202 204 205 204 23
24 188 193 198 200 202 205 205 205 24
25 188 194 198 201 203 205 206 205 25
26 188 194 199 201 203 205 206 206 26
27 189 194 199 201 203 206 207 206 27
28 189 195 199 202 204 206 207 207 28
29 189 195 200 202 204 207 207 207 29
30 190 195 200 202 204 207 208 207 30
31 190 196 200 203 205 207 208 208 31
32 190 196 201 203 205 208 209 208 32
33 191 196 201 203 205 208 209 209 33
34 191 196 201 204 206 208 209 209 34
35 191 197 201 204 206 209 210 209 35
36 191 197 202 204 206 209 210 210 36
37 192 197 202 205 207 209 210 210 37
38 192 198 202 205 207 210 211 211 38
39 192 198 203 205 207 210 211 211 39
40 193 198 203 206 208 210 211 211 40
41 193 199 203 206 208 211 212 212 41
42 193 199 203 206 208 211 212 212 42
43 193 199 204 207 209 211 212 212 43
44 194 199 204 207 209 212 213 213 44
45 194 200 204 207 209 212 213 213 45
46 194 200 205 207 210 212 213 213 46
47 195 200 205 208 210 213 214 214 47
48 195 200 205 208 210 213 214 214 48
49 195 201 205 208 211 213 214 215 49
... continued on next page
89

Table C.1.12: Spring General Science Student Achievement Percentiles , continued
Pct K 1 2 3 4 5 6 7 8 9 10 11 Pct
50 195 201 206 209 211 214 215 215 50
51 196 201 206 209 211 214 215 215 51
52 196 202 206 209 211 214 215 216 52
53 196 202 207 210 212 214 216 216 53
54 197 202 207 210 212 215 216 216 54
55 197 202 207 210 212 215 217 217 55
56 197 203 207 210 213 215 217 217 56
57 197 203 208 211 213 216 217 217 57
58 198 203 208 211 213 216 218 218 58
59 198 203 208 211 214 216 218 218 59
60 198 204 209 212 214 217 218 219 60
61 199 204 209 212 214 217 219 219 61
62 199 204 209 212 215 217 219 219 62
63 199 205 209 213 215 218 219 220 63
64 199 205 210 213 215 218 220 220 64
65 200 205 210 213 216 218 220 220 65
66 200 206 210 213 216 219 220 221 66
67 200 206 211 214 216 219 221 221 67
68 201 206 211 214 217 219 221 222 68
69 201 206 211 214 217 220 221 222 69
70 201 207 212 215 217 220 222 222 70
71 202 207 212 215 218 221 222 223 71
72 202 207 212 215 218 221 223 223 72
73 202 208 213 216 218 221 223 224 73
74 203 208 213 216 219 222 223 224 74
75 203 208 213 217 219 222 224 225 75
76 203 209 214 217 219 222 224 225 76
77 204 209 214 217 220 223 225 225 77
78 204 209 214 218 220 223 225 226 78
79 204 210 215 218 221 224 226 226 79
80 205 210 215 219 221 224 226 227 80
81 205 211 215 219 222 225 227 227 81
82 206 211 216 219 222 225 227 228 82
83 206 211 216 220 223 226 228 229 83
84 206 212 217 220 223 226 228 229 84
85 207 212 217 221 224 227 229 230 85
86 207 213 218 221 224 227 229 230 86
87 208 213 218 222 225 228 230 231 87
88 208 214 219 222 225 228 230 232 88
89 209 214 219 223 226 229 231 232 89
90 210 215 220 224 227 230 232 233 90
91 210 216 221 224 227 230 233 234 91
92 211 216 221 225 228 231 234 235 92
93 212 217 222 226 229 232 234 236 93
94 213 218 223 227 230 233 236 237 94
95 214 219 224 228 231 234 237 238 95
96 215 220 225 229 232 236 238 240 96
97 216 222 227 231 234 237 240 242 97
98 218 223 228 233 236 239 242 244 98
99 221 226 231 236 239 243 246 248 99
90
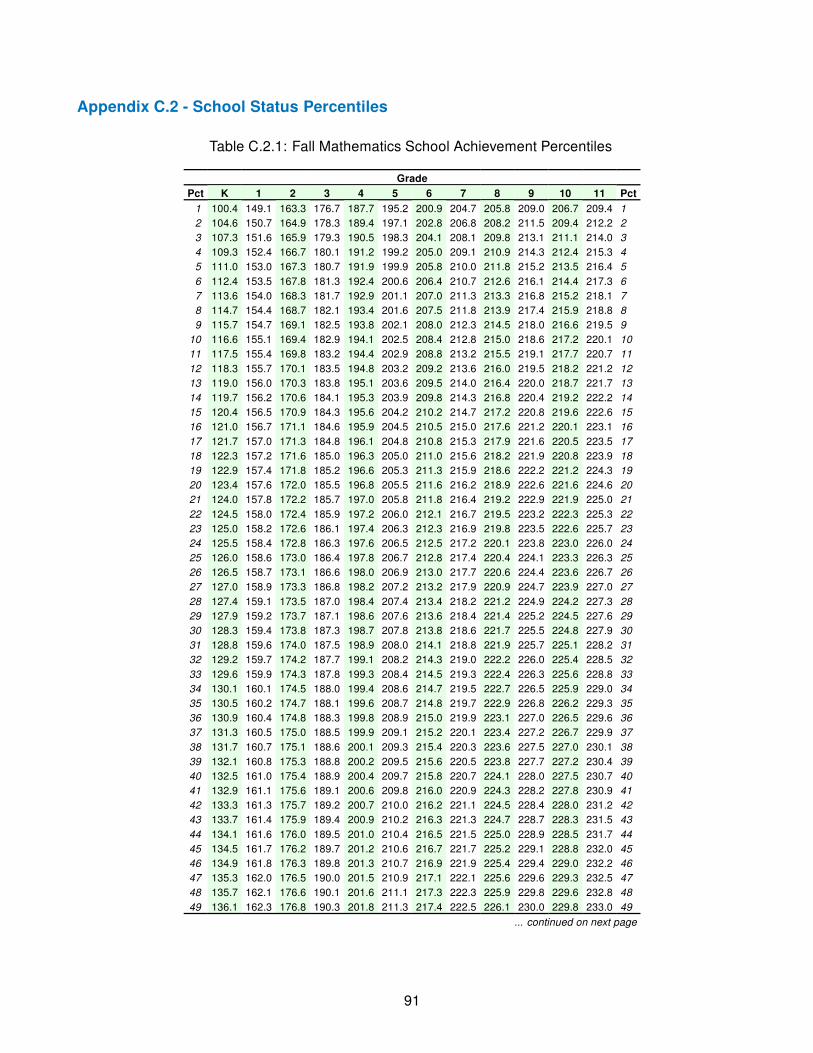
Appendix C.2 - School Status Percentiles
Table C.2.1: Fall Mathematics School Achievement Percentiles
Grade
Pct K 1 2 3 4 5 6 7 8 9 10 11 Pct
1 100.4 149.1 163.3 176.7 187.7 195.2 200.9 204.7 205.8 209.0 206.7 209.4 1
2 104.6 150.7 164.9 178.3 189.4 197.1 202.8 206.8 208.2 211.5 209.4 212.2 2
3 107.3 151.6 165.9 179.3 190.5 198.3 204.1 208.1 209.8 213.1 211.1 214.0 3
4 109.3 152.4 166.7 180.1 191.2 199.2 205.0 209.1 210.9 214.3 212.4 215.3 4
5 111.0 153.0 167.3 180.7 191.9 199.9 205.8 210.0 211.8 215.2 213.5 216.4 5
6 112.4 153.5 167.8 181.3 192.4 200.6 206.4 210.7 212.6 216.1 214.4 217.3 6
7 113.6 154.0 168.3 181.7 192.9 201.1 207.0 211.3 213.3 216.8 215.2 218.1 7
8 114.7 154.4 168.7 182.1 193.4 201.6 207.5 211.8 213.9 217.4 215.9 218.8 8
9 115.7 154.7 169.1 182.5 193.8 202.1 208.0 212.3 214.5 218.0 216.6 219.5 9
10 116.6 155.1 169.4 182.9 194.1 202.5 208.4 212.8 215.0 218.6 217.2 220.1 10
11 117.5 155.4 169.8 183.2 194.4 202.9 208.8 213.2 215.5 219.1 217.7 220.7 11
12 118.3 155.7 170.1 183.5 194.8 203.2 209.2 213.6 216.0 219.5 218.2 221.2 12
13 119.0 156.0 170.3 183.8 195.1 203.6 209.5 214.0 216.4 220.0 218.7 221.7 13
14 119.7 156.2 170.6 184.1 195.3 203.9 209.8 214.3 216.8 220.4 219.2 222.2 14
15 120.4 156.5 170.9 184.3 195.6 204.2 210.2 214.7 217.2 220.8 219.6 222.6 15
16 121.0 156.7 171.1 184.6 195.9 204.5 210.5 215.0 217.6 221.2 220.1 223.1 16
17 121.7 157.0 171.3 184.8 196.1 204.8 210.8 215.3 217.9 221.6 220.5 223.5 17
18 122.3 157.2 171.6 185.0 196.3 205.0 211.0 215.6 218.2 221.9 220.8 223.9 18
19 122.9 157.4 171.8 185.2 196.6 205.3 211.3 215.9 218.6 222.2 221.2 224.3 19
20 123.4 157.6 172.0 185.5 196.8 205.5 211.6 216.2 218.9 222.6 221.6 224.6 20
21 124.0 157.8 172.2 185.7 197.0 205.8 211.8 216.4 219.2 222.9 221.9 225.0 21
22 124.5 158.0 172.4 185.9 197.2 206.0 212.1 216.7 219.5 223.2 222.3 225.3 22
23 125.0 158.2 172.6 186.1 197.4 206.3 212.3 216.9 219.8 223.5 222.6 225.7 23
24 125.5 158.4 172.8 186.3 197.6 206.5 212.5 217.2 220.1 223.8 223.0 226.0 24
25 126.0 158.6 173.0 186.4 197.8 206.7 212.8 217.4 220.4 224.1 223.3 226.3 25
26 126.5 158.7 173.1 186.6 198.0 206.9 213.0 217.7 220.6 224.4 223.6 226.7 26
27 127.0 158.9 173.3 186.8 198.2 207.2 213.2 217.9 220.9 224.7 223.9 227.0 27
28 127.4 159.1 173.5 187.0 198.4 207.4 213.4 218.2 221.2 224.9 224.2 227.3 28
29 127.9 159.2 173.7 187.1 198.6 207.6 213.6 218.4 221.4 225.2 224.5 227.6 29
30 128.3 159.4 173.8 187.3 198.7 207.8 213.8 218.6 221.7 225.5 224.8 227.9 30
31 128.8 159.6 174.0 187.5 198.9 208.0 214.1 218.8 221.9 225.7 225.1 228.2 31
32 129.2 159.7 174.2 187.7 199.1 208.2 214.3 219.0 222.2 226.0 225.4 228.5 32
33 129.6 159.9 174.3 187.8 199.3 208.4 214.5 219.3 222.4 226.3 225.6 228.8 33
34 130.1 160.1 174.5 188.0 199.4 208.6 214.7 219.5 222.7 226.5 225.9 229.0 34
35 130.5 160.2 174.7 188.1 199.6 208.7 214.8 219.7 222.9 226.8 226.2 229.3 35
36 130.9 160.4 174.8 188.3 199.8 208.9 215.0 219.9 223.1 227.0 226.5 229.6 36
37 131.3 160.5 175.0 188.5 199.9 209.1 215.2 220.1 223.4 227.2 226.7 229.9 37
38 131.7 160.7 175.1 188.6 200.1 209.3 215.4 220.3 223.6 227.5 227.0 230.1 38
39 132.1 160.8 175.3 188.8 200.2 209.5 215.6 220.5 223.8 227.7 227.2 230.4 39
40 132.5 161.0 175.4 188.9 200.4 209.7 215.8 220.7 224.1 228.0 227.5 230.7 40
41 132.9 161.1 175.6 189.1 200.6 209.8 216.0 220.9 224.3 228.2 227.8 230.9 41
42 133.3 161.3 175.7 189.2 200.7 210.0 216.2 221.1 224.5 228.4 228.0 231.2 42
43 133.7 161.4 175.9 189.4 200.9 210.2 216.3 221.3 224.7 228.7 228.3 231.5 43
44 134.1 161.6 176.0 189.5 201.0 210.4 216.5 221.5 225.0 228.9 228.5 231.7 44
45 134.5 161.7 176.2 189.7 201.2 210.6 216.7 221.7 225.2 229.1 228.8 232.0 45
46 134.9 161.8 176.3 189.8 201.3 210.7 216.9 221.9 225.4 229.4 229.0 232.2 46
47 135.3 162.0 176.5 190.0 201.5 210.9 217.1 222.1 225.6 229.6 229.3 232.5 47
48 135.7 162.1 176.6 190.1 201.6 211.1 217.3 222.3 225.9 229.8 229.6 232.8 48
49 136.1 162.3 176.8 190.3 201.8 211.3 217.4 222.5 226.1 230.0 229.8 233.0 49
... continued on next page
91

Table C.2.1: Fall Mathematics School Achievement Percentiles , continued
Pct K 1 2 3 4 5 6 7 8 9 10 11 Pct
50 137 162 177 190 202 211 218 223 226 230 230 233 50
51 136.9 162.6 177.0 190.5 202.1 211.6 217.8 222.8 226.5 230.5 230.3 233.5 51
52 137.2 162.7 177.2 190.7 202.2 211.8 218.0 223.0 226.7 230.7 230.6 233.8 52
53 137.6 162.8 177.3 190.8 202.4 212.0 218.2 223.2 227.0 231.0 230.8 234.1 53
54 138.0 163.0 177.5 191.0 202.6 212.1 218.3 223.4 227.2 231.2 231.1 234.3 54
55 138.4 163.1 177.6 191.1 202.7 212.3 218.5 223.6 227.4 231.4 231.3 234.6 55
56 138.8 163.3 177.8 191.3 202.9 212.5 218.7 223.8 227.6 231.7 231.6 234.8 56
57 139.2 163.4 177.9 191.4 203.0 212.7 218.9 224.0 227.9 231.9 231.8 235.1 57
58 139.6 163.6 178.1 191.6 203.2 212.9 219.1 224.2 228.1 232.1 232.1 235.4 58
59 140.0 163.7 178.2 191.7 203.3 213.0 219.3 224.4 228.3 232.4 232.3 235.6 59
60 140.4 163.9 178.4 191.9 203.5 213.2 219.4 224.6 228.5 232.6 232.6 235.9 60
61 140.8 164.0 178.5 192.0 203.6 213.4 219.6 224.8 228.8 232.8 232.9 236.1 61
62 141.2 164.2 178.7 192.2 203.8 213.6 219.8 225.0 229.0 233.1 233.1 236.4 62
63 141.6 164.3 178.8 192.4 204.0 213.8 220.0 225.2 229.2 233.3 233.4 236.7 63
64 142.0 164.5 179.0 192.5 204.1 213.9 220.2 225.4 229.5 233.5 233.7 237.0 64
65 142.4 164.6 179.1 192.7 204.3 214.1 220.4 225.6 229.7 233.8 233.9 237.2 65
66 142.9 164.8 179.3 192.8 204.5 214.3 220.6 225.8 229.9 234.0 234.2 237.5 66
67 143.3 164.9 179.5 193.0 204.6 214.5 220.8 226.0 230.2 234.3 234.5 237.8 67
68 143.7 165.1 179.6 193.2 204.8 214.7 221.0 226.3 230.4 234.5 234.8 238.1 68
69 144.2 165.3 179.8 193.3 205.0 214.9 221.2 226.5 230.7 234.8 235.0 238.4 69
70 144.6 165.4 180.0 193.5 205.1 215.1 221.4 226.7 230.9 235.1 235.3 238.7 70
71 145.0 165.6 180.1 193.7 205.3 215.3 221.6 226.9 231.2 235.3 235.6 239.0 71
72 145.5 165.8 180.3 193.8 205.5 215.5 221.8 227.1 231.4 235.6 235.9 239.3 72
73 146.0 165.9 180.5 194.0 205.7 215.7 222.0 227.4 231.7 235.9 236.2 239.6 73
74 146.4 166.1 180.6 194.2 205.9 215.9 222.2 227.6 232.0 236.2 236.5 239.9 74
75 146.9 166.3 180.8 194.4 206.1 216.2 222.5 227.9 232.2 236.4 236.8 240.2 75
76 147.4 166.5 181.0 194.6 206.3 216.4 222.7 228.1 232.5 236.7 237.2 240.5 76
77 147.9 166.6 181.2 194.7 206.5 216.6 222.9 228.3 232.8 237.0 237.5 240.9 77
78 148.4 166.8 181.4 194.9 206.7 216.8 223.2 228.6 233.1 237.3 237.8 241.2 78
79 149.0 167.0 181.6 195.1 206.9 217.1 223.4 228.9 233.4 237.6 238.2 241.6 79
80 149.5 167.2 181.8 195.3 207.1 217.3 223.7 229.1 233.7 238.0 238.5 241.9 80
81 150.1 167.4 182.0 195.6 207.3 217.6 223.9 229.4 234.0 238.3 238.9 242.3 81
82 150.7 167.7 182.2 195.8 207.5 217.8 224.2 229.7 234.4 238.6 239.3 242.7 82
83 151.3 167.9 182.5 196.0 207.8 218.1 224.5 230.0 234.7 239.0 239.7 243.1 83
84 151.9 168.1 182.7 196.2 208.0 218.4 224.8 230.3 235.0 239.4 240.1 243.5 84
85 152.5 168.3 182.9 196.5 208.3 218.7 225.1 230.6 235.4 239.7 240.5 243.9 85
86 153.2 168.6 183.2 196.8 208.5 219.0 225.4 231.0 235.8 240.1 240.9 244.4 86
87 153.9 168.9 183.5 197.0 208.8 219.3 225.7 231.3 236.2 240.6 241.4 244.8 87
88 154.7 169.1 183.7 197.3 209.1 219.7 226.1 231.7 236.6 241.0 241.9 245.3 88
89 155.5 169.4 184.0 197.6 209.4 220.0 226.4 232.1 237.1 241.5 242.4 245.9 89
90 156.3 169.8 184.4 197.9 209.8 220.4 226.8 232.5 237.6 242.0 242.9 246.4 90
91 157.2 170.1 184.7 198.3 210.1 220.8 227.3 233.0 238.1 242.5 243.5 247.0 91
92 158.2 170.5 185.1 198.7 210.5 221.3 227.7 233.5 238.7 243.1 244.2 247.7 92
93 159.3 170.9 185.5 199.1 211.0 221.8 228.2 234.0 239.3 243.8 244.9 248.4 93
94 160.6 171.3 186.0 199.5 211.4 222.3 228.8 234.6 240.0 244.5 245.7 249.2 94
95 162.0 171.8 186.5 200.1 212.0 223.0 229.5 235.3 240.8 245.3 246.6 250.2 95
96 163.6 172.4 187.1 200.7 212.6 223.7 230.2 236.2 241.7 246.3 247.7 251.3 96
97 165.6 173.2 187.9 201.5 213.4 224.6 231.1 237.2 242.8 247.5 249.0 252.6 97
98 168.3 174.2 188.9 202.5 214.5 225.8 232.4 238.5 244.4 249.0 250.7 254.4 98
99 172.5 175.7 190.4 204.1 216.1 227.7 234.4 240.6 246.8 251.5 253.5 257.2 99
92

Table C.2.2: Winter Mathematics School Achievement Percentiles
Grade
Pct K 1 2 3 4 5 6 7 8 9 10 11 Pct
1 129.3 160.2 172.5 184.0 193.5 199.6 204.4 207.4 207.7 209.9 207.4 209.8 1
2 131.8 161.8 174.1 185.6 195.3 201.7 206.4 209.6 210.2 212.5 210.2 212.7 2
3 133.3 162.8 175.2 186.7 196.4 203.0 207.8 211.0 211.8 214.2 212.0 214.5 3
4 134.5 163.5 175.9 187.5 197.2 204.0 208.7 212.0 213.0 215.4 213.4 215.9 4
5 135.5 164.2 176.6 188.1 197.9 204.8 209.5 212.9 214.0 216.4 214.5 217.0 5
6 136.3 164.7 177.1 188.7 198.5 205.5 210.2 213.6 214.8 217.3 215.4 218.0 6
7 137.0 165.2 177.6 189.2 199.0 206.1 210.8 214.2 215.6 218.1 216.2 218.8 7
8 137.6 165.6 178.0 189.6 199.5 206.6 211.4 214.8 216.2 218.8 217.0 219.5 8
9 138.2 166.0 178.4 190.0 199.9 207.1 211.9 215.3 216.8 219.4 217.6 220.2 9
10 138.7 166.3 178.7 190.4 200.3 207.5 212.3 215.8 217.3 219.9 218.2 220.8 10
11 139.2 166.6 179.1 190.7 200.7 207.9 212.7 216.2 217.8 220.5 218.8 221.4 11
12 139.7 166.9 179.4 191.0 201.0 208.3 213.1 216.6 218.3 221.0 219.3 222.0 12
13 140.1 167.2 179.7 191.3 201.3 208.7 213.5 217.0 218.8 221.4 219.8 222.5 13
14 140.5 167.5 179.9 191.6 201.6 209.1 213.8 217.4 219.2 221.9 220.3 223.0 14
15 140.9 167.7 180.2 191.9 201.9 209.4 214.2 217.8 219.6 222.3 220.8 223.4 15
16 141.3 168.0 180.4 192.1 202.2 209.7 214.5 218.1 220.0 222.7 221.2 223.9 16
17 141.7 168.2 180.7 192.4 202.5 210.0 214.8 218.4 220.4 223.1 221.6 224.3 17
18 142.0 168.5 180.9 192.6 202.7 210.3 215.1 218.7 220.7 223.5 222.0 224.7 18
19 142.3 168.7 181.1 192.8 203.0 210.6 215.4 219.0 221.1 223.8 222.4 225.1 19
20 142.7 168.9 181.4 193.1 203.2 210.9 215.7 219.3 221.4 224.2 222.8 225.5 20
21 143.0 169.1 181.6 193.3 203.4 211.1 215.9 219.6 221.7 224.5 223.2 225.9 21
22 143.3 169.3 181.8 193.5 203.7 211.4 216.2 219.9 222.0 224.8 223.5 226.2 22
23 143.6 169.5 182.0 193.7 203.9 211.6 216.4 220.2 222.3 225.1 223.9 226.6 23
24 143.9 169.7 182.2 193.9 204.1 211.9 216.7 220.4 222.6 225.5 224.2 226.9 24
25 144.2 169.9 182.4 194.1 204.3 212.1 216.9 220.7 222.9 225.8 224.5 227.2 25
26 144.4 170.1 182.5 194.3 204.5 212.4 217.2 220.9 223.2 226.1 224.8 227.6 26
27 144.7 170.2 182.7 194.5 204.7 212.6 217.4 221.2 223.5 226.4 225.2 227.9 27
28 145.0 170.4 182.9 194.6 204.9 212.8 217.6 221.4 223.8 226.6 225.5 228.2 28
29 145.2 170.6 183.1 194.8 205.1 213.0 217.9 221.7 224.0 226.9 225.8 228.5 29
30 145.5 170.8 183.3 195.0 205.3 213.3 218.1 221.9 224.3 227.2 226.1 228.8 30
31 145.8 170.9 183.4 195.2 205.5 213.5 218.3 222.1 224.6 227.5 226.4 229.1 31
32 146.0 171.1 183.6 195.3 205.6 213.7 218.5 222.4 224.8 227.7 226.7 229.4 32
33 146.3 171.3 183.8 195.5 205.8 213.9 218.7 222.6 225.1 228.0 227.0 229.7 33
34 146.5 171.4 183.9 195.7 206.0 214.1 218.9 222.8 225.3 228.3 227.2 230.0 34
35 146.8 171.6 184.1 195.8 206.2 214.3 219.1 223.0 225.6 228.5 227.5 230.3 35
36 147.0 171.7 184.3 196.0 206.4 214.5 219.3 223.2 225.8 228.8 227.8 230.6 36
37 147.2 171.9 184.4 196.2 206.5 214.7 219.5 223.4 226.1 229.1 228.1 230.9 37
38 147.5 172.0 184.6 196.3 206.7 214.9 219.7 223.7 226.3 229.3 228.3 231.1 38
39 147.7 172.2 184.7 196.5 206.9 215.1 219.9 223.9 226.6 229.6 228.6 231.4 39
40 147.9 172.4 184.9 196.7 207.1 215.3 220.1 224.1 226.8 229.8 228.9 231.7 40
41 148.2 172.5 185.0 196.8 207.2 215.5 220.3 224.3 227.1 230.1 229.2 232.0 41
42 148.4 172.7 185.2 197.0 207.4 215.7 220.5 224.5 227.3 230.3 229.4 232.2 42
43 148.6 172.8 185.3 197.1 207.6 215.9 220.7 224.7 227.5 230.5 229.7 232.5 43
44 148.9 173.0 185.5 197.3 207.7 216.1 220.9 224.9 227.8 230.8 230.0 232.8 44
45 149.1 173.1 185.6 197.4 207.9 216.3 221.1 225.1 228.0 231.0 230.2 233.0 45
46 149.3 173.3 185.8 197.6 208.1 216.5 221.3 225.3 228.2 231.3 230.5 233.3 46
47 149.5 173.4 185.9 197.7 208.2 216.7 221.5 225.5 228.5 231.5 230.7 233.6 47
48 149.8 173.6 186.1 197.9 208.4 216.8 221.7 225.7 228.7 231.8 231.0 233.8 48
49 150.0 173.7 186.2 198.1 208.5 217.0 221.9 225.9 228.9 232.0 231.3 234.1 49
... continued on next page
93

Table C.2.2: Winter Mathematics School Achievement Percentiles , continued
Pct K 1 2 3 4 5 6 7 8 9 10 11 Pct
50 150 174 186 198 209 217 222 226 229 232 232 234 50
51 150.4 174.0 186.5 198.4 208.9 217.4 222.2 226.3 229.4 232.5 231.8 234.6 51
52 150.7 174.1 186.7 198.5 209.0 217.6 222.4 226.5 229.6 232.7 232.0 234.9 52
53 150.9 174.3 186.8 198.7 209.2 217.8 222.6 226.7 229.8 233.0 232.3 235.1 53
54 151.1 174.4 187.0 198.8 209.4 218.0 222.8 226.9 230.1 233.2 232.6 235.4 54
55 151.3 174.6 187.1 199.0 209.5 218.2 223.0 227.1 230.3 233.4 232.8 235.7 55
56 151.6 174.7 187.3 199.1 209.7 218.4 223.2 227.3 230.5 233.7 233.1 235.9 56
57 151.8 174.9 187.4 199.3 209.9 218.6 223.4 227.5 230.8 233.9 233.3 236.2 57
58 152.0 175.0 187.6 199.4 210.0 218.8 223.6 227.7 231.0 234.2 233.6 236.5 58
59 152.3 175.2 187.8 199.6 210.2 218.9 223.8 228.0 231.2 234.4 233.9 236.8 59
60 152.5 175.3 187.9 199.8 210.4 219.1 224.0 228.2 231.5 234.7 234.1 237.0 60
61 152.7 175.5 188.1 199.9 210.5 219.3 224.2 228.4 231.7 234.9 234.4 237.3 61
62 153.0 175.6 188.2 200.1 210.7 219.5 224.4 228.6 232.0 235.2 234.7 237.6 62
63 153.2 175.8 188.4 200.2 210.9 219.7 224.6 228.8 232.2 235.4 235.0 237.9 63
64 153.4 176.0 188.5 200.4 211.1 219.9 224.8 229.0 232.5 235.7 235.2 238.1 64
65 153.7 176.1 188.7 200.6 211.2 220.1 225.0 229.2 232.7 235.9 235.5 238.4 65
66 153.9 176.3 188.9 200.7 211.4 220.3 225.2 229.4 232.9 236.2 235.8 238.7 66
67 154.2 176.4 189.0 200.9 211.6 220.6 225.4 229.7 233.2 236.5 236.1 239.0 67
68 154.4 176.6 189.2 201.1 211.8 220.8 225.6 229.9 233.5 236.7 236.4 239.3 68
69 154.7 176.8 189.4 201.2 212.0 221.0 225.8 230.1 233.7 237.0 236.7 239.6 69
70 154.9 176.9 189.5 201.4 212.1 221.2 226.0 230.3 234.0 237.3 237.0 239.9 70
71 155.2 177.1 189.7 201.6 212.3 221.4 226.3 230.6 234.2 237.5 237.3 240.2 71
72 155.4 177.3 189.9 201.8 212.5 221.6 226.5 230.8 234.5 237.8 237.6 240.5 72
73 155.7 177.5 190.1 202.0 212.7 221.9 226.7 231.1 234.8 238.1 237.9 240.8 73
74 156.0 177.6 190.2 202.1 212.9 222.1 227.0 231.3 235.1 238.4 238.2 241.1 74
75 156.3 177.8 190.4 202.3 213.1 222.3 227.2 231.6 235.4 238.7 238.5 241.5 75
76 156.5 178.0 190.6 202.5 213.3 222.6 227.4 231.8 235.7 239.0 238.8 241.8 76
77 156.8 178.2 190.8 202.7 213.6 222.8 227.7 232.1 236.0 239.3 239.2 242.1 77
78 157.1 178.4 191.0 202.9 213.8 223.1 227.9 232.3 236.3 239.6 239.5 242.5 78
79 157.4 178.6 191.2 203.1 214.0 223.3 228.2 232.6 236.6 240.0 239.9 242.9 79
80 157.8 178.8 191.4 203.4 214.2 223.6 228.5 232.9 236.9 240.3 240.2 243.2 80
81 158.1 179.0 191.6 203.6 214.5 223.9 228.7 233.2 237.2 240.7 240.6 243.6 81
82 158.4 179.2 191.9 203.8 214.7 224.2 229.0 233.5 237.6 241.0 241.0 244.0 82
83 158.8 179.5 192.1 204.0 215.0 224.4 229.3 233.8 237.9 241.4 241.4 244.4 83
84 159.1 179.7 192.3 204.3 215.2 224.8 229.6 234.1 238.3 241.8 241.8 244.8 84
85 159.5 179.9 192.6 204.6 215.5 225.1 229.9 234.5 238.7 242.2 242.3 245.3 85
86 159.9 180.2 192.8 204.8 215.8 225.4 230.3 234.8 239.1 242.6 242.7 245.7 86
87 160.3 180.5 193.1 205.1 216.1 225.7 230.6 235.2 239.5 243.0 243.2 246.2 87
88 160.8 180.8 193.4 205.4 216.4 226.1 231.0 235.6 240.0 243.5 243.7 246.7 88
89 161.2 181.1 193.7 205.7 216.7 226.5 231.4 236.0 240.4 244.0 244.2 247.3 89
90 161.7 181.4 194.1 206.1 217.1 226.9 231.8 236.5 241.0 244.5 244.8 247.9 90
91 162.2 181.7 194.4 206.4 217.5 227.4 232.3 236.9 241.5 245.1 245.4 248.5 91
92 162.8 182.1 194.8 206.8 217.9 227.9 232.7 237.4 242.1 245.7 246.1 249.2 92
93 163.5 182.5 195.2 207.2 218.4 228.4 233.3 238.0 242.7 246.4 246.8 249.9 93
94 164.2 183.0 195.7 207.7 218.9 229.0 233.9 238.7 243.5 247.2 247.6 250.7 94
95 165.0 183.5 196.2 208.3 219.5 229.7 234.6 239.4 244.3 248.0 248.6 251.7 95
96 165.9 184.2 196.9 208.9 220.2 230.5 235.4 240.2 245.3 249.0 249.7 252.8 96
97 167.1 184.9 197.6 209.7 221.0 231.5 236.4 241.3 246.5 250.3 251.0 254.2 97
98 168.6 185.9 198.7 210.8 222.2 232.8 237.7 242.7 248.1 251.9 252.8 256.0 98
99 171.1 187.5 200.3 212.4 224.0 234.8 239.8 244.9 250.6 254.6 255.6 258.9 99
94

Table C.2.3: Spring Mathematics School Achievement Percentiles
Grade
Pct K 1 2 3 4 5 6 7 8 9 10 11 Pct
1 142.7 166.1 177.4 188.4 197.1 202.4 206.6 209.0 208.5 210.0 207.4 209.7 1
2 144.6 167.8 179.1 190.1 199.1 204.6 208.8 211.3 211.2 212.8 210.3 212.6 2
3 145.8 168.9 180.2 191.2 200.3 206.0 210.2 212.7 212.8 214.5 212.2 214.5 3
4 146.7 169.8 181.0 192.1 201.2 207.1 211.2 213.8 214.1 215.8 213.6 215.9 4
5 147.4 170.4 181.7 192.8 201.9 207.9 212.1 214.7 215.1 216.9 214.7 217.1 5
6 148.0 171.0 182.3 193.4 202.6 208.7 212.8 215.5 216.0 217.8 215.7 218.1 6
7 148.6 171.5 182.8 193.9 203.1 209.3 213.5 216.2 216.7 218.6 216.5 218.9 7
8 149.1 171.9 183.2 194.3 203.6 209.9 214.0 216.8 217.4 219.3 217.3 219.7 8
9 149.5 172.3 183.6 194.7 204.1 210.4 214.5 217.3 218.0 219.9 218.0 220.4 9
10 149.9 172.7 184.0 195.1 204.5 210.9 215.0 217.8 218.6 220.5 218.6 221.0 10
11 150.3 173.1 184.3 195.5 204.9 211.4 215.5 218.3 219.1 221.1 219.2 221.6 11
12 150.6 173.4 184.7 195.8 205.2 211.8 215.9 218.7 219.6 221.6 219.8 222.2 12
13 151.0 173.7 185.0 196.1 205.6 212.2 216.3 219.1 220.1 222.1 220.3 222.7 13
14 151.3 174.0 185.3 196.4 205.9 212.5 216.6 219.5 220.5 222.6 220.8 223.2 14
15 151.6 174.3 185.5 196.7 206.2 212.9 217.0 219.9 221.0 223.0 221.2 223.7 15
16 151.9 174.5 185.8 197.0 206.5 213.2 217.3 220.2 221.4 223.4 221.7 224.2 16
17 152.2 174.8 186.1 197.2 206.8 213.6 217.6 220.6 221.7 223.8 222.1 224.6 17
18 152.4 175.0 186.3 197.5 207.1 213.9 218.0 220.9 222.1 224.2 222.5 225.0 18
19 152.7 175.3 186.6 197.7 207.3 214.2 218.3 221.2 222.5 224.6 222.9 225.4 19
20 152.9 175.5 186.8 198.0 207.6 214.5 218.6 221.5 222.8 224.9 223.3 225.8 20
21 153.2 175.7 187.0 198.2 207.8 214.8 218.8 221.8 223.2 225.3 223.7 226.2 21
22 153.4 175.9 187.2 198.4 208.1 215.1 219.1 222.1 223.5 225.6 224.1 226.6 22
23 153.6 176.1 187.4 198.6 208.3 215.3 219.4 222.4 223.8 226.0 224.4 226.9 23
24 153.9 176.4 187.6 198.8 208.5 215.6 219.6 222.6 224.1 226.3 224.8 227.3 24
25 154.1 176.6 187.8 199.0 208.7 215.9 219.9 222.9 224.4 226.6 225.1 227.6 25
26 154.3 176.8 188.0 199.2 209.0 216.1 220.1 223.2 224.7 226.9 225.5 228.0 26
27 154.5 176.9 188.2 199.4 209.2 216.4 220.4 223.4 225.0 227.2 225.8 228.3 27
28 154.7 177.1 188.4 199.6 209.4 216.6 220.6 223.7 225.3 227.5 226.1 228.6 28
29 154.9 177.3 188.6 199.8 209.6 216.8 220.9 223.9 225.6 227.8 226.4 228.9 29
30 155.1 177.5 188.8 200.0 209.8 217.1 221.1 224.2 225.9 228.1 226.7 229.3 30
31 155.3 177.7 189.0 200.2 210.0 217.3 221.3 224.4 226.2 228.4 227.0 229.6 31
32 155.5 177.9 189.1 200.4 210.2 217.5 221.6 224.7 226.4 228.7 227.3 229.9 32
33 155.7 178.0 189.3 200.6 210.4 217.8 221.8 224.9 226.7 229.0 227.6 230.2 33
34 155.9 178.2 189.5 200.7 210.6 218.0 222.0 225.1 227.0 229.3 227.9 230.5 34
35 156.1 178.4 189.7 200.9 210.8 218.2 222.2 225.3 227.2 229.5 228.2 230.8 35
36 156.2 178.6 189.8 201.1 211.0 218.4 222.4 225.6 227.5 229.8 228.5 231.1 36
37 156.4 178.7 190.0 201.3 211.2 218.7 222.7 225.8 227.7 230.1 228.8 231.4 37
38 156.6 178.9 190.2 201.4 211.3 218.9 222.9 226.0 228.0 230.3 229.1 231.6 38
39 156.8 179.1 190.3 201.6 211.5 219.1 223.1 226.2 228.2 230.6 229.4 231.9 39
40 157.0 179.2 190.5 201.8 211.7 219.3 223.3 226.5 228.5 230.9 229.6 232.2 40
41 157.1 179.4 190.7 201.9 211.9 219.5 223.5 226.7 228.7 231.1 229.9 232.5 41
42 157.3 179.5 190.8 202.1 212.1 219.7 223.7 226.9 229.0 231.4 230.2 232.8 42
43 157.5 179.7 191.0 202.3 212.2 219.9 223.9 227.1 229.2 231.6 230.5 233.0 43
44 157.7 179.9 191.2 202.4 212.4 220.1 224.1 227.3 229.5 231.9 230.7 233.3 44
45 157.8 180.0 191.3 202.6 212.6 220.3 224.3 227.5 229.7 232.1 231.0 233.6 45
46 158.0 180.2 191.5 202.7 212.8 220.5 224.5 227.7 230.0 232.4 231.3 233.9 46
47 158.2 180.3 191.6 202.9 213.0 220.7 224.7 228.0 230.2 232.6 231.6 234.1 47
48 158.4 180.5 191.8 203.1 213.1 220.9 224.9 228.2 230.4 232.9 231.8 234.4 48
49 158.5 180.7 192.0 203.2 213.3 221.2 225.1 228.4 230.7 233.2 232.1 234.7 49
... continued on next page
95

Table C.2.3: Spring Mathematics School Achievement Percentiles , continued
Pct K 1 2 3 4 5 6 7 8 9 10 11 Pct
50 159 181 192 203 214 221 225 229 231 233 232 235 50
51 158.9 181.0 192.3 203.6 213.7 221.6 225.5 228.8 231.2 233.7 232.6 235.2 51
52 159.0 181.1 192.4 203.7 213.8 221.8 225.7 229.0 231.4 233.9 232.9 235.5 52
53 159.2 181.3 192.6 203.9 214.0 222.0 225.9 229.2 231.7 234.2 233.2 235.8 53
54 159.4 181.4 192.7 204.0 214.2 222.2 226.1 229.4 231.9 234.4 233.4 236.1 54
55 159.6 181.6 192.9 204.2 214.4 222.4 226.3 229.7 232.1 234.7 233.7 236.3 55
56 159.7 181.8 193.1 204.4 214.5 222.6 226.5 229.9 232.4 234.9 234.0 236.6 56
57 159.9 181.9 193.2 204.5 214.7 222.8 226.7 230.1 232.6 235.2 234.3 236.9 57
58 160.1 182.1 193.4 204.7 214.9 223.0 226.9 230.3 232.9 235.4 234.5 237.2 58
59 160.3 182.3 193.5 204.9 215.1 223.2 227.2 230.5 233.1 235.7 234.8 237.4 59
60 160.4 182.4 193.7 205.0 215.3 223.4 227.4 230.7 233.4 236.0 235.1 237.7 60
61 160.6 182.6 193.9 205.2 215.5 223.6 227.6 230.9 233.6 236.2 235.4 238.0 61
62 160.8 182.7 194.0 205.4 215.6 223.9 227.8 231.2 233.9 236.5 235.6 238.3 62
63 161.0 182.9 194.2 205.5 215.8 224.1 228.0 231.4 234.1 236.7 235.9 238.6 63
64 161.2 183.1 194.4 205.7 216.0 224.3 228.2 231.6 234.4 237.0 236.2 238.9 64
65 161.3 183.2 194.5 205.9 216.2 224.5 228.4 231.8 234.6 237.3 236.5 239.2 65
66 161.5 183.4 194.7 206.1 216.4 224.7 228.6 232.1 234.9 237.5 236.8 239.5 66
67 161.7 183.6 194.9 206.2 216.6 224.9 228.9 232.3 235.2 237.8 237.1 239.8 67
68 161.9 183.8 195.1 206.4 216.8 225.2 229.1 232.5 235.4 238.1 237.4 240.1 68
69 162.1 183.9 195.2 206.6 217.0 225.4 229.3 232.8 235.7 238.4 237.7 240.4 69
70 162.3 184.1 195.4 206.8 217.2 225.6 229.5 233.0 236.0 238.7 238.0 240.7 70
71 162.5 184.3 195.6 207.0 217.4 225.9 229.8 233.3 236.3 239.0 238.3 241.0 71
72 162.7 184.5 195.8 207.2 217.6 226.1 230.0 233.5 236.5 239.3 238.6 241.3 72
73 162.9 184.7 196.0 207.4 217.8 226.4 230.3 233.8 236.8 239.6 238.9 241.6 73
74 163.1 184.9 196.2 207.6 218.0 226.6 230.5 234.0 237.1 239.9 239.3 242.0 74
75 163.3 185.1 196.4 207.8 218.2 226.9 230.7 234.3 237.4 240.2 239.6 242.3 75
76 163.5 185.3 196.6 208.0 218.5 227.1 231.0 234.5 237.7 240.5 239.9 242.6 76
77 163.8 185.5 196.8 208.2 218.7 227.4 231.3 234.8 238.0 240.8 240.3 243.0 77
78 164.0 185.7 197.0 208.4 218.9 227.7 231.5 235.1 238.4 241.2 240.7 243.4 78
79 164.2 185.9 197.2 208.6 219.2 227.9 231.8 235.4 238.7 241.5 241.0 243.7 79
80 164.5 186.1 197.4 208.8 219.4 228.2 232.1 235.7 239.0 241.9 241.4 244.1 80
81 164.7 186.4 197.7 209.1 219.7 228.5 232.4 236.0 239.4 242.2 241.8 244.5 81
82 165.0 186.6 197.9 209.3 219.9 228.8 232.7 236.3 239.7 242.6 242.2 244.9 82
83 165.2 186.8 198.1 209.6 220.2 229.1 233.0 236.6 240.1 243.0 242.6 245.3 83
84 165.5 187.1 198.4 209.8 220.5 229.5 233.3 237.0 240.5 243.4 243.0 245.8 84
85 165.8 187.4 198.7 210.1 220.8 229.8 233.7 237.3 240.9 243.8 243.5 246.2 85
86 166.1 187.6 198.9 210.4 221.1 230.2 234.0 237.7 241.3 244.3 244.0 246.7 86
87 166.4 187.9 199.2 210.7 221.4 230.5 234.4 238.1 241.8 244.7 244.5 247.2 87
88 166.8 188.2 199.5 211.0 221.7 230.9 234.8 238.5 242.2 245.2 245.0 247.7 88
89 167.1 188.6 199.9 211.3 222.1 231.4 235.2 238.9 242.7 245.7 245.5 248.3 89
90 167.5 188.9 200.2 211.7 222.5 231.8 235.6 239.4 243.3 246.3 246.1 248.9 90
91 167.9 189.3 200.6 212.1 222.9 232.3 236.1 239.9 243.8 246.9 246.8 249.5 91
92 168.3 189.7 201.0 212.5 223.4 232.8 236.6 240.4 244.4 247.5 247.4 250.2 92
93 168.8 190.1 201.5 212.9 223.9 233.4 237.2 241.0 245.1 248.2 248.2 251.0 93
94 169.4 190.6 202.0 213.4 224.4 234.0 237.8 241.7 245.9 249.0 249.0 251.9 94
95 170.0 191.2 202.5 214.0 225.0 234.8 238.6 242.5 246.8 249.9 250.0 252.9 95
96 170.7 191.9 203.2 214.7 225.8 235.6 239.4 243.3 247.8 251.0 251.2 254.0 96
97 171.6 192.7 204.0 215.5 226.7 236.7 240.5 244.4 249.0 252.3 252.5 255.4 97
98 172.8 193.8 205.1 216.7 227.9 238.1 241.8 245.9 250.7 254.0 254.4 257.3 98
99 174.7 195.5 206.8 218.4 229.8 240.3 244.0 248.2 253.3 256.8 257.3 260.3 99
96

Table C.2.4: Fall Reading School Achievement Percentiles
Grade
Pct K 1 2 3 4 5 6 7 8 9 10 11 Pct
1 106.2 147.2 159.8 172.7 183.1 191.1 196.3 199.2 199.9 203.6 201.4 204.8 1
2 109.9 148.7 161.6 174.5 184.8 192.8 198.0 201.0 201.9 205.6 203.6 206.9 2
3 112.2 149.7 162.7 175.7 186.0 193.9 199.1 202.1 203.2 206.8 205.0 208.2 3
4 113.9 150.5 163.5 176.6 186.8 194.7 199.9 203.0 204.2 207.7 206.1 209.2 4
5 115.4 151.1 164.2 177.3 187.5 195.4 200.6 203.6 205.0 208.5 207.0 210.0 5
6 116.6 151.6 164.8 177.9 188.1 195.9 201.2 204.2 205.6 209.1 207.7 210.7 6
7 117.7 152.1 165.3 178.4 188.6 196.4 201.7 204.8 206.2 209.7 208.4 211.3 7
8 118.6 152.5 165.7 178.9 189.0 196.9 202.1 205.2 206.7 210.2 208.9 211.8 8
9 119.5 152.9 166.1 179.3 189.5 197.3 202.5 205.6 207.2 210.7 209.5 212.3 9
10 120.3 153.2 166.5 179.7 189.9 197.6 202.9 206.0 207.7 211.1 210.0 212.8 10
11 121.0 153.6 166.9 180.1 190.2 198.0 203.2 206.4 208.1 211.5 210.4 213.2 11
12 121.7 153.9 167.2 180.4 190.5 198.3 203.6 206.7 208.5 211.8 210.8 213.6 12
13 122.4 154.1 167.5 180.7 190.9 198.6 203.9 207.1 208.8 212.2 211.2 214.0 13
14 123.0 154.4 167.8 181.0 191.2 198.9 204.2 207.4 209.2 212.5 211.6 214.3 14
15 123.6 154.7 168.1 181.3 191.4 199.2 204.4 207.6 209.5 212.8 212.0 214.7 15
16 124.1 154.9 168.4 181.6 191.7 199.4 204.7 207.9 209.8 213.1 212.3 215.0 16
17 124.7 155.1 168.6 181.9 192.0 199.7 205.0 208.2 210.1 213.4 212.6 215.3 17
18 125.2 155.4 168.9 182.2 192.2 199.9 205.2 208.4 210.4 213.7 213.0 215.6 18
19 125.7 155.6 169.1 182.4 192.5 200.2 205.4 208.7 210.7 214.0 213.3 215.9 19
20 126.2 155.8 169.3 182.6 192.7 200.4 205.7 208.9 211.0 214.2 213.6 216.2 20
21 126.7 156.0 169.6 182.9 192.9 200.6 205.9 209.2 211.2 214.5 213.8 216.4 21
22 127.1 156.2 169.8 183.1 193.2 200.8 206.1 209.4 211.5 214.7 214.1 216.7 22
23 127.6 156.4 170.0 183.3 193.4 201.0 206.3 209.6 211.7 214.9 214.4 217.0 23
24 128.0 156.6 170.2 183.6 193.6 201.2 206.5 209.8 212.0 215.2 214.7 217.2 24
25 128.4 156.8 170.4 183.8 193.8 201.4 206.7 210.0 212.2 215.4 214.9 217.5 25
26 128.9 157.0 170.6 184.0 194.0 201.6 206.9 210.2 212.4 215.6 215.2 217.7 26
27 129.3 157.1 170.8 184.2 194.2 201.8 207.1 210.4 212.7 215.8 215.4 217.9 27
28 129.7 157.3 171.0 184.4 194.4 202.0 207.3 210.6 212.9 216.1 215.7 218.2 28
29 130.1 157.5 171.2 184.6 194.6 202.2 207.5 210.8 213.1 216.3 215.9 218.4 29
30 130.5 157.6 171.4 184.8 194.8 202.4 207.7 211.0 213.3 216.5 216.2 218.6 30
31 130.9 157.8 171.5 185.0 194.9 202.6 207.9 211.2 213.5 216.7 216.4 218.8 31
32 131.2 158.0 171.7 185.2 195.1 202.7 208.0 211.4 213.7 216.9 216.6 219.0 32
33 131.6 158.1 171.9 185.3 195.3 202.9 208.2 211.6 214.0 217.1 216.8 219.3 33
34 132.0 158.3 172.1 185.5 195.5 203.1 208.4 211.7 214.2 217.3 217.1 219.5 34
35 132.3 158.5 172.3 185.7 195.7 203.3 208.6 211.9 214.4 217.5 217.3 219.7 35
36 132.7 158.6 172.4 185.9 195.8 203.4 208.7 212.1 214.6 217.7 217.5 219.9 36
37 133.1 158.8 172.6 186.1 196.0 203.6 208.9 212.3 214.8 217.8 217.7 220.1 37
38 133.4 158.9 172.8 186.2 196.2 203.8 209.1 212.4 215.0 218.0 217.9 220.3 38
39 133.8 159.1 172.9 186.4 196.4 203.9 209.2 212.6 215.2 218.2 218.2 220.5 39
40 134.1 159.2 173.1 186.6 196.5 204.1 209.4 212.8 215.3 218.4 218.4 220.7 40
41 134.5 159.4 173.3 186.8 196.7 204.3 209.6 213.0 215.5 218.6 218.6 220.9 41
42 134.8 159.5 173.4 186.9 196.9 204.4 209.7 213.1 215.7 218.8 218.8 221.1 42
43 135.2 159.7 173.6 187.1 197.0 204.6 209.9 213.3 215.9 219.0 219.0 221.3 43
44 135.5 159.8 173.8 187.3 197.2 204.7 210.0 213.5 216.1 219.1 219.2 221.5 44
45 135.8 160.0 173.9 187.4 197.3 204.9 210.2 213.6 216.3 219.3 219.4 221.7 45
46 136.2 160.1 174.1 187.6 197.5 205.0 210.4 213.8 216.5 219.5 219.6 221.9 46
47 136.5 160.3 174.2 187.8 197.7 205.2 210.5 214.0 216.7 219.7 219.8 222.1 47
48 136.9 160.4 174.4 188.0 197.8 205.4 210.7 214.1 216.9 219.9 220.0 222.3 48
49 137.2 160.6 174.6 188.1 198.0 205.5 210.8 214.3 217.1 220.0 220.2 222.4 49
... continued on next page
97

Table C.2.4: Fall Reading School Achievement Percentiles , continued
Pct K 1 2 3 4 5 6 7 8 9 10 11 Pct
50 138 161 175 188 198 206 211 214 217 220 220 223 50
51 137.9 160.8 174.9 188.5 198.3 205.8 211.1 214.6 217.4 220.4 220.6 222.8 51
52 138.2 161.0 175.0 188.6 198.5 206.0 211.3 214.8 217.6 220.6 220.9 223.0 52
53 138.5 161.1 175.2 188.8 198.6 206.1 211.5 214.9 217.8 220.8 221.1 223.2 53
54 138.9 161.3 175.4 189.0 198.8 206.3 211.6 215.1 218.0 220.9 221.3 223.4 54
55 139.2 161.4 175.5 189.1 199.0 206.5 211.8 215.3 218.2 221.1 221.5 223.6 55
56 139.6 161.6 175.7 189.3 199.1 206.6 211.9 215.4 218.4 221.3 221.7 223.8 56
57 139.9 161.7 175.9 189.5 199.3 206.8 212.1 215.6 218.6 221.5 221.9 224.0 57
58 140.2 161.9 176.0 189.6 199.5 206.9 212.3 215.8 218.7 221.7 222.1 224.2 58
59 140.6 162.0 176.2 189.8 199.6 207.1 212.4 215.9 218.9 221.8 222.3 224.4 59
60 140.9 162.2 176.3 190.0 199.8 207.3 212.6 216.1 219.1 222.0 222.5 224.6 60
61 141.3 162.3 176.5 190.2 200.0 207.4 212.7 216.3 219.3 222.2 222.7 224.8 61
62 141.6 162.5 176.7 190.3 200.1 207.6 212.9 216.5 219.5 222.4 222.9 225.0 62
63 142.0 162.6 176.8 190.5 200.3 207.8 213.1 216.6 219.7 222.6 223.2 225.2 63
64 142.4 162.8 177.0 190.7 200.5 207.9 213.2 216.8 219.9 222.8 223.4 225.4 64
65 142.7 162.9 177.2 190.9 200.7 208.1 213.4 217.0 220.1 223.0 223.6 225.6 65
66 143.1 163.1 177.4 191.1 200.8 208.3 213.6 217.2 220.3 223.2 223.8 225.8 66
67 143.5 163.3 177.5 191.2 201.0 208.4 213.8 217.3 220.5 223.4 224.0 226.0 67
68 143.8 163.4 177.7 191.4 201.2 208.6 213.9 217.5 220.7 223.6 224.3 226.2 68
69 144.2 163.6 177.9 191.6 201.4 208.8 214.1 217.7 220.9 223.8 224.5 226.4 69
70 144.6 163.8 178.1 191.8 201.6 209.0 214.3 217.9 221.2 224.0 224.7 226.7 70
71 145.0 163.9 178.3 192.0 201.8 209.1 214.5 218.1 221.4 224.2 225.0 226.9 71
72 145.4 164.1 178.5 192.2 201.9 209.3 214.7 218.3 221.6 224.4 225.2 227.1 72
73 145.8 164.3 178.6 192.4 202.1 209.5 214.9 218.5 221.8 224.6 225.5 227.3 73
74 146.2 164.4 178.8 192.6 202.3 209.7 215.0 218.7 222.0 224.8 225.7 227.6 74
75 146.6 164.6 179.0 192.8 202.5 209.9 215.2 218.9 222.3 225.0 226.0 227.8 75
76 147.0 164.8 179.2 193.0 202.7 210.1 215.4 219.1 222.5 225.3 226.2 228.1 76
77 147.5 165.0 179.5 193.2 203.0 210.3 215.6 219.3 222.8 225.5 226.5 228.3 77
78 147.9 165.2 179.7 193.5 203.2 210.5 215.9 219.5 223.0 225.7 226.8 228.6 78
79 148.4 165.4 179.9 193.7 203.4 210.7 216.1 219.7 223.3 226.0 227.0 228.8 79
80 148.9 165.6 180.1 193.9 203.6 211.0 216.3 220.0 223.5 226.2 227.3 229.1 80
81 149.4 165.8 180.3 194.2 203.9 211.2 216.5 220.2 223.8 226.5 227.6 229.4 81
82 149.9 166.0 180.6 194.4 204.1 211.4 216.8 220.5 224.1 226.7 227.9 229.7 82
83 150.4 166.3 180.8 194.7 204.4 211.7 217.0 220.7 224.4 227.0 228.3 230.0 83
84 150.9 166.5 181.1 195.0 204.6 211.9 217.3 221.0 224.7 227.3 228.6 230.3 84
85 151.5 166.7 181.4 195.2 204.9 212.2 217.5 221.3 225.0 227.6 228.9 230.6 85
86 152.1 167.0 181.6 195.5 205.2 212.5 217.8 221.5 225.3 227.9 229.3 230.9 86
87 152.7 167.3 181.9 195.8 205.5 212.7 218.1 221.8 225.7 228.2 229.7 231.3 87
88 153.4 167.5 182.2 196.2 205.8 213.0 218.4 222.2 226.0 228.6 230.1 231.7 88
89 154.1 167.8 182.6 196.5 206.1 213.4 218.7 222.5 226.4 229.0 230.5 232.1 89
90 154.8 168.2 182.9 196.9 206.5 213.7 219.1 222.9 226.8 229.4 230.9 232.5 90
91 155.6 168.5 183.3 197.3 206.9 214.1 219.4 223.3 227.3 229.8 231.4 232.9 91
92 156.5 168.9 183.7 197.7 207.3 214.5 219.9 223.7 227.7 230.2 231.9 233.4 92
93 157.4 169.3 184.2 198.2 207.7 214.9 220.3 224.1 228.3 230.7 232.5 234.0 93
94 158.5 169.8 184.7 198.7 208.2 215.4 220.8 224.7 228.8 231.3 233.2 234.6 94
95 159.7 170.3 185.3 199.3 208.8 216.0 221.4 225.2 229.5 231.9 233.9 235.3 95
96 161.1 170.9 185.9 200.0 209.5 216.7 222.0 225.9 230.3 232.7 234.8 236.1 96
97 162.9 171.6 186.8 200.9 210.4 217.5 222.9 226.8 231.3 233.6 235.8 237.1 97
98 165.2 172.7 187.9 202.1 211.5 218.6 223.9 227.9 232.6 234.9 237.3 238.4 98
99 168.9 174.2 189.6 203.9 213.2 220.3 225.7 229.7 234.6 236.8 239.5 240.5 99
98
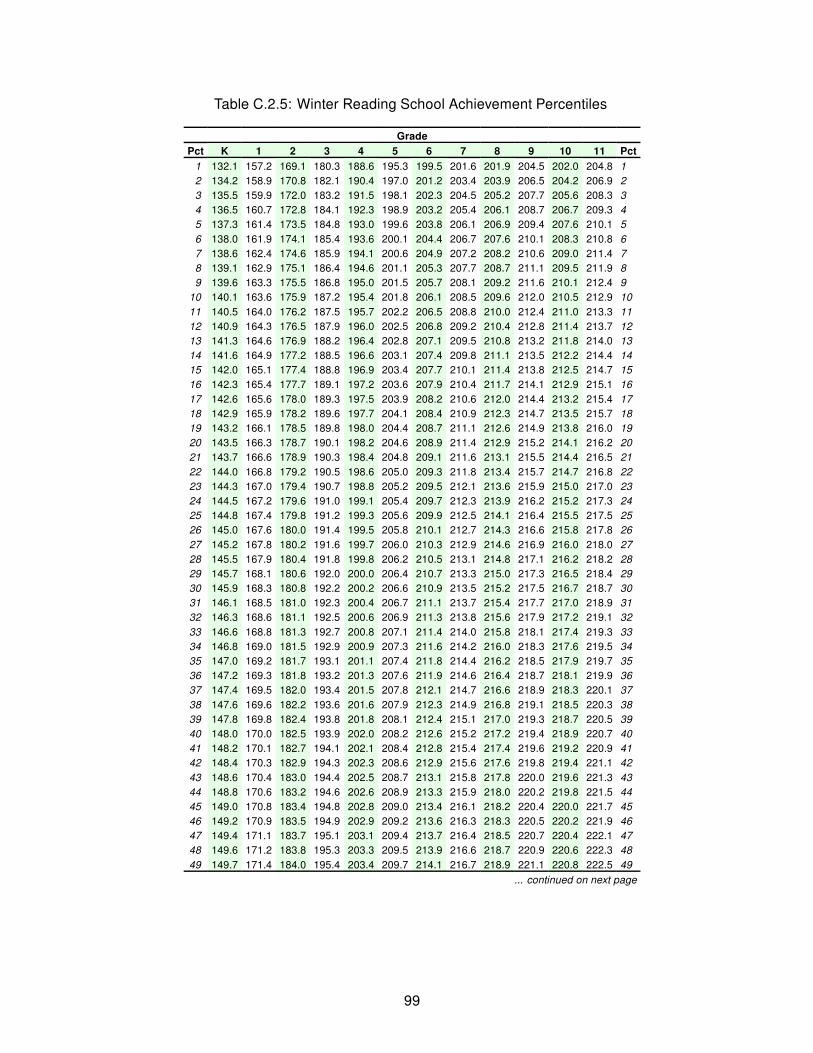
Table C.2.5: Winter Reading School Achievement Percentiles
Grade
Pct K 1 2 3 4 5 6 7 8 9 10 11 Pct
1 132.1 157.2 169.1 180.3 188.6 195.3 199.5 201.6 201.9 204.5 202.0 204.8 1
2 134.2 158.9 170.8 182.1 190.4 197.0 201.2 203.4 203.9 206.5 204.2 206.9 2
3 135.5 159.9 172.0 183.2 191.5 198.1 202.3 204.5 205.2 207.7 205.6 208.3 3
4 136.5 160.7 172.8 184.1 192.3 198.9 203.2 205.4 206.1 208.7 206.7 209.3 4
5 137.3 161.4 173.5 184.8 193.0 199.6 203.8 206.1 206.9 209.4 207.6 210.1 5
6 138.0 161.9 174.1 185.4 193.6 200.1 204.4 206.7 207.6 210.1 208.3 210.8 6
7 138.6 162.4 174.6 185.9 194.1 200.6 204.9 207.2 208.2 210.6 209.0 211.4 7
8 139.1 162.9 175.1 186.4 194.6 201.1 205.3 207.7 208.7 211.1 209.5 211.9 8
9 139.6 163.3 175.5 186.8 195.0 201.5 205.7 208.1 209.2 211.6 210.1 212.4 9
10 140.1 163.6 175.9 187.2 195.4 201.8 206.1 208.5 209.6 212.0 210.5 212.9 10
11 140.5 164.0 176.2 187.5 195.7 202.2 206.5 208.8 210.0 212.4 211.0 213.3 11
12 140.9 164.3 176.5 187.9 196.0 202.5 206.8 209.2 210.4 212.8 211.4 213.7 12
13 141.3 164.6 176.9 188.2 196.4 202.8 207.1 209.5 210.8 213.2 211.8 214.0 13
14 141.6 164.9 177.2 188.5 196.6 203.1 207.4 209.8 211.1 213.5 212.2 214.4 14
15 142.0 165.1 177.4 188.8 196.9 203.4 207.7 210.1 211.4 213.8 212.5 214.7 15
16 142.3 165.4 177.7 189.1 197.2 203.6 207.9 210.4 211.7 214.1 212.9 215.1 16
17 142.6 165.6 178.0 189.3 197.5 203.9 208.2 210.6 212.0 214.4 213.2 215.4 17
18 142.9 165.9 178.2 189.6 197.7 204.1 208.4 210.9 212.3 214.7 213.5 215.7 18
19 143.2 166.1 178.5 189.8 198.0 204.4 208.7 211.1 212.6 214.9 213.8 216.0 19
20 143.5 166.3 178.7 190.1 198.2 204.6 208.9 211.4 212.9 215.2 214.1 216.2 20
21 143.7 166.6 178.9 190.3 198.4 204.8 209.1 211.6 213.1 215.5 214.4 216.5 21
22 144.0 166.8 179.2 190.5 198.6 205.0 209.3 211.8 213.4 215.7 214.7 216.8 22
23 144.3 167.0 179.4 190.7 198.8 205.2 209.5 212.1 213.6 215.9 215.0 217.0 23
24 144.5 167.2 179.6 191.0 199.1 205.4 209.7 212.3 213.9 216.2 215.2 217.3 24
25 144.8 167.4 179.8 191.2 199.3 205.6 209.9 212.5 214.1 216.4 215.5 217.5 25
26 145.0 167.6 180.0 191.4 199.5 205.8 210.1 212.7 214.3 216.6 215.8 217.8 26
27 145.2 167.8 180.2 191.6 199.7 206.0 210.3 212.9 214.6 216.9 216.0 218.0 27
28 145.5 167.9 180.4 191.8 199.8 206.2 210.5 213.1 214.8 217.1 216.2 218.2 28
29 145.7 168.1 180.6 192.0 200.0 206.4 210.7 213.3 215.0 217.3 216.5 218.4 29
30 145.9 168.3 180.8 192.2 200.2 206.6 210.9 213.5 215.2 217.5 216.7 218.7 30
31 146.1 168.5 181.0 192.3 200.4 206.7 211.1 213.7 215.4 217.7 217.0 218.9 31
32 146.3 168.6 181.1 192.5 200.6 206.9 211.3 213.8 215.6 217.9 217.2 219.1 32
33 146.6 168.8 181.3 192.7 200.8 207.1 211.4 214.0 215.8 218.1 217.4 219.3 33
34 146.8 169.0 181.5 192.9 200.9 207.3 211.6 214.2 216.0 218.3 217.6 219.5 34
35 147.0 169.2 181.7 193.1 201.1 207.4 211.8 214.4 216.2 218.5 217.9 219.7 35
36 147.2 169.3 181.8 193.2 201.3 207.6 211.9 214.6 216.4 218.7 218.1 219.9 36
37 147.4 169.5 182.0 193.4 201.5 207.8 212.1 214.7 216.6 218.9 218.3 220.1 37
38 147.6 169.6 182.2 193.6 201.6 207.9 212.3 214.9 216.8 219.1 218.5 220.3 38
39 147.8 169.8 182.4 193.8 201.8 208.1 212.4 215.1 217.0 219.3 218.7 220.5 39
40 148.0 170.0 182.5 193.9 202.0 208.2 212.6 215.2 217.2 219.4 218.9 220.7 40
41 148.2 170.1 182.7 194.1 202.1 208.4 212.8 215.4 217.4 219.6 219.2 220.9 41
42 148.4 170.3 182.9 194.3 202.3 208.6 212.9 215.6 217.6 219.8 219.4 221.1 42
43 148.6 170.4 183.0 194.4 202.5 208.7 213.1 215.8 217.8 220.0 219.6 221.3 43
44 148.8 170.6 183.2 194.6 202.6 208.9 213.3 215.9 218.0 220.2 219.8 221.5 44
45 149.0 170.8 183.4 194.8 202.8 209.0 213.4 216.1 218.2 220.4 220.0 221.7 45
46 149.2 170.9 183.5 194.9 202.9 209.2 213.6 216.3 218.3 220.5 220.2 221.9 46
47 149.4 171.1 183.7 195.1 203.1 209.4 213.7 216.4 218.5 220.7 220.4 222.1 47
48 149.6 171.2 183.8 195.3 203.3 209.5 213.9 216.6 218.7 220.9 220.6 222.3 48
49 149.7 171.4 184.0 195.4 203.4 209.7 214.1 216.7 218.9 221.1 220.8 222.5 49
... continued on next page
99

Table C.2.5: Winter Reading School Achievement Percentiles , continued
Pct K 1 2 3 4 5 6 7 8 9 10 11 Pct
50 150 172 184 196 204 210 214 217 219 221 221 223 50
51 150.1 171.7 184.3 195.8 203.8 210.0 214.4 217.1 219.3 221.4 221.2 222.9 51
52 150.3 171.8 184.5 195.9 203.9 210.1 214.5 217.2 219.5 221.6 221.4 223.1 52
53 150.5 172.0 184.7 196.1 204.1 210.3 214.7 217.4 219.6 221.8 221.6 223.3 53
54 150.7 172.2 184.8 196.3 204.2 210.5 214.8 217.6 219.8 222.0 221.8 223.5 54
55 150.9 172.3 185.0 196.4 204.4 210.6 215.0 217.7 220.0 222.2 222.0 223.7 55
56 151.1 172.5 185.2 196.6 204.6 210.8 215.2 217.9 220.2 222.4 222.2 223.8 56
57 151.3 172.6 185.3 196.8 204.7 210.9 215.3 218.1 220.4 222.5 222.5 224.0 57
58 151.5 172.8 185.5 196.9 204.9 211.1 215.5 218.2 220.6 222.7 222.7 224.2 58
59 151.7 172.9 185.6 197.1 205.1 211.2 215.6 218.4 220.8 222.9 222.9 224.4 59
60 151.9 173.1 185.8 197.3 205.2 211.4 215.8 218.6 221.0 223.1 223.1 224.6 60
61 152.1 173.3 186.0 197.4 205.4 211.6 216.0 218.7 221.2 223.3 223.3 224.8 61
62 152.3 173.4 186.2 197.6 205.6 211.7 216.1 218.9 221.3 223.5 223.5 225.0 62
63 152.5 173.6 186.3 197.8 205.7 211.9 216.3 219.1 221.5 223.7 223.7 225.2 63
64 152.7 173.7 186.5 198.0 205.9 212.1 216.5 219.3 221.7 223.9 223.9 225.4 64
65 152.9 173.9 186.7 198.1 206.1 212.2 216.6 219.4 221.9 224.0 224.2 225.6 65
66 153.1 174.1 186.8 198.3 206.2 212.4 216.8 219.6 222.1 224.2 224.4 225.9 66
67 153.3 174.2 187.0 198.5 206.4 212.6 217.0 219.8 222.3 224.4 224.6 226.1 67
68 153.5 174.4 187.2 198.7 206.6 212.7 217.2 220.0 222.5 224.6 224.8 226.3 68
69 153.8 174.6 187.4 198.9 206.8 212.9 217.3 220.2 222.8 224.8 225.1 226.5 69
70 154.0 174.8 187.6 199.1 207.0 213.1 217.5 220.4 223.0 225.0 225.3 226.7 70
71 154.2 174.9 187.8 199.2 207.2 213.3 217.7 220.5 223.2 225.3 225.5 226.9 71
72 154.4 175.1 188.0 199.4 207.3 213.5 217.9 220.7 223.4 225.5 225.8 227.2 72
73 154.7 175.3 188.1 199.6 207.5 213.6 218.1 220.9 223.6 225.7 226.0 227.4 73
74 154.9 175.5 188.3 199.8 207.7 213.8 218.3 221.1 223.8 225.9 226.3 227.6 74
75 155.1 175.7 188.5 200.0 207.9 214.0 218.5 221.3 224.1 226.1 226.5 227.9 75
76 155.4 175.9 188.8 200.3 208.1 214.2 218.7 221.6 224.3 226.4 226.8 228.1 76
77 155.6 176.1 189.0 200.5 208.3 214.4 218.9 221.8 224.6 226.6 227.1 228.4 77
78 155.9 176.3 189.2 200.7 208.6 214.6 219.1 222.0 224.8 226.8 227.3 228.6 78
79 156.1 176.5 189.4 200.9 208.8 214.9 219.3 222.2 225.1 227.1 227.6 228.9 79
80 156.4 176.7 189.6 201.1 209.0 215.1 219.5 222.4 225.3 227.3 227.9 229.1 80
81 156.7 176.9 189.9 201.4 209.2 215.3 219.8 222.7 225.6 227.6 228.2 229.4 81
82 157.0 177.2 190.1 201.6 209.5 215.5 220.0 222.9 225.9 227.9 228.5 229.7 82
83 157.3 177.4 190.4 201.9 209.7 215.8 220.2 223.2 226.1 228.1 228.8 230.0 83
84 157.6 177.7 190.6 202.2 210.0 216.0 220.5 223.4 226.4 228.4 229.1 230.3 84
85 157.9 177.9 190.9 202.4 210.3 216.3 220.8 223.7 226.8 228.7 229.5 230.6 85
86 158.2 178.2 191.2 202.7 210.5 216.6 221.0 224.0 227.1 229.1 229.8 231.0 86
87 158.6 178.5 191.5 203.0 210.8 216.8 221.3 224.3 227.4 229.4 230.2 231.3 87
88 159.0 178.8 191.8 203.3 211.1 217.2 221.6 224.6 227.8 229.7 230.6 231.7 88
89 159.4 179.1 192.1 203.7 211.5 217.5 222.0 225.0 228.2 230.1 231.0 232.1 89
90 159.8 179.4 192.5 204.0 211.8 217.8 222.3 225.3 228.6 230.5 231.5 232.5 90
91 160.2 179.8 192.9 204.4 212.2 218.2 222.7 225.7 229.0 230.9 232.0 233.0 91
92 160.7 180.2 193.3 204.9 212.6 218.6 223.1 226.1 229.5 231.4 232.5 233.5 92
93 161.3 180.6 193.7 205.3 213.1 219.0 223.5 226.6 230.0 231.9 233.1 234.0 93
94 161.9 181.1 194.3 205.8 213.6 219.5 224.0 227.1 230.6 232.5 233.7 234.6 94
95 162.6 181.7 194.8 206.4 214.2 220.1 224.6 227.7 231.2 233.1 234.5 235.3 95
96 163.4 182.3 195.5 207.1 214.9 220.7 225.3 228.4 232.0 233.9 235.3 236.1 96
97 164.4 183.1 196.4 208.0 215.7 221.6 226.1 229.3 233.0 234.8 236.4 237.1 97
98 165.7 184.2 197.5 209.1 216.8 222.6 227.2 230.4 234.3 236.1 237.8 238.5 98
99 167.8 185.9 199.3 210.9 218.6 224.3 228.9 232.2 236.3 238.0 240.0 240.5 99
100

Table C.2.6: Spring Reading School Achievement Percentiles
Grade
Pct K 1 2 3 4 5 6 7 8 9 10 11 Pct
1 143.4 162.0 173.0 183.2 190.8 197.1 200.8 202.6 202.7 204.6 201.7 203.9 1
2 145.0 163.8 174.8 185.0 192.6 198.8 202.5 204.4 204.7 206.6 204.0 206.1 2
3 146.1 165.0 176.0 186.1 193.7 199.9 203.6 205.6 206.0 207.9 205.4 207.4 3
4 146.9 165.8 176.9 187.0 194.6 200.7 204.5 206.5 207.0 208.9 206.5 208.5 4
5 147.5 166.6 177.6 187.7 195.3 201.4 205.2 207.2 207.8 209.7 207.4 209.3 5
6 148.1 167.2 178.2 188.3 195.8 202.0 205.7 207.8 208.4 210.3 208.2 210.0 6
7 148.6 167.7 178.7 188.8 196.4 202.5 206.2 208.3 209.0 210.9 208.8 210.7 7
8 149.0 168.1 179.2 189.3 196.8 202.9 206.7 208.8 209.6 211.5 209.4 211.2 8
9 149.4 168.6 179.6 189.7 197.2 203.3 207.1 209.2 210.0 211.9 210.0 211.7 9
10 149.8 169.0 180.0 190.1 197.6 203.7 207.5 209.6 210.5 212.4 210.5 212.2 10
11 150.1 169.3 180.4 190.5 198.0 204.0 207.9 210.0 210.9 212.8 210.9 212.6 11
12 150.4 169.7 180.8 190.8 198.3 204.4 208.2 210.3 211.3 213.2 211.4 213.0 12
13 150.7 170.0 181.1 191.1 198.6 204.7 208.5 210.6 211.6 213.5 211.8 213.4 13
14 151.0 170.3 181.4 191.5 198.9 205.0 208.8 210.9 212.0 213.9 212.1 213.8 14
15 151.3 170.6 181.7 191.7 199.2 205.2 209.1 211.2 212.3 214.2 212.5 214.1 15
16 151.5 170.9 182.0 192.0 199.5 205.5 209.3 211.5 212.6 214.5 212.9 214.5 16
17 151.8 171.2 182.3 192.3 199.7 205.8 209.6 211.8 212.9 214.8 213.2 214.8 17
18 152.0 171.4 182.5 192.5 200.0 206.0 209.9 212.0 213.2 215.1 213.5 215.1 18
19 152.2 171.7 182.8 192.8 200.2 206.2 210.1 212.3 213.5 215.4 213.8 215.4 19
20 152.5 171.9 183.0 193.0 200.5 206.5 210.3 212.5 213.8 215.6 214.1 215.7 20
21 152.7 172.1 183.2 193.3 200.7 206.7 210.6 212.8 214.0 215.9 214.4 216.0 21
22 152.9 172.4 183.5 193.5 200.9 206.9 210.8 213.0 214.3 216.1 214.7 216.2 22
23 153.1 172.6 183.7 193.7 201.1 207.1 211.0 213.2 214.5 216.4 215.0 216.5 23
24 153.3 172.8 183.9 193.9 201.3 207.3 211.2 213.4 214.8 216.6 215.3 216.7 24
25 153.5 173.0 184.1 194.1 201.6 207.5 211.4 213.6 215.0 216.9 215.5 217.0 25
26 153.7 173.2 184.3 194.4 201.8 207.7 211.6 213.9 215.3 217.1 215.8 217.2 26
27 153.9 173.4 184.6 194.6 202.0 207.9 211.8 214.1 215.5 217.3 216.1 217.5 27
28 154.0 173.6 184.8 194.8 202.1 208.1 212.0 214.3 215.7 217.5 216.3 217.7 28
29 154.2 173.8 185.0 195.0 202.3 208.3 212.2 214.5 215.9 217.8 216.6 218.0 29
30 154.4 174.0 185.2 195.1 202.5 208.5 212.4 214.7 216.1 218.0 216.8 218.2 30
31 154.6 174.2 185.3 195.3 202.7 208.7 212.6 214.8 216.4 218.2 217.0 218.4 31
32 154.8 174.4 185.5 195.5 202.9 208.8 212.7 215.0 216.6 218.4 217.3 218.6 32
33 154.9 174.6 185.7 195.7 203.1 209.0 212.9 215.2 216.8 218.6 217.5 218.9 33
34 155.1 174.8 185.9 195.9 203.3 209.2 213.1 215.4 217.0 218.8 217.7 219.1 34
35 155.3 174.9 186.1 196.1 203.4 209.4 213.3 215.6 217.2 219.0 218.0 219.3 35
36 155.4 175.1 186.3 196.2 203.6 209.5 213.4 215.8 217.4 219.2 218.2 219.5 36
37 155.6 175.3 186.5 196.4 203.8 209.7 213.6 215.9 217.6 219.4 218.4 219.7 37
38 155.7 175.5 186.6 196.6 203.9 209.9 213.8 216.1 217.8 219.6 218.6 219.9 38
39 155.9 175.7 186.8 196.8 204.1 210.0 214.0 216.3 218.0 219.8 218.8 220.1 39
40 156.1 175.8 187.0 196.9 204.3 210.2 214.1 216.5 218.2 220.0 219.1 220.3 40
41 156.2 176.0 187.2 197.1 204.5 210.4 214.3 216.6 218.4 220.2 219.3 220.5 41
42 156.4 176.2 187.3 197.3 204.6 210.5 214.5 216.8 218.6 220.4 219.5 220.7 42
43 156.5 176.3 187.5 197.5 204.8 210.7 214.6 217.0 218.8 220.6 219.7 220.9 43
44 156.7 176.5 187.7 197.6 204.9 210.8 214.8 217.1 218.9 220.8 219.9 221.1 44
45 156.8 176.7 187.8 197.8 205.1 211.0 214.9 217.3 219.1 220.9 220.1 221.3 45
46 157.0 176.8 188.0 198.0 205.3 211.2 215.1 217.5 219.3 221.1 220.3 221.5 46
47 157.2 177.0 188.2 198.1 205.4 211.3 215.3 217.7 219.5 221.3 220.6 221.7 47
48 157.3 177.2 188.4 198.3 205.6 211.5 215.4 217.8 219.7 221.5 220.8 221.9 48
49 157.5 177.4 188.5 198.5 205.8 211.6 215.6 218.0 219.9 221.7 221.0 222.1 49
... continued on next page
101
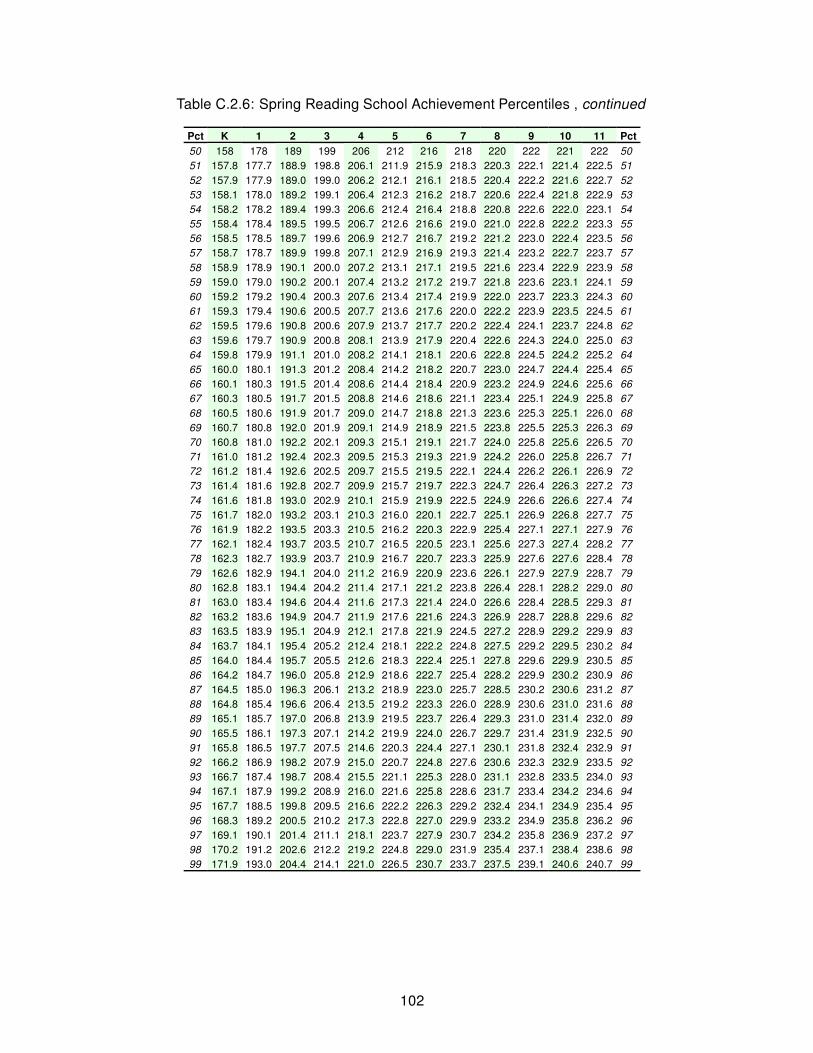
Table C.2.6: Spring Reading School Achievement Percentiles , continued
Pct K 1 2 3 4 5 6 7 8 9 10 11 Pct
50 158 178 189 199 206 212 216 218 220 222 221 222 50
51 157.8 177.7 188.9 198.8 206.1 211.9 215.9 218.3 220.3 222.1 221.4 222.5 51
52 157.9 177.9 189.0 199.0 206.2 212.1 216.1 218.5 220.4 222.2 221.6 222.7 52
53 158.1 178.0 189.2 199.1 206.4 212.3 216.2 218.7 220.6 222.4 221.8 222.9 53
54 158.2 178.2 189.4 199.3 206.6 212.4 216.4 218.8 220.8 222.6 222.0 223.1 54
55 158.4 178.4 189.5 199.5 206.7 212.6 216.6 219.0 221.0 222.8 222.2 223.3 55
56 158.5 178.5 189.7 199.6 206.9 212.7 216.7 219.2 221.2 223.0 222.4 223.5 56
57 158.7 178.7 189.9 199.8 207.1 212.9 216.9 219.3 221.4 223.2 222.7 223.7 57
58 158.9 178.9 190.1 200.0 207.2 213.1 217.1 219.5 221.6 223.4 222.9 223.9 58
59 159.0 179.0 190.2 200.1 207.4 213.2 217.2 219.7 221.8 223.6 223.1 224.1 59
60 159.2 179.2 190.4 200.3 207.6 213.4 217.4 219.9 222.0 223.7 223.3 224.3 60
61 159.3 179.4 190.6 200.5 207.7 213.6 217.6 220.0 222.2 223.9 223.5 224.5 61
62 159.5 179.6 190.8 200.6 207.9 213.7 217.7 220.2 222.4 224.1 223.7 224.8 62
63 159.6 179.7 190.9 200.8 208.1 213.9 217.9 220.4 222.6 224.3 224.0 225.0 63
64 159.8 179.9 191.1 201.0 208.2 214.1 218.1 220.6 222.8 224.5 224.2 225.2 64
65 160.0 180.1 191.3 201.2 208.4 214.2 218.2 220.7 223.0 224.7 224.4 225.4 65
66 160.1 180.3 191.5 201.4 208.6 214.4 218.4 220.9 223.2 224.9 224.6 225.6 66
67 160.3 180.5 191.7 201.5 208.8 214.6 218.6 221.1 223.4 225.1 224.9 225.8 67
68 160.5 180.6 191.9 201.7 209.0 214.7 218.8 221.3 223.6 225.3 225.1 226.0 68
69 160.7 180.8 192.0 201.9 209.1 214.9 218.9 221.5 223.8 225.5 225.3 226.3 69
70 160.8 181.0 192.2 202.1 209.3 215.1 219.1 221.7 224.0 225.8 225.6 226.5 70
71 161.0 181.2 192.4 202.3 209.5 215.3 219.3 221.9 224.2 226.0 225.8 226.7 71
72 161.2 181.4 192.6 202.5 209.7 215.5 219.5 222.1 224.4 226.2 226.1 226.9 72
73 161.4 181.6 192.8 202.7 209.9 215.7 219.7 222.3 224.7 226.4 226.3 227.2 73
74 161.6 181.8 193.0 202.9 210.1 215.9 219.9 222.5 224.9 226.6 226.6 227.4 74
75 161.7 182.0 193.2 203.1 210.3 216.0 220.1 222.7 225.1 226.9 226.8 227.7 75
76 161.9 182.2 193.5 203.3 210.5 216.2 220.3 222.9 225.4 227.1 227.1 227.9 76
77 162.1 182.4 193.7 203.5 210.7 216.5 220.5 223.1 225.6 227.3 227.4 228.2 77
78 162.3 182.7 193.9 203.7 210.9 216.7 220.7 223.3 225.9 227.6 227.6 228.4 78
79 162.6 182.9 194.1 204.0 211.2 216.9 220.9 223.6 226.1 227.9 227.9 228.7 79
80 162.8 183.1 194.4 204.2 211.4 217.1 221.2 223.8 226.4 228.1 228.2 229.0 80
81 163.0 183.4 194.6 204.4 211.6 217.3 221.4 224.0 226.6 228.4 228.5 229.3 81
82 163.2 183.6 194.9 204.7 211.9 217.6 221.6 224.3 226.9 228.7 228.8 229.6 82
83 163.5 183.9 195.1 204.9 212.1 217.8 221.9 224.5 227.2 228.9 229.2 229.9 83
84 163.7 184.1 195.4 205.2 212.4 218.1 222.2 224.8 227.5 229.2 229.5 230.2 84
85 164.0 184.4 195.7 205.5 212.6 218.3 222.4 225.1 227.8 229.6 229.9 230.5 85
86 164.2 184.7 196.0 205.8 212.9 218.6 222.7 225.4 228.2 229.9 230.2 230.9 86
87 164.5 185.0 196.3 206.1 213.2 218.9 223.0 225.7 228.5 230.2 230.6 231.2 87
88 164.8 185.4 196.6 206.4 213.5 219.2 223.3 226.0 228.9 230.6 231.0 231.6 88
89 165.1 185.7 197.0 206.8 213.9 219.5 223.7 226.4 229.3 231.0 231.4 232.0 89
90 165.5 186.1 197.3 207.1 214.2 219.9 224.0 226.7 229.7 231.4 231.9 232.5 90
91 165.8 186.5 197.7 207.5 214.6 220.3 224.4 227.1 230.1 231.8 232.4 232.9 91
92 166.2 186.9 198.2 207.9 215.0 220.7 224.8 227.6 230.6 232.3 232.9 233.5 92
93 166.7 187.4 198.7 208.4 215.5 221.1 225.3 228.0 231.1 232.8 233.5 234.0 93
94 167.1 187.9 199.2 208.9 216.0 221.6 225.8 228.6 231.7 233.4 234.2 234.6 94
95 167.7 188.5 199.8 209.5 216.6 222.2 226.3 229.2 232.4 234.1 234.9 235.4 95
96 168.3 189.2 200.5 210.2 217.3 222.8 227.0 229.9 233.2 234.9 235.8 236.2 96
97 169.1 190.1 201.4 211.1 218.1 223.7 227.9 230.7 234.2 235.8 236.9 237.2 97
98 170.2 191.2 202.6 212.2 219.2 224.8 229.0 231.9 235.4 237.1 238.4 238.6 98
99 171.9 193.0 204.4 214.1 221.0 226.5 230.7 233.7 237.5 239.1 240.6 240.7 99
102
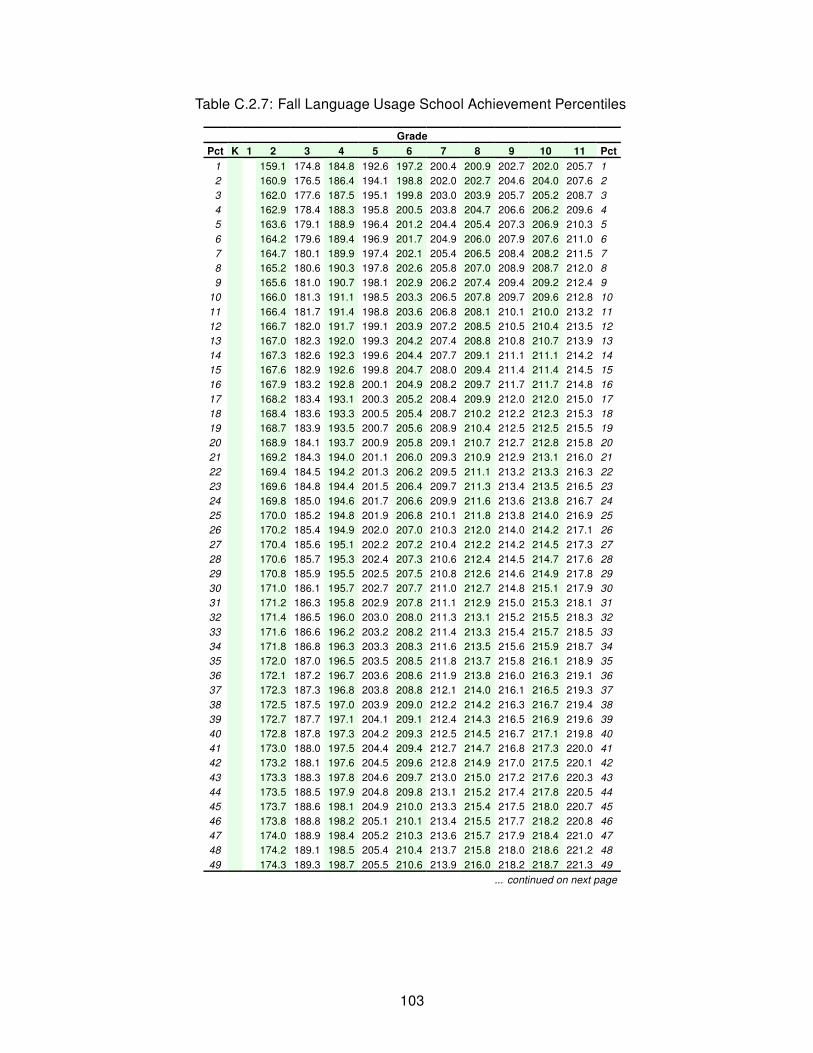
Table C.2.7: Fall Language Usage School Achievement Percentiles
Grade
Pct K 1 2 3 4 5 6 7 8 9 10 11 Pct
1 159.1 174.8 184.8 192.6 197.2 200.4 200.9 202.7 202.0 205.7 1
2 160.9 176.5 186.4 194.1 198.8 202.0 202.7 204.6 204.0 207.6 2
3 162.0 177.6 187.5 195.1 199.8 203.0 203.9 205.7 205.2 208.7 3
4 162.9 178.4 188.3 195.8 200.5 203.8 204.7 206.6 206.2 209.6 4
5 163.6 179.1 188.9 196.4 201.2 204.4 205.4 207.3 206.9 210.3 5
6 164.2 179.6 189.4 196.9 201.7 204.9 206.0 207.9 207.6 211.0 6
7 164.7 180.1 189.9 197.4 202.1 205.4 206.5 208.4 208.2 211.5 7
8 165.2 180.6 190.3 197.8 202.6 205.8 207.0 208.9 208.7 212.0 8
9 165.6 181.0 190.7 198.1 202.9 206.2 207.4 209.4 209.2 212.4 9
10 166.0 181.3 191.1 198.5 203.3 206.5 207.8 209.7 209.6 212.8 10
11 166.4 181.7 191.4 198.8 203.6 206.8 208.1 210.1 210.0 213.2 11
12 166.7 182.0 191.7 199.1 203.9 207.2 208.5 210.5 210.4 213.5 12
13 167.0 182.3 192.0 199.3 204.2 207.4 208.8 210.8 210.7 213.9 13
14 167.3 182.6 192.3 199.6 204.4 207.7 209.1 211.1 211.1 214.2 14
15 167.6 182.9 192.6 199.8 204.7 208.0 209.4 211.4 211.4 214.5 15
16 167.9 183.2 192.8 200.1 204.9 208.2 209.7 211.7 211.7 214.8 16
17 168.2 183.4 193.1 200.3 205.2 208.4 209.9 212.0 212.0 215.0 17
18 168.4 183.6 193.3 200.5 205.4 208.7 210.2 212.2 212.3 215.3 18
19 168.7 183.9 193.5 200.7 205.6 208.9 210.4 212.5 212.5 215.5 19
20 168.9 184.1 193.7 200.9 205.8 209.1 210.7 212.7 212.8 215.8 20
21 169.2 184.3 194.0 201.1 206.0 209.3 210.9 212.9 213.1 216.0 21
22 169.4 184.5 194.2 201.3 206.2 209.5 211.1 213.2 213.3 216.3 22
23 169.6 184.8 194.4 201.5 206.4 209.7 211.3 213.4 213.5 216.5 23
24 169.8 185.0 194.6 201.7 206.6 209.9 211.6 213.6 213.8 216.7 24
25 170.0 185.2 194.8 201.9 206.8 210.1 211.8 213.8 214.0 216.9 25
26 170.2 185.4 194.9 202.0 207.0 210.3 212.0 214.0 214.2 217.1 26
27 170.4 185.6 195.1 202.2 207.2 210.4 212.2 214.2 214.5 217.3 27
28 170.6 185.7 195.3 202.4 207.3 210.6 212.4 214.5 214.7 217.6 28
29 170.8 185.9 195.5 202.5 207.5 210.8 212.6 214.6 214.9 217.8 29
30 171.0 186.1 195.7 202.7 207.7 211.0 212.7 214.8 215.1 217.9 30
31 171.2 186.3 195.8 202.9 207.8 211.1 212.9 215.0 215.3 218.1 31
32 171.4 186.5 196.0 203.0 208.0 211.3 213.1 215.2 215.5 218.3 32
33 171.6 186.6 196.2 203.2 208.2 211.4 213.3 215.4 215.7 218.5 33
34 171.8 186.8 196.3 203.3 208.3 211.6 213.5 215.6 215.9 218.7 34
35 172.0 187.0 196.5 203.5 208.5 211.8 213.7 215.8 216.1 218.9 35
36 172.1 187.2 196.7 203.6 208.6 211.9 213.8 216.0 216.3 219.1 36
37 172.3 187.3 196.8 203.8 208.8 212.1 214.0 216.1 216.5 219.3 37
38 172.5 187.5 197.0 203.9 209.0 212.2 214.2 216.3 216.7 219.4 38
39 172.7 187.7 197.1 204.1 209.1 212.4 214.3 216.5 216.9 219.6 39
40 172.8 187.8 197.3 204.2 209.3 212.5 214.5 216.7 217.1 219.8 40
41 173.0 188.0 197.5 204.4 209.4 212.7 214.7 216.8 217.3 220.0 41
42 173.2 188.1 197.6 204.5 209.6 212.8 214.9 217.0 217.5 220.1 42
43 173.3 188.3 197.8 204.6 209.7 213.0 215.0 217.2 217.6 220.3 43
44 173.5 188.5 197.9 204.8 209.8 213.1 215.2 217.4 217.8 220.5 44
45 173.7 188.6 198.1 204.9 210.0 213.3 215.4 217.5 218.0 220.7 45
46 173.8 188.8 198.2 205.1 210.1 213.4 215.5 217.7 218.2 220.8 46
47 174.0 188.9 198.4 205.2 210.3 213.6 215.7 217.9 218.4 221.0 47
48 174.2 189.1 198.5 205.4 210.4 213.7 215.8 218.0 218.6 221.2 48
49 174.3 189.3 198.7 205.5 210.6 213.9 216.0 218.2 218.7 221.3 49
... continued on next page
103

Table C.2.7: Fall Language Usage School Achievement Percentiles , continued
Pct K 1 2 3 4 5 6 7 8 9 10 11 Pct
50 175 189 199 206 211 214 216 218 219 222 50
51 174.7 189.6 199.0 205.8 210.9 214.2 216.3 218.5 219.1 221.7 51
52 174.8 189.7 199.1 205.9 211.0 214.3 216.5 218.7 219.3 221.9 52
53 175.0 189.9 199.3 206.1 211.2 214.5 216.7 218.9 219.5 222.0 53
54 175.2 190.0 199.4 206.2 211.3 214.6 216.8 219.0 219.7 222.2 54
55 175.3 190.2 199.6 206.3 211.5 214.8 217.0 219.2 219.8 222.4 55
56 175.5 190.4 199.7 206.5 211.6 214.9 217.2 219.4 220.0 222.5 56
57 175.7 190.5 199.9 206.6 211.8 215.0 217.3 219.6 220.2 222.7 57
58 175.9 190.7 200.0 206.8 211.9 215.2 217.5 219.7 220.4 222.9 58
59 176.0 190.8 200.2 206.9 212.1 215.3 217.7 219.9 220.6 223.1 59
60 176.2 191.0 200.4 207.1 212.2 215.5 217.8 220.1 220.8 223.2 60
61 176.4 191.2 200.5 207.2 212.4 215.7 218.0 220.3 221.0 223.4 61
62 176.5 191.3 200.7 207.3 212.5 215.8 218.2 220.4 221.2 223.6 62
63 176.7 191.5 200.8 207.5 212.7 216.0 218.3 220.6 221.3 223.8 63
64 176.9 191.7 201.0 207.6 212.8 216.1 218.5 220.8 221.5 223.9 64
65 177.1 191.8 201.2 207.8 213.0 216.3 218.7 221.0 221.7 224.1 65
66 177.2 192.0 201.3 207.9 213.1 216.4 218.9 221.1 221.9 224.3 66
67 177.4 192.2 201.5 208.1 213.3 216.6 219.1 221.3 222.1 224.5 67
68 177.6 192.4 201.7 208.3 213.4 216.8 219.2 221.5 222.3 224.7 68
69 177.8 192.5 201.8 208.4 213.6 216.9 219.4 221.7 222.5 224.9 69
70 178.0 192.7 202.0 208.6 213.8 217.1 219.6 221.9 222.8 225.1 70
71 178.2 192.9 202.2 208.7 213.9 217.3 219.8 222.1 223.0 225.3 71
72 178.4 193.1 202.3 208.9 214.1 217.4 220.0 222.3 223.2 225.5 72
73 178.6 193.3 202.5 209.1 214.3 217.6 220.2 222.5 223.4 225.7 73
74 178.8 193.5 202.7 209.2 214.5 217.8 220.4 222.7 223.6 225.9 74
75 179.0 193.7 202.9 209.4 214.7 218.0 220.6 222.9 223.8 226.1 75
76 179.2 193.9 203.1 209.6 214.8 218.1 220.8 223.1 224.1 226.3 76
77 179.4 194.1 203.3 209.8 215.0 218.3 221.0 223.3 224.3 226.5 77
78 179.6 194.3 203.5 210.0 215.2 218.5 221.2 223.6 224.6 226.8 78
79 179.9 194.5 203.7 210.1 215.4 218.7 221.5 223.8 224.8 227.0 79
80 180.1 194.7 203.9 210.3 215.6 218.9 221.7 224.0 225.1 227.2 80
81 180.3 194.9 204.1 210.5 215.8 219.1 221.9 224.3 225.3 227.5 81
82 180.6 195.2 204.4 210.8 216.1 219.4 222.2 224.5 225.6 227.7 82
83 180.8 195.4 204.6 211.0 216.3 219.6 222.4 224.8 225.9 228.0 83
84 181.1 195.7 204.8 211.2 216.5 219.8 222.7 225.1 226.2 228.3 84
85 181.4 195.9 205.1 211.4 216.8 220.1 223.0 225.3 226.5 228.6 85
86 181.7 196.2 205.4 211.7 217.0 220.3 223.2 225.6 226.8 228.8 86
87 182.0 196.5 205.6 211.9 217.3 220.6 223.5 226.0 227.1 229.2 87
88 182.3 196.8 205.9 212.2 217.6 220.9 223.9 226.3 227.5 229.5 88
89 182.6 197.1 206.2 212.5 217.9 221.2 224.2 226.6 227.9 229.8 89
90 183.0 197.5 206.6 212.8 218.2 221.5 224.6 227.0 228.3 230.2 90
91 183.4 197.8 206.9 213.1 218.5 221.9 224.9 227.4 228.7 230.6 91
92 183.8 198.3 207.3 213.5 218.9 222.2 225.4 227.8 229.2 231.1 92
93 184.3 198.7 207.7 213.9 219.3 222.6 225.8 228.3 229.7 231.5 93
94 184.8 199.2 208.2 214.3 219.8 223.1 226.3 228.8 230.3 232.1 94
95 185.4 199.8 208.8 214.8 220.3 223.6 226.9 229.4 230.9 232.7 95
96 186.1 200.4 209.4 215.4 220.9 224.3 227.6 230.2 231.7 233.4 96
97 187.0 201.2 210.2 216.2 221.7 225.0 228.5 231.0 232.6 234.3 97
98 188.1 202.3 211.2 217.1 222.7 226.0 229.6 232.2 233.9 235.5 98
99 189.9 204.1 212.9 218.7 224.3 227.6 231.4 234.0 235.9 237.3 99
104

Table C.2.8: Winter Language Usage School Achievement Percentiles
Grade
Pct K 1 2 3 4 5 6 7 8 9 10 11 Pct
1 169.5 182.5 190.7 196.8 200.4 202.8 202.6 203.9 202.7 206.2 1
2 171.3 184.2 192.3 198.3 202.0 204.4 204.4 205.8 204.7 208.1 2
3 172.5 185.3 193.3 199.3 203.0 205.4 205.5 206.9 206.0 209.3 3
4 173.3 186.1 194.1 200.0 203.8 206.2 206.4 207.8 206.9 210.1 4
5 174.0 186.7 194.7 200.6 204.4 206.8 207.1 208.6 207.7 210.9 5
6 174.6 187.3 195.2 201.1 204.9 207.4 207.7 209.2 208.3 211.5 6
7 175.2 187.7 195.7 201.5 205.4 207.8 208.2 209.7 208.9 212.0 7
8 175.6 188.2 196.1 201.9 205.8 208.2 208.7 210.2 209.4 212.5 8
9 176.1 188.6 196.5 202.3 206.2 208.6 209.1 210.6 209.9 212.9 9
10 176.4 188.9 196.8 202.6 206.5 209.0 209.5 211.0 210.3 213.4 10
11 176.8 189.3 197.2 202.9 206.8 209.3 209.9 211.4 210.7 213.7 11
12 177.2 189.6 197.5 203.2 207.1 209.6 210.3 211.7 211.1 214.1 12
13 177.5 189.9 197.8 203.4 207.4 209.9 210.6 212.1 211.5 214.4 13
14 177.8 190.2 198.0 203.7 207.7 210.2 210.9 212.4 211.8 214.7 14
15 178.1 190.5 198.3 203.9 207.9 210.4 211.2 212.7 212.1 215.0 15
16 178.3 190.7 198.5 204.2 208.2 210.7 211.5 213.0 212.4 215.3 16
17 178.6 191.0 198.8 204.4 208.4 210.9 211.7 213.2 212.7 215.6 17
18 178.9 191.2 199.0 204.6 208.6 211.1 212.0 213.5 213.0 215.9 18
19 179.1 191.4 199.2 204.8 208.8 211.3 212.2 213.8 213.3 216.1 19
20 179.4 191.7 199.4 205.0 209.1 211.6 212.5 214.0 213.6 216.4 20
21 179.6 191.9 199.6 205.2 209.3 211.8 212.7 214.2 213.8 216.6 21
22 179.8 192.1 199.8 205.4 209.5 212.0 212.9 214.5 214.1 216.8 22
23 180.0 192.3 200.0 205.6 209.7 212.2 213.2 214.7 214.3 217.1 23
24 180.3 192.5 200.2 205.8 209.8 212.4 213.4 214.9 214.6 217.3 24
25 180.5 192.7 200.4 206.0 210.0 212.5 213.6 215.1 214.8 217.5 25
26 180.7 192.9 200.6 206.1 210.2 212.7 213.8 215.4 215.0 217.7 26
27 180.9 193.1 200.8 206.3 210.4 212.9 214.0 215.6 215.2 217.9 27
28 181.1 193.2 201.0 206.5 210.6 213.1 214.2 215.8 215.5 218.1 28
29 181.3 193.4 201.1 206.6 210.7 213.3 214.4 216.0 215.7 218.3 29
30 181.5 193.6 201.3 206.8 210.9 213.4 214.6 216.2 215.9 218.5 30
31 181.7 193.8 201.5 206.9 211.1 213.6 214.8 216.4 216.1 218.7 31
32 181.8 194.0 201.6 207.1 211.2 213.8 215.0 216.5 216.3 218.9 32
33 182.0 194.1 201.8 207.3 211.4 213.9 215.1 216.7 216.5 219.1 33
34 182.2 194.3 202.0 207.4 211.5 214.1 215.3 216.9 216.7 219.3 34
35 182.4 194.5 202.1 207.6 211.7 214.2 215.5 217.1 216.9 219.5 35
36 182.6 194.6 202.3 207.7 211.9 214.4 215.7 217.3 217.1 219.7 36
37 182.7 194.8 202.4 207.9 212.0 214.6 215.9 217.5 217.3 219.8 37
38 182.9 195.0 202.6 208.0 212.2 214.7 216.0 217.7 217.5 220.0 38
39 183.1 195.1 202.8 208.2 212.3 214.9 216.2 217.8 217.7 220.2 39
40 183.3 195.3 202.9 208.3 212.5 215.0 216.4 218.0 217.9 220.4 40
41 183.4 195.4 203.1 208.4 212.6 215.2 216.6 218.2 218.1 220.6 41
42 183.6 195.6 203.2 208.6 212.8 215.3 216.7 218.4 218.2 220.7 42
43 183.8 195.7 203.4 208.7 212.9 215.5 216.9 218.5 218.4 220.9 43
44 183.9 195.9 203.5 208.9 213.1 215.6 217.1 218.7 218.6 221.1 44
45 184.1 196.1 203.7 209.0 213.2 215.8 217.2 218.9 218.8 221.2 45
46 184.3 196.2 203.8 209.1 213.4 215.9 217.4 219.0 219.0 221.4 46
47 184.4 196.4 204.0 209.3 213.5 216.1 217.6 219.2 219.2 221.6 47
48 184.6 196.5 204.1 209.4 213.6 216.2 217.7 219.4 219.4 221.8 48
49 184.8 196.7 204.3 209.6 213.8 216.4 217.9 219.6 219.5 221.9 49
... continued on next page
105

Table C.2.8: Winter Language Usage School Achievement Percentiles , continued
Pct K 1 2 3 4 5 6 7 8 9 10 11 Pct
50 185 197 204 210 214 217 218 220 220 222 50
51 185.1 197.0 204.6 209.8 214.1 216.7 218.2 219.9 219.9 222.3 51
52 185.3 197.1 204.7 210.0 214.2 216.8 218.4 220.1 220.1 222.4 52
53 185.4 197.3 204.9 210.1 214.4 217.0 218.6 220.2 220.3 222.6 53
54 185.6 197.5 205.0 210.3 214.5 217.1 218.7 220.4 220.5 222.8 54
55 185.8 197.6 205.2 210.4 214.7 217.2 218.9 220.6 220.6 223.0 55
56 185.9 197.8 205.3 210.5 214.8 217.4 219.1 220.8 220.8 223.1 56
57 186.1 197.9 205.5 210.7 215.0 217.5 219.3 220.9 221.0 223.3 57
58 186.3 198.1 205.6 210.8 215.1 217.7 219.4 221.1 221.2 223.5 58
59 186.4 198.2 205.8 211.0 215.3 217.8 219.6 221.3 221.4 223.7 59
60 186.6 198.4 205.9 211.1 215.4 218.0 219.8 221.4 221.6 223.8 60
61 186.8 198.6 206.1 211.3 215.6 218.2 219.9 221.6 221.8 224.0 61
62 187.0 198.7 206.2 211.4 215.7 218.3 220.1 221.8 222.0 224.2 62
63 187.1 198.9 206.4 211.5 215.9 218.5 220.3 222.0 222.1 224.4 63
64 187.3 199.0 206.5 211.7 216.0 218.6 220.5 222.2 222.3 224.6 64
65 187.5 199.2 206.7 211.8 216.2 218.8 220.6 222.3 222.5 224.7 65
66 187.7 199.4 206.8 212.0 216.3 218.9 220.8 222.5 222.7 224.9 66
67 187.9 199.5 207.0 212.1 216.5 219.1 221.0 222.7 222.9 225.1 67
68 188.0 199.7 207.2 212.3 216.7 219.3 221.2 222.9 223.1 225.3 68
69 188.2 199.9 207.3 212.5 216.8 219.4 221.4 223.1 223.3 225.5 69
70 188.4 200.1 207.5 212.6 217.0 219.6 221.6 223.3 223.6 225.7 70
71 188.6 200.2 207.7 212.8 217.2 219.8 221.8 223.5 223.8 225.9 71
72 188.8 200.4 207.9 212.9 217.3 219.9 222.0 223.7 224.0 226.1 72
73 189.0 200.6 208.0 213.1 217.5 220.1 222.2 223.9 224.2 226.3 73
74 189.2 200.8 208.2 213.3 217.7 220.3 222.4 224.1 224.4 226.5 74
75 189.4 201.0 208.4 213.4 217.9 220.5 222.6 224.3 224.7 226.7 75
76 189.6 201.2 208.6 213.6 218.0 220.7 222.8 224.5 224.9 226.9 76
77 189.8 201.4 208.8 213.8 218.2 220.9 223.0 224.7 225.1 227.2 77
78 190.1 201.6 209.0 214.0 218.4 221.1 223.2 225.0 225.4 227.4 78
79 190.3 201.8 209.2 214.2 218.6 221.3 223.4 225.2 225.6 227.6 79
80 190.5 202.0 209.4 214.4 218.8 221.5 223.7 225.4 225.9 227.9 80
81 190.8 202.2 209.6 214.6 219.0 221.7 223.9 225.7 226.1 228.1 81
82 191.0 202.5 209.8 214.8 219.3 221.9 224.2 225.9 226.4 228.4 82
83 191.3 202.7 210.0 215.0 219.5 222.1 224.4 226.2 226.7 228.6 83
84 191.5 203.0 210.3 215.2 219.7 222.4 224.7 226.5 227.0 228.9 84
85 191.8 203.2 210.5 215.5 220.0 222.6 225.0 226.8 227.3 229.2 85
86 192.1 203.5 210.8 215.7 220.2 222.9 225.3 227.1 227.6 229.5 86
87 192.4 203.8 211.1 216.0 220.5 223.1 225.6 227.4 228.0 229.8 87
88 192.7 204.1 211.3 216.2 220.8 223.4 225.9 227.7 228.3 230.1 88
89 193.1 204.4 211.7 216.5 221.1 223.7 226.2 228.1 228.7 230.5 89
90 193.4 204.7 212.0 216.8 221.4 224.0 226.6 228.4 229.1 230.9 90
91 193.8 205.1 212.3 217.2 221.7 224.4 227.0 228.8 229.5 231.3 91
92 194.3 205.5 212.7 217.5 222.1 224.8 227.4 229.3 230.0 231.7 92
93 194.7 205.9 213.1 217.9 222.5 225.2 227.9 229.8 230.5 232.2 93
94 195.2 206.4 213.6 218.3 223.0 225.7 228.4 230.3 231.1 232.7 94
95 195.8 207.0 214.1 218.8 223.5 226.2 229.0 230.9 231.8 233.3 95
96 196.5 207.6 214.7 219.4 224.1 226.8 229.7 231.6 232.5 234.1 96
97 197.4 208.4 215.5 220.2 224.9 227.6 230.6 232.5 233.5 235.0 97
98 198.6 209.5 216.5 221.1 225.9 228.6 231.8 233.7 234.7 236.1 98
99 200.4 211.2 218.1 222.6 227.4 230.2 233.6 235.5 236.7 238.0 99
106

Table C.2.9: Spring Language Usage School Achievement Percentiles
Grade
Pct K 1 2 3 4 5 6 7 8 9 10 11 Pct
1 173.8 185.5 192.9 198.4 201.5 203.6 203.1 204.1 202.6 205.7 1
2 175.6 187.2 194.5 199.9 203.1 205.2 204.9 206.0 204.7 207.6 2
3 176.8 188.3 195.6 200.9 204.1 206.2 206.1 207.2 206.0 208.8 3
4 177.7 189.1 196.3 201.6 204.9 207.0 207.0 208.1 207.0 209.8 4
5 178.4 189.7 197.0 202.2 205.5 207.7 207.8 208.9 207.8 210.5 5
6 179.0 190.3 197.5 202.7 206.1 208.2 208.4 209.5 208.5 211.1 6
7 179.6 190.8 198.0 203.1 206.5 208.7 208.9 210.1 209.0 211.7 7
8 180.1 191.2 198.4 203.5 206.9 209.1 209.4 210.6 209.6 212.2 8
9 180.5 191.6 198.8 203.9 207.3 209.5 209.8 211.0 210.1 212.7 9
10 180.9 192.0 199.1 204.2 207.7 209.9 210.2 211.4 210.5 213.1 10
11 181.3 192.3 199.4 204.6 208.0 210.2 210.6 211.8 210.9 213.5 11
12 181.6 192.7 199.7 204.8 208.3 210.5 211.0 212.2 211.3 213.8 12
13 182.0 193.0 200.0 205.1 208.6 210.8 211.3 212.5 211.7 214.2 13
14 182.3 193.2 200.3 205.4 208.9 211.1 211.6 212.8 212.0 214.5 14
15 182.6 193.5 200.6 205.6 209.1 211.3 211.9 213.1 212.3 214.8 15
16 182.9 193.8 200.8 205.9 209.4 211.6 212.2 213.4 212.7 215.1 16
17 183.2 194.0 201.0 206.1 209.6 211.8 212.5 213.7 213.0 215.4 17
18 183.4 194.3 201.3 206.3 209.8 212.1 212.8 214.0 213.3 215.7 18
19 183.7 194.5 201.5 206.5 210.1 212.3 213.0 214.2 213.5 215.9 19
20 183.9 194.7 201.7 206.7 210.3 212.5 213.3 214.5 213.8 216.2 20
21 184.2 195.0 201.9 206.9 210.5 212.7 213.5 214.7 214.1 216.4 21
22 184.4 195.2 202.1 207.1 210.7 212.9 213.7 215.0 214.3 216.7 22
23 184.6 195.4 202.3 207.3 210.9 213.1 214.0 215.2 214.6 216.9 23
24 184.9 195.6 202.5 207.5 211.1 213.3 214.2 215.4 214.8 217.2 24
25 185.1 195.8 202.7 207.7 211.3 213.5 214.4 215.7 215.1 217.4 25
26 185.3 196.0 202.9 207.8 211.5 213.7 214.6 215.9 215.3 217.6 26
27 185.5 196.2 203.1 208.0 211.6 213.9 214.8 216.1 215.5 217.8 27
28 185.7 196.3 203.2 208.2 211.8 214.1 215.0 216.3 215.8 218.0 28
29 185.9 196.5 203.4 208.3 212.0 214.3 215.2 216.5 216.0 218.2 29
30 186.1 196.7 203.6 208.5 212.2 214.4 215.4 216.7 216.2 218.4 30
31 186.3 196.9 203.8 208.7 212.3 214.6 215.6 216.9 216.4 218.6 31
32 186.5 197.1 203.9 208.8 212.5 214.8 215.8 217.1 216.6 218.8 32
33 186.7 197.2 204.1 209.0 212.7 215.0 216.0 217.3 216.8 219.0 33
34 186.9 197.4 204.3 209.1 212.8 215.1 216.2 217.5 217.0 219.2 34
35 187.0 197.6 204.4 209.3 213.0 215.3 216.4 217.7 217.2 219.4 35
36 187.2 197.7 204.6 209.4 213.1 215.4 216.6 217.9 217.4 219.6 36
37 187.4 197.9 204.7 209.6 213.3 215.6 216.8 218.1 217.6 219.8 37
38 187.6 198.1 204.9 209.7 213.5 215.8 216.9 218.2 217.8 220.0 38
39 187.8 198.2 205.0 209.9 213.6 215.9 217.1 218.4 218.0 220.2 39
40 187.9 198.4 205.2 210.0 213.8 216.1 217.3 218.6 218.2 220.4 40
41 188.1 198.6 205.3 210.2 213.9 216.2 217.5 218.8 218.4 220.5 41
42 188.3 198.7 205.5 210.3 214.1 216.4 217.7 219.0 218.6 220.7 42
43 188.5 198.9 205.6 210.5 214.2 216.5 217.8 219.1 218.8 220.9 43
44 188.7 199.0 205.8 210.6 214.4 216.7 218.0 219.3 219.0 221.1 44
45 188.8 199.2 205.9 210.8 214.5 216.9 218.2 219.5 219.2 221.3 45
46 189.0 199.4 206.1 210.9 214.7 217.0 218.3 219.7 219.4 221.4 46
47 189.2 199.5 206.2 211.0 214.8 217.2 218.5 219.9 219.6 221.6 47
48 189.3 199.7 206.4 211.2 215.0 217.3 218.7 220.0 219.8 221.8 48
49 189.5 199.8 206.5 211.3 215.1 217.5 218.9 220.2 220.0 222.0 49
... continued on next page
107

Table C.2.9: Spring Language Usage School Achievement Percentiles , continued
Pct K 1 2 3 4 5 6 7 8 9 10 11 Pct
50 190 200 207 212 215 218 219 220 220 222 50
51 189.9 200.1 206.8 211.6 215.4 217.8 219.2 220.6 220.3 222.3 51
52 190.0 200.3 207.0 211.7 215.6 217.9 219.4 220.7 220.5 222.5 52
53 190.2 200.4 207.1 211.9 215.7 218.1 219.6 220.9 220.7 222.7 53
54 190.4 200.6 207.3 212.0 215.9 218.2 219.7 221.1 220.9 222.9 54
55 190.5 200.8 207.4 212.2 216.0 218.4 219.9 221.3 221.1 223.0 55
56 190.7 200.9 207.6 212.3 216.2 218.5 220.1 221.4 221.3 223.2 56
57 190.9 201.1 207.7 212.5 216.3 218.7 220.2 221.6 221.5 223.4 57
58 191.1 201.2 207.9 212.6 216.5 218.8 220.4 221.8 221.7 223.6 58
59 191.2 201.4 208.0 212.7 216.6 219.0 220.6 222.0 221.9 223.8 59
60 191.4 201.6 208.2 212.9 216.8 219.1 220.8 222.1 222.1 223.9 60
61 191.6 201.7 208.3 213.0 216.9 219.3 221.0 222.3 222.2 224.1 61
62 191.8 201.9 208.5 213.2 217.1 219.5 221.1 222.5 222.4 224.3 62
63 192.0 202.0 208.7 213.3 217.2 219.6 221.3 222.7 222.6 224.5 63
64 192.1 202.2 208.8 213.5 217.4 219.8 221.5 222.9 222.8 224.7 64
65 192.3 202.4 209.0 213.6 217.5 219.9 221.7 223.1 223.0 224.9 65
66 192.5 202.5 209.1 213.8 217.7 220.1 221.9 223.3 223.2 225.1 66
67 192.7 202.7 209.3 213.9 217.9 220.3 222.1 223.5 223.5 225.3 67
68 192.9 202.9 209.5 214.1 218.0 220.4 222.2 223.6 223.7 225.5 68
69 193.1 203.1 209.6 214.3 218.2 220.6 222.4 223.8 223.9 225.7 69
70 193.3 203.2 209.8 214.4 218.4 220.8 222.6 224.0 224.1 225.9 70
71 193.5 203.4 210.0 214.6 218.5 221.0 222.8 224.2 224.3 226.1 71
72 193.7 203.6 210.1 214.8 218.7 221.1 223.0 224.5 224.5 226.3 72
73 193.9 203.8 210.3 214.9 218.9 221.3 223.2 224.7 224.8 226.5 73
74 194.1 204.0 210.5 215.1 219.1 221.5 223.5 224.9 225.0 226.7 74
75 194.3 204.2 210.7 215.3 219.3 221.7 223.7 225.1 225.2 226.9 75
76 194.5 204.4 210.9 215.4 219.4 221.9 223.9 225.3 225.5 227.1 76
77 194.7 204.6 211.1 215.6 219.6 222.1 224.1 225.5 225.7 227.4 77
78 195.0 204.8 211.3 215.8 219.8 222.3 224.3 225.8 226.0 227.6 78
79 195.2 205.0 211.5 216.0 220.0 222.5 224.6 226.0 226.2 227.8 79
80 195.4 205.2 211.7 216.2 220.2 222.7 224.8 226.3 226.5 228.1 80
81 195.7 205.4 211.9 216.4 220.5 222.9 225.1 226.5 226.7 228.4 81
82 195.9 205.7 212.1 216.6 220.7 223.1 225.3 226.8 227.0 228.6 82
83 196.2 205.9 212.3 216.8 220.9 223.4 225.6 227.0 227.3 228.9 83
84 196.5 206.2 212.6 217.1 221.1 223.6 225.9 227.3 227.6 229.2 84
85 196.8 206.4 212.8 217.3 221.4 223.9 226.1 227.6 227.9 229.5 85
86 197.1 206.7 213.1 217.6 221.7 224.1 226.4 227.9 228.3 229.8 86
87 197.4 207.0 213.4 217.8 221.9 224.4 226.8 228.3 228.6 230.1 87
88 197.7 207.3 213.7 218.1 222.2 224.7 227.1 228.6 229.0 230.5 88
89 198.1 207.6 214.0 218.4 222.5 225.0 227.5 229.0 229.4 230.8 89
90 198.5 208.0 214.3 218.7 222.8 225.4 227.8 229.3 229.8 231.2 90
91 198.9 208.3 214.6 219.0 223.2 225.7 228.2 229.8 230.2 231.6 91
92 199.3 208.7 215.0 219.4 223.6 226.1 228.7 230.2 230.7 232.1 92
93 199.8 209.2 215.4 219.8 224.0 226.5 229.2 230.7 231.2 232.6 93
94 200.3 209.7 215.9 220.2 224.5 227.0 229.7 231.2 231.8 233.1 94
95 200.9 210.2 216.4 220.7 225.0 227.5 230.3 231.9 232.5 233.8 95
96 201.7 210.9 217.1 221.3 225.6 228.2 231.0 232.6 233.3 234.5 96
97 202.6 211.7 217.8 222.1 226.4 229.0 231.9 233.5 234.3 235.4 97
98 203.7 212.8 218.9 223.0 227.4 230.0 233.1 234.7 235.6 236.7 98
99 205.6 214.5 220.5 224.6 229.0 231.7 235.0 236.6 237.6 238.6 99
108

Table C.2.10: Fall General Science School Achievement Percentiles
Grade
Pct K 1 2 3 4 5 6 7 8 9 10 11 Pct
1 174.8 182.7 188.4 191.7 194.8 196.8 198.5 197.7 1
2 176.3 184.1 189.8 193.2 196.3 198.4 200.2 199.5 2
3 177.2 185.0 190.6 194.1 197.2 199.4 201.2 200.6 3
4 178.0 185.6 191.3 194.8 197.9 200.2 202.0 201.5 4
5 178.5 186.2 191.8 195.4 198.5 200.8 202.6 202.2 5
6 179.0 186.6 192.3 195.9 198.9 201.3 203.2 202.8 6
7 179.4 187.0 192.7 196.3 199.4 201.8 203.6 203.4 7
8 179.8 187.4 193.1 196.7 199.7 202.2 204.1 203.8 8
9 180.2 187.7 193.4 197.0 200.1 202.5 204.4 204.3 9
10 180.5 188.0 193.7 197.4 200.4 202.9 204.8 204.7 10
11 180.8 188.3 194.0 197.7 200.7 203.2 205.1 205.0 11
12 181.1 188.6 194.2 197.9 201.0 203.5 205.4 205.4 12
13 181.3 188.8 194.5 198.2 201.2 203.8 205.7 205.7 13
14 181.6 189.1 194.7 198.5 201.5 204.0 206.0 206.0 14
15 181.8 189.3 194.9 198.7 201.7 204.3 206.3 206.3 15
16 182.1 189.5 195.2 198.9 201.9 204.5 206.5 206.6 16
17 182.3 189.7 195.4 199.1 202.1 204.8 206.7 206.9 17
18 182.5 189.9 195.6 199.4 202.3 205.0 207.0 207.1 18
19 182.7 190.1 195.8 199.6 202.5 205.2 207.2 207.4 19
20 182.9 190.3 195.9 199.8 202.7 205.4 207.4 207.6 20
21 183.1 190.5 196.1 199.9 202.9 205.6 207.6 207.8 21
22 183.3 190.6 196.3 200.1 203.1 205.8 207.8 208.1 22
23 183.5 190.8 196.5 200.3 203.3 206.0 208.0 208.3 23
24 183.6 191.0 196.6 200.5 203.4 206.2 208.2 208.5 24
25 183.8 191.1 196.8 200.7 203.6 206.4 208.4 208.7 25
26 184.0 191.3 197.0 200.8 203.8 206.6 208.6 208.9 26
27 184.1 191.5 197.1 201.0 203.9 206.7 208.8 209.1 27
28 184.3 191.6 197.3 201.2 204.1 206.9 209.0 209.3 28
29 184.5 191.8 197.4 201.3 204.2 207.1 209.1 209.5 29
30 184.6 191.9 197.6 201.5 204.4 207.3 209.3 209.7 30
31 184.8 192.0 197.7 201.6 204.6 207.4 209.5 209.9 31
32 184.9 192.2 197.8 201.8 204.7 207.6 209.7 210.1 32
33 185.1 192.3 198.0 201.9 204.8 207.7 209.8 210.3 33
34 185.2 192.5 198.1 202.1 205.0 207.9 210.0 210.5 34
35 185.4 192.6 198.3 202.2 205.1 208.1 210.1 210.7 35
36 185.5 192.8 198.4 202.4 205.3 208.2 210.3 210.8 36
37 185.7 192.9 198.5 202.5 205.4 208.4 210.5 211.0 37
38 185.8 193.0 198.7 202.7 205.6 208.5 210.6 211.2 38
39 186.0 193.2 198.8 202.8 205.7 208.7 210.8 211.4 39
40 186.1 193.3 198.9 202.9 205.8 208.8 210.9 211.6 40
41 186.2 193.4 199.1 203.1 206.0 209.0 211.1 211.7 41
42 186.4 193.6 199.2 203.2 206.1 209.1 211.2 211.9 42
43 186.5 193.7 199.3 203.4 206.2 209.3 211.4 212.1 43
44 186.7 193.8 199.5 203.5 206.4 209.4 211.5 212.2 44
45 186.8 193.9 199.6 203.6 206.5 209.6 211.7 212.4 45
46 186.9 194.1 199.7 203.8 206.6 209.7 211.8 212.6 46
47 187.1 194.2 199.8 203.9 206.8 209.9 212.0 212.7 47
48 187.2 194.3 200.0 204.0 206.9 210.0 212.1 212.9 48
49 187.3 194.5 200.1 204.2 207.0 210.1 212.3 213.1 49
... continued on next page
109
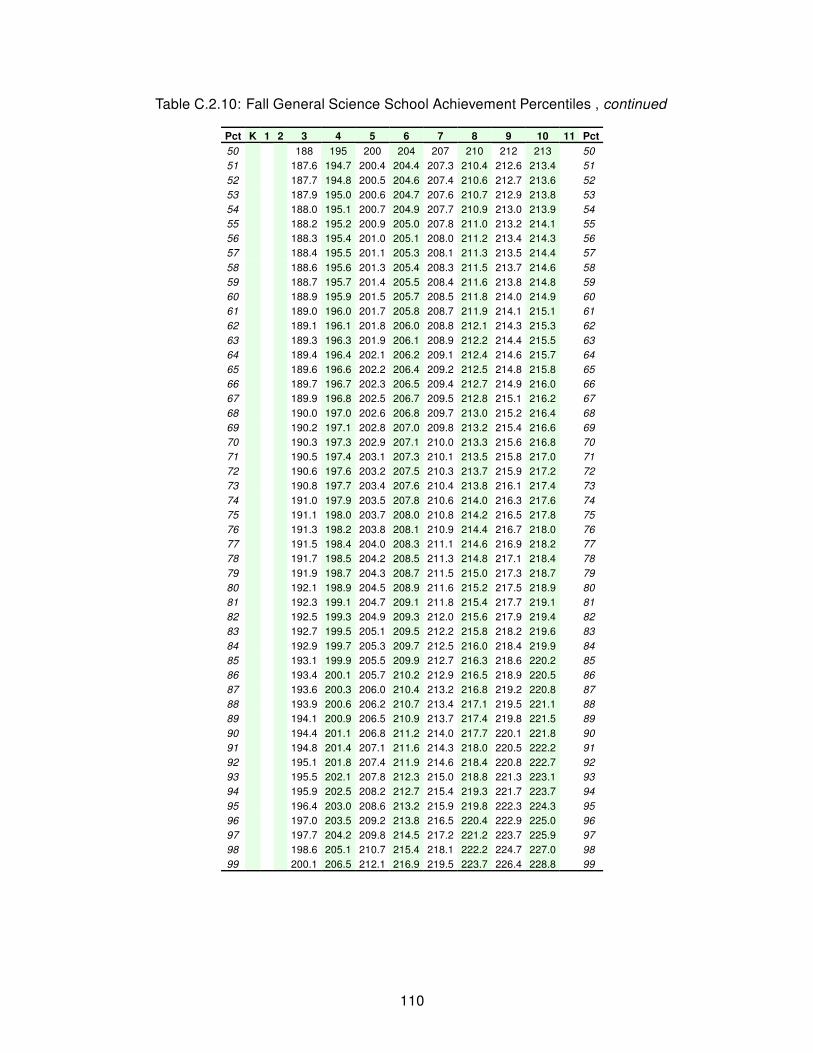
Table C.2.10: Fall General Science School Achievement Percentiles , continued
Pct K 1 2 3 4 5 6 7 8 9 10 11 Pct
50 188 195 200 204 207 210 212 213 50
51 187.6 194.7 200.4 204.4 207.3 210.4 212.6 213.4 51
52 187.7 194.8 200.5 204.6 207.4 210.6 212.7 213.6 52
53 187.9 195.0 200.6 204.7 207.6 210.7 212.9 213.8 53
54 188.0 195.1 200.7 204.9 207.7 210.9 213.0 213.9 54
55 188.2 195.2 200.9 205.0 207.8 211.0 213.2 214.1 55
56 188.3 195.4 201.0 205.1 208.0 211.2 213.4 214.3 56
57 188.4 195.5 201.1 205.3 208.1 211.3 213.5 214.4 57
58 188.6 195.6 201.3 205.4 208.3 211.5 213.7 214.6 58
59 188.7 195.7 201.4 205.5 208.4 211.6 213.8 214.8 59
60 188.9 195.9 201.5 205.7 208.5 211.8 214.0 214.9 60
61 189.0 196.0 201.7 205.8 208.7 211.9 214.1 215.1 61
62 189.1 196.1 201.8 206.0 208.8 212.1 214.3 215.3 62
63 189.3 196.3 201.9 206.1 208.9 212.2 214.4 215.5 63
64 189.4 196.4 202.1 206.2 209.1 212.4 214.6 215.7 64
65 189.6 196.6 202.2 206.4 209.2 212.5 214.8 215.8 65
66 189.7 196.7 202.3 206.5 209.4 212.7 214.9 216.0 66
67 189.9 196.8 202.5 206.7 209.5 212.8 215.1 216.2 67
68 190.0 197.0 202.6 206.8 209.7 213.0 215.2 216.4 68
69 190.2 197.1 202.8 207.0 209.8 213.2 215.4 216.6 69
70 190.3 197.3 202.9 207.1 210.0 213.3 215.6 216.8 70
71 190.5 197.4 203.1 207.3 210.1 213.5 215.8 217.0 71
72 190.6 197.6 203.2 207.5 210.3 213.7 215.9 217.2 72
73 190.8 197.7 203.4 207.6 210.4 213.8 216.1 217.4 73
74 191.0 197.9 203.5 207.8 210.6 214.0 216.3 217.6 74
75 191.1 198.0 203.7 208.0 210.8 214.2 216.5 217.8 75
76 191.3 198.2 203.8 208.1 210.9 214.4 216.7 218.0 76
77 191.5 198.4 204.0 208.3 211.1 214.6 216.9 218.2 77
78 191.7 198.5 204.2 208.5 211.3 214.8 217.1 218.4 78
79 191.9 198.7 204.3 208.7 211.5 215.0 217.3 218.7 79
80 192.1 198.9 204.5 208.9 211.6 215.2 217.5 218.9 80
81 192.3 199.1 204.7 209.1 211.8 215.4 217.7 219.1 81
82 192.5 199.3 204.9 209.3 212.0 215.6 217.9 219.4 82
83 192.7 199.5 205.1 209.5 212.2 215.8 218.2 219.6 83
84 192.9 199.7 205.3 209.7 212.5 216.0 218.4 219.9 84
85 193.1 199.9 205.5 209.9 212.7 216.3 218.6 220.2 85
86 193.4 200.1 205.7 210.2 212.9 216.5 218.9 220.5 86
87 193.6 200.3 206.0 210.4 213.2 216.8 219.2 220.8 87
88 193.9 200.6 206.2 210.7 213.4 217.1 219.5 221.1 88
89 194.1 200.9 206.5 210.9 213.7 217.4 219.8 221.5 89
90 194.4 201.1 206.8 211.2 214.0 217.7 220.1 221.8 90
91 194.8 201.4 207.1 211.6 214.3 218.0 220.5 222.2 91
92 195.1 201.8 207.4 211.9 214.6 218.4 220.8 222.7 92
93 195.5 202.1 207.8 212.3 215.0 218.8 221.3 223.1 93
94 195.9 202.5 208.2 212.7 215.4 219.3 221.7 223.7 94
95 196.4 203.0 208.6 213.2 215.9 219.8 222.3 224.3 95
96 197.0 203.5 209.2 213.8 216.5 220.4 222.9 225.0 96
97 197.7 204.2 209.8 214.5 217.2 221.2 223.7 225.9 97
98 198.6 205.1 210.7 215.4 218.1 222.2 224.7 227.0 98
99 200.1 206.5 212.1 216.9 219.5 223.7 226.4 228.8 99
110

Table C.2.11: Winter General Science School Achievement Percentiles
Grade
Pct K 1 2 3 4 5 6 7 8 9 10 11 Pct
1 180.2 186.7 191.7 194.2 196.8 198.8 199.9 198.4 1
2 181.7 188.1 193.1 195.7 198.3 200.4 201.5 200.3 2
3 182.6 189.0 194.0 196.7 199.3 201.4 202.6 201.5 3
4 183.3 189.7 194.7 197.4 200.0 202.1 203.4 202.3 4
5 183.8 190.2 195.2 198.0 200.5 202.7 204.0 203.1 5
6 184.3 190.7 195.7 198.5 201.0 203.3 204.5 203.7 6
7 184.7 191.1 196.1 198.9 201.5 203.7 205.0 204.2 7
8 185.1 191.5 196.5 199.3 201.8 204.1 205.4 204.7 8
9 185.5 191.8 196.8 199.7 202.2 204.5 205.8 205.1 9
10 185.8 192.1 197.1 200.0 202.5 204.9 206.2 205.6 10
11 186.1 192.4 197.4 200.3 202.8 205.2 206.5 205.9 11
12 186.3 192.7 197.6 200.6 203.1 205.5 206.8 206.3 12
13 186.6 192.9 197.9 200.9 203.4 205.8 207.1 206.6 13
14 186.8 193.2 198.1 201.1 203.6 206.0 207.4 206.9 14
15 187.1 193.4 198.4 201.3 203.8 206.3 207.7 207.2 15
16 187.3 193.6 198.6 201.6 204.1 206.5 207.9 207.5 16
17 187.5 193.8 198.8 201.8 204.3 206.8 208.2 207.8 17
18 187.7 194.0 199.0 202.0 204.5 207.0 208.4 208.1 18
19 187.9 194.2 199.2 202.2 204.7 207.2 208.6 208.3 19
20 188.1 194.4 199.4 202.4 204.9 207.4 208.8 208.6 20
21 188.3 194.6 199.5 202.6 205.1 207.6 209.0 208.8 21
22 188.5 194.7 199.7 202.8 205.3 207.8 209.2 209.0 22
23 188.6 194.9 199.9 203.0 205.5 208.0 209.4 209.3 23
24 188.8 195.1 200.1 203.2 205.6 208.2 209.6 209.5 24
25 189.0 195.3 200.2 203.3 205.8 208.4 209.8 209.7 25
26 189.1 195.4 200.4 203.5 206.0 208.6 210.0 209.9 26
27 189.3 195.6 200.5 203.7 206.1 208.7 210.2 210.1 27
28 189.5 195.7 200.7 203.8 206.3 208.9 210.4 210.3 28
29 189.6 195.9 200.8 204.0 206.5 209.1 210.6 210.5 29
30 189.8 196.0 201.0 204.2 206.6 209.2 210.7 210.7 30
31 189.9 196.2 201.1 204.3 206.8 209.4 210.9 210.9 31
32 190.1 196.3 201.3 204.5 206.9 209.6 211.1 211.1 32
33 190.2 196.5 201.4 204.6 207.1 209.7 211.2 211.3 33
34 190.4 196.6 201.6 204.8 207.2 209.9 211.4 211.5 34
35 190.5 196.7 201.7 204.9 207.4 210.0 211.6 211.7 35
36 190.7 196.9 201.8 205.1 207.5 210.2 211.7 211.9 36
37 190.8 197.0 202.0 205.2 207.7 210.4 211.9 212.0 37
38 190.9 197.2 202.1 205.4 207.8 210.5 212.1 212.2 38
39 191.1 197.3 202.2 205.5 208.0 210.7 212.2 212.4 39
40 191.2 197.4 202.4 205.7 208.1 210.8 212.4 212.6 40
41 191.4 197.6 202.5 205.8 208.2 211.0 212.5 212.8 41
42 191.5 197.7 202.6 205.9 208.4 211.1 212.7 212.9 42
43 191.6 197.8 202.8 206.1 208.5 211.3 212.8 213.1 43
44 191.8 198.0 202.9 206.2 208.7 211.4 213.0 213.3 44
45 191.9 198.1 203.0 206.4 208.8 211.6 213.1 213.5 45
46 192.0 198.2 203.2 206.5 208.9 211.7 213.3 213.6 46
47 192.2 198.3 203.3 206.6 209.1 211.8 213.4 213.8 47
48 192.3 198.5 203.4 206.8 209.2 212.0 213.6 214.0 48
49 192.4 198.6 203.6 206.9 209.3 212.1 213.7 214.1 49
... continued on next page
111

Table C.2.11: Winter General Science School Achievement Percentiles , continued
Pct K 1 2 3 4 5 6 7 8 9 10 11 Pct
50 193 199 204 207 210 212 214 214 50
51 192.7 198.9 203.8 207.2 209.6 212.4 214.0 214.5 51
52 192.8 199.0 203.9 207.3 209.7 212.6 214.2 214.7 52
53 193.0 199.1 204.1 207.5 209.9 212.7 214.3 214.8 53
54 193.1 199.2 204.2 207.6 210.0 212.9 214.5 215.0 54
55 193.2 199.4 204.3 207.8 210.2 213.0 214.6 215.2 55
56 193.4 199.5 204.5 207.9 210.3 213.2 214.8 215.4 56
57 193.5 199.6 204.6 208.0 210.4 213.3 214.9 215.5 57
58 193.6 199.8 204.7 208.2 210.6 213.5 215.1 215.7 58
59 193.8 199.9 204.9 208.3 210.7 213.6 215.3 215.9 59
60 193.9 200.0 205.0 208.5 210.8 213.8 215.4 216.1 60
61 194.0 200.2 205.1 208.6 211.0 213.9 215.6 216.2 61
62 194.2 200.3 205.3 208.7 211.1 214.1 215.7 216.4 62
63 194.3 200.4 205.4 208.9 211.3 214.2 215.9 216.6 63
64 194.5 200.6 205.5 209.0 211.4 214.4 216.0 216.8 64
65 194.6 200.7 205.7 209.2 211.6 214.5 216.2 217.0 65
66 194.7 200.9 205.8 209.3 211.7 214.7 216.4 217.1 66
67 194.9 201.0 205.9 209.5 211.9 214.8 216.5 217.3 67
68 195.0 201.1 206.1 209.6 212.0 215.0 216.7 217.5 68
69 195.2 201.3 206.2 209.8 212.2 215.2 216.9 217.7 69
70 195.3 201.4 206.4 210.0 212.3 215.3 217.0 217.9 70
71 195.5 201.6 206.5 210.1 212.5 215.5 217.2 218.1 71
72 195.6 201.7 206.7 210.3 212.6 215.7 217.4 218.3 72
73 195.8 201.9 206.8 210.4 212.8 215.8 217.6 218.5 73
74 196.0 202.0 207.0 210.6 213.0 216.0 217.8 218.7 74
75 196.1 202.2 207.2 210.8 213.1 216.2 217.9 218.9 75
76 196.3 202.4 207.3 211.0 213.3 216.4 218.1 219.2 76
77 196.5 202.5 207.5 211.1 213.5 216.6 218.3 219.4 77
78 196.6 202.7 207.7 211.3 213.7 216.8 218.5 219.6 78
79 196.8 202.9 207.8 211.5 213.8 217.0 218.7 219.8 79
80 197.0 203.1 208.0 211.7 214.0 217.2 218.9 220.1 80
81 197.2 203.3 208.2 211.9 214.2 217.4 219.2 220.3 81
82 197.4 203.4 208.4 212.1 214.4 217.6 219.4 220.6 82
83 197.6 203.6 208.6 212.3 214.7 217.8 219.6 220.8 83
84 197.8 203.9 208.8 212.5 214.9 218.1 219.9 221.1 84
85 198.0 204.1 209.0 212.8 215.1 218.3 220.1 221.4 85
86 198.3 204.3 209.2 213.0 215.3 218.6 220.4 221.7 86
87 198.5 204.5 209.5 213.3 215.6 218.8 220.7 222.0 87
88 198.8 204.8 209.7 213.5 215.8 219.1 221.0 222.4 88
89 199.1 205.1 210.0 213.8 216.1 219.4 221.3 222.7 89
90 199.3 205.3 210.3 214.1 216.4 219.7 221.6 223.1 90
91 199.7 205.6 210.6 214.4 216.7 220.1 221.9 223.5 91
92 200.0 206.0 210.9 214.8 217.1 220.4 222.3 223.9 92
93 200.4 206.3 211.3 215.2 217.5 220.8 222.8 224.4 93
94 200.8 206.7 211.7 215.6 217.9 221.3 223.2 225.0 94
95 201.3 207.2 212.1 216.1 218.4 221.8 223.8 225.6 95
96 201.8 207.8 212.7 216.7 219.0 222.4 224.4 226.3 96
97 202.5 208.4 213.4 217.4 219.7 223.2 225.2 227.2 97
98 203.4 209.3 214.2 218.4 220.6 224.2 226.2 228.4 98
99 204.9 210.7 215.6 219.9 222.1 225.8 227.9 230.2 99
112
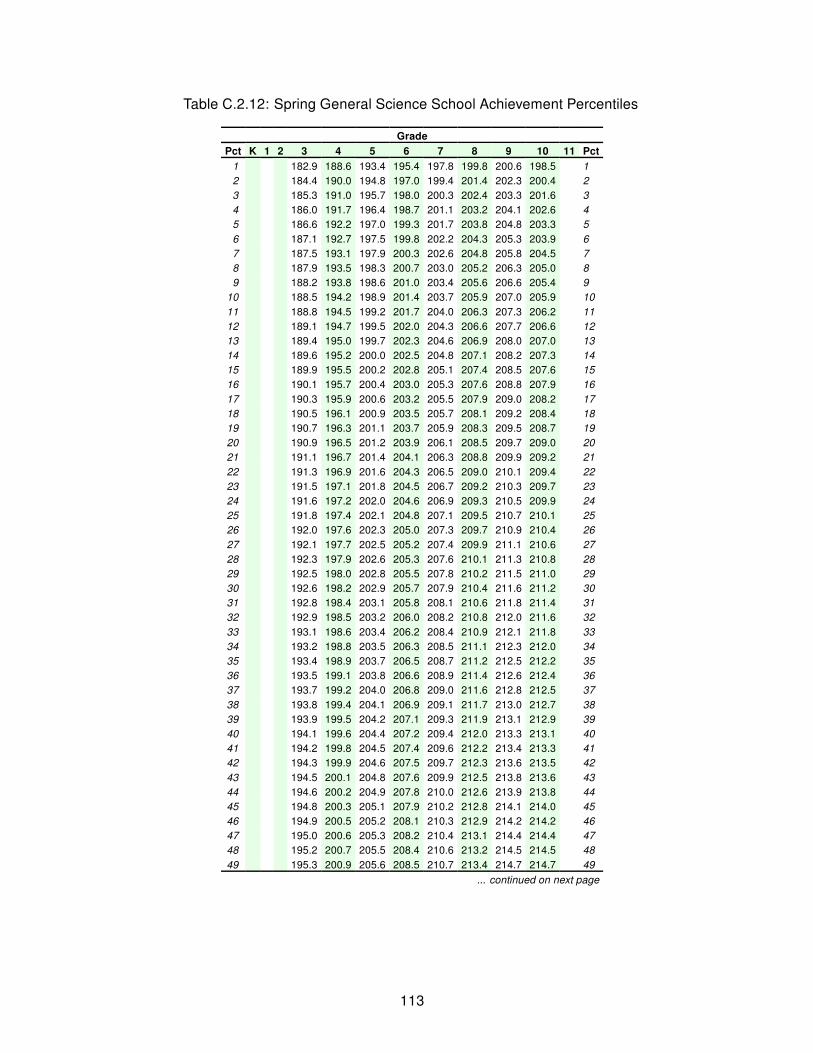
Table C.2.12: Spring General Science School Achievement Percentiles
Grade
Pct K 1 2 3 4 5 6 7 8 9 10 11 Pct
1 182.9 188.6 193.4 195.4 197.8 199.8 200.6 198.5 1
2 184.4 190.0 194.8 197.0 199.4 201.4 202.3 200.4 2
3 185.3 191.0 195.7 198.0 200.3 202.4 203.3 201.6 3
4 186.0 191.7 196.4 198.7 201.1 203.2 204.1 202.6 4
5 186.6 192.2 197.0 199.3 201.7 203.8 204.8 203.3 5
6 187.1 192.7 197.5 199.8 202.2 204.3 205.3 203.9 6
7 187.5 193.1 197.9 200.3 202.6 204.8 205.8 204.5 7
8 187.9 193.5 198.3 200.7 203.0 205.2 206.3 205.0 8
9 188.2 193.8 198.6 201.0 203.4 205.6 206.6 205.4 9
10 188.5 194.2 198.9 201.4 203.7 205.9 207.0 205.9 10
11 188.8 194.5 199.2 201.7 204.0 206.3 207.3 206.2 11
12 189.1 194.7 199.5 202.0 204.3 206.6 207.7 206.6 12
13 189.4 195.0 199.7 202.3 204.6 206.9 208.0 207.0 13
14 189.6 195.2 200.0 202.5 204.8 207.1 208.2 207.3 14
15 189.9 195.5 200.2 202.8 205.1 207.4 208.5 207.6 15
16 190.1 195.7 200.4 203.0 205.3 207.6 208.8 207.9 16
17 190.3 195.9 200.6 203.2 205.5 207.9 209.0 208.2 17
18 190.5 196.1 200.9 203.5 205.7 208.1 209.2 208.4 18
19 190.7 196.3 201.1 203.7 205.9 208.3 209.5 208.7 19
20 190.9 196.5 201.2 203.9 206.1 208.5 209.7 209.0 20
21 191.1 196.7 201.4 204.1 206.3 208.8 209.9 209.2 21
22 191.3 196.9 201.6 204.3 206.5 209.0 210.1 209.4 22
23 191.5 197.1 201.8 204.5 206.7 209.2 210.3 209.7 23
24 191.6 197.2 202.0 204.6 206.9 209.3 210.5 209.9 24
25 191.8 197.4 202.1 204.8 207.1 209.5 210.7 210.1 25
26 192.0 197.6 202.3 205.0 207.3 209.7 210.9 210.4 26
27 192.1 197.7 202.5 205.2 207.4 209.9 211.1 210.6 27
28 192.3 197.9 202.6 205.3 207.6 210.1 211.3 210.8 28
29 192.5 198.0 202.8 205.5 207.8 210.2 211.5 211.0 29
30 192.6 198.2 202.9 205.7 207.9 210.4 211.6 211.2 30
31 192.8 198.4 203.1 205.8 208.1 210.6 211.8 211.4 31
32 192.9 198.5 203.2 206.0 208.2 210.8 212.0 211.6 32
33 193.1 198.6 203.4 206.2 208.4 210.9 212.1 211.8 33
34 193.2 198.8 203.5 206.3 208.5 211.1 212.3 212.0 34
35 193.4 198.9 203.7 206.5 208.7 211.2 212.5 212.2 35
36 193.5 199.1 203.8 206.6 208.9 211.4 212.6 212.4 36
37 193.7 199.2 204.0 206.8 209.0 211.6 212.8 212.5 37
38 193.8 199.4 204.1 206.9 209.1 211.7 213.0 212.7 38
39 193.9 199.5 204.2 207.1 209.3 211.9 213.1 212.9 39
40 194.1 199.6 204.4 207.2 209.4 212.0 213.3 213.1 40
41 194.2 199.8 204.5 207.4 209.6 212.2 213.4 213.3 41
42 194.3 199.9 204.6 207.5 209.7 212.3 213.6 213.5 42
43 194.5 200.1 204.8 207.6 209.9 212.5 213.8 213.6 43
44 194.6 200.2 204.9 207.8 210.0 212.6 213.9 213.8 44
45 194.8 200.3 205.1 207.9 210.2 212.8 214.1 214.0 45
46 194.9 200.5 205.2 208.1 210.3 212.9 214.2 214.2 46
47 195.0 200.6 205.3 208.2 210.4 213.1 214.4 214.4 47
48 195.2 200.7 205.5 208.4 210.6 213.2 214.5 214.5 48
49 195.3 200.9 205.6 208.5 210.7 213.4 214.7 214.7 49
... continued on next page
113

Table C.2.12: Spring General Science School Achievement Percentiles , continued
Pct K 1 2 3 4 5 6 7 8 9 10 11 Pct
50 195 201 206 209 211 214 215 215 50
51 195.6 201.1 205.9 208.8 211.0 213.7 215.0 215.1 51
52 195.7 201.3 206.0 208.9 211.1 213.8 215.1 215.2 52
53 195.8 201.4 206.1 209.1 211.3 214.0 215.3 215.4 53
54 196.0 201.5 206.3 209.2 211.4 214.1 215.4 215.6 54
55 196.1 201.7 206.4 209.4 211.6 214.3 215.6 215.8 55
56 196.2 201.8 206.5 209.5 211.7 214.4 215.8 216.0 56
57 196.4 201.9 206.7 209.6 211.8 214.6 215.9 216.1 57
58 196.5 202.1 206.8 209.8 212.0 214.7 216.1 216.3 58
59 196.7 202.2 206.9 209.9 212.1 214.9 216.2 216.5 59
60 196.8 202.3 207.1 210.1 212.3 215.0 216.4 216.7 60
61 196.9 202.5 207.2 210.2 212.4 215.2 216.5 216.9 61
62 197.1 202.6 207.3 210.4 212.6 215.3 216.7 217.0 62
63 197.2 202.8 207.5 210.5 212.7 215.5 216.9 217.2 63
64 197.4 202.9 207.6 210.7 212.9 215.6 217.0 217.4 64
65 197.5 203.1 207.8 210.8 213.0 215.8 217.2 217.6 65
66 197.7 203.2 207.9 211.0 213.2 216.0 217.3 217.8 66
67 197.8 203.3 208.1 211.1 213.3 216.1 217.5 218.0 67
68 197.9 203.5 208.2 211.3 213.5 216.3 217.7 218.2 68
69 198.1 203.6 208.4 211.5 213.6 216.5 217.9 218.4 69
70 198.3 203.8 208.5 211.6 213.8 216.6 218.0 218.6 70
71 198.4 203.9 208.7 211.8 214.0 216.8 218.2 218.8 71
72 198.6 204.1 208.8 212.0 214.1 217.0 218.4 219.0 72
73 198.7 204.3 209.0 212.1 214.3 217.2 218.6 219.2 73
74 198.9 204.4 209.1 212.3 214.5 217.3 218.8 219.4 74
75 199.1 204.6 209.3 212.5 214.6 217.5 218.9 219.6 75
76 199.2 204.8 209.5 212.7 214.8 217.7 219.1 219.9 76
77 199.4 204.9 209.7 212.8 215.0 217.9 219.3 220.1 77
78 199.6 205.1 209.8 213.0 215.2 218.1 219.5 220.3 78
79 199.8 205.3 210.0 213.2 215.4 218.3 219.8 220.6 79
80 200.0 205.5 210.2 213.4 215.6 218.5 220.0 220.8 80
81 200.2 205.7 210.4 213.6 215.8 218.7 220.2 221.1 81
82 200.4 205.9 210.6 213.8 216.0 218.9 220.4 221.3 82
83 200.6 206.1 210.8 214.1 216.2 219.2 220.7 221.6 83
84 200.8 206.3 211.0 214.3 216.4 219.4 220.9 221.9 84
85 201.0 206.5 211.2 214.5 216.7 219.7 221.2 222.2 85
86 201.2 206.8 211.5 214.8 216.9 219.9 221.4 222.5 86
87 201.5 207.0 211.7 215.0 217.2 220.2 221.7 222.8 87
88 201.7 207.3 212.0 215.3 217.4 220.5 222.0 223.2 88
89 202.0 207.5 212.2 215.6 217.7 220.8 222.3 223.5 89
90 202.3 207.8 212.5 215.9 218.0 221.1 222.7 223.9 90
91 202.6 208.1 212.9 216.3 218.4 221.5 223.0 224.3 91
92 203.0 208.5 213.2 216.6 218.7 221.8 223.4 224.8 92
93 203.4 208.9 213.6 217.0 219.1 222.3 223.8 225.3 93
94 203.8 209.3 214.0 217.5 219.6 222.7 224.3 225.8 94
95 204.3 209.8 214.5 218.0 220.1 223.3 224.9 226.5 95
96 204.8 210.3 215.0 218.6 220.7 223.9 225.5 227.2 96
97 205.5 211.0 215.7 219.3 221.4 224.7 226.3 228.1 97
98 206.5 211.9 216.6 220.3 222.4 225.7 227.4 229.4 98
99 207.9 213.4 218.1 221.9 223.9 227.3 229.0 231.3 99
114
Appendix D - Student and School Conditional Growth Distributions
This appendix provides 11 multi-part tables for each content area (mathematics, reading, language usage,
and general science). Each table in a content area presents conditional term-to-term growth distributions
for one grade level (K-10). The term-to-term combinations that make up the parts of each table are:
Last Winter to Winter; Last Spring to Spring; Fall to Winter, Spring, and Next Fall; and Winter to Spring,
respectively. (Since there is no grade prior to kindergarten, only four tables are provided for grade K.)
These tables allow the distribution of growth for students to be readily compared to the corresponding
distribution of growth for schools.
To use these tables, first find the table that corresponds to the content area-grade level combination of
interest, and the panel (a, b, c, or d) in that table that provides the term-to-term growth comparison of
interest. Determine if the growth norms of interest are for students (left sub-panel) or for schools (right
sub-panel). In the RIT column of that sub-panel, find the beginning term RIT value that is closest to the
one of interest. Move to the right to find the mean growth to the second term in the comparison.
For example, if we wanted to find the fall-to-spring mathematics growth for a starting fall RIT of 180 for
grade 2 students, we would find TableD.1.3 (Mathematics Grade 2, Conditional Growth Distributions),
panel C (starting term fall), left sub-panel (students). We would see that a RIT of 180 is roughly at the
60th percentile, and the fall-to-spring growth for students is 14.81. In addition, we see in the top row of the
left sub-panel of panel C, that the standard deviation for this growth is 6.93. If we were further interested
in comparing this growth to that for schools where grade 2 students had a mean starting fall RIT of 180
in mathematics, we would find the closest value to 180 in the RIT Fall column of the right sub-panel
(schools). The closest value is 179.95. Moving from that value to the spring column, we find the fall-spring
growth to be 15.17 with a standard deviation (from the top row of the right sub-panel) of 2.66. We would
also observe that a starting RIT of 180 for schools is associated with the 70th percentile.
115
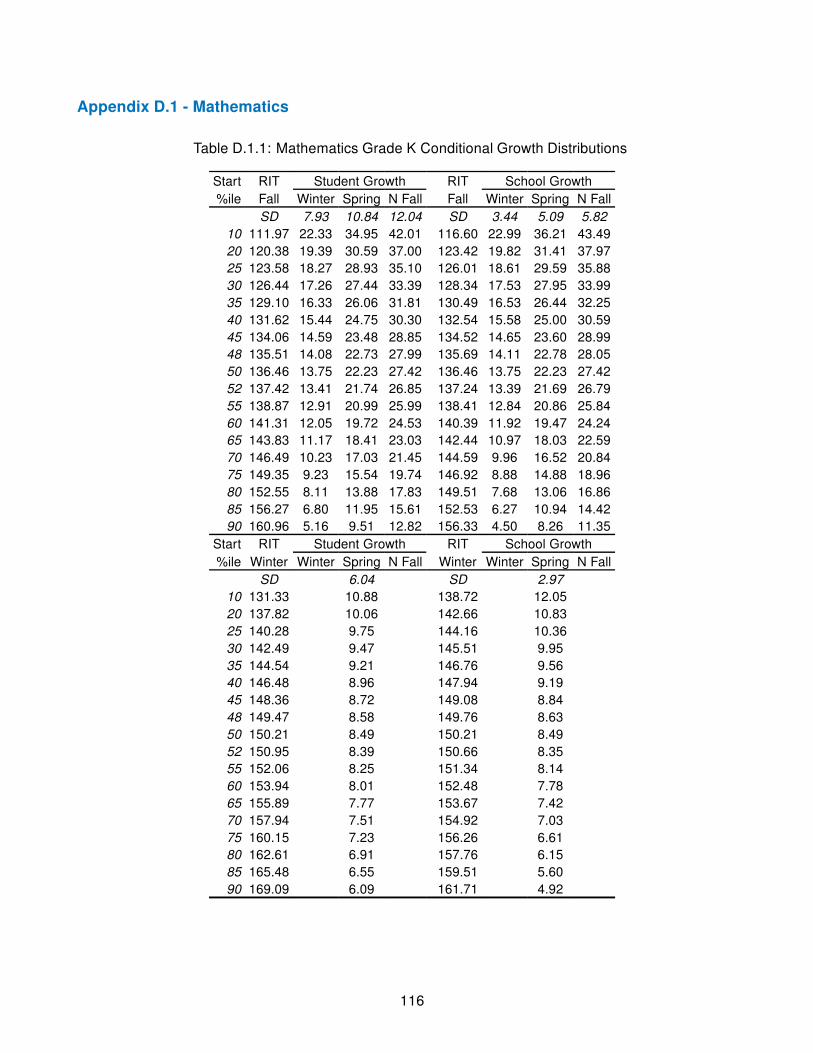
Appendix D.1 - Mathematics
Table D.1.1: Mathematics Grade K Conditional Growth Distributions
Start RIT Student Growth RIT School Growth
%ile Fall Winter Spring N Fall Fall Winter Spring N Fall
SD 7.93 10.84 12.04 SD 3.44 5.09 5.82
10 111.97 22.33 34.95 42.01 116.60 22.99 36.21 43.49
20 120.38 19.39 30.59 37.00 123.42 19.82 31.41 37.97
25 123.58 18.27 28.93 35.10 126.01 18.61 29.59 35.88
30 126.44 17.26 27.44 33.39 128.34 17.53 27.95 33.99
35 129.10 16.33 26.06 31.81 130.49 16.53 26.44 32.25
40 131.62 15.44 24.75 30.30 132.54 15.58 25.00 30.59
45 134.06 14.59 23.48 28.85 134.52 14.65 23.60 28.99
48 135.51 14.08 22.73 27.99 135.69 14.11 22.78 28.05
50 136.46 13.75 22.23 27.42 136.46 13.75 22.23 27.42
52 137.42 13.41 21.74 26.85 137.24 13.39 21.69 26.79
55 138.87 12.91 20.99 25.99 138.41 12.84 20.86 25.84
60 141.31 12.05 19.72 24.53 140.39 11.92 19.47 24.24
65 143.83 11.17 18.41 23.03 142.44 10.97 18.03 22.59
70 146.49 10.23 17.03 21.45 144.59 9.96 16.52 20.84
75 149.35 9.23 15.54 19.74 146.92 8.88 14.88 18.96
80 152.55 8.11 13.88 17.83 149.51 7.68 13.06 16.86
85 156.27 6.80 11.95 15.61 152.53 6.27 10.94 14.42
90 160.96 5.16 9.51 12.82 156.33 4.50 8.26 11.35
Start RIT Student Growth RIT School Growth
%ile Winter Winter Spring N Fall Winter Winter Spring N Fall
SD 6.04 SD 2.97
10 131.33 10.88 138.72 12.05
20 137.82 10.06 142.66 10.83
25 140.28 9.75 144.16 10.36
30 142.49 9.47 145.51 9.95
35 144.54 9.21 146.76 9.56
40 146.48 8.96 147.94 9.19
45 148.36 8.72 149.08 8.84
48 149.47 8.58 149.76 8.63
50 150.21 8.49 150.21 8.49
52 150.95 8.39 150.66 8.35
55 152.06 8.25 151.34 8.14
60 153.94 8.01 152.48 7.78
65 155.89 7.77 153.67 7.42
70 157.94 7.51 154.92 7.03
75 160.15 7.23 156.26 6.61
80 162.61 6.91 157.76 6.15
85 165.48 6.55 159.51 5.60
90 169.09 6.09 161.71 4.92
116

Table D.1.2: Mathematics Grade 1 Conditional Growth Distributions
Start RIT Student Growth RIT School Growth
%ile Last Winter Winter Spring N Fall Last Winter Winter Spring N Fall
SD 6.17 SD 2.60
10 132.83 26.41 142.62 24.46
20 139.18 25.07 145.61 23.79
25 141.60 24.56 146.75 23.53
30 143.77 24.11 147.77 23.31
35 145.77 23.68 148.72 23.09
40 147.68 23.28 149.62 22.89
45 149.53 22.89 150.49 22.70
48 150.62 22.66 151.00 22.58
50 151.34 22.51 151.34 22.51
52 152.07 22.35 151.68 22.43
55 153.16 22.12 152.20 22.31
60 155.00 21.73 153.06 22.12
65 156.91 21.33 153.96 21.92
70 158.92 20.91 154.91 21.71
75 161.08 20.45 155.93 21.48
80 163.50 19.94 157.07 21.22
85 166.31 19.35 158.39 20.93
90 169.85 18.60 160.06 20.55
Start RIT Student Growth RIT School Growth
%ile Last Spring Winter Spring N Fall Last Spring Winter Spring N Fall
SD 6.59 SD 2.91
10 139.17 26.35 149.79 23.84
20 146.19 24.58 153.17 22.93
25 148.86 23.91 154.45 22.59
30 151.25 23.30 155.60 22.28
35 153.47 22.74 156.66 21.99
40 155.58 22.21 157.68 21.72
45 157.61 21.70 158.66 21.45
48 158.82 21.40 159.23 21.30
50 159.62 21.19 159.62 21.19
52 160.42 20.99 160.00 21.09
55 161.62 20.69 160.58 20.94
60 163.66 20.18 161.56 20.67
65 165.77 19.65 162.57 20.40
70 167.99 19.09 163.64 20.11
75 170.38 18.48 164.79 19.80
80 173.05 17.81 166.07 19.46
85 176.16 17.03 167.57 19.06
90 180.07 16.04 169.45 18.55
Start RIT Student Growth RIT School Growth
%ile Fall Winter Spring N Fall Fall Winter Spring N Fall
SD 5.39 7.32 8.02 SD 1.71 2.98 3.34
10 145.93 12.82 20.15 16.21 155.08 11.55 18.60 15.13
20 151.59 12.34 19.55 15.66 157.60 11.51 18.53 14.94
... continued on next page
117
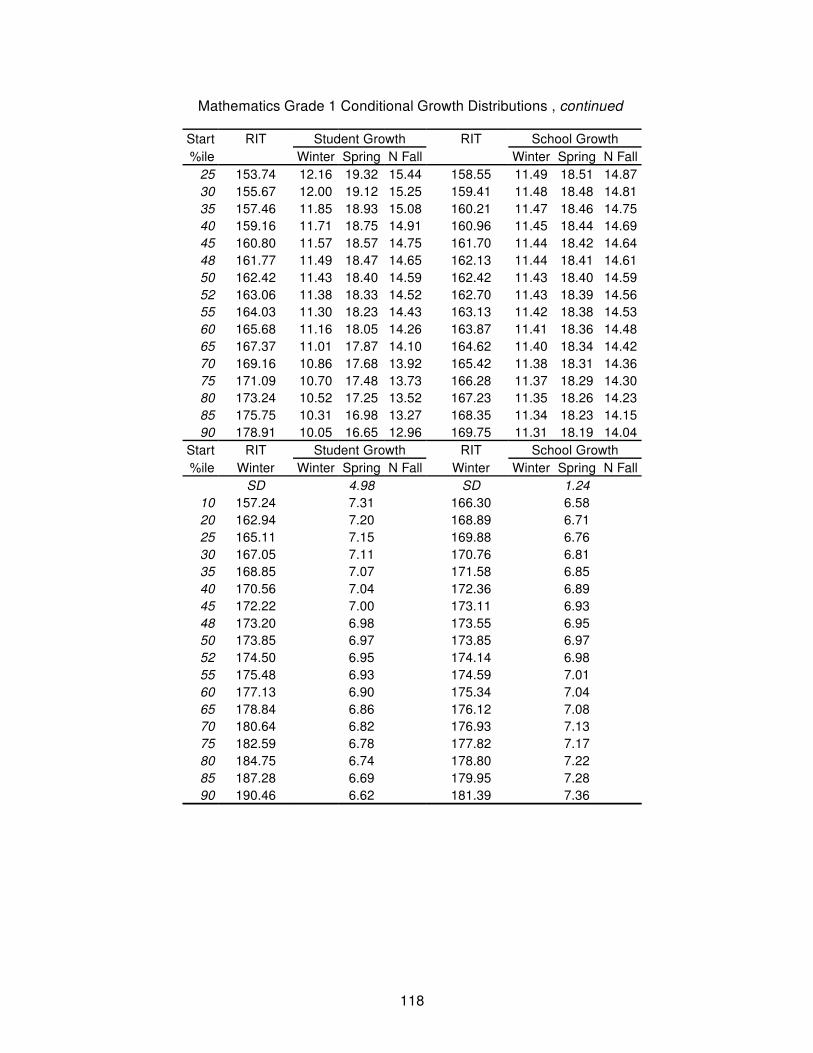
Mathematics Grade 1 Conditional Growth Distributions , continued
Start RIT Student Growth RIT School Growth
%ile Winter Spring N Fall Winter Spring N Fall
25 153.74 12.16 19.32 15.44 158.55 11.49 18.51 14.87
30 155.67 12.00 19.12 15.25 159.41 11.48 18.48 14.81
35 157.46 11.85 18.93 15.08 160.21 11.47 18.46 14.75
40 159.16 11.71 18.75 14.91 160.96 11.45 18.44 14.69
45 160.80 11.57 18.57 14.75 161.70 11.44 18.42 14.64
48 161.77 11.49 18.47 14.65 162.13 11.44 18.41 14.61
50 162.42 11.43 18.40 14.59 162.42 11.43 18.40 14.59
52 163.06 11.38 18.33 14.52 162.70 11.43 18.39 14.56
55 164.03 11.30 18.23 14.43 163.13 11.42 18.38 14.53
60 165.68 11.16 18.05 14.26 163.87 11.41 18.36 14.48
65 167.37 11.01 17.87 14.10 164.62 11.40 18.34 14.42
70 169.16 10.86 17.68 13.92 165.42 11.38 18.31 14.36
75 171.09 10.70 17.48 13.73 166.28 11.37 18.29 14.30
80 173.24 10.52 17.25 13.52 167.23 11.35 18.26 14.23
85 175.75 10.31 16.98 13.27 168.35 11.34 18.23 14.15
90 178.91 10.05 16.65 12.96 169.75 11.31 18.19 14.04
Start RIT Student Growth RIT School Growth
%ile Winter Winter Spring N Fall Winter Winter Spring N Fall
SD 4.98 SD 1.24
10 157.24 7.31 166.30 6.58
20 162.94 7.20 168.89 6.71
25 165.11 7.15 169.88 6.76
30 167.05 7.11 170.76 6.81
35 168.85 7.07 171.58 6.85
40 170.56 7.04 172.36 6.89
45 172.22 7.00 173.11 6.93
48 173.20 6.98 173.55 6.95
50 173.85 6.97 173.85 6.97
52 174.50 6.95 174.14 6.98
55 175.48 6.93 174.59 7.01
60 177.13 6.90 175.34 7.04
65 178.84 6.86 176.12 7.08
70 180.64 6.82 176.93 7.13
75 182.59 6.78 177.82 7.17
80 184.75 6.74 178.80 7.22
85 187.28 6.69 179.95 7.28
90 190.46 6.62 181.39 7.36
118

Table D.1.3: Mathematics Grade 2 Conditional Growth Distributions
Start RIT Student Growth RIT School Growth
%ile Last Winter Winter Spring N Fall Last Winter Winter Spring N Fall
SD 5.88 SD 2.27
10 154.47 16.91 164.35 14.96
20 160.76 15.78 167.25 14.49
25 163.15 15.35 168.35 14.32
30 165.29 14.96 169.34 14.16
35 167.28 14.60 170.25 14.01
40 169.17 14.26 171.12 13.87
45 170.99 13.93 171.96 13.74
48 172.07 13.73 172.46 13.66
50 172.79 13.60 172.79 13.60
52 173.51 13.47 173.12 13.55
55 174.59 13.28 173.62 13.47
60 176.41 12.95 174.46 13.33
65 178.30 12.61 175.33 13.19
70 180.29 12.25 176.24 13.05
75 182.43 11.86 177.23 12.89
80 184.82 11.43 178.33 12.71
85 187.61 10.92 179.62 12.50
90 191.11 10.29 181.23 12.25
Start RIT Student Growth RIT School Growth
%ile Last Spring Winter Spring N Fall Last Spring Winter Spring N Fall
SD 6.51 SD 2.76
10 159.83 17.06 169.88 14.93
20 166.56 15.56 173.16 14.16
25 169.11 14.99 174.40 13.86
30 171.41 14.47 175.52 13.60
35 173.53 14.00 176.56 13.36
40 175.55 13.55 177.54 13.13
45 177.50 13.11 178.49 12.90
48 178.66 12.86 179.05 12.77
50 179.42 12.68 179.42 12.68
52 180.19 12.51 179.80 12.60
55 181.35 12.26 180.36 12.46
60 183.30 11.82 181.31 12.24
65 185.32 11.37 182.29 12.01
70 187.44 10.89 183.33 11.77
75 189.74 10.38 184.45 11.50
80 192.29 9.81 185.69 11.21
85 195.27 9.15 187.14 10.87
90 199.02 8.31 188.97 10.44
Start RIT Student Growth RIT School Growth
%ile Fall Winter Spring N Fall Fall Winter Spring N Fall
SD 5.21 6.93 6.91 SD 1.52 2.66 2.40
10 159.95 11.03 17.25 14.97 169.43 9.56 15.32 13.36
20 165.77 10.50 16.55 14.37 171.99 9.54 15.28 13.32
... continued on next page
119

Mathematics Grade 2 Conditional Growth Distributions , continued
Start RIT Student Growth RIT School Growth
%ile Winter Spring N Fall Winter Spring N Fall
25 167.98 10.30 16.28 14.15 172.97 9.53 15.27 13.30
30 169.96 10.12 16.04 13.94 173.84 9.52 15.26 13.29
35 171.80 9.96 15.82 13.76 174.65 9.51 15.24 13.27
40 173.55 9.80 15.61 13.58 175.42 9.51 15.23 13.26
45 175.23 9.65 15.41 13.40 176.16 9.50 15.22 13.25
48 176.23 9.56 15.29 13.30 176.60 9.50 15.22 13.24
50 176.90 9.50 15.21 13.23 176.90 9.50 15.21 13.23
52 177.56 9.44 15.13 13.17 177.19 9.49 15.21 13.23
55 178.56 9.35 15.01 13.06 177.63 9.49 15.20 13.22
60 180.25 9.19 14.81 12.89 178.37 9.48 15.19 13.21
65 181.99 9.03 14.60 12.71 179.14 9.48 15.18 13.19
70 183.83 8.87 14.38 12.52 179.95 9.47 15.17 13.18
75 185.82 8.69 14.14 12.32 180.83 9.46 15.16 13.16
80 188.03 8.49 13.88 12.09 181.80 9.46 15.14 13.15
85 190.60 8.25 13.57 11.83 182.93 9.45 15.13 13.13
90 193.84 7.96 13.18 11.50 184.36 9.43 15.11 13.10
Start RIT Student Growth RIT School Growth
%ile Winter Winter Spring N Fall Winter Winter Spring N Fall
SD 4.87 SD 1.11
10 169.59 6.32 178.73 5.39
20 175.36 6.11 181.36 5.50
25 177.55 6.03 182.36 5.54
30 179.52 5.96 183.26 5.58
35 181.34 5.90 184.09 5.62
40 183.07 5.84 184.88 5.65
45 184.74 5.78 185.64 5.68
48 185.73 5.74 186.09 5.70
50 186.39 5.72 186.39 5.72
52 187.05 5.69 186.69 5.73
55 188.04 5.66 187.14 5.75
60 189.71 5.60 187.91 5.78
65 191.44 5.54 188.69 5.82
70 193.27 5.47 189.53 5.85
75 195.23 5.40 190.42 5.89
80 197.42 5.32 191.42 5.93
85 199.98 5.23 192.59 5.98
90 203.19 5.11 194.05 6.05
120

Table D.1.4: Mathematics Grade 3 Conditional Growth Distributions
Start RIT Student Growth RIT School Growth
%ile Last Winter Winter Spring N Fall Last Winter Winter Spring N Fall
SD 5.85 SD 2.09
10 169.13 13.78 178.32 12.51
20 174.84 13.32 180.88 12.49
25 177.01 13.15 181.85 12.48
30 178.96 12.99 182.72 12.47
35 180.76 12.85 183.53 12.46
40 182.48 12.71 184.29 12.46
45 184.13 12.57 185.03 12.45
48 185.11 12.50 185.47 12.45
50 185.76 12.44 185.76 12.44
52 186.42 12.39 186.06 12.44
55 187.40 12.31 186.49 12.44
60 189.05 12.18 187.24 12.43
65 190.76 12.04 188.00 12.42
70 192.57 11.90 188.81 12.42
75 194.52 11.74 189.68 12.41
80 196.69 11.57 190.65 12.40
85 199.21 11.36 191.78 12.39
90 202.39 11.11 193.21 12.38
Start RIT Student Growth RIT School Growth
%ile Last Spring Winter Spring N Fall Last Spring Winter Spring N Fall
SD 6.59 SD 2.71
10 174.14 13.71 183.53 12.35
20 180.13 13.05 186.30 12.16
25 182.40 12.81 187.35 12.09
30 184.45 12.58 188.29 12.03
35 186.34 12.38 189.17 11.97
40 188.14 12.18 190.00 11.91
45 189.88 11.99 190.80 11.86
48 190.91 11.88 191.28 11.83
50 191.59 11.81 191.59 11.81
52 192.27 11.73 191.91 11.78
55 193.30 11.62 192.38 11.75
60 195.04 11.43 193.18 11.70
65 196.84 11.23 194.01 11.64
70 198.73 11.03 194.89 11.58
75 200.78 10.80 195.83 11.52
80 203.05 10.56 196.88 11.45
85 205.71 10.27 198.11 11.37
90 209.04 9.90 199.65 11.26
Start RIT Student Growth RIT School Growth
%ile Fall Winter Spring N Fall Fall Winter Spring N Fall
SD 5.02 6.41 6.40 SD 1.25 2.19 1.99
10 173.61 8.82 14.11 11.74 182.87 7.66 12.74 10.86
20 179.37 8.47 13.73 11.61 185.46 7.71 12.83 11.03
... continued on next page
121

Mathematics Grade 3 Conditional Growth Distributions , continued
Start RIT Student Growth RIT School Growth
%ile Winter Spring N Fall Winter Spring N Fall
25 181.56 8.34 13.58 11.56 186.44 7.73 12.86 11.10
30 183.53 8.22 13.45 11.52 187.32 7.75 12.89 11.16
35 185.35 8.11 13.33 11.48 188.14 7.76 12.92 11.21
40 187.08 8.01 13.21 11.44 188.91 7.78 12.94 11.26
45 188.76 7.91 13.10 11.40 189.66 7.79 12.97 11.31
48 189.75 7.85 13.04 11.38 190.11 7.80 12.98 11.34
50 190.40 7.81 12.99 11.36 190.40 7.81 12.99 11.36
52 191.06 7.77 12.95 11.35 190.70 7.81 13.00 11.38
55 192.05 7.71 12.88 11.33 191.14 7.82 13.02 11.41
60 193.72 7.60 12.77 11.29 191.89 7.83 13.04 11.46
65 195.45 7.50 12.66 11.25 192.67 7.85 13.07 11.52
70 197.27 7.39 12.54 11.21 193.49 7.87 13.10 11.57
75 199.24 7.27 12.40 11.16 194.37 7.88 13.13 11.63
80 201.43 7.14 12.26 11.12 195.35 7.90 13.16 11.70
85 203.98 6.98 12.09 11.06 196.49 7.92 13.20 11.77
90 207.20 6.79 11.87 10.99 197.94 7.95 13.25 11.87
Start RIT Student Growth RIT School Growth
%ile Winter Winter Spring N Fall Winter Winter Spring N Fall
SD 4.72 SD 0.90
10 181.17 5.59 190.36 4.83
20 187.02 5.45 193.06 4.96
25 189.24 5.40 194.08 5.00
30 191.24 5.35 195.00 5.04
35 193.09 5.31 195.85 5.08
40 194.84 5.27 196.66 5.12
45 196.54 5.23 197.44 5.15
48 197.54 5.20 197.90 5.17
50 198.21 5.19 198.21 5.19
52 198.87 5.17 198.52 5.20
55 199.88 5.15 198.98 5.22
60 201.58 5.11 199.76 5.26
65 203.33 5.07 200.57 5.29
70 205.18 5.02 201.42 5.33
75 207.17 4.97 202.34 5.37
80 209.40 4.92 203.36 5.42
85 211.99 4.86 204.55 5.47
90 215.24 4.78 206.05 5.54
122

Table D.1.5: Mathematics Grade 4 Conditional Growth Distributions
Start RIT Student Growth RIT School Growth
%ile Last Winter Winter Spring N Fall Last Winter Winter Spring N Fall
SD 5.80 SD 1.88
10 181.04 10.96 190.47 10.19
20 186.92 10.82 193.11 10.31
25 189.15 10.76 194.12 10.36
30 191.16 10.71 195.02 10.40
35 193.02 10.67 195.85 10.44
40 194.78 10.63 196.65 10.47
45 196.49 10.59 197.41 10.51
48 197.50 10.56 197.87 10.53
50 198.17 10.54 198.17 10.54
52 198.84 10.53 198.47 10.56
55 199.85 10.50 198.92 10.58
60 201.55 10.46 199.69 10.61
65 203.31 10.42 200.48 10.65
70 205.17 10.37 201.31 10.69
75 207.18 10.33 202.21 10.73
80 209.41 10.27 203.22 10.78
85 212.01 10.21 204.39 10.83
90 215.29 10.13 205.86 10.90
Start RIT Student Growth RIT School Growth
%ile Last Spring Winter Spring N Fall Last Spring Winter Spring N Fall
SD 6.59 SD 2.44
10 185.44 10.82 195.24 9.81
20 191.65 10.52 198.09 9.86
25 194.01 10.41 199.17 9.88
30 196.13 10.31 200.14 9.89
35 198.10 10.21 201.04 9.91
40 199.96 10.12 201.90 9.92
45 201.76 10.04 202.72 9.94
48 202.83 9.99 203.21 9.95
50 203.54 9.95 203.54 9.95
52 204.24 9.92 203.86 9.96
55 205.31 9.87 204.35 9.97
60 207.11 9.78 205.18 9.98
65 208.98 9.69 206.03 10.00
70 210.94 9.60 206.93 10.01
75 213.06 9.49 207.90 10.03
80 215.42 9.38 208.99 10.05
85 218.17 9.25 210.25 10.07
90 221.63 9.08 211.83 10.10
Start RIT Student Growth RIT School Growth
%ile Fall Winter Spring N Fall Fall Winter Spring N Fall
SD 5.04 6.41 6.11 SD 1.26 2.20 1.72
10 184.31 7.30 11.85 9.47 194.11 6.36 10.82 9.17
20 190.36 7.12 11.74 9.62 196.80 6.50 11.07 9.42
... continued on next page
123

Mathematics Grade 4 Conditional Growth Distributions , continued
Start RIT Student Growth RIT School Growth
%ile Winter Spring N Fall Winter Spring N Fall
25 192.66 7.05 11.71 9.67 197.82 6.55 11.17 9.51
30 194.72 6.99 11.67 9.72 198.74 6.60 11.25 9.60
35 196.64 6.93 11.64 9.77 199.59 6.65 11.33 9.68
40 198.45 6.88 11.61 9.81 200.39 6.69 11.40 9.75
45 200.21 6.82 11.58 9.85 201.17 6.73 11.48 9.82
48 201.25 6.79 11.56 9.88 201.63 6.75 11.52 9.87
50 201.94 6.77 11.55 9.89 201.94 6.77 11.55 9.89
52 202.63 6.75 11.54 9.91 202.25 6.79 11.58 9.92
55 203.67 6.72 11.52 9.94 202.71 6.81 11.62 9.97
60 205.43 6.67 11.49 9.98 203.49 6.85 11.69 10.04
65 207.24 6.61 11.46 10.02 204.29 6.90 11.77 10.11
70 209.16 6.55 11.43 10.07 205.14 6.94 11.85 10.19
75 211.22 6.49 11.39 10.12 206.06 6.99 11.93 10.28
80 213.52 6.42 11.35 10.17 207.08 7.04 12.03 10.37
85 216.20 6.34 11.31 10.24 208.27 7.11 12.14 10.48
90 219.58 6.24 11.25 10.32 209.77 7.19 12.27 10.62
Start RIT Student Growth RIT School Growth
%ile Winter Winter Spring N Fall Winter Winter Spring N Fall
SD 4.72 SD 0.88
10 190.43 4.85 200.31 4.24
20 196.70 4.83 203.20 4.43
25 199.09 4.82 204.29 4.50
30 201.23 4.81 205.27 4.56
35 203.21 4.80 206.19 4.62
40 205.10 4.79 207.05 4.67
45 206.92 4.79 207.89 4.73
48 208.00 4.78 208.38 4.76
50 208.71 4.78 208.71 4.78
52 209.43 4.77 209.04 4.80
55 210.50 4.77 209.53 4.83
60 212.33 4.76 210.37 4.88
65 214.21 4.75 211.24 4.94
70 216.19 4.75 212.15 5.00
75 218.33 4.74 213.13 5.06
80 220.72 4.73 214.23 5.13
85 223.50 4.72 215.50 5.21
90 226.99 4.70 217.11 5.31
124

Table D.1.6: Mathematics Grade 5 Conditional Growth Distributions
Start RIT Student Growth RIT School Growth
%ile Last Winter Winter Spring N Fall Last Winter Winter Spring N Fall
SD 6.11 SD 2.13
10 189.19 10.02 198.96 8.97
20 195.68 9.72 202.09 9.03
25 198.14 9.60 203.28 9.05
30 200.35 9.50 204.35 9.07
35 202.40 9.40 205.34 9.09
40 204.35 9.31 206.28 9.11
45 206.23 9.23 207.19 9.12
48 207.35 9.18 207.73 9.13
50 208.09 9.14 208.09 9.14
52 208.82 9.11 208.44 9.15
55 209.94 9.06 208.98 9.16
60 211.82 8.97 209.89 9.18
65 213.77 8.88 210.83 9.19
70 215.82 8.78 211.82 9.21
75 218.03 8.68 212.89 9.23
80 220.49 8.57 214.08 9.26
85 223.37 8.44 215.47 9.28
90 226.98 8.27 217.21 9.32
Start RIT Student Growth RIT School Growth
%ile Last Spring Winter Spring N Fall Last Spring Winter Spring N Fall
SD 6.91 SD 2.85
10 192.53 10.08 202.77 8.79
20 199.47 9.58 206.19 8.73
25 202.10 9.39 207.49 8.71
30 204.47 9.22 208.66 8.69
35 206.66 9.06 209.74 8.67
40 208.74 8.91 210.77 8.65
45 210.76 8.76 211.76 8.64
48 211.95 8.68 212.35 8.63
50 212.74 8.62 212.74 8.62
52 213.53 8.56 213.13 8.61
55 214.72 8.48 213.72 8.60
60 216.73 8.33 214.71 8.59
65 218.81 8.18 215.74 8.57
70 221.01 8.02 216.82 8.55
75 223.37 7.85 217.98 8.53
80 226.01 7.66 219.28 8.51
85 229.08 7.44 220.80 8.48
90 232.95 7.16 222.71 8.45
Start RIT Student Growth RIT School Growth
%ile Fall Winter Spring N Fall Fall Winter Spring N Fall
SD 5.21 6.80 6.48 SD 1.49 2.60 2.04
10 192.63 6.12 9.91 5.35 202.47 5.25 8.98 5.20
20 199.09 6.01 9.91 5.57 205.55 5.43 9.30 5.47
... continued on next page
125

Mathematics Grade 5 Conditional Growth Distributions , continued
Start RIT Student Growth RIT School Growth
%ile Winter Spring N Fall Winter Spring N Fall
25 201.54 5.96 9.91 5.65 206.72 5.50 9.42 5.57
30 203.74 5.92 9.92 5.73 207.77 5.57 9.53 5.66
35 205.78 5.89 9.92 5.80 208.74 5.63 9.64 5.75
40 207.72 5.85 9.92 5.86 209.67 5.68 9.73 5.83
45 209.59 5.82 9.92 5.93 210.56 5.74 9.83 5.91
48 210.70 5.80 9.92 5.96 211.09 5.77 9.88 5.96
50 211.44 5.79 9.92 5.99 211.44 5.79 9.92 5.99
52 212.18 5.78 9.92 6.01 211.79 5.81 9.96 6.02
55 213.28 5.76 9.92 6.05 212.32 5.84 10.01 6.07
60 215.16 5.72 9.92 6.11 213.21 5.89 10.11 6.15
65 217.09 5.69 9.92 6.18 214.14 5.95 10.20 6.23
70 219.14 5.65 9.92 6.25 215.11 6.01 10.30 6.31
75 221.34 5.61 9.92 6.32 216.16 6.07 10.41 6.41
80 223.79 5.57 9.92 6.41 217.33 6.14 10.54 6.51
85 226.65 5.52 9.92 6.50 218.69 6.22 10.68 6.63
90 230.25 5.46 9.93 6.63 220.41 6.33 10.86 6.78
Start RIT Student Growth RIT School Growth
%ile Winter Winter Spring N Fall Winter Winter Spring N Fall
SD 4.81 SD 1.03
10 197.58 3.98 207.53 3.45
20 204.32 4.03 210.86 3.69
25 206.89 4.05 212.12 3.77
30 209.19 4.07 213.26 3.85
35 211.32 4.09 214.31 3.93
40 213.34 4.10 215.31 4.00
45 215.30 4.12 216.28 4.06
48 216.46 4.12 216.85 4.10
50 217.23 4.13 217.23 4.13
52 218.00 4.14 217.61 4.16
55 219.15 4.15 218.18 4.20
60 221.11 4.16 219.14 4.26
65 223.13 4.18 220.14 4.33
70 225.27 4.19 221.19 4.41
75 227.57 4.21 222.33 4.49
80 230.13 4.23 223.59 4.57
85 233.12 4.25 225.07 4.68
90 236.87 4.28 226.92 4.81
126

Table D.1.7: Mathematics Grade 6 Conditional Growth Distributions
Start RIT Student Growth RIT School Growth
%ile Last Winter Winter Spring N Fall Last Winter Winter Spring N Fall
SD 6.12 SD 2.01
10 195.80 7.30 206.89 5.77
20 202.88 6.73 210.17 5.72
25 205.57 6.51 211.41 5.70
30 207.99 6.31 212.53 5.68
35 210.23 6.13 213.57 5.67
40 212.35 5.96 214.55 5.65
45 214.41 5.79 215.50 5.64
48 215.63 5.69 216.06 5.63
50 216.43 5.63 216.43 5.63
52 217.24 5.56 216.81 5.62
55 218.46 5.46 217.37 5.61
60 220.51 5.29 218.32 5.60
65 222.64 5.12 219.30 5.58
70 224.88 4.94 220.34 5.57
75 227.29 4.74 221.45 5.55
80 229.98 4.52 222.70 5.53
85 233.12 4.27 224.15 5.51
90 237.07 3.95 225.97 5.49
Start RIT Student Growth RIT School Growth
%ile Last Spring Winter Spring N Fall Last Spring Winter Spring N Fall
SD 6.84 SD 2.49
10 198.21 7.58 210.05 5.47
20 205.84 6.65 213.62 5.26
25 208.74 6.30 214.98 5.19
30 211.35 5.98 216.19 5.12
35 213.76 5.69 217.32 5.06
40 216.05 5.41 218.39 5.00
45 218.26 5.14 219.43 4.94
48 219.57 4.98 220.04 4.90
50 220.44 4.88 220.44 4.88
52 221.31 4.77 220.85 4.86
55 222.62 4.61 221.46 4.82
60 224.84 4.35 222.50 4.76
65 227.13 4.07 223.57 4.70
70 229.54 3.78 224.70 4.64
75 232.15 3.46 225.91 4.57
80 235.05 3.11 227.27 4.49
85 238.43 2.70 228.85 4.40
90 242.68 2.18 230.83 4.29
Start RIT Student Growth RIT School Growth
%ile Fall Winter Spring N Fall Fall Winter Spring N Fall
SD 5.18 6.74 6.67 SD 1.30 2.27 1.96
10 197.72 4.94 8.01 6.61 208.40 4.06 7.03 6.06
20 204.55 4.77 7.91 6.64 211.56 4.19 7.26 6.28
... continued on next page
127

Mathematics Grade 6 Conditional Growth Distributions , continued
Start RIT Student Growth RIT School Growth
%ile Winter Spring N Fall Winter Spring N Fall
25 207.14 4.70 7.87 6.65 212.77 4.24 7.35 6.36
30 209.47 4.64 7.83 6.66 213.85 4.28 7.43 6.44
35 211.63 4.59 7.80 6.67 214.85 4.33 7.50 6.51
40 213.68 4.54 7.77 6.68 215.80 4.37 7.57 6.58
45 215.67 4.49 7.74 6.69 216.71 4.40 7.64 6.64
48 216.84 4.46 7.72 6.70 217.26 4.43 7.68 6.68
50 217.62 4.44 7.71 6.70 217.62 4.44 7.71 6.70
52 218.40 4.42 7.69 6.71 217.98 4.46 7.73 6.73
55 219.57 4.39 7.68 6.71 218.52 4.48 7.77 6.77
60 221.55 4.34 7.64 6.72 219.44 4.52 7.84 6.83
65 223.60 4.29 7.61 6.73 220.39 4.56 7.91 6.90
70 225.76 4.24 7.58 6.74 221.39 4.60 7.98 6.97
75 228.09 4.18 7.54 6.75 222.47 4.64 8.06 7.04
80 230.69 4.12 7.50 6.76 223.67 4.69 8.15 7.12
85 233.71 4.04 7.46 6.78 225.07 4.75 8.25 7.22
90 237.52 3.95 7.40 6.80 226.84 4.83 8.38 7.35
Start RIT Student Growth RIT School Growth
%ile Winter Winter Spring N Fall Winter Winter Spring N Fall
SD 4.80 SD 0.92
10 201.55 3.26 212.31 2.77
20 208.59 3.26 215.66 2.94
25 211.26 3.26 216.93 3.00
30 213.67 3.26 218.07 3.06
35 215.89 3.26 219.13 3.12
40 218.00 3.26 220.13 3.17
45 220.05 3.26 221.10 3.22
48 221.26 3.26 221.68 3.24
50 222.06 3.26 222.06 3.26
52 222.86 3.26 222.44 3.28
55 224.07 3.26 223.02 3.31
60 226.11 3.26 223.99 3.36
65 228.23 3.26 224.99 3.41
70 230.45 3.26 226.05 3.47
75 232.85 3.26 227.19 3.53
80 235.53 3.26 228.46 3.59
85 238.65 3.26 229.94 3.67
90 242.57 3.26 231.81 3.76
128

Table D.1.8: Mathematics Grade 7 Conditional Growth Distributions
Start RIT Student Growth RIT School Growth
%ile Last Winter Winter Spring N Fall Last Winter Winter Spring N Fall
SD 5.76 SD 1.80
10 199.31 6.22 210.63 5.42
20 206.67 5.93 214.11 5.40
25 209.47 5.82 215.43 5.39
30 211.98 5.72 216.62 5.38
35 214.31 5.62 217.71 5.38
40 216.52 5.53 218.76 5.37
45 218.65 5.45 219.77 5.37
48 219.92 5.40 220.36 5.37
50 220.76 5.36 220.76 5.36
52 221.60 5.33 221.15 5.36
55 222.86 5.28 221.75 5.36
60 225.00 5.19 222.76 5.35
65 227.21 5.10 223.80 5.35
70 229.54 5.01 224.90 5.34
75 232.05 4.91 226.09 5.34
80 234.85 4.80 227.41 5.33
85 238.11 4.67 228.95 5.32
90 242.21 4.50 230.88 5.31
Start RIT Student Growth RIT School Growth
%ile Last Spring Winter Spring N Fall Last Spring Winter Spring N Fall
SD 6.46 SD 2.17
10 200.89 6.56 212.79 5.37
20 208.71 5.99 216.53 5.21
25 211.69 5.78 217.95 5.15
30 214.35 5.59 219.22 5.10
35 216.83 5.41 220.40 5.05
40 219.17 5.24 221.52 5.01
45 221.44 5.08 222.61 4.96
48 222.79 4.98 223.25 4.93
50 223.68 4.92 223.68 4.92
52 224.57 4.85 224.10 4.90
55 225.91 4.76 224.74 4.87
60 228.18 4.59 225.83 4.83
65 230.53 4.42 226.95 4.78
70 233.00 4.24 228.13 4.73
75 235.67 4.05 229.41 4.68
80 238.64 3.84 230.83 4.62
85 242.10 3.59 232.48 4.55
90 246.46 3.28 234.56 4.47
Start RIT Student Growth RIT School Growth
%ile Fall Winter Spring N Fall Fall Winter Spring N Fall
SD 5.10 6.54 6.25 SD 1.19 2.08 1.89
10 201.38 3.87 6.11 5.08 212.76 3.14 5.36 4.86
20 208.68 3.73 6.05 5.22 216.16 3.26 5.56 5.07
... continued on next page
129

Mathematics Grade 7 Conditional Growth Distributions , continued
Start RIT Student Growth RIT School Growth
%ile Winter Spring N Fall Winter Spring N Fall
25 211.46 3.68 6.03 5.27 217.44 3.30 5.64 5.15
30 213.95 3.63 6.01 5.31 218.60 3.34 5.71 5.22
35 216.25 3.59 6.00 5.35 219.68 3.37 5.77 5.29
40 218.44 3.55 5.98 5.39 220.69 3.41 5.83 5.35
45 220.56 3.51 5.96 5.43 221.68 3.44 5.89 5.41
48 221.82 3.49 5.95 5.46 222.26 3.46 5.92 5.45
50 222.65 3.47 5.95 5.47 222.65 3.47 5.95 5.47
52 223.48 3.46 5.94 5.49 223.03 3.49 5.97 5.49
55 224.73 3.44 5.93 5.51 223.62 3.51 6.00 5.53
60 226.85 3.40 5.91 5.55 224.60 3.54 6.06 5.59
65 229.04 3.36 5.90 5.59 225.62 3.57 6.12 5.65
70 231.35 3.31 5.88 5.63 226.69 3.61 6.18 5.72
75 233.84 3.27 5.86 5.67 227.85 3.65 6.25 5.79
80 236.61 3.22 5.84 5.72 229.14 3.69 6.33 5.87
85 239.85 3.16 5.81 5.78 230.64 3.74 6.42 5.97
90 243.91 3.08 5.78 5.86 232.53 3.81 6.53 6.08
Start RIT Student Growth RIT School Growth
%ile Winter Winter Spring N Fall Winter Winter Spring N Fall
SD 4.75 SD 0.86
10 204.25 2.47 215.79 2.06
20 211.76 2.47 219.34 2.20
25 214.61 2.47 220.68 2.25
30 217.17 2.47 221.89 2.30
35 219.54 2.47 223.02 2.35
40 221.80 2.47 224.08 2.39
45 223.98 2.47 225.11 2.43
48 225.27 2.47 225.72 2.46
50 226.12 2.47 226.12 2.47
52 226.98 2.47 226.53 2.49
55 228.27 2.47 227.13 2.51
60 230.45 2.47 228.16 2.55
65 232.70 2.47 229.23 2.60
70 235.07 2.47 230.35 2.64
75 237.63 2.47 231.56 2.69
80 240.49 2.47 232.91 2.74
85 243.81 2.47 234.48 2.81
90 248.00 2.47 236.45 2.89
130

Table D.1.9: Mathematics Grade 8 Conditional Growth Distributions
Start RIT Student Growth RIT School Growth
%ile Last Winter Winter Spring N Fall Last Winter Winter Spring N Fall
SD 6.42 SD 1.97
10 201.94 5.23 213.41 4.20
20 209.74 4.98 217.27 4.30
25 212.70 4.88 218.74 4.34
30 215.37 4.79 220.06 4.37
35 217.83 4.71 221.28 4.40
40 220.17 4.63 222.44 4.43
45 222.44 4.56 223.56 4.46
48 223.77 4.51 224.22 4.47
50 224.66 4.48 224.66 4.48
52 225.55 4.46 225.10 4.50
55 226.89 4.41 225.77 4.51
60 229.16 4.34 226.89 4.54
65 231.50 4.26 228.05 4.57
70 233.96 4.18 229.27 4.60
75 236.62 4.09 230.59 4.63
80 239.59 3.99 232.05 4.67
85 243.04 3.88 233.76 4.71
90 247.39 3.74 235.92 4.77
Start RIT Student Growth RIT School Growth
%ile Last Spring Winter Spring N Fall Last Spring Winter Spring N Fall
SD 7.70 SD 2.50
10 203.15 5.37 215.16 3.86
20 211.31 4.90 219.20 3.91
25 214.41 4.72 220.73 3.93
30 217.20 4.56 222.11 3.95
35 219.78 4.41 223.39 3.96
40 222.22 4.27 224.60 3.98
45 224.59 4.14 225.77 3.99
48 225.99 4.06 226.46 4.00
50 226.92 4.00 226.92 4.00
52 227.85 3.95 227.38 4.01
55 229.25 3.87 228.08 4.02
60 231.62 3.73 229.25 4.03
65 234.07 3.59 230.46 4.05
70 236.65 3.45 231.74 4.06
75 239.43 3.29 233.12 4.08
80 242.53 3.11 234.65 4.10
85 246.15 2.90 236.44 4.12
90 250.69 2.64 238.69 4.15
Start RIT Student Growth RIT School Growth
%ile Fall Winter Spring N Fall Fall Winter Spring N Fall
SD 5.58 7.65 7.11 SD 1.21 2.12 1.92
10 203.42 3.37 5.07 2.85 215.03 2.42 3.87 3.15
20 211.28 3.19 4.91 3.23 218.90 2.56 4.13 3.43
... continued on next page
131
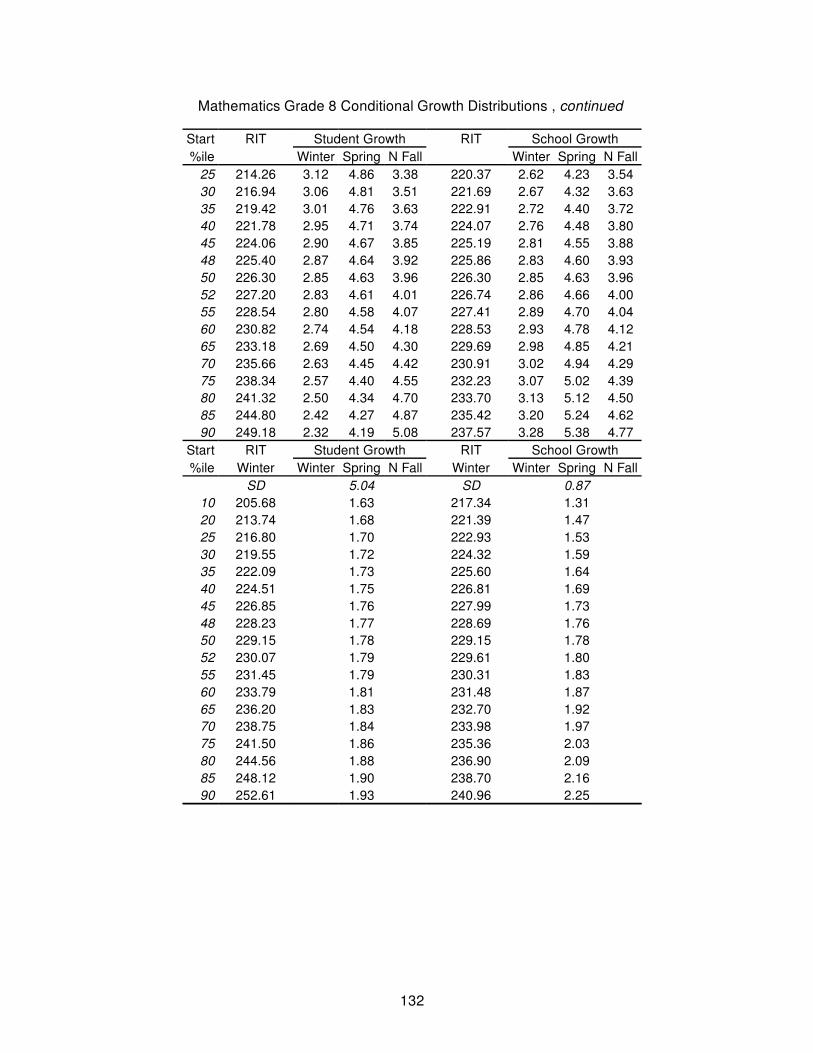
Mathematics Grade 8 Conditional Growth Distributions , continued
Start RIT Student Growth RIT School Growth
%ile Winter Spring N Fall Winter Spring N Fall
25 214.26 3.12 4.86 3.38 220.37 2.62 4.23 3.54
30 216.94 3.06 4.81 3.51 221.69 2.67 4.32 3.63
35 219.42 3.01 4.76 3.63 222.91 2.72 4.40 3.72
40 221.78 2.95 4.71 3.74 224.07 2.76 4.48 3.80
45 224.06 2.90 4.67 3.85 225.19 2.81 4.55 3.88
48 225.40 2.87 4.64 3.92 225.86 2.83 4.60 3.93
50 226.30 2.85 4.63 3.96 226.30 2.85 4.63 3.96
52 227.20 2.83 4.61 4.01 226.74 2.86 4.66 4.00
55 228.54 2.80 4.58 4.07 227.41 2.89 4.70 4.04
60 230.82 2.74 4.54 4.18 228.53 2.93 4.78 4.12
65 233.18 2.69 4.50 4.30 229.69 2.98 4.85 4.21
70 235.66 2.63 4.45 4.42 230.91 3.02 4.94 4.29
75 238.34 2.57 4.40 4.55 232.23 3.07 5.02 4.39
80 241.32 2.50 4.34 4.70 233.70 3.13 5.12 4.50
85 244.80 2.42 4.27 4.87 235.42 3.20 5.24 4.62
90 249.18 2.32 4.19 5.08 237.57 3.28 5.38 4.77
Start RIT Student Growth RIT School Growth
%ile Winter Winter Spring N Fall Winter Winter Spring N Fall
SD 5.04 SD 0.87
10 205.68 1.63 217.34 1.31
20 213.74 1.68 221.39 1.47
25 216.80 1.70 222.93 1.53
30 219.55 1.72 224.32 1.59
35 222.09 1.73 225.60 1.64
40 224.51 1.75 226.81 1.69
45 226.85 1.76 227.99 1.73
48 228.23 1.77 228.69 1.76
50 229.15 1.78 229.15 1.78
52 230.07 1.79 229.61 1.80
55 231.45 1.79 230.31 1.83
60 233.79 1.81 231.48 1.87
65 236.20 1.83 232.70 1.92
70 238.75 1.84 233.98 1.97
75 241.50 1.86 235.36 2.03
80 244.56 1.88 236.90 2.09
85 248.12 1.90 238.70 2.16
90 252.61 1.93 240.96 2.25
132

Table D.1.10: Mathematics Grade 9 Conditional Growth Distributions
Start RIT Student Growth RIT School Growth
%ile Last Winter Winter Spring N Fall Last Winter Winter Spring N Fall
SD 7.06 SD 2.43
10 204.78 5.37 216.90 3.43
20 213.19 4.55 221.15 3.28
25 216.38 4.24 222.76 3.22
30 219.24 3.96 224.20 3.16
35 221.90 3.70 225.54 3.11
40 224.42 3.45 226.82 3.07
45 226.86 3.21 228.05 3.02
48 228.30 3.07 228.78 2.99
50 229.26 2.98 229.26 2.98
52 230.22 2.88 229.74 2.96
55 231.66 2.74 230.47 2.93
60 234.10 2.50 231.70 2.89
65 236.62 2.26 232.97 2.84
70 239.27 2.00 234.31 2.79
75 242.14 1.72 235.76 2.74
80 245.33 1.41 237.37 2.68
85 249.05 1.04 239.25 2.61
90 253.73 0.58 241.61 2.52
Start RIT Student Growth RIT School Growth
%ile Last Spring Winter Spring N Fall Last Spring Winter Spring N Fall
SD 8.15 SD 2.93
10 205.06 5.62 217.77 3.32
20 213.92 4.55 222.27 3.04
25 217.29 4.15 223.98 2.94
30 220.32 3.78 225.52 2.84
35 223.12 3.45 226.94 2.76
40 225.78 3.13 228.30 2.67
45 228.36 2.82 229.60 2.60
48 229.88 2.64 230.38 2.55
50 230.89 2.52 230.89 2.52
52 231.90 2.40 231.40 2.49
55 233.42 2.21 232.17 2.44
60 236.00 1.90 233.48 2.36
65 238.66 1.58 234.83 2.28
70 241.46 1.25 236.26 2.19
75 244.48 0.89 237.79 2.10
80 247.85 0.48 239.50 1.99
85 251.78 0.01 241.50 1.87
90 256.72 -0.58 244.01 1.72
Start RIT Student Growth RIT School Growth
%ile Fall Winter Spring N Fall Fall Winter Spring N Fall
SD 5.80 8.14 7.38 SD 1.31 2.29 2.35
10 207.03 2.52 3.63 2.54 218.56 1.49 2.31 1.98
20 215.01 2.33 3.46 2.49 222.58 1.65 2.59 2.12
... continued on next page
133
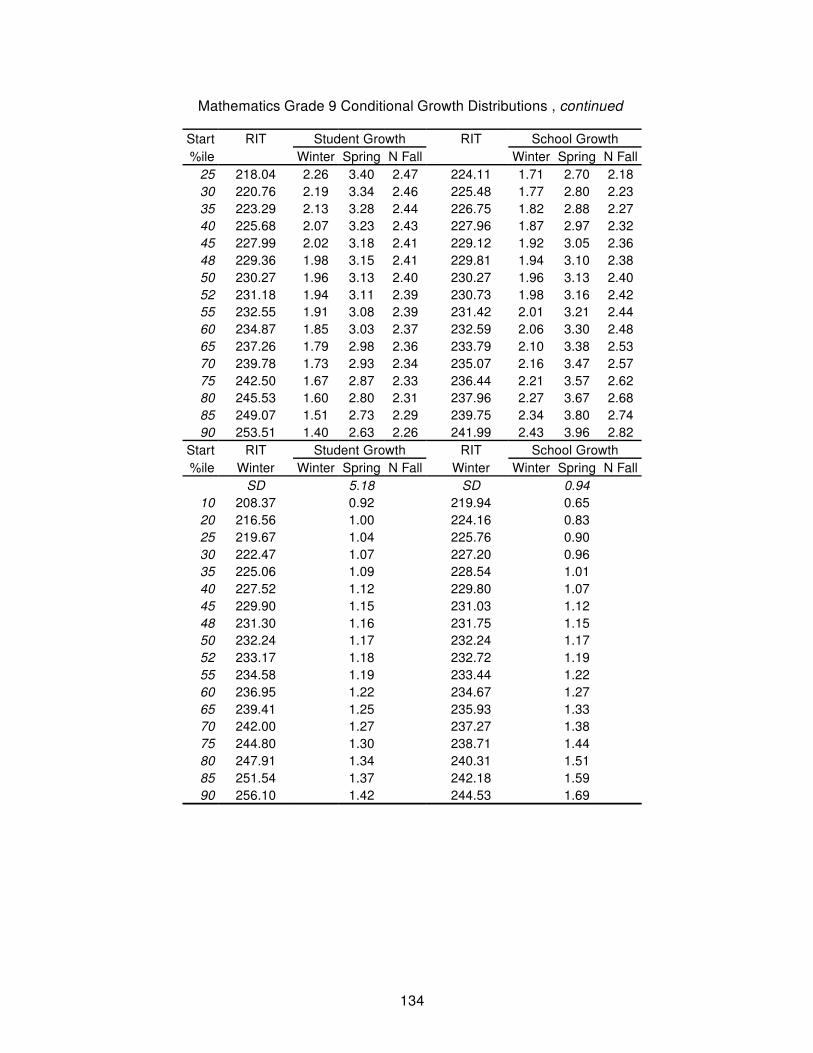
Mathematics Grade 9 Conditional Growth Distributions , continued
Start RIT Student Growth RIT School Growth
%ile Winter Spring N Fall Winter Spring N Fall
25 218.04 2.26 3.40 2.47 224.11 1.71 2.70 2.18
30 220.76 2.19 3.34 2.46 225.48 1.77 2.80 2.23
35 223.29 2.13 3.28 2.44 226.75 1.82 2.88 2.27
40 225.68 2.07 3.23 2.43 227.96 1.87 2.97 2.32
45 227.99 2.02 3.18 2.41 229.12 1.92 3.05 2.36
48 229.36 1.98 3.15 2.41 229.81 1.94 3.10 2.38
50 230.27 1.96 3.13 2.40 230.27 1.96 3.13 2.40
52 231.18 1.94 3.11 2.39 230.73 1.98 3.16 2.42
55 232.55 1.91 3.08 2.39 231.42 2.01 3.21 2.44
60 234.87 1.85 3.03 2.37 232.59 2.06 3.30 2.48
65 237.26 1.79 2.98 2.36 233.79 2.10 3.38 2.53
70 239.78 1.73 2.93 2.34 235.07 2.16 3.47 2.57
75 242.50 1.67 2.87 2.33 236.44 2.21 3.57 2.62
80 245.53 1.60 2.80 2.31 237.96 2.27 3.67 2.68
85 249.07 1.51 2.73 2.29 239.75 2.34 3.80 2.74
90 253.51 1.40 2.63 2.26 241.99 2.43 3.96 2.82
Start RIT Student Growth RIT School Growth
%ile Winter Winter Spring N Fall Winter Winter Spring N Fall
SD 5.18 SD 0.94
10 208.37 0.92 219.94 0.65
20 216.56 1.00 224.16 0.83
25 219.67 1.04 225.76 0.90
30 222.47 1.07 227.20 0.96
35 225.06 1.09 228.54 1.01
40 227.52 1.12 229.80 1.07
45 229.90 1.15 231.03 1.12
48 231.30 1.16 231.75 1.15
50 232.24 1.17 232.24 1.17
52 233.17 1.18 232.72 1.19
55 234.58 1.19 233.44 1.22
60 236.95 1.22 234.67 1.27
65 239.41 1.25 235.93 1.33
70 242.00 1.27 237.27 1.38
75 244.80 1.30 238.71 1.44
80 247.91 1.34 240.31 1.51
85 251.54 1.37 242.18 1.59
90 256.10 1.42 244.53 1.69
134

Table D.1.11: Mathematics Grade 10 Conditional Growth Distributions
Start RIT Student Growth RIT School Growth
%ile Last Winter Winter Spring N Fall Last Winter Winter Spring N Fall
SD 6.95 SD 2.05
10 204.04 3.43 216.05 2.45
20 212.70 3.02 220.59 2.38
25 215.99 2.87 222.31 2.35
30 218.94 2.73 223.86 2.33
35 221.68 2.60 225.29 2.31
40 224.28 2.48 226.65 2.29
45 226.79 2.36 227.97 2.27
48 228.28 2.29 228.75 2.25
50 229.27 2.25 229.27 2.25
52 230.26 2.20 229.79 2.24
55 231.74 2.13 230.57 2.23
60 234.26 2.01 231.88 2.21
65 236.85 1.89 233.24 2.19
70 239.59 1.76 234.68 2.16
75 242.55 1.63 236.23 2.14
80 245.84 1.47 237.95 2.11
85 249.67 1.29 239.96 2.08
90 254.50 1.07 242.49 2.04
Start RIT Student Growth RIT School Growth
%ile Last Spring Winter Spring N Fall Last Spring Winter Spring N Fall
SD 8.79 SD 2.70
10 203.72 4.27 216.49 2.56
20 212.82 3.54 221.21 2.42
25 216.27 3.26 223.00 2.36
30 219.38 3.01 224.61 2.31
35 222.26 2.78 226.10 2.27
40 224.99 2.56 227.51 2.22
45 227.63 2.35 228.88 2.18
48 229.19 2.22 229.69 2.16
50 230.23 2.14 230.23 2.14
52 231.26 2.06 230.76 2.12
55 232.82 1.93 231.57 2.10
60 235.47 1.72 232.94 2.06
65 238.20 1.50 234.35 2.01
70 241.07 1.27 235.85 1.97
75 244.18 1.02 237.45 1.92
80 247.63 0.74 239.24 1.86
85 251.66 0.42 241.33 1.80
90 256.73 0.01 243.96 1.72
Start RIT Student Growth RIT School Growth
%ile Fall Winter Spring N Fall Fall Winter Spring N Fall
SD 6.15 8.90 7.73 SD 1.51 2.65 2.20
10 204.94 2.17 3.11 1.09 217.17 1.21 1.87 1.65
20 213.56 1.93 2.84 1.40 221.59 1.30 2.02 1.77
... continued on next page
135

Mathematics Grade 10 Conditional Growth Distributions , continued
Start RIT Student Growth RIT School Growth
%ile Winter Spring N Fall Winter Spring N Fall
25 216.84 1.83 2.73 1.52 223.27 1.33 2.08 1.81
30 219.78 1.75 2.64 1.63 224.78 1.36 2.13 1.85
35 222.50 1.67 2.55 1.73 226.18 1.38 2.18 1.89
40 225.09 1.60 2.47 1.82 227.51 1.41 2.22 1.93
45 227.59 1.53 2.39 1.91 228.79 1.44 2.27 1.96
48 229.07 1.49 2.34 1.96 229.55 1.45 2.29 1.98
50 230.06 1.46 2.31 2.00 230.06 1.46 2.31 2.00
52 231.04 1.43 2.28 2.03 230.56 1.47 2.33 2.01
55 232.52 1.39 2.23 2.09 231.32 1.48 2.35 2.03
60 235.02 1.32 2.15 2.18 232.60 1.51 2.40 2.07
65 237.61 1.25 2.07 2.27 233.93 1.53 2.44 2.10
70 240.33 1.17 1.98 2.37 235.33 1.56 2.49 2.14
75 243.27 1.09 1.89 2.48 236.84 1.59 2.54 2.18
80 246.55 0.99 1.78 2.59 238.52 1.62 2.60 2.23
85 250.37 0.88 1.66 2.73 240.48 1.66 2.66 2.28
90 255.17 0.75 1.51 2.91 242.94 1.71 2.75 2.35
Start RIT Student Growth RIT School Growth
%ile Winter Winter Spring N Fall Winter Winter Spring N Fall
SD 5.41 SD 1.10
10 205.87 0.55 218.23 0.45
20 214.67 0.65 222.79 0.59
25 218.02 0.69 224.53 0.64
30 221.02 0.73 226.08 0.69
35 223.80 0.76 227.52 0.73
40 226.45 0.79 228.89 0.77
45 229.00 0.82 230.21 0.81
48 230.51 0.84 231.00 0.83
50 231.52 0.85 231.52 0.85
52 232.52 0.86 232.04 0.87
55 234.03 0.88 232.82 0.89
60 236.59 0.91 234.14 0.93
65 239.23 0.94 235.51 0.97
70 242.01 0.97 236.95 1.01
75 245.01 1.01 238.51 1.06
80 248.36 1.05 240.24 1.11
85 252.26 1.09 242.26 1.17
90 257.16 1.15 244.80 1.25
136

Appendix D.2 - Reading
Table D.2.1: Reading Grade K Conditional Growth Distributions
Start RIT Student Growth RIT School Growth
%ile Fall Winter Spring N Fall Fall Winter Spring N Fall
SD 7.96 10.82 12.09 SD 3.25 4.91 5.69
10 116.02 20.43 31.75 38.05 120.27 20.75 32.66 39.23
20 123.40 17.68 27.74 33.50 126.19 17.89 28.35 34.27
25 126.21 16.63 26.22 31.77 128.44 16.80 26.71 32.39
30 128.73 15.69 24.86 30.22 130.47 15.82 25.23 30.70
35 131.06 14.82 23.59 28.78 132.34 14.92 23.87 29.13
40 133.28 14.00 22.39 27.41 134.12 14.06 22.57 27.64
45 135.42 13.20 21.23 26.09 135.84 13.23 21.32 26.21
48 136.69 12.73 20.54 25.31 136.85 12.74 20.58 25.36
50 137.53 12.41 20.09 24.79 137.53 12.41 20.09 24.79
52 138.37 12.10 19.63 24.27 138.21 12.09 19.60 24.23
55 139.64 11.63 18.94 23.49 139.22 11.59 18.85 23.37
60 141.78 10.83 17.78 22.17 140.94 10.76 17.60 21.94
65 144.00 10.00 16.58 20.80 142.72 9.90 16.31 20.45
70 146.33 9.13 15.32 19.37 144.59 9.00 14.94 18.88
75 148.85 8.19 13.95 17.81 146.61 8.02 13.47 17.19
80 151.65 7.15 12.43 16.08 148.87 6.94 11.83 15.31
85 154.92 5.93 10.66 14.07 151.49 5.67 9.92 13.11
90 159.04 4.39 8.43 11.53 154.79 4.07 7.51 10.35
Start RIT Student Growth RIT School Growth
%ile Winter Winter Spring N Fall Winter Winter Spring N Fall
SD 6.28 SD 2.92
10 133.03 9.61 140.09 10.63
20 138.83 8.94 143.47 9.61
25 141.04 8.69 144.76 9.23
30 143.02 8.47 145.91 8.88
35 144.86 8.26 146.98 8.56
40 146.60 8.06 147.99 8.26
45 148.28 7.86 148.98 7.96
48 149.28 7.75 149.56 7.79
50 149.94 7.68 149.94 7.68
52 150.60 7.60 150.33 7.56
55 151.60 7.49 150.91 7.39
60 153.29 7.29 151.89 7.09
65 155.03 7.09 152.90 6.79
70 156.86 6.89 153.97 6.47
75 158.84 6.66 155.13 6.12
80 161.05 6.41 156.41 5.74
85 163.62 6.11 157.91 5.29
90 166.86 5.74 159.79 4.73
137
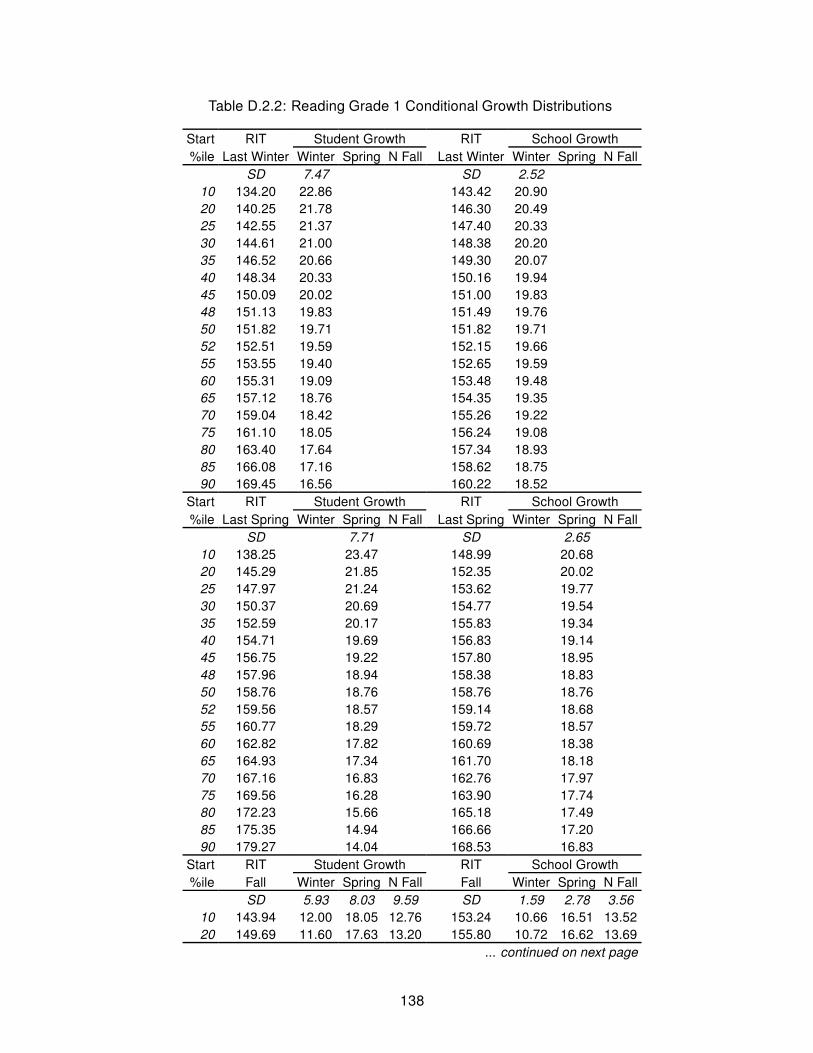
Table D.2.2: Reading Grade 1 Conditional Growth Distributions
Start RIT Student Growth RIT School Growth
%ile Last Winter Winter Spring N Fall Last Winter Winter Spring N Fall
SD 7.47 SD 2.52
10 134.20 22.86 143.42 20.90
20 140.25 21.78 146.30 20.49
25 142.55 21.37 147.40 20.33
30 144.61 21.00 148.38 20.20
35 146.52 20.66 149.30 20.07
40 148.34 20.33 150.16 19.94
45 150.09 20.02 151.00 19.83
48 151.13 19.83 151.49 19.76
50 151.82 19.71 151.82 19.71
52 152.51 19.59 152.15 19.66
55 153.55 19.40 152.65 19.59
60 155.31 19.09 153.48 19.48
65 157.12 18.76 154.35 19.35
70 159.04 18.42 155.26 19.22
75 161.10 18.05 156.24 19.08
80 163.40 17.64 157.34 18.93
85 166.08 17.16 158.62 18.75
90 169.45 16.56 160.22 18.52
Start RIT Student Growth RIT School Growth
%ile Last Spring Winter Spring N Fall Last Spring Winter Spring N Fall
SD 7.71 SD 2.65
10 138.25 23.47 148.99 20.68
20 145.29 21.85 152.35 20.02
25 147.97 21.24 153.62 19.77
30 150.37 20.69 154.77 19.54
35 152.59 20.17 155.83 19.34
40 154.71 19.69 156.83 19.14
45 156.75 19.22 157.80 18.95
48 157.96 18.94 158.38 18.83
50 158.76 18.76 158.76 18.76
52 159.56 18.57 159.14 18.68
55 160.77 18.29 159.72 18.57
60 162.82 17.82 160.69 18.38
65 164.93 17.34 161.70 18.18
70 167.16 16.83 162.76 17.97
75 169.56 16.28 163.90 17.74
80 172.23 15.66 165.18 17.49
85 175.35 14.94 166.66 17.20
90 179.27 14.04 168.53 16.83
Start RIT Student Growth RIT School Growth
%ile Fall Winter Spring N Fall Fall Winter Spring N Fall
SD 5.93 8.03 9.59 SD 1.59 2.78 3.56
10 143.94 12.00 18.05 12.76 153.24 10.66 16.51 13.52
20 149.69 11.60 17.63 13.20 155.80 10.72 16.62 13.69
... continued on next page
138

Reading Grade 1 Conditional Growth Distributions , continued
Start RIT Student Growth RIT School Growth
%ile Winter Spring N Fall Winter Spring N Fall
25 151.88 11.45 17.47 13.36 156.77 10.74 16.66 13.76
30 153.84 11.31 17.32 13.51 157.64 10.76 16.70 13.82
35 155.66 11.18 17.19 13.64 158.45 10.78 16.73 13.87
40 157.38 11.06 17.06 13.77 159.22 10.80 16.76 13.92
45 159.05 10.95 16.94 13.90 159.97 10.82 16.79 13.97
48 160.04 10.88 16.87 13.97 160.41 10.83 16.81 14.00
50 160.70 10.84 16.82 14.02 160.70 10.84 16.82 14.02
52 161.35 10.79 16.77 14.07 160.99 10.84 16.83 14.04
55 162.34 10.72 16.70 14.15 161.43 10.85 16.85 14.07
60 164.01 10.61 16.58 14.27 162.17 10.87 16.88 14.12
65 165.74 10.49 16.45 14.40 162.94 10.89 16.91 14.17
70 167.56 10.36 16.32 14.54 163.75 10.91 16.95 14.23
75 169.52 10.22 16.17 14.69 164.62 10.93 16.98 14.29
80 171.70 10.07 16.01 14.85 165.60 10.95 17.02 14.35
85 174.25 9.90 15.83 15.04 166.73 10.98 17.07 14.43
90 177.46 9.67 15.59 15.28 168.16 11.01 17.13 14.53
Start RIT Student Growth RIT School Growth
%ile Winter Winter Spring N Fall Winter Winter Spring N Fall
SD 5.46 SD 1.12
10 154.18 6.07 163.63 5.47
20 160.13 6.04 166.34 5.65
25 162.40 6.03 167.37 5.71
30 164.43 6.02 168.30 5.77
35 166.31 6.01 169.16 5.83
40 168.10 6.00 169.97 5.88
45 169.83 5.99 170.76 5.94
48 170.85 5.99 171.22 5.97
50 171.53 5.99 171.53 5.99
52 172.21 5.98 171.84 6.01
55 173.23 5.98 172.31 6.04
60 174.96 5.97 173.09 6.09
65 176.75 5.96 173.91 6.14
70 178.63 5.95 174.77 6.20
75 180.67 5.94 175.69 6.26
80 182.93 5.93 176.72 6.33
85 185.57 5.92 177.92 6.41
90 188.89 5.90 179.44 6.51
139

Table D.2.3: Reading Grade 2 Conditional Growth Distributions
Start RIT Student Growth RIT School Growth
%ile Last Winter Winter Spring N Fall Last Winter Winter Spring N Fall
SD 6.82 SD 2.00
10 151.49 15.60 163.05 13.21
20 158.41 14.54 166.01 12.97
25 161.05 14.13 167.13 12.87
30 163.41 13.77 168.14 12.79
35 165.60 13.43 169.08 12.72
40 167.68 13.12 169.96 12.64
45 169.69 12.81 170.82 12.57
48 170.88 12.62 171.33 12.53
50 171.67 12.50 171.67 12.50
52 172.46 12.38 172.00 12.48
55 173.65 12.20 172.51 12.43
60 175.66 11.89 173.37 12.36
65 177.74 11.57 174.26 12.29
70 179.93 11.24 175.19 12.22
75 182.29 10.87 176.20 12.13
80 184.92 10.47 177.33 12.04
85 187.99 10.00 178.64 11.93
90 191.85 9.41 180.28 11.80
Start RIT Student Growth RIT School Growth
%ile Last Spring Winter Spring N Fall Last Spring Winter Spring N Fall
SD 7.24 SD 2.28
10 156.11 15.44 168.21 12.34
20 163.54 13.90 171.48 11.86
25 166.36 13.31 172.73 11.68
30 168.90 12.79 173.85 11.51
35 171.24 12.30 174.88 11.36
40 173.47 11.83 175.86 11.22
45 175.63 11.39 176.81 11.08
48 176.90 11.12 177.38 11.00
50 177.75 10.94 177.75 10.94
52 178.60 10.77 178.12 10.89
55 179.87 10.50 178.69 10.81
60 182.03 10.05 179.64 10.67
65 184.26 9.59 180.62 10.52
70 186.60 9.10 181.65 10.37
75 189.14 8.57 182.77 10.21
80 191.96 7.99 184.01 10.03
85 195.25 7.30 185.46 9.82
90 199.39 6.44 187.29 9.55
Start RIT Student Growth RIT School Growth
%ile Fall Winter Spring N Fall Fall Winter Spring N Fall
SD 5.81 7.82 8.33 SD 1.43 2.50 2.42
10 154.83 11.65 17.15 14.11 166.51 9.55 14.14 13.35
20 161.66 10.90 16.06 13.95 169.33 9.51 14.08 13.45
... continued on next page
140

Reading Grade 2 Conditional Growth Distributions , continued
Start RIT Student Growth RIT School Growth
%ile Winter Spring N Fall Winter Spring N Fall
25 164.25 10.61 15.64 13.89 170.40 9.50 14.06 13.49
30 166.58 10.35 15.27 13.84 171.36 9.49 14.04 13.53
35 168.74 10.11 14.93 13.79 172.25 9.48 14.02 13.56
40 170.79 9.89 14.60 13.74 173.10 9.47 14.01 13.59
45 172.77 9.67 14.28 13.70 173.92 9.46 13.99 13.62
48 173.94 9.54 14.10 13.67 174.40 9.45 13.98 13.64
50 174.72 9.45 13.97 13.65 174.72 9.45 13.97 13.65
52 175.50 9.36 13.85 13.63 175.04 9.45 13.97 13.66
55 176.67 9.24 13.66 13.61 175.53 9.44 13.96 13.68
60 178.65 9.02 13.35 13.56 176.34 9.43 13.94 13.71
65 180.70 8.79 13.02 13.51 177.19 9.42 13.92 13.74
70 182.86 8.55 12.67 13.46 178.08 9.41 13.90 13.78
75 185.19 8.29 12.30 13.41 179.04 9.40 13.89 13.81
80 187.78 8.01 11.89 13.35 180.11 9.39 13.86 13.85
85 190.81 7.67 11.41 13.28 181.36 9.37 13.84 13.90
90 194.61 7.25 10.80 13.19 182.93 9.36 13.81 13.95
Start RIT Student Growth RIT School Growth
%ile Winter Winter Spring N Fall Winter Winter Spring N Fall
SD 5.44 SD 1.06
10 164.98 5.51 175.86 4.29
20 171.57 5.17 178.71 4.37
25 174.07 5.04 179.80 4.40
30 176.32 4.93 180.77 4.43
35 178.40 4.82 181.67 4.45
40 180.38 4.72 182.53 4.48
45 182.29 4.62 183.36 4.50
48 183.42 4.56 183.85 4.51
50 184.17 4.52 184.17 4.52
52 184.92 4.48 184.50 4.53
55 186.05 4.42 184.99 4.54
60 187.97 4.33 185.82 4.57
65 189.94 4.22 186.67 4.59
70 192.02 4.12 187.57 4.62
75 194.27 4.00 188.55 4.64
80 196.78 3.87 189.63 4.67
85 199.69 3.72 190.90 4.71
90 203.36 3.53 192.49 4.75
141

Table D.2.4: Reading Grade 3 Conditional Growth Distributions
Start RIT Student Growth RIT School Growth
%ile Last Winter Winter Spring N Fall Last Winter Winter Spring N Fall
SD 6.16 SD 1.60
10 163.32 14.57 175.27 12.15
20 170.35 13.62 178.20 12.03
25 173.02 13.26 179.31 11.99
30 175.42 12.94 180.31 11.95
35 177.64 12.64 181.23 11.91
40 179.75 12.35 182.11 11.87
45 181.79 12.08 182.96 11.84
48 183.00 11.91 183.46 11.82
50 183.80 11.81 183.80 11.81
52 184.60 11.70 184.13 11.79
55 185.81 11.54 184.63 11.77
60 187.85 11.26 185.48 11.74
65 189.96 10.98 186.36 11.70
70 192.18 10.68 187.29 11.67
75 194.58 10.35 188.29 11.63
80 197.25 9.99 189.40 11.58
85 200.36 9.57 190.70 11.53
90 204.28 9.04 192.33 11.46
Start RIT Student Growth RIT School Growth
%ile Last Spring Winter Spring N Fall Last Spring Winter Spring N Fall
SD 6.71 SD 1.88
10 167.33 13.97 179.38 11.09
20 174.47 12.77 182.39 10.88
25 177.19 12.31 183.53 10.80
30 179.63 11.90 184.56 10.73
35 181.89 11.52 185.51 10.66
40 184.03 11.16 186.41 10.59
45 186.11 10.81 187.29 10.53
48 187.33 10.61 187.81 10.50
50 188.15 10.47 188.15 10.47
52 188.96 10.33 188.49 10.45
55 190.19 10.13 189.01 10.41
60 192.27 9.78 189.88 10.35
65 194.41 9.42 190.79 10.28
70 196.67 9.04 191.74 10.22
75 199.11 8.63 192.77 10.14
80 201.82 8.18 193.91 10.06
85 204.99 7.64 195.25 9.97
90 208.97 6.98 196.92 9.85
Start RIT Student Growth RIT School Growth
%ile Fall Winter Spring N Fall Fall Winter Spring N Fall
SD 5.51 7.15 7.40 SD 1.15 2.02 2.05
10 167.98 9.56 13.60 11.53 179.70 7.60 10.82 9.82
20 174.95 8.79 12.48 10.98 182.65 7.50 10.66 9.86
... continued on next page
142

Reading Grade 3 Conditional Growth Distributions , continued
Start RIT Student Growth RIT School Growth
%ile Winter Spring N Fall Winter Spring N Fall
25 177.60 8.50 12.05 10.77 183.77 7.46 10.59 9.87
30 179.98 8.23 11.67 10.58 184.77 7.43 10.53 9.88
35 182.18 7.99 11.31 10.40 185.71 7.40 10.48 9.89
40 184.27 7.76 10.98 10.24 186.59 7.37 10.43 9.90
45 186.30 7.54 10.65 10.08 187.45 7.34 10.38 9.91
48 187.49 7.40 10.46 9.98 187.95 7.33 10.35 9.92
50 188.29 7.31 10.33 9.92 188.29 7.31 10.33 9.92
52 189.08 7.23 10.20 9.86 188.63 7.30 10.31 9.92
55 190.28 7.09 10.01 9.76 189.13 7.29 10.28 9.93
60 192.31 6.87 9.68 9.60 189.99 7.26 10.23 9.94
65 194.40 6.64 9.35 9.43 190.87 7.23 10.18 9.95
70 196.60 6.40 8.99 9.26 191.81 7.20 10.13 9.96
75 198.98 6.13 8.61 9.07 192.81 7.17 10.07 9.97
80 201.63 5.84 8.18 8.86 193.93 7.13 10.01 9.98
85 204.72 5.50 7.68 8.62 195.24 7.09 9.93 10.00
90 208.60 5.07 7.06 8.31 196.88 7.03 9.84 10.02
Start RIT Student Growth RIT School Growth
%ile Winter Winter Spring N Fall Winter Winter Spring N Fall
SD 5.24 SD 0.88
10 176.21 4.27 187.16 3.03
20 182.87 3.84 190.06 3.03
25 185.40 3.68 191.16 3.02
30 187.67 3.53 192.15 3.02
35 189.77 3.39 193.07 3.02
40 191.77 3.26 193.94 3.02
45 193.70 3.14 194.78 3.02
48 194.85 3.07 195.27 3.02
50 195.60 3.02 195.60 3.02
52 196.36 2.97 195.93 3.02
55 197.51 2.89 196.43 3.01
60 199.44 2.77 197.27 3.01
65 201.44 2.64 198.14 3.01
70 203.54 2.50 199.06 3.01
75 205.81 2.36 200.05 3.01
80 208.34 2.19 201.15 3.01
85 211.29 2.00 202.43 3.00
90 215.00 1.76 204.04 3.00
143
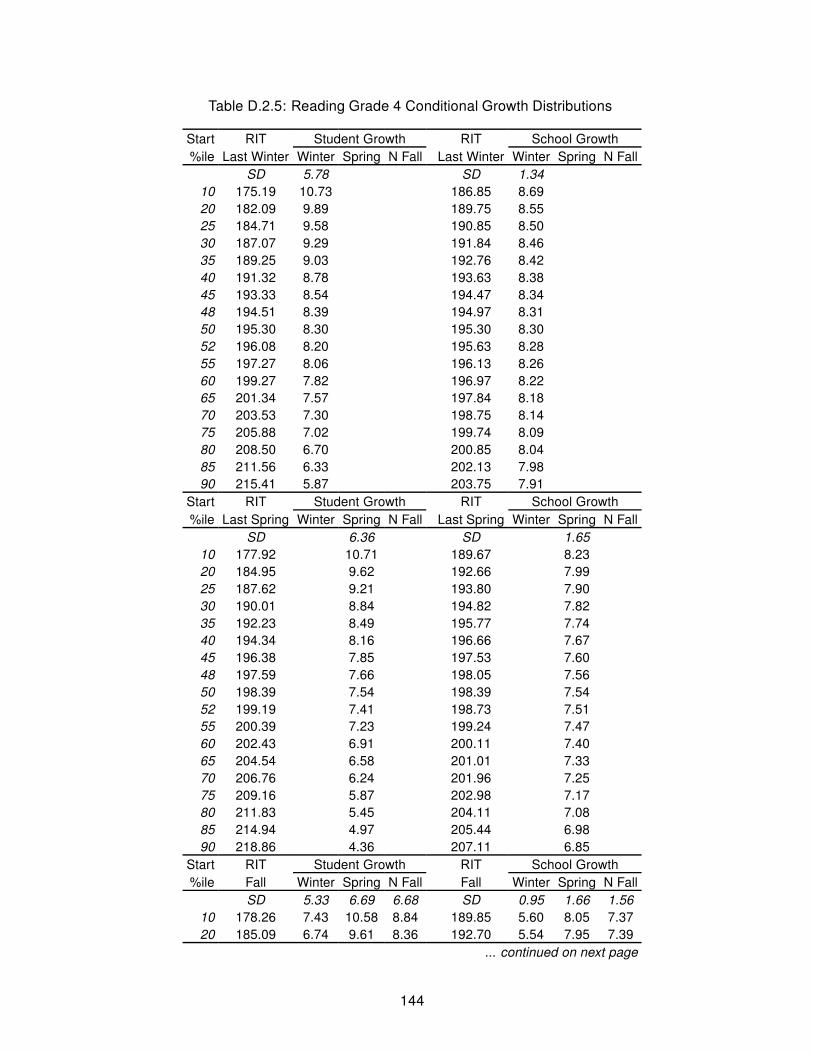
Table D.2.5: Reading Grade 4 Conditional Growth Distributions
Start RIT Student Growth RIT School Growth
%ile Last Winter Winter Spring N Fall Last Winter Winter Spring N Fall
SD 5.78 SD 1.34
10 175.19 10.73 186.85 8.69
20 182.09 9.89 189.75 8.55
25 184.71 9.58 190.85 8.50
30 187.07 9.29 191.84 8.46
35 189.25 9.03 192.76 8.42
40 191.32 8.78 193.63 8.38
45 193.33 8.54 194.47 8.34
48 194.51 8.39 194.97 8.31
50 195.30 8.30 195.30 8.30
52 196.08 8.20 195.63 8.28
55 197.27 8.06 196.13 8.26
60 199.27 7.82 196.97 8.22
65 201.34 7.57 197.84 8.18
70 203.53 7.30 198.75 8.14
75 205.88 7.02 199.74 8.09
80 208.50 6.70 200.85 8.04
85 211.56 6.33 202.13 7.98
90 215.41 5.87 203.75 7.91
Start RIT Student Growth RIT School Growth
%ile Last Spring Winter Spring N Fall Last Spring Winter Spring N Fall
SD 6.36 SD 1.65
10 177.92 10.71 189.67 8.23
20 184.95 9.62 192.66 7.99
25 187.62 9.21 193.80 7.90
30 190.01 8.84 194.82 7.82
35 192.23 8.49 195.77 7.74
40 194.34 8.16 196.66 7.67
45 196.38 7.85 197.53 7.60
48 197.59 7.66 198.05 7.56
50 198.39 7.54 198.39 7.54
52 199.19 7.41 198.73 7.51
55 200.39 7.23 199.24 7.47
60 202.43 6.91 200.11 7.40
65 204.54 6.58 201.01 7.33
70 206.76 6.24 201.96 7.25
75 209.16 5.87 202.98 7.17
80 211.83 5.45 204.11 7.08
85 214.94 4.97 205.44 6.98
90 218.86 4.36 207.11 6.85
Start RIT Student Growth RIT School Growth
%ile Fall Winter Spring N Fall Fall Winter Spring N Fall
SD 5.33 6.69 6.68 SD 0.95 1.66 1.56
10 178.26 7.43 10.58 8.84 189.85 5.60 8.05 7.37
20 185.09 6.74 9.61 8.36 192.70 5.54 7.95 7.39
... continued on next page
144

Reading Grade 4 Conditional Growth Distributions , continued
Start RIT Student Growth RIT School Growth
%ile Winter Spring N Fall Winter Spring N Fall
25 187.69 6.48 9.25 8.17 193.79 5.52 7.91 7.40
30 190.02 6.25 8.92 8.01 194.76 5.50 7.88 7.41
35 192.18 6.03 8.61 7.86 195.66 5.48 7.85 7.41
40 194.23 5.83 8.32 7.71 196.52 5.47 7.82 7.42
45 196.21 5.63 8.04 7.57 197.35 5.45 7.79 7.43
48 197.38 5.51 7.87 7.49 197.84 5.44 7.77 7.43
50 198.16 5.43 7.76 7.43 198.16 5.43 7.76 7.43
52 198.94 5.36 7.65 7.38 198.49 5.43 7.75 7.44
55 200.11 5.24 7.49 7.30 198.98 5.42 7.73 7.44
60 202.10 5.04 7.21 7.16 199.80 5.40 7.71 7.45
65 204.15 4.83 6.92 7.01 200.66 5.38 7.68 7.45
70 206.31 4.62 6.61 6.86 201.56 5.37 7.65 7.46
75 208.64 4.38 6.28 6.69 202.54 5.35 7.61 7.47
80 211.23 4.12 5.91 6.51 203.62 5.33 7.58 7.48
85 214.26 3.82 5.48 6.30 204.88 5.30 7.53 7.49
90 218.07 3.44 4.94 6.03 206.47 5.27 7.48 7.50
Start RIT Student Growth RIT School Growth
%ile Winter Winter Spring N Fall Winter Winter Spring N Fall
SD 5.10 SD 0.72
10 184.43 3.53 195.36 2.32
20 191.01 3.12 198.18 2.32
25 193.51 2.96 199.26 2.32
30 195.75 2.82 200.22 2.32
35 197.83 2.69 201.12 2.33
40 199.81 2.57 201.97 2.33
45 201.72 2.45 202.79 2.33
48 202.85 2.38 203.27 2.33
50 203.60 2.33 203.60 2.33
52 204.35 2.28 203.92 2.33
55 205.47 2.21 204.40 2.33
60 207.38 2.09 205.22 2.33
65 209.36 1.97 206.07 2.33
70 211.44 1.84 206.97 2.34
75 213.68 1.70 207.93 2.34
80 216.18 1.54 209.01 2.34
85 219.10 1.36 210.26 2.34
90 222.77 1.13 211.83 2.34
145

Table D.2.6: Reading Grade 5 Conditional Growth Distributions
Start RIT Student Growth RIT School Growth
%ile Last Winter Winter Spring N Fall Last Winter Winter Spring N Fall
SD 6.08 SD 1.33
10 183.69 9.05 194.99 7.03
20 190.43 8.17 197.85 6.85
25 192.99 7.84 198.94 6.78
30 195.29 7.54 199.91 6.72
35 197.42 7.27 200.82 6.66
40 199.44 7.01 201.68 6.61
45 201.40 6.75 202.51 6.55
48 202.55 6.60 203.00 6.52
50 203.32 6.50 203.32 6.50
52 204.09 6.40 203.65 6.48
55 205.25 6.25 204.14 6.45
60 207.20 6.00 204.97 6.40
65 209.23 5.74 205.83 6.35
70 211.36 5.46 206.73 6.29
75 213.66 5.16 207.71 6.23
80 216.22 4.83 208.79 6.16
85 219.20 4.44 210.06 6.08
90 222.96 3.96 211.65 5.98
Start RIT Student Growth RIT School Growth
%ile Last Spring Winter Spring N Fall Last Spring Winter Spring N Fall
SD 6.74 SD 1.71
10 185.88 9.14 197.33 6.67
20 192.73 8.05 200.25 6.42
25 195.33 7.63 201.36 6.33
30 197.67 7.26 202.36 6.25
35 199.83 6.91 203.28 6.17
40 201.89 6.59 204.15 6.10
45 203.88 6.27 205.00 6.03
48 205.05 6.08 205.50 5.98
50 205.83 5.96 205.83 5.96
52 206.62 5.83 206.17 5.93
55 207.79 5.64 206.67 5.89
60 209.78 5.33 207.51 5.82
65 211.83 5.00 208.39 5.74
70 214.00 4.65 209.31 5.67
75 216.34 4.28 210.31 5.58
80 218.94 3.87 211.42 5.49
85 221.97 3.38 212.71 5.38
90 225.79 2.77 214.33 5.25
Start RIT Student Growth RIT School Growth
%ile Fall Winter Spring N Fall Fall Winter Spring N Fall
SD 5.39 6.84 7.10 SD 1.01 1.77 1.58
10 186.29 6.08 8.80 6.50 197.64 4.31 6.39 5.62
20 192.94 5.41 7.87 6.14 200.40 4.25 6.29 5.56
... continued on next page
146

Reading Grade 5 Conditional Growth Distributions , continued
Start RIT Student Growth RIT School Growth
%ile Winter Spring N Fall Winter Spring N Fall
25 195.47 5.16 7.53 6.00 201.45 4.23 6.26 5.54
30 197.74 4.94 7.21 5.88 202.39 4.21 6.23 5.52
35 199.85 4.73 6.92 5.76 203.26 4.20 6.20 5.50
40 201.84 4.53 6.64 5.66 204.09 4.18 6.17 5.48
45 203.78 4.34 6.38 5.55 204.89 4.16 6.14 5.47
48 204.92 4.22 6.22 5.49 205.36 4.15 6.12 5.46
50 205.68 4.15 6.11 5.45 205.68 4.15 6.11 5.45
52 206.44 4.07 6.01 5.41 205.99 4.14 6.10 5.44
55 207.58 3.96 5.85 5.35 206.47 4.13 6.09 5.43
60 209.51 3.77 5.58 5.24 207.27 4.12 6.06 5.41
65 211.51 3.57 5.31 5.13 208.10 4.10 6.03 5.40
70 213.61 3.36 5.02 5.02 208.97 4.08 6.00 5.38
75 215.88 3.13 4.70 4.89 209.91 4.07 5.97 5.36
80 218.41 2.88 4.35 4.76 210.96 4.05 5.93 5.33
85 221.36 2.59 3.94 4.60 212.18 4.02 5.89 5.31
90 225.07 2.22 3.43 4.40 213.72 3.99 5.84 5.28
Start RIT Student Growth RIT School Growth
%ile Winter Winter Spring N Fall Winter Winter Spring N Fall
SD 5.14 SD 0.76
10 191.04 3.07 201.84 1.92
20 197.49 2.69 204.58 1.94
25 199.94 2.55 205.62 1.94
30 202.14 2.42 206.56 1.95
35 204.18 2.30 207.42 1.95
40 206.11 2.18 208.25 1.96
45 207.98 2.07 209.04 1.96
48 209.09 2.01 209.51 1.96
50 209.83 1.97 209.83 1.97
52 210.56 1.92 210.14 1.97
55 211.67 1.86 210.61 1.97
60 213.54 1.75 211.41 1.97
65 215.47 1.63 212.23 1.98
70 217.51 1.51 213.09 1.98
75 219.71 1.39 214.03 1.99
80 222.16 1.24 215.07 1.99
85 225.01 1.07 216.29 2.00
90 228.61 0.86 217.82 2.01
147

Table D.2.7: Reading Grade 6 Conditional Growth Distributions
Start RIT Student Growth RIT School Growth
%ile Last Winter Winter Spring N Fall Last Winter Winter Spring N Fall
SD 6.23 SD 1.68
10 189.87 7.52 201.27 5.14
20 196.64 6.52 204.13 4.96
25 199.22 6.14 205.22 4.89
30 201.53 5.80 206.19 4.82
35 203.67 5.48 207.10 4.77
40 205.70 5.18 207.95 4.71
45 207.67 4.89 208.78 4.66
48 208.83 4.72 209.27 4.63
50 209.60 4.61 209.60 4.61
52 210.37 4.49 209.93 4.59
55 211.54 4.32 210.42 4.56
60 213.50 4.03 211.25 4.50
65 215.53 3.73 212.11 4.45
70 217.67 3.42 213.01 4.39
75 219.99 3.08 213.99 4.33
80 222.56 2.70 215.07 4.26
85 225.56 2.25 216.34 4.18
90 229.33 1.70 217.93 4.08
Start RIT Student Growth RIT School Growth
%ile Last Spring Winter Spring N Fall Last Spring Winter Spring N Fall
SD 6.87 SD 2.08
10 191.15 8.01 202.83 5.11
20 198.15 6.70 205.82 4.80
25 200.81 6.21 206.96 4.68
30 203.20 5.76 207.98 4.57
35 205.42 5.35 208.93 4.47
40 207.52 4.95 209.83 4.38
45 209.55 4.58 210.69 4.29
48 210.75 4.35 211.21 4.24
50 211.55 4.20 211.55 4.20
52 212.35 4.05 211.89 4.17
55 213.55 3.83 212.40 4.11
60 215.58 3.45 213.27 4.02
65 217.68 3.06 214.17 3.93
70 219.90 2.64 215.12 3.83
75 222.29 2.20 216.14 3.72
80 224.95 1.70 217.28 3.61
85 228.05 1.12 218.60 3.47
90 231.95 0.39 220.27 3.30
Start RIT Student Growth RIT School Growth
%ile Fall Winter Spring N Fall Fall Winter Spring N Fall
SD 5.42 6.91 7.17 SD 1.09 1.91 1.84
10 191.84 5.10 7.34 5.93 202.90 3.34 4.97 4.52
20 198.41 4.45 6.46 5.48 205.68 3.30 4.90 4.55
... continued on next page
148

Reading Grade 6 Conditional Growth Distributions , continued
Start RIT Student Growth RIT School Growth
%ile Winter Spring N Fall Winter Spring N Fall
25 200.91 4.21 6.12 5.31 206.73 3.28 4.87 4.56
30 203.15 3.99 5.82 5.15 207.68 3.27 4.85 4.58
35 205.23 3.79 5.54 5.01 208.56 3.26 4.83 4.59
40 207.20 3.59 5.27 4.88 209.39 3.24 4.80 4.60
45 209.11 3.41 5.02 4.74 210.19 3.23 4.78 4.61
48 210.24 3.30 4.87 4.67 210.67 3.23 4.77 4.61
50 210.99 3.22 4.76 4.62 210.99 3.22 4.76 4.62
52 211.74 3.15 4.66 4.56 211.30 3.22 4.76 4.62
55 212.86 3.04 4.51 4.49 211.78 3.21 4.74 4.63
60 214.77 2.85 4.25 4.36 212.59 3.20 4.72 4.64
65 216.74 2.66 3.99 4.22 213.42 3.19 4.70 4.65
70 218.82 2.45 3.71 4.08 214.30 3.17 4.68 4.66
75 221.06 2.24 3.41 3.92 215.24 3.16 4.66 4.67
80 223.56 1.99 3.07 3.75 216.30 3.15 4.63 4.68
85 226.47 1.71 2.68 3.55 217.53 3.13 4.60 4.70
90 230.13 1.35 2.19 3.30 219.07 3.11 4.56 4.71
Start RIT Student Growth RIT School Growth
%ile Winter Winter Spring N Fall Winter Winter Spring N Fall
SD 5.16 SD 0.82
10 195.59 2.58 206.12 1.45
20 201.98 2.22 208.89 1.48
25 204.41 2.09 209.95 1.49
30 206.59 1.97 210.90 1.50
35 208.61 1.85 211.78 1.51
40 210.53 1.75 212.61 1.52
45 212.38 1.64 213.41 1.53
48 213.48 1.58 213.89 1.54
50 214.21 1.54 214.21 1.54
52 214.94 1.50 214.53 1.55
55 216.03 1.44 215.00 1.55
60 217.89 1.34 215.81 1.56
65 219.81 1.23 216.64 1.57
70 221.83 1.12 217.52 1.58
75 224.01 1.00 218.47 1.59
80 226.44 0.86 219.52 1.61
85 229.27 0.70 220.75 1.62
90 232.83 0.50 222.30 1.64
149

Table D.2.8: Reading Grade 7 Conditional Growth Distributions
Start RIT Student Growth RIT School Growth
%ile Last Winter Winter Spring N Fall Last Winter Winter Spring N Fall
SD 5.87 SD 1.48
10 192.96 6.29 204.21 4.50
20 199.82 5.49 207.20 4.32
25 202.43 5.19 208.34 4.25
30 204.77 4.92 209.37 4.19
35 206.93 4.67 210.31 4.13
40 208.99 4.43 211.21 4.07
45 210.98 4.20 212.08 4.02
48 212.16 4.06 212.60 3.99
50 212.94 3.97 212.94 3.97
52 213.72 3.88 213.28 3.95
55 214.90 3.74 213.80 3.92
60 216.89 3.51 214.67 3.87
65 218.95 3.27 215.57 3.81
70 221.12 3.02 216.52 3.75
75 223.46 2.75 217.54 3.69
80 226.06 2.45 218.68 3.62
85 229.10 2.10 220.00 3.54
90 232.92 1.65 221.68 3.44
Start RIT Student Growth RIT School Growth
%ile Last Spring Winter Spring N Fall Last Spring Winter Spring N Fall
SD 6.57 SD 1.94
10 193.59 7.10 205.16 4.80
20 200.71 5.97 208.31 4.47
25 203.41 5.55 209.50 4.34
30 205.84 5.16 210.58 4.23
35 208.09 4.81 211.57 4.12
40 210.23 4.47 212.52 4.02
45 212.30 4.15 213.43 3.92
48 213.52 3.95 213.97 3.86
50 214.33 3.83 214.33 3.83
52 215.14 3.70 214.69 3.79
55 216.37 3.51 215.23 3.73
60 218.43 3.18 216.15 3.63
65 220.57 2.84 217.09 3.53
70 222.82 2.49 218.09 3.43
75 225.25 2.10 219.16 3.31
80 227.96 1.68 220.36 3.18
85 231.11 1.18 221.75 3.04
90 235.08 0.56 223.51 2.85
Start RIT Student Growth RIT School Growth
%ile Fall Winter Spring N Fall Fall Winter Spring N Fall
SD 5.42 6.87 6.77 SD 1.04 1.83 1.67
10 194.82 4.19 6.04 5.02 206.03 2.56 3.88 3.89
20 201.56 3.60 5.24 4.64 208.92 2.53 3.82 3.91
... continued on next page
150
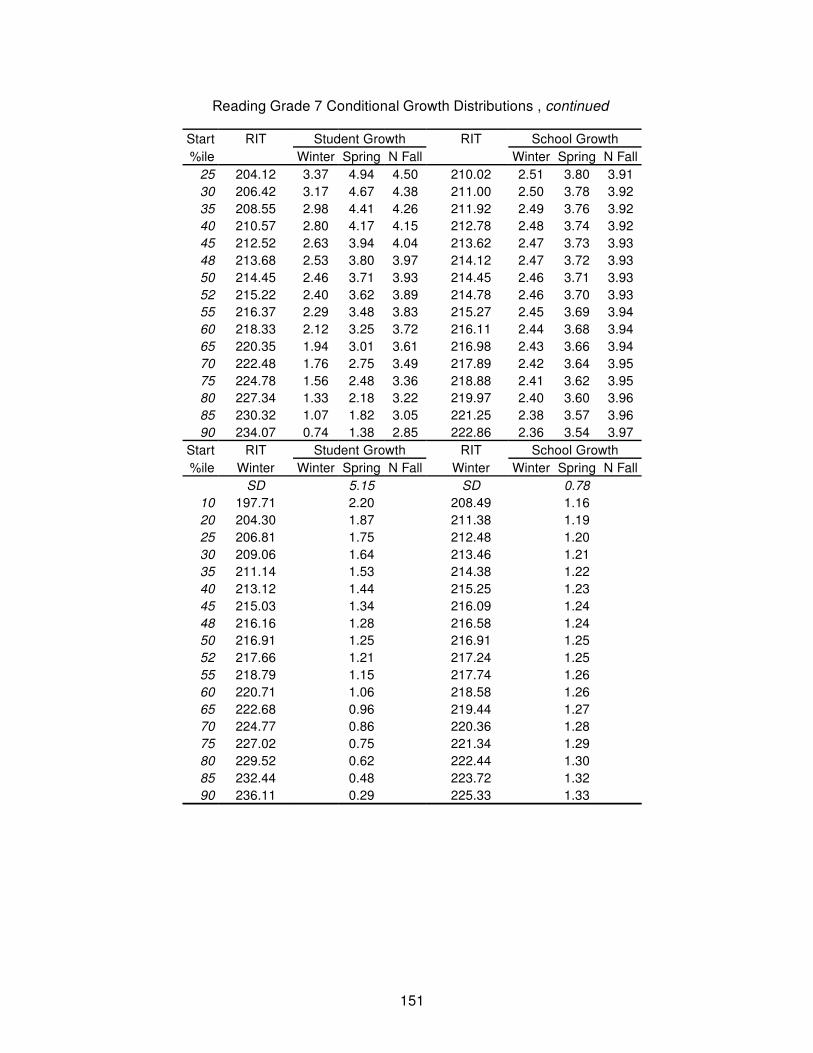
Reading Grade 7 Conditional Growth Distributions , continued
Start RIT Student Growth RIT School Growth
%ile Winter Spring N Fall Winter Spring N Fall
25 204.12 3.37 4.94 4.50 210.02 2.51 3.80 3.91
30 206.42 3.17 4.67 4.38 211.00 2.50 3.78 3.92
35 208.55 2.98 4.41 4.26 211.92 2.49 3.76 3.92
40 210.57 2.80 4.17 4.15 212.78 2.48 3.74 3.92
45 212.52 2.63 3.94 4.04 213.62 2.47 3.73 3.93
48 213.68 2.53 3.80 3.97 214.12 2.47 3.72 3.93
50 214.45 2.46 3.71 3.93 214.45 2.46 3.71 3.93
52 215.22 2.40 3.62 3.89 214.78 2.46 3.70 3.93
55 216.37 2.29 3.48 3.83 215.27 2.45 3.69 3.94
60 218.33 2.12 3.25 3.72 216.11 2.44 3.68 3.94
65 220.35 1.94 3.01 3.61 216.98 2.43 3.66 3.94
70 222.48 1.76 2.75 3.49 217.89 2.42 3.64 3.95
75 224.78 1.56 2.48 3.36 218.88 2.41 3.62 3.95
80 227.34 1.33 2.18 3.22 219.97 2.40 3.60 3.96
85 230.32 1.07 1.82 3.05 221.25 2.38 3.57 3.96
90 234.07 0.74 1.38 2.85 222.86 2.36 3.54 3.97
Start RIT Student Growth RIT School Growth
%ile Winter Winter Spring N Fall Winter Winter Spring N Fall
SD 5.15 SD 0.78
10 197.71 2.20 208.49 1.16
20 204.30 1.87 211.38 1.19
25 206.81 1.75 212.48 1.20
30 209.06 1.64 213.46 1.21
35 211.14 1.53 214.38 1.22
40 213.12 1.44 215.25 1.23
45 215.03 1.34 216.09 1.24
48 216.16 1.28 216.58 1.24
50 216.91 1.25 216.91 1.25
52 217.66 1.21 217.24 1.25
55 218.79 1.15 217.74 1.26
60 220.71 1.06 218.58 1.26
65 222.68 0.96 219.44 1.27
70 224.77 0.86 220.36 1.28
75 227.02 0.75 221.34 1.29
80 229.52 0.62 222.44 1.30
85 232.44 0.48 223.72 1.32
90 236.11 0.29 225.33 1.33
151

Table D.2.9: Reading Grade 8 Conditional Growth Distributions
Start RIT Student Growth RIT School Growth
%ile Last Winter Winter Spring N Fall Last Winter Winter Spring N Fall
SD 6.68 SD 1.76
10 195.64 5.71 206.19 3.69
20 202.48 4.96 209.41 3.63
25 205.08 4.67 210.63 3.61
30 207.41 4.42 211.73 3.59
35 209.57 4.18 212.75 3.57
40 211.62 3.96 213.71 3.56
45 213.61 3.74 214.64 3.54
48 214.78 3.61 215.20 3.53
50 215.56 3.53 215.56 3.53
52 216.34 3.44 215.93 3.52
55 217.52 3.31 216.48 3.51
60 219.50 3.09 217.41 3.49
65 221.55 2.87 218.38 3.48
70 223.71 2.63 219.40 3.46
75 226.05 2.38 220.49 3.44
80 228.64 2.09 221.71 3.42
85 231.67 1.76 223.14 3.39
90 235.48 1.34 224.93 3.36
Start RIT Student Growth RIT School Growth
%ile Last Spring Winter Spring N Fall Last Spring Winter Spring N Fall
SD 7.96 SD 2.23
10 196.62 6.08 207.55 3.36
20 203.61 5.05 210.79 3.27
25 206.27 4.66 212.02 3.23
30 208.65 4.31 213.13 3.20
35 210.86 3.99 214.15 3.17
40 212.96 3.68 215.12 3.14
45 214.99 3.38 216.06 3.12
48 216.19 3.21 216.62 3.10
50 216.99 3.09 216.99 3.09
52 217.78 2.97 217.35 3.08
55 218.98 2.80 217.91 3.06
60 221.01 2.50 218.85 3.03
65 223.11 2.19 219.82 3.01
70 225.32 1.87 220.84 2.98
75 227.71 1.52 221.95 2.94
80 230.36 1.13 223.18 2.91
85 233.46 0.67 224.61 2.87
90 237.35 0.10 226.42 2.81
Start RIT Student Growth RIT School Growth
%ile Fall Winter Spring N Fall Fall Winter Spring N Fall
SD 5.85 7.91 7.83 SD 1.27 2.23 1.97
10 197.10 3.78 5.56 3.05 207.67 2.08 3.25 2.81
20 204.01 3.12 4.62 3.07 210.95 2.00 3.11 2.92
... continued on next page
152
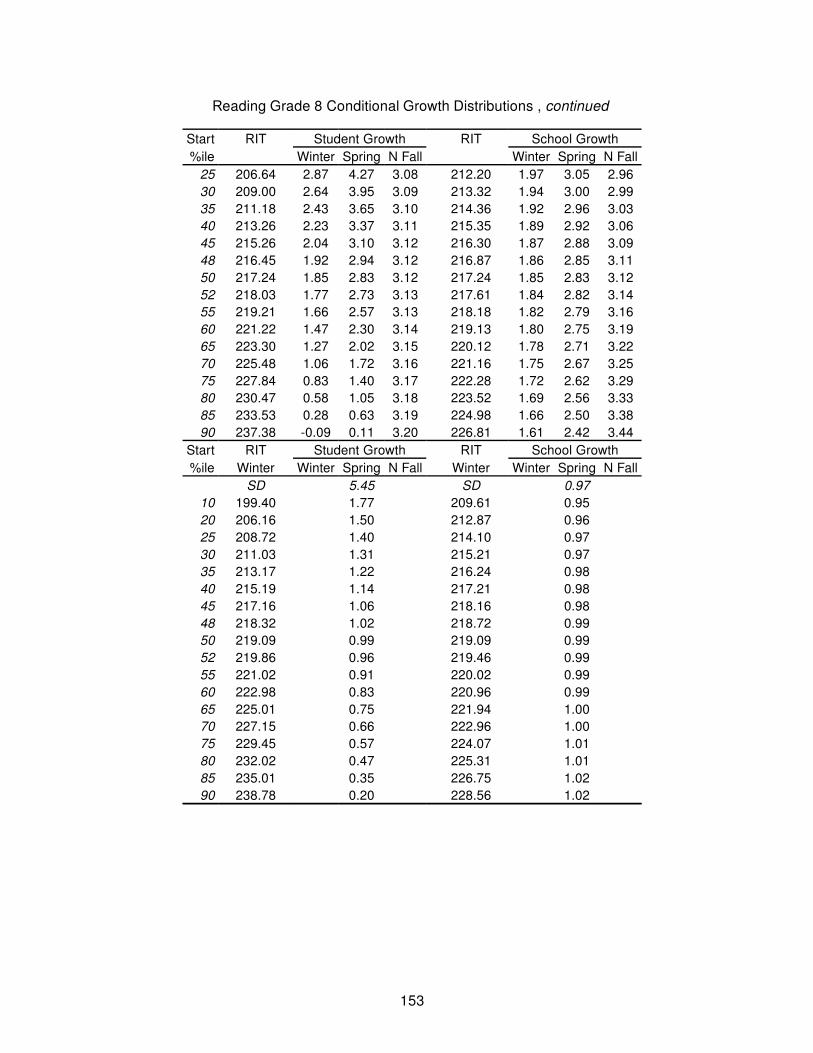
Reading Grade 8 Conditional Growth Distributions , continued
Start RIT Student Growth RIT School Growth
%ile Winter Spring N Fall Winter Spring N Fall
25 206.64 2.87 4.27 3.08 212.20 1.97 3.05 2.96
30 209.00 2.64 3.95 3.09 213.32 1.94 3.00 2.99
35 211.18 2.43 3.65 3.10 214.36 1.92 2.96 3.03
40 213.26 2.23 3.37 3.11 215.35 1.89 2.92 3.06
45 215.26 2.04 3.10 3.12 216.30 1.87 2.88 3.09
48 216.45 1.92 2.94 3.12 216.87 1.86 2.85 3.11
50 217.24 1.85 2.83 3.12 217.24 1.85 2.83 3.12
52 218.03 1.77 2.73 3.13 217.61 1.84 2.82 3.14
55 219.21 1.66 2.57 3.13 218.18 1.82 2.79 3.16
60 221.22 1.47 2.30 3.14 219.13 1.80 2.75 3.19
65 223.30 1.27 2.02 3.15 220.12 1.78 2.71 3.22
70 225.48 1.06 1.72 3.16 221.16 1.75 2.67 3.25
75 227.84 0.83 1.40 3.17 222.28 1.72 2.62 3.29
80 230.47 0.58 1.05 3.18 223.52 1.69 2.56 3.33
85 233.53 0.28 0.63 3.19 224.98 1.66 2.50 3.38
90 237.38 -0.09 0.11 3.20 226.81 1.61 2.42 3.44
Start RIT Student Growth RIT School Growth
%ile Winter Winter Spring N Fall Winter Winter Spring N Fall
SD 5.45 SD 0.97
10 199.40 1.77 209.61 0.95
20 206.16 1.50 212.87 0.96
25 208.72 1.40 214.10 0.97
30 211.03 1.31 215.21 0.97
35 213.17 1.22 216.24 0.98
40 215.19 1.14 217.21 0.98
45 217.16 1.06 218.16 0.98
48 218.32 1.02 218.72 0.99
50 219.09 0.99 219.09 0.99
52 219.86 0.96 219.46 0.99
55 221.02 0.91 220.02 0.99
60 222.98 0.83 220.96 0.99
65 225.01 0.75 221.94 1.00
70 227.15 0.66 222.96 1.00
75 229.45 0.57 224.07 1.01
80 232.02 0.47 225.31 1.01
85 235.01 0.35 226.75 1.02
90 238.78 0.20 228.56 1.02
153

Table D.2.10: Reading Grade 9 Conditional Growth Distributions
Start RIT Student Growth RIT School Growth
%ile Last Winter Winter Spring N Fall Last Winter Winter Spring N Fall
SD 7.26 SD 2.16
10 199.00 4.65 210.06 2.40
20 205.99 3.71 213.25 2.23
25 208.65 3.35 214.47 2.16
30 211.04 3.03 215.56 2.10
35 213.25 2.73 216.57 2.05
40 215.34 2.44 217.53 2.00
45 217.37 2.17 218.46 1.95
48 218.57 2.01 219.01 1.92
50 219.37 1.90 219.37 1.90
52 220.17 1.79 219.74 1.88
55 221.37 1.63 220.29 1.85
60 223.40 1.35 221.21 1.80
65 225.50 1.07 222.17 1.74
70 227.71 0.77 223.18 1.69
75 230.09 0.45 224.27 1.63
80 232.75 0.09 225.49 1.56
85 235.85 -0.33 226.91 1.49
90 239.74 -0.86 228.69 1.39
Start RIT Student Growth RIT School Growth
%ile Last Spring Winter Spring N Fall Last Spring Winter Spring N Fall
SD 8.32 SD 2.67
10 199.09 4.95 210.67 2.33
20 206.41 3.75 214.01 2.04
25 209.18 3.30 215.28 1.93
30 211.68 2.90 216.42 1.83
35 213.99 2.52 217.47 1.73
40 216.18 2.16 218.47 1.64
45 218.31 1.82 219.44 1.56
48 219.56 1.61 220.01 1.51
50 220.40 1.48 220.40 1.48
52 221.23 1.34 220.78 1.44
55 222.48 1.14 221.35 1.39
60 224.61 0.79 222.32 1.31
65 226.80 0.43 223.32 1.22
70 229.11 0.06 224.37 1.13
75 231.61 -0.35 225.51 1.02
80 234.38 -0.80 226.78 0.91
85 237.62 -1.33 228.26 0.78
90 241.70 -2.00 230.12 0.62
Start RIT Student Growth RIT School Growth
%ile Fall Winter Spring N Fall Fall Winter Spring N Fall
SD 6.19 8.65 7.84 SD 1.32 2.32 2.17
10 200.12 2.88 4.18 2.17 211.08 1.12 1.77 1.58
20 207.02 2.25 3.31 2.09 214.21 1.10 1.73 1.70
... continued on next page
154

Reading Grade 9 Conditional Growth Distributions , continued
Start RIT Student Growth RIT School Growth
%ile Winter Spring N Fall Winter Spring N Fall
25 209.64 2.01 2.98 2.05 215.41 1.09 1.71 1.74
30 211.99 1.80 2.69 2.03 216.48 1.08 1.70 1.78
35 214.17 1.60 2.41 2.00 217.47 1.07 1.69 1.82
40 216.24 1.41 2.15 1.97 218.41 1.07 1.68 1.86
45 218.24 1.23 1.90 1.95 219.32 1.06 1.67 1.89
48 219.43 1.12 1.75 1.94 219.86 1.06 1.66 1.91
50 220.22 1.05 1.66 1.93 220.22 1.05 1.66 1.93
52 221.00 0.98 1.56 1.92 220.57 1.05 1.65 1.94
55 222.19 0.87 1.41 1.90 221.11 1.05 1.64 1.96
60 224.19 0.69 1.16 1.88 222.02 1.04 1.63 2.00
65 226.26 0.51 0.90 1.85 222.96 1.03 1.62 2.03
70 228.44 0.31 0.62 1.83 223.96 1.03 1.61 2.07
75 230.79 0.09 0.33 1.80 225.03 1.02 1.60 2.11
80 233.41 -0.14 -0.00 1.77 226.22 1.01 1.58 2.16
85 236.47 -0.42 -0.39 1.73 227.61 1.00 1.56 2.21
90 240.31 -0.77 -0.87 1.68 229.36 0.99 1.54 2.28
Start RIT Student Growth RIT School Growth
%ile Winter Winter Spring N Fall Winter Winter Spring N Fall
SD 5.67 SD 0.98
10 201.35 1.06 212.04 0.42
20 208.19 0.90 215.21 0.48
25 210.78 0.84 216.41 0.50
30 213.12 0.79 217.49 0.53
35 215.28 0.74 218.49 0.55
40 217.33 0.69 219.44 0.57
45 219.32 0.65 220.36 0.58
48 220.49 0.62 220.91 0.59
50 221.27 0.60 221.27 0.60
52 222.05 0.58 221.63 0.61
55 223.22 0.56 222.17 0.62
60 225.21 0.51 223.09 0.64
65 227.26 0.47 224.04 0.66
70 229.42 0.42 225.05 0.68
75 231.75 0.36 226.13 0.70
80 234.35 0.30 227.33 0.72
85 237.38 0.23 228.74 0.75
90 241.19 0.15 230.50 0.79
155
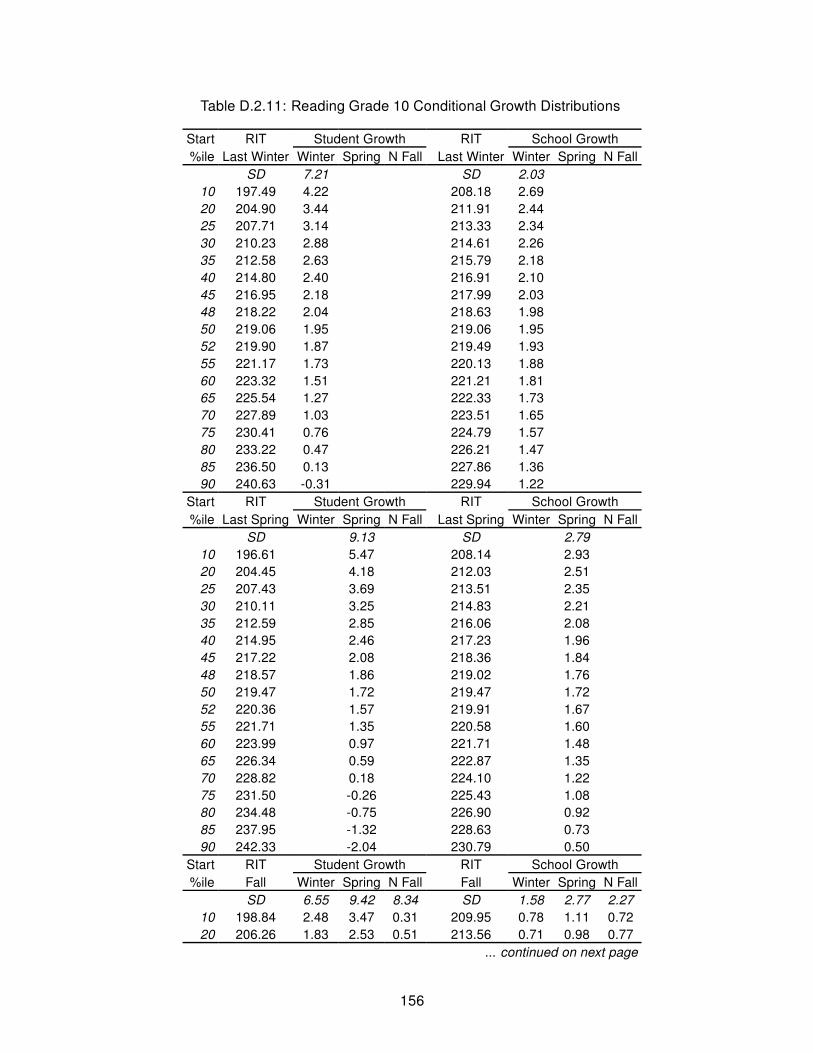
Table D.2.11: Reading Grade 10 Conditional Growth Distributions
Start RIT Student Growth RIT School Growth
%ile Last Winter Winter Spring N Fall Last Winter Winter Spring N Fall
SD 7.21 SD 2.03
10 197.49 4.22 208.18 2.69
20 204.90 3.44 211.91 2.44
25 207.71 3.14 213.33 2.34
30 210.23 2.88 214.61 2.26
35 212.58 2.63 215.79 2.18
40 214.80 2.40 216.91 2.10
45 216.95 2.18 217.99 2.03
48 218.22 2.04 218.63 1.98
50 219.06 1.95 219.06 1.95
52 219.90 1.87 219.49 1.93
55 221.17 1.73 220.13 1.88
60 223.32 1.51 221.21 1.81
65 225.54 1.27 222.33 1.73
70 227.89 1.03 223.51 1.65
75 230.41 0.76 224.79 1.57
80 233.22 0.47 226.21 1.47
85 236.50 0.13 227.86 1.36
90 240.63 -0.31 229.94 1.22
Start RIT Student Growth RIT School Growth
%ile Last Spring Winter Spring N Fall Last Spring Winter Spring N Fall
SD 9.13 SD 2.79
10 196.61 5.47 208.14 2.93
20 204.45 4.18 212.03 2.51
25 207.43 3.69 213.51 2.35
30 210.11 3.25 214.83 2.21
35 212.59 2.85 216.06 2.08
40 214.95 2.46 217.23 1.96
45 217.22 2.08 218.36 1.84
48 218.57 1.86 219.02 1.76
50 219.47 1.72 219.47 1.72
52 220.36 1.57 219.91 1.67
55 221.71 1.35 220.58 1.60
60 223.99 0.97 221.71 1.48
65 226.34 0.59 222.87 1.35
70 228.82 0.18 224.10 1.22
75 231.50 -0.26 225.43 1.08
80 234.48 -0.75 226.90 0.92
85 237.95 -1.32 228.63 0.73
90 242.33 -2.04 230.79 0.50
Start RIT Student Growth RIT School Growth
%ile Fall Winter Spring N Fall Fall Winter Spring N Fall
SD 6.55 9.42 8.34 SD 1.58 2.77 2.27
10 198.84 2.48 3.47 0.31 209.95 0.78 1.11 0.72
20 206.26 1.83 2.53 0.51 213.56 0.71 0.98 0.77
... continued on next page
156

Reading Grade 10 Conditional Growth Distributions , continued
Start RIT Student Growth RIT School Growth
%ile Winter Spring N Fall Winter Spring N Fall
25 209.08 1.58 2.17 0.58 214.92 0.68 0.93 0.79
30 211.61 1.35 1.85 0.64 216.15 0.66 0.89 0.81
35 213.95 1.15 1.56 0.70 217.29 0.63 0.85 0.83
40 216.17 0.95 1.28 0.76 218.37 0.61 0.81 0.84
45 218.33 0.76 1.01 0.82 219.42 0.59 0.77 0.86
48 219.60 0.65 0.85 0.85 220.03 0.58 0.75 0.86
50 220.44 0.57 0.74 0.87 220.44 0.57 0.74 0.87
52 221.29 0.50 0.63 0.89 220.85 0.56 0.72 0.88
55 222.56 0.38 0.47 0.93 221.47 0.55 0.70 0.89
60 224.71 0.19 0.20 0.98 222.52 0.53 0.67 0.90
65 226.94 -0.00 -0.08 1.04 223.60 0.51 0.63 0.92
70 229.28 -0.21 -0.38 1.10 224.74 0.48 0.59 0.93
75 231.81 -0.44 -0.70 1.16 225.96 0.46 0.54 0.95
80 234.63 -0.69 -1.05 1.24 227.33 0.43 0.50 0.97
85 237.91 -0.98 -1.47 1.32 228.93 0.40 0.44 0.99
90 242.04 -1.34 -1.99 1.43 230.93 0.36 0.37 1.02
Start RIT Student Growth RIT School Growth
%ile Winter Winter Spring N Fall Winter Winter Spring N Fall
SD 5.90 SD 1.19
10 199.61 0.48 210.54 0.03
20 206.96 0.37 214.13 0.08
25 209.75 0.33 215.50 0.10
30 212.26 0.30 216.73 0.11
35 214.58 0.26 217.86 0.13
40 216.78 0.23 218.94 0.14
45 218.92 0.20 219.99 0.15
48 220.18 0.18 220.60 0.16
50 221.01 0.17 221.01 0.17
52 221.85 0.16 221.42 0.17
55 223.11 0.14 222.04 0.18
60 225.25 0.11 223.09 0.20
65 227.45 0.07 224.16 0.21
70 229.77 0.04 225.30 0.22
75 232.28 0.00 226.53 0.24
80 235.07 -0.04 227.89 0.26
85 238.32 -0.09 229.49 0.28
90 242.42 -0.15 231.49 0.31
157

Appendix D.3 - Language Usage
Table D.3.1: Language Usage Grade 2 Conditional Growth Distributions
Start RIT Student Growth RIT School Growth
%ile Last Winter Winter Spring N Fall Last Winter Winter Spring N Fall
SD 6.31 SD 2.34
10 146.42 20.60 160.04 16.95
20 154.37 18.81 163.31 16.41
25 157.38 18.13 164.55 16.21
30 160.09 17.52 165.66 16.02
35 162.60 16.95 166.70 15.85
40 164.98 16.41 167.68 15.69
45 167.29 15.89 168.62 15.54
48 168.65 15.59 169.19 15.44
50 169.56 15.38 169.56 15.38
52 170.46 15.18 169.93 15.32
55 171.83 14.87 170.49 15.23
60 174.13 14.35 171.44 15.07
65 176.51 13.81 172.42 14.91
70 179.02 13.25 173.45 14.74
75 181.73 12.64 174.57 14.56
80 184.75 11.96 175.81 14.35
85 188.27 11.16 177.25 14.11
90 192.69 10.16 179.07 13.82
Start RIT Student Growth RIT School Growth
%ile Last Spring Winter Spring N Fall Last Spring Winter Spring N Fall
SD 7.12 SD 2.69
10 151.23 20.86 166.15 15.47
20 159.90 18.23 169.70 14.69
25 163.20 17.23 171.05 14.39
30 166.16 16.33 172.26 14.12
35 168.90 15.49 173.39 13.87
40 171.50 14.70 174.45 13.64
45 174.02 13.94 175.48 13.41
48 175.51 13.49 176.09 13.27
50 176.50 13.18 176.50 13.18
52 177.49 12.88 176.90 13.10
55 178.98 12.43 177.51 12.96
60 181.49 11.67 178.54 12.73
65 184.10 10.88 179.61 12.50
70 186.84 10.04 180.73 12.25
75 189.80 9.14 181.94 11.98
80 193.09 8.14 183.29 11.68
85 196.94 6.98 184.87 11.34
90 201.77 5.51 186.85 10.90
Start RIT Student Growth RIT School Growth
%ile Fall Winter Spring N Fall Fall Winter Spring N Fall
SD 6.11 8.98 8.92 SD 1.48 2.59 2.53
... continued on next page
158

Language Usage Grade 2 Conditional Growth Distributions , continued
Start RIT Student Growth RIT School Growth
%ile Winter Spring N Fall Winter Spring N Fall
10 153.26 13.65 20.28 19.19 166.02 10.65 15.55 15.39
20 160.56 12.54 18.53 17.68 168.93 10.57 15.42 15.19
25 163.33 12.12 17.86 17.11 170.04 10.54 15.37 15.11
30 165.82 11.74 17.26 16.60 171.04 10.52 15.33 15.04
35 168.12 11.39 16.71 16.12 171.96 10.49 15.28 14.98
40 170.31 11.06 16.18 15.67 172.83 10.47 15.25 14.92
45 172.43 10.74 15.67 15.23 173.68 10.45 15.21 14.86
48 173.68 10.55 15.37 14.98 174.18 10.44 15.18 14.83
50 174.51 10.43 15.17 14.80 174.51 10.43 15.17 14.80
52 175.34 10.30 14.97 14.63 174.85 10.42 15.16 14.78
55 176.60 10.11 14.67 14.37 175.35 10.41 15.13 14.75
60 178.71 9.79 14.16 13.94 176.19 10.38 15.09 14.69
65 180.90 9.46 13.63 13.49 177.07 10.36 15.06 14.63
70 183.21 9.11 13.08 13.01 177.99 10.34 15.01 14.56
75 185.70 8.73 12.48 12.50 178.99 10.31 14.97 14.49
80 188.47 8.31 11.81 11.92 180.09 10.28 14.92 14.42
85 191.70 7.82 11.04 11.26 181.38 10.25 14.86 14.33
90 195.76 7.21 10.06 10.42 183.01 10.21 14.79 14.22
Start RIT Student Growth RIT School Growth
%ile Winter Winter Spring N Fall Winter Winter Spring N Fall
SD 5.62 SD 1.11
10 165.28 5.93 176.45 4.59
20 172.03 5.52 179.36 4.64
25 174.59 5.37 180.47 4.66
30 176.90 5.23 181.46 4.68
35 179.03 5.10 182.39 4.70
40 181.05 4.98 183.26 4.71
45 183.01 4.86 184.11 4.73
48 184.17 4.79 184.61 4.74
50 184.94 4.74 184.94 4.74
52 185.71 4.70 185.27 4.75
55 186.87 4.63 185.77 4.76
60 188.83 4.51 186.62 4.77
65 190.85 4.39 187.49 4.79
70 192.98 4.26 188.42 4.81
75 195.29 4.12 189.41 4.83
80 197.85 3.96 190.52 4.85
85 200.84 3.78 191.81 4.87
90 204.60 3.55 193.43 4.90
159
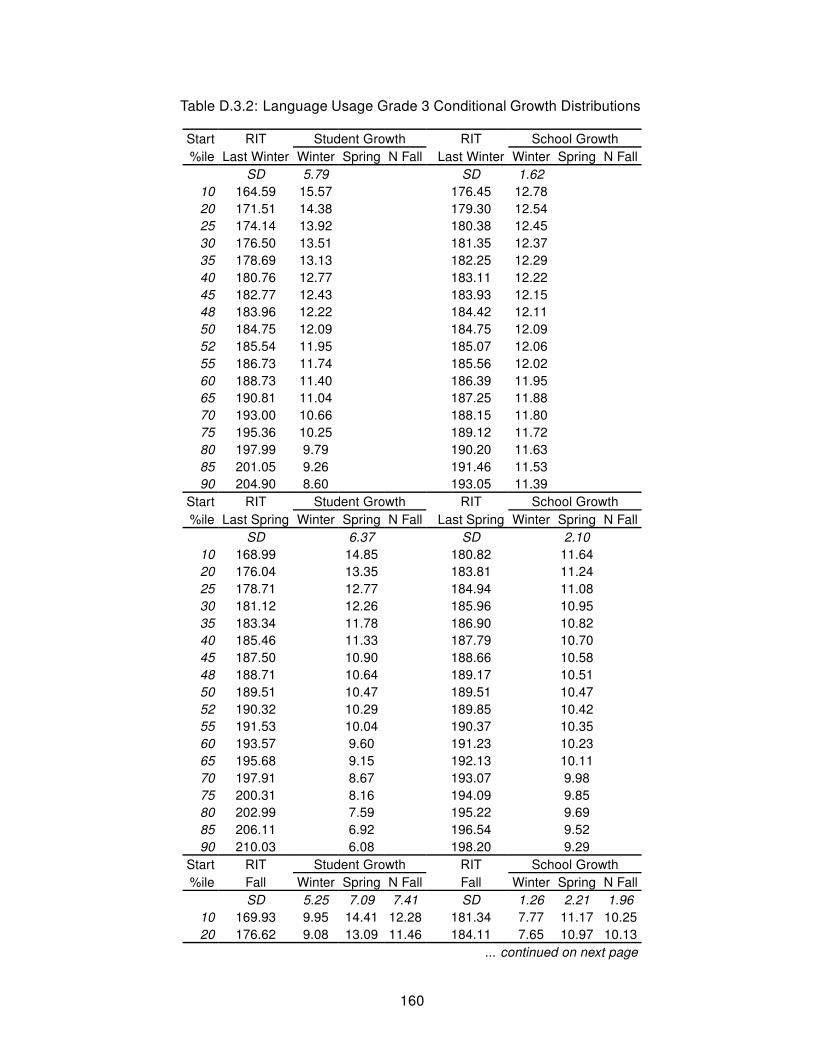
Table D.3.2: Language Usage Grade 3 Conditional Growth Distributions
Start RIT Student Growth RIT School Growth
%ile Last Winter Winter Spring N Fall Last Winter Winter Spring N Fall
SD 5.79 SD 1.62
10 164.59 15.57 176.45 12.78
20 171.51 14.38 179.30 12.54
25 174.14 13.92 180.38 12.45
30 176.50 13.51 181.35 12.37
35 178.69 13.13 182.25 12.29
40 180.76 12.77 183.11 12.22
45 182.77 12.43 183.93 12.15
48 183.96 12.22 184.42 12.11
50 184.75 12.09 184.75 12.09
52 185.54 11.95 185.07 12.06
55 186.73 11.74 185.56 12.02
60 188.73 11.40 186.39 11.95
65 190.81 11.04 187.25 11.88
70 193.00 10.66 188.15 11.80
75 195.36 10.25 189.12 11.72
80 197.99 9.79 190.20 11.63
85 201.05 9.26 191.46 11.53
90 204.90 8.60 193.05 11.39
Start RIT Student Growth RIT School Growth
%ile Last Spring Winter Spring N Fall Last Spring Winter Spring N Fall
SD 6.37 SD 2.10
10 168.99 14.85 180.82 11.64
20 176.04 13.35 183.81 11.24
25 178.71 12.77 184.94 11.08
30 181.12 12.26 185.96 10.95
35 183.34 11.78 186.90 10.82
40 185.46 11.33 187.79 10.70
45 187.50 10.90 188.66 10.58
48 188.71 10.64 189.17 10.51
50 189.51 10.47 189.51 10.47
52 190.32 10.29 189.85 10.42
55 191.53 10.04 190.37 10.35
60 193.57 9.60 191.23 10.23
65 195.68 9.15 192.13 10.11
70 197.91 8.67 193.07 9.98
75 200.31 8.16 194.09 9.85
80 202.99 7.59 195.22 9.69
85 206.11 6.92 196.54 9.52
90 210.03 6.08 198.20 9.29
Start RIT Student Growth RIT School Growth
%ile Fall Winter Spring N Fall Fall Winter Spring N Fall
SD 5.25 7.09 7.41 SD 1.26 2.21 1.96
10 169.93 9.95 14.41 12.28 181.34 7.77 11.17 10.25
20 176.62 9.08 13.09 11.46 184.11 7.65 10.97 10.13
... continued on next page
160

Language Usage Grade 3 Conditional Growth Distributions , continued
Start RIT Student Growth RIT School Growth
%ile Winter Spring N Fall Winter Spring N Fall
25 179.16 8.75 12.59 11.15 185.16 7.61 10.89 10.08
30 181.44 8.46 12.14 10.87 186.11 7.57 10.82 10.04
35 183.55 8.18 11.72 10.61 186.98 7.53 10.75 10.00
40 185.56 7.92 11.33 10.37 187.81 7.49 10.69 9.97
45 187.50 7.67 10.95 10.13 188.62 7.46 10.63 9.93
48 188.65 7.52 10.72 9.99 189.09 7.44 10.59 9.91
50 189.41 7.42 10.57 9.90 189.41 7.42 10.57 9.90
52 190.17 7.33 10.42 9.80 189.72 7.41 10.55 9.88
55 191.32 7.18 10.19 9.66 190.20 7.39 10.51 9.86
60 193.26 6.93 9.81 9.43 191.00 7.36 10.45 9.83
65 195.27 6.67 9.41 9.18 191.83 7.32 10.39 9.79
70 197.38 6.39 9.00 8.92 192.71 7.28 10.32 9.75
75 199.66 6.10 8.55 8.65 193.65 7.24 10.25 9.71
80 202.20 5.77 8.05 8.34 194.71 7.20 10.17 9.67
85 205.16 5.39 7.46 7.97 195.93 7.15 10.08 9.61
90 208.89 4.90 6.73 7.52 197.48 7.08 9.97 9.55
Start RIT Student Growth RIT School Growth
%ile Winter Winter Spring N Fall Winter Winter Spring N Fall
SD 4.95 SD 0.97
10 178.59 4.46 188.94 3.15
20 184.85 4.01 191.65 3.15
25 187.23 3.84 192.68 3.15
30 189.37 3.68 193.61 3.15
35 191.35 3.54 194.46 3.15
40 193.23 3.40 195.27 3.15
45 195.05 3.27 196.06 3.15
48 196.12 3.20 196.53 3.14
50 196.83 3.14 196.83 3.14
52 197.55 3.09 197.14 3.14
55 198.62 3.02 197.61 3.14
60 200.44 2.89 198.39 3.14
65 202.32 2.75 199.21 3.14
70 204.30 2.61 200.06 3.14
75 206.44 2.45 200.99 3.14
80 208.81 2.28 202.02 3.14
85 211.59 2.08 203.21 3.14
90 215.08 1.83 204.72 3.14
161

Table D.3.3: Language Usage Grade 4 Conditional Growth Distributions
Start RIT Student Growth RIT School Growth
%ile Last Winter Winter Spring N Fall Last Winter Winter Spring N Fall
SD 5.42 SD 1.43
10 177.40 10.71 188.58 8.49
20 183.97 9.73 191.31 8.28
25 186.46 9.36 192.35 8.19
30 188.71 9.03 193.28 8.12
35 190.78 8.72 194.15 8.05
40 192.76 8.43 194.97 7.99
45 194.66 8.15 195.76 7.93
48 195.79 7.98 196.23 7.89
50 196.54 7.87 196.54 7.87
52 197.29 7.76 196.85 7.84
55 198.42 7.59 197.32 7.81
60 200.33 7.31 198.12 7.75
65 202.30 7.01 198.94 7.68
70 204.38 6.71 199.80 7.61
75 206.62 6.37 200.73 7.54
80 209.11 6.00 201.77 7.46
85 212.02 5.57 202.98 7.37
90 215.69 5.03 204.50 7.25
Start RIT Student Growth RIT School Growth
%ile Last Spring Winter Spring N Fall Last Spring Winter Spring N Fall
SD 5.97 SD 1.84
10 180.59 10.38 191.72 7.76
20 187.20 9.17 194.50 7.45
25 189.71 8.71 195.56 7.33
30 191.96 8.30 196.51 7.23
35 194.05 7.92 197.39 7.13
40 196.03 7.56 198.23 7.04
45 197.95 7.20 199.04 6.95
48 199.08 7.00 199.52 6.89
50 199.83 6.86 199.83 6.86
52 200.59 6.72 200.15 6.82
55 201.72 6.51 200.63 6.77
60 203.64 6.16 201.44 6.68
65 205.62 5.80 202.27 6.59
70 207.71 5.42 203.16 6.49
75 209.96 5.00 204.11 6.38
80 212.47 4.54 205.16 6.26
85 215.40 4.01 206.40 6.13
90 219.08 3.34 207.95 5.95
Start RIT Student Growth RIT School Growth
%ile Fall Winter Spring N Fall Fall Winter Spring N Fall
SD 4.96 6.39 6.56 SD 1.00 1.75 1.62
10 180.04 7.82 11.20 8.91 191.09 5.86 8.35 7.32
20 186.49 7.05 10.05 8.27 193.75 5.76 8.18 7.23
... continued on next page
162

Language Usage Grade 4 Conditional Growth Distributions , continued
Start RIT Student Growth RIT School Growth
%ile Winter Spring N Fall Winter Spring N Fall
25 188.94 6.76 9.62 8.03 194.76 5.73 8.12 7.19
30 191.14 6.50 9.23 7.81 195.66 5.69 8.06 7.16
35 193.18 6.25 8.87 7.61 196.50 5.66 8.01 7.13
40 195.12 6.02 8.52 7.42 197.30 5.64 7.96 7.11
45 196.99 5.80 8.19 7.24 198.07 5.61 7.91 7.08
48 198.09 5.67 7.99 7.13 198.53 5.59 7.88 7.06
50 198.83 5.58 7.86 7.05 198.83 5.58 7.86 7.05
52 199.56 5.49 7.73 6.98 199.13 5.57 7.84 7.04
55 200.67 5.36 7.54 6.87 199.59 5.55 7.82 7.03
60 202.54 5.14 7.20 6.69 200.36 5.52 7.77 7.00
65 204.48 4.91 6.86 6.50 201.16 5.50 7.72 6.97
70 206.52 4.66 6.50 6.30 202.00 5.47 7.66 6.94
75 208.72 4.40 6.11 6.08 202.90 5.43 7.61 6.91
80 211.17 4.11 5.67 5.84 203.91 5.40 7.54 6.88
85 214.02 3.77 5.16 5.56 205.09 5.35 7.47 6.84
90 217.61 3.34 4.53 5.20 206.57 5.30 7.37 6.79
Start RIT Student Growth RIT School Growth
%ile Winter Winter Spring N Fall Winter Winter Spring N Fall
SD 4.73 SD 0.77
10 186.69 3.60 196.84 2.33
20 192.77 3.15 199.44 2.31
25 195.08 2.98 200.43 2.31
30 197.16 2.82 201.31 2.30
35 199.08 2.68 202.13 2.30
40 200.91 2.54 202.91 2.29
45 202.67 2.41 203.67 2.29
48 203.72 2.33 204.11 2.29
50 204.41 2.28 204.41 2.28
52 205.10 2.23 204.71 2.28
55 206.15 2.15 205.15 2.28
60 207.91 2.02 205.91 2.27
65 209.74 1.89 206.69 2.27
70 211.66 1.74 207.51 2.27
75 213.74 1.59 208.39 2.26
80 216.05 1.42 209.38 2.25
85 218.74 1.22 210.53 2.25
90 222.13 0.96 211.98 2.24
163

Table D.3.4: Language Usage Grade 5 Conditional Growth Distributions
Start RIT Student Growth RIT School Growth
%ile Last Winter Winter Spring N Fall Last Winter Winter Spring N Fall
SD 5.68 SD 1.60
10 185.83 8.56 196.53 6.35
20 192.07 7.58 199.10 6.12
25 194.44 7.20 200.08 6.04
30 196.57 6.87 200.95 5.96
35 198.55 6.55 201.76 5.89
40 200.42 6.26 202.53 5.82
45 202.23 5.97 203.28 5.76
48 203.30 5.80 203.72 5.72
50 204.01 5.69 204.01 5.69
52 204.72 5.58 204.30 5.66
55 205.79 5.41 204.75 5.63
60 207.61 5.12 205.49 5.56
65 209.48 4.83 206.26 5.49
70 211.45 4.52 207.07 5.42
75 213.58 4.18 207.95 5.34
80 215.95 3.80 208.92 5.26
85 218.71 3.37 210.06 5.16
90 222.19 2.82 211.49 5.03
Start RIT Student Growth RIT School Growth
%ile Last Spring Winter Spring N Fall Last Spring Winter Spring N Fall
SD 6.18 SD 1.92
10 188.04 8.49 198.71 5.97
20 194.35 7.31 201.35 5.66
25 196.75 6.86 202.36 5.53
30 198.90 6.46 203.26 5.43
35 200.89 6.08 204.10 5.33
40 202.79 5.73 204.89 5.23
45 204.62 5.39 205.66 5.14
48 205.70 5.18 206.12 5.08
50 206.42 5.05 206.42 5.05
52 207.14 4.91 206.72 5.01
55 208.22 4.71 207.17 4.96
60 210.05 4.37 207.94 4.86
65 211.94 4.01 208.74 4.77
70 213.94 3.64 209.57 4.67
75 216.09 3.23 210.48 4.56
80 218.49 2.78 211.48 4.44
85 221.28 2.26 212.66 4.30
90 224.79 1.60 214.13 4.12
Start RIT Student Growth RIT School Growth
%ile Fall Winter Spring N Fall Fall Winter Spring N Fall
SD 4.96 6.37 6.92 SD 0.97 1.70 1.83
10 187.86 6.13 8.81 6.65 198.46 4.23 6.12 5.29
20 193.96 5.42 7.79 6.16 200.92 4.18 6.02 5.27
... continued on next page
164

Language Usage Grade 5 Conditional Growth Distributions , continued
Start RIT Student Growth RIT School Growth
%ile Winter Spring N Fall Winter Spring N Fall
25 196.28 5.15 7.40 5.98 201.86 4.16 5.98 5.26
30 198.36 4.91 7.05 5.81 202.70 4.14 5.95 5.26
35 200.29 4.69 6.73 5.66 203.48 4.12 5.92 5.25
40 202.12 4.48 6.42 5.51 204.22 4.10 5.89 5.24
45 203.89 4.27 6.12 5.37 204.93 4.08 5.86 5.24
48 204.94 4.15 5.95 5.29 205.35 4.07 5.84 5.24
50 205.63 4.07 5.83 5.23 205.63 4.07 5.83 5.23
52 206.33 3.99 5.71 5.18 205.92 4.06 5.82 5.23
55 207.38 3.87 5.54 5.09 206.34 4.05 5.80 5.23
60 209.15 3.66 5.24 4.95 207.05 4.04 5.77 5.22
65 210.98 3.45 4.93 4.81 207.79 4.02 5.74 5.22
70 212.91 3.23 4.61 4.66 208.57 4.00 5.71 5.21
75 214.99 2.98 4.26 4.49 209.41 3.98 5.68 5.20
80 217.31 2.72 3.87 4.31 210.35 3.96 5.64 5.20
85 220.01 2.40 3.42 4.09 211.44 3.93 5.60 5.19
90 223.41 2.01 2.85 3.82 212.81 3.90 5.54 5.18
Start RIT Student Growth RIT School Growth
%ile Winter Winter Spring N Fall Winter Winter Spring N Fall
SD 4.72 SD 0.74
10 192.75 2.94 202.58 1.72
20 198.57 2.53 205.03 1.74
25 200.78 2.38 205.96 1.74
30 202.77 2.24 206.79 1.75
35 204.61 2.12 207.56 1.75
40 206.35 1.99 208.30 1.75
45 208.04 1.88 209.00 1.76
48 209.04 1.81 209.42 1.76
50 209.70 1.76 209.70 1.76
52 210.37 1.72 209.98 1.76
55 211.36 1.65 210.40 1.77
60 213.05 1.53 211.11 1.77
65 214.80 1.41 211.84 1.78
70 216.64 1.28 212.62 1.78
75 218.62 1.15 213.45 1.78
80 220.83 0.99 214.38 1.79
85 223.41 0.81 215.46 1.80
90 226.65 0.59 216.82 1.80
165

Table D.3.5: Language Usage Grade 6 Conditional Growth Distributions
Start RIT Student Growth RIT School Growth
%ile Last Winter Winter Spring N Fall Last Winter Winter Spring N Fall
SD 5.67 SD 1.63
10 191.70 6.83 202.31 4.48
20 197.92 5.90 204.89 4.36
25 200.28 5.55 205.87 4.31
30 202.40 5.23 206.75 4.27
35 204.37 4.94 207.56 4.23
40 206.23 4.66 208.33 4.20
45 208.04 4.39 209.08 4.16
48 209.11 4.23 209.52 4.14
50 209.82 4.13 209.82 4.13
52 210.52 4.02 210.11 4.11
55 211.59 3.86 210.55 4.09
60 213.40 3.59 211.30 4.05
65 215.26 3.31 212.07 4.02
70 217.23 3.02 212.88 3.98
75 219.35 2.70 213.76 3.94
80 221.71 2.35 214.74 3.89
85 224.47 1.94 215.88 3.84
90 227.93 1.42 217.32 3.77
Start RIT Student Growth RIT School Growth
%ile Last Spring Winter Spring N Fall Last Spring Winter Spring N Fall
SD 6.18 SD 1.90
10 193.19 6.85 203.97 4.11
20 199.54 5.73 206.61 3.93
25 201.95 5.31 207.62 3.86
30 204.11 4.93 208.52 3.80
35 206.11 4.57 209.35 3.75
40 208.02 4.24 210.15 3.69
45 209.86 3.91 210.91 3.64
48 210.95 3.72 211.37 3.61
50 211.67 3.59 211.67 3.59
52 212.39 3.46 211.97 3.57
55 213.48 3.27 212.42 3.54
60 215.32 2.95 213.19 3.49
65 217.22 2.61 213.99 3.44
70 219.23 2.26 214.82 3.38
75 221.39 1.87 215.72 3.32
80 223.80 1.45 216.73 3.25
85 226.61 0.95 217.90 3.17
90 230.15 0.33 219.37 3.08
Start RIT Student Growth RIT School Growth
%ile Fall Winter Spring N Fall Fall Winter Spring N Fall
SD 5.02 6.51 6.75 SD 1.03 1.81 1.79
10 193.05 5.11 7.22 5.27 203.27 3.34 4.76 3.69
20 199.12 4.46 6.30 4.77 205.83 3.30 4.68 3.74
... continued on next page
166
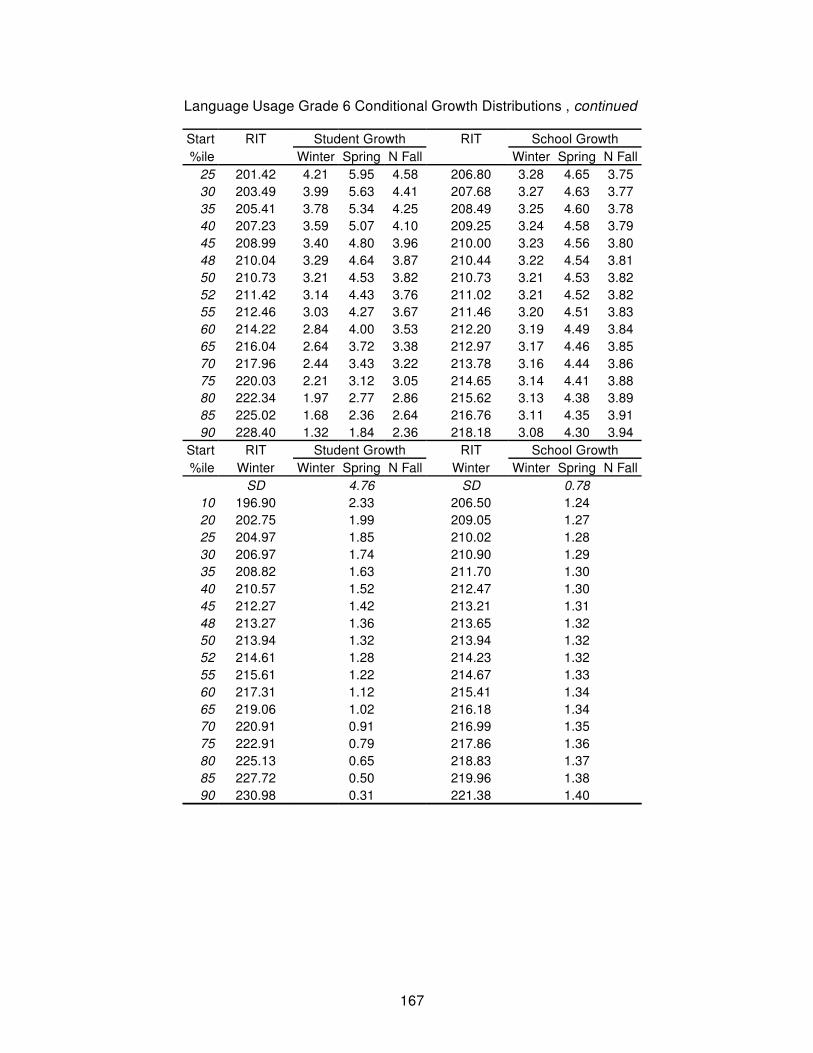
Language Usage Grade 6 Conditional Growth Distributions , continued
Start RIT Student Growth RIT School Growth
%ile Winter Spring N Fall Winter Spring N Fall
25 201.42 4.21 5.95 4.58 206.80 3.28 4.65 3.75
30 203.49 3.99 5.63 4.41 207.68 3.27 4.63 3.77
35 205.41 3.78 5.34 4.25 208.49 3.25 4.60 3.78
40 207.23 3.59 5.07 4.10 209.25 3.24 4.58 3.79
45 208.99 3.40 4.80 3.96 210.00 3.23 4.56 3.80
48 210.04 3.29 4.64 3.87 210.44 3.22 4.54 3.81
50 210.73 3.21 4.53 3.82 210.73 3.21 4.53 3.82
52 211.42 3.14 4.43 3.76 211.02 3.21 4.52 3.82
55 212.46 3.03 4.27 3.67 211.46 3.20 4.51 3.83
60 214.22 2.84 4.00 3.53 212.20 3.19 4.49 3.84
65 216.04 2.64 3.72 3.38 212.97 3.17 4.46 3.85
70 217.96 2.44 3.43 3.22 213.78 3.16 4.44 3.86
75 220.03 2.21 3.12 3.05 214.65 3.14 4.41 3.88
80 222.34 1.97 2.77 2.86 215.62 3.13 4.38 3.89
85 225.02 1.68 2.36 2.64 216.76 3.11 4.35 3.91
90 228.40 1.32 1.84 2.36 218.18 3.08 4.30 3.94
Start RIT Student Growth RIT School Growth
%ile Winter Winter Spring N Fall Winter Winter Spring N Fall
SD 4.76 SD 0.78
10 196.90 2.33 206.50 1.24
20 202.75 1.99 209.05 1.27
25 204.97 1.85 210.02 1.28
30 206.97 1.74 210.90 1.29
35 208.82 1.63 211.70 1.30
40 210.57 1.52 212.47 1.30
45 212.27 1.42 213.21 1.31
48 213.27 1.36 213.65 1.32
50 213.94 1.32 213.94 1.32
52 214.61 1.28 214.23 1.32
55 215.61 1.22 214.67 1.33
60 217.31 1.12 215.41 1.34
65 219.06 1.02 216.18 1.34
70 220.91 0.91 216.99 1.35
75 222.91 0.79 217.86 1.36
80 225.13 0.65 218.83 1.37
85 227.72 0.50 219.96 1.38
90 230.98 0.31 221.38 1.40
167

Table D.3.6: Language Usage Grade 7 Conditional Growth Distributions
Start RIT Student Growth RIT School Growth
%ile Last Winter Winter Spring N Fall Last Winter Winter Spring N Fall
SD 5.40 SD 1.43
10 195.13 5.49 205.44 3.76
20 201.35 4.73 208.11 3.59
25 203.71 4.44 209.13 3.53
30 205.83 4.18 210.04 3.47
35 207.79 3.94 210.89 3.42
40 209.65 3.71 211.69 3.37
45 211.46 3.49 212.47 3.32
48 212.52 3.36 212.93 3.30
50 213.23 3.28 213.23 3.28
52 213.94 3.19 213.54 3.26
55 215.01 3.06 214.00 3.23
60 216.81 2.84 214.77 3.18
65 218.67 2.61 215.58 3.13
70 220.64 2.37 216.42 3.08
75 222.76 2.11 217.33 3.02
80 225.12 1.82 218.35 2.96
85 227.87 1.49 219.54 2.89
90 231.33 1.06 221.03 2.80
Start RIT Student Growth RIT School Growth
%ile Last Spring Winter Spring N Fall Last Spring Winter Spring N Fall
SD 5.98 SD 1.70
10 195.83 5.99 206.27 3.91
20 202.27 4.97 209.13 3.60
25 204.72 4.58 210.21 3.49
30 206.92 4.23 211.19 3.38
35 208.95 3.91 212.09 3.28
40 210.89 3.60 212.95 3.19
45 212.76 3.31 213.78 3.10
48 213.86 3.13 214.27 3.05
50 214.60 3.01 214.60 3.01
52 215.33 2.90 214.92 2.98
55 216.44 2.72 215.41 2.93
60 218.31 2.43 216.24 2.84
65 220.24 2.12 217.10 2.74
70 222.28 1.80 218.00 2.65
75 224.47 1.45 218.98 2.54
80 226.92 1.06 220.06 2.42
85 229.77 0.61 221.33 2.29
90 233.36 0.04 222.92 2.11
Start RIT Student Growth RIT School Growth
%ile Fall Winter Spring N Fall Fall Winter Spring N Fall
SD 4.98 6.39 6.32 SD 1.07 1.88 1.76
10 196.31 4.10 5.78 4.33 206.53 2.57 3.72 3.09
20 202.39 3.54 5.03 3.94 209.10 2.54 3.68 3.12
... continued on next page
168

Language Usage Grade 7 Conditional Growth Distributions , continued
Start RIT Student Growth RIT School Growth
%ile Winter Spring N Fall Winter Spring N Fall
25 204.70 3.34 4.74 3.79 210.08 2.53 3.66 3.14
30 206.77 3.15 4.49 3.66 210.95 2.52 3.65 3.15
35 208.69 2.97 4.25 3.53 211.77 2.51 3.63 3.16
40 210.52 2.81 4.02 3.41 212.54 2.51 3.62 3.17
45 212.28 2.65 3.81 3.30 213.28 2.50 3.60 3.18
48 213.32 2.55 3.68 3.23 213.72 2.49 3.60 3.18
50 214.02 2.49 3.59 3.18 214.02 2.49 3.59 3.18
52 214.71 2.43 3.51 3.14 214.31 2.49 3.59 3.19
55 215.75 2.33 3.38 3.07 214.75 2.48 3.58 3.19
60 217.52 2.17 3.16 2.96 215.50 2.48 3.57 3.20
65 219.34 2.01 2.94 2.84 216.27 2.47 3.55 3.21
70 221.27 1.83 2.70 2.71 217.08 2.46 3.54 3.22
75 223.34 1.65 2.44 2.58 217.96 2.45 3.52 3.23
80 225.65 1.44 2.16 2.43 218.94 2.44 3.51 3.25
85 228.34 1.19 1.83 2.26 220.08 2.43 3.49 3.26
90 231.73 0.88 1.41 2.04 221.51 2.42 3.46 3.28
Start RIT Student Growth RIT School Growth
%ile Winter Winter Spring N Fall Winter Winter Spring N Fall
SD 4.72 SD 0.80
10 199.18 1.95 208.97 0.97
20 205.13 1.66 211.56 1.01
25 207.39 1.55 212.54 1.03
30 209.42 1.45 213.42 1.05
35 211.30 1.36 214.24 1.06
40 213.08 1.27 215.02 1.08
45 214.81 1.18 215.77 1.09
48 215.83 1.13 216.21 1.10
50 216.51 1.10 216.51 1.10
52 217.19 1.07 216.80 1.11
55 218.21 1.02 217.25 1.11
60 219.93 0.93 218.00 1.13
65 221.72 0.85 218.78 1.14
70 223.60 0.75 219.59 1.16
75 225.63 0.66 220.48 1.17
80 227.89 0.54 221.46 1.19
85 230.52 0.42 222.61 1.21
90 233.83 0.25 224.05 1.23
169

Table D.3.7: Language Usage Grade 8 Conditional Growth Distributions
Start RIT Student Growth RIT School Growth
%ile Last Winter Winter Spring N Fall Last Winter Winter Spring N Fall
SD 6.07 SD 1.67
10 196.77 5.25 206.71 3.11
20 203.04 4.49 209.57 3.08
25 205.43 4.20 210.66 3.07
30 207.57 3.94 211.63 3.06
35 209.55 3.70 212.54 3.05
40 211.43 3.47 213.40 3.05
45 213.25 3.25 214.23 3.04
48 214.33 3.12 214.72 3.04
50 215.05 3.03 215.05 3.03
52 215.76 2.95 215.37 3.03
55 216.84 2.82 215.86 3.03
60 218.66 2.59 216.69 3.02
65 220.54 2.37 217.55 3.01
70 222.52 2.13 218.46 3.00
75 224.66 1.87 219.43 2.99
80 227.05 1.58 220.52 2.98
85 229.82 1.24 221.79 2.97
90 233.32 0.82 223.38 2.96
Start RIT Student Growth RIT School Growth
%ile Last Spring Winter Spring N Fall Last Spring Winter Spring N Fall
SD 7.10 SD 2.13
10 197.55 5.64 207.74 2.94
20 204.00 4.63 210.69 2.86
25 206.44 4.25 211.81 2.83
30 208.64 3.91 212.81 2.80
35 210.68 3.59 213.75 2.78
40 212.61 3.29 214.63 2.76
45 214.48 3.00 215.48 2.73
48 215.59 2.83 215.99 2.72
50 216.33 2.71 216.33 2.71
52 217.06 2.60 216.66 2.70
55 218.17 2.42 217.17 2.69
60 220.04 2.13 218.02 2.67
65 221.97 1.83 218.91 2.64
70 224.01 1.51 219.84 2.62
75 226.21 1.17 220.84 2.59
80 228.66 0.79 221.96 2.56
85 231.51 0.35 223.27 2.53
90 235.10 -0.21 224.91 2.49
Start RIT Student Growth RIT School Growth
%ile Fall Winter Spring N Fall Fall Winter Spring N Fall
SD 5.25 7.01 7.32 SD 1.09 1.90 1.81
10 198.01 3.54 5.11 2.32 207.79 1.87 2.80 1.80
20 204.25 2.98 4.34 2.27 210.66 1.88 2.82 1.93
... continued on next page
170

Language Usage Grade 8 Conditional Growth Distributions , continued
Start RIT Student Growth RIT School Growth
%ile Winter Spring N Fall Winter Spring N Fall
25 206.61 2.76 4.05 2.25 211.76 1.89 2.83 1.98
30 208.74 2.57 3.78 2.24 212.74 1.89 2.84 2.02
35 210.71 2.40 3.54 2.22 213.65 1.89 2.85 2.06
40 212.58 2.23 3.31 2.20 214.51 1.90 2.85 2.10
45 214.39 2.07 3.09 2.19 215.35 1.90 2.86 2.14
48 215.46 1.97 2.95 2.18 215.84 1.90 2.86 2.16
50 216.17 1.91 2.86 2.18 216.17 1.91 2.86 2.18
52 216.88 1.84 2.78 2.17 216.50 1.91 2.87 2.19
55 217.95 1.75 2.64 2.16 216.99 1.91 2.87 2.21
60 219.76 1.58 2.42 2.15 217.83 1.91 2.88 2.25
65 221.63 1.41 2.19 2.13 218.69 1.92 2.88 2.29
70 223.60 1.24 1.95 2.12 219.60 1.92 2.89 2.33
75 225.73 1.05 1.68 2.10 220.59 1.92 2.90 2.37
80 228.10 0.83 1.39 2.08 221.68 1.93 2.91 2.42
85 230.86 0.59 1.05 2.06 222.96 1.93 2.91 2.48
90 234.33 0.27 0.62 2.03 224.56 1.94 2.93 2.55
Start RIT Student Growth RIT School Growth
%ile Winter Winter Spring N Fall Winter Winter Spring N Fall
SD 4.90 SD 0.80
10 200.23 1.64 209.54 0.76
20 206.36 1.41 212.47 0.83
25 208.69 1.32 213.59 0.86
30 210.78 1.24 214.58 0.88
35 212.71 1.16 215.51 0.90
40 214.55 1.09 216.39 0.92
45 216.33 1.03 217.24 0.94
48 217.38 0.99 217.74 0.95
50 218.08 0.96 218.08 0.96
52 218.78 0.93 218.41 0.97
55 219.83 0.89 218.92 0.98
60 221.61 0.82 219.77 1.00
65 223.44 0.75 220.64 1.02
70 225.38 0.68 221.57 1.04
75 227.47 0.60 222.57 1.06
80 229.80 0.51 223.68 1.09
85 232.51 0.41 224.98 1.12
90 235.92 0.28 226.61 1.15
171

Table D.3.8: Language Usage Grade 9 Conditional Growth Distributions
Start RIT Student Growth RIT School Growth
%ile Last Winter Winter Spring N Fall Last Winter Winter Spring N Fall
SD 6.42 SD 1.90
10 199.93 3.88 209.68 1.68
20 206.29 2.99 212.69 1.54
25 208.70 2.65 213.84 1.49
30 210.87 2.34 214.86 1.44
35 212.88 2.06 215.81 1.40
40 214.79 1.79 216.72 1.36
45 216.63 1.53 217.59 1.32
48 217.72 1.38 218.11 1.29
50 218.45 1.28 218.45 1.28
52 219.17 1.18 218.79 1.26
55 220.26 1.02 219.31 1.24
60 222.11 0.76 220.18 1.20
65 224.02 0.50 221.08 1.16
70 226.03 0.21 222.03 1.11
75 228.20 -0.09 223.06 1.07
80 230.61 -0.43 224.20 1.01
85 233.43 -0.83 225.54 0.95
90 236.97 -1.33 227.21 0.88
Start RIT Student Growth RIT School Growth
%ile Last Spring Winter Spring N Fall Last Spring Winter Spring N Fall
SD 7.21 SD 2.20
10 199.96 4.29 210.10 1.78
20 206.63 3.16 213.28 1.51
25 209.16 2.73 214.49 1.41
30 211.43 2.35 215.58 1.32
35 213.54 1.99 216.59 1.23
40 215.54 1.65 217.54 1.15
45 217.47 1.32 218.47 1.07
48 218.62 1.13 219.02 1.03
50 219.38 1.00 219.38 1.00
52 220.14 0.87 219.74 0.97
55 221.28 0.67 220.29 0.92
60 223.22 0.35 221.21 0.84
65 225.22 0.01 222.17 0.76
70 227.33 -0.35 223.18 0.68
75 229.60 -0.74 224.26 0.59
80 232.13 -1.17 225.48 0.48
85 235.09 -1.67 226.89 0.37
90 238.80 -2.30 228.66 0.22
Start RIT Student Growth RIT School Growth
%ile Fall Winter Spring N Fall Fall Winter Spring N Fall
SD 5.50 7.58 7.15 SD 1.24 2.18 2.02
10 200.25 3.01 4.29 1.56 209.75 1.42 2.11 0.80
20 206.47 2.44 3.50 1.43 212.71 1.39 2.08 0.93
... continued on next page
172

Language Usage Grade 9 Conditional Growth Distributions , continued
Start RIT Student Growth RIT School Growth
%ile Winter Spring N Fall Winter Spring N Fall
25 208.83 2.22 3.20 1.38 213.83 1.39 2.06 0.98
30 210.96 2.03 2.94 1.33 214.84 1.38 2.05 1.02
35 212.92 1.85 2.69 1.29 215.78 1.37 2.04 1.06
40 214.79 1.68 2.45 1.25 216.67 1.37 2.02 1.10
45 216.60 1.52 2.23 1.22 217.53 1.36 2.01 1.14
48 217.66 1.42 2.09 1.19 218.04 1.36 2.01 1.16
50 218.37 1.35 2.00 1.18 218.37 1.35 2.00 1.18
52 219.08 1.29 1.91 1.16 218.71 1.35 2.00 1.19
55 220.15 1.19 1.78 1.14 219.22 1.35 1.99 1.22
60 221.96 1.03 1.55 1.10 220.08 1.34 1.98 1.25
65 223.82 0.86 1.32 1.07 220.97 1.33 1.97 1.29
70 225.79 0.68 1.07 1.02 221.90 1.33 1.96 1.34
75 227.91 0.48 0.80 0.98 222.91 1.32 1.95 1.38
80 230.28 0.27 0.50 0.93 224.04 1.31 1.93 1.43
85 233.03 0.02 0.16 0.87 225.35 1.30 1.91 1.49
90 236.50 -0.30 -0.28 0.80 227.00 1.29 1.89 1.56
Start RIT Student Growth RIT School Growth
%ile Winter Winter Spring N Fall Winter Winter Spring N Fall
SD 5.07 SD 0.93
10 201.81 1.15 211.02 0.48
20 207.96 0.98 214.01 0.54
25 210.30 0.92 215.14 0.56
30 212.40 0.86 216.16 0.58
35 214.34 0.80 217.11 0.60
40 216.19 0.75 218.01 0.62
45 217.97 0.70 218.87 0.63
48 219.03 0.67 219.39 0.64
50 219.73 0.65 219.73 0.65
52 220.43 0.63 220.07 0.66
55 221.48 0.60 220.58 0.67
60 223.27 0.55 221.45 0.68
65 225.11 0.50 222.35 0.70
70 227.06 0.44 223.29 0.72
75 229.16 0.38 224.31 0.74
80 231.49 0.32 225.45 0.76
85 234.22 0.24 226.77 0.79
90 237.65 0.14 228.44 0.82
173

Table D.3.9: Language Usage Grade 10 Conditional Growth Distributions
Start RIT Student Growth RIT School Growth
%ile Last Winter Winter Spring N Fall Last Winter Winter Spring N Fall
SD 6.49 SD 1.90
10 198.85 3.56 208.61 2.06
20 205.47 2.88 211.89 1.89
25 207.99 2.62 213.13 1.83
30 210.25 2.38 214.25 1.77
35 212.35 2.17 215.28 1.72
40 214.34 1.96 216.27 1.67
45 216.26 1.76 217.22 1.62
48 217.40 1.65 217.78 1.59
50 218.15 1.57 218.15 1.57
52 218.91 1.49 218.53 1.55
55 220.05 1.37 219.09 1.52
60 221.97 1.18 220.04 1.47
65 223.96 0.97 221.02 1.42
70 226.05 0.76 222.06 1.37
75 228.31 0.52 223.17 1.31
80 230.83 0.26 224.42 1.25
85 233.77 -0.04 225.87 1.18
90 237.46 -0.42 227.69 1.08
Start RIT Student Growth RIT School Growth
%ile Last Spring Winter Spring N Fall Last Spring Winter Spring N Fall
SD 8.17 SD 2.47
10 198.24 4.66 208.86 2.18
20 205.28 3.55 212.25 1.92
25 207.95 3.12 213.54 1.82
30 210.35 2.74 214.69 1.73
35 212.57 2.39 215.76 1.65
40 214.68 2.06 216.78 1.57
45 216.72 1.74 217.76 1.49
48 217.93 1.54 218.34 1.45
50 218.73 1.42 218.73 1.42
52 219.53 1.29 219.11 1.39
55 220.74 1.10 219.70 1.34
60 222.78 0.78 220.68 1.27
65 224.89 0.44 221.69 1.19
70 227.11 0.09 222.76 1.11
75 229.51 -0.29 223.92 1.02
80 232.18 -0.71 225.21 0.92
85 235.30 -1.21 226.71 0.80
90 239.21 -1.83 228.59 0.66
Start RIT Student Growth RIT School Growth
%ile Fall Winter Spring N Fall Fall Winter Spring N Fall
SD 5.90 8.43 7.41 SD 1.44 2.51 1.88
10 199.66 2.40 3.46 0.75 209.59 0.94 1.47 1.02
20 206.27 1.85 2.69 0.86 212.80 0.89 1.38 1.04
... continued on next page
174
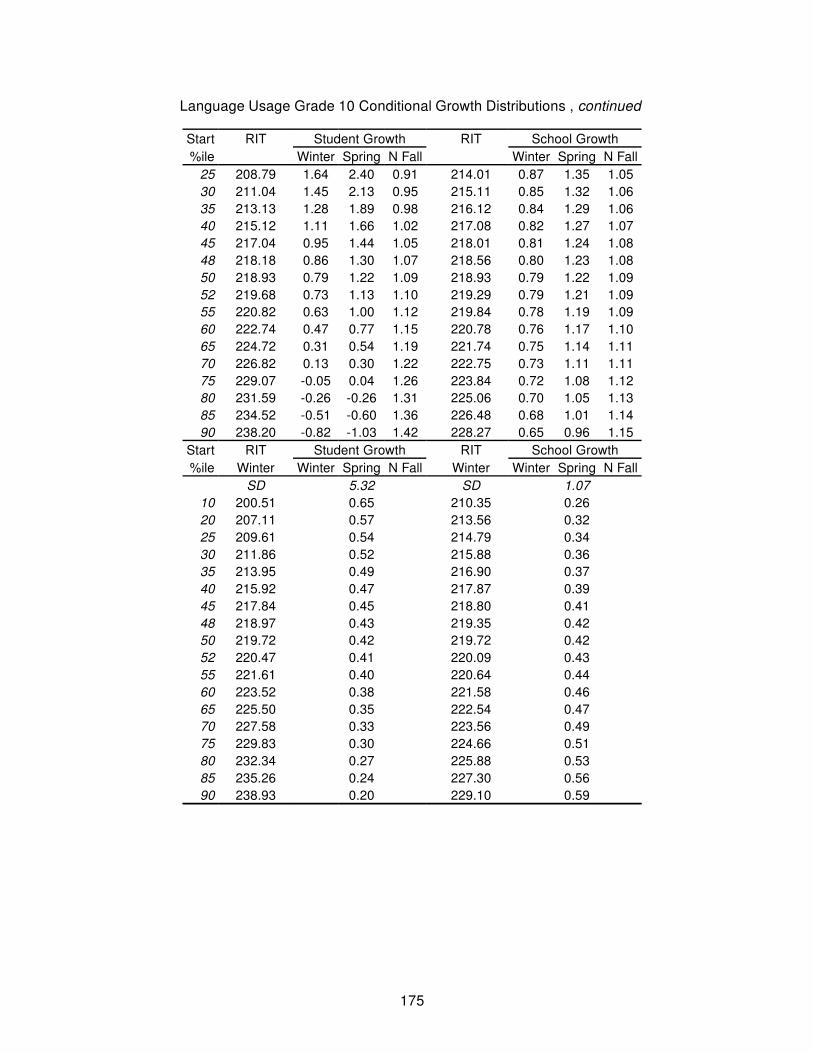
Language Usage Grade 10 Conditional Growth Distributions , continued
Start RIT Student Growth RIT School Growth
%ile Winter Spring N Fall Winter Spring N Fall
25 208.79 1.64 2.40 0.91 214.01 0.87 1.35 1.05
30 211.04 1.45 2.13 0.95 215.11 0.85 1.32 1.06
35 213.13 1.28 1.89 0.98 216.12 0.84 1.29 1.06
40 215.12 1.11 1.66 1.02 217.08 0.82 1.27 1.07
45 217.04 0.95 1.44 1.05 218.01 0.81 1.24 1.08
48 218.18 0.86 1.30 1.07 218.56 0.80 1.23 1.08
50 218.93 0.79 1.22 1.09 218.93 0.79 1.22 1.09
52 219.68 0.73 1.13 1.10 219.29 0.79 1.21 1.09
55 220.82 0.63 1.00 1.12 219.84 0.78 1.19 1.09
60 222.74 0.47 0.77 1.15 220.78 0.76 1.17 1.10
65 224.72 0.31 0.54 1.19 221.74 0.75 1.14 1.11
70 226.82 0.13 0.30 1.22 222.75 0.73 1.11 1.11
75 229.07 -0.05 0.04 1.26 223.84 0.72 1.08 1.12
80 231.59 -0.26 -0.26 1.31 225.06 0.70 1.05 1.13
85 234.52 -0.51 -0.60 1.36 226.48 0.68 1.01 1.14
90 238.20 -0.82 -1.03 1.42 228.27 0.65 0.96 1.15
Start RIT Student Growth RIT School Growth
%ile Winter Winter Spring N Fall Winter Winter Spring N Fall
SD 5.32 SD 1.07
10 200.51 0.65 210.35 0.26
20 207.11 0.57 213.56 0.32
25 209.61 0.54 214.79 0.34
30 211.86 0.52 215.88 0.36
35 213.95 0.49 216.90 0.37
40 215.92 0.47 217.87 0.39
45 217.84 0.45 218.80 0.41
48 218.97 0.43 219.35 0.42
50 219.72 0.42 219.72 0.42
52 220.47 0.41 220.09 0.43
55 221.61 0.40 220.64 0.44
60 223.52 0.38 221.58 0.46
65 225.50 0.35 222.54 0.47
70 227.58 0.33 223.56 0.49
75 229.83 0.30 224.66 0.51
80 232.34 0.27 225.88 0.53
85 235.26 0.24 227.30 0.56
90 238.93 0.20 229.10 0.59
175

Appendix D.4 - General Science
Table D.4.1: General Science Grade 3 Conditional Growth Distributions
Start RIT Student Growth RIT School Growth
%ile Last Winter Winter Spring N Fall Last Winter Winter Spring N Fall
SD 5.94 SD 1.75
10 168.56 12.25 177.27 8.88
20 173.98 10.86 179.71 8.65
25 176.04 10.33 180.63 8.56
30 177.89 9.86 181.46 8.48
35 179.61 9.42 182.23 8.40
40 181.24 9.00 182.96 8.33
45 182.81 8.59 183.66 8.26
48 183.74 8.36 184.08 8.22
50 184.36 8.20 184.36 8.20
52 184.98 8.04 184.64 8.17
55 185.91 7.80 185.05 8.13
60 187.48 7.40 185.76 8.06
65 189.11 6.98 186.49 7.99
70 190.83 6.54 187.26 7.92
75 192.68 6.06 188.09 7.84
80 194.74 5.53 189.01 7.75
85 197.14 4.92 190.09 7.64
90 200.16 4.14 191.45 7.51
Start RIT Student Growth RIT School Growth
%ile Last Spring Winter Spring N Fall Last Spring Winter Spring N Fall
SD 6.32 SD 2.15
10 171.32 12.56 180.54 8.58
20 177.06 10.78 183.12 8.16
25 179.25 10.10 184.10 8.01
30 181.21 9.50 184.98 7.87
35 183.02 8.93 185.80 7.74
40 184.75 8.40 186.57 7.61
45 186.42 7.88 187.32 7.49
48 187.40 7.58 187.76 7.42
50 188.06 7.38 188.06 7.38
52 188.71 7.17 188.35 7.33
55 189.70 6.87 188.79 7.26
60 191.37 6.35 189.54 7.14
65 193.09 5.82 190.32 7.02
70 194.91 5.26 191.13 6.88
75 196.87 4.65 192.01 6.74
80 199.05 3.97 192.99 6.59
85 201.60 3.19 194.13 6.41
90 204.80 2.19 195.57 6.18
Start RIT Student Growth RIT School Growth
%ile Fall Winter Spring N Fall Fall Winter Spring N Fall
SD 5.78 7.25 7.30 SD 1.20 2.10 1.95
... continued on next page
176

General Science Grade 3 Conditional Growth Distributions , continued
Start RIT Student Growth RIT School Growth
%ile Winter Spring N Fall Winter Spring N Fall
10 172.43 8.24 12.37 11.89 180.50 5.44 8.59 8.45
20 177.60 7.16 10.86 10.64 182.90 5.32 8.38 8.38
25 179.56 6.75 10.28 10.17 183.81 5.27 8.29 8.36
30 181.32 6.38 9.77 9.74 184.62 5.23 8.22 8.33
35 182.95 6.03 9.29 9.34 185.38 5.19 8.15 8.31
40 184.50 5.71 8.83 8.97 186.10 5.15 8.08 8.29
45 186.00 5.39 8.39 8.61 186.79 5.12 8.02 8.27
48 186.89 5.21 8.13 8.39 187.20 5.10 7.98 8.26
50 187.47 5.08 7.96 8.25 187.47 5.08 7.96 8.25
52 188.06 4.96 7.79 8.11 187.75 5.07 7.93 8.24
55 188.95 4.77 7.53 7.89 188.16 5.05 7.90 8.23
60 190.45 4.46 7.09 7.53 188.85 5.01 7.83 8.21
65 192.00 4.13 6.63 7.16 189.57 4.97 7.77 8.19
70 193.63 3.79 6.15 6.76 190.33 4.93 7.70 8.17
75 195.39 3.42 5.64 6.34 191.14 4.89 7.62 8.14
80 197.35 3.00 5.06 5.86 192.05 4.84 7.54 8.12
85 199.64 2.52 4.39 5.31 193.11 4.79 7.45 8.09
90 202.52 1.92 3.55 4.61 194.45 4.72 7.32 8.05
Start RIT Student Growth RIT School Growth
%ile Winter Winter Spring N Fall Winter Winter Spring N Fall
SD 5.66 SD 0.93
10 178.56 4.76 185.77 2.88
20 183.36 4.12 188.10 2.88
25 185.19 3.87 188.98 2.88
30 186.83 3.65 189.78 2.88
35 188.35 3.44 190.52 2.88
40 189.79 3.25 191.21 2.88
45 191.18 3.06 191.89 2.88
48 192.01 2.95 192.29 2.88
50 192.56 2.88 192.56 2.88
52 193.10 2.80 192.82 2.88
55 193.93 2.69 193.22 2.88
60 195.32 2.50 193.90 2.88
65 196.76 2.31 194.60 2.88
70 198.28 2.11 195.33 2.88
75 199.92 1.88 196.13 2.88
80 201.75 1.64 197.01 2.88
85 203.88 1.35 198.04 2.88
90 206.55 0.99 199.34 2.87
177

Table D.4.2: General Science Grade 4 Conditional Growth Distributions
Start RIT Student Growth RIT School Growth
%ile Last Winter Winter Spring N Fall Last Winter Winter Spring N Fall
SD 5.89 SD 1.65
10 177.92 9.29 185.78 6.69
20 182.88 8.28 188.04 6.57
25 184.77 7.89 188.91 6.53
30 186.46 7.55 189.68 6.49
35 188.03 7.23 190.40 6.45
40 189.52 6.93 191.08 6.42
45 190.96 6.64 191.73 6.38
48 191.81 6.46 192.12 6.36
50 192.38 6.35 192.38 6.35
52 192.95 6.23 192.64 6.34
55 193.80 6.06 193.03 6.32
60 195.24 5.77 193.69 6.28
65 196.73 5.47 194.37 6.25
70 198.30 5.15 195.08 6.21
75 199.99 4.80 195.86 6.17
80 201.88 4.42 196.72 6.13
85 204.08 3.97 197.72 6.07
90 206.84 3.41 198.98 6.01
Start RIT Student Growth RIT School Growth
%ile Last Spring Winter Spring N Fall Last Spring Winter Spring N Fall
SD 6.26 SD 2.12
10 180.17 9.36 188.20 6.53
20 185.30 8.16 190.57 6.30
25 187.25 7.71 191.47 6.22
30 189.00 7.30 192.28 6.15
35 190.62 6.93 193.03 6.08
40 192.16 6.57 193.75 6.01
45 193.65 6.22 194.43 5.95
48 194.53 6.02 194.84 5.91
50 195.11 5.88 195.11 5.88
52 195.70 5.75 195.38 5.86
55 196.58 5.54 195.79 5.82
60 198.07 5.20 196.48 5.76
65 199.60 4.84 197.19 5.69
70 201.23 4.46 197.94 5.62
75 202.98 4.06 198.75 5.55
80 204.92 3.60 199.65 5.46
85 207.19 3.08 200.70 5.36
90 210.05 2.41 202.03 5.24
Start RIT Student Growth RIT School Growth
%ile Fall Winter Spring N Fall Fall Winter Spring N Fall
SD 5.60 6.73 6.63 SD 1.07 1.86 1.61
10 180.28 6.69 9.68 9.01 188.03 4.23 6.56 6.89
20 185.19 5.82 8.56 8.29 190.28 4.20 6.51 6.90
... continued on next page
178

General Science Grade 4 Conditional Growth Distributions , continued
Start RIT Student Growth RIT School Growth
%ile Winter Spring N Fall Winter Spring N Fall
25 187.06 5.48 8.13 8.02 191.14 4.19 6.49 6.90
30 188.73 5.19 7.75 7.78 191.90 4.18 6.47 6.91
35 190.28 4.91 7.40 7.55 192.61 4.17 6.46 6.91
40 191.76 4.65 7.06 7.33 193.29 4.16 6.44 6.91
45 193.18 4.39 6.73 7.12 193.94 4.15 6.43 6.92
48 194.02 4.25 6.54 7.00 194.33 4.15 6.42 6.92
50 194.58 4.15 6.41 6.92 194.58 4.15 6.41 6.92
52 195.14 4.05 6.28 6.84 194.84 4.14 6.41 6.92
55 195.99 3.90 6.09 6.71 195.23 4.14 6.40 6.92
60 197.41 3.64 5.77 6.51 195.88 4.13 6.38 6.93
65 198.88 3.38 5.43 6.29 196.55 4.12 6.37 6.93
70 200.43 3.10 5.07 6.06 197.26 4.11 6.35 6.93
75 202.11 2.81 4.69 5.82 198.03 4.10 6.34 6.94
80 203.97 2.48 4.26 5.55 198.89 4.09 6.32 6.94
85 206.15 2.09 3.77 5.23 199.88 4.08 6.29 6.95
90 208.88 1.60 3.14 4.83 201.13 4.06 6.27 6.95
Start RIT Student Growth RIT School Growth
%ile Winter Winter Spring N Fall Winter Winter Spring N Fall
SD 5.49 SD 0.79
10 184.95 3.94 192.12 2.12
20 189.68 3.37 194.39 2.17
25 191.48 3.15 195.25 2.19
30 193.09 2.95 196.02 2.21
35 194.59 2.77 196.74 2.22
40 196.01 2.60 197.42 2.24
45 197.38 2.43 198.08 2.25
48 198.19 2.33 198.47 2.26
50 198.73 2.27 198.73 2.27
52 199.27 2.20 198.99 2.27
55 200.08 2.10 199.38 2.28
60 201.45 1.94 200.04 2.30
65 202.87 1.76 200.72 2.31
70 204.37 1.58 201.43 2.33
75 205.98 1.38 202.21 2.35
80 207.78 1.17 203.07 2.37
85 209.87 0.91 204.07 2.39
90 212.50 0.59 205.34 2.42
179

Table D.4.3: General Science Grade 5 Conditional Growth Distributions
Start RIT Student Growth RIT School Growth
%ile Last Winter Winter Spring N Fall Last Winter Winter Spring N Fall
SD 6.06 SD 1.39
10 184.11 8.11 191.87 5.47
20 189.00 7.16 194.09 5.43
25 190.85 6.80 194.94 5.41
30 192.52 6.47 195.69 5.40
35 194.06 6.17 196.40 5.38
40 195.53 5.89 197.06 5.37
45 196.95 5.61 197.71 5.36
48 197.78 5.45 198.09 5.35
50 198.34 5.34 198.34 5.34
52 198.90 5.24 198.59 5.34
55 199.74 5.07 198.98 5.33
60 201.15 4.80 199.62 5.32
65 202.62 4.51 200.29 5.31
70 204.16 4.21 200.99 5.29
75 205.83 3.89 201.75 5.28
80 207.69 3.53 202.59 5.26
85 209.85 3.11 203.57 5.24
90 212.57 2.58 204.81 5.22
Start RIT Student Growth RIT School Growth
%ile Last Spring Winter Spring N Fall Last Spring Winter Spring N Fall
SD 6.45 SD 1.87
10 186.02 8.16 194.05 5.30
20 191.12 7.02 196.39 5.14
25 193.06 6.59 197.28 5.08
30 194.80 6.20 198.08 5.03
35 196.41 5.84 198.82 4.98
40 197.94 5.50 199.53 4.94
45 199.42 5.17 200.21 4.89
48 200.29 4.98 200.61 4.87
50 200.88 4.85 200.88 4.85
52 201.46 4.72 201.14 4.83
55 202.33 4.52 201.55 4.80
60 203.81 4.19 202.23 4.76
65 205.34 3.85 202.93 4.71
70 206.95 3.49 203.67 4.66
75 208.69 3.10 204.47 4.61
80 210.63 2.67 205.36 4.55
85 212.89 2.17 206.40 4.48
90 215.73 1.53 207.71 4.40
Start RIT Student Growth RIT School Growth
%ile Fall Winter Spring N Fall Fall Winter Spring N Fall
SD 5.63 6.76 6.76 SD 1.07 1.87 1.48
10 186.06 5.81 8.42 6.68 193.70 3.54 5.64 4.96
20 190.93 5.00 7.41 6.17 195.94 3.51 5.59 5.04
... continued on next page
180

General Science Grade 5 Conditional Growth Distributions , continued
Start RIT Student Growth RIT School Growth
%ile Winter Spring N Fall Winter Spring N Fall
25 192.77 4.69 7.03 5.98 196.79 3.50 5.57 5.08
30 194.43 4.42 6.69 5.81 197.56 3.49 5.55 5.10
35 195.97 4.16 6.37 5.65 198.27 3.48 5.54 5.13
40 197.43 3.92 6.07 5.50 198.94 3.47 5.52 5.16
45 198.84 3.68 5.78 5.35 199.59 3.46 5.51 5.18
48 199.68 3.55 5.61 5.26 199.98 3.46 5.50 5.20
50 200.23 3.45 5.49 5.21 200.23 3.45 5.49 5.21
52 200.79 3.36 5.38 5.15 200.49 3.45 5.49 5.22
55 201.62 3.22 5.20 5.06 200.87 3.44 5.48 5.23
60 203.03 2.99 4.91 4.92 201.52 3.44 5.46 5.26
65 204.49 2.75 4.61 4.77 202.20 3.43 5.45 5.28
70 206.03 2.49 4.29 4.61 202.90 3.42 5.43 5.31
75 207.69 2.21 3.95 4.43 203.67 3.41 5.41 5.34
80 209.54 1.91 3.57 4.24 204.52 3.40 5.39 5.37
85 211.69 1.55 3.12 4.02 205.51 3.38 5.37 5.41
90 214.40 1.10 2.56 3.74 206.76 3.37 5.34 5.46
Start RIT Student Growth RIT School Growth
%ile Winter Winter Spring N Fall Winter Winter Spring N Fall
SD 5.50 SD 0.80
10 189.84 3.57 197.10 1.89
20 194.59 3.04 199.36 1.94
25 196.40 2.84 200.22 1.96
30 198.02 2.66 200.99 1.98
35 199.52 2.50 201.70 1.99
40 200.95 2.34 202.38 2.01
45 202.33 2.19 203.04 2.02
48 203.14 2.10 203.43 2.03
50 203.69 2.04 203.69 2.04
52 204.23 1.98 203.94 2.04
55 205.04 1.89 204.33 2.05
60 206.42 1.74 204.99 2.07
65 207.85 1.58 205.67 2.08
70 209.35 1.41 206.38 2.10
75 210.97 1.23 207.15 2.12
80 212.78 1.03 208.01 2.14
85 214.88 0.80 209.01 2.16
90 217.53 0.51 210.27 2.19
181
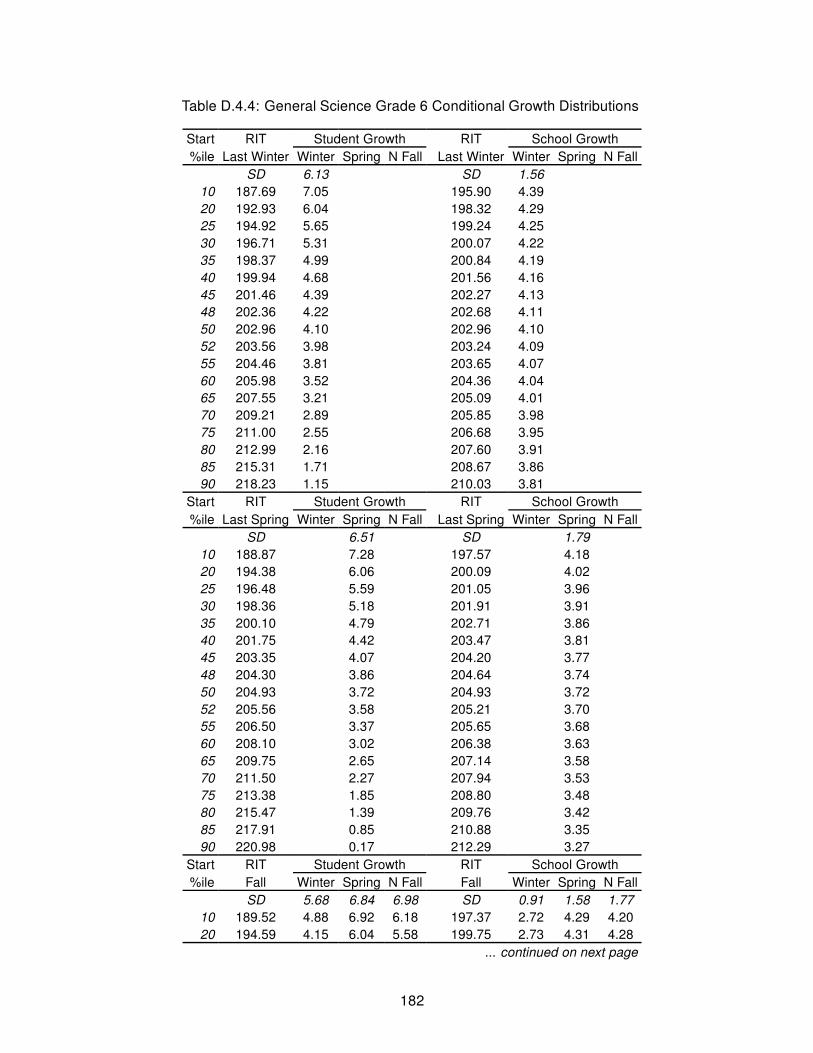
Table D.4.4: General Science Grade 6 Conditional Growth Distributions
Start RIT Student Growth RIT School Growth
%ile Last Winter Winter Spring N Fall Last Winter Winter Spring N Fall
SD 6.13 SD 1.56
10 187.69 7.05 195.90 4.39
20 192.93 6.04 198.32 4.29
25 194.92 5.65 199.24 4.25
30 196.71 5.31 200.07 4.22
35 198.37 4.99 200.84 4.19
40 199.94 4.68 201.56 4.16
45 201.46 4.39 202.27 4.13
48 202.36 4.22 202.68 4.11
50 202.96 4.10 202.96 4.10
52 203.56 3.98 203.24 4.09
55 204.46 3.81 203.65 4.07
60 205.98 3.52 204.36 4.04
65 207.55 3.21 205.09 4.01
70 209.21 2.89 205.85 3.98
75 211.00 2.55 206.68 3.95
80 212.99 2.16 207.60 3.91
85 215.31 1.71 208.67 3.86
90 218.23 1.15 210.03 3.81
Start RIT Student Growth RIT School Growth
%ile Last Spring Winter Spring N Fall Last Spring Winter Spring N Fall
SD 6.51 SD 1.79
10 188.87 7.28 197.57 4.18
20 194.38 6.06 200.09 4.02
25 196.48 5.59 201.05 3.96
30 198.36 5.18 201.91 3.91
35 200.10 4.79 202.71 3.86
40 201.75 4.42 203.47 3.81
45 203.35 4.07 204.20 3.77
48 204.30 3.86 204.64 3.74
50 204.93 3.72 204.93 3.72
52 205.56 3.58 205.21 3.70
55 206.50 3.37 205.65 3.68
60 208.10 3.02 206.38 3.63
65 209.75 2.65 207.14 3.58
70 211.50 2.27 207.94 3.53
75 213.38 1.85 208.80 3.48
80 215.47 1.39 209.76 3.42
85 217.91 0.85 210.88 3.35
90 220.98 0.17 212.29 3.27
Start RIT Student Growth RIT School Growth
%ile Fall Winter Spring N Fall Fall Winter Spring N Fall
SD 5.68 6.84 6.98 SD 0.91 1.58 1.77
10 189.52 4.88 6.92 6.18 197.37 2.72 4.29 4.20
20 194.59 4.15 6.04 5.58 199.75 2.73 4.31 4.28
... continued on next page
182

General Science Grade 6 Conditional Growth Distributions , continued
Start RIT Student Growth RIT School Growth
%ile Winter Spring N Fall Winter Spring N Fall
25 196.52 3.87 5.70 5.35 200.66 2.74 4.31 4.31
30 198.26 3.62 5.40 5.14 201.47 2.74 4.32 4.33
35 199.86 3.39 5.12 4.95 202.22 2.74 4.32 4.36
40 201.38 3.17 4.85 4.77 202.94 2.75 4.33 4.38
45 202.86 2.96 4.59 4.60 203.63 2.75 4.33 4.40
48 203.73 2.83 4.44 4.49 204.04 2.75 4.34 4.42
50 204.31 2.75 4.34 4.43 204.31 2.75 4.34 4.43
52 204.89 2.67 4.24 4.36 204.58 2.75 4.34 4.43
55 205.76 2.54 4.09 4.25 204.99 2.75 4.34 4.45
60 207.23 2.33 3.83 4.08 205.68 2.76 4.35 4.47
65 208.76 2.11 3.56 3.90 206.40 2.76 4.35 4.49
70 210.36 1.88 3.28 3.71 207.15 2.76 4.36 4.52
75 212.09 1.63 2.98 3.50 207.96 2.77 4.36 4.54
80 214.02 1.35 2.64 3.27 208.87 2.77 4.37 4.57
85 216.27 1.03 2.25 3.00 209.92 2.77 4.38 4.61
90 219.10 0.62 1.75 2.67 211.25 2.78 4.39 4.65
Start RIT Student Growth RIT School Growth
%ile Winter Winter Spring N Fall Winter Winter Spring N Fall
SD 5.53 SD 0.67
10 192.45 2.94 200.00 1.42
20 197.47 2.48 202.42 1.48
25 199.37 2.30 203.34 1.50
30 201.08 2.14 204.17 1.52
35 202.67 1.99 204.94 1.54
40 204.17 1.85 205.66 1.56
45 205.63 1.72 206.37 1.57
48 206.49 1.64 206.78 1.58
50 207.06 1.59 207.06 1.59
52 207.63 1.53 207.34 1.59
55 208.49 1.45 207.75 1.60
60 209.95 1.32 208.46 1.62
65 211.45 1.18 209.18 1.64
70 213.04 1.03 209.95 1.65
75 214.75 0.88 210.78 1.67
80 216.65 0.70 211.70 1.69
85 218.88 0.49 212.77 1.72
90 221.67 0.23 214.12 1.75
183

Table D.4.5: General Science Grade 7 Conditional Growth Distributions
Start RIT Student Growth RIT School Growth
%ile Last Winter Winter Spring N Fall Last Winter Winter Spring N Fall
SD 5.97 SD 1.38
10 190.57 5.76 199.12 3.62
20 195.88 4.96 201.50 3.55
25 197.90 4.65 202.40 3.53
30 199.72 4.38 203.21 3.50
35 201.40 4.12 203.97 3.48
40 202.99 3.88 204.68 3.46
45 204.53 3.65 205.37 3.44
48 205.45 3.51 205.78 3.43
50 206.05 3.42 206.05 3.42
52 206.66 3.33 206.32 3.41
55 207.57 3.19 206.73 3.40
60 209.11 2.96 207.42 3.38
65 210.71 2.71 208.14 3.36
70 212.39 2.46 208.89 3.34
75 214.20 2.19 209.70 3.31
80 216.22 1.88 210.61 3.28
85 218.58 1.52 211.66 3.25
90 221.54 1.08 212.99 3.21
Start RIT Student Growth RIT School Growth
%ile Last Spring Winter Spring N Fall Last Spring Winter Spring N Fall
SD 6.44 SD 1.66
10 191.44 6.09 200.57 3.44
20 197.01 5.10 203.01 3.35
25 199.12 4.72 203.93 3.32
30 201.02 4.38 204.76 3.29
35 202.78 4.07 205.53 3.27
40 204.45 3.77 206.26 3.24
45 206.07 3.48 206.97 3.22
48 207.03 3.31 207.38 3.21
50 207.66 3.20 207.66 3.20
52 208.30 3.08 207.94 3.19
55 209.25 2.91 208.36 3.17
60 210.87 2.62 209.06 3.15
65 212.54 2.33 209.79 3.13
70 214.30 2.01 210.56 3.10
75 216.20 1.67 211.39 3.07
80 218.32 1.30 212.32 3.04
85 220.78 0.86 213.39 3.00
90 223.88 0.30 214.75 2.96
Start RIT Student Growth RIT School Growth
%ile Fall Winter Spring N Fall Fall Winter Spring N Fall
SD 5.71 6.87 6.62 SD 0.79 1.38 1.48
10 191.90 4.24 5.99 5.88 200.39 2.20 3.52 4.38
20 197.14 3.57 5.19 5.37 202.72 2.23 3.57 4.38
... continued on next page
184

General Science Grade 7 Conditional Growth Distributions , continued
Start RIT Student Growth RIT School Growth
%ile Winter Spring N Fall Winter Spring N Fall
25 199.14 3.32 4.89 5.17 203.61 2.24 3.59 4.38
30 200.93 3.09 4.62 5.00 204.40 2.25 3.61 4.38
35 202.59 2.88 4.37 4.83 205.14 2.26 3.63 4.38
40 204.16 2.68 4.13 4.68 205.84 2.27 3.65 4.38
45 205.68 2.48 3.90 4.53 206.51 2.28 3.66 4.38
48 206.58 2.37 3.77 4.44 206.91 2.29 3.67 4.38
50 207.18 2.29 3.68 4.38 207.18 2.29 3.68 4.38
52 207.78 2.21 3.59 4.32 207.45 2.29 3.68 4.38
55 208.68 2.10 3.45 4.23 207.85 2.30 3.69 4.38
60 210.20 1.90 3.22 4.08 208.52 2.31 3.71 4.38
65 211.78 1.70 2.98 3.93 209.22 2.32 3.72 4.38
70 213.43 1.49 2.73 3.77 209.96 2.33 3.74 4.38
75 215.22 1.26 2.46 3.59 210.76 2.34 3.76 4.38
80 217.22 1.01 2.16 3.39 211.64 2.35 3.78 4.38
85 219.54 0.71 1.81 3.16 212.67 2.36 3.80 4.38
90 222.46 0.34 1.37 2.88 213.97 2.38 3.83 4.38
Start RIT Student Growth RIT School Growth
%ile Winter Winter Spring N Fall Winter Winter Spring N Fall
SD 5.54 SD 0.58
10 194.26 2.62 202.51 1.21
20 199.48 2.20 204.90 1.27
25 201.47 2.03 205.81 1.29
30 203.25 1.89 206.62 1.31
35 204.90 1.76 207.38 1.33
40 206.46 1.63 208.10 1.35
45 207.98 1.51 208.79 1.37
48 208.88 1.44 209.20 1.38
50 209.47 1.39 209.47 1.39
52 210.07 1.34 209.74 1.39
55 210.96 1.27 210.15 1.40
60 212.48 1.14 210.85 1.42
65 214.04 1.02 211.56 1.44
70 215.69 0.88 212.32 1.46
75 217.47 0.74 213.13 1.48
80 219.46 0.58 214.04 1.50
85 221.77 0.39 215.10 1.53
90 224.68 0.16 216.43 1.56
185

Table D.4.6: General Science Grade 8 Conditional Growth Distributions
Start RIT Student Growth RIT School Growth
%ile Last Winter Winter Spring N Fall Last Winter Winter Spring N Fall
SD 6.47 SD 1.41
10 193.30 5.74 201.69 3.38
20 198.66 4.93 204.17 3.38
25 200.69 4.63 205.11 3.38
30 202.52 4.35 205.95 3.38
35 204.21 4.09 206.73 3.38
40 205.82 3.85 207.47 3.38
45 207.37 3.62 208.19 3.38
48 208.29 3.48 208.62 3.39
50 208.90 3.39 208.90 3.39
52 209.51 3.29 209.18 3.39
55 210.43 3.15 209.61 3.39
60 211.98 2.92 210.32 3.39
65 213.59 2.68 211.07 3.39
70 215.28 2.42 211.85 3.39
75 217.11 2.14 212.69 3.39
80 219.14 1.84 213.63 3.39
85 221.51 1.48 214.73 3.39
90 224.49 1.03 216.11 3.39
Start RIT Student Growth RIT School Growth
%ile Last Spring Winter Spring N Fall Last Spring Winter Spring N Fall
SD 7.16 SD 1.83
10 194.16 6.02 203.13 3.18
20 199.73 5.03 205.62 3.17
25 201.85 4.66 206.57 3.16
30 203.75 4.32 207.42 3.16
35 205.51 4.01 208.21 3.15
40 207.18 3.71 208.95 3.15
45 208.80 3.42 209.67 3.14
48 209.75 3.25 210.10 3.14
50 210.39 3.14 210.39 3.14
52 211.02 3.03 210.67 3.14
55 211.98 2.86 211.10 3.14
60 213.59 2.57 211.82 3.13
65 215.26 2.27 212.57 3.13
70 217.02 1.96 213.35 3.12
75 218.92 1.62 214.20 3.12
80 221.04 1.24 215.15 3.11
85 223.51 0.81 216.25 3.11
90 226.61 0.25 217.64 3.10
Start RIT Student Growth RIT School Growth
%ile Fall Winter Spring N Fall Fall Winter Spring N Fall
SD 5.88 7.30 7.36 SD 0.98 1.72 1.49
10 194.55 4.05 5.76 3.91 202.87 2.08 3.39 3.08
20 199.95 3.35 4.90 3.72 205.42 2.05 3.34 3.18
... continued on next page
186

General Science Grade 8 Conditional Growth Distributions , continued
Start RIT Student Growth RIT School Growth
%ile Winter Spring N Fall Winter Spring N Fall
25 202.00 3.08 4.57 3.65 206.39 2.04 3.32 3.22
30 203.85 2.84 4.27 3.59 207.25 2.03 3.30 3.25
35 205.56 2.62 4.00 3.53 208.06 2.02 3.28 3.28
40 207.18 2.40 3.74 3.48 208.82 2.02 3.27 3.31
45 208.74 2.20 3.49 3.42 209.56 2.01 3.25 3.34
48 209.67 2.08 3.34 3.39 210.00 2.00 3.24 3.36
50 210.29 2.00 3.24 3.37 210.29 2.00 3.24 3.37
52 210.90 1.92 3.14 3.35 210.58 1.99 3.23 3.38
55 211.83 1.80 2.99 3.32 211.01 1.99 3.22 3.40
60 213.40 1.59 2.74 3.26 211.75 1.98 3.21 3.43
65 215.02 1.38 2.48 3.21 212.51 1.97 3.19 3.46
70 216.72 1.16 2.21 3.15 213.32 1.96 3.18 3.49
75 218.57 0.92 1.91 3.08 214.19 1.95 3.16 3.52
80 220.62 0.65 1.58 3.01 215.15 1.94 3.14 3.56
85 223.01 0.34 1.20 2.93 216.28 1.93 3.12 3.60
90 226.02 -0.06 0.72 2.83 217.70 1.91 3.09 3.66
Start RIT Student Growth RIT School Growth
%ile Winter Winter Spring N Fall Winter Winter Spring N Fall
SD 5.66 SD 0.74
10 196.67 2.39 204.85 1.15
20 202.03 1.99 207.40 1.18
25 204.07 1.84 208.37 1.19
30 205.89 1.71 209.24 1.20
35 207.59 1.59 210.05 1.21
40 209.20 1.47 210.81 1.22
45 210.75 1.35 211.56 1.23
48 211.67 1.29 211.99 1.24
50 212.28 1.24 212.28 1.24
52 212.90 1.20 212.58 1.24
55 213.82 1.13 213.01 1.25
60 215.37 1.01 213.75 1.26
65 216.98 0.90 214.52 1.27
70 218.67 0.77 215.33 1.28
75 220.50 0.64 216.20 1.29
80 222.54 0.49 217.17 1.30
85 224.91 0.31 218.30 1.32
90 227.90 0.09 219.72 1.34
187
Appendix E - Student and School Conditional Growth Percentiles
For each content area, this appendix provides a set of up to six tables for each grade level (K-10). Tables
numbered E.1._, E.2._, E.3._, and E.4._ correspond to mathematics, reading, language usage, and gen-
eral science, respectively. Each table in a content area-grade level set presents conditional term-to-term
growth percentiles for both students and schools. The term-to-term combinations that make up a grade
level set are: Last Winter to Winter; Last Spring to Spring; Fall to Next Fall; Fall to Spring; Fall to Winter;
and Winter to Spring, respectively. (Since there is no grade prior to kindergarten, only four tables are pro-
vided for grade K.) Appearing on the left side of each of these tables is a column of 18 percentile ranks.
For each percentile rank, there are two rows of values; the first is for student values, the second for school
values. To the right of each percentile rank are the starting RIT values associated it (one for students,
one for schools). To the right of each starting RIT are the mean growth and standard deviation associated
with it. Each of the nine right-most columns contain the amount of growth associated with the conditional
growth percentiles (CGP) and the conditional growth index values (CGI) shown at the top of the column.
There is a fixed statistical relationship between CGP and CGI; these values are constant across all tables.
Let’s assume that we want to determine the conditional growth percentile for a grade 2 student who grew
13 RITs in mathematics from fall to spring after obtaining a fall RIT score of 180. We would first find the
table with appropriate content area-grade combination (mathematics-grade 2) and the appropriate term-to-
term comparison (fall-to-spring). This is TableE.1.14. Since we are interested in a student’s performance,
we would find the RIT value from the starting RIT column for a student that is closest to 180. The closest
value is 180.25 in the 60th percentile row. To identify the CGP for observed growth of 13, we move across
on the same student row to find a value closest to 13. The closest value is 13.06, in the Conditional Growth
column labeled 40. Thus, 40 is the CGP for fall-to-spring growth of 13 for a grade 2 student starting out in
fall with a RIT of 180. The associated conditional growth index (CGI) is -.25.
As another example, assume we are interested in determining how much growth a school’s second
graders would have to make to attain a conditional growth percentile (CGP) of 60 in the spring when
they started the school year with a mean RIT score of 180. To determine this we would first find the ap-
propriate table - the one showing fall-to-spring mathematics growth for grade 2 students, which is, again,
TableE.1.14. We begin by finding the mean fall status for a school that is closest to 180 in the Start RIT
column. That value is 179.95 in the 70th percentile row block for status. We would move across the
School row until we intersected the column containing the 60th growth percentiles. The value in the cell,
15.84 (RITs) is the amount of growth associated with the conditional growth percentile of 60.
188

Appendix E.1 - Mathematics
Table E.1.1: Mathematics Grade K From Fall To N Fall Conditional Growth Percentile
Conditional Growth
Start Status Growth CGP 20 30 40 45 50 55 60 70 80
%ile RIT Mean SD CGI -0.84 -0.52 -0.25 -0.13 0.00 0.13 0.25 0.52 0.84
10 111.97 42.01 12.04 Student 31.88 35.70 38.96 40.50 42.01 43.53 45.06 48.33 52.15
116.60 43.49 5.82 School 38.59 40.44 42.01 42.76 43.49 44.22 44.96 46.54 48.38
20 120.38 37.00 12.04 Student 26.87 30.69 33.95 35.49 37.00 38.52 40.05 43.32 47.14
123.42 37.97 5.82 School 33.08 34.92 36.50 37.24 37.97 38.70 39.44 41.02 42.87
25 123.58 35.10 12.04 Student 24.96 28.78 32.05 33.59 35.10 36.61 38.15 41.41 45.23
126.01 35.88 5.82 School 30.98 32.83 34.40 35.14 35.88 36.61 37.35 38.93 40.77
30 126.44 33.39 12.04 Student 23.25 27.07 30.34 31.88 33.39 34.90 36.44 39.70 43.53
128.34 33.99 5.82 School 29.10 30.94 32.52 33.26 33.99 34.72 35.47 37.04 38.89
35 129.10 31.81 12.04 Student 21.67 25.49 28.75 30.29 31.81 33.32 34.86 38.12 41.94
130.49 32.25 5.82 School 27.35 29.20 30.78 31.52 32.25 32.98 33.72 35.30 37.14
40 131.62 30.30 12.04 Student 20.17 23.99 27.25 28.79 30.30 31.82 33.35 36.62 40.44
132.54 30.59 5.82 School 25.70 27.54 29.12 29.86 30.59 31.33 32.07 33.64 35.49
45 134.06 28.85 12.04 Student 18.71 22.53 25.80 27.34 28.85 30.36 31.90 35.16 38.98
134.52 28.99 5.82 School 24.10 25.94 27.52 28.26 28.99 29.72 30.47 32.04 33.89
48 135.51 27.99 12.04 Student 17.85 21.67 24.94 26.48 27.99 29.50 31.04 34.30 38.12
135.69 28.05 5.82 School 23.15 25.00 26.57 27.32 28.05 28.78 29.52 31.10 32.94
50 136.46 27.42 12.04 Student 17.28 21.10 24.37 25.90 27.42 28.93 30.47 33.73 37.55
136.46 27.42 5.82 School 22.52 24.37 25.94 26.69 27.42 28.15 28.89 30.47 32.31
52 137.42 26.85 12.04 Student 16.71 20.53 23.80 25.33 26.85 28.36 29.90 33.16 36.98
137.24 26.79 5.82 School 21.89 23.74 25.32 26.06 26.79 27.52 28.26 29.84 31.68
55 138.87 25.99 12.04 Student 15.85 19.67 22.94 24.47 25.99 27.50 29.04 32.30 36.12
138.41 25.84 5.82 School 20.95 22.79 24.37 25.11 25.84 26.57 27.32 28.89 30.74
60 141.31 24.53 12.04 Student 14.40 18.22 21.48 23.02 24.53 26.05 27.58 30.85 34.67
140.39 24.24 5.82 School 19.35 21.19 22.77 23.51 24.24 24.97 25.71 27.29 29.14
65 143.83 23.03 12.04 Student 12.89 16.71 19.98 21.52 23.03 24.54 26.08 29.34 33.17
142.44 22.59 5.82 School 17.69 19.54 21.11 21.86 22.59 23.32 24.06 25.64 27.48
70 146.49 21.45 12.04 Student 11.31 15.13 18.39 19.93 21.45 22.96 24.50 27.76 31.58
144.59 20.84 5.82 School 15.95 17.79 19.37 20.11 20.84 21.57 22.32 23.89 25.74
75 149.35 19.74 12.04 Student 9.60 13.42 16.69 18.22 19.74 21.25 22.79 26.05 29.87
146.92 18.96 5.82 School 14.07 15.91 17.49 18.23 18.96 19.69 20.43 22.01 23.85
80 152.55 17.83 12.04 Student 7.70 11.52 14.78 16.32 17.83 19.35 20.88 24.15 27.97
149.51 16.86 5.82 School 11.97 13.81 15.39 16.13 16.86 17.60 18.34 19.91 21.76
85 156.27 15.61 12.04 Student 5.48 9.30 12.56 14.10 15.61 17.13 18.67 21.93 25.75
152.53 14.42 5.82 School 9.53 11.37 12.95 13.69 14.42 15.15 15.90 17.47 19.32
90 160.96 12.82 12.04 Student 2.69 6.51 9.77 11.31 12.82 14.34 15.87 19.14 22.96
156.33 11.35 5.82 School 6.45 8.30 9.87 10.62 11.35 12.08 12.82 14.40 16.24
CGI - Conditional Growth Index CGP - Conditional Growth Percentile
189

Table E.1.2: Mathematics Grade K From Fall To Spring Conditional Growth Percentile
Conditional Growth
Start Status Growth CGP 20 30 40 45 50 55 60 70 80
%ile RIT Mean SD CGI -0.84 -0.52 -0.25 -0.13 0.00 0.13 0.25 0.52 0.84
10 111.97 34.95 10.84 Student 25.83 29.27 32.21 33.59 34.95 36.32 37.70 40.64 44.08
116.60 36.21 5.09 School 31.92 33.53 34.92 35.57 36.21 36.85 37.50 38.88 40.49
20 120.38 30.59 10.84 Student 21.47 24.90 27.84 29.23 30.59 31.95 33.33 36.27 39.71
123.42 31.41 5.09 School 27.12 28.74 30.12 30.77 31.41 32.05 32.70 34.08 35.70
25 123.58 28.93 10.84 Student 19.81 23.25 26.18 27.57 28.93 30.29 31.68 34.61 38.05
126.01 29.59 5.09 School 25.30 26.92 28.30 28.95 29.59 30.23 30.88 32.26 33.88
30 126.44 27.44 10.84 Student 18.32 21.76 24.69 26.08 27.44 28.80 30.19 33.12 36.56
128.34 27.95 5.09 School 23.66 25.28 26.66 27.31 27.95 28.59 29.24 30.62 32.24
35 129.10 26.06 10.84 Student 16.94 20.38 23.31 24.70 26.06 27.42 28.81 31.74 35.18
130.49 26.44 5.09 School 22.15 23.76 25.14 25.80 26.44 27.08 27.73 29.11 30.72
40 131.62 24.75 10.84 Student 15.63 19.07 22.00 23.39 24.75 26.11 27.50 30.43 33.87
132.54 25.00 5.09 School 20.71 22.33 23.71 24.36 25.00 25.64 26.29 27.67 29.28
45 134.06 23.48 10.84 Student 14.36 17.80 20.74 22.12 23.48 24.84 26.23 29.17 32.60
134.52 23.60 5.09 School 19.32 20.93 22.31 22.96 23.60 24.25 24.90 26.28 27.89
48 135.51 22.73 10.84 Student 13.61 17.05 19.99 21.37 22.73 24.09 25.48 28.42 31.85
135.69 22.78 5.09 School 18.49 20.11 21.49 22.14 22.78 23.42 24.07 25.45 27.07
50 136.46 22.23 10.84 Student 13.11 16.55 19.49 20.87 22.23 23.60 24.98 27.92 31.36
136.46 22.23 5.09 School 17.95 19.56 20.94 21.59 22.23 22.88 23.53 24.91 26.52
52 137.42 21.74 10.84 Student 12.61 16.05 18.99 20.38 21.74 23.10 24.48 27.42 30.86
137.24 21.69 5.09 School 17.40 19.02 20.40 21.05 21.69 22.33 22.98 24.36 25.98
55 138.87 20.99 10.84 Student 11.87 15.30 18.24 19.63 20.99 22.35 23.73 26.67 30.11
138.41 20.86 5.09 School 16.58 18.19 19.57 20.22 20.86 21.51 22.16 23.54 25.15
60 141.31 19.72 10.84 Student 10.60 14.04 16.97 18.36 19.72 21.08 22.47 25.40 28.84
140.39 19.47 5.09 School 15.18 16.80 18.18 18.83 19.47 20.11 20.76 22.14 23.76
65 143.83 18.41 10.84 Student 9.29 12.73 15.66 17.05 18.41 19.77 21.16 24.09 27.53
142.44 18.03 5.09 School 13.75 15.36 16.74 17.39 18.03 18.67 19.32 20.71 22.32
70 146.49 17.03 10.84 Student 7.91 11.35 14.28 15.67 17.03 18.39 19.78 22.71 26.15
144.59 16.52 5.09 School 12.23 13.85 15.23 15.88 16.52 17.16 17.81 19.19 20.81
75 149.35 15.54 10.84 Student 6.42 9.86 12.79 14.18 15.54 16.90 18.29 21.22 24.66
146.92 14.88 5.09 School 10.59 12.21 13.59 14.24 14.88 15.52 16.17 17.55 19.17
80 152.55 13.88 10.84 Student 4.76 8.20 11.14 12.52 13.88 15.24 16.63 19.57 23.00
149.51 13.06 5.09 School 8.77 10.39 11.77 12.42 13.06 13.70 14.35 15.73 17.35
85 156.27 11.95 10.84 Student 2.83 6.26 9.20 10.59 11.95 13.31 14.69 17.63 21.07
152.53 10.94 5.09 School 6.65 8.26 9.64 10.30 10.94 11.58 12.23 13.61 15.22
90 160.96 9.51 10.84 Student 0.39 3.83 6.77 8.15 9.51 10.88 12.26 15.20 18.64
156.33 8.26 5.09 School 3.98 5.59 6.97 7.62 8.26 8.90 9.55 10.94 12.55
CGI - Conditional Growth Index CGP - Conditional Growth Percentile
190

Table E.1.3: Mathematics Grade K From Fall To Winter Conditional Growth Percentile
Conditional Growth
Start Status Growth CGP 20 30 40 45 50 55 60 70 80
%ile RIT Mean SD CGI -0.84 -0.52 -0.25 -0.13 0.00 0.13 0.25 0.52 0.84
10 111.97 22.33 7.93 Student 15.66 18.17 20.32 21.34 22.33 23.33 24.34 26.49 29.01
116.60 22.99 3.44 School 20.10 21.19 22.12 22.56 22.99 23.43 23.86 24.80 25.89
20 120.38 19.39 7.93 Student 12.71 15.23 17.38 18.39 19.39 20.38 21.40 23.55 26.06
123.42 19.82 3.44 School 16.93 18.02 18.95 19.39 19.82 20.25 20.69 21.62 22.71
25 123.58 18.27 7.93 Student 11.59 14.11 16.26 17.27 18.27 19.26 20.28 22.43 24.94
126.01 18.61 3.44 School 15.72 16.81 17.74 18.18 18.61 19.05 19.48 20.42 21.51
30 126.44 17.26 7.93 Student 10.58 13.10 15.25 16.26 17.26 18.26 19.27 21.42 23.94
128.34 17.53 3.44 School 14.64 15.73 16.66 17.10 17.53 17.96 18.40 19.33 20.42
35 129.10 16.33 7.93 Student 9.65 12.17 14.32 15.33 16.33 17.33 18.34 20.49 23.01
130.49 16.53 3.44 School 13.63 14.72 15.66 16.10 16.53 16.96 17.40 18.33 19.42
40 131.62 15.44 7.93 Student 8.77 11.28 13.43 14.45 15.44 16.44 17.45 19.60 22.12
132.54 15.58 3.44 School 12.68 13.77 14.70 15.14 15.58 16.01 16.45 17.38 18.47
45 134.06 14.59 7.93 Student 7.91 10.43 12.58 13.59 14.59 15.59 16.60 18.75 21.27
134.52 14.65 3.44 School 11.76 12.85 13.78 14.22 14.65 15.09 15.52 16.46 17.55
48 135.51 14.08 7.93 Student 7.41 9.92 12.07 13.09 14.08 15.08 16.09 18.24 20.76
135.69 14.11 3.44 School 11.22 12.31 13.24 13.68 14.11 14.54 14.98 15.91 17.00
50 136.46 13.75 7.93 Student 7.07 9.59 11.74 12.75 13.75 14.74 15.76 17.91 20.42
136.46 13.75 3.44 School 10.85 11.94 12.88 13.32 13.75 14.18 14.62 15.55 16.64
52 137.42 13.41 7.93 Student 6.73 9.25 11.40 12.41 13.41 14.41 15.42 17.57 20.09
137.24 13.39 3.44 School 10.49 11.58 12.51 12.95 13.39 13.82 14.26 15.19 16.28
55 138.87 12.91 7.93 Student 6.23 8.75 10.90 11.91 12.91 13.90 14.92 17.07 19.58
138.41 12.84 3.44 School 9.95 11.04 11.97 12.41 12.84 13.27 13.71 14.64 15.73
60 141.31 12.05 7.93 Student 5.37 7.89 10.04 11.05 12.05 13.05 14.06 16.21 18.73
140.39 11.92 3.44 School 9.03 10.12 11.05 11.49 11.92 12.35 12.79 13.72 14.81
65 143.83 11.17 7.93 Student 4.49 7.01 9.16 10.17 11.17 12.16 13.18 15.33 17.84
142.44 10.97 3.44 School 8.07 9.16 10.10 10.54 10.97 11.40 11.84 12.77 13.86
70 146.49 10.23 7.93 Student 3.56 6.07 8.22 9.24 10.23 11.23 12.24 14.39 16.91
144.59 9.96 3.44 School 7.07 8.16 9.09 9.53 9.96 10.40 10.83 11.77 12.86
75 149.35 9.23 7.93 Student 2.55 5.07 7.22 8.23 9.23 10.23 11.24 13.39 15.91
146.92 8.88 3.44 School 5.99 7.08 8.01 8.45 8.88 9.31 9.75 10.68 11.77
80 152.55 8.11 7.93 Student 1.43 3.95 6.10 7.11 8.11 9.11 10.12 12.27 14.79
149.51 7.68 3.44 School 4.78 5.87 6.80 7.24 7.68 8.11 8.55 9.48 10.57
85 156.27 6.80 7.93 Student 0.13 2.64 4.79 5.81 6.80 7.80 8.81 10.96 13.48
152.53 6.27 3.44 School 3.38 4.47 5.40 5.84 6.27 6.70 7.14 8.07 9.16
90 160.96 5.16 7.93 Student -1.52 1.00 3.15 4.16 5.16 6.16 7.17 9.32 11.84
156.33 4.50 3.44 School 1.61 2.70 3.63 4.07 4.50 4.93 5.37 6.30 7.39
CGI - Conditional Growth Index CGP - Conditional Growth Percentile
191
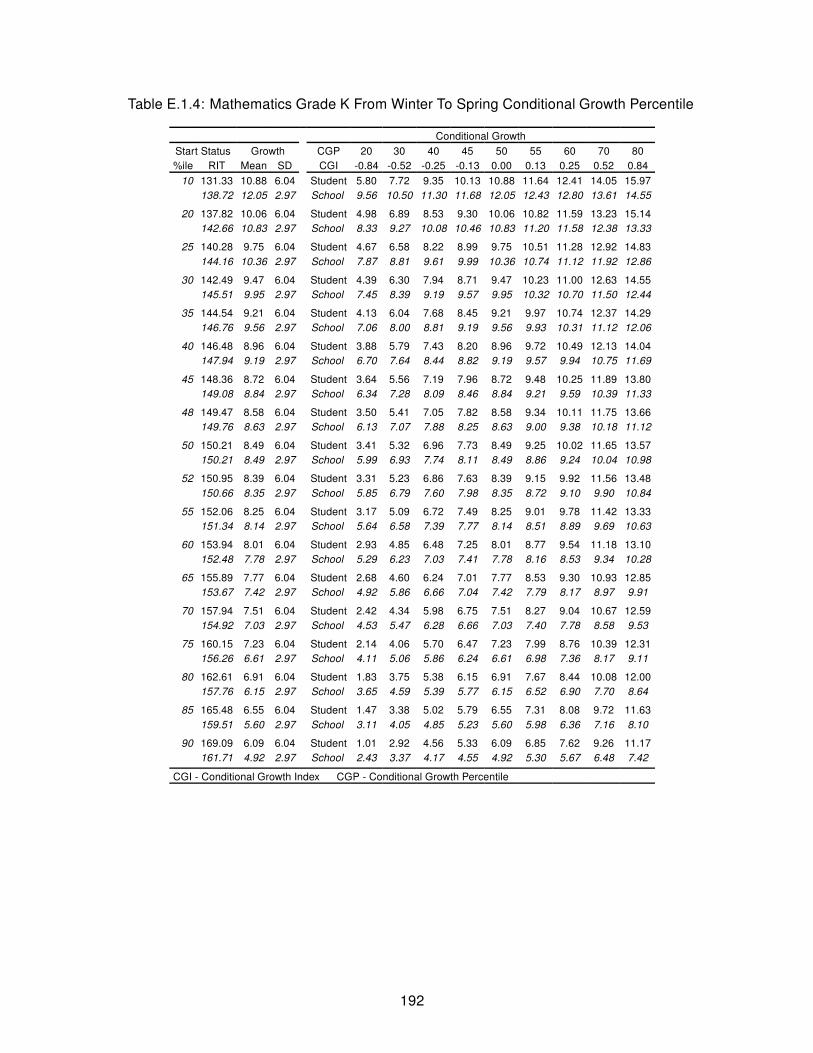
Table E.1.4: Mathematics Grade K From Winter To Spring Conditional Growth Percentile
Conditional Growth
Start Status Growth CGP 20 30 40 45 50 55 60 70 80
%ile RIT Mean SD CGI -0.84 -0.52 -0.25 -0.13 0.00 0.13 0.25 0.52 0.84
10 131.33 10.88 6.04 Student 5.80 7.72 9.35 10.13 10.88 11.64 12.41 14.05 15.97
138.72 12.05 2.97 School 9.56 10.50 11.30 11.68 12.05 12.43 12.80 13.61 14.55
20 137.82 10.06 6.04 Student 4.98 6.89 8.53 9.30 10.06 10.82 11.59 13.23 15.14
142.66 10.83 2.97 School 8.33 9.27 10.08 10.46 10.83 11.20 11.58 12.38 13.33
25 140.28 9.75 6.04 Student 4.67 6.58 8.22 8.99 9.75 10.51 11.28 12.92 14.83
144.16 10.36 2.97 School 7.87 8.81 9.61 9.99 10.36 10.74 11.12 11.92 12.86
30 142.49 9.47 6.04 Student 4.39 6.30 7.94 8.71 9.47 10.23 11.00 12.63 14.55
145.51 9.95 2.97 School 7.45 8.39 9.19 9.57 9.95 10.32 10.70 11.50 12.44
35 144.54 9.21 6.04 Student 4.13 6.04 7.68 8.45 9.21 9.97 10.74 12.37 14.29
146.76 9.56 2.97 School 7.06 8.00 8.81 9.19 9.56 9.93 10.31 11.12 12.06
40 146.48 8.96 6.04 Student 3.88 5.79 7.43 8.20 8.96 9.72 10.49 12.13 14.04
147.94 9.19 2.97 School 6.70 7.64 8.44 8.82 9.19 9.57 9.94 10.75 11.69
45 148.36 8.72 6.04 Student 3.64 5.56 7.19 7.96 8.72 9.48 10.25 11.89 13.80
149.08 8.84 2.97 School 6.34 7.28 8.09 8.46 8.84 9.21 9.59 10.39 11.33
48 149.47 8.58 6.04 Student 3.50 5.41 7.05 7.82 8.58 9.34 10.11 11.75 13.66
149.76 8.63 2.97 School 6.13 7.07 7.88 8.25 8.63 9.00 9.38 10.18 11.12
50 150.21 8.49 6.04 Student 3.41 5.32 6.96 7.73 8.49 9.25 10.02 11.65 13.57
150.21 8.49 2.97 School 5.99 6.93 7.74 8.11 8.49 8.86 9.24 10.04 10.98
52 150.95 8.39 6.04 Student 3.31 5.23 6.86 7.63 8.39 9.15 9.92 11.56 13.48
150.66 8.35 2.97 School 5.85 6.79 7.60 7.98 8.35 8.72 9.10 9.90 10.84
55 152.06 8.25 6.04 Student 3.17 5.09 6.72 7.49 8.25 9.01 9.78 11.42 13.33
151.34 8.14 2.97 School 5.64 6.58 7.39 7.77 8.14 8.51 8.89 9.69 10.63
60 153.94 8.01 6.04 Student 2.93 4.85 6.48 7.25 8.01 8.77 9.54 11.18 13.10
152.48 7.78 2.97 School 5.29 6.23 7.03 7.41 7.78 8.16 8.53 9.34 10.28
65 155.89 7.77 6.04 Student 2.68 4.60 6.24 7.01 7.77 8.53 9.30 10.93 12.85
153.67 7.42 2.97 School 4.92 5.86 6.66 7.04 7.42 7.79 8.17 8.97 9.91
70 157.94 7.51 6.04 Student 2.42 4.34 5.98 6.75 7.51 8.27 9.04 10.67 12.59
154.92 7.03 2.97 School 4.53 5.47 6.28 6.66 7.03 7.40 7.78 8.58 9.53
75 160.15 7.23 6.04 Student 2.14 4.06 5.70 6.47 7.23 7.99 8.76 10.39 12.31
156.26 6.61 2.97 School 4.11 5.06 5.86 6.24 6.61 6.98 7.36 8.17 9.11
80 162.61 6.91 6.04 Student 1.83 3.75 5.38 6.15 6.91 7.67 8.44 10.08 12.00
157.76 6.15 2.97 School 3.65 4.59 5.39 5.77 6.15 6.52 6.90 7.70 8.64
85 165.48 6.55 6.04 Student 1.47 3.38 5.02 5.79 6.55 7.31 8.08 9.72 11.63
159.51 5.60 2.97 School 3.11 4.05 4.85 5.23 5.60 5.98 6.36 7.16 8.10
90 169.09 6.09 6.04 Student 1.01 2.92 4.56 5.33 6.09 6.85 7.62 9.26 11.17
161.71 4.92 2.97 School 2.43 3.37 4.17 4.55 4.92 5.30 5.67 6.48 7.42
CGI - Conditional Growth Index CGP - Conditional Growth Percentile
192

Table E.1.5: Mathematics Grade 1 From Last Winter To Winter Conditional Growth Percentile
Conditional Growth
Start Status Growth CGP 20 30 40 45 50 55 60 70 80
%ile RIT Mean SD CGI -0.84 -0.52 -0.25 -0.13 0.00 0.13 0.25 0.52 0.84
10 132.83 26.41 6.17 Student 21.22 23.18 24.85 25.64 26.41 27.19 27.98 29.65 31.61
142.62 24.46 2.60 School 22.27 23.09 23.80 24.13 24.46 24.79 25.12 25.83 26.65
20 139.18 25.07 6.17 Student 19.88 21.84 23.51 24.30 25.07 25.85 26.64 28.31 30.27
145.61 23.79 2.60 School 21.60 22.42 23.13 23.46 23.79 24.12 24.45 25.16 25.98
25 141.60 24.56 6.17 Student 19.37 21.33 23.00 23.79 24.56 25.34 26.13 27.80 29.76
146.75 23.53 2.60 School 21.34 22.17 22.87 23.21 23.53 23.86 24.19 24.90 25.73
30 143.77 24.11 6.17 Student 18.91 20.87 22.54 23.33 24.11 24.88 25.67 27.34 29.30
147.77 23.31 2.60 School 21.11 21.94 22.65 22.98 23.31 23.63 23.97 24.67 25.50
35 145.77 23.68 6.17 Student 18.49 20.45 22.12 22.91 23.68 24.46 25.24 26.92 28.87
148.72 23.09 2.60 School 20.90 21.73 22.43 22.77 23.09 23.42 23.75 24.46 25.29
40 147.68 23.28 6.17 Student 18.09 20.04 21.72 22.50 23.28 24.05 24.84 26.51 28.47
149.62 22.89 2.60 School 20.70 21.53 22.23 22.57 22.89 23.22 23.55 24.26 25.08
45 149.53 22.89 6.17 Student 17.70 19.65 21.33 22.11 22.89 23.66 24.45 26.13 28.08
150.49 22.70 2.60 School 20.51 21.33 22.04 22.37 22.70 23.03 23.36 24.06 24.89
48 150.62 22.66 6.17 Student 17.47 19.42 21.10 21.88 22.66 23.43 24.22 25.89 27.85
151.00 22.58 2.60 School 20.39 21.22 21.92 22.26 22.58 22.91 23.24 23.95 24.77
50 151.34 22.51 6.17 Student 17.31 19.27 20.94 21.73 22.51 23.28 24.07 25.74 27.70
151.34 22.51 2.60 School 20.31 21.14 21.85 22.18 22.51 22.83 23.17 23.87 24.70
52 152.07 22.35 6.17 Student 17.16 19.12 20.79 21.58 22.35 23.13 23.92 25.59 27.55
151.68 22.43 2.60 School 20.24 21.06 21.77 22.10 22.43 22.76 23.09 23.80 24.62
55 153.16 22.12 6.17 Student 16.93 18.89 20.56 21.35 22.12 22.90 23.69 25.36 27.32
152.20 22.31 2.60 School 20.12 20.95 21.65 21.99 22.31 22.64 22.97 23.68 24.51
60 155.00 21.73 6.17 Student 16.54 18.50 20.17 20.96 21.73 22.51 23.30 24.97 26.93
153.06 22.12 2.60 School 19.93 20.75 21.46 21.79 22.12 22.45 22.78 23.49 24.31
65 156.91 21.33 6.17 Student 16.14 18.10 19.77 20.56 21.33 22.11 22.89 24.57 26.52
153.96 21.92 2.60 School 19.73 20.55 21.26 21.59 21.92 22.25 22.58 23.28 24.11
70 158.92 20.91 6.17 Student 15.71 17.67 19.34 20.13 20.91 21.68 22.47 24.14 26.10
154.91 21.71 2.60 School 19.51 20.34 21.05 21.38 21.71 22.03 22.37 23.07 23.90
75 161.08 20.45 6.17 Student 15.26 17.21 18.89 19.67 20.45 21.22 22.01 23.69 25.64
155.93 21.48 2.60 School 19.29 20.11 20.82 21.15 21.48 21.81 22.14 22.84 23.67
80 163.50 19.94 6.17 Student 14.75 16.70 18.38 19.16 19.94 20.72 21.50 23.18 25.13
157.07 21.22 2.60 School 19.03 19.86 20.56 20.90 21.22 21.55 21.88 22.59 23.42
85 166.31 19.35 6.17 Student 14.15 16.11 17.78 18.57 19.35 20.12 20.91 22.58 24.54
158.39 20.93 2.60 School 18.73 19.56 20.27 20.60 20.93 21.25 21.59 22.29 23.12
90 169.85 18.60 6.17 Student 13.41 15.36 17.03 17.82 18.60 19.37 20.16 21.83 23.79
160.06 20.55 2.60 School 18.36 19.19 19.89 20.23 20.55 20.88 21.21 21.92 22.74
CGI - Conditional Growth Index CGP - Conditional Growth Percentile
193

Table E.1.6: Mathematics Grade 1 From Last Spring To Spring Conditional Growth Percentile
Conditional Growth
Start Status Growth CGP 20 30 40 45 50 55 60 70 80
%ile RIT Mean SD CGI -0.84 -0.52 -0.25 -0.13 0.00 0.13 0.25 0.52 0.84
10 139.17 26.35 6.59 Student 20.80 22.89 24.68 25.52 26.35 27.17 28.02 29.80 31.89
149.79 23.84 2.91 School 21.39 22.31 23.10 23.47 23.84 24.20 24.58 25.36 26.29
20 146.19 24.58 6.59 Student 19.04 21.12 22.91 23.75 24.58 25.41 26.25 28.03 30.12
153.17 22.93 2.91 School 20.48 21.40 22.19 22.57 22.93 23.30 23.67 24.46 25.38
25 148.86 23.91 6.59 Student 18.36 20.45 22.24 23.08 23.91 24.73 25.57 27.36 29.45
154.45 22.59 2.91 School 20.14 21.06 21.85 22.22 22.59 22.95 23.32 24.11 25.03
30 151.25 23.30 6.59 Student 17.76 19.85 21.63 22.48 23.30 24.13 24.97 26.76 28.85
155.60 22.28 2.91 School 19.83 20.75 21.54 21.91 22.28 22.64 23.01 23.80 24.73
35 153.47 22.74 6.59 Student 17.20 19.29 21.08 21.92 22.74 23.57 24.41 26.20 28.29
156.66 21.99 2.91 School 19.54 20.46 21.25 21.62 21.99 22.36 22.73 23.52 24.44
40 155.58 22.21 6.59 Student 16.67 18.76 20.54 21.39 22.21 23.04 23.88 25.67 27.76
157.68 21.72 2.91 School 19.27 20.19 20.98 21.35 21.72 22.08 22.45 23.24 24.17
45 157.61 21.70 6.59 Student 16.16 18.25 20.03 20.87 21.70 22.53 23.37 25.15 27.24
158.66 21.45 2.91 School 19.01 19.93 20.72 21.09 21.45 21.82 22.19 22.98 23.90
48 158.82 21.40 6.59 Student 15.85 17.94 19.73 20.57 21.40 22.22 23.06 24.85 26.94
159.23 21.30 2.91 School 18.85 19.77 20.56 20.93 21.30 21.66 22.04 22.82 23.75
50 159.62 21.19 6.59 Student 15.65 17.74 19.53 20.37 21.19 22.02 22.86 24.65 26.74
159.62 21.19 2.91 School 18.75 19.67 20.46 20.83 21.19 21.56 21.93 22.72 23.64
52 160.42 20.99 6.59 Student 15.45 17.54 19.32 20.17 20.99 21.82 22.66 24.45 26.54
160.00 21.09 2.91 School 18.64 19.57 20.35 20.73 21.09 21.46 21.83 22.62 23.54
55 161.62 20.69 6.59 Student 15.15 17.24 19.02 19.86 20.69 21.52 22.36 24.14 26.23
160.58 20.94 2.91 School 18.49 19.41 20.20 20.57 20.94 21.30 21.67 22.46 23.38
60 163.66 20.18 6.59 Student 14.63 16.72 18.51 19.35 20.18 21.00 21.84 23.63 25.72
161.56 20.67 2.91 School 18.22 19.15 19.94 20.31 20.67 21.04 21.41 22.20 23.12
65 165.77 19.65 6.59 Student 14.10 16.19 17.98 18.82 19.65 20.47 21.31 23.10 25.19
162.57 20.40 2.91 School 17.95 18.87 19.66 20.03 20.40 20.77 21.14 21.93 22.85
70 167.99 19.09 6.59 Student 13.54 15.63 17.42 18.26 19.09 19.91 20.76 22.54 24.63
163.64 20.11 2.91 School 17.66 18.59 19.38 19.75 20.11 20.48 20.85 21.64 22.56
75 170.38 18.48 6.59 Student 12.94 15.03 16.81 17.66 18.48 19.31 20.15 21.94 24.03
164.79 19.80 2.91 School 17.35 18.28 19.07 19.44 19.80 20.17 20.54 21.33 22.25
80 173.05 17.81 6.59 Student 12.27 14.36 16.14 16.98 17.81 18.64 19.48 21.26 23.35
166.07 19.46 2.91 School 17.01 17.93 18.72 19.09 19.46 19.82 20.20 20.98 21.91
85 176.16 17.03 6.59 Student 11.49 13.57 15.36 16.20 17.03 17.86 18.70 20.48 22.57
167.57 19.06 2.91 School 16.61 17.53 18.32 18.69 19.06 19.42 19.79 20.58 21.51
90 180.07 16.04 6.59 Student 10.50 12.59 14.37 15.21 16.04 16.87 17.71 19.50 21.59
169.45 18.55 2.91 School 16.10 17.03 17.81 18.19 18.55 18.92 19.29 20.08 21.00
CGI - Conditional Growth Index CGP - Conditional Growth Percentile
194

Table E.1.7: Mathematics Grade 1 From Fall To N Fall Conditional Growth Percentile
Conditional Growth
Start Status Growth CGP 20 30 40 45 50 55 60 70 80
%ile RIT Mean SD CGI -0.84 -0.52 -0.25 -0.13 0.00 0.13 0.25 0.52 0.84
10 145.93 16.21 8.02 Student 9.46 12.01 14.18 15.21 16.21 17.22 18.25 20.42 22.97
155.08 15.13 3.34 School 12.32 13.38 14.28 14.71 15.13 15.55 15.98 16.88 17.94
20 151.59 15.66 8.02 Student 8.90 11.45 13.62 14.65 15.66 16.66 17.69 19.86 22.41
157.60 14.94 3.34 School 12.13 13.19 14.10 14.52 14.94 15.36 15.79 16.69 17.75
25 153.74 15.44 8.02 Student 8.69 11.24 13.41 14.43 15.44 16.45 17.48 19.65 22.20
158.55 14.87 3.34 School 12.06 13.12 14.03 14.45 14.87 15.29 15.72 16.62 17.68
30 155.67 15.25 8.02 Student 8.50 11.04 13.22 14.24 15.25 16.26 17.29 19.46 22.01
159.41 14.81 3.34 School 12.00 13.06 13.96 14.39 14.81 15.23 15.65 16.56 17.62
35 157.46 15.08 8.02 Student 8.32 10.87 13.04 14.07 15.08 16.08 17.11 19.28 21.83
160.21 14.75 3.34 School 11.94 13.00 13.90 14.33 14.75 15.17 15.60 16.50 17.56
40 159.16 14.91 8.02 Student 8.15 10.70 12.87 13.90 14.91 15.92 16.94 19.12 21.66
160.96 14.69 3.34 School 11.88 12.94 13.85 14.27 14.69 15.11 15.54 16.44 17.50
45 160.80 14.75 8.02 Student 7.99 10.54 12.71 13.74 14.75 15.75 16.78 18.95 21.50
161.70 14.64 3.34 School 11.83 12.89 13.79 14.22 14.64 15.06 15.49 16.39 17.45
48 161.77 14.65 8.02 Student 7.90 10.44 12.62 13.64 14.65 15.66 16.68 18.86 21.40
162.13 14.61 3.34 School 11.80 12.86 13.76 14.19 14.61 15.03 15.45 16.36 17.42
50 162.42 14.59 8.02 Student 7.83 10.38 12.55 13.58 14.59 15.59 16.62 18.79 21.34
162.42 14.59 3.34 School 11.78 12.83 13.74 14.17 14.59 15.01 15.43 16.34 17.40
52 163.06 14.52 8.02 Student 7.77 10.31 12.49 13.51 14.52 15.53 16.56 18.73 21.28
162.70 14.56 3.34 School 11.75 12.81 13.72 14.14 14.56 14.98 15.41 16.32 17.38
55 164.03 14.43 8.02 Student 7.67 10.22 12.39 13.42 14.43 15.43 16.46 18.63 21.18
163.13 14.53 3.34 School 11.72 12.78 13.69 14.11 14.53 14.95 15.38 16.28 17.34
60 165.68 14.26 8.02 Student 7.51 10.06 12.23 13.26 14.26 15.27 16.30 18.47 21.02
163.87 14.48 3.34 School 11.67 12.73 13.63 14.06 14.48 14.90 15.32 16.23 17.29
65 167.37 14.10 8.02 Student 7.34 9.89 12.06 13.09 14.10 15.10 16.13 18.30 20.85
164.62 14.42 3.34 School 11.61 12.67 13.58 14.00 14.42 14.84 15.27 16.17 17.23
70 169.16 13.92 8.02 Student 7.17 9.71 11.89 12.91 13.92 14.93 15.95 18.13 20.67
165.42 14.36 3.34 School 11.55 12.61 13.52 13.94 14.36 14.78 15.21 16.11 17.17
75 171.09 13.73 8.02 Student 6.98 9.52 11.70 12.72 13.73 14.74 15.76 17.94 20.48
166.28 14.30 3.34 School 11.49 12.55 13.45 13.88 14.30 14.72 15.15 16.05 17.11
80 173.24 13.52 8.02 Student 6.76 9.31 11.48 12.51 13.52 14.52 15.55 17.72 20.27
167.23 14.23 3.34 School 11.42 12.48 13.38 13.81 14.23 14.65 15.07 15.98 17.04
85 175.75 13.27 8.02 Student 6.52 9.06 11.24 12.26 13.27 14.28 15.30 17.48 20.02
168.35 14.15 3.34 School 11.34 12.39 13.30 13.73 14.15 14.57 14.99 15.90 16.96
90 178.91 12.96 8.02 Student 6.20 8.75 10.92 11.95 12.96 13.97 14.99 17.17 19.71
169.75 14.04 3.34 School 11.23 12.29 13.20 13.62 14.04 14.46 14.89 15.79 16.85
CGI - Conditional Growth Index CGP - Conditional Growth Percentile
195

Table E.1.8: Mathematics Grade 1 From Fall To Spring Conditional Growth Percentile
Conditional Growth
Start Status Growth CGP 20 30 40 45 50 55 60 70 80
%ile RIT Mean SD CGI -0.84 -0.52 -0.25 -0.13 0.00 0.13 0.25 0.52 0.84
10 145.93 20.15 7.32 Student 13.99 16.31 18.30 19.23 20.15 21.07 22.01 23.99 26.31
155.08 18.60 2.98 School 16.09 17.04 17.85 18.23 18.60 18.98 19.36 20.17 21.12
20 151.59 19.55 7.32 Student 13.39 15.71 17.70 18.63 19.55 20.47 21.40 23.39 25.71
157.60 18.53 2.98 School 16.02 16.97 17.78 18.16 18.53 18.91 19.29 20.10 21.04
25 153.74 19.32 7.32 Student 13.16 15.48 17.47 18.40 19.32 20.24 21.18 23.16 25.48
158.55 18.51 2.98 School 16.00 16.94 17.75 18.13 18.51 18.88 19.26 20.07 21.02
30 155.67 19.12 7.32 Student 12.96 15.28 17.26 18.20 19.12 20.04 20.97 22.95 25.28
159.41 18.48 2.98 School 15.97 16.92 17.73 18.11 18.48 18.86 19.24 20.05 20.99
35 157.46 18.93 7.32 Student 12.77 15.09 17.07 18.01 18.93 19.85 20.78 22.76 25.09
160.21 18.46 2.98 School 15.95 16.90 17.70 18.09 18.46 18.84 19.22 20.03 20.97
40 159.16 18.75 7.32 Student 12.58 14.91 16.89 17.83 18.75 19.66 20.60 22.58 24.91
160.96 18.44 2.98 School 15.93 16.87 17.68 18.06 18.44 18.81 19.20 20.00 20.95
45 160.80 18.57 7.32 Student 12.41 14.73 16.72 17.65 18.57 19.49 20.42 22.41 24.73
161.70 18.42 2.98 School 15.91 16.85 17.66 18.04 18.42 18.79 19.17 19.98 20.93
48 161.77 18.47 7.32 Student 12.31 14.63 16.61 17.55 18.47 19.39 20.32 22.31 24.63
162.13 18.41 2.98 School 15.90 16.84 17.65 18.03 18.41 18.78 19.16 19.97 20.92
50 162.42 18.40 7.32 Student 12.24 14.56 16.54 17.48 18.40 19.32 20.25 22.24 24.56
162.42 18.40 2.98 School 15.89 16.83 17.64 18.02 18.40 18.77 19.15 19.96 20.91
52 163.06 18.33 7.32 Student 12.17 14.49 16.48 17.41 18.33 19.25 20.18 22.17 24.49
162.70 18.39 2.98 School 15.88 16.83 17.63 18.02 18.39 18.77 19.15 19.96 20.90
55 164.03 18.23 7.32 Student 12.07 14.39 16.37 17.31 18.23 19.15 20.08 22.07 24.39
163.13 18.38 2.98 School 15.87 16.81 17.62 18.00 18.38 18.75 19.13 19.94 20.89
60 165.68 18.05 7.32 Student 11.89 14.21 16.20 17.13 18.05 18.97 19.91 21.89 24.21
163.87 18.36 2.98 School 15.85 16.79 17.60 17.98 18.36 18.73 19.11 19.92 20.87
65 167.37 17.87 7.32 Student 11.71 14.03 16.02 16.95 17.87 18.79 19.73 21.71 24.03
164.62 18.34 2.98 School 15.83 16.77 17.58 17.96 18.34 18.71 19.09 19.90 20.85
70 169.16 17.68 7.32 Student 11.52 13.84 15.83 16.76 17.68 18.60 19.54 21.52 23.84
165.42 18.31 2.98 School 15.80 16.75 17.56 17.94 18.31 18.69 19.07 19.88 20.83
75 171.09 17.48 7.32 Student 11.32 13.64 15.62 16.56 17.48 18.40 19.33 21.31 23.64
166.28 18.29 2.98 School 15.78 16.73 17.53 17.92 18.29 18.67 19.05 19.86 20.80
80 173.24 17.25 7.32 Student 11.09 13.41 15.39 16.33 17.25 18.17 19.10 21.09 23.41
167.23 18.26 2.98 School 15.75 16.70 17.51 17.89 18.26 18.64 19.02 19.83 20.78
85 175.75 16.98 7.32 Student 10.82 13.14 15.13 16.06 16.98 17.90 18.84 20.82 23.14
168.35 18.23 2.98 School 15.72 16.67 17.48 17.86 18.23 18.61 18.99 19.80 20.74
90 178.91 16.65 7.32 Student 10.49 12.81 14.79 15.73 16.65 17.57 18.50 20.48 22.81
169.75 18.19 2.98 School 15.68 16.63 17.44 17.82 18.19 18.57 18.95 19.76 20.71
CGI - Conditional Growth Index CGP - Conditional Growth Percentile
196

Table E.1.9: Mathematics Grade 1 From Fall To Winter Conditional Growth Percentile
Conditional Growth
Start Status Growth CGP 20 30 40 45 50 55 60 70 80
%ile RIT Mean SD CGI -0.84 -0.52 -0.25 -0.13 0.00 0.13 0.25 0.52 0.84
10 145.93 12.82 5.39 Student 8.28 9.99 11.45 12.14 12.82 13.49 14.18 15.64 17.35
155.08 11.55 1.71 School 10.11 10.65 11.12 11.33 11.55 11.76 11.98 12.44 12.98
20 151.59 12.34 5.39 Student 7.80 9.51 10.98 11.66 12.34 13.02 13.71 15.17 16.88
157.60 11.51 1.71 School 10.07 10.61 11.08 11.29 11.51 11.72 11.94 12.40 12.94
25 153.74 12.16 5.39 Student 7.62 9.33 10.80 11.48 12.16 12.84 13.53 14.99 16.70
158.55 11.49 1.71 School 10.06 10.60 11.06 11.28 11.49 11.71 11.93 12.39 12.93
30 155.67 12.00 5.39 Student 7.46 9.17 10.63 11.32 12.00 12.68 13.36 14.83 16.54
159.41 11.48 1.71 School 10.04 10.59 11.05 11.27 11.48 11.69 11.91 12.37 12.92
35 157.46 11.85 5.39 Student 7.31 9.02 10.48 11.17 11.85 12.53 13.21 14.68 16.39
160.21 11.47 1.71 School 10.03 10.57 11.03 11.25 11.47 11.68 11.90 12.36 12.90
40 159.16 11.71 5.39 Student 7.17 8.88 10.34 11.03 11.71 12.38 13.07 14.53 16.24
160.96 11.45 1.71 School 10.02 10.56 11.02 11.24 11.45 11.67 11.89 12.35 12.89
45 160.80 11.57 5.39 Student 7.03 8.74 10.20 10.89 11.57 12.24 12.93 14.39 16.10
161.70 11.44 1.71 School 10.01 10.55 11.01 11.23 11.44 11.66 11.88 12.34 12.88
48 161.77 11.49 5.39 Student 6.95 8.66 10.12 10.81 11.49 12.16 12.85 14.31 16.02
162.13 11.44 1.71 School 10.00 10.54 11.00 11.22 11.44 11.65 11.87 12.33 12.87
50 162.42 11.43 5.39 Student 6.89 8.60 10.07 10.75 11.43 12.11 12.80 14.26 15.97
162.42 11.43 1.71 School 10.00 10.54 11.00 11.22 11.43 11.65 11.86 12.33 12.87
52 163.06 11.38 5.39 Student 6.84 8.55 10.01 10.70 11.38 12.05 12.74 14.20 15.91
162.70 11.43 1.71 School 9.99 10.53 10.99 11.21 11.43 11.64 11.86 12.32 12.86
55 164.03 11.30 5.39 Student 6.76 8.47 9.93 10.62 11.30 11.97 12.66 14.12 15.83
163.13 11.42 1.71 School 9.98 10.53 10.99 11.21 11.42 11.63 11.85 12.31 12.86
60 165.68 11.16 5.39 Student 6.62 8.33 9.79 10.48 11.16 11.84 12.52 13.98 15.69
163.87 11.41 1.71 School 9.97 10.51 10.98 11.19 11.41 11.62 11.84 12.30 12.84
65 167.37 11.01 5.39 Student 6.48 8.19 9.65 10.34 11.01 11.69 12.38 13.84 15.55
164.62 11.40 1.71 School 9.96 10.50 10.96 11.18 11.40 11.61 11.83 12.29 12.83
70 169.16 10.86 5.39 Student 6.33 8.04 9.50 10.19 10.86 11.54 12.23 13.69 15.40
165.42 11.38 1.71 School 9.95 10.49 10.95 11.17 11.38 11.60 11.82 12.28 12.82
75 171.09 10.70 5.39 Student 6.17 7.88 9.34 10.02 10.70 11.38 12.07 13.53 15.24
166.28 11.37 1.71 School 9.93 10.48 10.94 11.16 11.37 11.58 11.80 12.26 12.81
80 173.24 10.52 5.39 Student 5.98 7.69 9.16 9.84 10.52 11.20 11.89 13.35 15.06
167.23 11.35 1.71 School 9.92 10.46 10.92 11.14 11.35 11.57 11.79 12.25 12.79
85 175.75 10.31 5.39 Student 5.77 7.48 8.95 9.63 10.31 10.99 11.68 13.14 14.85
168.35 11.34 1.71 School 9.90 10.44 10.90 11.12 11.34 11.55 11.77 12.23 12.77
90 178.91 10.05 5.39 Student 5.51 7.22 8.68 9.37 10.05 10.72 11.41 12.87 14.58
169.75 11.31 1.71 School 9.88 10.42 10.88 11.10 11.31 11.53 11.75 12.21 12.75
CGI - Conditional Growth Index CGP - Conditional Growth Percentile
197
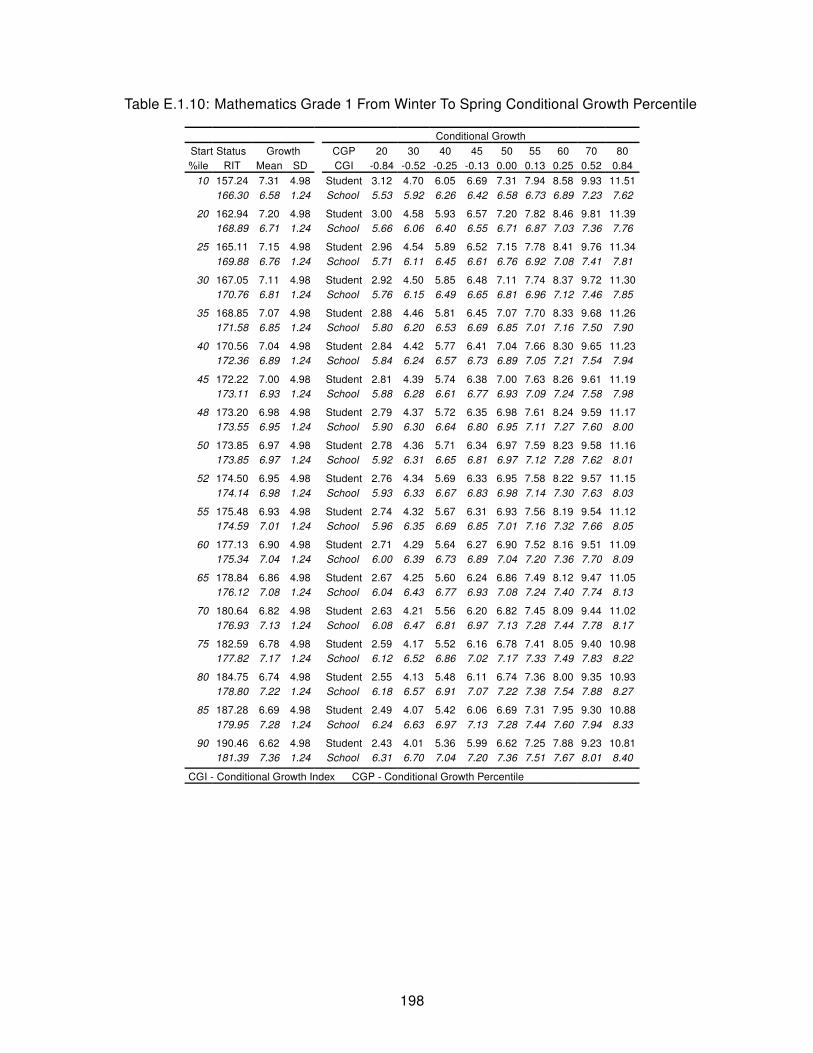
Table E.1.10: Mathematics Grade 1 From Winter To Spring Conditional Growth Percentile
Conditional Growth
Start Status Growth CGP 20 30 40 45 50 55 60 70 80
%ile RIT Mean SD CGI -0.84 -0.52 -0.25 -0.13 0.00 0.13 0.25 0.52 0.84
10 157.24 7.31 4.98 Student 3.12 4.70 6.05 6.69 7.31 7.94 8.58 9.93 11.51
166.30 6.58 1.24 School 5.53 5.92 6.26 6.42 6.58 6.73 6.89 7.23 7.62
20 162.94 7.20 4.98 Student 3.00 4.58 5.93 6.57 7.20 7.82 8.46 9.81 11.39
168.89 6.71 1.24 School 5.66 6.06 6.40 6.55 6.71 6.87 7.03 7.36 7.76
25 165.11 7.15 4.98 Student 2.96 4.54 5.89 6.52 7.15 7.78 8.41 9.76 11.34
169.88 6.76 1.24 School 5.71 6.11 6.45 6.61 6.76 6.92 7.08 7.41 7.81
30 167.05 7.11 4.98 Student 2.92 4.50 5.85 6.48 7.11 7.74 8.37 9.72 11.30
170.76 6.81 1.24 School 5.76 6.15 6.49 6.65 6.81 6.96 7.12 7.46 7.85
35 168.85 7.07 4.98 Student 2.88 4.46 5.81 6.45 7.07 7.70 8.33 9.68 11.26
171.58 6.85 1.24 School 5.80 6.20 6.53 6.69 6.85 7.01 7.16 7.50 7.90
40 170.56 7.04 4.98 Student 2.84 4.42 5.77 6.41 7.04 7.66 8.30 9.65 11.23
172.36 6.89 1.24 School 5.84 6.24 6.57 6.73 6.89 7.05 7.21 7.54 7.94
45 172.22 7.00 4.98 Student 2.81 4.39 5.74 6.38 7.00 7.63 8.26 9.61 11.19
173.11 6.93 1.24 School 5.88 6.28 6.61 6.77 6.93 7.09 7.24 7.58 7.98
48 173.20 6.98 4.98 Student 2.79 4.37 5.72 6.35 6.98 7.61 8.24 9.59 11.17
173.55 6.95 1.24 School 5.90 6.30 6.64 6.80 6.95 7.11 7.27 7.60 8.00
50 173.85 6.97 4.98 Student 2.78 4.36 5.71 6.34 6.97 7.59 8.23 9.58 11.16
173.85 6.97 1.24 School 5.92 6.31 6.65 6.81 6.97 7.12 7.28 7.62 8.01
52 174.50 6.95 4.98 Student 2.76 4.34 5.69 6.33 6.95 7.58 8.22 9.57 11.15
174.14 6.98 1.24 School 5.93 6.33 6.67 6.83 6.98 7.14 7.30 7.63 8.03
55 175.48 6.93 4.98 Student 2.74 4.32 5.67 6.31 6.93 7.56 8.19 9.54 11.12
174.59 7.01 1.24 School 5.96 6.35 6.69 6.85 7.01 7.16 7.32 7.66 8.05
60 177.13 6.90 4.98 Student 2.71 4.29 5.64 6.27 6.90 7.52 8.16 9.51 11.09
175.34 7.04 1.24 School 6.00 6.39 6.73 6.89 7.04 7.20 7.36 7.70 8.09
65 178.84 6.86 4.98 Student 2.67 4.25 5.60 6.24 6.86 7.49 8.12 9.47 11.05
176.12 7.08 1.24 School 6.04 6.43 6.77 6.93 7.08 7.24 7.40 7.74 8.13
70 180.64 6.82 4.98 Student 2.63 4.21 5.56 6.20 6.82 7.45 8.09 9.44 11.02
176.93 7.13 1.24 School 6.08 6.47 6.81 6.97 7.13 7.28 7.44 7.78 8.17
75 182.59 6.78 4.98 Student 2.59 4.17 5.52 6.16 6.78 7.41 8.05 9.40 10.98
177.82 7.17 1.24 School 6.12 6.52 6.86 7.02 7.17 7.33 7.49 7.83 8.22
80 184.75 6.74 4.98 Student 2.55 4.13 5.48 6.11 6.74 7.36 8.00 9.35 10.93
178.80 7.22 1.24 School 6.18 6.57 6.91 7.07 7.22 7.38 7.54 7.88 8.27
85 187.28 6.69 4.98 Student 2.49 4.07 5.42 6.06 6.69 7.31 7.95 9.30 10.88
179.95 7.28 1.24 School 6.24 6.63 6.97 7.13 7.28 7.44 7.60 7.94 8.33
90 190.46 6.62 4.98 Student 2.43 4.01 5.36 5.99 6.62 7.25 7.88 9.23 10.81
181.39 7.36 1.24 School 6.31 6.70 7.04 7.20 7.36 7.51 7.67 8.01 8.40
CGI - Conditional Growth Index CGP - Conditional Growth Percentile
198

Table E.1.11: Mathematics Grade 2 From Last Winter To Winter Conditional Growth Percentile
Conditional Growth
Start Status Growth CGP 20 30 40 45 50 55 60 70 80
%ile RIT Mean SD CGI -0.84 -0.52 -0.25 -0.13 0.00 0.13 0.25 0.52 0.84
10 154.47 16.91 5.88 Student 11.96 13.83 15.42 16.17 16.91 17.65 18.40 20.00 21.87
164.35 14.96 2.27 School 13.05 13.77 14.38 14.67 14.96 15.24 15.53 16.15 16.87
20 160.76 15.78 5.88 Student 10.83 12.69 14.29 15.04 15.78 16.52 17.27 18.86 20.73
167.25 14.49 2.27 School 12.58 13.30 13.92 14.21 14.49 14.78 15.07 15.68 16.40
25 163.15 15.35 5.88 Student 10.39 12.26 13.85 14.61 15.35 16.08 16.84 18.43 20.30
168.35 14.32 2.27 School 12.41 13.13 13.74 14.03 14.32 14.60 14.89 15.51 16.23
30 165.29 14.96 5.88 Student 10.01 11.87 13.47 14.22 14.96 15.70 16.45 18.04 19.91
169.34 14.16 2.27 School 12.25 12.97 13.58 13.87 14.16 14.44 14.73 15.35 16.07
35 167.28 14.60 5.88 Student 9.65 11.51 13.11 13.86 14.60 15.34 16.09 17.68 19.55
170.25 14.01 2.27 School 12.10 12.82 13.43 13.72 14.01 14.30 14.59 15.20 15.92
40 169.17 14.26 5.88 Student 9.31 11.17 12.77 13.52 14.26 15.00 15.75 17.34 19.21
171.12 13.87 2.27 School 11.96 12.68 13.29 13.58 13.87 14.16 14.45 15.06 15.78
45 170.99 13.93 5.88 Student 8.98 10.84 12.44 13.19 13.93 14.67 15.42 17.01 18.88
171.96 13.74 2.27 School 11.82 12.54 13.16 13.45 13.74 14.02 14.31 14.93 15.65
48 172.07 13.73 5.88 Student 8.78 10.65 12.24 12.99 13.73 14.47 15.22 16.82 18.68
172.46 13.66 2.27 School 11.74 12.46 13.08 13.37 13.66 13.94 14.23 14.85 15.57
50 172.79 13.60 5.88 Student 8.65 10.52 12.11 12.86 13.60 14.34 15.09 16.69 18.55
172.79 13.60 2.27 School 11.69 12.41 13.03 13.32 13.60 13.89 14.18 14.79 15.51
52 173.51 13.47 5.88 Student 8.52 10.39 11.98 12.73 13.47 14.21 14.96 16.56 18.42
173.12 13.55 2.27 School 11.64 12.36 12.97 13.26 13.55 13.83 14.12 14.74 15.46
55 174.59 13.28 5.88 Student 8.33 10.19 11.79 12.54 13.28 14.02 14.77 16.36 18.23
173.62 13.47 2.27 School 11.56 12.28 12.89 13.18 13.47 13.75 14.04 14.66 15.38
60 176.41 12.95 5.88 Student 8.00 9.86 11.46 12.21 12.95 13.69 14.44 16.03 17.90
174.46 13.33 2.27 School 11.42 12.14 12.76 13.05 13.33 13.62 13.91 14.52 15.24
65 178.30 12.61 5.88 Student 7.66 9.52 11.12 11.87 12.61 13.35 14.10 15.69 17.56
175.33 13.19 2.27 School 11.28 12.00 12.62 12.91 13.19 13.48 13.77 14.38 15.11
70 180.29 12.25 5.88 Student 7.30 9.16 10.76 11.51 12.25 12.99 13.74 15.33 17.20
176.24 13.05 2.27 School 11.14 11.86 12.47 12.76 13.05 13.33 13.62 14.24 14.96
75 182.43 11.86 5.88 Student 6.91 8.77 10.37 11.12 11.86 12.60 13.35 14.94 16.81
177.23 12.89 2.27 School 10.98 11.70 12.31 12.60 12.89 13.17 13.46 14.08 14.80
80 184.82 11.43 5.88 Student 6.48 8.34 9.94 10.69 11.43 12.17 12.92 14.51 16.38
178.33 12.71 2.27 School 10.80 11.52 12.14 12.43 12.71 13.00 13.29 13.90 14.62
85 187.61 10.92 5.88 Student 5.97 7.84 9.43 10.18 10.92 11.66 12.41 14.01 15.87
179.62 12.50 2.27 School 10.59 11.31 11.93 12.22 12.50 12.79 13.08 13.70 14.42
90 191.11 10.29 5.88 Student 5.34 7.21 8.80 9.55 10.29 11.03 11.78 13.37 15.24
181.23 12.25 2.27 School 10.33 11.05 11.67 11.96 12.25 12.53 12.82 13.44 14.16
CGI - Conditional Growth Index CGP - Conditional Growth Percentile
199

Table E.1.12: Mathematics Grade 2 From Last Spring To Spring Conditional Growth Percentile
Conditional Growth
Start Status Growth CGP 20 30 40 45 50 55 60 70 80
%ile RIT Mean SD CGI -0.84 -0.52 -0.25 -0.13 0.00 0.13 0.25 0.52 0.84
10 159.83 17.06 6.51 Student 11.58 13.65 15.41 16.24 17.06 17.88 18.71 20.47 22.53
169.88 14.93 2.76 School 12.60 13.48 14.23 14.58 14.93 15.27 15.63 16.38 17.25
20 166.56 15.56 6.51 Student 10.08 12.14 13.91 14.74 15.56 16.37 17.20 18.97 21.03
173.16 14.16 2.76 School 11.83 12.71 13.46 13.81 14.16 14.50 14.86 15.61 16.48
25 169.11 14.99 6.51 Student 9.51 11.57 13.34 14.17 14.99 15.80 16.63 18.40 20.46
174.40 13.86 2.76 School 11.54 12.42 13.16 13.52 13.86 14.21 14.56 15.31 16.19
30 171.41 14.47 6.51 Student 9.00 11.06 12.83 13.66 14.47 15.29 16.12 17.89 19.95
175.52 13.60 2.76 School 11.28 12.15 12.90 13.25 13.60 13.95 14.30 15.05 15.93
35 173.53 14.00 6.51 Student 8.52 10.59 12.35 13.18 14.00 14.82 15.65 17.41 19.48
176.56 13.36 2.76 School 11.03 11.91 12.66 13.01 13.36 13.71 14.06 14.81 15.68
40 175.55 13.55 6.51 Student 8.07 10.14 11.90 12.73 13.55 14.37 15.20 16.96 19.03
177.54 13.13 2.76 School 10.80 11.68 12.43 12.78 13.13 13.47 13.83 14.58 15.45
45 177.50 13.11 6.51 Student 7.64 9.70 11.46 12.30 13.11 13.93 14.76 16.53 18.59
178.49 12.90 2.76 School 10.58 11.46 12.20 12.56 12.90 13.25 13.60 14.35 15.23
48 178.66 12.86 6.51 Student 7.38 9.44 11.21 12.04 12.86 13.67 14.50 16.27 18.33
179.05 12.77 2.76 School 10.45 11.32 12.07 12.42 12.77 13.12 13.47 14.22 15.10
50 179.42 12.68 6.51 Student 7.21 9.27 11.04 11.87 12.68 13.50 14.33 16.10 18.16
179.42 12.68 2.76 School 10.36 11.24 11.98 12.34 12.68 13.03 13.38 14.13 15.01
52 180.19 12.51 6.51 Student 7.04 9.10 10.86 11.70 12.51 13.33 14.16 15.93 17.99
179.80 12.60 2.76 School 10.27 11.15 11.90 12.25 12.60 12.94 13.30 14.04 14.92
55 181.35 12.26 6.51 Student 6.78 8.84 10.61 11.44 12.26 13.07 13.90 15.67 17.73
180.36 12.46 2.76 School 10.14 11.02 11.76 12.12 12.46 12.81 13.16 13.91 14.79
60 183.30 11.82 6.51 Student 6.34 8.41 10.17 11.00 11.82 12.64 13.47 15.23 17.30
181.31 12.24 2.76 School 9.92 10.79 11.54 11.89 12.24 12.59 12.94 13.69 14.57
65 185.32 11.37 6.51 Student 5.89 7.96 9.72 10.55 11.37 12.19 13.02 14.78 16.85
182.29 12.01 2.76 School 9.68 10.56 11.31 11.66 12.01 12.36 12.71 13.46 14.33
70 187.44 10.89 6.51 Student 5.42 7.48 9.25 10.08 10.89 11.71 12.54 14.31 16.37
183.33 11.77 2.76 School 9.44 10.32 11.07 11.42 11.77 12.11 12.47 13.21 14.09
75 189.74 10.38 6.51 Student 4.91 6.97 8.73 9.56 10.38 11.20 12.03 13.79 15.86
184.45 11.50 2.76 School 9.18 10.05 10.80 11.16 11.50 11.85 12.20 12.95 13.83
80 192.29 9.81 6.51 Student 4.33 6.40 8.16 8.99 9.81 10.63 11.46 13.22 15.29
185.69 11.21 2.76 School 8.89 9.76 10.51 10.86 11.21 11.56 11.91 12.66 13.54
85 195.27 9.15 6.51 Student 3.67 5.73 7.50 8.33 9.15 9.96 10.80 12.56 14.62
187.14 10.87 2.76 School 8.55 9.42 10.17 10.52 10.87 11.22 11.57 12.32 13.19
90 199.02 8.31 6.51 Student 2.83 4.90 6.66 7.49 8.31 9.13 9.96 11.72 13.79
188.97 10.44 2.76 School 8.12 8.99 9.74 10.09 10.44 10.79 11.14 11.89 12.77
CGI - Conditional Growth Index CGP - Conditional Growth Percentile
200

Table E.1.13: Mathematics Grade 2 From Fall To N Fall Conditional Growth Percentile
Conditional Growth
Start Status Growth CGP 20 30 40 45 50 55 60 70 80
%ile RIT Mean SD CGI -0.84 -0.52 -0.25 -0.13 0.00 0.13 0.25 0.52 0.84
10 159.95 14.97 6.91 Student 9.16 11.35 13.22 14.10 14.97 15.84 16.72 18.60 20.79
169.43 13.36 2.40 School 11.35 12.11 12.76 13.06 13.36 13.67 13.97 14.62 15.38
20 165.77 14.37 6.91 Student 8.56 10.75 12.62 13.51 14.37 15.24 16.13 18.00 20.19
171.99 13.32 2.40 School 11.30 12.06 12.71 13.02 13.32 13.62 13.93 14.58 15.34
25 167.98 14.15 6.91 Student 8.33 10.52 12.40 13.28 14.15 15.02 15.90 17.77 19.96
172.97 13.30 2.40 School 11.28 12.05 12.69 13.00 13.30 13.60 13.91 14.56 15.32
30 169.96 13.94 6.91 Student 8.13 10.32 12.19 13.08 13.94 14.81 15.70 17.57 19.76
173.84 13.29 2.40 School 11.27 12.03 12.68 12.99 13.29 13.59 13.89 14.54 15.30
35 171.80 13.76 6.91 Student 7.94 10.13 12.01 12.89 13.76 14.62 15.51 17.38 19.57
174.65 13.27 2.40 School 11.26 12.02 12.67 12.97 13.27 13.57 13.88 14.53 15.29
40 173.55 13.58 6.91 Student 7.76 9.95 11.83 12.71 13.58 14.45 15.33 17.20 19.39
175.42 13.26 2.40 School 11.24 12.00 12.65 12.96 13.26 13.56 13.87 14.52 15.28
45 175.23 13.40 6.91 Student 7.59 9.78 11.65 12.54 13.40 14.27 15.15 17.03 19.22
176.16 13.25 2.40 School 11.23 11.99 12.64 12.94 13.25 13.55 13.85 14.50 15.26
48 176.23 13.30 6.91 Student 7.49 9.68 11.55 12.43 13.30 14.17 15.05 16.93 19.12
176.60 13.24 2.40 School 11.22 11.98 12.63 12.94 13.24 13.54 13.85 14.50 15.26
50 176.90 13.23 6.91 Student 7.42 9.61 11.48 12.37 13.23 14.10 14.98 16.86 19.05
176.90 13.23 2.40 School 11.22 11.98 12.63 12.93 13.23 13.53 13.84 14.49 15.25
52 177.56 13.17 6.91 Student 7.35 9.54 11.41 12.30 13.17 14.03 14.92 16.79 18.98
177.19 13.23 2.40 School 11.21 11.97 12.62 12.93 13.23 13.53 13.84 14.49 15.25
55 178.56 13.06 6.91 Student 7.25 9.44 11.31 12.19 13.06 13.93 14.81 16.69 18.88
177.63 13.22 2.40 School 11.20 11.96 12.61 12.92 13.22 13.52 13.83 14.48 15.24
60 180.25 12.89 6.91 Student 7.07 9.27 11.14 12.02 12.89 13.76 14.64 16.51 18.71
178.37 13.21 2.40 School 11.19 11.95 12.60 12.91 13.21 13.51 13.81 14.46 15.23
65 181.99 12.71 6.91 Student 6.89 9.09 10.96 11.84 12.71 13.58 14.46 16.33 18.53
179.14 13.19 2.40 School 11.18 11.94 12.59 12.89 13.19 13.50 13.80 14.45 15.21
70 183.83 12.52 6.91 Student 6.71 8.90 10.77 11.65 12.52 13.39 14.27 16.15 18.34
179.95 13.18 2.40 School 11.16 11.92 12.57 12.88 13.18 13.48 13.79 14.44 15.20
75 185.82 12.32 6.91 Student 6.50 8.69 10.57 11.45 12.32 13.19 14.07 15.94 18.13
180.83 13.16 2.40 School 11.15 11.91 12.56 12.86 13.16 13.47 13.77 14.42 15.18
80 188.03 12.09 6.91 Student 6.28 8.47 10.34 11.22 12.09 12.96 13.84 15.72 17.91
181.80 13.15 2.40 School 11.13 11.89 12.54 12.85 13.15 13.45 13.75 14.40 15.17
85 190.60 11.83 6.91 Student 6.01 8.20 10.08 10.96 11.83 12.70 13.58 15.45 17.64
182.93 13.13 2.40 School 11.11 11.87 12.52 12.83 13.13 13.43 13.73 14.38 15.15
90 193.84 11.50 6.91 Student 5.68 7.87 9.74 10.63 11.50 12.36 13.25 15.12 17.31
184.36 13.10 2.40 School 11.08 11.85 12.50 12.80 13.10 13.40 13.71 14.36 15.12
CGI - Conditional Growth Index CGP - Conditional Growth Percentile
201

Table E.1.14: Mathematics Grade 2 From Fall To Spring Conditional Growth Percentile
Conditional Growth
Start Status Growth CGP 20 30 40 45 50 55 60 70 80
%ile RIT Mean SD CGI -0.84 -0.52 -0.25 -0.13 0.00 0.13 0.25 0.52 0.84
10 159.95 17.25 6.93 Student 11.41 13.61 15.49 16.38 17.25 18.12 19.00 20.88 23.08
169.43 15.32 2.66 School 13.08 13.92 14.64 14.98 15.32 15.65 15.99 16.71 17.56
20 165.77 16.55 6.93 Student 10.72 12.91 14.79 15.68 16.55 17.42 18.30 20.18 22.38
171.99 15.28 2.66 School 13.04 13.89 14.61 14.95 15.28 15.62 15.96 16.68 17.52
25 167.98 16.28 6.93 Student 10.45 12.65 14.53 15.41 16.28 17.15 18.04 19.92 22.11
172.97 15.27 2.66 School 13.03 13.87 14.59 14.93 15.27 15.60 15.94 16.66 17.51
30 169.96 16.04 6.93 Student 10.21 12.41 14.29 15.17 16.04 16.92 17.80 19.68 21.88
173.84 15.26 2.66 School 13.01 13.86 14.58 14.92 15.26 15.59 15.93 16.65 17.50
35 171.80 15.82 6.93 Student 9.99 12.19 14.07 14.95 15.82 16.69 17.58 19.46 21.65
174.65 15.24 2.66 School 13.00 13.85 14.57 14.91 15.24 15.58 15.92 16.64 17.49
40 173.55 15.61 6.93 Student 9.78 11.98 13.86 14.74 15.61 16.48 17.37 19.25 21.45
175.42 15.23 2.66 School 12.99 13.84 14.56 14.90 15.23 15.57 15.91 16.63 17.47
45 175.23 15.41 6.93 Student 9.58 11.78 13.66 14.54 15.41 16.28 17.17 19.04 21.24
176.16 15.22 2.66 School 12.98 13.83 14.55 14.89 15.22 15.56 15.90 16.62 17.46
48 176.23 15.29 6.93 Student 9.46 11.66 13.54 14.42 15.29 16.16 17.05 18.93 21.12
176.60 15.22 2.66 School 12.98 13.82 14.54 14.88 15.22 15.55 15.89 16.61 17.46
50 176.90 15.21 6.93 Student 9.38 11.58 13.46 14.34 15.21 16.08 16.97 18.85 21.04
176.90 15.21 2.66 School 12.97 13.82 14.54 14.88 15.21 15.55 15.89 16.61 17.45
52 177.56 15.13 6.93 Student 9.30 11.50 13.38 14.26 15.13 16.00 16.89 18.77 20.96
177.19 15.21 2.66 School 12.97 13.81 14.53 14.87 15.21 15.54 15.88 16.60 17.45
55 178.56 15.01 6.93 Student 9.18 11.38 13.26 14.14 15.01 15.88 16.77 18.65 20.84
177.63 15.20 2.66 School 12.96 13.81 14.53 14.87 15.20 15.54 15.88 16.60 17.44
60 180.25 14.81 6.93 Student 8.98 11.18 13.06 13.94 14.81 15.68 16.57 18.44 20.64
178.37 15.19 2.66 School 12.95 13.80 14.52 14.86 15.19 15.53 15.87 16.59 17.43
65 181.99 14.60 6.93 Student 8.77 10.97 12.85 13.73 14.60 15.47 16.36 18.23 20.43
179.14 15.18 2.66 School 12.94 13.78 14.51 14.85 15.18 15.52 15.86 16.58 17.42
70 183.83 14.38 6.93 Student 8.55 10.75 12.62 13.51 14.38 15.25 16.14 18.01 20.21
179.95 15.17 2.66 School 12.93 13.77 14.49 14.83 15.17 15.50 15.84 16.57 17.41
75 185.82 14.14 6.93 Student 8.31 10.51 12.39 13.27 14.14 15.01 15.90 17.78 19.97
180.83 15.16 2.66 School 12.92 13.76 14.48 14.82 15.16 15.49 15.83 16.55 17.40
80 188.03 13.88 6.93 Student 8.05 10.24 12.12 13.01 13.88 14.75 15.63 17.51 19.71
181.80 15.14 2.66 School 12.90 13.75 14.47 14.81 15.14 15.48 15.82 16.54 17.38
85 190.60 13.57 6.93 Student 7.74 9.93 11.81 12.70 13.57 14.44 15.32 17.20 19.40
182.93 15.13 2.66 School 12.89 13.73 14.45 14.79 15.13 15.46 15.80 16.52 17.37
90 193.84 13.18 6.93 Student 7.35 9.55 11.42 12.31 13.18 14.05 14.93 16.81 19.01
184.36 15.11 2.66 School 12.87 13.71 14.43 14.77 15.11 15.44 15.78 16.50 17.35
CGI - Conditional Growth Index CGP - Conditional Growth Percentile
202

Table E.1.15: Mathematics Grade 2 From Fall To Winter Conditional Growth Percentile
Conditional Growth
Start Status Growth CGP 20 30 40 45 50 55 60 70 80
%ile RIT Mean SD CGI -0.84 -0.52 -0.25 -0.13 0.00 0.13 0.25 0.52 0.84
10 159.95 11.03 5.21 Student 6.64 8.30 9.71 10.38 11.03 11.69 12.35 13.77 15.42
169.43 9.56 1.52 School 8.28 8.76 9.17 9.37 9.56 9.75 9.94 10.35 10.84
20 165.77 10.50 5.21 Student 6.12 7.77 9.18 9.85 10.50 11.16 11.83 13.24 14.89
171.99 9.54 1.52 School 8.25 8.74 9.15 9.34 9.54 9.73 9.92 10.33 10.82
25 167.98 10.30 5.21 Student 5.92 7.57 8.98 9.65 10.30 10.96 11.62 13.04 14.69
172.97 9.53 1.52 School 8.25 8.73 9.14 9.34 9.53 9.72 9.91 10.33 10.81
30 169.96 10.12 5.21 Student 5.74 7.39 8.80 9.47 10.12 10.78 11.45 12.86 14.51
173.84 9.52 1.52 School 8.24 8.72 9.13 9.33 9.52 9.71 9.91 10.32 10.80
35 171.80 9.96 5.21 Student 5.57 7.22 8.64 9.30 9.96 10.61 11.28 12.69 14.35
174.65 9.51 1.52 School 8.23 8.72 9.13 9.32 9.51 9.71 9.90 10.31 10.79
40 173.55 9.80 5.21 Student 5.41 7.07 8.48 9.14 9.80 10.45 11.12 12.53 14.19
175.42 9.51 1.52 School 8.23 8.71 9.12 9.32 9.51 9.70 9.89 10.31 10.79
45 175.23 9.65 5.21 Student 5.26 6.91 8.33 8.99 9.65 10.30 10.97 12.38 14.03
176.16 9.50 1.52 School 8.22 8.70 9.12 9.31 9.50 9.69 9.89 10.30 10.78
48 176.23 9.56 5.21 Student 5.17 6.82 8.23 8.90 9.56 10.21 10.88 12.29 13.94
176.60 9.50 1.52 School 8.22 8.70 9.11 9.31 9.50 9.69 9.88 10.30 10.78
50 176.90 9.50 5.21 Student 5.11 6.76 8.17 8.84 9.50 10.15 10.82 12.23 13.88
176.90 9.50 1.52 School 8.21 8.70 9.11 9.30 9.50 9.69 9.88 10.29 10.78
52 177.56 9.44 5.21 Student 5.05 6.70 8.11 8.78 9.44 10.09 10.76 12.17 13.82
177.19 9.49 1.52 School 8.21 8.70 9.11 9.30 9.49 9.68 9.88 10.29 10.77
55 178.56 9.35 5.21 Student 4.96 6.61 8.02 8.69 9.35 10.00 10.67 12.08 13.73
177.63 9.49 1.52 School 8.21 8.69 9.10 9.30 9.49 9.68 9.88 10.29 10.77
60 180.25 9.19 5.21 Student 4.80 6.46 7.87 8.54 9.19 9.85 10.51 11.93 13.58
178.37 9.48 1.52 School 8.20 8.69 9.10 9.29 9.48 9.67 9.87 10.28 10.76
65 181.99 9.03 5.21 Student 4.65 6.30 7.71 8.38 9.03 9.69 10.35 11.77 13.42
179.14 9.48 1.52 School 8.20 8.68 9.09 9.29 9.48 9.67 9.86 10.28 10.76
70 183.83 8.87 5.21 Student 4.48 6.13 7.55 8.21 8.87 9.52 10.19 11.60 13.26
179.95 9.47 1.52 School 8.19 8.67 9.09 9.28 9.47 9.66 9.86 10.27 10.75
75 185.82 8.69 5.21 Student 4.30 5.95 7.37 8.03 8.69 9.34 10.01 11.42 13.08
180.83 9.46 1.52 School 8.18 8.67 9.08 9.27 9.46 9.65 9.85 10.26 10.74
80 188.03 8.49 5.21 Student 4.10 5.75 7.17 7.83 8.49 9.14 9.81 11.22 12.88
181.80 9.46 1.52 School 8.17 8.66 9.07 9.26 9.46 9.65 9.84 10.25 10.74
85 190.60 8.25 5.21 Student 3.87 5.52 6.93 7.60 8.25 8.91 9.57 10.99 12.64
182.93 9.45 1.52 School 8.17 8.65 9.06 9.26 9.45 9.64 9.83 10.24 10.73
90 193.84 7.96 5.21 Student 3.57 5.23 6.64 7.30 7.96 8.61 9.28 10.69 12.35
184.36 9.43 1.52 School 8.15 8.64 9.05 9.24 9.43 9.63 9.82 10.23 10.72
CGI - Conditional Growth Index CGP - Conditional Growth Percentile
203

Table E.1.16: Mathematics Grade 2 From Winter To Spring Conditional Growth Percentile
Conditional Growth
Start Status Growth CGP 20 30 40 45 50 55 60 70 80
%ile RIT Mean SD CGI -0.84 -0.52 -0.25 -0.13 0.00 0.13 0.25 0.52 0.84
10 169.59 6.32 4.87 Student 2.22 3.76 5.09 5.71 6.32 6.93 7.55 8.88 10.42
178.73 5.39 1.11 School 4.45 4.80 5.11 5.25 5.39 5.53 5.67 5.97 6.33
20 175.36 6.11 4.87 Student 2.01 3.56 4.88 5.50 6.11 6.73 7.35 8.67 10.21
181.36 5.50 1.11 School 4.56 4.92 5.22 5.36 5.50 5.64 5.78 6.08 6.44
25 177.55 6.03 4.87 Student 1.93 3.48 4.80 5.42 6.03 6.65 7.27 8.59 10.14
182.36 5.54 1.11 School 4.61 4.96 5.26 5.40 5.54 5.68 5.83 6.13 6.48
30 179.52 5.96 4.87 Student 1.86 3.41 4.73 5.35 5.96 6.58 7.20 8.52 10.07
183.26 5.58 1.11 School 4.65 5.00 5.30 5.44 5.58 5.72 5.86 6.17 6.52
35 181.34 5.90 4.87 Student 1.80 3.34 4.66 5.29 5.90 6.51 7.13 8.45 10.00
184.09 5.62 1.11 School 4.68 5.03 5.34 5.48 5.62 5.76 5.90 6.20 6.55
40 183.07 5.84 4.87 Student 1.73 3.28 4.60 5.22 5.84 6.45 7.07 8.39 9.94
184.88 5.65 1.11 School 4.71 5.07 5.37 5.51 5.65 5.79 5.93 6.24 6.59
45 184.74 5.78 4.87 Student 1.67 3.22 4.54 5.16 5.78 6.39 7.01 8.33 9.88
185.64 5.68 1.11 School 4.75 5.10 5.40 5.54 5.68 5.82 5.97 6.27 6.62
48 185.73 5.74 4.87 Student 1.64 3.18 4.51 5.13 5.74 6.35 6.98 8.30 9.84
186.09 5.70 1.11 School 4.77 5.12 5.42 5.56 5.70 5.84 5.99 6.29 6.64
50 186.39 5.72 4.87 Student 1.61 3.16 4.48 5.10 5.72 6.33 6.95 8.27 9.82
186.39 5.72 1.11 School 4.78 5.13 5.43 5.58 5.72 5.86 6.00 6.30 6.65
52 187.05 5.69 4.87 Student 1.59 3.14 4.46 5.08 5.69 6.31 6.93 8.25 9.79
186.69 5.73 1.11 School 4.79 5.15 5.45 5.59 5.73 5.87 6.01 6.31 6.67
55 188.04 5.66 4.87 Student 1.56 3.10 4.42 5.05 5.66 6.27 6.89 8.21 9.76
187.14 5.75 1.11 School 4.81 5.17 5.47 5.61 5.75 5.89 6.03 6.33 6.69
60 189.71 5.60 4.87 Student 1.50 3.04 4.36 4.98 5.60 6.21 6.83 8.15 9.70
187.91 5.78 1.11 School 4.84 5.20 5.50 5.64 5.78 5.92 6.06 6.37 6.72
65 191.44 5.54 4.87 Student 1.43 2.98 4.30 4.92 5.54 6.15 6.77 8.09 9.64
188.69 5.82 1.11 School 4.88 5.23 5.53 5.68 5.82 5.96 6.10 6.40 6.75
70 193.27 5.47 4.87 Student 1.37 2.91 4.23 4.86 5.47 6.08 6.70 8.03 9.57
189.53 5.85 1.11 School 4.91 5.27 5.57 5.71 5.85 5.99 6.13 6.43 6.79
75 195.23 5.40 4.87 Student 1.30 2.84 4.16 4.79 5.40 6.01 6.63 7.95 9.50
190.42 5.89 1.11 School 4.95 5.31 5.61 5.75 5.89 6.03 6.17 6.47 6.83
80 197.42 5.32 4.87 Student 1.22 2.76 4.09 4.71 5.32 5.93 6.56 7.88 9.42
191.42 5.93 1.11 School 5.00 5.35 5.65 5.79 5.93 6.07 6.21 6.52 6.87
85 199.98 5.23 4.87 Student 1.13 2.67 3.99 4.62 5.23 5.84 6.46 7.78 9.33
192.59 5.98 1.11 School 5.05 5.40 5.70 5.84 5.98 6.12 6.26 6.57 6.92
90 203.19 5.11 4.87 Student 1.01 2.56 3.88 4.50 5.11 5.73 6.35 7.67 9.21
194.05 6.05 1.11 School 5.11 5.46 5.76 5.91 6.05 6.18 6.33 6.63 6.98
CGI - Conditional Growth Index CGP - Conditional Growth Percentile
204

Table E.1.17: Mathematics Grade 3 From Last Winter To Winter Conditional Growth Percentile
Conditional Growth
Start Status Growth CGP 20 30 40 45 50 55 60 70 80
%ile RIT Mean SD CGI -0.84 -0.52 -0.25 -0.13 0.00 0.13 0.25 0.52 0.84
10 169.13 13.78 5.85 Student 8.85 10.71 12.30 13.04 13.78 14.51 15.26 16.85 18.71
178.32 12.51 2.09 School 10.75 11.42 11.98 12.25 12.51 12.77 13.04 13.60 14.26
20 174.84 13.32 5.85 Student 8.39 10.25 11.84 12.59 13.32 14.06 14.80 16.39 18.25
180.88 12.49 2.09 School 10.73 11.39 11.96 12.23 12.49 12.75 13.02 13.58 14.24
25 177.01 13.15 5.85 Student 8.22 10.08 11.66 12.41 13.15 13.88 14.63 16.22 18.07
181.85 12.48 2.09 School 10.72 11.38 11.95 12.22 12.48 12.74 13.01 13.57 14.23
30 178.96 12.99 5.85 Student 8.06 9.92 11.51 12.25 12.99 13.73 14.47 16.06 17.92
182.72 12.47 2.09 School 10.72 11.38 11.94 12.21 12.47 12.73 13.00 13.56 14.23
35 180.76 12.85 5.85 Student 7.92 9.78 11.36 12.11 12.85 13.58 14.33 15.92 17.77
183.53 12.46 2.09 School 10.71 11.37 11.94 12.20 12.46 12.73 12.99 13.56 14.22
40 182.48 12.71 5.85 Student 7.78 9.64 11.22 11.97 12.71 13.44 14.19 15.78 17.63
184.29 12.46 2.09 School 10.70 11.36 11.93 12.19 12.46 12.72 12.99 13.55 14.21
45 184.13 12.57 5.85 Student 7.65 9.50 11.09 11.84 12.57 13.31 14.06 15.64 17.50
185.03 12.45 2.09 School 10.70 11.36 11.92 12.19 12.45 12.71 12.98 13.54 14.21
48 185.11 12.50 5.85 Student 7.57 9.43 11.01 11.76 12.50 13.23 13.98 15.57 17.42
185.47 12.45 2.09 School 10.69 11.35 11.92 12.18 12.45 12.71 12.97 13.54 14.20
50 185.76 12.44 5.85 Student 7.52 9.37 10.96 11.71 12.44 13.18 13.93 15.51 17.37
185.76 12.44 2.09 School 10.69 11.35 11.92 12.18 12.44 12.71 12.97 13.54 14.20
52 186.42 12.39 5.85 Student 7.46 9.32 10.91 11.66 12.39 13.13 13.87 15.46 17.32
186.06 12.44 2.09 School 10.69 11.35 11.91 12.18 12.44 12.70 12.97 13.53 14.20
55 187.40 12.31 5.85 Student 7.39 9.24 10.83 11.58 12.31 13.05 13.80 15.38 17.24
186.49 12.44 2.09 School 10.68 11.34 11.91 12.18 12.44 12.70 12.97 13.53 14.19
60 189.05 12.18 5.85 Student 7.25 9.11 10.70 11.44 12.18 12.92 13.66 15.25 17.11
187.24 12.43 2.09 School 10.68 11.34 11.90 12.17 12.43 12.69 12.96 13.52 14.19
65 190.76 12.04 5.85 Student 7.11 8.97 10.56 11.31 12.04 12.78 13.53 15.11 16.97
188.00 12.42 2.09 School 10.67 11.33 11.90 12.16 12.42 12.69 12.95 13.52 14.18
70 192.57 11.90 5.85 Student 6.97 8.83 10.41 11.16 11.90 12.63 13.38 14.97 16.82
188.81 12.42 2.09 School 10.66 11.32 11.89 12.15 12.42 12.68 12.94 13.51 14.17
75 194.52 11.74 5.85 Student 6.81 8.67 10.26 11.01 11.74 12.48 13.22 14.81 16.67
189.68 12.41 2.09 School 10.65 11.32 11.88 12.15 12.41 12.67 12.94 13.50 14.16
80 196.69 11.57 5.85 Student 6.64 8.50 10.08 10.83 11.57 12.30 13.05 14.64 16.49
190.65 12.40 2.09 School 10.65 11.31 11.87 12.14 12.40 12.66 12.93 13.49 14.16
85 199.21 11.36 5.85 Student 6.44 8.29 9.88 10.63 11.36 12.10 12.85 14.43 16.29
191.78 12.39 2.09 School 10.64 11.30 11.86 12.13 12.39 12.65 12.92 13.48 14.15
90 202.39 11.11 5.85 Student 6.18 8.04 9.63 10.37 11.11 11.84 12.59 14.18 16.04
193.21 12.38 2.09 School 10.62 11.28 11.85 12.12 12.38 12.64 12.91 13.47 14.13
CGI - Conditional Growth Index CGP - Conditional Growth Percentile
205

Table E.1.18: Mathematics Grade 3 From Last Spring To Spring Conditional Growth Percentile
Conditional Growth
Start Status Growth CGP 20 30 40 45 50 55 60 70 80
%ile RIT Mean SD CGI -0.84 -0.52 -0.25 -0.13 0.00 0.13 0.25 0.52 0.84
10 174.14 13.71 6.59 Student 8.16 10.25 12.04 12.88 13.71 14.54 15.38 17.16 19.25
183.53 12.35 2.71 School 10.07 10.93 11.66 12.01 12.35 12.69 13.03 13.77 14.63
20 180.13 13.05 6.59 Student 7.51 9.60 11.38 12.23 13.05 13.88 14.72 16.51 18.60
186.30 12.16 2.71 School 9.88 10.74 11.48 11.82 12.16 12.50 12.85 13.58 14.44
25 182.40 12.81 6.59 Student 7.26 9.35 11.14 11.98 12.81 13.63 14.48 16.26 18.35
187.35 12.09 2.71 School 9.81 10.67 11.41 11.75 12.09 12.43 12.78 13.51 14.37
30 184.45 12.58 6.59 Student 7.04 9.13 10.91 11.76 12.58 13.41 14.25 16.04 18.13
188.29 12.03 2.71 School 9.75 10.61 11.34 11.69 12.03 12.37 12.71 13.45 14.30
35 186.34 12.38 6.59 Student 6.83 8.92 10.71 11.55 12.38 13.21 14.05 15.83 17.92
189.17 11.97 2.71 School 9.69 10.55 11.28 11.63 11.97 12.31 12.65 13.39 14.25
40 188.14 12.18 6.59 Student 6.63 8.73 10.51 11.35 12.18 13.01 13.85 15.64 17.73
190.00 11.91 2.71 School 9.64 10.49 11.23 11.57 11.91 12.25 12.60 13.33 14.19
45 189.88 11.99 6.59 Student 6.45 8.54 10.32 11.16 11.99 12.82 13.66 15.45 17.54
190.80 11.86 2.71 School 9.58 10.44 11.17 11.52 11.86 12.20 12.54 13.28 14.14
48 190.91 11.88 6.59 Student 6.33 8.42 10.21 11.05 11.88 12.71 13.55 15.34 17.43
191.28 11.83 2.71 School 9.55 10.41 11.14 11.49 11.83 12.17 12.51 13.25 14.10
50 191.59 11.81 6.59 Student 6.26 8.35 10.14 10.98 11.81 12.63 13.48 15.26 17.35
191.59 11.81 2.71 School 9.53 10.39 11.12 11.47 11.81 12.15 12.49 13.22 14.08
52 192.27 11.73 6.59 Student 6.18 8.27 10.06 10.90 11.73 12.56 13.40 15.19 17.28
191.91 11.78 2.71 School 9.51 10.37 11.10 11.44 11.78 12.12 12.47 13.20 14.06
55 193.30 11.62 6.59 Student 6.07 8.16 9.95 10.79 11.62 12.45 13.29 15.08 17.17
192.38 11.75 2.71 School 9.47 10.33 11.07 11.41 11.75 12.09 12.44 13.17 14.03
60 195.04 11.43 6.59 Student 5.88 7.97 9.76 10.60 11.43 12.26 13.10 14.89 16.98
193.18 11.70 2.71 School 9.42 10.28 11.01 11.36 11.70 12.04 12.38 13.12 13.98
65 196.84 11.23 6.59 Student 5.69 7.78 9.56 10.41 11.23 12.06 12.90 14.69 16.78
194.01 11.64 2.71 School 9.36 10.22 10.96 11.30 11.64 11.98 12.33 13.06 13.92
70 198.73 11.03 6.59 Student 5.48 7.57 9.36 10.20 11.03 11.86 12.70 14.48 16.57
194.89 11.58 2.71 School 9.31 10.16 10.90 11.24 11.58 11.92 12.27 13.00 13.86
75 200.78 10.80 6.59 Student 5.26 7.35 9.13 9.98 10.80 11.63 12.47 14.26 16.35
195.83 11.52 2.71 School 9.24 10.10 10.83 11.18 11.52 11.86 12.21 12.94 13.80
80 203.05 10.56 6.59 Student 5.01 7.10 8.89 9.73 10.56 11.38 12.23 14.01 16.10
196.88 11.45 2.71 School 9.17 10.03 10.76 11.11 11.45 11.79 12.14 12.87 13.73
85 205.71 10.27 6.59 Student 4.72 6.81 8.60 9.44 10.27 11.10 11.94 13.72 15.81
198.11 11.37 2.71 School 9.09 9.95 10.68 11.03 11.37 11.71 12.05 12.79 13.64
90 209.04 9.90 6.59 Student 4.36 6.45 8.23 9.08 9.90 10.73 11.57 13.36 15.45
199.65 11.26 2.71 School 8.99 9.84 10.58 10.92 11.26 11.60 11.95 12.68 13.54
CGI - Conditional Growth Index CGP - Conditional Growth Percentile
206

Table E.1.19: Mathematics Grade 3 From Fall To N Fall Conditional Growth Percentile
Conditional Growth
Start Status Growth CGP 20 30 40 45 50 55 60 70 80
%ile RIT Mean SD CGI -0.84 -0.52 -0.25 -0.13 0.00 0.13 0.25 0.52 0.84
10 173.61 11.74 6.40 Student 6.35 8.38 10.12 10.94 11.74 12.55 13.36 15.10 17.13
182.87 10.86 1.99 School 9.19 9.82 10.36 10.61 10.86 11.11 11.36 11.90 12.53
20 179.37 11.61 6.40 Student 6.22 8.25 9.99 10.81 11.61 12.42 13.23 14.97 17.00
185.46 11.03 1.99 School 9.36 9.99 10.53 10.78 11.03 11.28 11.54 12.07 12.71
25 181.56 11.56 6.40 Student 6.17 8.21 9.94 10.76 11.56 12.37 13.18 14.92 16.95
186.44 11.10 1.99 School 9.42 10.06 10.59 10.85 11.10 11.35 11.60 12.14 12.77
30 183.53 11.52 6.40 Student 6.13 8.16 9.90 10.71 11.52 12.32 13.14 14.88 16.91
187.32 11.16 1.99 School 9.48 10.11 10.65 10.91 11.16 11.41 11.66 12.20 12.83
35 185.35 11.48 6.40 Student 6.09 8.12 9.86 10.67 11.48 12.28 13.10 14.83 16.86
188.14 11.21 1.99 School 9.54 10.17 10.71 10.96 11.21 11.46 11.72 12.25 12.88
40 187.08 11.44 6.40 Student 6.05 8.08 9.82 10.63 11.44 12.24 13.06 14.80 16.83
188.91 11.26 1.99 School 9.59 10.22 10.76 11.01 11.26 11.51 11.77 12.31 12.94
45 188.76 11.40 6.40 Student 6.01 8.04 9.78 10.60 11.40 12.21 13.02 14.76 16.79
189.66 11.31 1.99 School 9.64 10.27 10.81 11.06 11.31 11.56 11.82 12.36 12.99
48 189.75 11.38 6.40 Student 5.99 8.02 9.76 10.57 11.38 12.18 13.00 14.74 16.77
190.11 11.34 1.99 School 9.67 10.30 10.84 11.09 11.34 11.59 11.85 12.39 13.02
50 190.40 11.36 6.40 Student 5.98 8.01 9.74 10.56 11.36 12.17 12.99 14.72 16.75
190.40 11.36 1.99 School 9.69 10.32 10.86 11.11 11.36 11.61 11.87 12.41 13.04
52 191.06 11.35 6.40 Student 5.96 7.99 9.73 10.54 11.35 12.15 12.97 14.71 16.74
190.70 11.38 1.99 School 9.71 10.34 10.88 11.13 11.38 11.63 11.89 12.43 13.06
55 192.05 11.33 6.40 Student 5.94 7.97 9.70 10.52 11.33 12.13 12.95 14.68 16.71
191.14 11.41 1.99 School 9.74 10.37 10.91 11.16 11.41 11.66 11.92 12.46 13.09
60 193.72 11.29 6.40 Student 5.90 7.93 9.67 10.48 11.29 12.09 12.91 14.65 16.68
191.89 11.46 1.99 School 9.79 10.42 10.96 11.21 11.46 11.71 11.97 12.51 13.14
65 195.45 11.25 6.40 Student 5.86 7.89 9.63 10.45 11.25 12.05 12.87 14.61 16.64
192.67 11.52 1.99 School 9.84 10.47 11.01 11.27 11.52 11.77 12.02 12.56 13.19
70 197.27 11.21 6.40 Student 5.82 7.85 9.59 10.40 11.21 12.01 12.83 14.57 16.60
193.49 11.57 1.99 School 9.90 10.53 11.07 11.32 11.57 11.82 12.07 12.61 13.24
75 199.24 11.16 6.40 Student 5.78 7.81 9.54 10.36 11.16 11.97 12.79 14.52 16.55
194.37 11.63 1.99 School 9.96 10.59 11.13 11.38 11.63 11.88 12.13 12.67 13.30
80 201.43 11.12 6.40 Student 5.73 7.76 9.49 10.31 11.12 11.92 12.74 14.47 16.50
195.35 11.70 1.99 School 10.02 10.65 11.19 11.45 11.70 11.94 12.20 12.74 13.37
85 203.98 11.06 6.40 Student 5.67 7.70 9.44 10.25 11.06 11.86 12.68 14.42 16.45
196.49 11.77 1.99 School 10.10 10.73 11.27 11.52 11.77 12.02 12.28 12.81 13.44
90 207.20 10.99 6.40 Student 5.60 7.63 9.36 10.18 10.99 11.79 12.61 14.34 16.37
197.94 11.87 1.99 School 10.20 10.83 11.36 11.62 11.87 12.12 12.37 12.91 13.54
CGI - Conditional Growth Index CGP - Conditional Growth Percentile
207
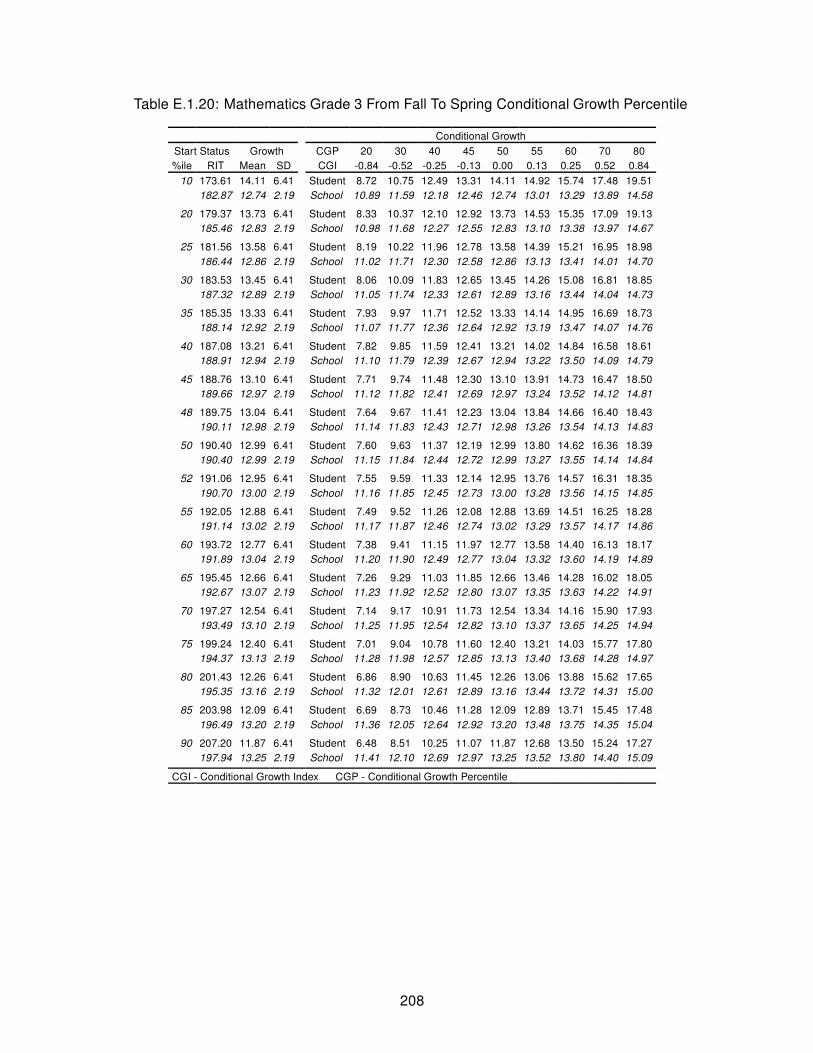
Table E.1.20: Mathematics Grade 3 From Fall To Spring Conditional Growth Percentile
Conditional Growth
Start Status Growth CGP 20 30 40 45 50 55 60 70 80
%ile RIT Mean SD CGI -0.84 -0.52 -0.25 -0.13 0.00 0.13 0.25 0.52 0.84
10 173.61 14.11 6.41 Student 8.72 10.75 12.49 13.31 14.11 14.92 15.74 17.48 19.51
182.87 12.74 2.19 School 10.89 11.59 12.18 12.46 12.74 13.01 13.29 13.89 14.58
20 179.37 13.73 6.41 Student 8.33 10.37 12.10 12.92 13.73 14.53 15.35 17.09 19.13
185.46 12.83 2.19 School 10.98 11.68 12.27 12.55 12.83 13.10 13.38 13.97 14.67
25 181.56 13.58 6.41 Student 8.19 10.22 11.96 12.78 13.58 14.39 15.21 16.95 18.98
186.44 12.86 2.19 School 11.02 11.71 12.30 12.58 12.86 13.13 13.41 14.01 14.70
30 183.53 13.45 6.41 Student 8.06 10.09 11.83 12.65 13.45 14.26 15.08 16.81 18.85
187.32 12.89 2.19 School 11.05 11.74 12.33 12.61 12.89 13.16 13.44 14.04 14.73
35 185.35 13.33 6.41 Student 7.93 9.97 11.71 12.52 13.33 14.14 14.95 16.69 18.73
188.14 12.92 2.19 School 11.07 11.77 12.36 12.64 12.92 13.19 13.47 14.07 14.76
40 187.08 13.21 6.41 Student 7.82 9.85 11.59 12.41 13.21 14.02 14.84 16.58 18.61
188.91 12.94 2.19 School 11.10 11.79 12.39 12.67 12.94 13.22 13.50 14.09 14.79
45 188.76 13.10 6.41 Student 7.71 9.74 11.48 12.30 13.10 13.91 14.73 16.47 18.50
189.66 12.97 2.19 School 11.12 11.82 12.41 12.69 12.97 13.24 13.52 14.12 14.81
48 189.75 13.04 6.41 Student 7.64 9.67 11.41 12.23 13.04 13.84 14.66 16.40 18.43
190.11 12.98 2.19 School 11.14 11.83 12.43 12.71 12.98 13.26 13.54 14.13 14.83
50 190.40 12.99 6.41 Student 7.60 9.63 11.37 12.19 12.99 13.80 14.62 16.36 18.39
190.40 12.99 2.19 School 11.15 11.84 12.44 12.72 12.99 13.27 13.55 14.14 14.84
52 191.06 12.95 6.41 Student 7.55 9.59 11.33 12.14 12.95 13.76 14.57 16.31 18.35
190.70 13.00 2.19 School 11.16 11.85 12.45 12.73 13.00 13.28 13.56 14.15 14.85
55 192.05 12.88 6.41 Student 7.49 9.52 11.26 12.08 12.88 13.69 14.51 16.25 18.28
191.14 13.02 2.19 School 11.17 11.87 12.46 12.74 13.02 13.29 13.57 14.17 14.86
60 193.72 12.77 6.41 Student 7.38 9.41 11.15 11.97 12.77 13.58 14.40 16.13 18.17
191.89 13.04 2.19 School 11.20 11.90 12.49 12.77 13.04 13.32 13.60 14.19 14.89
65 195.45 12.66 6.41 Student 7.26 9.29 11.03 11.85 12.66 13.46 14.28 16.02 18.05
192.67 13.07 2.19 School 11.23 11.92 12.52 12.80 13.07 13.35 13.63 14.22 14.91
70 197.27 12.54 6.41 Student 7.14 9.17 10.91 11.73 12.54 13.34 14.16 15.90 17.93
193.49 13.10 2.19 School 11.25 11.95 12.54 12.82 13.10 13.37 13.65 14.25 14.94
75 199.24 12.40 6.41 Student 7.01 9.04 10.78 11.60 12.40 13.21 14.03 15.77 17.80
194.37 13.13 2.19 School 11.28 11.98 12.57 12.85 13.13 13.40 13.68 14.28 14.97
80 201.43 12.26 6.41 Student 6.86 8.90 10.63 11.45 12.26 13.06 13.88 15.62 17.65
195.35 13.16 2.19 School 11.32 12.01 12.61 12.89 13.16 13.44 13.72 14.31 15.00
85 203.98 12.09 6.41 Student 6.69 8.73 10.46 11.28 12.09 12.89 13.71 15.45 17.48
196.49 13.20 2.19 School 11.36 12.05 12.64 12.92 13.20 13.48 13.75 14.35 15.04
90 207.20 11.87 6.41 Student 6.48 8.51 10.25 11.07 11.87 12.68 13.50 15.24 17.27
197.94 13.25 2.19 School 11.41 12.10 12.69 12.97 13.25 13.52 13.80 14.40 15.09
CGI - Conditional Growth Index CGP - Conditional Growth Percentile
208

Table E.1.21: Mathematics Grade 3 From Fall To Winter Conditional Growth Percentile
Conditional Growth
Start Status Growth CGP 20 30 40 45 50 55 60 70 80
%ile RIT Mean SD CGI -0.84 -0.52 -0.25 -0.13 0.00 0.13 0.25 0.52 0.84
10 173.61 8.82 5.02 Student 4.60 6.19 7.55 8.19 8.82 9.45 10.09 11.45 13.04
182.87 7.66 1.25 School 6.61 7.00 7.34 7.50 7.66 7.82 7.98 8.32 8.71
20 179.37 8.47 5.02 Student 4.25 5.84 7.20 7.84 8.47 9.10 9.74 11.10 12.70
185.46 7.71 1.25 School 6.66 7.05 7.39 7.55 7.71 7.87 8.03 8.37 8.76
25 181.56 8.34 5.02 Student 4.12 5.71 7.07 7.71 8.34 8.97 9.61 10.97 12.56
186.44 7.73 1.25 School 6.68 7.07 7.41 7.57 7.73 7.89 8.05 8.39 8.78
30 183.53 8.22 5.02 Student 4.00 5.59 6.95 7.59 8.22 8.85 9.49 10.85 12.44
187.32 7.75 1.25 School 6.69 7.09 7.43 7.59 7.75 7.90 8.06 8.40 8.80
35 185.35 8.11 5.02 Student 3.89 5.48 6.84 7.48 8.11 8.74 9.38 10.74 12.33
188.14 7.76 1.25 School 6.71 7.11 7.44 7.60 7.76 7.92 8.08 8.42 8.82
40 187.08 8.01 5.02 Student 3.78 5.38 6.74 7.38 8.01 8.64 9.28 10.64 12.23
188.91 7.78 1.25 School 6.72 7.12 7.46 7.62 7.78 7.93 8.09 8.43 8.83
45 188.76 7.91 5.02 Student 3.68 5.27 6.63 7.27 7.91 8.54 9.18 10.54 12.13
189.66 7.79 1.25 School 6.74 7.13 7.47 7.63 7.79 7.95 8.11 8.45 8.85
48 189.75 7.85 5.02 Student 3.62 5.21 6.57 7.22 7.85 8.48 9.12 10.48 12.07
190.11 7.80 1.25 School 6.75 7.14 7.48 7.64 7.80 7.96 8.12 8.46 8.85
50 190.40 7.81 5.02 Student 3.58 5.17 6.53 7.18 7.81 8.44 9.08 10.44 12.03
190.40 7.81 1.25 School 6.75 7.15 7.49 7.65 7.81 7.96 8.12 8.46 8.86
52 191.06 7.77 5.02 Student 3.54 5.14 6.49 7.14 7.77 8.40 9.04 10.40 11.99
190.70 7.81 1.25 School 6.76 7.15 7.49 7.65 7.81 7.97 8.13 8.47 8.87
55 192.05 7.71 5.02 Student 3.48 5.08 6.43 7.08 7.71 8.34 8.98 10.34 11.93
191.14 7.82 1.25 School 6.77 7.16 7.50 7.66 7.82 7.98 8.14 8.48 8.87
60 193.72 7.60 5.02 Student 3.38 4.97 6.33 6.97 7.60 8.24 8.88 10.24 11.83
191.89 7.83 1.25 School 6.78 7.18 7.52 7.68 7.83 7.99 8.15 8.49 8.89
65 195.45 7.50 5.02 Student 3.28 4.87 6.23 6.87 7.50 8.13 8.77 10.13 11.72
192.67 7.85 1.25 School 6.80 7.19 7.53 7.69 7.85 8.01 8.17 8.51 8.90
70 197.27 7.39 5.02 Student 3.17 4.76 6.12 6.76 7.39 8.02 8.66 10.02 11.61
193.49 7.87 1.25 School 6.81 7.21 7.55 7.71 7.87 8.02 8.18 8.52 8.92
75 199.24 7.27 5.02 Student 3.05 4.64 6.00 6.64 7.27 7.90 8.54 9.90 11.49
194.37 7.88 1.25 School 6.83 7.23 7.57 7.72 7.88 8.04 8.20 8.54 8.94
80 201.43 7.14 5.02 Student 2.92 4.51 5.87 6.51 7.14 7.77 8.41 9.77 11.36
195.35 7.90 1.25 School 6.85 7.24 7.58 7.74 7.90 8.06 8.22 8.56 8.96
85 203.98 6.98 5.02 Student 2.76 4.35 5.71 6.35 6.98 7.61 8.25 9.61 11.21
196.49 7.92 1.25 School 6.87 7.27 7.61 7.77 7.92 8.08 8.24 8.58 8.98
90 207.20 6.79 5.02 Student 2.57 4.16 5.52 6.16 6.79 7.42 8.06 9.42 11.01
197.94 7.95 1.25 School 6.90 7.29 7.63 7.79 7.95 8.11 8.27 8.61 9.01
CGI - Conditional Growth Index CGP - Conditional Growth Percentile
209

Table E.1.22: Mathematics Grade 3 From Winter To Spring Conditional Growth Percentile
Conditional Growth
Start Status Growth CGP 20 30 40 45 50 55 60 70 80
%ile RIT Mean SD CGI -0.84 -0.52 -0.25 -0.13 0.00 0.13 0.25 0.52 0.84
10 181.17 5.59 4.72 Student 1.62 3.12 4.40 5.00 5.59 6.19 6.79 8.07 9.57
190.36 4.83 0.90 School 4.08 4.36 4.61 4.72 4.83 4.95 5.06 5.31 5.59
20 187.02 5.45 4.72 Student 1.48 2.98 4.26 4.86 5.45 6.05 6.65 7.93 9.43
193.06 4.96 0.90 School 4.20 4.48 4.73 4.84 4.96 5.07 5.18 5.43 5.72
25 189.24 5.40 4.72 Student 1.43 2.93 4.21 4.81 5.40 5.99 6.60 7.88 9.37
194.08 5.00 0.90 School 4.24 4.53 4.77 4.89 5.00 5.12 5.23 5.48 5.76
30 191.24 5.35 4.72 Student 1.38 2.88 4.16 4.76 5.35 5.95 6.55 7.83 9.33
195.00 5.04 0.90 School 4.28 4.57 4.81 4.93 5.04 5.16 5.27 5.52 5.80
35 193.09 5.31 4.72 Student 1.34 2.83 4.11 4.72 5.31 5.90 6.51 7.79 9.28
195.85 5.08 0.90 School 4.32 4.61 4.85 4.97 5.08 5.20 5.31 5.55 5.84
40 194.84 5.27 4.72 Student 1.29 2.79 4.07 4.67 5.27 5.86 6.46 7.74 9.24
196.66 5.12 0.90 School 4.36 4.64 4.89 5.00 5.12 5.23 5.35 5.59 5.88
45 196.54 5.23 4.72 Student 1.25 2.75 4.03 4.63 5.23 5.82 6.42 7.70 9.20
197.44 5.15 0.90 School 4.39 4.68 4.92 5.04 5.15 5.27 5.38 5.63 5.91
48 197.54 5.20 4.72 Student 1.23 2.73 4.01 4.61 5.20 5.80 6.40 7.68 9.18
197.90 5.17 0.90 School 4.41 4.70 4.95 5.06 5.17 5.29 5.40 5.65 5.93
50 198.21 5.19 4.72 Student 1.21 2.71 3.99 4.59 5.19 5.78 6.38 7.66 9.16
198.21 5.19 0.90 School 4.43 4.71 4.96 5.07 5.19 5.30 5.42 5.66 5.95
52 198.87 5.17 4.72 Student 1.20 2.70 3.98 4.58 5.17 5.77 6.37 7.65 9.15
198.52 5.20 0.90 School 4.44 4.73 4.97 5.09 5.20 5.32 5.43 5.67 5.96
55 199.88 5.15 4.72 Student 1.17 2.67 3.95 4.55 5.15 5.74 6.34 7.62 9.12
198.98 5.22 0.90 School 4.46 4.75 4.99 5.11 5.22 5.34 5.45 5.70 5.98
60 201.58 5.11 4.72 Student 1.13 2.63 3.91 4.51 5.11 5.70 6.30 7.58 9.08
199.76 5.26 0.90 School 4.50 4.78 5.03 5.14 5.26 5.37 5.49 5.73 6.02
65 203.33 5.07 4.72 Student 1.09 2.59 3.87 4.47 5.07 5.66 6.26 7.54 9.04
200.57 5.29 0.90 School 4.53 4.82 5.07 5.18 5.29 5.41 5.52 5.77 6.05
70 205.18 5.02 4.72 Student 1.05 2.55 3.83 4.43 5.02 5.62 6.22 7.50 9.00
201.42 5.33 0.90 School 4.57 4.86 5.10 5.22 5.33 5.45 5.56 5.81 6.09
75 207.17 4.97 4.72 Student 1.00 2.50 3.78 4.38 4.97 5.57 6.17 7.45 8.95
202.34 5.37 0.90 School 4.61 4.90 5.15 5.26 5.37 5.49 5.60 5.85 6.13
80 209.40 4.92 4.72 Student 0.95 2.45 3.73 4.33 4.92 5.52 6.12 7.40 8.90
203.36 5.42 0.90 School 4.66 4.95 5.19 5.31 5.42 5.53 5.65 5.89 6.18
85 211.99 4.86 4.72 Student 0.89 2.38 3.66 4.27 4.86 5.45 6.06 7.34 8.83
204.55 5.47 0.90 School 4.71 5.00 5.24 5.36 5.47 5.59 5.70 5.95 6.23
90 215.24 4.78 4.72 Student 0.81 2.31 3.59 4.19 4.78 5.38 5.98 7.26 8.76
206.05 5.54 0.90 School 4.78 5.07 5.31 5.43 5.54 5.65 5.77 6.01 6.30
CGI - Conditional Growth Index CGP - Conditional Growth Percentile
210

Table E.1.23: Mathematics Grade 4 From Last Winter To Winter Conditional Growth Percentile
Conditional Growth
Start Status Growth CGP 20 30 40 45 50 55 60 70 80
%ile RIT Mean SD CGI -0.84 -0.52 -0.25 -0.13 0.00 0.13 0.25 0.52 0.84
10 181.04 10.96 5.80 Student 6.08 7.92 9.49 10.23 10.96 11.69 12.43 14.00 15.84
190.47 10.19 1.88 School 8.61 9.21 9.71 9.95 10.19 10.43 10.67 11.18 11.77
20 186.92 10.82 5.80 Student 5.94 7.78 9.35 10.09 10.82 11.55 12.29 13.86 15.70
193.11 10.31 1.88 School 8.73 9.33 9.84 10.08 10.31 10.55 10.79 11.30 11.89
25 189.15 10.76 5.80 Student 5.89 7.72 9.30 10.04 10.76 11.49 12.23 13.80 15.64
194.12 10.36 1.88 School 8.78 9.37 9.88 10.12 10.36 10.59 10.83 11.34 11.94
30 191.16 10.71 5.80 Student 5.84 7.68 9.25 9.99 10.71 11.44 12.18 13.75 15.59
195.02 10.40 1.88 School 8.82 9.42 9.92 10.16 10.40 10.64 10.88 11.38 11.98
35 193.02 10.67 5.80 Student 5.79 7.63 9.20 9.94 10.67 11.40 12.14 13.71 15.55
195.85 10.44 1.88 School 8.86 9.45 9.96 10.20 10.44 10.67 10.91 11.42 12.02
40 194.78 10.63 5.80 Student 5.75 7.59 9.16 9.90 10.63 11.36 12.10 13.67 15.51
196.65 10.47 1.88 School 8.89 9.49 10.00 10.24 10.47 10.71 10.95 11.46 12.05
45 196.49 10.59 5.80 Student 5.71 7.55 9.12 9.86 10.59 11.31 12.05 13.63 15.46
197.41 10.51 1.88 School 8.93 9.53 10.03 10.27 10.51 10.75 10.99 11.49 12.09
48 197.50 10.56 5.80 Student 5.68 7.52 9.09 9.83 10.56 11.29 12.03 13.60 15.44
197.87 10.53 1.88 School 8.95 9.55 10.06 10.29 10.53 10.77 11.01 11.52 12.11
50 198.17 10.54 5.80 Student 5.67 7.50 9.08 9.82 10.54 11.27 12.01 13.58 15.42
198.17 10.54 1.88 School 8.96 9.56 10.07 10.31 10.54 10.78 11.02 11.53 12.12
52 198.84 10.53 5.80 Student 5.65 7.49 9.06 9.80 10.53 11.26 12.00 13.57 15.41
198.47 10.56 1.88 School 8.98 9.57 10.08 10.32 10.56 10.79 11.03 11.54 12.14
55 199.85 10.50 5.80 Student 5.63 7.46 9.04 9.78 10.50 11.23 11.97 13.54 15.38
198.92 10.58 1.88 School 9.00 9.59 10.10 10.34 10.58 10.82 11.05 11.56 12.16
60 201.55 10.46 5.80 Student 5.58 7.42 8.99 9.73 10.46 11.19 11.93 13.50 15.34
199.69 10.61 1.88 School 9.03 9.63 10.14 10.38 10.61 10.85 11.09 11.60 12.19
65 203.31 10.42 5.80 Student 5.54 7.38 8.95 9.69 10.42 11.15 11.89 13.46 15.30
200.48 10.65 1.88 School 9.07 9.67 10.18 10.42 10.65 10.89 11.13 11.64 12.23
70 205.17 10.37 5.80 Student 5.50 7.33 8.91 9.65 10.37 11.10 11.84 13.41 15.25
201.31 10.69 1.88 School 9.11 9.70 10.21 10.45 10.69 10.93 11.17 11.67 12.27
75 207.18 10.33 5.80 Student 5.45 7.29 8.86 9.60 10.33 11.05 11.79 13.37 15.20
202.21 10.73 1.88 School 9.15 9.75 10.26 10.50 10.73 10.97 11.21 11.72 12.31
80 209.41 10.27 5.80 Student 5.39 7.23 8.80 9.54 10.27 11.00 11.74 13.31 15.15
203.22 10.78 1.88 School 9.20 9.79 10.30 10.54 10.78 11.01 11.25 11.76 12.36
85 212.01 10.21 5.80 Student 5.33 7.17 8.74 9.48 10.21 10.94 11.68 13.25 15.09
204.39 10.83 1.88 School 9.25 9.85 10.36 10.59 10.83 11.07 11.31 11.82 12.41
90 215.29 10.13 5.80 Student 5.25 7.09 8.66 9.40 10.13 10.86 11.60 13.17 15.01
205.86 10.90 1.88 School 9.32 9.91 10.42 10.66 10.90 11.13 11.37 11.88 12.48
CGI - Conditional Growth Index CGP - Conditional Growth Percentile
211
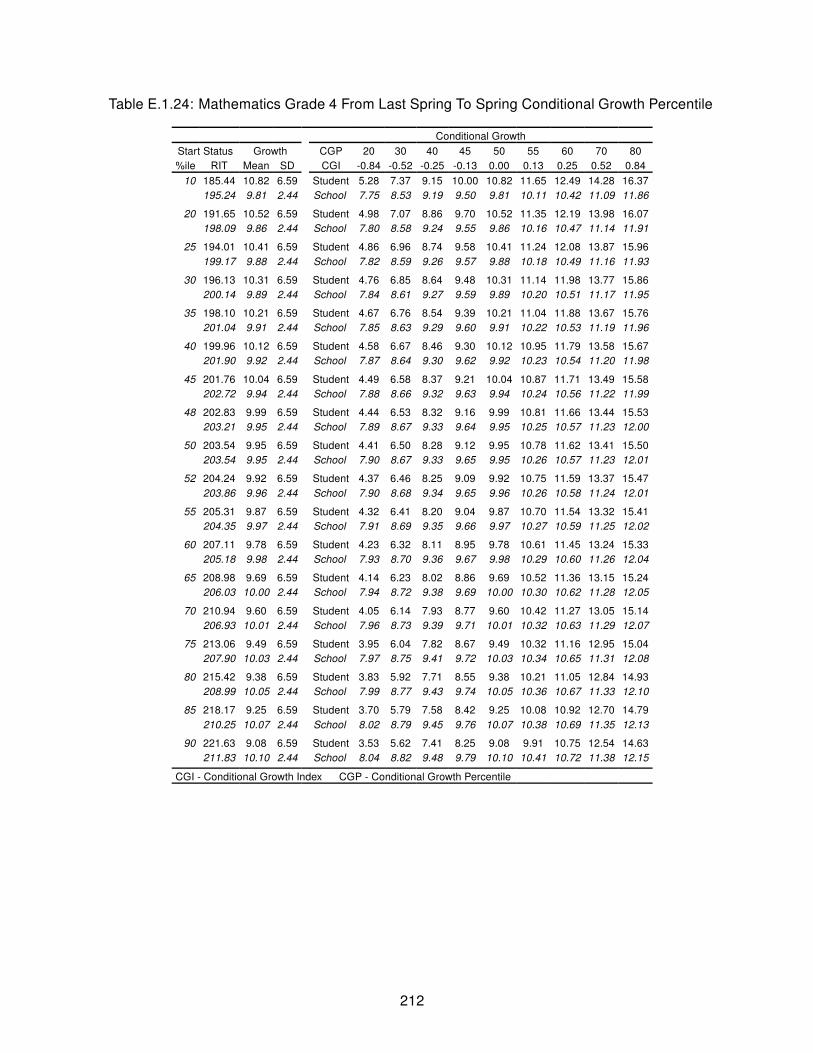
Table E.1.24: Mathematics Grade 4 From Last Spring To Spring Conditional Growth Percentile
Conditional Growth
Start Status Growth CGP 20 30 40 45 50 55 60 70 80
%ile RIT Mean SD CGI -0.84 -0.52 -0.25 -0.13 0.00 0.13 0.25 0.52 0.84
10 185.44 10.82 6.59 Student 5.28 7.37 9.15 10.00 10.82 11.65 12.49 14.28 16.37
195.24 9.81 2.44 School 7.75 8.53 9.19 9.50 9.81 10.11 10.42 11.09 11.86
20 191.65 10.52 6.59 Student 4.98 7.07 8.86 9.70 10.52 11.35 12.19 13.98 16.07
198.09 9.86 2.44 School 7.80 8.58 9.24 9.55 9.86 10.16 10.47 11.14 11.91
25 194.01 10.41 6.59 Student 4.86 6.96 8.74 9.58 10.41 11.24 12.08 13.87 15.96
199.17 9.88 2.44 School 7.82 8.59 9.26 9.57 9.88 10.18 10.49 11.16 11.93
30 196.13 10.31 6.59 Student 4.76 6.85 8.64 9.48 10.31 11.14 11.98 13.77 15.86
200.14 9.89 2.44 School 7.84 8.61 9.27 9.59 9.89 10.20 10.51 11.17 11.95
35 198.10 10.21 6.59 Student 4.67 6.76 8.54 9.39 10.21 11.04 11.88 13.67 15.76
201.04 9.91 2.44 School 7.85 8.63 9.29 9.60 9.91 10.22 10.53 11.19 11.96
40 199.96 10.12 6.59 Student 4.58 6.67 8.46 9.30 10.12 10.95 11.79 13.58 15.67
201.90 9.92 2.44 School 7.87 8.64 9.30 9.62 9.92 10.23 10.54 11.20 11.98
45 201.76 10.04 6.59 Student 4.49 6.58 8.37 9.21 10.04 10.87 11.71 13.49 15.58
202.72 9.94 2.44 School 7.88 8.66 9.32 9.63 9.94 10.24 10.56 11.22 11.99
48 202.83 9.99 6.59 Student 4.44 6.53 8.32 9.16 9.99 10.81 11.66 13.44 15.53
203.21 9.95 2.44 School 7.89 8.67 9.33 9.64 9.95 10.25 10.57 11.23 12.00
50 203.54 9.95 6.59 Student 4.41 6.50 8.28 9.12 9.95 10.78 11.62 13.41 15.50
203.54 9.95 2.44 School 7.90 8.67 9.33 9.65 9.95 10.26 10.57 11.23 12.01
52 204.24 9.92 6.59 Student 4.37 6.46 8.25 9.09 9.92 10.75 11.59 13.37 15.47
203.86 9.96 2.44 School 7.90 8.68 9.34 9.65 9.96 10.26 10.58 11.24 12.01
55 205.31 9.87 6.59 Student 4.32 6.41 8.20 9.04 9.87 10.70 11.54 13.32 15.41
204.35 9.97 2.44 School 7.91 8.69 9.35 9.66 9.97 10.27 10.59 11.25 12.02
60 207.11 9.78 6.59 Student 4.23 6.32 8.11 8.95 9.78 10.61 11.45 13.24 15.33
205.18 9.98 2.44 School 7.93 8.70 9.36 9.67 9.98 10.29 10.60 11.26 12.04
65 208.98 9.69 6.59 Student 4.14 6.23 8.02 8.86 9.69 10.52 11.36 13.15 15.24
206.03 10.00 2.44 School 7.94 8.72 9.38 9.69 10.00 10.30 10.62 11.28 12.05
70 210.94 9.60 6.59 Student 4.05 6.14 7.93 8.77 9.60 10.42 11.27 13.05 15.14
206.93 10.01 2.44 School 7.96 8.73 9.39 9.71 10.01 10.32 10.63 11.29 12.07
75 213.06 9.49 6.59 Student 3.95 6.04 7.82 8.67 9.49 10.32 11.16 12.95 15.04
207.90 10.03 2.44 School 7.97 8.75 9.41 9.72 10.03 10.34 10.65 11.31 12.08
80 215.42 9.38 6.59 Student 3.83 5.92 7.71 8.55 9.38 10.21 11.05 12.84 14.93
208.99 10.05 2.44 School 7.99 8.77 9.43 9.74 10.05 10.36 10.67 11.33 12.10
85 218.17 9.25 6.59 Student 3.70 5.79 7.58 8.42 9.25 10.08 10.92 12.70 14.79
210.25 10.07 2.44 School 8.02 8.79 9.45 9.76 10.07 10.38 10.69 11.35 12.13
90 221.63 9.08 6.59 Student 3.53 5.62 7.41 8.25 9.08 9.91 10.75 12.54 14.63
211.83 10.10 2.44 School 8.04 8.82 9.48 9.79 10.10 10.41 10.72 11.38 12.15
CGI - Conditional Growth Index CGP - Conditional Growth Percentile
212

Table E.1.25: Mathematics Grade 4 From Fall To N Fall Conditional Growth Percentile
Conditional Growth
Start Status Growth CGP 20 30 40 45 50 55 60 70 80
%ile RIT Mean SD CGI -0.84 -0.52 -0.25 -0.13 0.00 0.13 0.25 0.52 0.84
10 184.31 9.47 6.11 Student 4.33 6.27 7.92 8.70 9.47 10.24 11.02 12.68 14.62
194.11 9.17 1.72 School 7.71 8.26 8.73 8.95 9.17 9.38 9.60 10.07 10.62
20 190.36 9.62 6.11 Student 4.47 6.41 8.07 8.85 9.62 10.39 11.17 12.82 14.76
196.80 9.42 1.72 School 7.96 8.51 8.98 9.20 9.42 9.63 9.85 10.32 10.87
25 192.66 9.67 6.11 Student 4.53 6.47 8.12 8.90 9.67 10.44 11.22 12.88 14.82
197.82 9.51 1.72 School 8.06 8.61 9.07 9.29 9.51 9.73 9.95 10.42 10.96
30 194.72 9.72 6.11 Student 4.58 6.52 8.17 8.95 9.72 10.49 11.27 12.93 14.87
198.74 9.60 1.72 School 8.15 8.69 9.16 9.38 9.60 9.81 10.03 10.50 11.05
35 196.64 9.77 6.11 Student 4.62 6.56 8.22 9.00 9.77 10.54 11.32 12.97 14.91
199.59 9.68 1.72 School 8.22 8.77 9.24 9.46 9.68 9.89 10.11 10.58 11.13
40 198.45 9.81 6.11 Student 4.67 6.61 8.26 9.04 9.81 10.58 11.36 13.02 14.95
200.39 9.75 1.72 School 8.30 8.85 9.31 9.53 9.75 9.97 10.19 10.66 11.20
45 200.21 9.85 6.11 Student 4.71 6.65 8.31 9.09 9.85 10.62 11.40 13.06 15.00
201.17 9.82 1.72 School 8.37 8.92 9.39 9.61 9.82 10.04 10.26 10.73 11.27
48 201.25 9.88 6.11 Student 4.73 6.67 8.33 9.11 9.88 10.65 11.43 13.08 15.02
201.63 9.87 1.72 School 8.41 8.96 9.43 9.65 9.87 10.08 10.30 10.77 11.32
50 201.94 9.89 6.11 Student 4.75 6.69 8.35 9.13 9.89 10.66 11.44 13.10 15.04
201.94 9.89 1.72 School 8.44 8.99 9.46 9.68 9.89 10.11 10.33 10.80 11.35
52 202.63 9.91 6.11 Student 4.77 6.71 8.36 9.14 9.91 10.68 11.46 13.12 15.05
202.25 9.92 1.72 School 8.47 9.02 9.49 9.71 9.92 10.14 10.36 10.83 11.37
55 203.67 9.94 6.11 Student 4.79 6.73 8.39 9.17 9.94 10.70 11.48 13.14 15.08
202.71 9.97 1.72 School 8.52 9.06 9.53 9.75 9.97 10.18 10.40 10.87 11.42
60 205.43 9.98 6.11 Student 4.83 6.77 8.43 9.21 9.98 10.75 11.53 13.18 15.12
203.49 10.04 1.72 School 8.59 9.13 9.60 9.82 10.04 10.26 10.48 10.94 11.49
65 207.24 10.02 6.11 Student 4.88 6.82 8.47 9.25 10.02 10.79 11.57 13.23 15.17
204.29 10.11 1.72 School 8.66 9.21 9.68 9.90 10.11 10.33 10.55 11.02 11.57
70 209.16 10.07 6.11 Student 4.92 6.86 8.52 9.30 10.07 10.84 11.62 13.27 15.21
205.14 10.19 1.72 School 8.74 9.29 9.76 9.98 10.19 10.41 10.63 11.10 11.64
75 211.22 10.12 6.11 Student 4.97 6.91 8.57 9.35 10.12 10.89 11.67 13.32 15.26
206.06 10.28 1.72 School 8.83 9.37 9.84 10.06 10.28 10.50 10.72 11.18 11.73
80 213.52 10.17 6.11 Student 5.03 6.97 8.62 9.40 10.17 10.94 11.72 13.38 15.32
207.08 10.37 1.72 School 8.92 9.47 9.94 10.16 10.37 10.59 10.81 11.28 11.83
85 216.20 10.24 6.11 Student 5.09 7.03 8.69 9.47 10.24 11.00 11.78 13.44 15.38
208.27 10.48 1.72 School 9.03 9.58 10.05 10.27 10.48 10.70 10.92 11.39 11.94
90 219.58 10.32 6.11 Student 5.17 7.11 8.77 9.55 10.32 11.08 11.87 13.52 15.46
209.77 10.62 1.72 School 9.17 9.72 10.19 10.41 10.62 10.84 11.06 11.53 12.08
CGI - Conditional Growth Index CGP - Conditional Growth Percentile
213

Table E.1.26: Mathematics Grade 4 From Fall To Spring Conditional Growth Percentile
Conditional Growth
Start Status Growth CGP 20 30 40 45 50 55 60 70 80
%ile RIT Mean SD CGI -0.84 -0.52 -0.25 -0.13 0.00 0.13 0.25 0.52 0.84
10 184.31 11.85 6.41 Student 6.45 8.49 10.22 11.04 11.85 12.65 13.47 15.21 17.24
194.11 10.82 2.20 School 8.97 9.67 10.26 10.55 10.82 11.10 11.38 11.97 12.67
20 190.36 11.74 6.41 Student 6.35 8.38 10.12 10.94 11.74 12.55 13.37 15.10 17.14
196.80 11.07 2.20 School 9.22 9.92 10.51 10.79 11.07 11.35 11.63 12.22 12.92
25 192.66 11.71 6.41 Student 6.31 8.34 10.08 10.90 11.71 12.51 13.33 15.07 17.10
197.82 11.17 2.20 School 9.32 10.01 10.61 10.89 11.17 11.44 11.72 12.32 13.02
30 194.72 11.67 6.41 Student 6.28 8.31 10.05 10.86 11.67 12.48 13.29 15.03 17.06
198.74 11.25 2.20 School 9.40 10.10 10.69 10.97 11.25 11.53 11.81 12.40 13.10
35 196.64 11.64 6.41 Student 6.24 8.28 10.01 10.83 11.64 12.44 13.26 15.00 17.03
199.59 11.33 2.20 School 9.48 10.18 10.77 11.05 11.33 11.61 11.89 12.48 13.18
40 198.45 11.61 6.41 Student 6.21 8.25 9.98 10.80 11.61 12.41 13.23 14.97 17.00
200.39 11.40 2.20 School 9.55 10.25 10.85 11.13 11.40 11.68 11.96 12.56 13.25
45 200.21 11.58 6.41 Student 6.18 8.22 9.95 10.77 11.58 12.38 13.20 14.94 16.97
201.17 11.48 2.20 School 9.63 10.32 10.92 11.20 11.48 11.75 12.03 12.63 13.33
48 201.25 11.56 6.41 Student 6.17 8.20 9.94 10.75 11.56 12.36 13.18 14.92 16.95
201.63 11.52 2.20 School 9.67 10.37 10.96 11.24 11.52 11.80 12.08 12.67 13.37
50 201.94 11.55 6.41 Student 6.16 8.19 9.92 10.74 11.55 12.35 13.17 14.91 16.94
201.94 11.55 2.20 School 9.70 10.40 10.99 11.27 11.55 11.82 12.11 12.70 13.40
52 202.63 11.54 6.41 Student 6.14 8.18 9.91 10.73 11.54 12.34 13.16 14.90 16.93
202.25 11.58 2.20 School 9.73 10.42 11.02 11.30 11.58 11.85 12.13 12.73 13.43
55 203.67 11.52 6.41 Student 6.13 8.16 9.90 10.71 11.52 12.32 13.14 14.88 16.91
202.71 11.62 2.20 School 9.77 10.47 11.06 11.34 11.62 11.90 12.18 12.77 13.47
60 205.43 11.49 6.41 Student 6.10 8.13 9.87 10.68 11.49 12.29 13.11 14.85 16.88
203.49 11.69 2.20 School 9.84 10.54 11.13 11.42 11.69 11.97 12.25 12.84 13.54
65 207.24 11.46 6.41 Student 6.07 8.10 9.84 10.65 11.46 12.26 13.08 14.82 16.85
204.29 11.77 2.20 School 9.92 10.61 11.21 11.49 11.77 12.04 12.32 12.92 13.62
70 209.16 11.43 6.41 Student 6.03 8.07 9.80 10.62 11.43 12.23 13.05 14.79 16.82
205.14 11.85 2.20 School 9.99 10.69 11.29 11.57 11.85 12.12 12.40 13.00 13.70
75 211.22 11.39 6.41 Student 6.00 8.03 9.77 10.59 11.39 12.20 13.01 14.75 16.78
206.06 11.93 2.20 School 10.08 10.78 11.37 11.65 11.93 12.21 12.49 13.08 13.78
80 213.52 11.35 6.41 Student 5.96 7.99 9.73 10.55 11.35 12.16 12.98 14.71 16.75
207.08 12.03 2.20 School 10.17 10.87 11.47 11.75 12.03 12.30 12.58 13.18 13.88
85 216.20 11.31 6.41 Student 5.91 7.95 9.68 10.50 11.31 12.11 12.93 14.67 16.70
208.27 12.14 2.20 School 10.29 10.98 11.58 11.86 12.14 12.41 12.69 13.29 13.99
90 219.58 11.25 6.41 Student 5.86 7.89 9.63 10.44 11.25 12.05 12.87 14.61 16.64
209.77 12.27 2.20 School 10.42 11.12 11.72 12.00 12.27 12.55 12.83 13.43 14.13
CGI - Conditional Growth Index CGP - Conditional Growth Percentile
214

Table E.1.27: Mathematics Grade 4 From Fall To Winter Conditional Growth Percentile
Conditional Growth
Start Status Growth CGP 20 30 40 45 50 55 60 70 80
%ile RIT Mean SD CGI -0.84 -0.52 -0.25 -0.13 0.00 0.13 0.25 0.52 0.84
10 184.31 7.30 5.04 Student 3.06 4.66 6.02 6.67 7.30 7.93 8.58 9.94 11.54
194.11 6.36 1.26 School 5.30 5.70 6.04 6.20 6.36 6.51 6.67 7.01 7.41
20 190.36 7.12 5.04 Student 2.88 4.48 5.84 6.49 7.12 7.75 8.39 9.76 11.36
196.80 6.50 1.26 School 5.44 5.84 6.18 6.34 6.50 6.66 6.82 7.16 7.56
25 192.66 7.05 5.04 Student 2.81 4.41 5.77 6.42 7.05 7.68 8.33 9.69 11.29
197.82 6.55 1.26 School 5.49 5.89 6.23 6.39 6.55 6.71 6.87 7.21 7.61
30 194.72 6.99 5.04 Student 2.75 4.35 5.71 6.35 6.99 7.62 8.26 9.63 11.23
198.74 6.60 1.26 School 5.54 5.94 6.28 6.44 6.60 6.76 6.92 7.26 7.66
35 196.64 6.93 5.04 Student 2.69 4.29 5.65 6.30 6.93 7.56 8.21 9.57 11.17
199.59 6.65 1.26 School 5.59 5.99 6.33 6.49 6.65 6.80 6.96 7.30 7.70
40 198.45 6.88 5.04 Student 2.64 4.23 5.60 6.24 6.88 7.51 8.15 9.52 11.11
200.39 6.69 1.26 School 5.63 6.03 6.37 6.53 6.69 6.85 7.01 7.35 7.75
45 200.21 6.82 5.04 Student 2.58 4.18 5.55 6.19 6.82 7.46 8.10 9.46 11.06
201.17 6.73 1.26 School 5.67 6.07 6.41 6.57 6.73 6.89 7.05 7.39 7.79
48 201.25 6.79 5.04 Student 2.55 4.15 5.51 6.16 6.79 7.42 8.07 9.43 11.03
201.63 6.75 1.26 School 5.70 6.10 6.44 6.60 6.75 6.91 7.07 7.41 7.81
50 201.94 6.77 5.04 Student 2.53 4.13 5.49 6.14 6.77 7.40 8.05 9.41 11.01
201.94 6.77 1.26 School 5.71 6.11 6.45 6.61 6.77 6.93 7.09 7.43 7.83
52 202.63 6.75 5.04 Student 2.51 4.11 5.47 6.12 6.75 7.38 8.03 9.39 10.99
202.25 6.79 1.26 School 5.73 6.13 6.47 6.63 6.79 6.94 7.10 7.45 7.84
55 203.67 6.72 5.04 Student 2.48 4.08 5.44 6.09 6.72 7.35 7.99 9.36 10.96
202.71 6.81 1.26 School 5.75 6.15 6.49 6.65 6.81 6.97 7.13 7.47 7.87
60 205.43 6.67 5.04 Student 2.43 4.02 5.39 6.03 6.67 7.30 7.94 9.31 10.91
203.49 6.85 1.26 School 5.79 6.19 6.53 6.69 6.85 7.01 7.17 7.51 7.91
65 207.24 6.61 5.04 Student 2.37 3.97 5.33 5.98 6.61 7.24 7.89 9.25 10.85
204.29 6.90 1.26 School 5.84 6.24 6.58 6.74 6.90 7.05 7.21 7.55 7.95
70 209.16 6.55 5.04 Student 2.31 3.91 5.28 5.92 6.55 7.19 7.83 9.20 10.79
205.14 6.94 1.26 School 5.88 6.28 6.62 6.78 6.94 7.10 7.26 7.60 8.00
75 211.22 6.49 5.04 Student 2.25 3.85 5.22 5.86 6.49 7.12 7.77 9.13 10.73
206.06 6.99 1.26 School 5.93 6.33 6.67 6.83 6.99 7.15 7.31 7.65 8.05
80 213.52 6.42 5.04 Student 2.18 3.78 5.15 5.79 6.42 7.06 7.70 9.06 10.66
207.08 7.04 1.26 School 5.99 6.38 6.72 6.88 7.04 7.20 7.36 7.70 8.10
85 216.20 6.34 5.04 Student 2.10 3.70 5.07 5.71 6.34 6.97 7.62 8.98 10.58
208.27 7.11 1.26 School 6.05 6.45 6.79 6.95 7.11 7.26 7.42 7.76 8.16
90 219.58 6.24 5.04 Student 2.00 3.60 4.96 5.61 6.24 6.87 7.52 8.88 10.48
209.77 7.19 1.26 School 6.13 6.53 6.87 7.03 7.19 7.34 7.50 7.84 8.24
CGI - Conditional Growth Index CGP - Conditional Growth Percentile
215

Table E.1.28: Mathematics Grade 4 From Winter To Spring Conditional Growth Percentile
Conditional Growth
Start Status Growth CGP 20 30 40 45 50 55 60 70 80
%ile RIT Mean SD CGI -0.84 -0.52 -0.25 -0.13 0.00 0.13 0.25 0.52 0.84
10 190.43 4.85 4.72 Student 0.89 2.38 3.66 4.26 4.85 5.45 6.05 7.33 8.82
200.31 4.24 0.88 School 3.50 3.78 4.02 4.13 4.24 4.35 4.46 4.70 4.98
20 196.70 4.83 4.72 Student 0.86 2.36 3.63 4.24 4.83 5.42 6.02 7.30 8.80
203.20 4.43 0.88 School 3.69 3.96 4.20 4.31 4.43 4.54 4.65 4.89 5.16
25 199.09 4.82 4.72 Student 0.85 2.34 3.62 4.23 4.82 5.41 6.01 7.29 8.79
204.29 4.50 0.88 School 3.76 4.03 4.27 4.38 4.50 4.61 4.72 4.96 5.23
30 201.23 4.81 4.72 Student 0.84 2.34 3.61 4.22 4.81 5.40 6.00 7.28 8.78
205.27 4.56 0.88 School 3.82 4.10 4.34 4.45 4.56 4.67 4.78 5.02 5.30
35 203.21 4.80 4.72 Student 0.83 2.33 3.61 4.21 4.80 5.39 6.00 7.27 8.77
206.19 4.62 0.88 School 3.88 4.16 4.39 4.51 4.62 4.73 4.84 5.08 5.36
40 205.10 4.79 4.72 Student 0.82 2.32 3.60 4.20 4.79 5.39 5.99 7.27 8.76
207.05 4.67 0.88 School 3.93 4.21 4.45 4.56 4.67 4.78 4.89 5.13 5.41
45 206.92 4.79 4.72 Student 0.82 2.31 3.59 4.19 4.79 5.38 5.98 7.26 8.75
207.89 4.73 0.88 School 3.99 4.26 4.50 4.61 4.73 4.84 4.95 5.19 5.46
48 208.00 4.78 4.72 Student 0.81 2.31 3.59 4.19 4.78 5.37 5.98 7.25 8.75
208.38 4.76 0.88 School 4.02 4.30 4.53 4.65 4.76 4.87 4.98 5.22 5.50
50 208.71 4.78 4.72 Student 0.81 2.30 3.58 4.19 4.78 5.37 5.97 7.25 8.75
208.71 4.78 0.88 School 4.04 4.32 4.56 4.67 4.78 4.89 5.00 5.24 5.52
52 209.43 4.77 4.72 Student 0.81 2.30 3.58 4.18 4.77 5.37 5.97 7.25 8.74
209.04 4.80 0.88 School 4.06 4.34 4.58 4.69 4.80 4.91 5.02 5.26 5.54
55 210.50 4.77 4.72 Student 0.80 2.30 3.58 4.18 4.77 5.36 5.97 7.24 8.74
209.53 4.83 0.88 School 4.09 4.37 4.61 4.72 4.83 4.94 5.05 5.29 5.57
60 212.33 4.76 4.72 Student 0.79 2.29 3.57 4.17 4.76 5.36 5.96 7.24 8.73
210.37 4.88 0.88 School 4.14 4.42 4.66 4.77 4.88 4.99 5.11 5.34 5.62
65 214.21 4.75 4.72 Student 0.79 2.28 3.56 4.16 4.75 5.35 5.95 7.23 8.72
211.24 4.94 0.88 School 4.20 4.48 4.72 4.83 4.94 5.05 5.16 5.40 5.68
70 216.19 4.75 4.72 Student 0.78 2.27 3.55 4.15 4.75 5.34 5.94 7.22 8.72
212.15 5.00 0.88 School 4.26 4.54 4.77 4.89 5.00 5.11 5.22 5.46 5.74
75 218.33 4.74 4.72 Student 0.77 2.26 3.54 4.14 4.74 5.33 5.93 7.21 8.71
213.13 5.06 0.88 School 4.32 4.60 4.84 4.95 5.06 5.17 5.28 5.52 5.80
80 220.72 4.73 4.72 Student 0.76 2.25 3.53 4.13 4.73 5.32 5.92 7.20 8.70
214.23 5.13 0.88 School 4.39 4.67 4.91 5.02 5.13 5.24 5.35 5.59 5.87
85 223.50 4.72 4.72 Student 0.75 2.24 3.52 4.12 4.72 5.31 5.91 7.19 8.68
215.50 5.21 0.88 School 4.47 4.75 4.99 5.10 5.21 5.32 5.43 5.67 5.95
90 226.99 4.70 4.72 Student 0.73 2.23 3.51 4.11 4.70 5.29 5.90 7.17 8.67
217.11 5.31 0.88 School 4.57 4.85 5.09 5.20 5.31 5.43 5.54 5.78 6.05
CGI - Conditional Growth Index CGP - Conditional Growth Percentile
216

Table E.1.29: Mathematics Grade 5 From Last Winter To Winter Conditional Growth Percentile
Conditional Growth
Start Status Growth CGP 20 30 40 45 50 55 60 70 80
%ile RIT Mean SD CGI -0.84 -0.52 -0.25 -0.13 0.00 0.13 0.25 0.52 0.84
10 189.19 10.02 6.11 Student 4.87 6.81 8.47 9.25 10.02 10.78 11.56 13.22 15.16
198.96 8.97 2.13 School 7.17 7.85 8.43 8.70 8.97 9.23 9.51 10.08 10.76
20 195.68 9.72 6.11 Student 4.57 6.51 8.17 8.95 9.72 10.48 11.26 12.92 14.86
202.09 9.03 2.13 School 7.23 7.91 8.49 8.76 9.03 9.29 9.57 10.14 10.82
25 198.14 9.60 6.11 Student 4.46 6.40 8.05 8.83 9.60 10.37 11.15 12.80 14.74
203.28 9.05 2.13 School 7.26 7.93 8.51 8.78 9.05 9.32 9.59 10.17 10.84
30 200.35 9.50 6.11 Student 4.36 6.30 7.95 8.73 9.50 10.27 11.05 12.70 14.64
204.35 9.07 2.13 School 7.28 7.95 8.53 8.80 9.07 9.34 9.61 10.19 10.86
35 202.40 9.40 6.11 Student 4.26 6.20 7.86 8.64 9.40 10.17 10.95 12.61 14.55
205.34 9.09 2.13 School 7.30 7.97 8.55 8.82 9.09 9.36 9.63 10.21 10.88
40 204.35 9.31 6.11 Student 4.17 6.11 7.77 8.55 9.31 10.08 10.86 12.52 14.46
206.28 9.11 2.13 School 7.31 7.99 8.57 8.84 9.11 9.37 9.65 10.22 10.90
45 206.23 9.23 6.11 Student 4.09 6.02 7.68 8.46 9.23 9.99 10.77 12.43 14.37
207.19 9.12 2.13 School 7.33 8.01 8.58 8.86 9.12 9.39 9.66 10.24 10.92
48 207.35 9.18 6.11 Student 4.03 5.97 7.63 8.41 9.18 9.94 10.72 12.38 14.32
207.73 9.13 2.13 School 7.34 8.02 8.60 8.87 9.13 9.40 9.67 10.25 10.93
50 208.09 9.14 6.11 Student 4.00 5.94 7.59 8.37 9.14 9.91 10.69 12.35 14.28
208.09 9.14 2.13 School 7.35 8.02 8.60 8.87 9.14 9.41 9.68 10.26 10.93
52 208.82 9.11 6.11 Student 3.97 5.90 7.56 8.34 9.11 9.88 10.66 12.31 14.25
208.44 9.15 2.13 School 7.36 8.03 8.61 8.88 9.15 9.42 9.69 10.27 10.94
55 209.94 9.06 6.11 Student 3.91 5.85 7.51 8.29 9.06 9.82 10.60 12.26 14.20
208.98 9.16 2.13 School 7.37 8.04 8.62 8.89 9.16 9.43 9.70 10.28 10.95
60 211.82 8.97 6.11 Student 3.83 5.77 7.42 8.20 8.97 9.74 10.52 12.17 14.11
209.89 9.18 2.13 School 7.38 8.06 8.64 8.91 9.18 9.44 9.72 10.29 10.97
65 213.77 8.88 6.11 Student 3.74 5.68 7.33 8.11 8.88 9.65 10.43 12.08 14.02
210.83 9.19 2.13 School 7.40 8.08 8.65 8.93 9.19 9.46 9.73 10.31 10.99
70 215.82 8.78 6.11 Student 3.64 5.58 7.24 8.02 8.78 9.55 10.33 11.99 13.93
211.82 9.21 2.13 School 7.42 8.10 8.67 8.95 9.21 9.48 9.75 10.33 11.01
75 218.03 8.68 6.11 Student 3.54 5.48 7.13 7.91 8.68 9.45 10.23 11.89 13.82
212.89 9.23 2.13 School 7.44 8.12 8.69 8.97 9.23 9.50 9.77 10.35 11.03
80 220.49 8.57 6.11 Student 3.43 5.36 7.02 7.80 8.57 9.34 10.12 11.77 13.71
214.08 9.26 2.13 School 7.46 8.14 8.72 8.99 9.26 9.53 9.80 10.37 11.05
85 223.37 8.44 6.11 Student 3.29 5.23 6.89 7.67 8.44 9.20 9.98 11.64 13.58
215.47 9.28 2.13 School 7.49 8.17 8.74 9.02 9.28 9.55 9.82 10.40 11.08
90 226.98 8.27 6.11 Student 3.13 5.06 6.72 7.50 8.27 9.04 9.82 11.47 13.41
217.21 9.32 2.13 School 7.52 8.20 8.78 9.05 9.32 9.59 9.86 10.44 11.11
CGI - Conditional Growth Index CGP - Conditional Growth Percentile
217

Table E.1.30: Mathematics Grade 5 From Last Spring To Spring Conditional Growth Percentile
Conditional Growth
Start Status Growth CGP 20 30 40 45 50 55 60 70 80
%ile RIT Mean SD CGI -0.84 -0.52 -0.25 -0.13 0.00 0.13 0.25 0.52 0.84
10 192.53 10.08 6.91 Student 4.26 6.45 8.33 9.21 10.08 10.95 11.83 13.71 15.90
202.77 8.79 2.85 School 6.39 7.30 8.07 8.43 8.79 9.15 9.51 10.28 11.18
20 199.47 9.58 6.91 Student 3.76 5.95 7.83 8.71 9.58 10.45 11.33 13.20 15.40
206.19 8.73 2.85 School 6.34 7.24 8.01 8.37 8.73 9.09 9.45 10.22 11.13
25 202.10 9.39 6.91 Student 3.57 5.76 7.64 8.52 9.39 10.26 11.14 13.01 15.21
207.49 8.71 2.85 School 6.31 7.22 7.99 8.35 8.71 9.07 9.43 10.20 11.10
30 204.47 9.22 6.91 Student 3.40 5.59 7.47 8.35 9.22 10.09 10.97 12.84 15.04
208.66 8.69 2.85 School 6.29 7.20 7.97 8.33 8.69 9.05 9.41 10.18 11.08
35 206.66 9.06 6.91 Student 3.24 5.43 7.31 8.19 9.06 9.93 10.81 12.68 14.88
209.74 8.67 2.85 School 6.28 7.18 7.95 8.31 8.67 9.03 9.39 10.16 11.07
40 208.74 8.91 6.91 Student 3.09 5.28 7.16 8.04 8.91 9.78 10.66 12.53 14.73
210.77 8.65 2.85 School 6.26 7.16 7.93 8.30 8.65 9.01 9.37 10.15 11.05
45 210.76 8.76 6.91 Student 2.94 5.14 7.01 7.89 8.76 9.63 10.51 12.39 14.58
211.76 8.64 2.85 School 6.24 7.14 7.92 8.28 8.64 8.99 9.36 10.13 11.03
48 211.95 8.68 6.91 Student 2.86 5.05 6.92 7.81 8.68 9.55 10.43 12.30 14.50
212.35 8.63 2.85 School 6.23 7.13 7.91 8.27 8.63 8.98 9.35 10.12 11.02
50 212.74 8.62 6.91 Student 2.80 4.99 6.87 7.75 8.62 9.49 10.37 12.25 14.44
212.74 8.62 2.85 School 6.23 7.13 7.90 8.26 8.62 8.98 9.34 10.11 11.01
52 213.53 8.56 6.91 Student 2.74 4.94 6.81 7.69 8.56 9.43 10.31 12.19 14.38
213.13 8.61 2.85 School 6.22 7.12 7.89 8.26 8.61 8.97 9.33 10.11 11.01
55 214.72 8.48 6.91 Student 2.66 4.85 6.72 7.61 8.48 9.35 10.23 12.10 14.30
213.72 8.60 2.85 School 6.21 7.11 7.88 8.25 8.60 8.96 9.32 10.10 11.00
60 216.73 8.33 6.91 Student 2.51 4.70 6.58 7.46 8.33 9.20 10.08 11.96 14.15
214.71 8.59 2.85 School 6.19 7.09 7.87 8.23 8.59 8.94 9.31 10.08 10.98
65 218.81 8.18 6.91 Student 2.36 4.55 6.43 7.31 8.18 9.05 9.93 11.81 14.00
215.74 8.57 2.85 School 6.17 7.08 7.85 8.21 8.57 8.93 9.29 10.06 10.96
70 221.01 8.02 6.91 Student 2.20 4.40 6.27 7.15 8.02 8.89 9.77 11.65 13.84
216.82 8.55 2.85 School 6.16 7.06 7.83 8.19 8.55 8.91 9.27 10.04 10.95
75 223.37 7.85 6.91 Student 2.03 4.23 6.10 6.98 7.85 8.72 9.60 11.48 13.67
217.98 8.53 2.85 School 6.14 7.04 7.81 8.17 8.53 8.89 9.25 10.02 10.93
80 226.01 7.66 6.91 Student 1.84 4.03 5.91 6.79 7.66 8.53 9.41 11.29 13.48
219.28 8.51 2.85 School 6.11 7.02 7.79 8.15 8.51 8.87 9.23 10.00 10.90
85 229.08 7.44 6.91 Student 1.62 3.81 5.69 6.57 7.44 8.31 9.19 11.07 13.26
220.80 8.48 2.85 School 6.09 6.99 7.76 8.13 8.48 8.84 9.20 9.98 10.88
90 232.95 7.16 6.91 Student 1.34 3.53 5.41 6.29 7.16 8.03 8.91 10.79 12.98
222.71 8.45 2.85 School 6.06 6.96 7.73 8.09 8.45 8.81 9.17 9.94 10.85
CGI - Conditional Growth Index CGP - Conditional Growth Percentile
218

Table E.1.31: Mathematics Grade 5 From Fall To N Fall Conditional Growth Percentile
Conditional Growth
Start Status Growth CGP 20 30 40 45 50 55 60 70 80
%ile RIT Mean SD CGI -0.84 -0.52 -0.25 -0.13 0.00 0.13 0.25 0.52 0.84
10 192.63 5.35 6.48 Student -0.10 1.95 3.71 4.54 5.35 6.17 6.99 8.75 10.81
202.47 5.20 2.04 School 3.48 4.13 4.68 4.94 5.20 5.45 5.71 6.27 6.91
20 199.09 5.57 6.48 Student 0.12 2.17 3.93 4.76 5.57 6.38 7.21 8.97 11.02
205.55 5.47 2.04 School 3.75 4.40 4.95 5.21 5.47 5.72 5.98 6.54 7.18
25 201.54 5.65 6.48 Student 0.20 2.25 4.01 4.84 5.65 6.47 7.30 9.05 11.11
206.72 5.57 2.04 School 3.85 4.50 5.05 5.31 5.57 5.83 6.09 6.64 7.29
30 203.74 5.73 6.48 Student 0.27 2.33 4.09 4.91 5.73 6.54 7.37 9.13 11.18
207.77 5.66 2.04 School 3.95 4.59 5.15 5.41 5.66 5.92 6.18 6.73 7.38
35 205.78 5.80 6.48 Student 0.34 2.40 4.16 4.98 5.80 6.61 7.44 9.20 11.25
208.74 5.75 2.04 School 4.03 4.68 5.23 5.49 5.75 6.01 6.27 6.82 7.47
40 207.72 5.86 6.48 Student 0.41 2.46 4.22 5.05 5.86 6.68 7.50 9.26 11.32
209.67 5.83 2.04 School 4.11 4.76 5.32 5.58 5.83 6.09 6.35 6.90 7.55
45 209.59 5.93 6.48 Student 0.47 2.53 4.28 5.11 5.93 6.74 7.57 9.32 11.38
210.56 5.91 2.04 School 4.19 4.84 5.39 5.65 5.91 6.17 6.43 6.98 7.63
48 210.70 5.96 6.48 Student 0.51 2.57 4.32 5.15 5.96 6.78 7.61 9.36 11.42
211.09 5.96 2.04 School 4.24 4.89 5.44 5.70 5.96 6.21 6.47 7.03 7.68
50 211.44 5.99 6.48 Student 0.53 2.59 4.35 5.17 5.99 6.80 7.63 9.39 11.44
211.44 5.99 2.04 School 4.27 4.92 5.47 5.73 5.99 6.25 6.51 7.06 7.71
52 212.18 6.01 6.48 Student 0.56 2.62 4.37 5.20 6.01 6.83 7.66 9.41 11.47
211.79 6.02 2.04 School 4.30 4.95 5.50 5.76 6.02 6.28 6.54 7.09 7.74
55 213.28 6.05 6.48 Student 0.60 2.65 4.41 5.24 6.05 6.87 7.69 9.45 11.51
212.32 6.07 2.04 School 4.35 5.00 5.55 5.81 6.07 6.32 6.58 7.14 7.78
60 215.16 6.11 6.48 Student 0.66 2.72 4.47 5.30 6.11 6.93 7.76 9.51 11.57
213.21 6.15 2.04 School 4.43 5.08 5.63 5.89 6.15 6.40 6.66 7.22 7.86
65 217.09 6.18 6.48 Student 0.73 2.78 4.54 5.37 6.18 6.99 7.82 9.58 11.63
214.14 6.23 2.04 School 4.51 5.16 5.71 5.97 6.23 6.48 6.74 7.30 7.94
70 219.14 6.25 6.48 Student 0.80 2.85 4.61 5.44 6.25 7.06 7.89 9.65 11.70
215.11 6.31 2.04 School 4.60 5.24 5.80 6.06 6.31 6.57 6.83 7.38 8.03
75 221.34 6.32 6.48 Student 0.87 2.93 4.68 5.51 6.32 7.14 7.97 9.72 11.78
216.16 6.41 2.04 School 4.69 5.34 5.89 6.15 6.41 6.66 6.92 7.48 8.12
80 223.79 6.41 6.48 Student 0.95 3.01 4.77 5.59 6.41 7.22 8.05 9.81 11.86
217.33 6.51 2.04 School 4.79 5.44 5.99 6.25 6.51 6.77 7.03 7.58 8.23
85 226.65 6.50 6.48 Student 1.05 3.11 4.86 5.69 6.50 7.32 8.15 9.90 11.96
218.69 6.63 2.04 School 4.91 5.56 6.11 6.37 6.63 6.89 7.15 7.70 8.35
90 230.25 6.63 6.48 Student 1.17 3.23 4.98 5.81 6.63 7.44 8.27 10.02 12.08
220.41 6.78 2.04 School 5.07 5.71 6.27 6.53 6.78 7.04 7.30 7.85 8.50
CGI - Conditional Growth Index CGP - Conditional Growth Percentile
219

Table E.1.32: Mathematics Grade 5 From Fall To Spring Conditional Growth Percentile
Conditional Growth
Start Status Growth CGP 20 30 40 45 50 55 60 70 80
%ile RIT Mean SD CGI -0.84 -0.52 -0.25 -0.13 0.00 0.13 0.25 0.52 0.84
10 192.63 9.91 6.80 Student 4.19 6.35 8.19 9.06 9.91 10.77 11.63 13.48 15.63
202.47 8.98 2.60 School 6.79 7.61 8.32 8.65 8.98 9.30 9.64 10.34 11.17
20 199.09 9.91 6.80 Student 4.19 6.35 8.19 9.06 9.91 10.77 11.64 13.48 15.64
205.55 9.30 2.60 School 7.11 7.94 8.64 8.97 9.30 9.63 9.96 10.66 11.49
25 201.54 9.91 6.80 Student 4.19 6.35 8.19 9.06 9.91 10.77 11.64 13.48 15.64
206.72 9.42 2.60 School 7.23 8.06 8.76 9.10 9.42 9.75 10.08 10.79 11.61
30 203.74 9.92 6.80 Student 4.19 6.35 8.19 9.06 9.92 10.77 11.64 13.48 15.64
207.77 9.53 2.60 School 7.34 8.17 8.87 9.21 9.53 9.86 10.19 10.90 11.72
35 205.78 9.92 6.80 Student 4.19 6.35 8.19 9.06 9.92 10.77 11.64 13.48 15.64
208.74 9.64 2.60 School 7.45 8.27 8.98 9.31 9.64 9.96 10.29 11.00 11.82
40 207.72 9.92 6.80 Student 4.19 6.35 8.19 9.06 9.92 10.77 11.64 13.48 15.64
209.67 9.73 2.60 School 7.54 8.37 9.07 9.41 9.73 10.06 10.39 11.10 11.92
45 209.59 9.92 6.80 Student 4.19 6.35 8.20 9.06 9.92 10.77 11.64 13.48 15.64
210.56 9.83 2.60 School 7.64 8.46 9.17 9.50 9.83 10.15 10.49 11.19 12.02
48 210.70 9.92 6.80 Student 4.20 6.35 8.20 9.06 9.92 10.77 11.64 13.48 15.64
211.09 9.88 2.60 School 7.69 8.52 9.22 9.56 9.88 10.21 10.54 11.25 12.07
50 211.44 9.92 6.80 Student 4.20 6.35 8.20 9.06 9.92 10.77 11.64 13.49 15.64
211.44 9.92 2.60 School 7.73 8.56 9.26 9.59 9.92 10.25 10.58 11.28 12.11
52 212.18 9.92 6.80 Student 4.20 6.35 8.20 9.06 9.92 10.77 11.64 13.49 15.64
211.79 9.96 2.60 School 7.77 8.59 9.30 9.63 9.96 10.28 10.61 11.32 12.14
55 213.28 9.92 6.80 Student 4.20 6.35 8.20 9.06 9.92 10.77 11.64 13.49 15.64
212.32 10.01 2.60 School 7.82 8.65 9.35 9.68 10.01 10.34 10.67 11.37 12.20
60 215.16 9.92 6.80 Student 4.20 6.35 8.20 9.07 9.92 10.77 11.64 13.49 15.64
213.21 10.11 2.60 School 7.92 8.74 9.45 9.78 10.11 10.43 10.76 11.47 12.29
65 217.09 9.92 6.80 Student 4.20 6.35 8.20 9.07 9.92 10.78 11.64 13.49 15.64
214.14 10.20 2.60 School 8.01 8.84 9.54 9.88 10.20 10.53 10.86 11.57 12.39
70 219.14 9.92 6.80 Student 4.20 6.36 8.20 9.07 9.92 10.78 11.64 13.49 15.65
215.11 10.30 2.60 School 8.12 8.94 9.65 9.98 10.30 10.63 10.96 11.67 12.49
75 221.34 9.92 6.80 Student 4.20 6.36 8.20 9.07 9.92 10.78 11.65 13.49 15.65
216.16 10.41 2.60 School 8.23 9.05 9.76 10.09 10.41 10.74 11.07 11.78 12.60
80 223.79 9.92 6.80 Student 4.20 6.36 8.20 9.07 9.92 10.78 11.65 13.49 15.65
217.33 10.54 2.60 School 8.35 9.17 9.88 10.21 10.54 10.86 11.20 11.90 12.73
85 226.65 9.92 6.80 Student 4.20 6.36 8.20 9.07 9.92 10.78 11.65 13.49 15.65
218.69 10.68 2.60 School 8.49 9.32 10.02 10.35 10.68 11.01 11.34 12.04 12.87
90 230.25 9.93 6.80 Student 4.20 6.36 8.20 9.07 9.93 10.78 11.65 13.49 15.65
220.41 10.86 2.60 School 8.67 9.50 10.20 10.53 10.86 11.19 11.52 12.22 13.05
CGI - Conditional Growth Index CGP - Conditional Growth Percentile
220

Table E.1.33: Mathematics Grade 5 From Fall To Winter Conditional Growth Percentile
Conditional Growth
Start Status Growth CGP 20 30 40 45 50 55 60 70 80
%ile RIT Mean SD CGI -0.84 -0.52 -0.25 -0.13 0.00 0.13 0.25 0.52 0.84
10 192.63 6.12 5.21 Student 1.73 3.39 4.80 5.47 6.12 6.78 7.44 8.85 10.51
202.47 5.25 1.49 School 4.00 4.47 4.87 5.06 5.25 5.44 5.63 6.03 6.50
20 199.09 6.01 5.21 Student 1.62 3.27 4.69 5.35 6.01 6.66 7.33 8.74 10.39
205.55 5.43 1.49 School 4.18 4.66 5.06 5.25 5.43 5.62 5.81 6.21 6.69
25 201.54 5.96 5.21 Student 1.58 3.23 4.64 5.31 5.96 6.62 7.28 8.70 10.35
206.72 5.50 1.49 School 4.25 4.73 5.13 5.32 5.50 5.69 5.88 6.28 6.76
30 203.74 5.92 5.21 Student 1.54 3.19 4.60 5.27 5.92 6.58 7.24 8.66 10.31
207.77 5.57 1.49 School 4.32 4.79 5.19 5.38 5.57 5.75 5.94 6.35 6.82
35 205.78 5.89 5.21 Student 1.50 3.16 4.57 5.23 5.89 6.54 7.21 8.62 10.27
208.74 5.63 1.49 School 4.38 4.85 5.25 5.44 5.63 5.81 6.00 6.41 6.88
40 207.72 5.85 5.21 Student 1.47 3.12 4.53 5.20 5.85 6.51 7.17 8.59 10.24
209.67 5.68 1.49 School 4.43 4.90 5.31 5.49 5.68 5.87 6.06 6.46 6.93
45 209.59 5.82 5.21 Student 1.43 3.09 4.50 5.17 5.82 6.48 7.14 8.55 10.21
210.56 5.74 1.49 School 4.48 4.96 5.36 5.55 5.74 5.92 6.11 6.51 6.99
48 210.70 5.80 5.21 Student 1.42 3.07 4.48 5.15 5.80 6.46 7.12 8.53 10.19
211.09 5.77 1.49 School 4.52 4.99 5.39 5.58 5.77 5.95 6.14 6.55 7.02
50 211.44 5.79 5.21 Student 1.40 3.06 4.47 5.13 5.79 6.44 7.11 8.52 10.17
211.44 5.79 1.49 School 4.54 5.01 5.41 5.60 5.79 5.97 6.16 6.57 7.04
52 212.18 5.78 5.21 Student 1.39 3.04 4.45 5.12 5.78 6.43 7.10 8.51 10.16
211.79 5.81 1.49 School 4.56 5.03 5.43 5.62 5.81 6.00 6.19 6.59 7.06
55 213.28 5.76 5.21 Student 1.37 3.02 4.44 5.10 5.76 6.41 7.08 8.49 10.14
212.32 5.84 1.49 School 4.59 5.06 5.46 5.65 5.84 6.03 6.22 6.62 7.09
60 215.16 5.72 5.21 Student 1.34 2.99 4.40 5.07 5.72 6.38 7.04 8.46 10.11
213.21 5.89 1.49 School 4.64 5.12 5.52 5.71 5.89 6.08 6.27 6.67 7.15
65 217.09 5.69 5.21 Student 1.30 2.96 4.37 5.03 5.69 6.34 7.01 8.42 10.07
214.14 5.95 1.49 School 4.70 5.17 5.57 5.76 5.95 6.14 6.33 6.73 7.20
70 219.14 5.65 5.21 Student 1.27 2.92 4.33 5.00 5.65 6.31 6.97 8.38 10.04
215.11 6.01 1.49 School 4.76 5.23 5.63 5.82 6.01 6.20 6.38 6.79 7.26
75 221.34 5.61 5.21 Student 1.23 2.88 4.29 4.96 5.61 6.27 6.93 8.35 10.00
216.16 6.07 1.49 School 4.82 5.29 5.69 5.88 6.07 6.26 6.45 6.85 7.32
80 223.79 5.57 5.21 Student 1.18 2.84 4.25 4.91 5.57 6.22 6.89 8.30 9.96
217.33 6.14 1.49 School 4.89 5.36 5.76 5.95 6.14 6.33 6.52 6.92 7.39
85 226.65 5.52 5.21 Student 1.13 2.79 4.20 4.86 5.52 6.17 6.84 8.25 9.90
218.69 6.22 1.49 School 4.97 5.44 5.85 6.04 6.22 6.41 6.60 7.00 7.47
90 230.25 5.46 5.21 Student 1.07 2.72 4.14 4.80 5.46 6.11 6.78 8.19 9.84
220.41 6.33 1.49 School 5.08 5.55 5.95 6.14 6.33 6.51 6.70 7.11 7.58
CGI - Conditional Growth Index CGP - Conditional Growth Percentile
221

Table E.1.34: Mathematics Grade 5 From Winter To Spring Conditional Growth Percentile
Conditional Growth
Start Status Growth CGP 20 30 40 45 50 55 60 70 80
%ile RIT Mean SD CGI -0.84 -0.52 -0.25 -0.13 0.00 0.13 0.25 0.52 0.84
10 197.58 3.98 4.81 Student -0.07 1.45 2.76 3.37 3.98 4.58 5.20 6.50 8.03
207.53 3.45 1.03 School 2.59 2.91 3.19 3.32 3.45 3.58 3.72 4.00 4.32
20 204.32 4.03 4.81 Student -0.02 1.51 2.81 3.43 4.03 4.64 5.25 6.56 8.08
210.86 3.69 1.03 School 2.82 3.15 3.43 3.56 3.69 3.82 3.95 4.23 4.55
25 206.89 4.05 4.81 Student -0.00 1.53 2.83 3.45 4.05 4.66 5.27 6.58 8.10
212.12 3.77 1.03 School 2.91 3.23 3.51 3.65 3.77 3.90 4.04 4.32 4.64
30 209.19 4.07 4.81 Student 0.02 1.54 2.85 3.46 4.07 4.67 5.29 6.59 8.12
213.26 3.85 1.03 School 2.99 3.31 3.59 3.72 3.85 3.98 4.12 4.40 4.72
35 211.32 4.09 4.81 Student 0.03 1.56 2.87 3.48 4.09 4.69 5.30 6.61 8.14
214.31 3.93 1.03 School 3.06 3.39 3.67 3.80 3.93 4.06 4.19 4.47 4.80
40 213.34 4.10 4.81 Student 0.05 1.58 2.88 3.50 4.10 4.71 5.32 6.63 8.15
215.31 4.00 1.03 School 3.13 3.46 3.74 3.87 4.00 4.13 4.26 4.54 4.87
45 215.30 4.12 4.81 Student 0.06 1.59 2.90 3.51 4.12 4.72 5.34 6.64 8.17
216.28 4.06 1.03 School 3.20 3.52 3.80 3.93 4.06 4.19 4.33 4.61 4.93
48 216.46 4.12 4.81 Student 0.07 1.60 2.91 3.52 4.12 4.73 5.34 6.65 8.18
216.85 4.10 1.03 School 3.24 3.56 3.84 3.97 4.10 4.23 4.37 4.65 4.97
50 217.23 4.13 4.81 Student 0.08 1.61 2.91 3.53 4.13 4.74 5.35 6.66 8.18
217.23 4.13 1.03 School 3.26 3.59 3.87 4.00 4.13 4.26 4.39 4.67 5.00
52 218.00 4.14 4.81 Student 0.09 1.61 2.92 3.53 4.14 4.74 5.36 6.66 8.19
217.61 4.16 1.03 School 3.29 3.62 3.90 4.03 4.16 4.29 4.42 4.70 5.03
55 219.15 4.15 4.81 Student 0.09 1.62 2.93 3.54 4.15 4.75 5.37 6.67 8.20
218.18 4.20 1.03 School 3.33 3.66 3.94 4.07 4.20 4.33 4.46 4.74 5.07
60 221.11 4.16 4.81 Student 0.11 1.64 2.94 3.56 4.16 4.77 5.38 6.69 8.21
219.14 4.26 1.03 School 3.40 3.72 4.00 4.13 4.26 4.39 4.53 4.81 5.13
65 223.13 4.18 4.81 Student 0.12 1.65 2.96 3.57 4.18 4.78 5.40 6.70 8.23
220.14 4.33 1.03 School 3.47 3.79 4.07 4.20 4.33 4.46 4.60 4.88 5.20
70 225.27 4.19 4.81 Student 0.14 1.67 2.97 3.59 4.19 4.80 5.41 6.72 8.24
221.19 4.41 1.03 School 3.54 3.87 4.15 4.28 4.41 4.54 4.67 4.95 5.28
75 227.57 4.21 4.81 Student 0.16 1.69 2.99 3.61 4.21 4.82 5.43 6.74 8.26
222.33 4.49 1.03 School 3.62 3.95 4.23 4.36 4.49 4.62 4.75 5.03 5.36
80 230.13 4.23 4.81 Student 0.18 1.71 3.01 3.63 4.23 4.84 5.45 6.75 8.28
223.59 4.57 1.03 School 3.71 4.03 4.31 4.45 4.57 4.70 4.84 5.12 5.44
85 233.12 4.25 4.81 Student 0.20 1.73 3.03 3.65 4.25 4.86 5.47 6.78 8.30
225.07 4.68 1.03 School 3.81 4.14 4.42 4.55 4.68 4.81 4.94 5.22 5.55
90 236.87 4.28 4.81 Student 0.23 1.76 3.06 3.68 4.28 4.89 5.50 6.81 8.33
226.92 4.81 1.03 School 3.94 4.27 4.55 4.68 4.81 4.94 5.07 5.35 5.68
CGI - Conditional Growth Index CGP - Conditional Growth Percentile
222
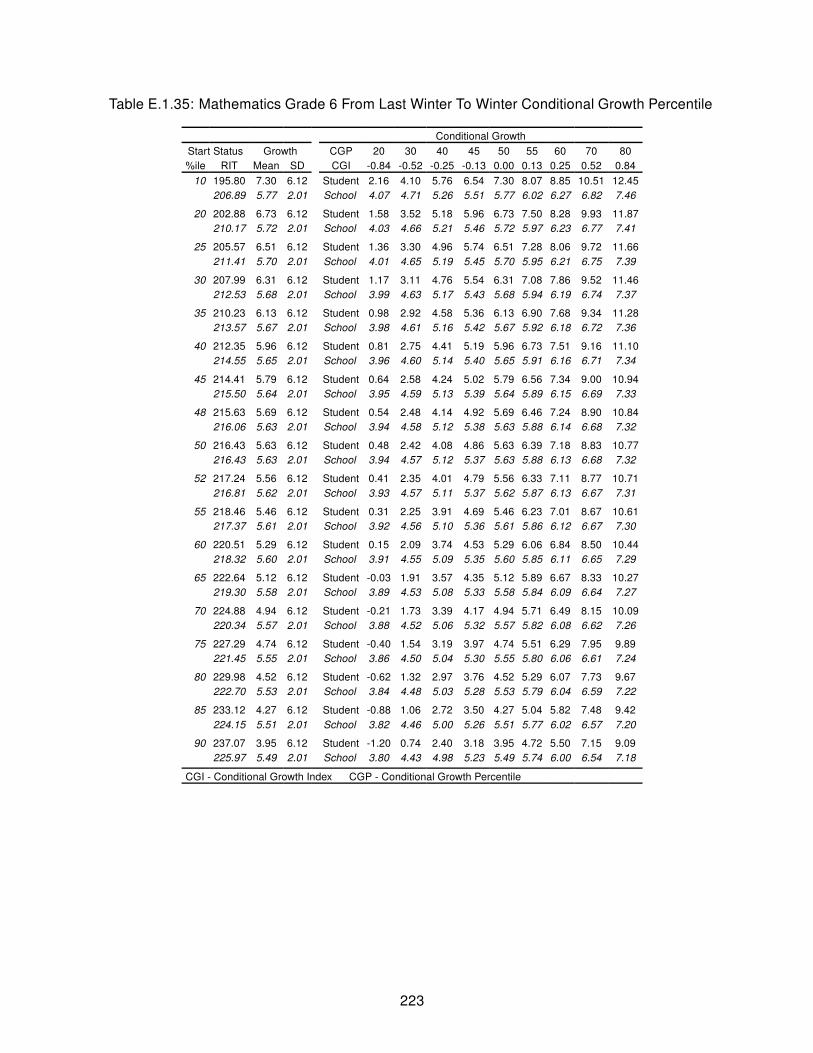
Table E.1.35: Mathematics Grade 6 From Last Winter To Winter Conditional Growth Percentile
Conditional Growth
Start Status Growth CGP 20 30 40 45 50 55 60 70 80
%ile RIT Mean SD CGI -0.84 -0.52 -0.25 -0.13 0.00 0.13 0.25 0.52 0.84
10 195.80 7.30 6.12 Student 2.16 4.10 5.76 6.54 7.30 8.07 8.85 10.51 12.45
206.89 5.77 2.01 School 4.07 4.71 5.26 5.51 5.77 6.02 6.27 6.82 7.46
20 202.88 6.73 6.12 Student 1.58 3.52 5.18 5.96 6.73 7.50 8.28 9.93 11.87
210.17 5.72 2.01 School 4.03 4.66 5.21 5.46 5.72 5.97 6.23 6.77 7.41
25 205.57 6.51 6.12 Student 1.36 3.30 4.96 5.74 6.51 7.28 8.06 9.72 11.66
211.41 5.70 2.01 School 4.01 4.65 5.19 5.45 5.70 5.95 6.21 6.75 7.39
30 207.99 6.31 6.12 Student 1.17 3.11 4.76 5.54 6.31 7.08 7.86 9.52 11.46
212.53 5.68 2.01 School 3.99 4.63 5.17 5.43 5.68 5.94 6.19 6.74 7.37
35 210.23 6.13 6.12 Student 0.98 2.92 4.58 5.36 6.13 6.90 7.68 9.34 11.28
213.57 5.67 2.01 School 3.98 4.61 5.16 5.42 5.67 5.92 6.18 6.72 7.36
40 212.35 5.96 6.12 Student 0.81 2.75 4.41 5.19 5.96 6.73 7.51 9.16 11.10
214.55 5.65 2.01 School 3.96 4.60 5.14 5.40 5.65 5.91 6.16 6.71 7.34
45 214.41 5.79 6.12 Student 0.64 2.58 4.24 5.02 5.79 6.56 7.34 9.00 10.94
215.50 5.64 2.01 School 3.95 4.59 5.13 5.39 5.64 5.89 6.15 6.69 7.33
48 215.63 5.69 6.12 Student 0.54 2.48 4.14 4.92 5.69 6.46 7.24 8.90 10.84
216.06 5.63 2.01 School 3.94 4.58 5.12 5.38 5.63 5.88 6.14 6.68 7.32
50 216.43 5.63 6.12 Student 0.48 2.42 4.08 4.86 5.63 6.39 7.18 8.83 10.77
216.43 5.63 2.01 School 3.94 4.57 5.12 5.37 5.63 5.88 6.13 6.68 7.32
52 217.24 5.56 6.12 Student 0.41 2.35 4.01 4.79 5.56 6.33 7.11 8.77 10.71
216.81 5.62 2.01 School 3.93 4.57 5.11 5.37 5.62 5.87 6.13 6.67 7.31
55 218.46 5.46 6.12 Student 0.31 2.25 3.91 4.69 5.46 6.23 7.01 8.67 10.61
217.37 5.61 2.01 School 3.92 4.56 5.10 5.36 5.61 5.86 6.12 6.67 7.30
60 220.51 5.29 6.12 Student 0.15 2.09 3.74 4.53 5.29 6.06 6.84 8.50 10.44
218.32 5.60 2.01 School 3.91 4.55 5.09 5.35 5.60 5.85 6.11 6.65 7.29
65 222.64 5.12 6.12 Student -0.03 1.91 3.57 4.35 5.12 5.89 6.67 8.33 10.27
219.30 5.58 2.01 School 3.89 4.53 5.08 5.33 5.58 5.84 6.09 6.64 7.27
70 224.88 4.94 6.12 Student -0.21 1.73 3.39 4.17 4.94 5.71 6.49 8.15 10.09
220.34 5.57 2.01 School 3.88 4.52 5.06 5.32 5.57 5.82 6.08 6.62 7.26
75 227.29 4.74 6.12 Student -0.40 1.54 3.19 3.97 4.74 5.51 6.29 7.95 9.89
221.45 5.55 2.01 School 3.86 4.50 5.04 5.30 5.55 5.80 6.06 6.61 7.24
80 229.98 4.52 6.12 Student -0.62 1.32 2.97 3.76 4.52 5.29 6.07 7.73 9.67
222.70 5.53 2.01 School 3.84 4.48 5.03 5.28 5.53 5.79 6.04 6.59 7.22
85 233.12 4.27 6.12 Student -0.88 1.06 2.72 3.50 4.27 5.04 5.82 7.48 9.42
224.15 5.51 2.01 School 3.82 4.46 5.00 5.26 5.51 5.77 6.02 6.57 7.20
90 237.07 3.95 6.12 Student -1.20 0.74 2.40 3.18 3.95 4.72 5.50 7.15 9.09
225.97 5.49 2.01 School 3.80 4.43 4.98 5.23 5.49 5.74 6.00 6.54 7.18
CGI - Conditional Growth Index CGP - Conditional Growth Percentile
223

Table E.1.36: Mathematics Grade 6 From Last Spring To Spring Conditional Growth Percentile
Conditional Growth
Start Status Growth CGP 20 30 40 45 50 55 60 70 80
%ile RIT Mean SD CGI -0.84 -0.52 -0.25 -0.13 0.00 0.13 0.25 0.52 0.84
10 198.21 7.58 6.84 Student 1.82 3.99 5.84 6.72 7.58 8.43 9.31 11.16 13.33
210.05 5.47 2.49 School 3.37 4.16 4.83 5.15 5.47 5.78 6.10 6.77 7.56
20 205.84 6.65 6.84 Student 0.90 3.07 4.92 5.79 6.65 7.51 8.38 10.23 12.40
213.62 5.26 2.49 School 3.17 3.96 4.63 4.95 5.26 5.58 5.90 6.57 7.36
25 208.74 6.30 6.84 Student 0.55 2.71 4.57 5.44 6.30 7.16 8.03 9.88 12.05
214.98 5.19 2.49 School 3.09 3.88 4.56 4.88 5.19 5.50 5.82 6.49 7.28
30 211.35 5.98 6.84 Student 0.23 2.40 4.25 5.12 5.98 6.84 7.71 9.57 11.74
216.19 5.12 2.49 School 3.02 3.81 4.49 4.81 5.12 5.43 5.75 6.43 7.22
35 213.76 5.69 6.84 Student -0.06 2.11 3.96 4.83 5.69 6.55 7.42 9.27 11.44
217.32 5.06 2.49 School 2.96 3.75 4.42 4.74 5.06 5.37 5.69 6.36 7.15
40 216.05 5.41 6.84 Student -0.34 1.83 3.68 4.55 5.41 6.27 7.14 9.00 11.17
218.39 5.00 2.49 School 2.90 3.69 4.36 4.68 5.00 5.31 5.63 6.30 7.09
45 218.26 5.14 6.84 Student -0.61 1.56 3.41 4.28 5.14 6.00 6.88 8.73 10.90
219.43 4.94 2.49 School 2.84 3.63 4.31 4.62 4.94 5.25 5.57 6.24 7.03
48 219.57 4.98 6.84 Student -0.77 1.40 3.25 4.13 4.98 5.84 6.72 8.57 10.74
220.04 4.90 2.49 School 2.81 3.60 4.27 4.59 4.90 5.22 5.53 6.21 7.00
50 220.44 4.88 6.84 Student -0.87 1.29 3.15 4.02 4.88 5.74 6.61 8.46 10.63
220.44 4.88 2.49 School 2.78 3.57 4.25 4.57 4.88 5.19 5.51 6.19 6.98
52 221.31 4.77 6.84 Student -0.98 1.19 3.04 3.91 4.77 5.63 6.51 8.36 10.53
220.85 4.86 2.49 School 2.76 3.55 4.23 4.54 4.86 5.17 5.49 6.16 6.95
55 222.62 4.61 6.84 Student -1.14 1.03 2.88 3.76 4.61 5.47 6.35 8.20 10.37
221.46 4.82 2.49 School 2.73 3.52 4.19 4.51 4.82 5.13 5.45 6.13 6.92
60 224.84 4.35 6.84 Student -1.41 0.76 2.61 3.49 4.35 5.21 6.08 7.93 10.10
222.50 4.76 2.49 School 2.67 3.46 4.13 4.45 4.76 5.08 5.39 6.07 6.86
65 227.13 4.07 6.84 Student -1.68 0.48 2.34 3.21 4.07 4.93 5.80 7.65 9.82
223.57 4.70 2.49 School 2.61 3.40 4.07 4.39 4.70 5.02 5.33 6.01 6.80
70 229.54 3.78 6.84 Student -1.98 0.19 2.04 2.92 3.78 4.63 5.51 7.36 9.53
224.70 4.64 2.49 School 2.54 3.33 4.01 4.33 4.64 4.95 5.27 5.95 6.74
75 232.15 3.46 6.84 Student -2.29 -0.12 1.73 2.60 3.46 4.32 5.19 7.04 9.21
225.91 4.57 2.49 School 2.47 3.26 3.94 4.26 4.57 4.88 5.20 5.88 6.67
80 235.05 3.11 6.84 Student -2.64 -0.48 1.38 2.25 3.11 3.97 4.84 6.69 8.86
227.27 4.49 2.49 School 2.40 3.19 3.86 4.18 4.49 4.81 5.13 5.80 6.59
85 238.43 2.70 6.84 Student -3.05 -0.89 0.97 1.84 2.70 3.56 4.43 6.28 8.45
228.85 4.40 2.49 School 2.31 3.10 3.77 4.09 4.40 4.72 5.04 5.71 6.50
90 242.68 2.18 6.84 Student -3.57 -1.40 0.45 1.32 2.18 3.04 3.91 5.77 7.94
230.83 4.29 2.49 School 2.20 2.99 3.66 3.98 4.29 4.61 4.92 5.60 6.39
CGI - Conditional Growth Index CGP - Conditional Growth Percentile
224

Table E.1.37: Mathematics Grade 6 From Fall To N Fall Conditional Growth Percentile
Conditional Growth
Start Status Growth CGP 20 30 40 45 50 55 60 70 80
%ile RIT Mean SD CGI -0.84 -0.52 -0.25 -0.13 0.00 0.13 0.25 0.52 0.84
10 197.72 6.61 6.67 Student 1.00 3.11 4.92 5.77 6.61 7.45 8.30 10.10 12.22
208.40 6.06 1.96 School 4.41 5.03 5.56 5.81 6.06 6.31 6.56 7.09 7.71
20 204.55 6.64 6.67 Student 1.03 3.15 4.95 5.80 6.64 7.48 8.33 10.14 12.25
211.56 6.28 1.96 School 4.63 5.25 5.79 6.04 6.28 6.53 6.78 7.31 7.93
25 207.14 6.65 6.67 Student 1.04 3.16 4.96 5.82 6.65 7.49 8.34 10.15 12.26
212.77 6.36 1.96 School 4.72 5.34 5.87 6.12 6.36 6.61 6.86 7.39 8.01
30 209.47 6.66 6.67 Student 1.05 3.17 4.98 5.83 6.66 7.50 8.35 10.16 12.27
213.85 6.44 1.96 School 4.79 5.41 5.94 6.19 6.44 6.69 6.94 7.47 8.09
35 211.63 6.67 6.67 Student 1.06 3.18 4.99 5.84 6.67 7.51 8.36 10.17 12.28
214.85 6.51 1.96 School 4.86 5.48 6.01 6.26 6.51 6.76 7.01 7.54 8.16
40 213.68 6.68 6.67 Student 1.07 3.19 5.00 5.85 6.68 7.52 8.37 10.18 12.29
215.80 6.58 1.96 School 4.93 5.55 6.08 6.33 6.58 6.82 7.07 7.60 8.22
45 215.67 6.69 6.67 Student 1.08 3.20 5.01 5.86 6.69 7.53 8.38 10.19 12.30
216.71 6.64 1.96 School 4.99 5.61 6.14 6.39 6.64 6.89 7.14 7.67 8.29
48 216.84 6.70 6.67 Student 1.09 3.20 5.01 5.86 6.70 7.54 8.39 10.19 12.31
217.26 6.68 1.96 School 5.03 5.65 6.18 6.43 6.68 6.92 7.17 7.70 8.32
50 217.62 6.70 6.67 Student 1.09 3.21 5.01 5.87 6.70 7.54 8.39 10.20 12.31
217.62 6.70 1.96 School 5.06 5.68 6.21 6.46 6.70 6.95 7.20 7.73 8.35
52 218.40 6.71 6.67 Student 1.10 3.21 5.02 5.87 6.71 7.54 8.40 10.20 12.32
217.98 6.73 1.96 School 5.08 5.70 6.23 6.48 6.73 6.97 7.22 7.75 8.38
55 219.57 6.71 6.67 Student 1.10 3.22 5.02 5.87 6.71 7.55 8.40 10.21 12.32
218.52 6.77 1.96 School 5.12 5.74 6.27 6.52 6.77 7.01 7.26 7.79 8.41
60 221.55 6.72 6.67 Student 1.11 3.23 5.03 5.88 6.72 7.56 8.41 10.22 12.33
219.44 6.83 1.96 School 5.18 5.80 6.33 6.58 6.83 7.08 7.33 7.86 8.48
65 223.60 6.73 6.67 Student 1.12 3.24 5.04 5.89 6.73 7.57 8.42 10.23 12.34
220.39 6.90 1.96 School 5.25 5.87 6.40 6.65 6.90 7.14 7.39 7.92 8.54
70 225.76 6.74 6.67 Student 1.13 3.25 5.05 5.90 6.74 7.58 8.43 10.24 12.35
221.39 6.97 1.96 School 5.32 5.94 6.47 6.72 6.97 7.21 7.46 7.99 8.61
75 228.09 6.75 6.67 Student 1.14 3.26 5.06 5.91 6.75 7.59 8.44 10.25 12.36
222.47 7.04 1.96 School 5.39 6.01 6.55 6.80 7.04 7.29 7.54 8.07 8.69
80 230.69 6.76 6.67 Student 1.15 3.27 5.08 5.93 6.76 7.60 8.45 10.26 12.37
223.67 7.12 1.96 School 5.48 6.10 6.63 6.88 7.12 7.37 7.62 8.15 8.77
85 233.71 6.78 6.67 Student 1.17 3.28 5.09 5.94 6.78 7.62 8.47 10.27 12.39
225.07 7.22 1.96 School 5.58 6.20 6.73 6.98 7.22 7.47 7.72 8.25 8.87
90 237.52 6.80 6.67 Student 1.19 3.30 5.11 5.96 6.80 7.63 8.49 10.29 12.41
226.84 7.35 1.96 School 5.70 6.32 6.85 7.10 7.35 7.59 7.84 8.37 8.99
CGI - Conditional Growth Index CGP - Conditional Growth Percentile
225

Table E.1.38: Mathematics Grade 6 From Fall To Spring Conditional Growth Percentile
Conditional Growth
Start Status Growth CGP 20 30 40 45 50 55 60 70 80
%ile RIT Mean SD CGI -0.84 -0.52 -0.25 -0.13 0.00 0.13 0.25 0.52 0.84
10 197.72 8.01 6.74 Student 2.34 4.48 6.31 7.17 8.01 8.86 9.72 11.55 13.69
208.40 7.03 2.27 School 5.13 5.84 6.46 6.75 7.03 7.32 7.61 8.22 8.94
20 204.55 7.91 6.74 Student 2.23 4.37 6.20 7.06 7.91 8.75 9.62 11.44 13.58
211.56 7.26 2.27 School 5.36 6.08 6.69 6.98 7.26 7.55 7.84 8.45 9.17
25 207.14 7.87 6.74 Student 2.19 4.33 6.16 7.02 7.87 8.71 9.58 11.40 13.54
212.77 7.35 2.27 School 5.44 6.16 6.78 7.07 7.35 7.64 7.93 8.54 9.26
30 209.47 7.83 6.74 Student 2.16 4.30 6.12 6.98 7.83 8.68 9.54 11.37 13.51
213.85 7.43 2.27 School 5.52 6.24 6.86 7.15 7.43 7.72 8.00 8.62 9.34
35 211.63 7.80 6.74 Student 2.12 4.26 6.09 6.95 7.80 8.65 9.51 11.33 13.47
214.85 7.50 2.27 School 5.60 6.31 6.93 7.22 7.50 7.79 8.08 8.69 9.41
40 213.68 7.77 6.74 Student 2.09 4.23 6.06 6.92 7.77 8.61 9.47 11.30 13.44
215.80 7.57 2.27 School 5.66 6.38 7.00 7.29 7.57 7.86 8.15 8.76 9.48
45 215.67 7.74 6.74 Student 2.06 4.20 6.03 6.89 7.74 8.58 9.44 11.27 13.41
216.71 7.64 2.27 School 5.73 6.45 7.07 7.35 7.64 7.92 8.21 8.83 9.55
48 216.84 7.72 6.74 Student 2.04 4.18 6.01 6.87 7.72 8.56 9.43 11.25 13.39
217.26 7.68 2.27 School 5.77 6.49 7.10 7.39 7.68 7.96 8.25 8.87 9.59
50 217.62 7.71 6.74 Student 2.03 4.17 6.00 6.86 7.71 8.55 9.41 11.24 13.38
217.62 7.71 2.27 School 5.80 6.52 7.13 7.42 7.71 7.99 8.28 8.89 9.61
52 218.40 7.69 6.74 Student 2.02 4.16 5.98 6.85 7.69 8.54 9.40 11.23 13.37
217.98 7.73 2.27 School 5.82 6.54 7.16 7.45 7.73 8.02 8.31 8.92 9.64
55 219.57 7.68 6.74 Student 2.00 4.14 5.97 6.83 7.68 8.52 9.38 11.21 13.35
218.52 7.77 2.27 School 5.86 6.58 7.20 7.49 7.77 8.06 8.35 8.96 9.68
60 221.55 7.64 6.74 Student 1.97 4.11 5.94 6.80 7.64 8.49 9.35 11.18 13.32
219.44 7.84 2.27 School 5.93 6.65 7.26 7.55 7.84 8.12 8.41 9.03 9.75
65 223.60 7.61 6.74 Student 1.94 4.08 5.90 6.77 7.61 8.46 9.32 11.15 13.29
220.39 7.91 2.27 School 6.00 6.72 7.33 7.62 7.91 8.19 8.48 9.10 9.82
70 225.76 7.58 6.74 Student 1.90 4.04 5.87 6.73 7.58 8.43 9.29 11.12 13.25
221.39 7.98 2.27 School 6.07 6.79 7.41 7.70 7.98 8.27 8.55 9.17 9.89
75 228.09 7.54 6.74 Student 1.87 4.01 5.83 6.70 7.54 8.39 9.25 11.08 13.22
222.47 8.06 2.27 School 6.15 6.87 7.48 7.77 8.06 8.34 8.63 9.25 9.97
80 230.69 7.50 6.74 Student 1.83 3.97 5.79 6.66 7.50 8.35 9.21 11.04 13.18
223.67 8.15 2.27 School 6.24 6.96 7.57 7.86 8.15 8.43 8.72 9.34 10.05
85 233.71 7.46 6.74 Student 1.78 3.92 5.75 6.61 7.46 8.30 9.16 10.99 13.13
225.07 8.25 2.27 School 6.34 7.06 7.67 7.96 8.25 8.53 8.82 9.44 10.16
90 237.52 7.40 6.74 Student 1.72 3.86 5.69 6.55 7.40 8.24 9.11 10.93 13.07
226.84 8.38 2.27 School 6.47 7.19 7.80 8.09 8.38 8.66 8.95 9.57 10.29
CGI - Conditional Growth Index CGP - Conditional Growth Percentile
226

Table E.1.39: Mathematics Grade 6 From Fall To Winter Conditional Growth Percentile
Conditional Growth
Start Status Growth CGP 20 30 40 45 50 55 60 70 80
%ile RIT Mean SD CGI -0.84 -0.52 -0.25 -0.13 0.00 0.13 0.25 0.52 0.84
10 197.72 4.94 5.18 Student 0.58 2.22 3.62 4.28 4.94 5.59 6.25 7.65 9.30
208.40 4.06 1.30 School 2.97 3.38 3.73 3.89 4.06 4.22 4.39 4.74 5.15
20 204.55 4.77 5.18 Student 0.41 2.05 3.45 4.11 4.77 5.42 6.08 7.48 9.13
211.56 4.19 1.30 School 3.10 3.51 3.86 4.03 4.19 4.35 4.52 4.87 5.28
25 207.14 4.70 5.18 Student 0.34 1.98 3.39 4.05 4.70 5.35 6.01 7.42 9.06
212.77 4.24 1.30 School 3.15 3.56 3.91 4.08 4.24 4.40 4.57 4.92 5.33
30 209.47 4.64 5.18 Student 0.28 1.93 3.33 3.99 4.64 5.29 5.96 7.36 9.00
213.85 4.28 1.30 School 3.19 3.60 3.96 4.12 4.28 4.45 4.61 4.96 5.37
35 211.63 4.59 5.18 Student 0.23 1.87 3.28 3.94 4.59 5.24 5.90 7.31 8.95
214.85 4.33 1.30 School 3.24 3.65 4.00 4.16 4.33 4.49 4.65 5.01 5.42
40 213.68 4.54 5.18 Student 0.18 1.82 3.23 3.89 4.54 5.19 5.85 7.26 8.90
215.80 4.37 1.30 School 3.27 3.69 4.04 4.20 4.37 4.53 4.69 5.04 5.46
45 215.67 4.49 5.18 Student 0.13 1.77 3.18 3.84 4.49 5.14 5.80 7.21 8.85
216.71 4.40 1.30 School 3.31 3.72 4.08 4.24 4.40 4.57 4.73 5.08 5.49
48 216.84 4.46 5.18 Student 0.10 1.74 3.15 3.81 4.46 5.11 5.77 7.18 8.82
217.26 4.43 1.30 School 3.34 3.75 4.10 4.26 4.43 4.59 4.75 5.11 5.52
50 217.62 4.44 5.18 Student 0.08 1.72 3.13 3.79 4.44 5.09 5.75 7.16 8.80
217.62 4.44 1.30 School 3.35 3.76 4.11 4.28 4.44 4.60 4.77 5.12 5.53
52 218.40 4.42 5.18 Student 0.06 1.71 3.11 3.77 4.42 5.07 5.73 7.14 8.78
217.98 4.46 1.30 School 3.37 3.78 4.13 4.29 4.46 4.62 4.78 5.14 5.55
55 219.57 4.39 5.18 Student 0.03 1.68 3.08 3.74 4.39 5.04 5.71 7.11 8.75
218.52 4.48 1.30 School 3.39 3.80 4.15 4.32 4.48 4.64 4.81 5.16 5.57
60 221.55 4.34 5.18 Student -0.02 1.63 3.03 3.69 4.34 4.99 5.66 7.06 8.70
219.44 4.52 1.30 School 3.43 3.84 4.19 4.35 4.52 4.68 4.85 5.20 5.61
65 223.60 4.29 5.18 Student -0.07 1.58 2.98 3.64 4.29 4.94 5.61 7.01 8.65
220.39 4.56 1.30 School 3.47 3.88 4.23 4.39 4.56 4.72 4.88 5.24 5.65
70 225.76 4.24 5.18 Student -0.12 1.52 2.93 3.59 4.24 4.89 5.55 6.96 8.60
221.39 4.60 1.30 School 3.51 3.92 4.27 4.44 4.60 4.76 4.93 5.28 5.69
75 228.09 4.18 5.18 Student -0.18 1.46 2.87 3.53 4.18 4.83 5.49 6.90 8.54
222.47 4.64 1.30 School 3.55 3.96 4.31 4.48 4.64 4.81 4.97 5.32 5.73
80 230.69 4.12 5.18 Student -0.24 1.40 2.80 3.47 4.12 4.77 5.43 6.83 8.48
223.67 4.69 1.30 School 3.60 4.01 4.37 4.53 4.69 4.86 5.02 5.37 5.78
85 233.71 4.04 5.18 Student -0.32 1.32 2.73 3.39 4.04 4.69 5.35 6.76 8.40
225.07 4.75 1.30 School 3.66 4.07 4.42 4.59 4.75 4.91 5.08 5.43 5.84
90 237.52 3.95 5.18 Student -0.41 1.23 2.63 3.30 3.95 4.60 5.26 6.66 8.31
226.84 4.83 1.30 School 3.73 4.15 4.50 4.66 4.83 4.99 5.15 5.50 5.92
CGI - Conditional Growth Index CGP - Conditional Growth Percentile
227

Table E.1.40: Mathematics Grade 6 From Winter To Spring Conditional Growth Percentile
Conditional Growth
Start Status Growth CGP 20 30 40 45 50 55 60 70 80
%ile RIT Mean SD CGI -0.84 -0.52 -0.25 -0.13 0.00 0.13 0.25 0.52 0.84
10 201.55 3.26 4.80 Student -0.78 0.75 2.05 2.66 3.26 3.87 4.48 5.78 7.31
212.31 2.77 0.92 School 1.99 2.29 2.54 2.65 2.77 2.88 3.00 3.25 3.54
20 208.59 3.26 4.80 Student -0.78 0.75 2.05 2.66 3.26 3.87 4.48 5.78 7.31
215.66 2.94 0.92 School 2.16 2.46 2.71 2.82 2.94 3.05 3.17 3.42 3.71
25 211.26 3.26 4.80 Student -0.78 0.75 2.05 2.66 3.26 3.87 4.48 5.78 7.31
216.93 3.00 0.92 School 2.23 2.52 2.77 2.89 3.00 3.12 3.24 3.49 3.78
30 213.67 3.26 4.80 Student -0.78 0.75 2.05 2.66 3.26 3.87 4.48 5.78 7.31
218.07 3.06 0.92 School 2.29 2.58 2.83 2.95 3.06 3.18 3.29 3.54 3.84
35 215.89 3.26 4.80 Student -0.78 0.75 2.05 2.66 3.26 3.87 4.48 5.78 7.31
219.13 3.12 0.92 School 2.34 2.63 2.88 3.00 3.12 3.23 3.35 3.60 3.89
40 218.00 3.26 4.80 Student -0.78 0.75 2.05 2.66 3.26 3.87 4.48 5.78 7.31
220.13 3.17 0.92 School 2.39 2.68 2.93 3.05 3.17 3.28 3.40 3.65 3.94
45 220.05 3.26 4.80 Student -0.78 0.75 2.05 2.66 3.26 3.87 4.48 5.78 7.31
221.10 3.22 0.92 School 2.44 2.73 2.98 3.10 3.22 3.33 3.45 3.70 3.99
48 221.26 3.26 4.80 Student -0.78 0.75 2.05 2.66 3.26 3.87 4.48 5.78 7.31
221.68 3.24 0.92 School 2.47 2.76 3.01 3.13 3.24 3.36 3.48 3.73 4.02
50 222.06 3.26 4.80 Student -0.78 0.75 2.05 2.66 3.26 3.87 4.48 5.78 7.31
222.06 3.26 0.92 School 2.49 2.78 3.03 3.15 3.26 3.38 3.50 3.75 4.04
52 222.86 3.26 4.80 Student -0.78 0.75 2.05 2.66 3.26 3.87 4.48 5.78 7.31
222.44 3.28 0.92 School 2.51 2.80 3.05 3.17 3.28 3.40 3.52 3.77 4.06
55 224.07 3.26 4.80 Student -0.78 0.75 2.05 2.66 3.26 3.87 4.48 5.78 7.31
223.02 3.31 0.92 School 2.54 2.83 3.08 3.20 3.31 3.43 3.55 3.80 4.09
60 226.11 3.26 4.80 Student -0.78 0.75 2.05 2.66 3.26 3.87 4.48 5.78 7.31
223.99 3.36 0.92 School 2.59 2.88 3.13 3.25 3.36 3.48 3.60 3.84 4.14
65 228.23 3.26 4.80 Student -0.78 0.75 2.05 2.66 3.26 3.87 4.48 5.78 7.31
224.99 3.41 0.92 School 2.64 2.93 3.18 3.30 3.41 3.53 3.65 3.90 4.19
70 230.45 3.26 4.80 Student -0.78 0.75 2.05 2.66 3.26 3.87 4.48 5.78 7.31
226.05 3.47 0.92 School 2.69 2.98 3.23 3.35 3.47 3.58 3.70 3.95 4.24
75 232.85 3.26 4.80 Student -0.78 0.75 2.05 2.66 3.26 3.87 4.48 5.78 7.31
227.19 3.53 0.92 School 2.75 3.04 3.29 3.41 3.53 3.64 3.76 4.01 4.30
80 235.53 3.26 4.80 Student -0.78 0.75 2.05 2.66 3.26 3.87 4.48 5.78 7.31
228.46 3.59 0.92 School 2.82 3.11 3.36 3.47 3.59 3.71 3.82 4.07 4.36
85 238.65 3.26 4.80 Student -0.78 0.75 2.05 2.66 3.26 3.87 4.48 5.78 7.31
229.94 3.67 0.92 School 2.89 3.18 3.43 3.55 3.67 3.78 3.90 4.15 4.44
90 242.57 3.26 4.80 Student -0.78 0.75 2.05 2.66 3.26 3.87 4.48 5.78 7.31
231.81 3.76 0.92 School 2.99 3.28 3.53 3.64 3.76 3.88 3.99 4.24 4.53
CGI - Conditional Growth Index CGP - Conditional Growth Percentile
228

Table E.1.41: Mathematics Grade 7 From Last Winter To Winter Conditional Growth Percentile
Conditional Growth
Start Status Growth CGP 20 30 40 45 50 55 60 70 80
%ile RIT Mean SD CGI -0.84 -0.52 -0.25 -0.13 0.00 0.13 0.25 0.52 0.84
10 199.31 6.22 5.76 Student 1.38 3.21 4.77 5.50 6.22 6.95 7.68 9.24 11.07
210.63 5.42 1.80 School 3.90 4.47 4.96 5.19 5.42 5.64 5.87 6.36 6.93
20 206.67 5.93 5.76 Student 1.08 2.91 4.47 5.21 5.93 6.65 7.39 8.95 10.77
214.11 5.40 1.80 School 3.88 4.45 4.94 5.17 5.40 5.62 5.85 6.34 6.91
25 209.47 5.82 5.76 Student 0.97 2.80 4.36 5.09 5.82 6.54 7.27 8.83 10.66
215.43 5.39 1.80 School 3.88 4.45 4.94 5.17 5.39 5.62 5.85 6.33 6.90
30 211.98 5.72 5.76 Student 0.87 2.70 4.26 4.99 5.72 6.44 7.17 8.73 10.56
216.62 5.38 1.80 School 3.87 4.44 4.93 5.16 5.38 5.61 5.84 6.33 6.90
35 214.31 5.62 5.76 Student 0.78 2.60 4.16 4.90 5.62 6.35 7.08 8.64 10.47
217.71 5.38 1.80 School 3.87 4.44 4.92 5.15 5.38 5.61 5.83 6.32 6.89
40 216.52 5.53 5.76 Student 0.69 2.51 4.07 4.81 5.53 6.26 6.99 8.55 10.38
218.76 5.37 1.80 School 3.86 4.43 4.92 5.15 5.37 5.60 5.83 6.32 6.89
45 218.65 5.45 5.76 Student 0.60 2.43 3.99 4.72 5.45 6.17 6.91 8.47 10.29
219.77 5.37 1.80 School 3.85 4.43 4.91 5.14 5.37 5.59 5.82 6.31 6.88
48 219.92 5.40 5.76 Student 0.55 2.38 3.94 4.67 5.40 6.12 6.86 8.42 10.24
220.36 5.37 1.80 School 3.85 4.42 4.91 5.14 5.37 5.59 5.82 6.31 6.88
50 220.76 5.36 5.76 Student 0.52 2.34 3.90 4.64 5.36 6.09 6.82 8.38 10.21
220.76 5.36 1.80 School 3.85 4.42 4.91 5.14 5.36 5.59 5.82 6.31 6.88
52 221.60 5.33 5.76 Student 0.48 2.31 3.87 4.61 5.33 6.05 6.79 8.35 10.17
221.15 5.36 1.80 School 3.85 4.42 4.91 5.14 5.36 5.59 5.82 6.30 6.87
55 222.86 5.28 5.76 Student 0.43 2.26 3.82 4.56 5.28 6.00 6.74 8.30 10.12
221.75 5.36 1.80 School 3.84 4.41 4.90 5.13 5.36 5.58 5.81 6.30 6.87
60 225.00 5.19 5.76 Student 0.35 2.17 3.73 4.47 5.19 5.92 6.65 8.21 10.04
222.76 5.35 1.80 School 3.84 4.41 4.90 5.13 5.35 5.58 5.81 6.30 6.87
65 227.21 5.10 5.76 Student 0.26 2.09 3.65 4.38 5.10 5.83 6.56 8.12 9.95
223.80 5.35 1.80 School 3.83 4.40 4.89 5.12 5.35 5.57 5.80 6.29 6.86
70 229.54 5.01 5.76 Student 0.17 1.99 3.55 4.29 5.01 5.73 6.47 8.03 9.86
224.90 5.34 1.80 School 3.83 4.40 4.89 5.12 5.34 5.57 5.80 6.28 6.86
75 232.05 4.91 5.76 Student 0.07 1.89 3.45 4.19 4.91 5.63 6.37 7.93 9.75
226.09 5.34 1.80 School 3.82 4.39 4.88 5.11 5.34 5.56 5.79 6.28 6.85
80 234.85 4.80 5.76 Student -0.05 1.78 3.34 4.07 4.80 5.52 6.26 7.82 9.64
227.41 5.33 1.80 School 3.81 4.39 4.87 5.10 5.33 5.55 5.78 6.27 6.84
85 238.11 4.67 5.76 Student -0.18 1.65 3.21 3.94 4.67 5.39 6.13 7.69 9.51
228.95 5.32 1.80 School 3.81 4.38 4.86 5.09 5.32 5.55 5.78 6.26 6.83
90 242.21 4.50 5.76 Student -0.34 1.48 3.04 3.78 4.50 5.23 5.96 7.52 9.35
230.88 5.31 1.80 School 3.80 4.37 4.85 5.08 5.31 5.54 5.77 6.25 6.82
CGI - Conditional Growth Index CGP - Conditional Growth Percentile
229

Table E.1.42: Mathematics Grade 7 From Last Spring To Spring Conditional Growth Percentile
Conditional Growth
Start Status Growth CGP 20 30 40 45 50 55 60 70 80
%ile RIT Mean SD CGI -0.84 -0.52 -0.25 -0.13 0.00 0.13 0.25 0.52 0.84
10 200.89 6.56 6.46 Student 1.12 3.17 4.92 5.74 6.56 7.37 8.19 9.95 12.00
212.79 5.37 2.17 School 3.54 4.23 4.82 5.09 5.37 5.64 5.92 6.51 7.20
20 208.71 5.99 6.46 Student 0.55 2.60 4.36 5.18 5.99 6.81 7.63 9.38 11.43
216.53 5.21 2.17 School 3.38 4.07 4.66 4.94 5.21 5.49 5.76 6.35 7.04
25 211.69 5.78 6.46 Student 0.34 2.39 4.14 4.97 5.78 6.59 7.42 9.17 11.22
217.95 5.15 2.17 School 3.32 4.01 4.60 4.88 5.15 5.43 5.70 6.29 6.98
30 214.35 5.59 6.46 Student 0.15 2.20 3.95 4.78 5.59 6.40 7.22 8.98 11.03
219.22 5.10 2.17 School 3.27 3.96 4.55 4.83 5.10 5.37 5.65 6.24 6.93
35 216.83 5.41 6.46 Student -0.03 2.02 3.77 4.60 5.41 6.22 7.05 8.80 10.85
220.40 5.05 2.17 School 3.22 3.91 4.50 4.78 5.05 5.32 5.60 6.19 6.88
40 219.17 5.24 6.46 Student -0.20 1.85 3.60 4.43 5.24 6.05 6.88 8.63 10.68
221.52 5.01 2.17 School 3.18 3.87 4.45 4.73 5.01 5.28 5.56 6.15 6.83
45 221.44 5.08 6.46 Student -0.36 1.69 3.44 4.26 5.08 5.89 6.71 8.47 10.52
222.61 4.96 2.17 School 3.13 3.82 4.41 4.69 4.96 5.23 5.51 6.10 6.79
48 222.79 4.98 6.46 Student -0.46 1.59 3.34 4.17 4.98 5.79 6.62 8.37 10.42
223.25 4.93 2.17 School 3.10 3.79 4.38 4.66 4.93 5.21 5.48 6.07 6.76
50 223.68 4.92 6.46 Student -0.52 1.53 3.28 4.10 4.92 5.73 6.55 8.31 10.36
223.68 4.92 2.17 School 3.09 3.78 4.37 4.64 4.92 5.19 5.47 6.06 6.75
52 224.57 4.85 6.46 Student -0.59 1.46 3.21 4.04 4.85 5.66 6.49 8.24 10.29
224.10 4.90 2.17 School 3.07 3.76 4.35 4.63 4.90 5.17 5.45 6.04 6.73
55 225.91 4.76 6.46 Student -0.68 1.37 3.12 3.94 4.76 5.57 6.39 8.14 10.19
224.74 4.87 2.17 School 3.04 3.73 4.32 4.60 4.87 5.15 5.42 6.01 6.70
60 228.18 4.59 6.46 Student -0.85 1.20 2.95 3.78 4.59 5.40 6.23 7.98 10.03
225.83 4.83 2.17 School 3.00 3.69 4.28 4.55 4.83 5.10 5.38 5.97 6.66
65 230.53 4.42 6.46 Student -1.02 1.03 2.79 3.61 4.42 5.24 6.06 7.81 9.86
226.95 4.78 2.17 School 2.95 3.64 4.23 4.51 4.78 5.05 5.33 5.92 6.61
70 233.00 4.24 6.46 Student -1.19 0.86 2.61 3.43 4.24 5.06 5.88 7.63 9.68
228.13 4.73 2.17 School 2.90 3.59 4.18 4.46 4.73 5.00 5.28 5.87 6.56
75 235.67 4.05 6.46 Student -1.39 0.66 2.42 3.24 4.05 4.86 5.69 7.44 9.49
229.41 4.68 2.17 School 2.85 3.54 4.13 4.41 4.68 4.95 5.23 5.82 6.51
80 238.64 3.84 6.46 Student -1.60 0.45 2.20 3.03 3.84 4.65 5.48 7.23 9.28
230.83 4.62 2.17 School 2.79 3.48 4.07 4.35 4.62 4.89 5.17 5.76 6.45
85 242.10 3.59 6.46 Student -1.85 0.20 1.95 2.78 3.59 4.40 5.23 6.98 9.03
232.48 4.55 2.17 School 2.72 3.41 4.00 4.28 4.55 4.82 5.10 5.69 6.38
90 246.46 3.28 6.46 Student -2.16 -0.11 1.64 2.46 3.28 4.09 4.91 6.66 8.72
234.56 4.47 2.17 School 2.64 3.33 3.91 4.19 4.47 4.74 5.02 5.60 6.29
CGI - Conditional Growth Index CGP - Conditional Growth Percentile
230

Table E.1.43: Mathematics Grade 7 From Fall To N Fall Conditional Growth Percentile
Conditional Growth
Start Status Growth CGP 20 30 40 45 50 55 60 70 80
%ile RIT Mean SD CGI -0.84 -0.52 -0.25 -0.13 0.00 0.13 0.25 0.52 0.84
10 201.38 5.08 6.25 Student -0.18 1.81 3.50 4.30 5.08 5.87 6.67 8.36 10.35
212.76 4.86 1.89 School 3.27 3.87 4.38 4.62 4.86 5.10 5.34 5.85 6.45
20 208.68 5.22 6.25 Student -0.04 1.94 3.63 4.43 5.22 6.00 6.80 8.49 10.48
216.16 5.07 1.89 School 3.48 4.08 4.59 4.83 5.07 5.31 5.55 6.06 6.66
25 211.46 5.27 6.25 Student 0.01 1.99 3.68 4.48 5.27 6.05 6.85 8.55 10.53
217.44 5.15 1.89 School 3.56 4.16 4.67 4.91 5.15 5.39 5.63 6.14 6.74
30 213.95 5.31 6.25 Student 0.05 2.04 3.73 4.53 5.31 6.10 6.90 8.59 10.57
218.60 5.22 1.89 School 3.63 4.23 4.74 4.98 5.22 5.46 5.70 6.21 6.81
35 216.25 5.35 6.25 Student 0.09 2.08 3.77 4.57 5.35 6.14 6.94 8.63 10.61
219.68 5.29 1.89 School 3.69 4.29 4.81 5.05 5.29 5.52 5.77 6.28 6.88
40 218.44 5.39 6.25 Student 0.13 2.12 3.81 4.61 5.39 6.18 6.98 8.67 10.65
220.69 5.35 1.89 School 3.76 4.36 4.87 5.11 5.35 5.59 5.83 6.34 6.94
45 220.56 5.43 6.25 Student 0.17 2.16 3.85 4.65 5.43 6.22 7.02 8.71 10.69
221.68 5.41 1.89 School 3.82 4.42 4.93 5.17 5.41 5.65 5.89 6.40 7.00
48 221.82 5.46 6.25 Student 0.20 2.18 3.87 4.67 5.46 6.24 7.04 8.73 10.72
222.26 5.45 1.89 School 3.85 4.45 4.97 5.21 5.45 5.68 5.93 6.44 7.04
50 222.65 5.47 6.25 Student 0.21 2.19 3.89 4.69 5.47 6.26 7.05 8.75 10.73
222.65 5.47 1.89 School 3.88 4.48 4.99 5.23 5.47 5.71 5.95 6.46 7.06
52 223.48 5.49 6.25 Student 0.23 2.21 3.90 4.70 5.49 6.27 7.07 8.76 10.75
223.03 5.49 1.89 School 3.90 4.50 5.02 5.26 5.49 5.73 5.97 6.49 7.09
55 224.73 5.51 6.25 Student 0.25 2.23 3.93 4.72 5.51 6.29 7.09 8.79 10.77
223.62 5.53 1.89 School 3.94 4.54 5.05 5.29 5.53 5.77 6.01 6.52 7.12
60 226.85 5.55 6.25 Student 0.29 2.27 3.96 4.76 5.55 6.33 7.13 8.82 10.81
224.60 5.59 1.89 School 4.00 4.60 5.11 5.35 5.59 5.83 6.07 6.58 7.18
65 229.04 5.59 6.25 Student 0.33 2.31 4.00 4.80 5.59 6.37 7.17 8.86 10.85
225.62 5.65 1.89 School 4.06 4.66 5.18 5.42 5.65 5.89 6.13 6.65 7.25
70 231.35 5.63 6.25 Student 0.37 2.35 4.05 4.84 5.63 6.41 7.21 8.91 10.89
226.69 5.72 1.89 School 4.13 4.73 5.24 5.48 5.72 5.96 6.20 6.71 7.31
75 233.84 5.67 6.25 Student 0.41 2.40 4.09 4.89 5.67 6.46 7.26 8.95 10.93
227.85 5.79 1.89 School 4.20 4.80 5.31 5.56 5.79 6.03 6.27 6.79 7.39
80 236.61 5.72 6.25 Student 0.46 2.45 4.14 4.94 5.72 6.51 7.31 9.00 10.98
229.14 5.87 1.89 School 4.28 4.88 5.39 5.64 5.87 6.11 6.35 6.87 7.47
85 239.85 5.78 6.25 Student 0.52 2.51 4.20 5.00 5.78 6.57 7.37 9.06 11.04
230.64 5.97 1.89 School 4.37 4.97 5.49 5.73 5.97 6.20 6.45 6.96 7.56
90 243.91 5.86 6.25 Student 0.60 2.58 4.27 5.07 5.86 6.64 7.44 9.13 11.12
232.53 6.08 1.89 School 4.49 5.09 5.60 5.85 6.08 6.32 6.56 7.08 7.68
CGI - Conditional Growth Index CGP - Conditional Growth Percentile
231

Table E.1.44: Mathematics Grade 7 From Fall To Spring Conditional Growth Percentile
Conditional Growth
Start Status Growth CGP 20 30 40 45 50 55 60 70 80
%ile RIT Mean SD CGI -0.84 -0.52 -0.25 -0.13 0.00 0.13 0.25 0.52 0.84
10 201.38 6.11 6.54 Student 0.60 2.68 4.45 5.29 6.11 6.93 7.77 9.54 11.62
212.76 5.36 2.08 School 3.61 4.27 4.84 5.10 5.36 5.63 5.89 6.46 7.12
20 208.68 6.05 6.54 Student 0.55 2.62 4.40 5.23 6.05 6.88 7.71 9.49 11.56
216.16 5.56 2.08 School 3.81 4.47 5.04 5.30 5.56 5.83 6.09 6.66 7.32
25 211.46 6.03 6.54 Student 0.52 2.60 4.37 5.21 6.03 6.85 7.69 9.46 11.54
217.44 5.64 2.08 School 3.89 4.55 5.11 5.38 5.64 5.90 6.17 6.73 7.39
30 213.95 6.01 6.54 Student 0.51 2.58 4.35 5.19 6.01 6.84 7.67 9.44 11.52
218.60 5.71 2.08 School 3.95 4.61 5.18 5.45 5.71 5.97 6.24 6.80 7.46
35 216.25 6.00 6.54 Student 0.49 2.56 4.34 5.17 6.00 6.82 7.65 9.43 11.50
219.68 5.77 2.08 School 4.02 4.68 5.24 5.51 5.77 6.03 6.30 6.86 7.53
40 218.44 5.98 6.54 Student 0.47 2.55 4.32 5.16 5.98 6.80 7.64 9.41 11.49
220.69 5.83 2.08 School 4.08 4.74 5.30 5.57 5.83 6.09 6.36 6.92 7.59
45 220.56 5.96 6.54 Student 0.45 2.53 4.30 5.14 5.96 6.78 7.62 9.39 11.47
221.68 5.89 2.08 School 4.13 4.80 5.36 5.63 5.89 6.15 6.42 6.98 7.64
48 221.82 5.95 6.54 Student 0.44 2.52 4.29 5.13 5.95 6.77 7.61 9.38 11.46
222.26 5.92 2.08 School 4.17 4.83 5.39 5.66 5.92 6.18 6.45 7.02 7.68
50 222.65 5.95 6.54 Student 0.44 2.51 4.29 5.12 5.95 6.77 7.60 9.38 11.45
222.65 5.95 2.08 School 4.19 4.85 5.42 5.68 5.95 6.21 6.47 7.04 7.70
52 223.48 5.94 6.54 Student 0.43 2.51 4.28 5.12 5.94 6.76 7.60 9.37 11.45
223.03 5.97 2.08 School 4.21 4.88 5.44 5.71 5.97 6.23 6.50 7.06 7.72
55 224.73 5.93 6.54 Student 0.42 2.50 4.27 5.11 5.93 6.75 7.59 9.36 11.44
223.62 6.00 2.08 School 4.25 4.91 5.47 5.74 6.00 6.26 6.53 7.10 7.76
60 226.85 5.91 6.54 Student 0.41 2.48 4.26 5.09 5.91 6.74 7.57 9.35 11.42
224.60 6.06 2.08 School 4.31 4.97 5.53 5.80 6.06 6.32 6.59 7.15 7.82
65 229.04 5.90 6.54 Student 0.39 2.46 4.24 5.07 5.90 6.72 7.55 9.33 11.40
225.62 6.12 2.08 School 4.37 5.03 5.59 5.86 6.12 6.38 6.65 7.21 7.87
70 231.35 5.88 6.54 Student 0.37 2.45 4.22 5.06 5.88 6.70 7.54 9.31 11.39
226.69 6.18 2.08 School 4.43 5.09 5.66 5.92 6.18 6.45 6.71 7.28 7.94
75 233.84 5.86 6.54 Student 0.35 2.43 4.20 5.04 5.86 6.68 7.52 9.29 11.37
227.85 6.25 2.08 School 4.50 5.16 5.72 5.99 6.25 6.51 6.78 7.34 8.01
80 236.61 5.84 6.54 Student 0.33 2.41 4.18 5.02 5.84 6.66 7.50 9.27 11.35
229.14 6.33 2.08 School 4.57 5.23 5.80 6.07 6.33 6.59 6.86 7.42 8.08
85 239.85 5.81 6.54 Student 0.31 2.38 4.16 4.99 5.81 6.64 7.47 9.24 11.32
230.64 6.42 2.08 School 4.66 5.32 5.89 6.15 6.42 6.68 6.94 7.51 8.17
90 243.91 5.78 6.54 Student 0.27 2.35 4.12 4.96 5.78 6.60 7.44 9.21 11.29
232.53 6.53 2.08 School 4.77 5.43 6.00 6.26 6.53 6.79 7.05 7.62 8.28
CGI - Conditional Growth Index CGP - Conditional Growth Percentile
232

Table E.1.45: Mathematics Grade 7 From Fall To Winter Conditional Growth Percentile
Conditional Growth
Start Status Growth CGP 20 30 40 45 50 55 60 70 80
%ile RIT Mean SD CGI -0.84 -0.52 -0.25 -0.13 0.00 0.13 0.25 0.52 0.84
10 201.38 3.87 5.10 Student -0.43 1.19 2.57 3.22 3.87 4.51 5.16 6.54 8.16
212.76 3.14 1.19 School 2.14 2.52 2.84 2.99 3.14 3.29 3.44 3.77 4.14
20 208.68 3.73 5.10 Student -0.56 1.06 2.44 3.09 3.73 4.37 5.02 6.41 8.02
216.16 3.26 1.19 School 2.25 2.63 2.95 3.11 3.26 3.41 3.56 3.88 4.26
25 211.46 3.68 5.10 Student -0.61 1.00 2.39 3.04 3.68 4.32 4.97 6.35 7.97
217.44 3.30 1.19 School 2.30 2.67 3.00 3.15 3.30 3.45 3.60 3.92 4.30
30 213.95 3.63 5.10 Student -0.66 0.96 2.34 2.99 3.63 4.27 4.93 6.31 7.93
218.60 3.34 1.19 School 2.33 2.71 3.04 3.19 3.34 3.49 3.64 3.96 4.34
35 216.25 3.59 5.10 Student -0.70 0.92 2.30 2.95 3.59 4.23 4.88 6.27 7.88
219.68 3.37 1.19 School 2.37 2.75 3.07 3.22 3.37 3.52 3.68 4.00 4.38
40 218.44 3.55 5.10 Student -0.74 0.88 2.26 2.91 3.55 4.19 4.84 6.23 7.84
220.69 3.41 1.19 School 2.41 2.78 3.11 3.26 3.41 3.56 3.71 4.03 4.41
45 220.56 3.51 5.10 Student -0.78 0.84 2.22 2.87 3.51 4.15 4.80 6.19 7.81
221.68 3.44 1.19 School 2.44 2.82 3.14 3.29 3.44 3.59 3.74 4.07 4.44
48 221.82 3.49 5.10 Student -0.80 0.81 2.20 2.85 3.49 4.13 4.78 6.16 7.78
222.26 3.46 1.19 School 2.46 2.84 3.16 3.31 3.46 3.61 3.76 4.09 4.46
50 222.65 3.47 5.10 Student -0.82 0.80 2.18 2.83 3.47 4.11 4.77 6.15 7.77
222.65 3.47 1.19 School 2.47 2.85 3.17 3.32 3.47 3.62 3.78 4.10 4.48
52 223.48 3.46 5.10 Student -0.83 0.78 2.17 2.82 3.46 4.10 4.75 6.13 7.75
223.03 3.49 1.19 School 2.48 2.86 3.18 3.34 3.49 3.64 3.79 4.11 4.49
55 224.73 3.44 5.10 Student -0.86 0.76 2.14 2.79 3.44 4.08 4.73 6.11 7.73
223.62 3.51 1.19 School 2.50 2.88 3.20 3.36 3.51 3.66 3.81 4.13 4.51
60 226.85 3.40 5.10 Student -0.90 0.72 2.10 2.76 3.40 4.04 4.69 6.07 7.69
224.60 3.54 1.19 School 2.54 2.91 3.24 3.39 3.54 3.69 3.84 4.16 4.54
65 229.04 3.36 5.10 Student -0.94 0.68 2.06 2.71 3.36 4.00 4.65 6.03 7.65
225.62 3.57 1.19 School 2.57 2.95 3.27 3.42 3.57 3.72 3.88 4.20 4.58
70 231.35 3.31 5.10 Student -0.98 0.64 2.02 2.67 3.31 3.95 4.61 5.99 7.61
226.69 3.61 1.19 School 2.61 2.98 3.31 3.46 3.61 3.76 3.91 4.23 4.61
75 233.84 3.27 5.10 Student -1.03 0.59 1.98 2.63 3.27 3.91 4.56 5.94 7.56
227.85 3.65 1.19 School 2.65 3.02 3.35 3.50 3.65 3.80 3.95 4.27 4.65
80 236.61 3.22 5.10 Student -1.08 0.54 1.92 2.58 3.22 3.86 4.51 5.89 7.51
229.14 3.69 1.19 School 2.69 3.07 3.39 3.54 3.69 3.84 3.99 4.32 4.69
85 239.85 3.16 5.10 Student -1.14 0.48 1.86 2.52 3.16 3.80 4.45 5.83 7.45
230.64 3.74 1.19 School 2.74 3.12 3.44 3.59 3.74 3.89 4.04 4.37 4.74
90 243.91 3.08 5.10 Student -1.21 0.41 1.79 2.44 3.08 3.72 4.37 5.76 7.37
232.53 3.81 1.19 School 2.80 3.18 3.50 3.66 3.81 3.96 4.11 4.43 4.81
CGI - Conditional Growth Index CGP - Conditional Growth Percentile
233
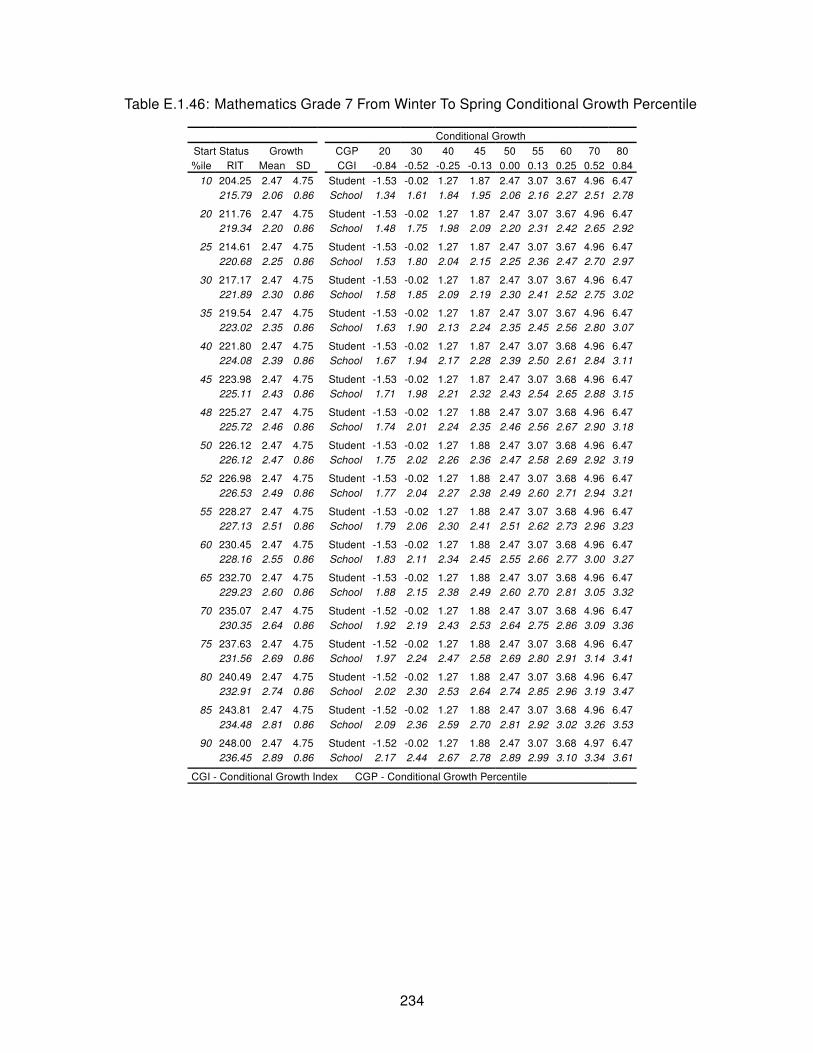
Table E.1.46: Mathematics Grade 7 From Winter To Spring Conditional Growth Percentile
Conditional Growth
Start Status Growth CGP 20 30 40 45 50 55 60 70 80
%ile RIT Mean SD CGI -0.84 -0.52 -0.25 -0.13 0.00 0.13 0.25 0.52 0.84
10 204.25 2.47 4.75 Student -1.53 -0.02 1.27 1.87 2.47 3.07 3.67 4.96 6.47
215.79 2.06 0.86 School 1.34 1.61 1.84 1.95 2.06 2.16 2.27 2.51 2.78
20 211.76 2.47 4.75 Student -1.53 -0.02 1.27 1.87 2.47 3.07 3.67 4.96 6.47
219.34 2.20 0.86 School 1.48 1.75 1.98 2.09 2.20 2.31 2.42 2.65 2.92
25 214.61 2.47 4.75 Student -1.53 -0.02 1.27 1.87 2.47 3.07 3.67 4.96 6.47
220.68 2.25 0.86 School 1.53 1.80 2.04 2.15 2.25 2.36 2.47 2.70 2.97
30 217.17 2.47 4.75 Student -1.53 -0.02 1.27 1.87 2.47 3.07 3.67 4.96 6.47
221.89 2.30 0.86 School 1.58 1.85 2.09 2.19 2.30 2.41 2.52 2.75 3.02
35 219.54 2.47 4.75 Student -1.53 -0.02 1.27 1.87 2.47 3.07 3.67 4.96 6.47
223.02 2.35 0.86 School 1.63 1.90 2.13 2.24 2.35 2.45 2.56 2.80 3.07
40 221.80 2.47 4.75 Student -1.53 -0.02 1.27 1.87 2.47 3.07 3.68 4.96 6.47
224.08 2.39 0.86 School 1.67 1.94 2.17 2.28 2.39 2.50 2.61 2.84 3.11
45 223.98 2.47 4.75 Student -1.53 -0.02 1.27 1.87 2.47 3.07 3.68 4.96 6.47
225.11 2.43 0.86 School 1.71 1.98 2.21 2.32 2.43 2.54 2.65 2.88 3.15
48 225.27 2.47 4.75 Student -1.53 -0.02 1.27 1.88 2.47 3.07 3.68 4.96 6.47
225.72 2.46 0.86 School 1.74 2.01 2.24 2.35 2.46 2.56 2.67 2.90 3.18
50 226.12 2.47 4.75 Student -1.53 -0.02 1.27 1.88 2.47 3.07 3.68 4.96 6.47
226.12 2.47 0.86 School 1.75 2.02 2.26 2.36 2.47 2.58 2.69 2.92 3.19
52 226.98 2.47 4.75 Student -1.53 -0.02 1.27 1.88 2.47 3.07 3.68 4.96 6.47
226.53 2.49 0.86 School 1.77 2.04 2.27 2.38 2.49 2.60 2.71 2.94 3.21
55 228.27 2.47 4.75 Student -1.53 -0.02 1.27 1.88 2.47 3.07 3.68 4.96 6.47
227.13 2.51 0.86 School 1.79 2.06 2.30 2.41 2.51 2.62 2.73 2.96 3.23
60 230.45 2.47 4.75 Student -1.53 -0.02 1.27 1.88 2.47 3.07 3.68 4.96 6.47
228.16 2.55 0.86 School 1.83 2.11 2.34 2.45 2.55 2.66 2.77 3.00 3.27
65 232.70 2.47 4.75 Student -1.53 -0.02 1.27 1.88 2.47 3.07 3.68 4.96 6.47
229.23 2.60 0.86 School 1.88 2.15 2.38 2.49 2.60 2.70 2.81 3.05 3.32
70 235.07 2.47 4.75 Student -1.52 -0.02 1.27 1.88 2.47 3.07 3.68 4.96 6.47
230.35 2.64 0.86 School 1.92 2.19 2.43 2.53 2.64 2.75 2.86 3.09 3.36
75 237.63 2.47 4.75 Student -1.52 -0.02 1.27 1.88 2.47 3.07 3.68 4.96 6.47
231.56 2.69 0.86 School 1.97 2.24 2.47 2.58 2.69 2.80 2.91 3.14 3.41
80 240.49 2.47 4.75 Student -1.52 -0.02 1.27 1.88 2.47 3.07 3.68 4.96 6.47
232.91 2.74 0.86 School 2.02 2.30 2.53 2.64 2.74 2.85 2.96 3.19 3.47
85 243.81 2.47 4.75 Student -1.52 -0.02 1.27 1.88 2.47 3.07 3.68 4.96 6.47
234.48 2.81 0.86 School 2.09 2.36 2.59 2.70 2.81 2.92 3.02 3.26 3.53
90 248.00 2.47 4.75 Student -1.52 -0.02 1.27 1.88 2.47 3.07 3.68 4.97 6.47
236.45 2.89 0.86 School 2.17 2.44 2.67 2.78 2.89 2.99 3.10 3.34 3.61
CGI - Conditional Growth Index CGP - Conditional Growth Percentile
234

Table E.1.47: Mathematics Grade 8 From Last Winter To Winter Conditional Growth Percentile
Conditional Growth
Start Status Growth CGP 20 30 40 45 50 55 60 70 80
%ile RIT Mean SD CGI -0.84 -0.52 -0.25 -0.13 0.00 0.13 0.25 0.52 0.84
10 201.94 5.23 6.42 Student -0.17 1.87 3.61 4.43 5.23 6.04 6.86 8.60 10.63
213.41 4.20 1.97 School 2.55 3.17 3.70 3.95 4.20 4.45 4.70 5.23 5.86
20 209.74 4.98 6.42 Student -0.43 1.61 3.35 4.17 4.98 5.78 6.60 8.34 10.38
217.27 4.30 1.97 School 2.64 3.27 3.80 4.05 4.30 4.55 4.80 5.33 5.96
25 212.70 4.88 6.42 Student -0.52 1.51 3.25 4.07 4.88 5.68 6.50 8.24 10.28
218.74 4.34 1.97 School 2.68 3.30 3.84 4.09 4.34 4.58 4.83 5.37 5.99
30 215.37 4.79 6.42 Student -0.61 1.42 3.16 3.98 4.79 5.60 6.42 8.16 10.19
220.06 4.37 1.97 School 2.71 3.34 3.87 4.12 4.37 4.62 4.87 5.40 6.03
35 217.83 4.71 6.42 Student -0.69 1.34 3.08 3.90 4.71 5.52 6.34 8.07 10.11
221.28 4.40 1.97 School 2.74 3.37 3.90 4.15 4.40 4.65 4.90 5.43 6.06
40 220.17 4.63 6.42 Student -0.77 1.27 3.01 3.83 4.63 5.44 6.26 8.00 10.03
222.44 4.43 1.97 School 2.77 3.40 3.93 4.18 4.43 4.68 4.93 5.46 6.09
45 222.44 4.56 6.42 Student -0.84 1.19 2.93 3.75 4.56 5.36 6.18 7.92 9.96
223.56 4.46 1.97 School 2.80 3.42 3.96 4.21 4.46 4.70 4.96 5.49 6.11
48 223.77 4.51 6.42 Student -0.89 1.15 2.89 3.71 4.51 5.32 6.14 7.88 9.92
224.22 4.47 1.97 School 2.82 3.44 3.97 4.23 4.47 4.72 4.97 5.51 6.13
50 224.66 4.48 6.42 Student -0.92 1.12 2.86 3.68 4.48 5.29 6.11 7.85 9.89
224.66 4.48 1.97 School 2.83 3.45 3.99 4.24 4.48 4.73 4.98 5.52 6.14
52 225.55 4.46 6.42 Student -0.95 1.09 2.83 3.65 4.46 5.26 6.08 7.82 9.86
225.10 4.50 1.97 School 2.84 3.46 4.00 4.25 4.50 4.74 4.99 5.53 6.15
55 226.89 4.41 6.42 Student -0.99 1.05 2.78 3.60 4.41 5.22 6.04 7.78 9.81
225.77 4.51 1.97 School 2.86 3.48 4.01 4.26 4.51 4.76 5.01 5.54 6.17
60 229.16 4.34 6.42 Student -1.07 0.97 2.71 3.53 4.34 5.14 5.96 7.70 9.74
226.89 4.54 1.97 School 2.88 3.51 4.04 4.29 4.54 4.79 5.04 5.57 6.20
65 231.50 4.26 6.42 Student -1.14 0.89 2.63 3.45 4.26 5.07 5.89 7.63 9.66
228.05 4.57 1.97 School 2.91 3.54 4.07 4.32 4.57 4.82 5.07 5.60 6.23
70 233.96 4.18 6.42 Student -1.22 0.81 2.55 3.37 4.18 4.99 5.80 7.54 9.58
229.27 4.60 1.97 School 2.94 3.57 4.10 4.35 4.60 4.85 5.10 5.63 6.26
75 236.62 4.09 6.42 Student -1.31 0.73 2.46 3.28 4.09 4.90 5.72 7.46 9.49
230.59 4.63 1.97 School 2.98 3.60 4.13 4.39 4.63 4.88 5.13 5.67 6.29
80 239.59 3.99 6.42 Student -1.41 0.63 2.37 3.19 3.99 4.80 5.62 7.36 9.40
232.05 4.67 1.97 School 3.01 3.64 4.17 4.42 4.67 4.92 5.17 5.70 6.33
85 243.04 3.88 6.42 Student -1.52 0.51 2.25 3.07 3.88 4.69 5.51 7.25 9.28
233.76 4.71 1.97 School 3.06 3.68 4.21 4.47 4.71 4.96 5.21 5.74 6.37
90 247.39 3.74 6.42 Student -1.67 0.37 2.11 2.93 3.74 4.54 5.36 7.10 9.14
235.92 4.77 1.97 School 3.11 3.73 4.27 4.52 4.77 5.01 5.27 5.80 6.42
CGI - Conditional Growth Index CGP - Conditional Growth Percentile
235

Table E.1.48: Mathematics Grade 8 From Last Spring To Spring Conditional Growth Percentile
Conditional Growth
Start Status Growth CGP 20 30 40 45 50 55 60 70 80
%ile RIT Mean SD CGI -0.84 -0.52 -0.25 -0.13 0.00 0.13 0.25 0.52 0.84
10 203.15 5.37 7.70 Student -1.11 1.33 3.42 4.40 5.37 6.33 7.32 9.41 11.85
215.16 3.86 2.50 School 1.76 2.55 3.23 3.55 3.86 4.18 4.49 5.17 5.97
20 211.31 4.90 7.70 Student -1.58 0.86 2.95 3.93 4.90 5.87 6.85 8.94 11.38
219.20 3.91 2.50 School 1.81 2.60 3.28 3.60 3.91 4.22 4.54 5.22 6.01
25 214.41 4.72 7.70 Student -1.76 0.68 2.77 3.75 4.72 5.69 6.67 8.76 11.20
220.73 3.93 2.50 School 1.82 2.62 3.30 3.61 3.93 4.24 4.56 5.24 6.03
30 217.20 4.56 7.70 Student -1.92 0.52 2.61 3.59 4.56 5.53 6.51 8.60 11.04
222.11 3.95 2.50 School 1.84 2.63 3.31 3.63 3.95 4.26 4.58 5.26 6.05
35 219.78 4.41 7.70 Student -2.07 0.38 2.46 3.45 4.41 5.38 6.36 8.45 10.90
223.39 3.96 2.50 School 1.86 2.65 3.33 3.65 3.96 4.28 4.59 5.27 6.07
40 222.22 4.27 7.70 Student -2.21 0.24 2.32 3.31 4.27 5.24 6.22 8.31 10.75
224.60 3.98 2.50 School 1.87 2.66 3.34 3.66 3.98 4.29 4.61 5.29 6.08
45 224.59 4.14 7.70 Student -2.34 0.10 2.19 3.17 4.14 5.11 6.09 8.18 10.62
225.77 3.99 2.50 School 1.89 2.68 3.36 3.68 3.99 4.30 4.62 5.30 6.09
48 225.99 4.06 7.70 Student -2.42 0.02 2.11 3.09 4.06 5.03 6.01 8.10 10.54
226.46 4.00 2.50 School 1.89 2.69 3.37 3.68 4.00 4.31 4.63 5.31 6.10
50 226.92 4.00 7.70 Student -2.48 -0.03 2.05 3.04 4.00 4.97 5.96 8.04 10.49
226.92 4.00 2.50 School 1.90 2.69 3.37 3.69 4.00 4.32 4.64 5.32 6.11
52 227.85 3.95 7.70 Student -2.53 -0.09 2.00 2.98 3.95 4.92 5.90 7.99 10.43
227.38 4.01 2.50 School 1.91 2.70 3.38 3.70 4.01 4.32 4.64 5.32 6.11
55 229.25 3.87 7.70 Student -2.61 -0.17 1.92 2.90 3.87 4.84 5.82 7.91 10.35
228.08 4.02 2.50 School 1.91 2.71 3.38 3.70 4.02 4.33 4.65 5.33 6.12
60 231.62 3.73 7.70 Student -2.75 -0.30 1.78 2.77 3.73 4.70 5.69 7.77 10.22
229.25 4.03 2.50 School 1.93 2.72 3.40 3.72 4.03 4.35 4.67 5.34 6.14
65 234.07 3.59 7.70 Student -2.89 -0.44 1.64 2.63 3.59 4.56 5.55 7.63 10.08
230.46 4.05 2.50 School 1.94 2.74 3.41 3.73 4.05 4.36 4.68 5.36 6.15
70 236.65 3.45 7.70 Student -3.03 -0.59 1.50 2.48 3.45 4.41 5.40 7.48 9.93
231.74 4.06 2.50 School 1.96 2.75 3.43 3.75 4.06 4.38 4.70 5.37 6.17
75 239.43 3.29 7.70 Student -3.19 -0.75 1.34 2.32 3.29 4.25 5.24 7.33 9.77
233.12 4.08 2.50 School 1.98 2.77 3.45 3.77 4.08 4.39 4.71 5.39 6.18
80 242.53 3.11 7.70 Student -3.37 -0.93 1.16 2.14 3.11 4.08 5.06 7.15 9.59
234.65 4.10 2.50 School 1.99 2.79 3.46 3.78 4.10 4.41 4.73 5.41 6.20
85 246.15 2.90 7.70 Student -3.58 -1.14 0.95 1.93 2.90 3.87 4.85 6.94 9.38
236.44 4.12 2.50 School 2.02 2.81 3.49 3.81 4.12 4.43 4.75 5.43 6.22
90 250.69 2.64 7.70 Student -3.84 -1.40 0.69 1.67 2.64 3.61 4.59 6.68 9.12
238.69 4.15 2.50 School 2.04 2.84 3.51 3.83 4.15 4.46 4.78 5.46 6.25
CGI - Conditional Growth Index CGP - Conditional Growth Percentile
236

Table E.1.49: Mathematics Grade 8 From Fall To N Fall Conditional Growth Percentile
Conditional Growth
Start Status Growth CGP 20 30 40 45 50 55 60 70 80
%ile RIT Mean SD CGI -0.84 -0.52 -0.25 -0.13 0.00 0.13 0.25 0.52 0.84
10 203.42 2.85 7.11 Student -3.14 -0.88 1.04 1.95 2.85 3.74 4.65 6.57 8.83
215.03 3.15 1.92 School 1.54 2.15 2.67 2.91 3.15 3.40 3.64 4.16 4.77
20 211.28 3.23 7.11 Student -2.75 -0.50 1.43 2.34 3.23 4.12 5.03 6.96 9.21
218.90 3.43 1.92 School 1.81 2.42 2.94 3.19 3.43 3.67 3.92 4.44 5.05
25 214.26 3.38 7.11 Student -2.61 -0.35 1.57 2.48 3.38 4.27 5.18 7.10 9.36
220.37 3.54 1.92 School 1.92 2.53 3.05 3.30 3.54 3.78 4.03 4.55 5.16
30 216.94 3.51 7.11 Student -2.48 -0.22 1.71 2.61 3.51 4.40 5.31 7.23 9.49
221.69 3.63 1.92 School 2.01 2.62 3.15 3.39 3.63 3.87 4.12 4.64 5.25
35 219.42 3.63 7.11 Student -2.36 -0.10 1.83 2.73 3.63 4.52 5.43 7.36 9.61
222.91 3.72 1.92 School 2.10 2.71 3.23 3.48 3.72 3.96 4.21 4.73 5.34
40 221.78 3.74 7.11 Student -2.24 0.01 1.94 2.85 3.74 4.64 5.54 7.47 9.73
224.07 3.80 1.92 School 2.18 2.79 3.32 3.56 3.80 4.05 4.29 4.81 5.42
45 224.06 3.85 7.11 Student -2.13 0.13 2.05 2.96 3.85 4.75 5.66 7.58 9.84
225.19 3.88 1.92 School 2.27 2.88 3.40 3.64 3.88 4.13 4.37 4.89 5.50
48 225.40 3.92 7.11 Student -2.06 0.19 2.12 3.03 3.92 4.81 5.72 7.65 9.90
225.86 3.93 1.92 School 2.31 2.92 3.44 3.69 3.93 4.17 4.42 4.94 5.55
50 226.30 3.96 7.11 Student -2.02 0.24 2.16 3.07 3.96 4.86 5.76 7.69 9.95
226.30 3.96 1.92 School 2.34 2.95 3.48 3.72 3.96 4.21 4.45 4.97 5.58
52 227.20 4.01 7.11 Student -1.98 0.28 2.21 3.11 4.01 4.90 5.81 7.74 9.99
226.74 4.00 1.92 School 2.38 2.99 3.51 3.75 4.00 4.24 4.48 5.00 5.61
55 228.54 4.07 7.11 Student -1.91 0.35 2.27 3.18 4.07 4.97 5.87 7.80 10.06
227.41 4.04 1.92 School 2.42 3.03 3.56 3.80 4.04 4.28 4.53 5.05 5.66
60 230.82 4.18 7.11 Student -1.80 0.46 2.38 3.29 4.18 5.08 5.99 7.91 10.17
228.53 4.12 1.92 School 2.50 3.11 3.64 3.88 4.12 4.37 4.61 5.13 5.74
65 233.18 4.30 7.11 Student -1.68 0.57 2.50 3.41 4.30 5.19 6.10 8.03 10.28
229.69 4.21 1.92 School 2.59 3.20 3.72 3.97 4.21 4.45 4.69 5.22 5.83
70 235.66 4.42 7.11 Student -1.56 0.69 2.62 3.53 4.42 5.31 6.22 8.15 10.40
230.91 4.29 1.92 School 2.68 3.29 3.81 4.05 4.29 4.54 4.78 5.30 5.91
75 238.34 4.55 7.11 Student -1.43 0.82 2.75 3.66 4.55 5.45 6.35 8.28 10.54
232.23 4.39 1.92 School 2.77 3.38 3.90 4.15 4.39 4.63 4.88 5.40 6.01
80 241.32 4.70 7.11 Student -1.29 0.97 2.90 3.80 4.70 5.59 6.50 8.43 10.68
233.70 4.50 1.92 School 2.88 3.49 4.01 4.25 4.50 4.74 4.98 5.50 6.11
85 244.80 4.87 7.11 Student -1.12 1.14 3.07 3.97 4.87 5.76 6.67 8.60 10.85
235.42 4.62 1.92 School 3.00 3.61 4.13 4.38 4.62 4.86 5.11 5.63 6.24
90 249.18 5.08 7.11 Student -0.90 1.35 3.28 4.19 5.08 5.97 6.88 8.81 11.06
237.57 4.77 1.92 School 3.15 3.76 4.29 4.53 4.77 5.01 5.26 5.78 6.39
CGI - Conditional Growth Index CGP - Conditional Growth Percentile
237

Table E.1.50: Mathematics Grade 8 From Fall To Spring Conditional Growth Percentile
Conditional Growth
Start Status Growth CGP 20 30 40 45 50 55 60 70 80
%ile RIT Mean SD CGI -0.84 -0.52 -0.25 -0.13 0.00 0.13 0.25 0.52 0.84
10 203.42 5.07 7.65 Student -1.37 1.05 3.13 4.10 5.07 6.03 7.00 9.08 11.50
215.03 3.87 2.12 School 2.09 2.76 3.33 3.60 3.87 4.14 4.41 4.98 5.65
20 211.28 4.91 7.65 Student -1.52 0.90 2.98 3.95 4.91 5.88 6.85 8.93 11.35
218.90 4.13 2.12 School 2.35 3.02 3.59 3.86 4.13 4.40 4.67 5.24 5.91
25 214.26 4.86 7.65 Student -1.58 0.85 2.92 3.90 4.86 5.82 6.80 8.87 11.30
220.37 4.23 2.12 School 2.45 3.12 3.69 3.96 4.23 4.50 4.77 5.34 6.01
30 216.94 4.81 7.65 Student -1.63 0.79 2.87 3.85 4.81 5.77 6.74 8.82 11.24
221.69 4.32 2.12 School 2.53 3.21 3.78 4.05 4.32 4.58 4.85 5.43 6.10
35 219.42 4.76 7.65 Student -1.68 0.75 2.82 3.80 4.76 5.72 6.70 8.77 11.20
222.91 4.40 2.12 School 2.62 3.29 3.86 4.13 4.40 4.67 4.94 5.51 6.18
40 221.78 4.71 7.65 Student -1.72 0.70 2.78 3.75 4.71 5.67 6.65 8.73 11.15
224.07 4.48 2.12 School 2.69 3.37 3.94 4.21 4.48 4.74 5.01 5.59 6.26
45 224.06 4.67 7.65 Student -1.77 0.66 2.73 3.71 4.67 5.63 6.61 8.68 11.11
225.19 4.55 2.12 School 2.77 3.44 4.02 4.29 4.55 4.82 5.09 5.66 6.34
48 225.40 4.64 7.65 Student -1.79 0.63 2.71 3.68 4.64 5.61 6.58 8.66 11.08
225.86 4.60 2.12 School 2.81 3.49 4.06 4.33 4.60 4.86 5.13 5.71 6.38
50 226.30 4.63 7.65 Student -1.81 0.62 2.69 3.67 4.63 5.59 6.56 8.64 11.06
226.30 4.63 2.12 School 2.84 3.52 4.09 4.36 4.63 4.89 5.16 5.74 6.41
52 227.20 4.61 7.65 Student -1.83 0.60 2.67 3.65 4.61 5.57 6.55 8.62 11.05
226.74 4.66 2.12 School 2.87 3.55 4.12 4.39 4.66 4.92 5.19 5.77 6.44
55 228.54 4.58 7.65 Student -1.85 0.57 2.65 3.62 4.58 5.55 6.52 8.60 11.02
227.41 4.70 2.12 School 2.92 3.59 4.16 4.43 4.70 4.97 5.24 5.81 6.48
60 230.82 4.54 7.65 Student -1.90 0.53 2.60 3.58 4.54 5.50 6.48 8.55 10.98
228.53 4.78 2.12 School 2.99 3.67 4.24 4.51 4.78 5.04 5.31 5.89 6.56
65 233.18 4.50 7.65 Student -1.94 0.48 2.56 3.53 4.50 5.46 6.43 8.51 10.93
229.69 4.85 2.12 School 3.07 3.74 4.32 4.59 4.85 5.12 5.39 5.97 6.64
70 235.66 4.45 7.65 Student -1.99 0.44 2.51 3.49 4.45 5.41 6.39 8.46 10.89
230.91 4.94 2.12 School 3.15 3.83 4.40 4.67 4.94 5.20 5.47 6.05 6.72
75 238.34 4.40 7.65 Student -2.04 0.38 2.46 3.44 4.40 5.36 6.33 8.41 10.83
232.23 5.02 2.12 School 3.24 3.91 4.49 4.76 5.02 5.29 5.56 6.14 6.81
80 241.32 4.34 7.65 Student -2.10 0.33 2.40 3.38 4.34 5.30 6.28 8.35 10.78
233.70 5.12 2.12 School 3.34 4.01 4.59 4.86 5.12 5.39 5.66 6.23 6.91
85 244.80 4.27 7.65 Student -2.17 0.26 2.33 3.31 4.27 5.23 6.21 8.28 10.71
235.42 5.24 2.12 School 3.46 4.13 4.70 4.97 5.24 5.50 5.78 6.35 7.02
90 249.18 4.19 7.65 Student -2.25 0.18 2.25 3.23 4.19 5.15 6.13 8.20 10.63
237.57 5.38 2.12 School 3.60 4.27 4.85 5.12 5.38 5.65 5.92 6.49 7.17
CGI - Conditional Growth Index CGP - Conditional Growth Percentile
238

Table E.1.51: Mathematics Grade 8 From Fall To Winter Conditional Growth Percentile
Conditional Growth
Start Status Growth CGP 20 30 40 45 50 55 60 70 80
%ile RIT Mean SD CGI -0.84 -0.52 -0.25 -0.13 0.00 0.13 0.25 0.52 0.84
10 203.42 3.37 5.58 Student -1.32 0.45 1.96 2.67 3.37 4.08 4.79 6.30 8.07
215.03 2.42 1.21 School 1.40 1.78 2.11 2.26 2.42 2.57 2.72 3.05 3.43
20 211.28 3.19 5.58 Student -1.50 0.27 1.78 2.49 3.19 3.89 4.61 6.12 7.89
218.90 2.56 1.21 School 1.54 1.93 2.26 2.41 2.56 2.72 2.87 3.20 3.58
25 214.26 3.12 5.58 Student -1.57 0.20 1.71 2.42 3.12 3.83 4.54 6.05 7.82
220.37 2.62 1.21 School 1.60 1.98 2.31 2.47 2.62 2.77 2.93 3.26 3.64
30 216.94 3.06 5.58 Student -1.63 0.14 1.65 2.36 3.06 3.76 4.48 5.99 7.76
221.69 2.67 1.21 School 1.65 2.04 2.36 2.52 2.67 2.82 2.98 3.31 3.69
35 219.42 3.01 5.58 Student -1.69 0.08 1.59 2.31 3.01 3.71 4.42 5.93 7.70
222.91 2.72 1.21 School 1.70 2.08 2.41 2.57 2.72 2.87 3.02 3.35 3.74
40 221.78 2.95 5.58 Student -1.74 0.03 1.54 2.25 2.95 3.65 4.36 5.88 7.65
224.07 2.76 1.21 School 1.74 2.13 2.46 2.61 2.76 2.91 3.07 3.40 3.78
45 224.06 2.90 5.58 Student -1.79 -0.03 1.49 2.20 2.90 3.60 4.31 5.82 7.59
225.19 2.81 1.21 School 1.79 2.17 2.50 2.65 2.81 2.96 3.11 3.44 3.82
48 225.40 2.87 5.58 Student -1.83 -0.06 1.46 2.17 2.87 3.57 4.28 5.79 7.56
225.86 2.83 1.21 School 1.81 2.20 2.52 2.68 2.83 2.98 3.14 3.47 3.85
50 226.30 2.85 5.58 Student -1.85 -0.08 1.43 2.15 2.85 3.55 4.26 5.77 7.54
226.30 2.85 1.21 School 1.83 2.21 2.54 2.70 2.85 3.00 3.15 3.48 3.87
52 227.20 2.83 5.58 Student -1.87 -0.10 1.41 2.13 2.83 3.53 4.24 5.75 7.52
226.74 2.86 1.21 School 1.84 2.23 2.56 2.71 2.86 3.02 3.17 3.50 3.88
55 228.54 2.80 5.58 Student -1.90 -0.13 1.38 2.09 2.80 3.50 4.21 5.72 7.49
227.41 2.89 1.21 School 1.87 2.25 2.58 2.74 2.89 3.04 3.20 3.52 3.91
60 230.82 2.74 5.58 Student -1.95 -0.18 1.33 2.04 2.74 3.44 4.16 5.67 7.44
228.53 2.93 1.21 School 1.91 2.30 2.63 2.78 2.93 3.08 3.24 3.57 3.95
65 233.18 2.69 5.58 Student -2.00 -0.24 1.28 1.99 2.69 3.39 4.10 5.61 7.38
229.69 2.98 1.21 School 1.96 2.34 2.67 2.83 2.98 3.13 3.28 3.61 4.00
70 235.66 2.63 5.58 Student -2.06 -0.29 1.22 1.93 2.63 3.33 4.04 5.56 7.32
230.91 3.02 1.21 School 2.00 2.39 2.72 2.87 3.02 3.18 3.33 3.66 4.04
75 238.34 2.57 5.58 Student -2.12 -0.35 1.16 1.87 2.57 3.27 3.98 5.49 7.26
232.23 3.07 1.21 School 2.06 2.44 2.77 2.92 3.07 3.23 3.38 3.71 4.09
80 241.32 2.50 5.58 Student -2.19 -0.42 1.09 1.80 2.50 3.20 3.91 5.43 7.19
233.70 3.13 1.21 School 2.11 2.50 2.82 2.98 3.13 3.28 3.44 3.77 4.15
85 244.80 2.42 5.58 Student -2.27 -0.50 1.01 1.72 2.42 3.12 3.83 5.35 7.11
235.42 3.20 1.21 School 2.18 2.56 2.89 3.04 3.20 3.35 3.50 3.83 4.22
90 249.18 2.32 5.58 Student -2.37 -0.60 0.91 1.62 2.32 3.02 3.73 5.24 7.01
237.57 3.28 1.21 School 2.26 2.64 2.97 3.13 3.28 3.43 3.59 3.91 4.30
CGI - Conditional Growth Index CGP - Conditional Growth Percentile
239

Table E.1.52: Mathematics Grade 8 From Winter To Spring Conditional Growth Percentile
Conditional Growth
Start Status Growth CGP 20 30 40 45 50 55 60 70 80
%ile RIT Mean SD CGI -0.84 -0.52 -0.25 -0.13 0.00 0.13 0.25 0.52 0.84
10 205.68 1.63 5.04 Student -2.62 -1.02 0.35 0.99 1.63 2.26 2.90 4.27 5.87
217.34 1.31 0.87 School 0.58 0.85 1.09 1.20 1.31 1.41 1.53 1.76 2.04
20 213.74 1.68 5.04 Student -2.57 -0.97 0.40 1.05 1.68 2.31 2.96 4.32 5.92
221.39 1.47 0.87 School 0.74 1.01 1.25 1.36 1.47 1.58 1.69 1.92 2.20
25 216.80 1.70 5.04 Student -2.55 -0.95 0.42 1.07 1.70 2.33 2.98 4.34 5.94
222.93 1.53 0.87 School 0.80 1.07 1.31 1.42 1.53 1.64 1.75 1.99 2.26
30 219.55 1.72 5.04 Student -2.53 -0.93 0.44 1.08 1.72 2.35 3.00 4.36 5.96
224.32 1.59 0.87 School 0.86 1.13 1.37 1.48 1.59 1.69 1.81 2.04 2.32
35 222.09 1.73 5.04 Student -2.51 -0.91 0.46 1.10 1.73 2.37 3.01 4.38 5.98
225.60 1.64 0.87 School 0.91 1.18 1.42 1.53 1.64 1.75 1.86 2.09 2.37
40 224.51 1.75 5.04 Student -2.50 -0.90 0.47 1.12 1.75 2.38 3.03 4.39 6.00
226.81 1.69 0.87 School 0.96 1.23 1.47 1.58 1.69 1.80 1.91 2.14 2.42
45 226.85 1.76 5.04 Student -2.48 -0.88 0.49 1.13 1.76 2.40 3.04 4.41 6.01
227.99 1.73 0.87 School 1.00 1.28 1.51 1.62 1.73 1.84 1.95 2.19 2.46
48 228.23 1.77 5.04 Student -2.47 -0.87 0.50 1.14 1.77 2.41 3.05 4.42 6.02
228.69 1.76 0.87 School 1.03 1.31 1.54 1.65 1.76 1.87 1.98 2.22 2.49
50 229.15 1.78 5.04 Student -2.47 -0.87 0.50 1.15 1.78 2.41 3.06 4.43 6.03
229.15 1.78 0.87 School 1.05 1.32 1.56 1.67 1.78 1.89 2.00 2.23 2.51
52 230.07 1.79 5.04 Student -2.46 -0.86 0.51 1.15 1.79 2.42 3.06 4.43 6.03
229.61 1.80 0.87 School 1.07 1.34 1.58 1.69 1.80 1.91 2.02 2.25 2.53
55 231.45 1.79 5.04 Student -2.45 -0.85 0.52 1.16 1.79 2.43 3.07 4.44 6.04
230.31 1.83 0.87 School 1.10 1.37 1.61 1.72 1.83 1.94 2.05 2.28 2.56
60 233.79 1.81 5.04 Student -2.44 -0.84 0.53 1.18 1.81 2.44 3.09 4.46 6.06
231.48 1.87 0.87 School 1.14 1.42 1.65 1.76 1.87 1.98 2.09 2.33 2.60
65 236.20 1.83 5.04 Student -2.42 -0.82 0.55 1.19 1.83 2.46 3.10 4.47 6.07
232.70 1.92 0.87 School 1.19 1.47 1.70 1.81 1.92 2.03 2.14 2.38 2.65
70 238.75 1.84 5.04 Student -2.40 -0.80 0.56 1.21 1.84 2.48 3.12 4.49 6.09
233.98 1.97 0.87 School 1.24 1.52 1.75 1.86 1.97 2.08 2.19 2.43 2.70
75 241.50 1.86 5.04 Student -2.39 -0.79 0.58 1.23 1.86 2.49 3.14 4.51 6.11
235.36 2.03 0.87 School 1.30 1.57 1.81 1.92 2.03 2.14 2.25 2.48 2.76
80 244.56 1.88 5.04 Student -2.37 -0.77 0.60 1.25 1.88 2.51 3.16 4.53 6.13
236.90 2.09 0.87 School 1.36 1.64 1.87 1.98 2.09 2.20 2.31 2.55 2.82
85 248.12 1.90 5.04 Student -2.34 -0.74 0.63 1.27 1.90 2.54 3.18 4.55 6.15
238.70 2.16 0.87 School 1.43 1.71 1.94 2.05 2.16 2.27 2.38 2.62 2.89
90 252.61 1.93 5.04 Student -2.31 -0.71 0.65 1.30 1.93 2.57 3.21 4.58 6.18
240.96 2.25 0.87 School 1.52 1.80 2.03 2.14 2.25 2.36 2.47 2.71 2.98
CGI - Conditional Growth Index CGP - Conditional Growth Percentile
240

Table E.1.53: Mathematics Grade 9 From Last Winter To Winter Conditional Growth Percentile
Conditional Growth
Start Status Growth CGP 20 30 40 45 50 55 60 70 80
%ile RIT Mean SD CGI -0.84 -0.52 -0.25 -0.13 0.00 0.13 0.25 0.52 0.84
10 204.78 5.37 7.06 Student -0.57 1.67 3.58 4.48 5.37 6.26 7.16 9.07 11.31
216.90 3.43 2.43 School 1.39 2.16 2.82 3.13 3.43 3.74 4.05 4.71 5.48
20 213.19 4.55 7.06 Student -1.40 0.84 2.76 3.66 4.55 5.44 6.34 8.25 10.49
221.15 3.28 2.43 School 1.23 2.00 2.66 2.97 3.28 3.58 3.89 4.55 5.32
25 216.38 4.24 7.06 Student -1.71 0.53 2.45 3.35 4.24 5.12 6.03 7.94 10.18
222.76 3.22 2.43 School 1.17 1.94 2.60 2.91 3.22 3.52 3.83 4.49 5.26
30 219.24 3.96 7.06 Student -1.99 0.25 2.17 3.07 3.96 4.84 5.74 7.66 9.90
224.20 3.16 2.43 School 1.12 1.89 2.55 2.86 3.16 3.47 3.78 4.44 5.21
35 221.90 3.70 7.06 Student -2.25 -0.01 1.91 2.81 3.70 4.58 5.49 7.40 9.64
225.54 3.11 2.43 School 1.07 1.84 2.50 2.81 3.11 3.42 3.73 4.39 5.16
40 224.42 3.45 7.06 Student -2.49 -0.25 1.66 2.56 3.45 4.34 5.24 7.15 9.39
226.82 3.07 2.43 School 1.02 1.79 2.45 2.76 3.07 3.37 3.68 4.34 5.11
45 226.86 3.21 7.06 Student -2.73 -0.49 1.42 2.32 3.21 4.10 5.00 6.91 9.16
228.05 3.02 2.43 School 0.97 1.75 2.41 2.72 3.02 3.33 3.64 4.30 5.07
48 228.30 3.07 7.06 Student -2.87 -0.63 1.28 2.18 3.07 3.96 4.86 6.77 9.01
228.78 2.99 2.43 School 0.95 1.72 2.38 2.69 2.99 3.30 3.61 4.27 5.04
50 229.26 2.98 7.06 Student -2.97 -0.73 1.19 2.09 2.98 3.86 4.77 6.68 8.92
229.26 2.98 2.43 School 0.93 1.70 2.36 2.67 2.98 3.28 3.59 4.25 5.02
52 230.22 2.88 7.06 Student -3.06 -0.82 1.09 2.00 2.88 3.77 4.67 6.59 8.83
229.74 2.96 2.43 School 0.91 1.68 2.34 2.65 2.96 3.26 3.58 4.23 5.01
55 231.66 2.74 7.06 Student -3.20 -0.96 0.95 1.85 2.74 3.63 4.53 6.45 8.69
230.47 2.93 2.43 School 0.88 1.66 2.32 2.63 2.93 3.24 3.55 4.21 4.98
60 234.10 2.50 7.06 Student -3.44 -1.20 0.71 1.62 2.50 3.39 4.29 6.21 8.45
231.70 2.89 2.43 School 0.84 1.61 2.27 2.58 2.89 3.19 3.50 4.16 4.93
65 236.62 2.26 7.06 Student -3.69 -1.45 0.47 1.37 2.26 3.14 4.05 5.96 8.20
232.97 2.84 2.43 School 0.79 1.56 2.22 2.53 2.84 3.14 3.46 4.12 4.89
70 239.27 2.00 7.06 Student -3.95 -1.71 0.21 1.11 2.00 2.89 3.79 5.70 7.94
234.31 2.79 2.43 School 0.74 1.51 2.17 2.48 2.79 3.10 3.41 4.07 4.84
75 242.14 1.72 7.06 Student -4.23 -1.99 -0.07 0.83 1.72 2.60 3.51 5.42 7.66
235.76 2.74 2.43 School 0.69 1.46 2.12 2.43 2.74 3.04 3.35 4.01 4.78
80 245.33 1.41 7.06 Student -4.54 -2.30 -0.38 0.52 1.41 2.29 3.19 5.11 7.35
237.37 2.68 2.43 School 0.63 1.40 2.06 2.37 2.68 2.98 3.29 3.95 4.72
85 249.05 1.04 7.06 Student -4.90 -2.66 -0.75 0.15 1.04 1.93 2.83 4.75 6.99
239.25 2.61 2.43 School 0.56 1.33 1.99 2.30 2.61 2.91 3.22 3.88 4.65
90 253.73 0.58 7.06 Student -5.36 -3.12 -1.21 -0.30 0.58 1.47 2.37 4.29 6.53
241.61 2.52 2.43 School 0.47 1.24 1.90 2.21 2.52 2.83 3.14 3.80 4.57
CGI - Conditional Growth Index CGP - Conditional Growth Percentile
241

Table E.1.54: Mathematics Grade 9 From Last Spring To Spring Conditional Growth Percentile
Conditional Growth
Start Status Growth CGP 20 30 40 45 50 55 60 70 80
%ile RIT Mean SD CGI -0.84 -0.52 -0.25 -0.13 0.00 0.13 0.25 0.52 0.84
10 205.06 5.62 8.15 Student -1.24 1.34 3.55 4.59 5.62 6.64 7.68 9.89 12.47
217.77 3.32 2.93 School 0.85 1.78 2.57 2.95 3.32 3.68 4.06 4.85 5.78
20 213.92 4.55 8.15 Student -2.30 0.28 2.49 3.53 4.55 5.58 6.62 8.82 11.41
222.27 3.04 2.93 School 0.58 1.51 2.30 2.67 3.04 3.41 3.78 4.58 5.51
25 217.29 4.15 8.15 Student -2.71 -0.12 2.08 3.12 4.15 5.17 6.21 8.42 11.00
223.98 2.94 2.93 School 0.47 1.40 2.20 2.57 2.94 3.31 3.68 4.47 5.40
30 220.32 3.78 8.15 Student -3.07 -0.49 1.72 2.76 3.78 4.81 5.85 8.06 10.64
225.52 2.84 2.93 School 0.38 1.31 2.10 2.48 2.84 3.21 3.59 4.38 5.31
35 223.12 3.45 8.15 Student -3.41 -0.82 1.38 2.42 3.45 4.47 5.51 7.72 10.30
226.94 2.76 2.93 School 0.29 1.22 2.01 2.39 2.76 3.13 3.50 4.29 5.22
40 225.78 3.13 8.15 Student -3.73 -1.14 1.07 2.11 3.13 4.15 5.19 7.40 9.99
228.30 2.67 2.93 School 0.21 1.14 1.93 2.31 2.67 3.04 3.42 4.21 5.14
45 228.36 2.82 8.15 Student -4.04 -1.45 0.76 1.80 2.82 3.84 4.88 7.09 9.68
229.60 2.60 2.93 School 0.13 1.06 1.85 2.23 2.60 2.96 3.34 4.13 5.06
48 229.88 2.64 8.15 Student -4.22 -1.63 0.57 1.61 2.64 3.66 4.70 6.91 9.49
230.38 2.55 2.93 School 0.08 1.01 1.81 2.18 2.55 2.92 3.29 4.08 5.01
50 230.89 2.52 8.15 Student -4.34 -1.76 0.45 1.49 2.52 3.54 4.58 6.79 9.37
230.89 2.52 2.93 School 0.05 0.98 1.77 2.15 2.52 2.88 3.26 4.05 4.98
52 231.90 2.40 8.15 Student -4.46 -1.88 0.33 1.37 2.40 3.42 4.46 6.67 9.25
231.40 2.49 2.93 School 0.02 0.95 1.74 2.12 2.49 2.85 3.23 4.02 4.95
55 233.42 2.21 8.15 Student -4.64 -2.06 0.15 1.19 2.21 3.24 4.28 6.48 9.07
232.17 2.44 2.93 School -0.03 0.90 1.70 2.07 2.44 2.81 3.18 3.97 4.90
60 236.00 1.90 8.15 Student -4.95 -2.37 -0.16 0.88 1.90 2.93 3.97 6.18 8.76
233.48 2.36 2.93 School -0.11 0.82 1.62 1.99 2.36 2.73 3.10 3.89 4.82
65 238.66 1.58 8.15 Student -5.27 -2.69 -0.48 0.56 1.58 2.61 3.65 5.86 8.44
234.83 2.28 2.93 School -0.19 0.74 1.53 1.91 2.28 2.64 3.02 3.81 4.74
70 241.46 1.25 8.15 Student -5.61 -3.02 -0.82 0.22 1.25 2.27 3.31 5.52 8.10
236.26 2.19 2.93 School -0.28 0.65 1.45 1.82 2.19 2.56 2.93 3.73 4.65
75 244.48 0.89 8.15 Student -5.97 -3.39 -1.18 -0.14 0.89 1.91 2.95 5.16 7.74
237.79 2.10 2.93 School -0.37 0.56 1.35 1.73 2.10 2.46 2.84 3.63 4.56
80 247.85 0.48 8.15 Student -6.37 -3.79 -1.58 -0.54 0.48 1.51 2.55 4.75 7.34
239.50 1.99 2.93 School -0.47 0.45 1.25 1.62 1.99 2.36 2.73 3.53 4.46
85 251.78 0.01 8.15 Student -6.85 -4.26 -2.05 -1.01 0.01 1.03 2.07 4.28 6.87
241.50 1.87 2.93 School -0.60 0.33 1.13 1.50 1.87 2.24 2.61 3.41 4.34
90 256.72 -0.58 8.15 Student -7.44 -4.85 -2.65 -1.61 -0.58 0.44 1.48 3.69 6.27
244.01 1.72 2.93 School -0.75 0.18 0.97 1.35 1.72 2.08 2.46 3.25 4.18
CGI - Conditional Growth Index CGP - Conditional Growth Percentile
242

Table E.1.55: Mathematics Grade 9 From Fall To N Fall Conditional Growth Percentile
Conditional Growth
Start Status Growth CGP 20 30 40 45 50 55 60 70 80
%ile RIT Mean SD CGI -0.84 -0.52 -0.25 -0.13 0.00 0.13 0.25 0.52 0.84
10 207.03 2.54 7.38 Student -3.67 -1.33 0.67 1.61 2.54 3.47 4.41 6.41 8.75
218.56 1.98 2.35 School 0.01 0.75 1.38 1.68 1.98 2.27 2.57 3.21 3.95
20 215.01 2.49 7.38 Student -3.72 -1.38 0.62 1.56 2.49 3.42 4.36 6.36 8.70
222.58 2.12 2.35 School 0.15 0.89 1.53 1.83 2.12 2.42 2.72 3.35 4.10
25 218.04 2.47 7.38 Student -3.73 -1.40 0.60 1.55 2.47 3.40 4.34 6.34 8.68
224.11 2.18 2.35 School 0.20 0.95 1.58 1.88 2.18 2.47 2.77 3.41 4.15
30 220.76 2.46 7.38 Student -3.75 -1.41 0.59 1.53 2.46 3.38 4.33 6.32 8.66
225.48 2.23 2.35 School 0.25 1.00 1.63 1.93 2.23 2.52 2.82 3.46 4.20
35 223.29 2.44 7.38 Student -3.77 -1.43 0.57 1.51 2.44 3.37 4.31 6.31 8.65
226.75 2.27 2.35 School 0.30 1.04 1.68 1.98 2.27 2.57 2.87 3.50 4.25
40 225.68 2.43 7.38 Student -3.78 -1.44 0.56 1.50 2.43 3.35 4.30 6.30 8.64
227.96 2.32 2.35 School 0.34 1.09 1.72 2.02 2.32 2.61 2.91 3.55 4.29
45 227.99 2.41 7.38 Student -3.79 -1.45 0.54 1.49 2.41 3.34 4.28 6.28 8.62
229.12 2.36 2.35 School 0.39 1.13 1.76 2.06 2.36 2.65 2.95 3.59 4.33
48 229.36 2.41 7.38 Student -3.80 -1.46 0.54 1.48 2.41 3.33 4.27 6.27 8.61
229.81 2.38 2.35 School 0.41 1.15 1.79 2.09 2.38 2.68 2.98 3.61 4.36
50 230.27 2.40 7.38 Student -3.81 -1.47 0.53 1.47 2.40 3.33 4.27 6.27 8.61
230.27 2.40 2.35 School 0.43 1.17 1.81 2.11 2.40 2.69 2.99 3.63 4.37
52 231.18 2.39 7.38 Student -3.81 -1.47 0.53 1.47 2.39 3.32 4.26 6.26 8.60
230.73 2.42 2.35 School 0.44 1.19 1.82 2.12 2.42 2.71 3.01 3.65 4.39
55 232.55 2.39 7.38 Student -3.82 -1.48 0.52 1.46 2.39 3.31 4.26 6.25 8.59
231.42 2.44 2.35 School 0.47 1.21 1.85 2.15 2.44 2.74 3.04 3.67 4.41
60 234.87 2.37 7.38 Student -3.83 -1.50 0.50 1.45 2.37 3.30 4.24 6.24 8.58
232.59 2.48 2.35 School 0.51 1.25 1.89 2.19 2.48 2.78 3.08 3.71 4.46
65 237.26 2.36 7.38 Student -3.85 -1.51 0.49 1.43 2.36 3.29 4.23 6.23 8.57
233.79 2.53 2.35 School 0.55 1.30 1.93 2.23 2.53 2.82 3.12 3.76 4.50
70 239.78 2.34 7.38 Student -3.86 -1.52 0.47 1.42 2.34 3.27 4.21 6.21 8.55
235.07 2.57 2.35 School 0.60 1.34 1.98 2.28 2.57 2.87 3.17 3.80 4.55
75 242.50 2.33 7.38 Student -3.88 -1.54 0.46 1.40 2.33 3.25 4.20 6.20 8.54
236.44 2.62 2.35 School 0.65 1.39 2.03 2.33 2.62 2.92 3.22 3.85 4.60
80 245.53 2.31 7.38 Student -3.90 -1.56 0.44 1.38 2.31 3.24 4.18 6.18 8.52
237.96 2.68 2.35 School 0.70 1.45 2.08 2.38 2.68 2.97 3.27 3.91 4.65
85 249.07 2.29 7.38 Student -3.92 -1.58 0.42 1.36 2.29 3.22 4.16 6.16 8.50
239.75 2.74 2.35 School 0.77 1.51 2.15 2.45 2.74 3.04 3.33 3.97 4.71
90 253.51 2.26 7.38 Student -3.95 -1.61 0.39 1.34 2.26 3.19 4.13 6.13 8.47
241.99 2.82 2.35 School 0.85 1.59 2.23 2.53 2.82 3.12 3.42 4.05 4.79
CGI - Conditional Growth Index CGP - Conditional Growth Percentile
243

Table E.1.56: Mathematics Grade 9 From Fall To Spring Conditional Growth Percentile
Conditional Growth
Start Status Growth CGP 20 30 40 45 50 55 60 70 80
%ile RIT Mean SD CGI -0.84 -0.52 -0.25 -0.13 0.00 0.13 0.25 0.52 0.84
10 207.03 3.63 8.14 Student -3.21 -0.63 1.57 2.61 3.63 4.66 5.70 7.90 10.48
218.56 2.31 2.29 School 0.38 1.11 1.73 2.02 2.31 2.60 2.89 3.51 4.23
20 215.01 3.46 8.14 Student -3.39 -0.81 1.40 2.44 3.46 4.48 5.52 7.73 10.31
222.58 2.59 2.29 School 0.66 1.39 2.01 2.30 2.59 2.88 3.17 3.79 4.52
25 218.04 3.40 8.14 Student -3.45 -0.87 1.33 2.37 3.40 4.42 5.46 7.66 10.24
224.11 2.70 2.29 School 0.77 1.50 2.12 2.41 2.70 2.99 3.28 3.90 4.63
30 220.76 3.34 8.14 Student -3.51 -0.93 1.28 2.32 3.34 4.36 5.40 7.60 10.19
225.48 2.80 2.29 School 0.87 1.59 2.22 2.51 2.80 3.08 3.38 4.00 4.72
35 223.29 3.28 8.14 Student -3.57 -0.98 1.22 2.26 3.28 4.31 5.34 7.55 10.13
226.75 2.88 2.29 School 0.96 1.68 2.30 2.60 2.88 3.17 3.46 4.09 4.81
40 225.68 3.23 8.14 Student -3.62 -1.04 1.17 2.21 3.23 4.25 5.29 7.50 10.08
227.96 2.97 2.29 School 1.04 1.77 2.39 2.68 2.97 3.26 3.55 4.17 4.90
45 227.99 3.18 8.14 Student -3.67 -1.09 1.12 2.16 3.18 4.20 5.24 7.45 10.03
229.12 3.05 2.29 School 1.12 1.85 2.47 2.76 3.05 3.34 3.63 4.25 4.98
48 229.36 3.15 8.14 Student -3.70 -1.11 1.09 2.13 3.15 4.17 5.21 7.42 10.00
229.81 3.10 2.29 School 1.17 1.90 2.52 2.81 3.10 3.39 3.68 4.30 5.03
50 230.27 3.13 8.14 Student -3.72 -1.13 1.07 2.11 3.13 4.16 5.19 7.40 9.98
230.27 3.13 2.29 School 1.21 1.93 2.55 2.85 3.13 3.42 3.71 4.33 5.06
52 231.18 3.11 8.14 Student -3.74 -1.15 1.05 2.09 3.11 4.14 5.17 7.38 9.96
230.73 3.16 2.29 School 1.24 1.96 2.58 2.88 3.16 3.45 3.75 4.37 5.09
55 232.55 3.08 8.14 Student -3.76 -1.18 1.02 2.06 3.08 4.11 5.15 7.35 9.93
231.42 3.21 2.29 School 1.29 2.01 2.63 2.93 3.21 3.50 3.79 4.41 5.14
60 234.87 3.03 8.14 Student -3.81 -1.23 0.97 2.01 3.03 4.06 5.10 7.30 9.88
232.59 3.30 2.29 School 1.37 2.10 2.72 3.01 3.30 3.58 3.88 4.50 5.22
65 237.26 2.98 8.14 Student -3.87 -1.29 0.92 1.96 2.98 4.00 5.04 7.25 9.83
233.79 3.38 2.29 School 1.45 2.18 2.80 3.09 3.38 3.67 3.96 4.58 5.31
70 239.78 2.93 8.14 Student -3.92 -1.34 0.87 1.91 2.93 3.95 4.99 7.19 9.78
235.07 3.47 2.29 School 1.54 2.27 2.89 3.18 3.47 3.76 4.05 4.67 5.40
75 242.50 2.87 8.14 Student -3.98 -1.40 0.81 1.85 2.87 3.89 4.93 7.14 9.72
236.44 3.57 2.29 School 1.64 2.37 2.99 3.28 3.57 3.85 4.15 4.77 5.49
80 245.53 2.80 8.14 Student -4.04 -1.46 0.74 1.78 2.80 3.83 4.87 7.07 9.65
237.96 3.67 2.29 School 1.75 2.47 3.09 3.39 3.67 3.96 4.25 4.88 5.60
85 249.07 2.73 8.14 Student -4.12 -1.54 0.67 1.70 2.73 3.75 4.79 6.99 9.58
239.75 3.80 2.29 School 1.87 2.60 3.22 3.51 3.80 4.09 4.38 5.00 5.73
90 253.51 2.63 8.14 Student -4.22 -1.64 0.57 1.61 2.63 3.65 4.69 6.90 9.48
241.99 3.96 2.29 School 2.03 2.76 3.38 3.67 3.96 4.25 4.54 5.16 5.88
CGI - Conditional Growth Index CGP - Conditional Growth Percentile
244

Table E.1.57: Mathematics Grade 9 From Fall To Winter Conditional Growth Percentile
Conditional Growth
Start Status Growth CGP 20 30 40 45 50 55 60 70 80
%ile RIT Mean SD CGI -0.84 -0.52 -0.25 -0.13 0.00 0.13 0.25 0.52 0.84
10 207.03 2.52 5.80 Student -2.36 -0.52 1.05 1.79 2.52 3.25 3.99 5.56 7.40
218.56 1.49 1.31 School 0.39 0.81 1.16 1.33 1.49 1.66 1.82 2.18 2.59
20 215.01 2.33 5.80 Student -2.55 -0.71 0.86 1.60 2.33 3.06 3.80 5.37 7.21
222.58 1.65 1.31 School 0.55 0.97 1.32 1.49 1.65 1.82 1.98 2.34 2.75
25 218.04 2.26 5.80 Student -2.62 -0.78 0.79 1.53 2.26 2.99 3.73 5.30 7.14
224.11 1.71 1.31 School 0.61 1.03 1.38 1.55 1.71 1.88 2.05 2.40 2.82
30 220.76 2.19 5.80 Student -2.69 -0.85 0.72 1.46 2.19 2.92 3.66 5.23 7.07
225.48 1.77 1.31 School 0.67 1.08 1.44 1.61 1.77 1.93 2.10 2.46 2.87
35 223.29 2.13 5.80 Student -2.75 -0.91 0.66 1.40 2.13 2.86 3.60 5.17 7.01
226.75 1.82 1.31 School 0.72 1.13 1.49 1.66 1.82 1.99 2.15 2.51 2.92
40 225.68 2.07 5.80 Student -2.81 -0.97 0.60 1.34 2.07 2.80 3.54 5.11 6.95
227.96 1.87 1.31 School 0.77 1.18 1.54 1.71 1.87 2.03 2.20 2.56 2.97
45 227.99 2.02 5.80 Student -2.86 -1.02 0.55 1.29 2.02 2.75 3.49 5.06 6.90
229.12 1.92 1.31 School 0.81 1.23 1.58 1.75 1.92 2.08 2.25 2.60 3.02
48 229.36 1.98 5.80 Student -2.89 -1.06 0.52 1.26 1.98 2.71 3.45 5.02 6.86
229.81 1.94 1.31 School 0.84 1.26 1.61 1.78 1.94 2.11 2.28 2.63 3.05
50 230.27 1.96 5.80 Student -2.92 -1.08 0.49 1.23 1.96 2.69 3.43 5.00 6.84
230.27 1.96 1.31 School 0.86 1.28 1.63 1.80 1.96 2.13 2.29 2.65 3.06
52 231.18 1.94 5.80 Student -2.94 -1.10 0.47 1.21 1.94 2.67 3.41 4.98 6.82
230.73 1.98 1.31 School 0.88 1.29 1.65 1.82 1.98 2.15 2.31 2.67 3.08
55 232.55 1.91 5.80 Student -2.97 -1.13 0.44 1.18 1.91 2.64 3.38 4.95 6.79
231.42 2.01 1.31 School 0.91 1.32 1.68 1.84 2.01 2.17 2.34 2.70 3.11
60 234.87 1.85 5.80 Student -3.03 -1.19 0.38 1.12 1.85 2.58 3.32 4.89 6.73
232.59 2.06 1.31 School 0.95 1.37 1.72 1.89 2.06 2.22 2.39 2.74 3.16
65 237.26 1.79 5.80 Student -3.08 -1.25 0.33 1.07 1.79 2.52 3.26 4.83 6.67
233.79 2.10 1.31 School 1.00 1.42 1.77 1.94 2.10 2.27 2.44 2.79 3.21
70 239.78 1.73 5.80 Student -3.14 -1.31 0.27 1.01 1.73 2.46 3.20 4.77 6.61
235.07 2.16 1.31 School 1.05 1.47 1.82 1.99 2.16 2.32 2.49 2.84 3.26
75 242.50 1.67 5.80 Student -3.21 -1.37 0.20 0.94 1.67 2.40 3.14 4.71 6.55
236.44 2.21 1.31 School 1.11 1.52 1.88 2.05 2.21 2.38 2.54 2.90 3.31
80 245.53 1.60 5.80 Student -3.28 -1.44 0.13 0.87 1.60 2.32 3.06 4.64 6.47
237.96 2.27 1.31 School 1.17 1.59 1.94 2.11 2.27 2.44 2.60 2.96 3.37
85 249.07 1.51 5.80 Student -3.37 -1.53 0.04 0.78 1.51 2.24 2.98 4.55 6.39
239.75 2.34 1.31 School 1.24 1.66 2.01 2.18 2.34 2.51 2.68 3.03 3.45
90 253.51 1.40 5.80 Student -3.47 -1.64 -0.06 0.68 1.40 2.13 2.87 4.44 6.28
241.99 2.43 1.31 School 1.33 1.75 2.10 2.27 2.43 2.60 2.77 3.12 3.54
CGI - Conditional Growth Index CGP - Conditional Growth Percentile
245

Table E.1.58: Mathematics Grade 9 From Winter To Spring Conditional Growth Percentile
Conditional Growth
Start Status Growth CGP 20 30 40 45 50 55 60 70 80
%ile RIT Mean SD CGI -0.84 -0.52 -0.25 -0.13 0.00 0.13 0.25 0.52 0.84
10 208.37 0.92 5.18 Student -3.44 -1.80 -0.39 0.27 0.92 1.57 2.23 3.64 5.28
219.94 0.65 0.94 School -0.14 0.16 0.41 0.53 0.65 0.77 0.89 1.14 1.44
20 216.56 1.00 5.18 Student -3.36 -1.71 -0.31 0.35 1.00 1.66 2.32 3.72 5.37
224.16 0.83 0.94 School 0.04 0.34 0.59 0.71 0.83 0.95 1.06 1.32 1.62
25 219.67 1.04 5.18 Student -3.32 -1.68 -0.28 0.39 1.04 1.69 2.35 3.75 5.40
225.76 0.90 0.94 School 0.11 0.40 0.66 0.78 0.90 1.01 1.13 1.39 1.68
30 222.47 1.07 5.18 Student -3.29 -1.65 -0.25 0.42 1.07 1.72 2.38 3.78 5.43
227.20 0.96 0.94 School 0.17 0.47 0.72 0.84 0.96 1.07 1.19 1.45 1.74
35 225.06 1.09 5.18 Student -3.27 -1.62 -0.22 0.44 1.09 1.75 2.41 3.81 5.46
228.54 1.01 0.94 School 0.23 0.52 0.78 0.90 1.01 1.13 1.25 1.50 1.80
40 227.52 1.12 5.18 Student -3.24 -1.60 -0.19 0.47 1.12 1.77 2.43 3.84 5.48
229.80 1.07 0.94 School 0.28 0.58 0.83 0.95 1.07 1.18 1.30 1.56 1.85
45 229.90 1.15 5.18 Student -3.22 -1.57 -0.17 0.49 1.15 1.80 2.46 3.86 5.51
231.03 1.12 0.94 School 0.33 0.63 0.88 1.00 1.12 1.24 1.36 1.61 1.91
48 231.30 1.16 5.18 Student -3.20 -1.56 -0.15 0.51 1.16 1.81 2.47 3.88 5.52
231.75 1.15 0.94 School 0.36 0.66 0.91 1.03 1.15 1.27 1.39 1.64 1.94
50 232.24 1.17 5.18 Student -3.19 -1.55 -0.14 0.52 1.17 1.82 2.48 3.89 5.53
232.24 1.17 0.94 School 0.38 0.68 0.93 1.05 1.17 1.29 1.41 1.66 1.96
52 233.17 1.18 5.18 Student -3.18 -1.54 -0.13 0.53 1.18 1.83 2.49 3.90 5.54
232.72 1.19 0.94 School 0.40 0.70 0.95 1.07 1.19 1.31 1.43 1.68 1.98
55 234.58 1.19 5.18 Student -3.17 -1.52 -0.12 0.54 1.19 1.85 2.51 3.91 5.56
233.44 1.22 0.94 School 0.43 0.73 0.98 1.10 1.22 1.34 1.46 1.71 2.01
60 236.95 1.22 5.18 Student -3.14 -1.50 -0.09 0.57 1.22 1.87 2.53 3.94 5.58
234.67 1.27 0.94 School 0.49 0.78 1.04 1.16 1.27 1.39 1.51 1.76 2.06
65 239.41 1.25 5.18 Student -3.12 -1.47 -0.07 0.59 1.25 1.90 2.56 3.96 5.61
235.93 1.33 0.94 School 0.54 0.84 1.09 1.21 1.33 1.44 1.56 1.82 2.11
70 242.00 1.27 5.18 Student -3.09 -1.44 -0.04 0.62 1.27 1.92 2.59 3.99 5.63
237.27 1.38 0.94 School 0.60 0.89 1.15 1.27 1.38 1.50 1.62 1.87 2.17
75 244.80 1.30 5.18 Student -3.06 -1.41 -0.01 0.65 1.30 1.95 2.62 4.02 5.66
238.71 1.44 0.94 School 0.66 0.95 1.21 1.33 1.44 1.56 1.68 1.94 2.23
80 247.91 1.34 5.18 Student -3.03 -1.38 0.02 0.68 1.34 1.99 2.65 4.05 5.70
240.31 1.51 0.94 School 0.72 1.02 1.28 1.39 1.51 1.63 1.75 2.00 2.30
85 251.54 1.37 5.18 Student -2.99 -1.34 0.06 0.72 1.37 2.02 2.69 4.09 5.73
242.18 1.59 0.94 School 0.80 1.10 1.35 1.47 1.59 1.71 1.83 2.08 2.38
90 256.10 1.42 5.18 Student -2.94 -1.30 0.11 0.77 1.42 2.07 2.73 4.14 5.78
244.53 1.69 0.94 School 0.90 1.20 1.45 1.57 1.69 1.81 1.93 2.18 2.48
CGI - Conditional Growth Index CGP - Conditional Growth Percentile
246
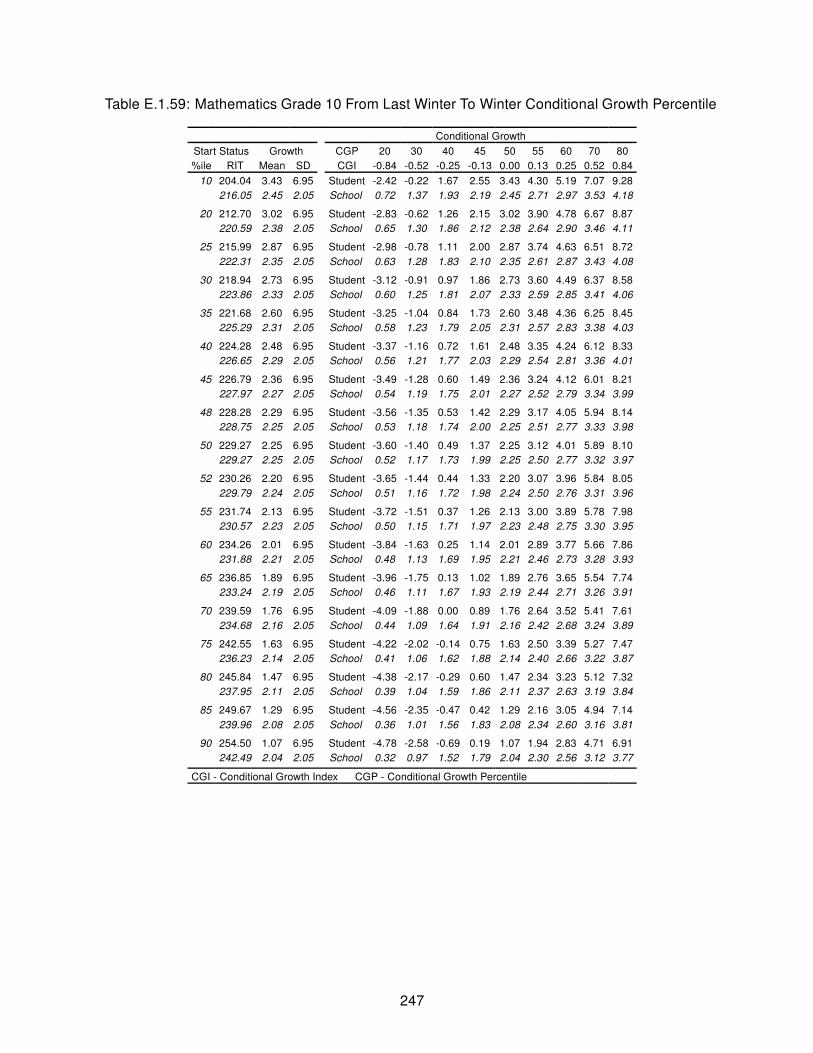
Table E.1.59: Mathematics Grade 10 From Last Winter To Winter Conditional Growth Percentile
Conditional Growth
Start Status Growth CGP 20 30 40 45 50 55 60 70 80
%ile RIT Mean SD CGI -0.84 -0.52 -0.25 -0.13 0.00 0.13 0.25 0.52 0.84
10 204.04 3.43 6.95 Student -2.42 -0.22 1.67 2.55 3.43 4.30 5.19 7.07 9.28
216.05 2.45 2.05 School 0.72 1.37 1.93 2.19 2.45 2.71 2.97 3.53 4.18
20 212.70 3.02 6.95 Student -2.83 -0.62 1.26 2.15 3.02 3.90 4.78 6.67 8.87
220.59 2.38 2.05 School 0.65 1.30 1.86 2.12 2.38 2.64 2.90 3.46 4.11
25 215.99 2.87 6.95 Student -2.98 -0.78 1.11 2.00 2.87 3.74 4.63 6.51 8.72
222.31 2.35 2.05 School 0.63 1.28 1.83 2.10 2.35 2.61 2.87 3.43 4.08
30 218.94 2.73 6.95 Student -3.12 -0.91 0.97 1.86 2.73 3.60 4.49 6.37 8.58
223.86 2.33 2.05 School 0.60 1.25 1.81 2.07 2.33 2.59 2.85 3.41 4.06
35 221.68 2.60 6.95 Student -3.25 -1.04 0.84 1.73 2.60 3.48 4.36 6.25 8.45
225.29 2.31 2.05 School 0.58 1.23 1.79 2.05 2.31 2.57 2.83 3.38 4.03
40 224.28 2.48 6.95 Student -3.37 -1.16 0.72 1.61 2.48 3.35 4.24 6.12 8.33
226.65 2.29 2.05 School 0.56 1.21 1.77 2.03 2.29 2.54 2.81 3.36 4.01
45 226.79 2.36 6.95 Student -3.49 -1.28 0.60 1.49 2.36 3.24 4.12 6.01 8.21
227.97 2.27 2.05 School 0.54 1.19 1.75 2.01 2.27 2.52 2.79 3.34 3.99
48 228.28 2.29 6.95 Student -3.56 -1.35 0.53 1.42 2.29 3.17 4.05 5.94 8.14
228.75 2.25 2.05 School 0.53 1.18 1.74 2.00 2.25 2.51 2.77 3.33 3.98
50 229.27 2.25 6.95 Student -3.60 -1.40 0.49 1.37 2.25 3.12 4.01 5.89 8.10
229.27 2.25 2.05 School 0.52 1.17 1.73 1.99 2.25 2.50 2.77 3.32 3.97
52 230.26 2.20 6.95 Student -3.65 -1.44 0.44 1.33 2.20 3.07 3.96 5.84 8.05
229.79 2.24 2.05 School 0.51 1.16 1.72 1.98 2.24 2.50 2.76 3.31 3.96
55 231.74 2.13 6.95 Student -3.72 -1.51 0.37 1.26 2.13 3.00 3.89 5.78 7.98
230.57 2.23 2.05 School 0.50 1.15 1.71 1.97 2.23 2.48 2.75 3.30 3.95
60 234.26 2.01 6.95 Student -3.84 -1.63 0.25 1.14 2.01 2.89 3.77 5.66 7.86
231.88 2.21 2.05 School 0.48 1.13 1.69 1.95 2.21 2.46 2.73 3.28 3.93
65 236.85 1.89 6.95 Student -3.96 -1.75 0.13 1.02 1.89 2.76 3.65 5.54 7.74
233.24 2.19 2.05 School 0.46 1.11 1.67 1.93 2.19 2.44 2.71 3.26 3.91
70 239.59 1.76 6.95 Student -4.09 -1.88 0.00 0.89 1.76 2.64 3.52 5.41 7.61
234.68 2.16 2.05 School 0.44 1.09 1.64 1.91 2.16 2.42 2.68 3.24 3.89
75 242.55 1.63 6.95 Student -4.22 -2.02 -0.14 0.75 1.63 2.50 3.39 5.27 7.47
236.23 2.14 2.05 School 0.41 1.06 1.62 1.88 2.14 2.40 2.66 3.22 3.87
80 245.84 1.47 6.95 Student -4.38 -2.17 -0.29 0.60 1.47 2.34 3.23 5.12 7.32
237.95 2.11 2.05 School 0.39 1.04 1.59 1.86 2.11 2.37 2.63 3.19 3.84
85 249.67 1.29 6.95 Student -4.56 -2.35 -0.47 0.42 1.29 2.16 3.05 4.94 7.14
239.96 2.08 2.05 School 0.36 1.01 1.56 1.83 2.08 2.34 2.60 3.16 3.81
90 254.50 1.07 6.95 Student -4.78 -2.58 -0.69 0.19 1.07 1.94 2.83 4.71 6.91
242.49 2.04 2.05 School 0.32 0.97 1.52 1.79 2.04 2.30 2.56 3.12 3.77
CGI - Conditional Growth Index CGP - Conditional Growth Percentile
247

Table E.1.60: Mathematics Grade 10 From Last Spring To Spring Conditional Growth Percentile
Conditional Growth
Start Status Growth CGP 20 30 40 45 50 55 60 70 80
%ile RIT Mean SD CGI -0.84 -0.52 -0.25 -0.13 0.00 0.13 0.25 0.52 0.84
10 203.72 4.27 8.79 Student -3.13 -0.34 2.04 3.16 4.27 5.38 6.50 8.88 11.67
216.49 2.56 2.70 School 0.29 1.15 1.88 2.22 2.56 2.90 3.25 3.98 4.83
20 212.82 3.54 8.79 Student -3.86 -1.07 1.31 2.43 3.54 4.64 5.77 8.15 10.94
221.21 2.42 2.70 School 0.15 1.00 1.73 2.08 2.42 2.76 3.10 3.83 4.69
25 216.27 3.26 8.79 Student -4.14 -1.35 1.03 2.16 3.26 4.37 5.49 7.87 10.66
223.00 2.36 2.70 School 0.09 0.95 1.68 2.02 2.36 2.70 3.05 3.78 4.63
30 219.38 3.01 8.79 Student -4.39 -1.60 0.78 1.91 3.01 4.12 5.24 7.62 10.41
224.61 2.31 2.70 School 0.04 0.90 1.63 1.97 2.31 2.65 3.00 3.73 4.58
35 222.26 2.78 8.79 Student -4.62 -1.83 0.55 1.68 2.78 3.89 5.01 7.39 10.18
226.10 2.27 2.70 School -0.00 0.85 1.58 1.93 2.27 2.61 2.95 3.68 4.54
40 224.99 2.56 8.79 Student -4.84 -2.05 0.33 1.46 2.56 3.67 4.79 7.17 9.96
227.51 2.22 2.70 School -0.05 0.81 1.54 1.88 2.22 2.56 2.91 3.64 4.50
45 227.63 2.35 8.79 Student -5.05 -2.26 0.12 1.24 2.35 3.45 4.58 6.96 9.75
228.88 2.18 2.70 School -0.09 0.77 1.50 1.84 2.18 2.52 2.86 3.60 4.45
48 229.19 2.22 8.79 Student -5.18 -2.39 -0.00 1.12 2.22 3.33 4.45 6.83 9.62
229.69 2.16 2.70 School -0.12 0.74 1.47 1.82 2.16 2.50 2.84 3.57 4.43
50 230.23 2.14 8.79 Student -5.26 -2.47 -0.09 1.03 2.14 3.24 4.37 6.75 9.54
230.23 2.14 2.70 School -0.13 0.72 1.46 1.80 2.14 2.48 2.82 3.56 4.41
52 231.26 2.06 8.79 Student -5.34 -2.56 -0.17 0.95 2.06 3.16 4.28 6.67 9.46
230.76 2.12 2.70 School -0.15 0.71 1.44 1.78 2.12 2.46 2.81 3.54 4.39
55 232.82 1.93 8.79 Student -5.47 -2.68 -0.30 0.83 1.93 3.04 4.16 6.54 9.33
231.57 2.10 2.70 School -0.17 0.68 1.41 1.76 2.10 2.44 2.78 3.51 4.37
60 235.47 1.72 8.79 Student -5.68 -2.89 -0.51 0.61 1.72 2.82 3.95 6.33 9.12
232.94 2.06 2.70 School -0.22 0.64 1.37 1.72 2.06 2.40 2.74 3.47 4.33
65 238.20 1.50 8.79 Student -5.90 -3.11 -0.73 0.39 1.50 2.60 3.73 6.11 8.90
234.35 2.01 2.70 School -0.26 0.60 1.33 1.67 2.01 2.35 2.70 3.43 4.28
70 241.07 1.27 8.79 Student -6.13 -3.34 -0.96 0.16 1.27 2.37 3.50 5.88 8.67
235.85 1.97 2.70 School -0.31 0.55 1.28 1.63 1.97 2.31 2.65 3.38 4.24
75 244.18 1.02 8.79 Student -6.38 -3.59 -1.21 -0.09 1.02 2.12 3.25 5.63 8.42
237.45 1.92 2.70 School -0.35 0.50 1.23 1.58 1.92 2.26 2.60 3.33 4.19
80 247.63 0.74 8.79 Student -6.66 -3.87 -1.49 -0.36 0.74 1.85 2.97 5.35 8.14
239.24 1.86 2.70 School -0.41 0.45 1.18 1.52 1.86 2.20 2.55 3.28 4.13
85 251.66 0.42 8.79 Student -6.98 -4.19 -1.81 -0.69 0.42 1.52 2.64 5.03 7.82
241.33 1.80 2.70 School -0.47 0.38 1.11 1.46 1.80 2.14 2.48 3.21 4.07
90 256.73 0.01 8.79 Student -7.39 -4.60 -2.22 -1.10 0.01 1.11 2.24 4.62 7.41
243.96 1.72 2.70 School -0.56 0.30 1.03 1.38 1.72 2.06 2.40 3.13 3.99
CGI - Conditional Growth Index CGP - Conditional Growth Percentile
248
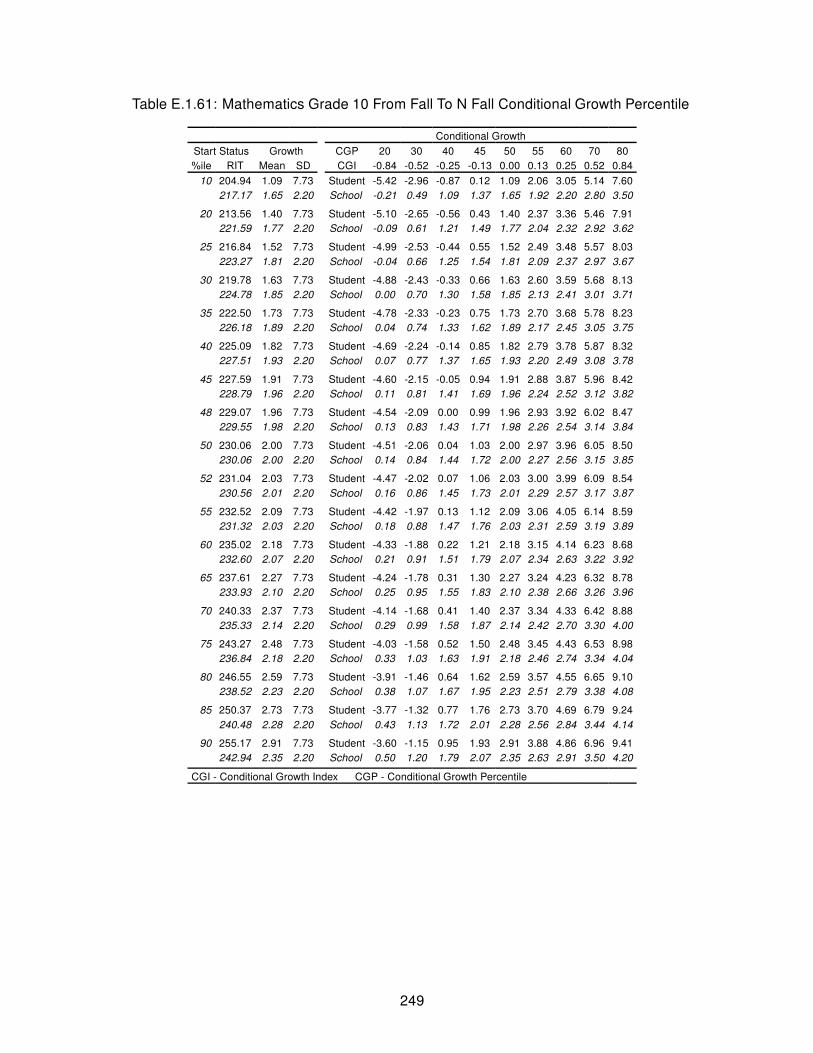
Table E.1.61: Mathematics Grade 10 From Fall To N Fall Conditional Growth Percentile
Conditional Growth
Start Status Growth CGP 20 30 40 45 50 55 60 70 80
%ile RIT Mean SD CGI -0.84 -0.52 -0.25 -0.13 0.00 0.13 0.25 0.52 0.84
10 204.94 1.09 7.73 Student -5.42 -2.96 -0.87 0.12 1.09 2.06 3.05 5.14 7.60
217.17 1.65 2.20 School -0.21 0.49 1.09 1.37 1.65 1.92 2.20 2.80 3.50
20 213.56 1.40 7.73 Student -5.10 -2.65 -0.56 0.43 1.40 2.37 3.36 5.46 7.91
221.59 1.77 2.20 School -0.09 0.61 1.21 1.49 1.77 2.04 2.32 2.92 3.62
25 216.84 1.52 7.73 Student -4.99 -2.53 -0.44 0.55 1.52 2.49 3.48 5.57 8.03
223.27 1.81 2.20 School -0.04 0.66 1.25 1.54 1.81 2.09 2.37 2.97 3.67
30 219.78 1.63 7.73 Student -4.88 -2.43 -0.33 0.66 1.63 2.60 3.59 5.68 8.13
224.78 1.85 2.20 School 0.00 0.70 1.30 1.58 1.85 2.13 2.41 3.01 3.71
35 222.50 1.73 7.73 Student -4.78 -2.33 -0.23 0.75 1.73 2.70 3.68 5.78 8.23
226.18 1.89 2.20 School 0.04 0.74 1.33 1.62 1.89 2.17 2.45 3.05 3.75
40 225.09 1.82 7.73 Student -4.69 -2.24 -0.14 0.85 1.82 2.79 3.78 5.87 8.32
227.51 1.93 2.20 School 0.07 0.77 1.37 1.65 1.93 2.20 2.49 3.08 3.78
45 227.59 1.91 7.73 Student -4.60 -2.15 -0.05 0.94 1.91 2.88 3.87 5.96 8.42
228.79 1.96 2.20 School 0.11 0.81 1.41 1.69 1.96 2.24 2.52 3.12 3.82
48 229.07 1.96 7.73 Student -4.54 -2.09 0.00 0.99 1.96 2.93 3.92 6.02 8.47
229.55 1.98 2.20 School 0.13 0.83 1.43 1.71 1.98 2.26 2.54 3.14 3.84
50 230.06 2.00 7.73 Student -4.51 -2.06 0.04 1.03 2.00 2.97 3.96 6.05 8.50
230.06 2.00 2.20 School 0.14 0.84 1.44 1.72 2.00 2.27 2.56 3.15 3.85
52 231.04 2.03 7.73 Student -4.47 -2.02 0.07 1.06 2.03 3.00 3.99 6.09 8.54
230.56 2.01 2.20 School 0.16 0.86 1.45 1.73 2.01 2.29 2.57 3.17 3.87
55 232.52 2.09 7.73 Student -4.42 -1.97 0.13 1.12 2.09 3.06 4.05 6.14 8.59
231.32 2.03 2.20 School 0.18 0.88 1.47 1.76 2.03 2.31 2.59 3.19 3.89
60 235.02 2.18 7.73 Student -4.33 -1.88 0.22 1.21 2.18 3.15 4.14 6.23 8.68
232.60 2.07 2.20 School 0.21 0.91 1.51 1.79 2.07 2.34 2.63 3.22 3.92
65 237.61 2.27 7.73 Student -4.24 -1.78 0.31 1.30 2.27 3.24 4.23 6.32 8.78
233.93 2.10 2.20 School 0.25 0.95 1.55 1.83 2.10 2.38 2.66 3.26 3.96
70 240.33 2.37 7.73 Student -4.14 -1.68 0.41 1.40 2.37 3.34 4.33 6.42 8.88
235.33 2.14 2.20 School 0.29 0.99 1.58 1.87 2.14 2.42 2.70 3.30 4.00
75 243.27 2.48 7.73 Student -4.03 -1.58 0.52 1.50 2.48 3.45 4.43 6.53 8.98
236.84 2.18 2.20 School 0.33 1.03 1.63 1.91 2.18 2.46 2.74 3.34 4.04
80 246.55 2.59 7.73 Student -3.91 -1.46 0.64 1.62 2.59 3.57 4.55 6.65 9.10
238.52 2.23 2.20 School 0.38 1.07 1.67 1.95 2.23 2.51 2.79 3.38 4.08
85 250.37 2.73 7.73 Student -3.77 -1.32 0.77 1.76 2.73 3.70 4.69 6.79 9.24
240.48 2.28 2.20 School 0.43 1.13 1.72 2.01 2.28 2.56 2.84 3.44 4.14
90 255.17 2.91 7.73 Student -3.60 -1.15 0.95 1.93 2.91 3.88 4.86 6.96 9.41
242.94 2.35 2.20 School 0.50 1.20 1.79 2.07 2.35 2.63 2.91 3.50 4.20
CGI - Conditional Growth Index CGP - Conditional Growth Percentile
249

Table E.1.62: Mathematics Grade 10 From Fall To Spring Conditional Growth Percentile
Conditional Growth
Start Status Growth CGP 20 30 40 45 50 55 60 70 80
%ile RIT Mean SD CGI -0.84 -0.52 -0.25 -0.13 0.00 0.13 0.25 0.52 0.84
10 204.94 3.11 8.90 Student -4.38 -1.56 0.86 1.99 3.11 4.23 5.37 7.78 10.61
217.17 1.87 2.65 School -0.36 0.48 1.20 1.54 1.87 2.20 2.54 3.26 4.10
20 213.56 2.84 8.90 Student -4.66 -1.83 0.58 1.72 2.84 3.96 5.09 7.51 10.33
221.59 2.02 2.65 School -0.21 0.63 1.35 1.69 2.02 2.36 2.69 3.41 4.25
25 216.84 2.73 8.90 Student -4.76 -1.94 0.48 1.61 2.73 3.85 4.99 7.40 10.22
223.27 2.08 2.65 School -0.15 0.69 1.41 1.75 2.08 2.41 2.75 3.47 4.31
30 219.78 2.64 8.90 Student -4.85 -2.03 0.38 1.52 2.64 3.76 4.89 7.31 10.13
224.78 2.13 2.65 School -0.10 0.74 1.46 1.80 2.13 2.46 2.80 3.52 4.36
35 222.50 2.55 8.90 Student -4.94 -2.12 0.30 1.43 2.55 3.67 4.81 7.22 10.04
226.18 2.18 2.65 School -0.05 0.79 1.51 1.85 2.18 2.51 2.85 3.57 4.41
40 225.09 2.47 8.90 Student -5.02 -2.20 0.21 1.35 2.47 3.59 4.72 7.14 9.96
227.51 2.22 2.65 School -0.01 0.83 1.55 1.89 2.22 2.56 2.89 3.61 4.45
45 227.59 2.39 8.90 Student -5.10 -2.28 0.13 1.27 2.39 3.51 4.64 7.06 9.88
228.79 2.27 2.65 School 0.04 0.88 1.60 1.93 2.27 2.60 2.94 3.66 4.50
48 229.07 2.34 8.90 Student -5.15 -2.33 0.09 1.22 2.34 3.46 4.60 7.01 9.83
229.55 2.29 2.65 School 0.06 0.90 1.62 1.96 2.29 2.63 2.96 3.68 4.52
50 230.06 2.31 8.90 Student -5.18 -2.36 0.05 1.19 2.31 3.43 4.56 6.98 9.80
230.06 2.31 2.65 School 0.08 0.92 1.64 1.98 2.31 2.64 2.98 3.70 4.54
52 231.04 2.28 8.90 Student -5.21 -2.39 0.02 1.16 2.28 3.40 4.53 6.95 9.77
230.56 2.33 2.65 School 0.10 0.94 1.66 1.99 2.33 2.66 3.00 3.72 4.56
55 232.52 2.23 8.90 Student -5.26 -2.44 -0.02 1.11 2.23 3.35 4.49 6.90 9.72
231.32 2.35 2.65 School 0.12 0.96 1.68 2.02 2.35 2.69 3.02 3.74 4.58
60 235.02 2.15 8.90 Student -5.34 -2.52 -0.10 1.03 2.15 3.27 4.41 6.82 9.64
232.60 2.40 2.65 School 0.17 1.01 1.72 2.06 2.40 2.73 3.07 3.78 4.62
65 237.61 2.07 8.90 Student -5.42 -2.60 -0.19 0.95 2.07 3.19 4.32 6.74 9.56
233.93 2.44 2.65 School 0.21 1.05 1.77 2.11 2.44 2.77 3.11 3.83 4.67
70 240.33 1.98 8.90 Student -5.51 -2.69 -0.27 0.86 1.98 3.10 4.24 6.65 9.47
235.33 2.49 2.65 School 0.26 1.10 1.82 2.16 2.49 2.82 3.16 3.88 4.72
75 243.27 1.89 8.90 Student -5.61 -2.78 -0.37 0.77 1.89 3.01 4.14 6.56 9.38
236.84 2.54 2.65 School 0.31 1.15 1.87 2.21 2.54 2.87 3.21 3.93 4.77
80 246.55 1.78 8.90 Student -5.71 -2.89 -0.47 0.66 1.78 2.90 4.04 6.45 9.27
238.52 2.60 2.65 School 0.37 1.21 1.93 2.26 2.60 2.93 3.27 3.99 4.83
85 250.37 1.66 8.90 Student -5.83 -3.01 -0.60 0.54 1.66 2.78 3.92 6.33 9.15
240.48 2.66 2.65 School 0.43 1.27 1.99 2.33 2.66 3.00 3.33 4.05 4.89
90 255.17 1.51 8.90 Student -5.99 -3.16 -0.75 0.39 1.51 2.63 3.76 6.18 9.00
242.94 2.75 2.65 School 0.52 1.36 2.08 2.41 2.75 3.08 3.42 4.14 4.98
CGI - Conditional Growth Index CGP - Conditional Growth Percentile
250

Table E.1.63: Mathematics Grade 10 From Fall To Winter Conditional Growth Percentile
Conditional Growth
Start Status Growth CGP 20 30 40 45 50 55 60 70 80
%ile RIT Mean SD CGI -0.84 -0.52 -0.25 -0.13 0.00 0.13 0.25 0.52 0.84
10 204.94 2.17 6.15 Student -3.01 -1.05 0.61 1.40 2.17 2.94 3.73 5.40 7.35
217.17 1.21 1.51 School -0.06 0.42 0.83 1.02 1.21 1.40 1.59 2.00 2.48
20 213.56 1.93 6.15 Student -3.25 -1.30 0.37 1.15 1.93 2.70 3.48 5.15 7.10
221.59 1.30 1.51 School 0.02 0.50 0.91 1.11 1.30 1.49 1.68 2.09 2.57
25 216.84 1.83 6.15 Student -3.34 -1.39 0.28 1.06 1.83 2.61 3.39 5.06 7.01
223.27 1.33 1.51 School 0.05 0.53 0.94 1.14 1.33 1.52 1.71 2.12 2.60
30 219.78 1.75 6.15 Student -3.43 -1.47 0.19 0.98 1.75 2.52 3.31 4.98 6.93
224.78 1.36 1.51 School 0.08 0.56 0.97 1.17 1.36 1.55 1.74 2.15 2.63
35 222.50 1.67 6.15 Student -3.50 -1.55 0.12 0.90 1.67 2.45 3.23 4.90 6.85
226.18 1.38 1.51 School 0.11 0.59 1.00 1.19 1.38 1.57 1.77 2.18 2.66
40 225.09 1.60 6.15 Student -3.58 -1.62 0.04 0.83 1.60 2.37 3.16 4.83 6.78
227.51 1.41 1.51 School 0.14 0.62 1.03 1.22 1.41 1.60 1.79 2.20 2.68
45 227.59 1.53 6.15 Student -3.65 -1.70 -0.03 0.76 1.53 2.30 3.09 4.75 6.71
228.79 1.44 1.51 School 0.16 0.64 1.05 1.24 1.44 1.63 1.82 2.23 2.71
48 229.07 1.49 6.15 Student -3.69 -1.74 -0.07 0.71 1.49 2.26 3.05 4.71 6.66
229.55 1.45 1.51 School 0.18 0.66 1.07 1.26 1.45 1.64 1.83 2.24 2.72
50 230.06 1.46 6.15 Student -3.72 -1.77 -0.10 0.69 1.46 2.23 3.02 4.68 6.64
230.06 1.46 1.51 School 0.19 0.67 1.08 1.27 1.46 1.65 1.84 2.25 2.73
52 231.04 1.43 6.15 Student -3.74 -1.79 -0.13 0.66 1.43 2.20 2.99 4.66 6.61
230.56 1.47 1.51 School 0.20 0.68 1.09 1.28 1.47 1.66 1.85 2.26 2.74
55 232.52 1.39 6.15 Student -3.79 -1.84 -0.17 0.62 1.39 2.16 2.95 4.62 6.57
231.32 1.48 1.51 School 0.21 0.69 1.10 1.29 1.48 1.67 1.87 2.28 2.76
60 235.02 1.32 6.15 Student -3.86 -1.91 -0.24 0.55 1.32 2.09 2.88 4.54 6.50
232.60 1.51 1.51 School 0.23 0.72 1.13 1.32 1.51 1.70 1.89 2.30 2.78
65 237.61 1.25 6.15 Student -3.93 -1.98 -0.31 0.47 1.25 2.02 2.80 4.47 6.42
233.93 1.53 1.51 School 0.26 0.74 1.15 1.34 1.53 1.73 1.92 2.33 2.81
70 240.33 1.17 6.15 Student -4.01 -2.06 -0.39 0.40 1.17 1.94 2.73 4.39 6.34
235.33 1.56 1.51 School 0.29 0.77 1.18 1.37 1.56 1.75 1.95 2.36 2.84
75 243.27 1.09 6.15 Student -4.09 -2.14 -0.47 0.31 1.09 1.86 2.64 4.31 6.26
236.84 1.59 1.51 School 0.32 0.80 1.21 1.40 1.59 1.78 1.97 2.39 2.87
80 246.55 0.99 6.15 Student -4.18 -2.23 -0.57 0.22 0.99 1.77 2.55 4.22 6.17
238.52 1.62 1.51 School 0.35 0.83 1.24 1.43 1.62 1.81 2.01 2.42 2.90
85 250.37 0.88 6.15 Student -4.29 -2.34 -0.67 0.11 0.88 1.66 2.44 4.11 6.06
240.48 1.66 1.51 School 0.39 0.87 1.28 1.47 1.66 1.85 2.05 2.46 2.94
90 255.17 0.75 6.15 Student -4.43 -2.48 -0.81 -0.02 0.75 1.52 2.31 3.97 5.92
242.94 1.71 1.51 School 0.44 0.92 1.33 1.52 1.71 1.90 2.09 2.50 2.98
CGI - Conditional Growth Index CGP - Conditional Growth Percentile
251

Table E.1.64: Mathematics Grade 10 From Winter To Spring Conditional Growth Percentile
Conditional Growth
Start Status Growth CGP 20 30 40 45 50 55 60 70 80
%ile RIT Mean SD CGI -0.84 -0.52 -0.25 -0.13 0.00 0.13 0.25 0.52 0.84
10 205.87 0.55 5.41 Student -4.00 -2.29 -0.82 -0.13 0.55 1.23 1.92 3.39 5.10
218.23 0.45 1.10 School -0.48 -0.13 0.17 0.31 0.45 0.59 0.73 1.03 1.38
20 214.67 0.65 5.41 Student -3.90 -2.18 -0.72 -0.03 0.65 1.33 2.02 3.49 5.21
222.79 0.59 1.10 School -0.34 0.01 0.31 0.45 0.59 0.73 0.87 1.17 1.52
25 218.02 0.69 5.41 Student -3.86 -2.15 -0.68 0.01 0.69 1.37 2.06 3.53 5.25
224.53 0.64 1.10 School -0.29 0.06 0.36 0.50 0.64 0.78 0.92 1.22 1.57
30 221.02 0.73 5.41 Student -3.83 -2.11 -0.64 0.05 0.73 1.41 2.10 3.56 5.28
226.08 0.69 1.10 School -0.24 0.11 0.41 0.55 0.69 0.83 0.97 1.27 1.62
35 223.80 0.76 5.41 Student -3.79 -2.08 -0.61 0.08 0.76 1.44 2.13 3.60 5.31
227.52 0.73 1.10 School -0.20 0.15 0.45 0.59 0.73 0.87 1.01 1.31 1.66
40 226.45 0.79 5.41 Student -3.76 -2.05 -0.58 0.11 0.79 1.47 2.16 3.63 5.34
228.89 0.77 1.10 School -0.16 0.19 0.49 0.63 0.77 0.91 1.05 1.35 1.70
45 229.00 0.82 5.41 Student -3.73 -2.02 -0.55 0.14 0.82 1.50 2.19 3.66 5.37
230.21 0.81 1.10 School -0.12 0.23 0.53 0.67 0.81 0.95 1.09 1.39 1.74
48 230.51 0.84 5.41 Student -3.72 -2.00 -0.53 0.16 0.84 1.52 2.21 3.68 5.39
231.00 0.83 1.10 School -0.09 0.26 0.55 0.70 0.83 0.97 1.11 1.41 1.76
50 231.52 0.85 5.41 Student -3.70 -1.99 -0.52 0.17 0.85 1.53 2.22 3.69 5.40
231.52 0.85 1.10 School -0.08 0.27 0.57 0.71 0.85 0.99 1.13 1.43 1.78
52 232.52 0.86 5.41 Student -3.69 -1.98 -0.51 0.18 0.86 1.54 2.23 3.70 5.42
232.04 0.87 1.10 School -0.06 0.29 0.59 0.73 0.87 1.00 1.14 1.44 1.79
55 234.03 0.88 5.41 Student -3.67 -1.96 -0.49 0.20 0.88 1.56 2.25 3.72 5.43
232.82 0.89 1.10 School -0.04 0.31 0.61 0.75 0.89 1.03 1.17 1.47 1.82
60 236.59 0.91 5.41 Student -3.64 -1.93 -0.46 0.23 0.91 1.59 2.28 3.75 5.46
234.14 0.93 1.10 School -0.00 0.35 0.65 0.79 0.93 1.07 1.21 1.51 1.86
65 239.23 0.94 5.41 Student -3.61 -1.90 -0.43 0.26 0.94 1.62 2.31 3.78 5.49
235.51 0.97 1.10 School 0.04 0.39 0.69 0.83 0.97 1.11 1.25 1.55 1.90
70 242.01 0.97 5.41 Student -3.58 -1.86 -0.40 0.29 0.97 1.65 2.34 3.81 5.53
236.95 1.01 1.10 School 0.08 0.43 0.73 0.87 1.01 1.15 1.29 1.59 1.94
75 245.01 1.01 5.41 Student -3.55 -1.83 -0.36 0.33 1.01 1.69 2.38 3.85 5.56
238.51 1.06 1.10 School 0.13 0.48 0.78 0.92 1.06 1.20 1.34 1.64 1.99
80 248.36 1.05 5.41 Student -3.51 -1.79 -0.32 0.37 1.05 1.73 2.42 3.88 5.60
240.24 1.11 1.10 School 0.18 0.53 0.83 0.97 1.11 1.25 1.39 1.69 2.04
85 252.26 1.09 5.41 Student -3.46 -1.74 -0.28 0.41 1.09 1.77 2.46 3.93 5.65
242.26 1.17 1.10 School 0.24 0.59 0.89 1.03 1.17 1.31 1.45 1.75 2.10
90 257.16 1.15 5.41 Student -3.40 -1.69 -0.22 0.47 1.15 1.83 2.52 3.99 5.70
244.80 1.25 1.10 School 0.32 0.67 0.97 1.11 1.25 1.39 1.53 1.83 2.18
CGI - Conditional Growth Index CGP - Conditional Growth Percentile
252

Appendix E.2 - Reading
Table E.2.1: Reading Grade K From Fall To N Fall Conditional Growth Percentile
Conditional Growth
Start Status Growth CGP 20 30 40 45 50 55 60 70 80
%ile RIT Mean SD CGI -0.84 -0.52 -0.25 -0.13 0.00 0.13 0.25 0.52 0.84
10 116.02 38.05 12.09 Student 27.87 31.71 34.98 36.53 38.05 39.57 41.11 44.39 48.23
120.27 39.23 5.69 School 34.44 36.25 37.79 38.52 39.23 39.94 40.67 42.21 44.02
20 123.40 33.50 12.09 Student 23.32 27.15 30.43 31.98 33.50 35.02 36.56 39.84 43.67
126.19 34.27 5.69 School 29.49 31.29 32.83 33.56 34.27 34.99 35.71 37.26 39.06
25 126.21 31.77 12.09 Student 21.59 25.43 28.70 30.25 31.77 33.29 34.83 38.11 41.95
128.44 32.39 5.69 School 27.60 29.41 30.95 31.68 32.39 33.10 33.83 35.37 37.18
30 128.73 30.22 12.09 Student 20.04 23.87 27.15 28.70 30.22 31.73 33.28 36.56 40.39
130.47 30.70 5.69 School 25.91 27.72 29.26 29.98 30.70 31.41 32.14 33.68 35.49
35 131.06 28.78 12.09 Student 18.60 22.43 25.71 27.26 28.78 30.30 31.84 35.12 38.95
132.34 29.13 5.69 School 24.34 26.15 27.69 28.42 29.13 29.85 30.57 32.11 33.92
40 133.28 27.41 12.09 Student 17.23 21.07 24.35 25.89 27.41 28.93 30.47 33.75 37.59
134.12 27.64 5.69 School 22.86 24.66 26.20 26.93 27.64 28.36 29.09 30.63 32.43
45 135.42 26.09 12.09 Student 15.91 19.75 23.03 24.57 26.09 27.61 29.15 32.43 36.27
135.84 26.21 5.69 School 21.42 23.22 24.77 25.49 26.21 26.92 27.65 29.19 30.99
48 136.69 25.31 12.09 Student 15.13 18.97 22.25 23.79 25.31 26.83 28.37 31.65 35.49
136.85 25.36 5.69 School 20.57 22.37 23.91 24.64 25.36 26.07 26.80 28.34 30.14
50 137.53 24.79 12.09 Student 14.61 18.45 21.73 23.27 24.79 26.31 27.85 31.13 34.97
137.53 24.79 5.69 School 20.00 21.81 23.35 24.08 24.79 25.51 26.23 27.77 29.58
52 138.37 24.27 12.09 Student 14.09 17.93 21.21 22.75 24.27 25.79 27.34 30.61 34.45
138.21 24.23 5.69 School 19.44 21.24 22.78 23.51 24.23 24.94 25.67 27.21 29.01
55 139.64 23.49 12.09 Student 13.31 17.15 20.43 21.97 23.49 25.01 26.55 29.83 33.67
139.22 23.37 5.69 School 18.59 20.39 21.93 22.66 23.37 24.09 24.82 26.36 28.16
60 141.78 22.17 12.09 Student 11.99 15.83 19.11 20.65 22.17 23.69 25.23 28.51 32.35
140.94 21.94 5.69 School 17.15 18.95 20.49 21.22 21.94 22.65 23.38 24.92 26.72
65 144.00 20.80 12.09 Student 10.63 14.46 17.74 19.28 20.80 22.32 23.87 27.15 30.98
142.72 20.45 5.69 School 15.66 17.47 19.01 19.73 20.45 21.16 21.89 23.43 25.24
70 146.33 19.37 12.09 Student 9.19 13.02 16.30 17.85 19.37 20.89 22.43 25.71 29.54
144.59 18.88 5.69 School 14.09 15.90 17.44 18.17 18.88 19.60 20.32 21.86 23.67
75 148.85 17.81 12.09 Student 7.63 11.47 14.75 16.29 17.81 19.33 20.88 24.15 27.99
146.61 17.19 5.69 School 12.40 14.21 15.75 16.48 17.19 17.91 18.63 20.17 21.98
80 151.65 16.08 12.09 Student 5.91 9.74 13.02 14.56 16.08 17.60 19.15 22.43 26.26
148.87 15.31 5.69 School 10.52 12.32 13.87 14.59 15.31 16.02 16.75 18.29 20.09
85 154.92 14.07 12.09 Student 3.89 7.73 11.01 12.55 14.07 15.59 17.13 20.41 24.25
151.49 13.11 5.69 School 8.33 10.13 11.67 12.40 13.11 13.83 14.55 16.10 17.90
90 159.04 11.53 12.09 Student 1.36 5.19 8.47 10.01 11.53 13.05 14.60 17.88 21.71
154.79 10.35 5.69 School 5.56 7.37 8.91 9.64 10.35 11.07 11.79 13.33 15.14
CGI - Conditional Growth Index CGP - Conditional Growth Percentile
253

Table E.2.2: Reading Grade K From Fall To Spring Conditional Growth Percentile
Conditional Growth
Start Status Growth CGP 20 30 40 45 50 55 60 70 80
%ile RIT Mean SD CGI -0.84 -0.52 -0.25 -0.13 0.00 0.13 0.25 0.52 0.84
10 116.02 31.75 10.82 Student 22.64 26.07 29.01 30.39 31.75 33.11 34.49 37.42 40.85
120.27 32.66 4.91 School 28.53 30.09 31.42 32.05 32.66 33.28 33.91 35.24 36.80
20 123.40 27.74 10.82 Student 18.64 22.07 25.00 26.39 27.74 29.10 30.49 33.42 36.85
126.19 28.35 4.91 School 24.21 25.77 27.10 27.73 28.35 28.96 29.59 30.92 32.48
25 126.21 26.22 10.82 Student 17.12 20.55 23.48 24.86 26.22 27.58 28.97 31.90 35.33
128.44 26.71 4.91 School 22.57 24.13 25.46 26.09 26.71 27.32 27.95 29.28 30.84
30 128.73 24.86 10.82 Student 15.75 19.18 22.12 23.50 24.86 26.22 27.60 30.53 33.96
130.47 25.23 4.91 School 21.10 22.66 23.99 24.62 25.23 25.85 26.48 27.81 29.37
35 131.06 23.59 10.82 Student 14.49 17.92 20.85 22.23 23.59 24.95 26.33 29.27 32.70
132.34 23.87 4.91 School 19.73 21.29 22.62 23.25 23.87 24.49 25.11 26.44 28.00
40 133.28 22.39 10.82 Student 13.29 16.72 19.65 21.03 22.39 23.75 25.13 28.07 31.50
134.12 22.57 4.91 School 18.44 20.00 21.33 21.96 22.57 23.19 23.82 25.15 26.71
45 135.42 21.23 10.82 Student 12.12 15.56 18.49 19.87 21.23 22.59 23.97 26.90 30.34
135.84 21.32 4.91 School 17.19 18.74 20.08 20.70 21.32 21.94 22.57 23.90 25.46
48 136.69 20.54 10.82 Student 11.44 14.87 17.80 19.18 20.54 21.90 23.28 26.22 29.65
136.85 20.58 4.91 School 16.44 18.00 19.33 19.96 20.58 21.20 21.82 23.16 24.71
50 137.53 20.09 10.82 Student 10.98 14.41 17.35 18.73 20.09 21.45 22.83 25.76 29.19
137.53 20.09 4.91 School 15.95 17.51 18.84 19.47 20.09 20.70 21.33 22.66 24.22
52 138.37 19.63 10.82 Student 10.52 13.96 16.89 18.27 19.63 20.99 22.37 25.31 28.74
138.21 19.60 4.91 School 15.46 17.02 18.35 18.98 19.60 20.21 20.84 22.17 23.73
55 139.64 18.94 10.82 Student 9.84 13.27 16.20 17.58 18.94 20.30 21.69 24.62 28.05
139.22 18.85 4.91 School 14.72 16.28 17.61 18.24 18.85 19.47 20.10 21.43 22.99
60 141.78 17.78 10.82 Student 8.68 12.11 15.04 16.42 17.78 19.14 20.52 23.46 26.89
140.94 17.60 4.91 School 13.47 15.02 16.36 16.98 17.60 18.22 18.85 20.18 21.74
65 144.00 16.58 10.82 Student 7.48 10.91 13.84 15.22 16.58 17.94 19.32 22.26 25.69
142.72 16.31 4.91 School 12.17 13.73 15.06 15.69 16.31 16.92 17.55 18.88 20.44
70 146.33 15.32 10.82 Student 6.21 9.64 12.57 13.96 15.32 16.68 18.06 20.99 24.42
144.59 14.94 4.91 School 10.81 12.36 13.70 14.32 14.94 15.56 16.19 17.52 19.08
75 148.85 13.95 10.82 Student 4.84 8.28 11.21 12.59 13.95 15.31 16.69 19.62 23.06
146.61 13.47 4.91 School 9.33 10.89 12.22 12.85 13.47 14.09 14.71 16.04 17.60
80 151.65 12.43 10.82 Student 3.32 6.76 9.69 11.07 12.43 13.79 15.17 18.10 21.54
148.87 11.83 4.91 School 7.69 9.25 10.58 11.21 11.83 12.45 13.07 14.40 15.96
85 154.92 10.66 10.82 Student 1.55 4.98 7.92 9.30 10.66 12.02 13.40 16.33 19.76
151.49 9.92 4.91 School 5.78 7.34 8.67 9.30 9.92 10.53 11.16 12.49 14.05
90 159.04 8.43 10.82 Student -0.68 2.75 5.69 7.07 8.43 9.79 11.17 14.10 17.53
154.79 7.51 4.91 School 3.38 4.93 6.27 6.89 7.51 8.13 8.76 10.09 11.65
CGI - Conditional Growth Index CGP - Conditional Growth Percentile
254

Table E.2.3: Reading Grade K From Fall To Winter Conditional Growth Percentile
Conditional Growth
Start Status Growth CGP 20 30 40 45 50 55 60 70 80
%ile RIT Mean SD CGI -0.84 -0.52 -0.25 -0.13 0.00 0.13 0.25 0.52 0.84
10 116.02 20.43 7.96 Student 13.73 16.25 18.41 19.43 20.43 21.43 22.45 24.60 27.13
120.27 20.75 3.25 School 18.01 19.04 19.93 20.34 20.75 21.16 21.58 22.46 23.49
20 123.40 17.68 7.96 Student 10.98 13.50 15.66 16.68 17.68 18.68 19.69 21.85 24.38
126.19 17.89 3.25 School 15.15 16.18 17.06 17.48 17.89 18.30 18.71 19.60 20.63
25 126.21 16.63 7.96 Student 9.93 12.46 14.61 15.63 16.63 17.63 18.65 20.81 23.33
128.44 16.80 3.25 School 14.06 15.09 15.98 16.39 16.80 17.21 17.63 18.51 19.54
30 128.73 15.69 7.96 Student 8.99 11.52 13.68 14.69 15.69 16.69 17.71 19.87 22.39
130.47 15.82 3.25 School 13.09 14.12 15.00 15.42 15.82 16.23 16.65 17.53 18.56
35 131.06 14.82 7.96 Student 8.12 10.65 12.81 13.82 14.82 15.82 16.84 19.00 21.52
132.34 14.92 3.25 School 12.18 13.21 14.09 14.51 14.92 15.33 15.74 16.63 17.66
40 133.28 14.00 7.96 Student 7.30 9.82 11.98 13.00 14.00 15.00 16.01 18.17 20.70
134.12 14.06 3.25 School 11.32 12.35 13.24 13.65 14.06 14.47 14.89 15.77 16.80
45 135.42 13.20 7.96 Student 6.50 9.02 11.18 12.20 13.20 14.20 15.22 17.37 19.90
135.84 13.23 3.25 School 10.49 11.52 12.41 12.82 13.23 13.64 14.05 14.94 15.97
48 136.69 12.73 7.96 Student 6.03 8.55 10.71 11.73 12.73 13.73 14.74 16.90 19.43
136.85 12.74 3.25 School 10.00 11.03 11.91 12.33 12.74 13.15 13.56 14.44 15.48
50 137.53 12.41 7.96 Student 5.71 8.24 10.39 11.41 12.41 13.41 14.43 16.59 19.11
137.53 12.41 3.25 School 9.67 10.71 11.59 12.00 12.41 12.82 13.24 14.12 15.15
52 138.37 12.10 7.96 Student 5.40 7.92 10.08 11.10 12.10 13.10 14.12 16.27 18.80
138.21 12.09 3.25 School 9.35 10.38 11.26 11.68 12.09 12.49 12.91 13.79 14.82
55 139.64 11.63 7.96 Student 4.93 7.45 9.61 10.63 11.63 12.63 13.64 15.80 18.33
139.22 11.59 3.25 School 8.86 9.89 10.77 11.19 11.59 12.00 12.42 13.30 14.33
60 141.78 10.83 7.96 Student 4.13 6.65 8.81 9.83 10.83 11.83 12.84 15.00 17.53
140.94 10.76 3.25 School 8.02 9.06 9.94 10.35 10.76 11.17 11.59 12.47 13.50
65 144.00 10.00 7.96 Student 3.30 5.83 7.98 9.00 10.00 11.00 12.02 14.18 16.70
142.72 9.90 3.25 School 7.17 8.20 9.08 9.50 9.90 10.31 10.73 11.61 12.64
70 146.33 9.13 7.96 Student 2.43 4.96 7.11 8.13 9.13 10.13 11.15 13.31 15.83
144.59 9.00 3.25 School 6.26 7.29 8.17 8.59 9.00 9.41 9.82 10.71 11.74
75 148.85 8.19 7.96 Student 1.49 4.02 6.18 7.19 8.19 9.19 10.21 12.37 14.89
146.61 8.02 3.25 School 5.28 6.32 7.20 7.61 8.02 8.43 8.85 9.73 10.76
80 151.65 7.15 7.96 Student 0.45 2.97 5.13 6.15 7.15 8.15 9.16 11.32 13.85
148.87 6.94 3.25 School 4.20 5.23 6.11 6.53 6.94 7.34 7.76 8.64 9.67
85 154.92 5.93 7.96 Student -0.77 1.75 3.91 4.93 5.93 6.93 7.95 10.10 12.63
151.49 5.67 3.25 School 2.93 3.96 4.84 5.26 5.67 6.08 6.49 7.37 8.41
90 159.04 4.39 7.96 Student -2.31 0.22 2.38 3.39 4.39 5.40 6.41 8.57 11.10
154.79 4.07 3.25 School 1.33 2.37 3.25 3.66 4.07 4.48 4.90 5.78 6.81
CGI - Conditional Growth Index CGP - Conditional Growth Percentile
255

Table E.2.4: Reading Grade K From Winter To Spring Conditional Growth Percentile
Conditional Growth
Start Status Growth CGP 20 30 40 45 50 55 60 70 80
%ile RIT Mean SD CGI -0.84 -0.52 -0.25 -0.13 0.00 0.13 0.25 0.52 0.84
10 133.03 9.61 6.28 Student 4.32 6.31 8.02 8.82 9.61 10.40 11.20 12.90 14.89
140.09 10.63 2.92 School 8.17 9.09 9.89 10.26 10.63 10.99 11.37 12.16 13.08
20 138.83 8.94 6.28 Student 3.66 5.65 7.35 8.15 8.94 9.73 10.53 12.24 14.23
143.47 9.61 2.92 School 7.16 8.08 8.87 9.25 9.61 9.98 10.35 11.14 12.07
25 141.04 8.69 6.28 Student 3.41 5.40 7.10 7.90 8.69 9.48 10.28 11.98 13.98
144.76 9.23 2.92 School 6.77 7.70 8.49 8.86 9.23 9.60 9.97 10.76 11.69
30 143.02 8.47 6.28 Student 3.18 5.17 6.87 7.68 8.47 9.25 10.06 11.76 13.75
145.91 8.88 2.92 School 6.42 7.35 8.14 8.52 8.88 9.25 9.62 10.41 11.34
35 144.86 8.26 6.28 Student 2.97 4.96 6.67 7.47 8.26 9.05 9.85 11.55 13.54
146.98 8.56 2.92 School 6.10 7.03 7.82 8.20 8.56 8.93 9.30 10.09 11.02
40 146.60 8.06 6.28 Student 2.77 4.76 6.47 7.27 8.06 8.85 9.65 11.35 13.34
147.99 8.26 2.92 School 5.80 6.73 7.52 7.89 8.26 8.63 9.00 9.79 10.72
45 148.28 7.86 6.28 Student 2.58 4.57 6.27 7.08 7.86 8.65 9.46 11.16 13.15
148.98 7.96 2.92 School 5.51 6.43 7.22 7.60 7.96 8.33 8.70 9.50 10.42
48 149.28 7.75 6.28 Student 2.47 4.46 6.16 6.96 7.75 8.54 9.34 11.04 13.04
149.56 7.79 2.92 School 5.33 6.26 7.05 7.42 7.79 8.16 8.53 9.32 10.25
50 149.94 7.68 6.28 Student 2.39 4.38 6.08 6.89 7.68 8.46 9.27 10.97 12.96
149.94 7.68 2.92 School 5.22 6.14 6.94 7.31 7.68 8.04 8.42 9.21 10.13
52 150.60 7.60 6.28 Student 2.32 4.31 6.01 6.81 7.60 8.39 9.19 10.89 12.88
150.33 7.56 2.92 School 5.10 6.03 6.82 7.19 7.56 7.93 8.30 9.09 10.02
55 151.60 7.49 6.28 Student 2.20 4.19 5.90 6.70 7.49 8.28 9.08 10.78 12.77
150.91 7.39 2.92 School 4.93 5.85 6.65 7.02 7.39 7.75 8.13 8.92 9.84
60 153.29 7.29 6.28 Student 2.01 4.00 5.70 6.50 7.29 8.08 8.88 10.59 12.58
151.89 7.09 2.92 School 4.63 5.56 6.35 6.73 7.09 7.46 7.83 8.62 9.55
65 155.03 7.09 6.28 Student 1.81 3.80 5.50 6.31 7.09 7.88 8.69 10.39 12.38
152.90 6.79 2.92 School 4.33 5.26 6.05 6.42 6.79 7.16 7.53 8.32 9.25
70 156.86 6.89 6.28 Student 1.60 3.59 5.29 6.10 6.89 7.67 8.48 10.18 12.17
153.97 6.47 2.92 School 4.01 4.94 5.73 6.10 6.47 6.84 7.21 8.00 8.93
75 158.84 6.66 6.28 Student 1.37 3.37 5.07 5.87 6.66 7.45 8.25 9.95 11.94
155.13 6.12 2.92 School 3.67 4.59 5.38 5.76 6.12 6.49 6.86 7.65 8.58
80 161.05 6.41 6.28 Student 1.12 3.11 4.82 5.62 6.41 7.20 8.00 9.70 11.69
156.41 5.74 2.92 School 3.28 4.21 5.00 5.37 5.74 6.10 6.48 7.27 8.20
85 163.62 6.11 6.28 Student 0.83 2.82 4.52 5.32 6.11 6.90 7.70 9.41 11.40
157.91 5.29 2.92 School 2.83 3.76 4.55 4.92 5.29 5.66 6.03 6.82 7.75
90 166.86 5.74 6.28 Student 0.46 2.45 4.15 4.96 5.74 6.53 7.33 9.04 11.03
159.79 4.73 2.92 School 2.27 3.19 3.99 4.36 4.73 5.09 5.47 6.26 7.18
CGI - Conditional Growth Index CGP - Conditional Growth Percentile
256

Table E.2.5: Reading Grade 1 From Last Winter To Winter Conditional Growth Percentile
Conditional Growth
Start Status Growth CGP 20 30 40 45 50 55 60 70 80
%ile RIT Mean SD CGI -0.84 -0.52 -0.25 -0.13 0.00 0.13 0.25 0.52 0.84
10 134.20 22.86 7.47 Student 16.57 18.94 20.97 21.92 22.86 23.80 24.76 26.78 29.15
143.42 20.90 2.52 School 18.78 19.58 20.26 20.58 20.90 21.21 21.54 22.22 23.02
20 140.25 21.78 7.47 Student 15.49 17.86 19.89 20.84 21.78 22.72 23.67 25.70 28.07
146.30 20.49 2.52 School 18.37 19.17 19.85 20.17 20.49 20.81 21.13 21.81 22.61
25 142.55 21.37 7.47 Student 15.08 17.45 19.48 20.43 21.37 22.31 23.26 25.29 27.66
147.40 20.33 2.52 School 18.21 19.01 19.70 20.02 20.33 20.65 20.97 21.66 22.45
30 144.61 21.00 7.47 Student 14.71 17.08 19.11 20.06 21.00 21.94 22.89 24.92 27.29
148.38 20.20 2.52 School 18.08 18.87 19.56 19.88 20.20 20.51 20.83 21.52 22.32
35 146.52 20.66 7.47 Student 14.37 16.74 18.76 19.72 20.66 21.60 22.55 24.58 26.95
149.30 20.07 2.52 School 17.95 18.75 19.43 19.75 20.07 20.38 20.70 21.39 22.19
40 148.34 20.33 7.47 Student 14.04 16.41 18.44 19.39 20.33 21.27 22.23 24.25 26.62
150.16 19.94 2.52 School 17.82 18.62 19.31 19.63 19.94 20.26 20.58 21.27 22.06
45 150.09 20.02 7.47 Student 13.73 16.10 18.13 19.08 20.02 20.96 21.91 23.94 26.31
151.00 19.83 2.52 School 17.71 18.51 19.19 19.51 19.83 20.14 20.46 21.15 21.95
48 151.13 19.83 7.47 Student 13.54 15.91 17.94 18.89 19.83 20.77 21.73 23.75 26.12
151.49 19.76 2.52 School 17.64 18.44 19.12 19.44 19.76 20.07 20.39 21.08 21.88
50 151.82 19.71 7.47 Student 13.42 15.79 17.82 18.77 19.71 20.65 21.60 23.63 26.00
151.82 19.71 2.52 School 17.59 18.39 19.07 19.39 19.71 20.03 20.35 21.03 21.83
52 152.51 19.59 7.47 Student 13.30 15.67 17.69 18.65 19.59 20.53 21.48 23.51 25.88
152.15 19.66 2.52 School 17.54 18.34 19.03 19.35 19.66 19.98 20.30 20.98 21.78
55 153.55 19.40 7.47 Student 13.11 15.48 17.51 18.46 19.40 20.34 21.29 23.32 25.69
152.65 19.59 2.52 School 17.47 18.27 18.96 19.28 19.59 19.91 20.23 20.91 21.71
60 155.31 19.09 7.47 Student 12.80 15.17 17.19 18.15 19.09 20.03 20.98 23.01 25.38
153.48 19.48 2.52 School 17.36 18.15 18.84 19.16 19.48 19.79 20.11 20.80 21.59
65 157.12 18.76 7.47 Student 12.47 14.84 16.87 17.82 18.76 19.70 20.65 22.68 25.05
154.35 19.35 2.52 School 17.23 18.03 18.71 19.04 19.35 19.67 19.99 20.67 21.47
70 159.04 18.42 7.47 Student 12.13 14.50 16.53 17.48 18.42 19.36 20.31 22.34 24.71
155.26 19.22 2.52 School 17.10 17.90 18.59 18.91 19.22 19.54 19.86 20.54 21.34
75 161.10 18.05 7.47 Student 11.76 14.13 16.16 17.11 18.05 18.99 19.94 21.97 24.34
156.24 19.08 2.52 School 16.97 17.76 18.45 18.77 19.08 19.40 19.72 20.41 21.20
80 163.40 17.64 7.47 Student 11.35 13.72 15.74 16.70 17.64 18.58 19.53 21.56 23.93
157.34 18.93 2.52 School 16.81 17.61 18.29 18.61 18.93 19.25 19.57 20.25 21.05
85 166.08 17.16 7.47 Student 10.87 13.24 15.27 16.22 17.16 18.10 19.05 21.08 23.45
158.62 18.75 2.52 School 16.63 17.43 18.11 18.43 18.75 19.07 19.39 20.07 20.87
90 169.45 16.56 7.47 Student 10.27 12.64 14.66 15.62 16.56 17.49 18.45 20.48 22.85
160.22 18.52 2.52 School 16.40 17.20 17.88 18.21 18.52 18.84 19.16 19.84 20.64
CGI - Conditional Growth Index CGP - Conditional Growth Percentile
257

Table E.2.6: Reading Grade 1 From Last Spring To Spring Conditional Growth Percentile
Conditional Growth
Start Status Growth CGP 20 30 40 45 50 55 60 70 80
%ile RIT Mean SD CGI -0.84 -0.52 -0.25 -0.13 0.00 0.13 0.25 0.52 0.84
10 138.25 23.47 7.71 Student 16.98 19.43 21.52 22.50 23.47 24.44 25.42 27.51 29.95
148.99 20.68 2.65 School 18.45 19.29 20.01 20.35 20.68 21.01 21.35 22.07 22.91
20 145.29 21.85 7.71 Student 15.37 17.81 19.90 20.88 21.85 22.82 23.80 25.89 28.34
152.35 20.02 2.65 School 17.79 18.63 19.35 19.69 20.02 20.35 20.69 21.41 22.25
25 147.97 21.24 7.71 Student 14.75 17.20 19.28 20.27 21.24 22.21 23.19 25.28 27.72
153.62 19.77 2.65 School 17.54 18.38 19.10 19.44 19.77 20.10 20.44 21.16 22.00
30 150.37 20.69 7.71 Student 14.20 16.64 18.73 19.72 20.69 21.65 22.64 24.73 27.17
154.77 19.54 2.65 School 17.32 18.16 18.87 19.21 19.54 19.88 20.21 20.93 21.77
35 152.59 20.17 7.71 Student 13.69 16.13 18.22 19.21 20.17 21.14 22.13 24.21 26.66
155.83 19.34 2.65 School 17.11 17.95 18.66 19.00 19.34 19.67 20.01 20.72 21.56
40 154.71 19.69 7.71 Student 13.20 15.65 17.74 18.72 19.69 20.66 21.64 23.73 26.17
156.83 19.14 2.65 School 16.91 17.75 18.47 18.80 19.14 19.47 19.81 20.52 21.36
45 156.75 19.22 7.71 Student 12.73 15.18 17.27 18.25 19.22 20.19 21.17 23.26 25.70
157.80 18.95 2.65 School 16.72 17.56 18.27 18.61 18.95 19.28 19.62 20.33 21.17
48 157.96 18.94 7.71 Student 12.46 14.90 16.99 17.97 18.94 19.91 20.89 22.98 25.43
158.38 18.83 2.65 School 16.61 17.44 18.16 18.50 18.83 19.16 19.50 20.22 21.06
50 158.76 18.76 7.71 Student 12.27 14.72 16.80 17.79 18.76 19.72 20.71 22.80 25.24
158.76 18.76 2.65 School 16.53 17.37 18.09 18.42 18.76 19.09 19.43 20.14 20.98
52 159.56 18.57 7.71 Student 12.09 14.53 16.62 17.60 18.57 19.54 20.52 22.61 25.06
159.14 18.68 2.65 School 16.45 17.29 18.01 18.35 18.68 19.01 19.35 20.07 20.91
55 160.77 18.29 7.71 Student 11.81 14.25 16.34 17.33 18.29 19.26 20.25 22.33 24.78
159.72 18.57 2.65 School 16.34 17.18 17.90 18.24 18.57 18.90 19.24 19.96 20.79
60 162.82 17.82 7.71 Student 11.34 13.78 15.87 16.86 17.82 18.79 19.78 21.87 24.31
160.69 18.38 2.65 School 16.15 16.99 17.71 18.04 18.38 18.71 19.05 19.76 20.60
65 164.93 17.34 7.71 Student 10.85 13.30 15.39 16.37 17.34 18.31 19.29 21.38 23.82
161.70 18.18 2.65 School 15.95 16.79 17.51 17.85 18.18 18.51 18.85 19.57 20.40
70 167.16 16.83 7.71 Student 10.34 12.79 14.88 15.86 16.83 17.80 18.78 20.87 23.31
162.76 17.97 2.65 School 15.74 16.58 17.30 17.64 17.97 18.30 18.64 19.36 20.20
75 169.56 16.28 7.71 Student 9.79 12.24 14.32 15.31 16.28 17.24 18.23 20.32 22.76
163.90 17.74 2.65 School 15.52 16.36 17.07 17.41 17.74 18.08 18.41 19.13 19.97
80 172.23 15.66 7.71 Student 9.18 11.62 13.71 14.69 15.66 16.63 17.61 19.70 22.15
165.18 17.49 2.65 School 15.27 16.11 16.82 17.16 17.49 17.82 18.16 18.88 19.72
85 175.35 14.94 7.71 Student 8.46 10.90 12.99 13.98 14.94 15.91 16.90 18.99 21.43
166.66 17.20 2.65 School 14.97 15.81 16.53 16.87 17.20 17.53 17.87 18.59 19.43
90 179.27 14.04 7.71 Student 7.56 10.00 12.09 13.07 14.04 15.01 16.00 18.08 20.53
168.53 16.83 2.65 School 14.61 15.44 16.16 16.50 16.83 17.16 17.50 18.22 19.06
CGI - Conditional Growth Index CGP - Conditional Growth Percentile
258

Table E.2.7: Reading Grade 1 From Fall To N Fall Conditional Growth Percentile
Conditional Growth
Start Status Growth CGP 20 30 40 45 50 55 60 70 80
%ile RIT Mean SD CGI -0.84 -0.52 -0.25 -0.13 0.00 0.13 0.25 0.52 0.84
10 143.94 12.76 9.59 Student 4.70 7.74 10.34 11.56 12.76 13.97 15.19 17.79 20.83
153.24 13.52 3.56 School 10.52 11.65 12.62 13.07 13.52 13.97 14.42 15.39 16.52
20 149.69 13.20 9.59 Student 5.13 8.17 10.77 11.99 13.20 14.40 15.63 18.22 21.26
155.80 13.69 3.56 School 10.70 11.83 12.79 13.25 13.69 14.14 14.60 15.56 16.69
25 151.88 13.36 9.59 Student 5.29 8.33 10.93 12.16 13.36 14.57 15.79 18.39 21.43
156.77 13.76 3.56 School 10.76 11.89 12.86 13.31 13.76 14.21 14.66 15.63 16.76
30 153.84 13.51 9.59 Student 5.44 8.48 11.08 12.30 13.51 14.71 15.94 18.54 21.58
157.64 13.82 3.56 School 10.82 11.95 12.92 13.37 13.82 14.27 14.72 15.69 16.82
35 155.66 13.64 9.59 Student 5.58 8.62 11.22 12.44 13.64 14.85 16.07 18.67 21.71
158.45 13.87 3.56 School 10.87 12.00 12.97 13.42 13.87 14.32 14.77 15.74 16.87
40 157.38 13.77 9.59 Student 5.71 8.75 11.35 12.57 13.77 14.98 16.20 18.80 21.84
159.22 13.92 3.56 School 10.93 12.06 13.02 13.48 13.92 14.37 14.83 15.79 16.92
45 159.05 13.90 9.59 Student 5.83 8.87 11.47 12.70 13.90 15.10 16.33 18.93 21.97
159.97 13.97 3.56 School 10.98 12.11 13.07 13.53 13.97 14.42 14.88 15.84 16.97
48 160.04 13.97 9.59 Student 5.91 8.95 11.55 12.77 13.97 15.18 16.40 19.00 22.04
160.41 14.00 3.56 School 11.01 12.14 13.10 13.56 14.00 14.45 14.91 15.87 17.00
50 160.70 14.02 9.59 Student 5.96 9.00 11.59 12.82 14.02 15.23 16.45 19.05 22.09
160.70 14.02 3.56 School 11.03 12.16 13.12 13.58 14.02 14.47 14.93 15.89 17.02
52 161.35 14.07 9.59 Student 6.01 9.05 11.64 12.87 14.07 15.28 16.50 19.10 22.14
160.99 14.04 3.56 School 11.05 12.18 13.14 13.60 14.04 14.49 14.95 15.91 17.04
55 162.34 14.15 9.59 Student 6.08 9.12 11.72 12.94 14.15 15.35 16.58 19.17 22.21
161.43 14.07 3.56 School 11.08 12.20 13.17 13.63 14.07 14.52 14.98 15.94 17.07
60 164.01 14.27 9.59 Student 6.20 9.25 11.84 13.07 14.27 15.48 16.70 19.30 22.34
162.17 14.12 3.56 School 11.13 12.26 13.22 13.68 14.12 14.57 15.03 15.99 17.12
65 165.74 14.40 9.59 Student 6.33 9.38 11.97 13.20 14.40 15.61 16.83 19.43 22.47
162.94 14.17 3.56 School 11.18 12.31 13.27 13.73 14.17 14.62 15.08 16.04 17.17
70 167.56 14.54 9.59 Student 6.47 9.51 12.11 13.33 14.54 15.74 16.97 19.56 22.61
163.75 14.23 3.56 School 11.23 12.36 13.33 13.78 14.23 14.68 15.13 16.10 17.23
75 169.52 14.69 9.59 Student 6.62 9.66 12.26 13.48 14.69 15.89 17.11 19.71 22.75
164.62 14.29 3.56 School 11.29 12.42 13.39 13.84 14.29 14.74 15.19 16.16 17.29
80 171.70 14.85 9.59 Student 6.78 9.82 12.42 13.65 14.85 16.05 17.28 19.88 22.92
165.60 14.35 3.56 School 11.36 12.49 13.45 13.91 14.35 14.80 15.26 16.22 17.35
85 174.25 15.04 9.59 Student 6.97 10.01 12.61 13.84 15.04 16.25 17.47 20.07 23.11
166.73 14.43 3.56 School 11.43 12.56 13.53 13.98 14.43 14.88 15.33 16.30 17.43
90 177.46 15.28 9.59 Student 7.21 10.26 12.85 14.08 15.28 16.49 17.71 20.31 23.35
168.16 14.53 3.56 School 11.53 12.66 13.62 14.08 14.53 14.97 15.43 16.39 17.52
CGI - Conditional Growth Index CGP - Conditional Growth Percentile
259

Table E.2.8: Reading Grade 1 From Fall To Spring Conditional Growth Percentile
Conditional Growth
Start Status Growth CGP 20 30 40 45 50 55 60 70 80
%ile RIT Mean SD CGI -0.84 -0.52 -0.25 -0.13 0.00 0.13 0.25 0.52 0.84
10 143.94 18.05 8.03 Student 11.29 13.84 16.02 17.04 18.05 19.06 20.09 22.26 24.81
153.24 16.51 2.78 School 14.18 15.06 15.81 16.17 16.51 16.86 17.22 17.97 18.85
20 149.69 17.63 8.03 Student 10.87 13.42 15.59 16.62 17.63 18.64 19.66 21.84 24.39
155.80 16.62 2.78 School 14.28 15.16 15.92 16.27 16.62 16.97 17.32 18.08 18.96
25 151.88 17.47 8.03 Student 10.71 13.26 15.43 16.46 17.47 18.48 19.50 21.68 24.23
156.77 16.66 2.78 School 14.32 15.20 15.96 16.31 16.66 17.01 17.36 18.12 19.00
30 153.84 17.32 8.03 Student 10.57 13.11 15.29 16.32 17.32 18.33 19.36 21.54 24.08
157.64 16.70 2.78 School 14.36 15.24 15.99 16.35 16.70 17.04 17.40 18.15 19.03
35 155.66 17.19 8.03 Student 10.43 12.98 15.16 16.18 17.19 18.20 19.23 21.40 23.95
158.45 16.73 2.78 School 14.39 15.27 16.03 16.38 16.73 17.08 17.43 18.19 19.07
40 157.38 17.06 8.03 Student 10.30 12.85 15.03 16.06 17.06 18.07 19.10 21.28 23.82
159.22 16.76 2.78 School 14.42 15.30 16.06 16.41 16.76 17.11 17.46 18.22 19.10
45 159.05 16.94 8.03 Student 10.18 12.73 14.91 15.93 16.94 17.95 18.98 21.15 23.70
159.97 16.79 2.78 School 14.45 15.34 16.09 16.44 16.79 17.14 17.49 18.25 19.13
48 160.04 16.87 8.03 Student 10.11 12.66 14.83 15.86 16.87 17.88 18.90 21.08 23.63
160.41 16.81 2.78 School 14.47 15.35 16.11 16.46 16.81 17.16 17.51 18.27 19.15
50 160.70 16.82 8.03 Student 10.06 12.61 14.79 15.81 16.82 17.83 18.86 21.03 23.58
160.70 16.82 2.78 School 14.48 15.37 16.12 16.47 16.82 17.17 17.52 18.28 19.16
52 161.35 16.77 8.03 Student 10.01 12.56 14.74 15.76 16.77 17.78 18.81 20.98 23.53
160.99 16.83 2.78 School 14.50 15.38 16.13 16.48 16.83 17.18 17.54 18.29 19.17
55 162.34 16.70 8.03 Student 9.94 12.49 14.67 15.69 16.70 17.71 18.74 20.91 23.46
161.43 16.85 2.78 School 14.51 15.40 16.15 16.50 16.85 17.20 17.55 18.31 19.19
60 164.01 16.58 8.03 Student 9.82 12.37 14.54 15.57 16.58 17.59 18.61 20.79 23.34
162.17 16.88 2.78 School 14.54 15.43 16.18 16.53 16.88 17.23 17.59 18.34 19.22
65 165.74 16.45 8.03 Student 9.69 12.24 14.42 15.44 16.45 17.46 18.49 20.66 23.21
162.94 16.91 2.78 School 14.58 15.46 16.21 16.56 16.91 17.26 17.62 18.37 19.25
70 167.56 16.32 8.03 Student 9.56 12.11 14.28 15.31 16.32 17.33 18.35 20.53 23.08
163.75 16.95 2.78 School 14.61 15.49 16.24 16.60 16.95 17.30 17.65 18.40 19.28
75 169.52 16.17 8.03 Student 9.41 11.96 14.14 15.16 16.17 17.18 18.21 20.39 22.93
164.62 16.98 2.78 School 14.65 15.53 16.28 16.63 16.98 17.33 17.69 18.44 19.32
80 171.70 16.01 8.03 Student 9.25 11.80 13.98 15.00 16.01 17.02 18.05 20.23 22.77
165.60 17.02 2.78 School 14.69 15.57 16.32 16.67 17.02 17.37 17.73 18.48 19.36
85 174.25 15.83 8.03 Student 9.07 11.61 13.79 14.82 15.83 16.84 17.86 20.04 22.59
166.73 17.07 2.78 School 14.73 15.61 16.37 16.72 17.07 17.42 17.77 18.53 19.41
90 177.46 15.59 8.03 Student 8.83 11.38 13.56 14.58 15.59 16.60 17.63 19.80 22.35
168.16 17.13 2.78 School 14.79 15.67 16.42 16.78 17.13 17.48 17.83 18.58 19.46
CGI - Conditional Growth Index CGP - Conditional Growth Percentile
260

Table E.2.9: Reading Grade 1 From Fall To Winter Conditional Growth Percentile
Conditional Growth
Start Status Growth CGP 20 30 40 45 50 55 60 70 80
%ile RIT Mean SD CGI -0.84 -0.52 -0.25 -0.13 0.00 0.13 0.25 0.52 0.84
10 143.94 12.00 5.93 Student 7.00 8.88 10.49 11.25 12.00 12.74 13.50 15.11 16.99
153.24 10.66 1.59 School 9.32 9.83 10.26 10.46 10.66 10.86 11.06 11.49 12.00
20 149.69 11.60 5.93 Student 6.60 8.49 10.09 10.85 11.60 12.34 13.10 14.71 16.59
155.80 10.72 1.59 School 9.38 9.89 10.32 10.52 10.72 10.92 11.12 11.55 12.06
25 151.88 11.45 5.93 Student 6.45 8.33 9.94 10.70 11.45 12.19 12.95 14.56 16.44
156.77 10.74 1.59 School 9.41 9.91 10.34 10.54 10.74 10.94 11.15 11.58 12.08
30 153.84 11.31 5.93 Student 6.32 8.20 9.81 10.56 11.31 12.06 12.81 14.42 16.30
157.64 10.76 1.59 School 9.43 9.93 10.36 10.56 10.76 10.96 11.17 11.60 12.10
35 155.66 11.18 5.93 Student 6.19 8.07 9.68 10.44 11.18 11.93 12.69 14.30 16.18
158.45 10.78 1.59 School 9.45 9.95 10.38 10.58 10.78 10.98 11.18 11.61 12.12
40 157.38 11.06 5.93 Student 6.07 7.95 9.56 10.32 11.06 11.81 12.57 14.18 16.06
159.22 10.80 1.59 School 9.46 9.97 10.40 10.60 10.80 11.00 11.20 11.63 12.14
45 159.05 10.95 5.93 Student 5.95 7.84 9.45 10.20 10.95 11.69 12.45 14.06 15.94
159.97 10.82 1.59 School 9.48 9.99 10.42 10.62 10.82 11.02 11.22 11.65 12.15
48 160.04 10.88 5.93 Student 5.89 7.77 9.38 10.13 10.88 11.63 12.38 13.99 15.87
160.41 10.83 1.59 School 9.49 10.00 10.43 10.63 10.83 11.03 11.23 11.66 12.16
50 160.70 10.84 5.93 Student 5.84 7.72 9.33 10.09 10.84 11.58 12.34 13.95 15.83
160.70 10.84 1.59 School 9.50 10.00 10.43 10.64 10.84 11.03 11.24 11.67 12.17
52 161.35 10.79 5.93 Student 5.80 7.68 9.29 10.04 10.79 11.54 12.29 13.90 15.78
160.99 10.84 1.59 School 9.51 10.01 10.44 10.64 10.84 11.04 11.24 11.67 12.18
55 162.34 10.72 5.93 Student 5.73 7.61 9.22 9.98 10.72 11.47 12.22 13.83 15.72
161.43 10.85 1.59 School 9.52 10.02 10.45 10.65 10.85 11.05 11.25 11.68 12.19
60 164.01 10.61 5.93 Student 5.61 7.49 9.10 9.86 10.61 11.35 12.11 13.72 15.60
162.17 10.87 1.59 School 9.53 10.04 10.47 10.67 10.87 11.07 11.27 11.70 12.21
65 165.74 10.49 5.93 Student 5.49 7.37 8.98 9.74 10.49 11.23 11.99 13.60 15.48
162.94 10.89 1.59 School 9.55 10.06 10.49 10.69 10.89 11.09 11.29 11.72 12.22
70 167.56 10.36 5.93 Student 5.37 7.25 8.86 9.61 10.36 11.11 11.86 13.47 15.35
163.75 10.91 1.59 School 9.57 10.07 10.50 10.71 10.91 11.11 11.31 11.74 12.24
75 169.52 10.22 5.93 Student 5.23 7.11 8.72 9.48 10.22 10.97 11.73 13.34 15.22
164.62 10.93 1.59 School 9.59 10.09 10.53 10.73 10.93 11.13 11.33 11.76 12.26
80 171.70 10.07 5.93 Student 5.08 6.96 8.57 9.33 10.07 10.82 11.58 13.19 15.07
165.60 10.95 1.59 School 9.61 10.12 10.55 10.75 10.95 11.15 11.35 11.78 12.29
85 174.25 9.90 5.93 Student 4.90 6.79 8.39 9.15 9.90 10.64 11.40 13.01 14.89
166.73 10.98 1.59 School 9.64 10.14 10.57 10.78 10.98 11.18 11.38 11.81 12.31
90 177.46 9.67 5.93 Student 4.68 6.56 8.17 8.93 9.67 10.42 11.18 12.79 14.67
168.16 11.01 1.59 School 9.67 10.18 10.61 10.81 11.01 11.21 11.41 11.84 12.35
CGI - Conditional Growth Index CGP - Conditional Growth Percentile
261

Table E.2.10: Reading Grade 1 From Winter To Spring Conditional Growth Percentile
Conditional Growth
Start Status Growth CGP 20 30 40 45 50 55 60 70 80
%ile RIT Mean SD CGI -0.84 -0.52 -0.25 -0.13 0.00 0.13 0.25 0.52 0.84
10 154.18 6.07 5.46 Student 1.48 3.21 4.69 5.39 6.07 6.76 7.46 8.94 10.67
163.63 5.47 1.12 School 4.52 4.88 5.18 5.33 5.47 5.61 5.75 6.06 6.41
20 160.13 6.04 5.46 Student 1.45 3.18 4.66 5.36 6.04 6.73 7.43 8.91 10.64
166.34 5.65 1.12 School 4.70 5.06 5.36 5.50 5.65 5.79 5.93 6.23 6.59
25 162.40 6.03 5.46 Student 1.44 3.17 4.65 5.35 6.03 6.72 7.41 8.89 10.63
167.37 5.71 1.12 School 4.77 5.12 5.43 5.57 5.71 5.85 6.00 6.30 6.66
30 164.43 6.02 5.46 Student 1.43 3.16 4.64 5.34 6.02 6.71 7.40 8.88 10.62
168.30 5.77 1.12 School 4.83 5.18 5.49 5.63 5.77 5.92 6.06 6.36 6.72
35 166.31 6.01 5.46 Student 1.42 3.15 4.63 5.33 6.01 6.70 7.40 8.87 10.61
169.16 5.83 1.12 School 4.88 5.24 5.55 5.69 5.83 5.97 6.11 6.42 6.78
40 168.10 6.00 5.46 Student 1.41 3.14 4.62 5.32 6.00 6.69 7.39 8.87 10.60
169.97 5.88 1.12 School 4.94 5.29 5.60 5.74 5.88 6.02 6.17 6.47 6.83
45 169.83 5.99 5.46 Student 1.40 3.13 4.61 5.31 5.99 6.68 7.38 8.86 10.59
170.76 5.94 1.12 School 4.99 5.35 5.65 5.79 5.94 6.08 6.22 6.52 6.88
48 170.85 5.99 5.46 Student 1.40 3.13 4.61 5.30 5.99 6.68 7.37 8.85 10.58
171.22 5.97 1.12 School 5.02 5.38 5.68 5.82 5.97 6.11 6.25 6.56 6.91
50 171.53 5.99 5.46 Student 1.39 3.12 4.60 5.30 5.99 6.67 7.37 8.85 10.58
171.53 5.99 1.12 School 5.04 5.40 5.70 5.84 5.99 6.13 6.27 6.58 6.93
52 172.21 5.98 5.46 Student 1.39 3.12 4.60 5.30 5.98 6.67 7.37 8.85 10.58
171.84 6.01 1.12 School 5.06 5.42 5.72 5.87 6.01 6.15 6.29 6.60 6.95
55 173.23 5.98 5.46 Student 1.38 3.12 4.59 5.29 5.98 6.66 7.36 8.84 10.57
172.31 6.04 1.12 School 5.09 5.45 5.75 5.90 6.04 6.18 6.32 6.63 6.98
60 174.96 5.97 5.46 Student 1.38 3.11 4.59 5.28 5.97 6.65 7.35 8.83 10.56
173.09 6.09 1.12 School 5.14 5.50 5.80 5.95 6.09 6.23 6.37 6.68 7.04
65 176.75 5.96 5.46 Student 1.37 3.10 4.58 5.27 5.96 6.65 7.34 8.82 10.55
173.91 6.14 1.12 School 5.20 5.55 5.86 6.00 6.14 6.28 6.43 6.73 7.09
70 178.63 5.95 5.46 Student 1.36 3.09 4.57 5.26 5.95 6.64 7.33 8.81 10.54
174.77 6.20 1.12 School 5.25 5.61 5.91 6.06 6.20 6.34 6.48 6.79 7.14
75 180.67 5.94 5.46 Student 1.35 3.08 4.56 5.25 5.94 6.63 7.32 8.80 10.53
175.69 6.26 1.12 School 5.31 5.67 5.97 6.12 6.26 6.40 6.54 6.85 7.21
80 182.93 5.93 5.46 Student 1.34 3.07 4.55 5.24 5.93 6.62 7.31 8.79 10.52
176.72 6.33 1.12 School 5.38 5.74 6.04 6.19 6.33 6.47 6.61 6.92 7.27
85 185.57 5.92 5.46 Student 1.32 3.05 4.53 5.23 5.92 6.60 7.30 8.78 10.51
177.92 6.41 1.12 School 5.46 5.82 6.12 6.26 6.41 6.55 6.69 7.00 7.35
90 188.89 5.90 5.46 Student 1.31 3.04 4.52 5.21 5.90 6.59 7.28 8.76 10.49
179.44 6.51 1.12 School 5.56 5.92 6.22 6.36 6.51 6.65 6.79 7.09 7.45
CGI - Conditional Growth Index CGP - Conditional Growth Percentile
262

Table E.2.11: Reading Grade 2 From Last Winter To Winter Conditional Growth Percentile
Conditional Growth
Start Status Growth CGP 20 30 40 45 50 55 60 70 80
%ile RIT Mean SD CGI -0.84 -0.52 -0.25 -0.13 0.00 0.13 0.25 0.52 0.84
10 151.49 15.60 6.82 Student 9.86 12.02 13.87 14.74 15.60 16.46 17.33 19.18 21.34
163.05 13.21 2.00 School 11.53 12.16 12.70 12.96 13.21 13.46 13.72 14.26 14.89
20 158.41 14.54 6.82 Student 8.80 10.96 12.81 13.68 14.54 15.39 16.26 18.11 20.28
166.01 12.97 2.00 School 11.28 11.92 12.46 12.72 12.97 13.22 13.47 14.02 14.65
25 161.05 14.13 6.82 Student 8.39 10.56 12.41 13.28 14.13 14.99 15.86 17.71 19.87
167.13 12.87 2.00 School 11.19 11.83 12.37 12.62 12.87 13.13 13.38 13.92 14.56
30 163.41 13.77 6.82 Student 8.03 10.19 12.04 12.91 13.77 14.63 15.50 17.35 19.51
168.14 12.79 2.00 School 11.11 11.74 12.29 12.54 12.79 13.04 13.30 13.84 14.48
35 165.60 13.43 6.82 Student 7.70 9.86 11.71 12.58 13.43 14.29 15.16 17.01 19.17
169.08 12.72 2.00 School 11.03 11.67 12.21 12.46 12.72 12.97 13.22 13.76 14.40
40 167.68 13.12 6.82 Student 7.38 9.54 11.39 12.26 13.12 13.97 14.84 16.69 18.85
169.96 12.64 2.00 School 10.96 11.59 12.14 12.39 12.64 12.89 13.15 13.69 14.33
45 169.69 12.81 6.82 Student 7.07 9.23 11.08 11.95 12.81 13.66 14.53 16.38 18.55
170.82 12.57 2.00 School 10.89 11.52 12.07 12.32 12.57 12.82 13.08 13.62 14.26
48 170.88 12.62 6.82 Student 6.89 9.05 10.90 11.77 12.62 13.48 14.35 16.20 18.36
171.33 12.53 2.00 School 10.85 11.48 12.02 12.28 12.53 12.78 13.04 13.58 14.21
50 171.67 12.50 6.82 Student 6.76 8.93 10.78 11.65 12.50 13.36 14.23 16.08 18.24
171.67 12.50 2.00 School 10.82 11.46 12.00 12.25 12.50 12.76 13.01 13.55 14.19
52 172.46 12.38 6.82 Student 6.64 8.81 10.66 11.53 12.38 13.24 14.11 15.96 18.12
172.00 12.48 2.00 School 10.79 11.43 11.97 12.22 12.48 12.73 12.98 13.52 14.16
55 173.65 12.20 6.82 Student 6.46 8.62 10.47 11.34 12.20 13.06 13.93 15.78 17.94
172.51 12.43 2.00 School 10.75 11.39 11.93 12.18 12.43 12.69 12.94 13.48 14.12
60 175.66 11.89 6.82 Student 6.15 8.32 10.16 11.03 11.89 12.75 13.62 15.47 17.63
173.37 12.36 2.00 School 10.68 11.32 11.86 12.11 12.36 12.62 12.87 13.41 14.05
65 177.74 11.57 6.82 Student 5.83 8.00 9.85 10.72 11.57 12.43 13.30 15.15 17.31
174.26 12.29 2.00 School 10.61 11.24 11.79 12.04 12.29 12.54 12.80 13.34 13.97
70 179.93 11.24 6.82 Student 5.50 7.66 9.51 10.38 11.24 12.09 12.96 14.81 16.98
175.19 12.22 2.00 School 10.53 11.17 11.71 11.96 12.22 12.47 12.72 13.26 13.90
75 182.29 10.87 6.82 Student 5.14 7.30 9.15 10.02 10.87 11.73 12.60 14.45 16.61
176.20 12.13 2.00 School 10.45 11.08 11.63 11.88 12.13 12.38 12.64 13.18 13.82
80 184.92 10.47 6.82 Student 4.73 6.90 8.74 9.61 10.47 11.33 12.20 14.05 16.21
177.33 12.04 2.00 School 10.36 10.99 11.53 11.79 12.04 12.29 12.55 13.09 13.72
85 187.99 10.00 6.82 Student 4.26 6.42 8.27 9.14 10.00 10.86 11.73 13.58 15.74
178.64 11.93 2.00 School 10.25 10.89 11.43 11.68 11.93 12.18 12.44 12.98 13.62
90 191.85 9.41 6.82 Student 3.67 5.83 7.68 8.55 9.41 10.27 11.14 12.98 15.15
180.28 11.80 2.00 School 10.12 10.75 11.29 11.55 11.80 12.05 12.31 12.85 13.48
CGI - Conditional Growth Index CGP - Conditional Growth Percentile
263

Table E.2.12: Reading Grade 2 From Last Spring To Spring Conditional Growth Percentile
Conditional Growth
Start Status Growth CGP 20 30 40 45 50 55 60 70 80
%ile RIT Mean SD CGI -0.84 -0.52 -0.25 -0.13 0.00 0.13 0.25 0.52 0.84
10 156.11 15.44 7.24 Student 9.35 11.65 13.61 14.53 15.44 16.36 17.28 19.24 21.54
168.21 12.34 2.28 School 10.42 11.14 11.76 12.05 12.34 12.62 12.92 13.53 14.26
20 163.54 13.90 7.24 Student 7.80 10.10 12.06 12.99 13.90 14.81 15.73 17.70 20.00
171.48 11.86 2.28 School 9.94 10.66 11.28 11.57 11.86 12.15 12.44 13.06 13.78
25 166.36 13.31 7.24 Student 7.22 9.51 11.48 12.40 13.31 14.22 15.15 17.11 19.41
172.73 11.68 2.28 School 9.76 10.48 11.10 11.39 11.68 11.96 12.26 12.87 13.60
30 168.90 12.79 7.24 Student 6.69 8.99 10.95 11.88 12.79 13.70 14.62 16.58 18.88
173.85 11.51 2.28 School 9.59 10.32 10.94 11.23 11.51 11.80 12.09 12.71 13.43
35 171.24 12.30 7.24 Student 6.20 8.50 10.46 11.39 12.30 13.21 14.13 16.10 18.39
174.88 11.36 2.28 School 9.44 10.17 10.78 11.08 11.36 11.65 11.94 12.56 13.28
40 173.47 11.83 7.24 Student 5.74 8.04 10.00 10.92 11.83 12.74 13.67 15.63 17.93
175.86 11.22 2.28 School 9.30 10.02 10.64 10.93 11.22 11.51 11.80 12.42 13.14
45 175.63 11.39 7.24 Student 5.29 7.59 9.55 10.47 11.39 12.30 13.22 15.18 17.48
176.81 11.08 2.28 School 9.16 9.88 10.50 10.79 11.08 11.37 11.66 12.28 13.00
48 176.90 11.12 7.24 Student 5.02 7.32 9.28 10.21 11.12 12.03 12.95 14.92 17.22
177.38 11.00 2.28 School 9.08 9.80 10.42 10.71 11.00 11.28 11.58 12.19 12.92
50 177.75 10.94 7.24 Student 4.85 7.15 9.11 10.03 10.94 11.85 12.78 14.74 17.04
177.75 10.94 2.28 School 9.02 9.75 10.37 10.66 10.94 11.23 11.52 12.14 12.86
52 178.60 10.77 7.24 Student 4.67 6.97 8.93 9.86 10.77 11.68 12.60 14.57 16.86
178.12 10.89 2.28 School 8.97 9.69 10.31 10.60 10.89 11.18 11.47 12.09 12.81
55 179.87 10.50 7.24 Student 4.41 6.70 8.67 9.59 10.50 11.41 12.34 14.30 16.60
178.69 10.81 2.28 School 8.89 9.61 10.23 10.52 10.81 11.09 11.38 12.00 12.73
60 182.03 10.05 7.24 Student 3.96 6.26 8.22 9.14 10.05 10.96 11.89 13.85 16.15
179.64 10.67 2.28 School 8.75 9.47 10.09 10.38 10.67 10.95 11.25 11.86 12.59
65 184.26 9.59 7.24 Student 3.49 5.79 7.76 8.68 9.59 10.50 11.43 13.39 15.69
180.62 10.52 2.28 School 8.60 9.33 9.95 10.24 10.52 10.81 11.10 11.72 12.44
70 186.60 9.10 7.24 Student 3.01 5.30 7.27 8.19 9.10 10.01 10.94 12.90 15.20
181.65 10.37 2.28 School 8.45 9.18 9.80 10.09 10.37 10.66 10.95 11.57 12.29
75 189.14 8.57 7.24 Student 2.48 4.78 6.74 7.66 8.57 9.48 10.41 12.37 14.67
182.77 10.21 2.28 School 8.29 9.01 9.63 9.92 10.21 10.50 10.79 11.41 12.13
80 191.96 7.99 7.24 Student 1.89 4.19 6.15 7.08 7.99 8.90 9.82 11.79 14.08
184.01 10.03 2.28 School 8.11 8.83 9.45 9.74 10.03 10.31 10.61 11.22 11.95
85 195.25 7.30 7.24 Student 1.21 3.51 5.47 6.39 7.30 8.21 9.14 11.10 13.40
185.46 9.82 2.28 School 7.90 8.62 9.24 9.53 9.82 10.10 10.39 11.01 11.74
90 199.39 6.44 7.24 Student 0.35 2.64 4.61 5.53 6.44 7.35 8.28 10.24 12.54
187.29 9.55 2.28 School 7.63 8.35 8.97 9.26 9.55 9.84 10.13 10.75 11.47
CGI - Conditional Growth Index CGP - Conditional Growth Percentile
264

Table E.2.13: Reading Grade 2 From Fall To N Fall Conditional Growth Percentile
Conditional Growth
Start Status Growth CGP 20 30 40 45 50 55 60 70 80
%ile RIT Mean SD CGI -0.84 -0.52 -0.25 -0.13 0.00 0.13 0.25 0.52 0.84
10 154.83 14.11 8.33 Student 7.10 9.74 12.00 13.07 14.11 15.16 16.22 18.48 21.13
166.51 13.35 2.42 School 11.31 12.08 12.74 13.05 13.35 13.65 13.96 14.62 15.38
20 161.66 13.95 8.33 Student 6.94 9.58 11.84 12.91 13.95 15.00 16.07 18.32 20.97
169.33 13.45 2.42 School 11.42 12.19 12.84 13.15 13.45 13.76 14.07 14.72 15.49
25 164.25 13.89 8.33 Student 6.88 9.52 11.78 12.85 13.89 14.94 16.01 18.26 20.91
170.40 13.49 2.42 School 11.46 12.22 12.88 13.19 13.49 13.80 14.10 14.76 15.53
30 166.58 13.84 8.33 Student 6.83 9.47 11.73 12.79 13.84 14.89 15.95 18.21 20.85
171.36 13.53 2.42 School 11.49 12.26 12.92 13.22 13.53 13.83 14.14 14.80 15.56
35 168.74 13.79 8.33 Student 6.78 9.42 11.68 12.74 13.79 14.84 15.90 18.16 20.80
172.25 13.56 2.42 School 11.53 12.29 12.95 13.26 13.56 13.86 14.17 14.83 15.60
40 170.79 13.74 8.33 Student 6.73 9.37 11.63 12.70 13.74 14.79 15.85 18.11 20.76
173.10 13.59 2.42 School 11.56 12.32 12.98 13.29 13.59 13.90 14.20 14.86 15.63
45 172.77 13.70 8.33 Student 6.68 9.33 11.59 12.65 13.70 14.74 15.81 18.07 20.71
173.92 13.62 2.42 School 11.59 12.35 13.01 13.32 13.62 13.93 14.23 14.89 15.66
48 173.94 13.67 8.33 Student 6.66 9.30 11.56 12.62 13.67 14.72 15.78 18.04 20.68
174.40 13.64 2.42 School 11.60 12.37 13.03 13.34 13.64 13.94 14.25 14.91 15.67
50 174.72 13.65 8.33 Student 6.64 9.28 11.54 12.60 13.65 14.70 15.76 18.02 20.66
174.72 13.65 2.42 School 11.62 12.38 13.04 13.35 13.65 13.96 14.26 14.92 15.69
52 175.50 13.63 8.33 Student 6.62 9.26 11.52 12.59 13.63 14.68 15.74 18.00 20.65
175.04 13.66 2.42 School 11.63 12.40 13.05 13.36 13.66 13.97 14.28 14.93 15.70
55 176.67 13.61 8.33 Student 6.59 9.24 11.50 12.56 13.61 14.65 15.72 17.98 20.62
175.53 13.68 2.42 School 11.65 12.41 13.07 13.38 13.68 13.98 14.29 14.95 15.72
60 178.65 13.56 8.33 Student 6.55 9.19 11.45 12.51 13.56 14.61 15.67 17.93 20.57
176.34 13.71 2.42 School 11.68 12.44 13.10 13.41 13.71 14.02 14.32 14.98 15.75
65 180.70 13.51 8.33 Student 6.50 9.14 11.40 12.47 13.51 14.56 15.62 17.88 20.53
177.19 13.74 2.42 School 11.71 12.47 13.13 13.44 13.74 14.05 14.35 15.01 15.78
70 182.86 13.46 8.33 Student 6.45 9.09 11.35 12.42 13.46 14.51 15.57 17.83 20.48
178.08 13.78 2.42 School 11.74 12.51 13.16 13.47 13.78 14.08 14.39 15.04 15.81
75 185.19 13.41 8.33 Student 6.40 9.04 11.30 12.36 13.41 14.46 15.52 17.78 20.42
179.04 13.81 2.42 School 11.78 12.54 13.20 13.51 13.81 14.11 14.42 15.08 15.85
80 187.78 13.35 8.33 Student 6.34 8.98 11.24 12.30 13.35 14.40 15.46 17.72 20.36
180.11 13.85 2.42 School 11.82 12.58 13.24 13.55 13.85 14.15 14.46 15.12 15.88
85 190.81 13.28 8.33 Student 6.27 8.91 11.17 12.23 13.28 14.33 15.39 17.65 20.29
181.36 13.90 2.42 School 11.86 12.63 13.28 13.59 13.90 14.20 14.51 15.16 15.93
90 194.61 13.19 8.33 Student 6.18 8.82 11.08 12.14 13.19 14.24 15.30 17.56 20.20
182.93 13.95 2.42 School 11.92 12.69 13.34 13.65 13.95 14.26 14.57 15.22 15.99
CGI - Conditional Growth Index CGP - Conditional Growth Percentile
265

Table E.2.14: Reading Grade 2 From Fall To Spring Conditional Growth Percentile
Conditional Growth
Start Status Growth CGP 20 30 40 45 50 55 60 70 80
%ile RIT Mean SD CGI -0.84 -0.52 -0.25 -0.13 0.00 0.13 0.25 0.52 0.84
10 154.83 17.15 7.82 Student 10.57 13.05 15.17 16.17 17.15 18.13 19.13 21.25 23.73
166.51 14.14 2.50 School 12.04 12.83 13.51 13.83 14.14 14.45 14.77 15.45 16.24
20 161.66 16.06 7.82 Student 9.48 11.96 14.08 15.08 16.06 17.04 18.04 20.16 22.64
169.33 14.08 2.50 School 11.98 12.77 13.45 13.77 14.08 14.40 14.72 15.39 16.18
25 164.25 15.64 7.82 Student 9.06 11.54 13.66 14.66 15.64 16.63 17.63 19.75 22.23
170.40 14.06 2.50 School 11.96 12.75 13.43 13.75 14.06 14.37 14.69 15.37 16.16
30 166.58 15.27 7.82 Student 8.69 11.17 13.29 14.29 15.27 16.25 17.25 19.37 21.85
171.36 14.04 2.50 School 11.94 12.73 13.41 13.73 14.04 14.35 14.67 15.35 16.14
35 168.74 14.93 7.82 Student 8.34 10.83 12.95 13.94 14.93 15.91 16.91 19.03 21.51
172.25 14.02 2.50 School 11.92 12.71 13.39 13.71 14.02 14.34 14.66 15.33 16.12
40 170.79 14.60 7.82 Student 8.02 10.50 12.62 13.62 14.60 15.58 16.58 18.70 21.18
173.10 14.01 2.50 School 11.90 12.70 13.37 13.69 14.01 14.32 14.64 15.32 16.11
45 172.77 14.28 7.82 Student 7.70 10.18 12.30 13.30 14.28 15.27 16.27 18.39 20.87
173.92 13.99 2.50 School 11.89 12.68 13.36 13.68 13.99 14.30 14.62 15.30 16.09
48 173.94 14.10 7.82 Student 7.51 10.00 12.12 13.11 14.10 15.08 16.08 18.20 20.68
174.40 13.98 2.50 School 11.88 12.67 13.35 13.67 13.98 14.29 14.61 15.29 16.08
50 174.72 13.97 7.82 Student 7.39 9.87 11.99 12.99 13.97 14.96 15.95 18.07 20.56
174.72 13.97 2.50 School 11.87 12.66 13.34 13.66 13.97 14.29 14.61 15.28 16.07
52 175.50 13.85 7.82 Student 7.27 9.75 11.87 12.87 13.85 14.83 15.83 17.95 20.43
175.04 13.97 2.50 School 11.86 12.66 13.33 13.65 13.97 14.28 14.60 15.28 16.07
55 176.67 13.66 7.82 Student 7.08 9.56 11.68 12.68 13.66 14.64 15.64 17.76 20.24
175.53 13.96 2.50 School 11.85 12.65 13.32 13.64 13.96 14.27 14.59 15.27 16.06
60 178.65 13.35 7.82 Student 6.76 9.24 11.36 12.36 13.35 14.33 15.33 17.45 19.93
176.34 13.94 2.50 School 11.84 12.63 13.31 13.63 13.94 14.25 14.57 15.25 16.04
65 180.70 13.02 7.82 Student 6.44 8.92 11.04 12.04 13.02 14.00 15.00 17.12 19.60
177.19 13.92 2.50 School 11.82 12.61 13.29 13.61 13.92 14.24 14.56 15.23 16.02
70 182.86 12.67 7.82 Student 6.09 8.57 10.69 11.69 12.67 13.66 14.66 16.78 19.26
178.08 13.90 2.50 School 11.80 12.60 13.27 13.59 13.90 14.22 14.54 15.21 16.01
75 185.19 12.30 7.82 Student 5.72 8.20 10.32 11.32 12.30 13.28 14.28 16.40 18.88
179.04 13.89 2.50 School 11.78 12.58 13.25 13.57 13.89 14.20 14.52 15.19 15.99
80 187.78 11.89 7.82 Student 5.31 7.79 9.91 10.90 11.89 12.87 13.87 15.99 18.47
180.11 13.86 2.50 School 11.76 12.55 13.23 13.55 13.86 14.18 14.50 15.17 15.97
85 190.81 11.41 7.82 Student 4.82 7.30 9.42 10.42 11.41 12.39 13.39 15.51 17.99
181.36 13.84 2.50 School 11.74 12.53 13.21 13.52 13.84 14.15 14.47 15.15 15.94
90 194.61 10.80 7.82 Student 4.22 6.70 8.82 9.81 10.80 11.78 12.78 14.90 17.38
182.93 13.81 2.50 School 11.70 12.50 13.17 13.49 13.81 14.12 14.44 15.12 15.91
CGI - Conditional Growth Index CGP - Conditional Growth Percentile
266

Table E.2.15: Reading Grade 2 From Fall To Winter Conditional Growth Percentile
Conditional Growth
Start Status Growth CGP 20 30 40 45 50 55 60 70 80
%ile RIT Mean SD CGI -0.84 -0.52 -0.25 -0.13 0.00 0.13 0.25 0.52 0.84
10 154.83 11.65 5.81 Student 6.76 8.61 10.18 10.92 11.65 12.38 13.12 14.70 16.54
166.51 9.55 1.43 School 8.34 8.80 9.18 9.37 9.55 9.73 9.91 10.29 10.75
20 161.66 10.90 5.81 Student 6.01 7.85 9.42 10.17 10.90 11.63 12.37 13.94 15.78
169.33 9.51 1.43 School 8.31 8.77 9.15 9.33 9.51 9.69 9.88 10.26 10.72
25 164.25 10.61 5.81 Student 5.72 7.56 9.14 9.88 10.61 11.34 12.08 13.65 15.49
170.40 9.50 1.43 School 8.30 8.75 9.14 9.32 9.50 9.68 9.86 10.25 10.70
30 166.58 10.35 5.81 Student 5.47 7.31 8.88 9.62 10.35 11.08 11.82 13.40 15.24
171.36 9.49 1.43 School 8.29 8.74 9.13 9.31 9.49 9.67 9.85 10.24 10.69
35 168.74 10.11 5.81 Student 5.23 7.07 8.64 9.38 10.11 10.84 11.58 13.16 15.00
172.25 9.48 1.43 School 8.28 8.73 9.12 9.30 9.48 9.66 9.84 10.23 10.68
40 170.79 9.89 5.81 Student 5.00 6.84 8.42 9.16 9.89 10.62 11.36 12.93 14.77
173.10 9.47 1.43 School 8.27 8.72 9.11 9.29 9.47 9.65 9.83 10.22 10.67
45 172.77 9.67 5.81 Student 4.78 6.62 8.20 8.94 9.67 10.40 11.14 12.71 14.55
173.92 9.46 1.43 School 8.26 8.71 9.10 9.28 9.46 9.64 9.82 10.21 10.66
48 173.94 9.54 5.81 Student 4.65 6.49 8.07 8.81 9.54 10.27 11.01 12.58 14.42
174.40 9.45 1.43 School 8.25 8.71 9.09 9.28 9.45 9.63 9.82 10.20 10.66
50 174.72 9.45 5.81 Student 4.57 6.41 7.98 8.72 9.45 10.18 10.92 12.50 14.34
174.72 9.45 1.43 School 8.25 8.70 9.09 9.27 9.45 9.63 9.81 10.20 10.65
52 175.50 9.36 5.81 Student 4.48 6.32 7.89 8.64 9.36 10.09 10.84 12.41 14.25
175.04 9.45 1.43 School 8.25 8.70 9.09 9.27 9.45 9.63 9.81 10.20 10.65
55 176.67 9.24 5.81 Student 4.35 6.19 7.76 8.51 9.24 9.96 10.71 12.28 14.12
175.53 9.44 1.43 School 8.24 8.69 9.08 9.26 9.44 9.62 9.80 10.19 10.64
60 178.65 9.02 5.81 Student 4.13 5.97 7.55 8.29 9.02 9.75 10.49 12.06 13.90
176.34 9.43 1.43 School 8.23 8.68 9.07 9.25 9.43 9.61 9.79 10.18 10.63
65 180.70 8.79 5.81 Student 3.90 5.75 7.32 8.06 8.79 9.52 10.26 11.83 13.68
177.19 9.42 1.43 School 8.22 8.67 9.06 9.24 9.42 9.60 9.78 10.17 10.62
70 182.86 8.55 5.81 Student 3.66 5.51 7.08 7.82 8.55 9.28 10.02 11.60 13.44
178.08 9.41 1.43 School 8.21 8.66 9.05 9.23 9.41 9.59 9.77 10.16 10.61
75 185.19 8.29 5.81 Student 3.41 5.25 6.82 7.56 8.29 9.02 9.76 11.34 13.18
179.04 9.40 1.43 School 8.20 8.65 9.04 9.22 9.40 9.58 9.76 10.15 10.60
80 187.78 8.01 5.81 Student 3.12 4.96 6.54 7.28 8.01 8.74 9.48 11.05 12.89
180.11 9.39 1.43 School 8.19 8.64 9.03 9.21 9.39 9.57 9.75 10.14 10.59
85 190.81 7.67 5.81 Student 2.79 4.63 6.20 6.94 7.67 8.40 9.14 10.72 12.56
181.36 9.37 1.43 School 8.17 8.63 9.01 9.19 9.37 9.55 9.74 10.12 10.58
90 194.61 7.25 5.81 Student 2.37 4.21 5.78 6.52 7.25 7.98 8.72 10.30 12.14
182.93 9.36 1.43 School 8.15 8.61 8.99 9.18 9.36 9.54 9.72 10.10 10.56
CGI - Conditional Growth Index CGP - Conditional Growth Percentile
267

Table E.2.16: Reading Grade 2 From Winter To Spring Conditional Growth Percentile
Conditional Growth
Start Status Growth CGP 20 30 40 45 50 55 60 70 80
%ile RIT Mean SD CGI -0.84 -0.52 -0.25 -0.13 0.00 0.13 0.25 0.52 0.84
10 164.98 5.51 5.44 Student 0.94 2.66 4.13 4.83 5.51 6.19 6.89 8.36 10.09
175.86 4.29 1.06 School 3.40 3.74 4.02 4.16 4.29 4.42 4.56 4.84 5.18
20 171.57 5.17 5.44 Student 0.60 2.32 3.79 4.49 5.17 5.85 6.55 8.02 9.75
178.71 4.37 1.06 School 3.48 3.82 4.10 4.24 4.37 4.50 4.64 4.92 5.26
25 174.07 5.04 5.44 Student 0.47 2.19 3.67 4.36 5.04 5.73 6.42 7.89 9.62
179.80 4.40 1.06 School 3.51 3.85 4.13 4.27 4.40 4.53 4.67 4.95 5.29
30 176.32 4.93 5.44 Student 0.35 2.08 3.55 4.24 4.93 5.61 6.30 7.78 9.50
180.77 4.43 1.06 School 3.54 3.87 4.16 4.29 4.43 4.56 4.69 4.98 5.32
35 178.40 4.82 5.44 Student 0.24 1.97 3.44 4.14 4.82 5.50 6.20 7.67 9.39
181.67 4.45 1.06 School 3.56 3.90 4.18 4.32 4.45 4.58 4.72 5.01 5.34
40 180.38 4.72 5.44 Student 0.14 1.87 3.34 4.03 4.72 5.40 6.09 7.57 9.29
182.53 4.48 1.06 School 3.59 3.92 4.21 4.34 4.48 4.61 4.74 5.03 5.37
45 182.29 4.62 5.44 Student 0.04 1.77 3.24 3.94 4.62 5.30 6.00 7.47 9.19
183.36 4.50 1.06 School 3.61 3.94 4.23 4.37 4.50 4.63 4.77 5.05 5.39
48 183.42 4.56 5.44 Student -0.01 1.71 3.18 3.88 4.56 5.24 5.94 7.41 9.14
183.85 4.51 1.06 School 3.62 3.96 4.24 4.38 4.51 4.65 4.78 5.07 5.40
50 184.17 4.52 5.44 Student -0.05 1.67 3.14 3.84 4.52 5.20 5.90 7.37 9.10
184.17 4.52 1.06 School 3.63 3.97 4.25 4.39 4.52 4.65 4.79 5.08 5.41
52 184.92 4.48 5.44 Student -0.09 1.63 3.11 3.80 4.48 5.17 5.86 7.33 9.06
184.50 4.53 1.06 School 3.64 3.98 4.26 4.40 4.53 4.66 4.80 5.09 5.42
55 186.05 4.42 5.44 Student -0.15 1.57 3.05 3.74 4.42 5.11 5.80 7.28 9.00
184.99 4.54 1.06 School 3.66 3.99 4.28 4.41 4.54 4.68 4.81 5.10 5.43
60 187.97 4.33 5.44 Student -0.25 1.48 2.95 3.64 4.33 5.01 5.70 7.18 8.90
185.82 4.57 1.06 School 3.68 4.01 4.30 4.43 4.57 4.70 4.84 5.12 5.46
65 189.94 4.22 5.44 Student -0.35 1.37 2.85 3.54 4.22 4.91 5.60 7.08 8.80
186.67 4.59 1.06 School 3.70 4.04 4.32 4.46 4.59 4.72 4.86 5.15 5.48
70 192.02 4.12 5.44 Student -0.46 1.27 2.74 3.43 4.12 4.80 5.49 6.97 8.69
187.57 4.62 1.06 School 3.73 4.06 4.35 4.48 4.62 4.75 4.88 5.17 5.51
75 194.27 4.00 5.44 Student -0.57 1.15 2.62 3.32 4.00 4.68 5.38 6.85 8.58
188.55 4.64 1.06 School 3.75 4.09 4.38 4.51 4.64 4.78 4.91 5.20 5.53
80 196.78 3.87 5.44 Student -0.70 1.02 2.50 3.19 3.87 4.56 5.25 6.72 8.45
189.63 4.67 1.06 School 3.78 4.12 4.41 4.54 4.67 4.81 4.94 5.23 5.56
85 199.69 3.72 5.44 Student -0.85 0.87 2.35 3.04 3.72 4.41 5.10 6.57 8.30
190.90 4.71 1.06 School 3.82 4.16 4.44 4.58 4.71 4.84 4.98 5.26 5.60
90 203.36 3.53 5.44 Student -1.04 0.68 2.16 2.85 3.53 4.22 4.91 6.38 8.11
192.49 4.75 1.06 School 3.86 4.20 4.49 4.62 4.75 4.89 5.02 5.31 5.64
CGI - Conditional Growth Index CGP - Conditional Growth Percentile
268

Table E.2.17: Reading Grade 3 From Last Winter To Winter Conditional Growth Percentile
Conditional Growth
Start Status Growth CGP 20 30 40 45 50 55 60 70 80
%ile RIT Mean SD CGI -0.84 -0.52 -0.25 -0.13 0.00 0.13 0.25 0.52 0.84
10 163.32 14.57 6.16 Student 9.39 11.34 13.01 13.79 14.57 15.34 16.13 17.80 19.75
175.27 12.15 1.60 School 10.80 11.31 11.74 11.95 12.15 12.35 12.56 12.99 13.50
20 170.35 13.62 6.16 Student 8.44 10.39 12.06 12.85 13.62 14.39 15.18 16.85 18.80
178.20 12.03 1.60 School 10.68 11.19 11.62 11.83 12.03 12.23 12.44 12.87 13.38
25 173.02 13.26 6.16 Student 8.08 10.03 11.70 12.49 13.26 14.03 14.82 16.49 18.44
179.31 11.99 1.60 School 10.64 11.15 11.58 11.78 11.99 12.19 12.39 12.83 13.34
30 175.42 12.94 6.16 Student 7.75 9.71 11.38 12.16 12.94 13.71 14.50 16.16 18.12
180.31 11.95 1.60 School 10.60 11.11 11.54 11.74 11.95 12.15 12.35 12.79 13.30
35 177.64 12.64 6.16 Student 7.46 9.41 11.08 11.86 12.64 13.41 14.20 15.86 17.82
181.23 11.91 1.60 School 10.56 11.07 11.50 11.71 11.91 12.11 12.32 12.75 13.26
40 179.75 12.35 6.16 Student 7.17 9.12 10.79 11.58 12.35 13.13 13.91 15.58 17.53
182.11 11.87 1.60 School 10.52 11.03 11.47 11.67 11.87 12.08 12.28 12.72 13.22
45 181.79 12.08 6.16 Student 6.90 8.85 10.52 11.30 12.08 12.85 13.64 15.30 17.26
182.96 11.84 1.60 School 10.49 11.00 11.43 11.64 11.84 12.04 12.25 12.68 13.19
48 183.00 11.91 6.16 Student 6.73 8.69 10.35 11.14 11.91 12.69 13.47 15.14 17.09
183.46 11.82 1.60 School 10.47 10.98 11.41 11.62 11.82 12.02 12.23 12.66 13.17
50 183.80 11.81 6.16 Student 6.62 8.58 10.25 11.03 11.81 12.58 13.37 15.03 16.99
183.80 11.81 1.60 School 10.46 10.96 11.40 11.60 11.81 12.01 12.21 12.65 13.16
52 184.60 11.70 6.16 Student 6.52 8.47 10.14 10.92 11.70 12.47 13.26 14.93 16.88
184.13 11.79 1.60 School 10.44 10.95 11.39 11.59 11.79 11.99 12.20 12.63 13.14
55 185.81 11.54 6.16 Student 6.35 8.31 9.98 10.76 11.54 12.31 13.09 14.76 16.72
184.63 11.77 1.60 School 10.42 10.93 11.37 11.57 11.77 11.97 12.18 12.61 13.12
60 187.85 11.26 6.16 Student 6.08 8.03 9.70 10.49 11.26 12.03 12.82 14.49 16.44
185.48 11.74 1.60 School 10.39 10.90 11.33 11.54 11.74 11.94 12.14 12.58 13.09
65 189.96 10.98 6.16 Student 5.79 7.75 9.42 10.20 10.98 11.75 12.54 14.20 16.16
186.36 11.70 1.60 School 10.35 10.86 11.30 11.50 11.70 11.90 12.11 12.54 13.05
70 192.18 10.68 6.16 Student 5.50 7.45 9.12 9.90 10.68 11.45 12.24 13.90 15.86
187.29 11.67 1.60 School 10.32 10.82 11.26 11.46 11.67 11.87 12.07 12.51 13.02
75 194.58 10.35 6.16 Student 5.17 7.12 8.79 9.58 10.35 11.13 11.91 13.58 15.53
188.29 11.63 1.60 School 10.28 10.78 11.22 11.42 11.63 11.83 12.03 12.47 12.98
80 197.25 9.99 6.16 Student 4.81 6.76 8.43 9.22 9.99 10.77 11.55 13.22 15.17
189.40 11.58 1.60 School 10.23 10.74 11.17 11.38 11.58 11.78 11.99 12.42 12.93
85 200.36 9.57 6.16 Student 4.39 6.34 8.01 8.80 9.57 10.35 11.13 12.80 14.75
190.70 11.53 1.60 School 10.18 10.69 11.12 11.33 11.53 11.73 11.93 12.37 12.88
90 204.28 9.04 6.16 Student 3.86 5.82 7.49 8.27 9.04 9.82 10.60 12.27 14.23
192.33 11.46 1.60 School 10.11 10.62 11.06 11.26 11.46 11.66 11.87 12.30 12.81
CGI - Conditional Growth Index CGP - Conditional Growth Percentile
269

Table E.2.18: Reading Grade 3 From Last Spring To Spring Conditional Growth Percentile
Conditional Growth
Start Status Growth CGP 20 30 40 45 50 55 60 70 80
%ile RIT Mean SD CGI -0.84 -0.52 -0.25 -0.13 0.00 0.13 0.25 0.52 0.84
10 167.33 13.97 6.71 Student 8.32 10.45 12.27 13.12 13.97 14.81 15.67 17.49 19.62
179.38 11.09 1.88 School 9.51 10.11 10.62 10.86 11.09 11.33 11.57 12.08 12.68
20 174.47 12.77 6.71 Student 7.12 9.25 11.07 11.92 12.77 13.61 14.47 16.29 18.42
182.39 10.88 1.88 School 9.30 9.89 10.40 10.64 10.88 11.12 11.36 11.87 12.47
25 177.19 12.31 6.71 Student 6.66 8.79 10.61 11.47 12.31 13.15 14.01 15.83 17.96
183.53 10.80 1.88 School 9.21 9.81 10.32 10.56 10.80 11.04 11.28 11.79 12.38
30 179.63 11.90 6.71 Student 6.25 8.38 10.20 11.06 11.90 12.74 13.60 15.42 17.55
184.56 10.73 1.88 School 9.14 9.74 10.25 10.49 10.73 10.96 11.20 11.71 12.31
35 181.89 11.52 6.71 Student 5.87 8.00 9.82 10.68 11.52 12.37 13.22 15.04 17.17
185.51 10.66 1.88 School 9.07 9.67 10.18 10.42 10.66 10.90 11.14 11.65 12.24
40 184.03 11.16 6.71 Student 5.51 7.64 9.46 10.32 11.16 12.01 12.86 14.68 16.81
186.41 10.59 1.88 School 9.01 9.61 10.12 10.36 10.59 10.83 11.07 11.58 12.18
45 186.11 10.81 6.71 Student 5.16 7.29 9.11 9.97 10.81 11.66 12.51 14.33 16.46
187.29 10.53 1.88 School 8.95 9.54 10.06 10.30 10.53 10.77 11.01 11.52 12.12
48 187.33 10.61 6.71 Student 4.96 7.09 8.91 9.76 10.61 11.45 12.31 14.13 16.26
187.81 10.50 1.88 School 8.91 9.51 10.02 10.26 10.50 10.73 10.97 11.48 12.08
50 188.15 10.47 6.71 Student 4.82 6.95 8.77 9.63 10.47 11.31 12.17 13.99 16.12
188.15 10.47 1.88 School 8.89 9.48 9.99 10.23 10.47 10.71 10.95 11.46 12.06
52 188.96 10.33 6.71 Student 4.68 6.81 8.63 9.49 10.33 11.18 12.03 13.85 15.98
188.49 10.45 1.88 School 8.86 9.46 9.97 10.21 10.45 10.68 10.92 11.43 12.03
55 190.19 10.13 6.71 Student 4.48 6.61 8.43 9.28 10.13 10.97 11.83 13.65 15.78
189.01 10.41 1.88 School 8.82 9.42 9.93 10.17 10.41 10.65 10.89 11.40 12.00
60 192.27 9.78 6.71 Student 4.13 6.26 8.08 8.94 9.78 10.62 11.48 13.30 15.43
189.88 10.35 1.88 School 8.76 9.36 9.87 10.11 10.35 10.58 10.82 11.34 11.93
65 194.41 9.42 6.71 Student 3.77 5.90 7.72 8.58 9.42 10.26 11.12 12.94 15.07
190.79 10.28 1.88 School 8.70 9.30 9.81 10.05 10.28 10.52 10.76 11.27 11.87
70 196.67 9.04 6.71 Student 3.39 5.52 7.34 8.20 9.04 9.88 10.74 12.56 14.69
191.74 10.22 1.88 School 8.63 9.23 9.74 9.98 10.22 10.45 10.69 11.20 11.80
75 199.11 8.63 6.71 Student 2.98 5.11 6.93 7.79 8.63 9.48 10.33 12.15 14.28
192.77 10.14 1.88 School 8.56 9.16 9.67 9.91 10.14 10.38 10.62 11.13 11.73
80 201.82 8.18 6.71 Student 2.53 4.66 6.48 7.33 8.18 9.02 9.88 11.70 13.83
193.91 10.06 1.88 School 8.48 9.07 9.58 9.82 10.06 10.30 10.54 11.05 11.65
85 204.99 7.64 6.71 Student 1.99 4.12 5.94 6.80 7.64 8.49 9.35 11.16 13.29
195.25 9.97 1.88 School 8.38 8.98 9.49 9.73 9.97 10.20 10.44 10.95 11.55
90 208.97 6.98 6.71 Student 1.33 3.46 5.28 6.13 6.98 7.82 8.68 10.50 12.63
196.92 9.85 1.88 School 8.26 8.86 9.37 9.61 9.85 10.08 10.32 10.84 11.43
CGI - Conditional Growth Index CGP - Conditional Growth Percentile
270

Table E.2.19: Reading Grade 3 From Fall To N Fall Conditional Growth Percentile
Conditional Growth
Start Status Growth CGP 20 30 40 45 50 55 60 70 80
%ile RIT Mean SD CGI -0.84 -0.52 -0.25 -0.13 0.00 0.13 0.25 0.52 0.84
10 167.98 11.53 7.40 Student 5.30 7.65 9.66 10.60 11.53 12.46 13.41 15.41 17.76
179.70 9.82 2.05 School 8.10 8.75 9.31 9.57 9.82 10.08 10.34 10.90 11.54
20 174.95 10.98 7.40 Student 4.75 7.10 9.10 10.05 10.98 11.91 12.85 14.86 17.21
182.65 9.86 2.05 School 8.14 8.78 9.34 9.60 9.86 10.11 10.37 10.93 11.58
25 177.60 10.77 7.40 Student 4.54 6.89 8.89 9.84 10.77 11.70 12.64 14.65 17.00
183.77 9.87 2.05 School 8.15 8.80 9.35 9.61 9.87 10.13 10.39 10.94 11.59
30 179.98 10.58 7.40 Student 4.35 6.70 8.70 9.65 10.58 11.51 12.46 14.46 16.81
184.77 9.88 2.05 School 8.16 8.81 9.36 9.62 9.88 10.14 10.40 10.95 11.60
35 182.18 10.40 7.40 Student 4.18 6.52 8.53 9.47 10.40 11.33 12.28 14.29 16.63
185.71 9.89 2.05 School 8.17 8.82 9.37 9.63 9.89 10.15 10.41 10.96 11.61
40 184.27 10.24 7.40 Student 4.01 6.36 8.36 9.31 10.24 11.17 12.11 14.12 16.47
186.59 9.90 2.05 School 8.18 8.83 9.38 9.64 9.90 10.16 10.42 10.97 11.62
45 186.30 10.08 7.40 Student 3.85 6.20 8.20 9.15 10.08 11.01 11.95 13.96 16.31
187.45 9.91 2.05 School 8.19 8.84 9.39 9.65 9.91 10.17 10.43 10.98 11.63
48 187.49 9.98 7.40 Student 3.75 6.10 8.11 9.05 9.98 10.91 11.86 13.86 16.21
187.95 9.92 2.05 School 8.19 8.84 9.40 9.66 9.92 10.17 10.43 10.99 11.64
50 188.29 9.92 7.40 Student 3.69 6.04 8.04 8.99 9.92 10.85 11.80 13.80 16.15
188.29 9.92 2.05 School 8.20 8.85 9.40 9.66 9.92 10.18 10.44 10.99 11.64
52 189.08 9.86 7.40 Student 3.63 5.97 7.98 8.93 9.86 10.79 11.73 13.74 16.09
188.63 9.92 2.05 School 8.20 8.85 9.41 9.67 9.92 10.18 10.44 11.00 11.64
55 190.28 9.76 7.40 Student 3.53 5.88 7.89 8.83 9.76 10.69 11.64 13.64 15.99
189.13 9.93 2.05 School 8.21 8.86 9.41 9.67 9.93 10.19 10.45 11.00 11.65
60 192.31 9.60 7.40 Student 3.37 5.72 7.73 8.67 9.60 10.53 11.48 13.48 15.83
189.99 9.94 2.05 School 8.22 8.87 9.42 9.68 9.94 10.20 10.46 11.01 11.66
65 194.40 9.43 7.40 Student 3.21 5.55 7.56 8.50 9.43 10.36 11.31 13.32 15.66
190.87 9.95 2.05 School 8.23 8.88 9.43 9.69 9.95 10.21 10.47 11.02 11.67
70 196.60 9.26 7.40 Student 3.03 5.38 7.38 8.33 9.26 10.19 11.13 13.14 15.49
191.81 9.96 2.05 School 8.24 8.89 9.44 9.70 9.96 10.22 10.48 11.03 11.68
75 198.98 9.07 7.40 Student 2.84 5.19 7.20 8.14 9.07 10.00 10.95 12.95 15.30
192.81 9.97 2.05 School 8.25 8.90 9.45 9.71 9.97 10.23 10.49 11.04 11.69
80 201.63 8.86 7.40 Student 2.63 4.98 6.99 7.93 8.86 9.79 10.74 12.74 15.09
193.93 9.98 2.05 School 8.26 8.91 9.46 9.73 9.98 10.24 10.50 11.06 11.70
85 204.72 8.62 7.40 Student 2.39 4.73 6.74 7.68 8.62 9.55 10.49 12.50 14.84
195.24 10.00 2.05 School 8.28 8.93 9.48 9.74 10.00 10.25 10.52 11.07 11.72
90 208.60 8.31 7.40 Student 2.08 4.42 6.43 7.38 8.31 9.24 10.18 12.19 14.54
196.88 10.02 2.05 School 8.29 8.94 9.50 9.76 10.02 10.27 10.53 11.09 11.74
CGI - Conditional Growth Index CGP - Conditional Growth Percentile
271

Table E.2.20: Reading Grade 3 From Fall To Spring Conditional Growth Percentile
Conditional Growth
Start Status Growth CGP 20 30 40 45 50 55 60 70 80
%ile RIT Mean SD CGI -0.84 -0.52 -0.25 -0.13 0.00 0.13 0.25 0.52 0.84
10 167.98 13.60 7.15 Student 7.59 9.85 11.79 12.70 13.60 14.50 15.41 17.35 19.62
179.70 10.82 2.02 School 9.13 9.77 10.31 10.57 10.82 11.08 11.34 11.88 12.52
20 174.95 12.48 7.15 Student 6.46 8.73 10.67 11.58 12.48 13.38 14.29 16.23 18.49
182.65 10.66 2.02 School 8.96 9.60 10.14 10.40 10.66 10.91 11.17 11.71 12.35
25 177.60 12.05 7.15 Student 6.04 8.30 10.24 11.15 12.05 12.95 13.86 15.80 18.07
183.77 10.59 2.02 School 8.89 9.53 10.08 10.34 10.59 10.84 11.10 11.65 12.29
30 179.98 11.67 7.15 Student 5.65 7.92 9.86 10.77 11.67 12.57 13.48 15.42 17.69
184.77 10.53 2.02 School 8.83 9.47 10.02 10.28 10.53 10.79 11.04 11.59 12.23
35 182.18 11.31 7.15 Student 5.30 7.57 9.50 10.42 11.31 12.21 13.13 15.06 17.33
185.71 10.48 2.02 School 8.78 9.42 9.97 10.23 10.48 10.73 10.99 11.54 12.18
40 184.27 10.98 7.15 Student 4.96 7.23 9.17 10.08 10.98 11.88 12.79 14.73 16.99
186.59 10.43 2.02 School 8.73 9.37 9.92 10.17 10.43 10.68 10.94 11.49 12.13
45 186.30 10.65 7.15 Student 4.64 6.90 8.84 9.75 10.65 11.55 12.46 14.40 16.67
187.45 10.38 2.02 School 8.68 9.32 9.87 10.13 10.38 10.63 10.89 11.44 12.08
48 187.49 10.46 7.15 Student 4.44 6.71 8.65 9.56 10.46 11.36 12.27 14.21 16.47
187.95 10.35 2.02 School 8.65 9.29 9.84 10.10 10.35 10.60 10.86 11.41 12.05
50 188.29 10.33 7.15 Student 4.32 6.58 8.52 9.43 10.33 11.23 12.14 14.08 16.35
188.29 10.33 2.02 School 8.63 9.27 9.82 10.08 10.33 10.58 10.84 11.39 12.03
52 189.08 10.20 7.15 Student 4.19 6.45 8.39 9.30 10.20 11.10 12.01 13.95 16.22
188.63 10.31 2.02 School 8.61 9.25 9.80 10.06 10.31 10.57 10.82 11.37 12.01
55 190.28 10.01 7.15 Student 3.99 6.26 8.20 9.11 10.01 10.91 11.82 13.76 16.03
189.13 10.28 2.02 School 8.58 9.22 9.77 10.03 10.28 10.54 10.79 11.34 11.98
60 192.31 9.68 7.15 Student 3.67 5.94 7.87 8.79 9.68 10.58 11.49 13.43 15.70
189.99 10.23 2.02 School 8.53 9.17 9.72 9.98 10.23 10.49 10.74 11.29 11.93
65 194.40 9.35 7.15 Student 3.33 5.60 7.54 8.45 9.35 10.25 11.16 13.10 15.36
190.87 10.18 2.02 School 8.48 9.12 9.67 9.93 10.18 10.44 10.69 11.24 11.88
70 196.60 8.99 7.15 Student 2.98 5.24 7.18 8.09 8.99 9.89 10.80 12.74 15.01
191.81 10.13 2.02 School 8.43 9.07 9.62 9.88 10.13 10.38 10.64 11.19 11.83
75 198.98 8.61 7.15 Student 2.59 4.86 6.80 7.71 8.61 9.51 10.42 12.36 14.62
192.81 10.07 2.02 School 8.37 9.01 9.56 9.82 10.07 10.32 10.58 11.13 11.77
80 201.63 8.18 7.15 Student 2.17 4.43 6.37 7.28 8.18 9.08 9.99 11.93 14.20
193.93 10.01 2.02 School 8.31 8.95 9.50 9.75 10.01 10.26 10.52 11.06 11.71
85 204.72 7.68 7.15 Student 1.67 3.94 5.87 6.79 7.68 8.58 9.50 11.43 13.70
195.24 9.93 2.02 School 8.23 8.87 9.42 9.68 9.93 10.19 10.44 10.99 11.63
90 208.60 7.06 7.15 Student 1.04 3.31 5.25 6.16 7.06 7.96 8.87 10.81 13.07
196.88 9.84 2.02 School 8.14 8.78 9.33 9.58 9.84 10.09 10.35 10.90 11.54
CGI - Conditional Growth Index CGP - Conditional Growth Percentile
272

Table E.2.21: Reading Grade 3 From Fall To Winter Conditional Growth Percentile
Conditional Growth
Start Status Growth CGP 20 30 40 45 50 55 60 70 80
%ile RIT Mean SD CGI -0.84 -0.52 -0.25 -0.13 0.00 0.13 0.25 0.52 0.84
10 167.98 9.56 5.51 Student 4.92 6.67 8.16 8.87 9.56 10.25 10.96 12.45 14.20
179.70 7.60 1.15 School 6.63 6.99 7.30 7.45 7.60 7.74 7.89 8.20 8.57
20 174.95 8.79 5.51 Student 4.15 5.90 7.39 8.10 8.79 9.48 10.19 11.68 13.43
182.65 7.50 1.15 School 6.53 6.90 7.21 7.36 7.50 7.65 7.79 8.11 8.47
25 177.60 8.50 5.51 Student 3.86 5.61 7.10 7.80 8.50 9.19 9.89 11.39 13.14
183.77 7.46 1.15 School 6.49 6.86 7.17 7.32 7.46 7.61 7.76 8.07 8.43
30 179.98 8.23 5.51 Student 3.59 5.34 6.84 7.54 8.23 8.93 9.63 11.13 12.87
184.77 7.43 1.15 School 6.46 6.83 7.14 7.29 7.43 7.58 7.72 8.04 8.40
35 182.18 7.99 5.51 Student 3.35 5.10 6.59 7.30 7.99 8.68 9.39 10.88 12.63
185.71 7.40 1.15 School 6.43 6.79 7.11 7.25 7.40 7.54 7.69 8.00 8.37
40 184.27 7.76 5.51 Student 3.12 4.87 6.36 7.07 7.76 8.45 9.16 10.65 12.40
186.59 7.37 1.15 School 6.40 6.77 7.08 7.23 7.37 7.52 7.66 7.98 8.34
45 186.30 7.54 5.51 Student 2.89 4.64 6.14 6.84 7.54 8.23 8.93 10.43 12.18
187.45 7.34 1.15 School 6.37 6.74 7.05 7.20 7.34 7.49 7.63 7.95 8.31
48 187.49 7.40 5.51 Student 2.76 4.51 6.01 6.71 7.40 8.10 8.80 10.29 12.04
187.95 7.33 1.15 School 6.35 6.72 7.03 7.18 7.33 7.47 7.62 7.93 8.30
50 188.29 7.31 5.51 Student 2.67 4.42 5.92 6.62 7.31 8.01 8.71 10.21 11.96
188.29 7.31 1.15 School 6.34 6.71 7.02 7.17 7.31 7.46 7.61 7.92 8.29
52 189.08 7.23 5.51 Student 2.59 4.34 5.83 6.53 7.23 7.92 8.62 10.12 11.87
188.63 7.30 1.15 School 6.33 6.70 7.01 7.16 7.30 7.45 7.60 7.91 8.27
55 190.28 7.09 5.51 Student 2.45 4.20 5.70 6.40 7.09 7.79 8.49 9.99 11.74
189.13 7.29 1.15 School 6.32 6.68 6.99 7.14 7.29 7.43 7.58 7.89 8.26
60 192.31 6.87 5.51 Student 2.23 3.98 5.47 6.18 6.87 7.56 8.27 9.76 11.51
189.99 7.26 1.15 School 6.29 6.65 6.97 7.11 7.26 7.40 7.55 7.86 8.23
65 194.40 6.64 5.51 Student 2.00 3.75 5.24 5.95 6.64 7.33 8.04 9.53 11.28
190.87 7.23 1.15 School 6.26 6.62 6.94 7.08 7.23 7.37 7.52 7.83 8.20
70 196.60 6.40 5.51 Student 1.75 3.50 5.00 5.70 6.40 7.09 7.79 9.29 11.04
191.81 7.20 1.15 School 6.23 6.59 6.91 7.05 7.20 7.34 7.49 7.80 8.17
75 198.98 6.13 5.51 Student 1.49 3.24 4.74 5.44 6.13 6.83 7.53 9.02 10.77
192.81 7.17 1.15 School 6.20 6.56 6.87 7.02 7.17 7.31 7.46 7.77 8.14
80 201.63 5.84 5.51 Student 1.20 2.95 4.44 5.15 5.84 6.53 7.24 8.73 10.48
193.93 7.13 1.15 School 6.16 6.52 6.84 6.98 7.13 7.27 7.42 7.73 8.10
85 204.72 5.50 5.51 Student 0.86 2.61 4.10 4.80 5.50 6.19 6.89 8.39 10.14
195.24 7.09 1.15 School 6.12 6.48 6.79 6.94 7.09 7.23 7.38 7.69 8.06
90 208.60 5.07 5.51 Student 0.43 2.18 3.67 4.37 5.07 5.76 6.46 7.96 9.71
196.88 7.03 1.15 School 6.06 6.43 6.74 6.89 7.03 7.18 7.32 7.64 8.00
CGI - Conditional Growth Index CGP - Conditional Growth Percentile
273

Table E.2.22: Reading Grade 3 From Winter To Spring Conditional Growth Percentile
Conditional Growth
Start Status Growth CGP 20 30 40 45 50 55 60 70 80
%ile RIT Mean SD CGI -0.84 -0.52 -0.25 -0.13 0.00 0.13 0.25 0.52 0.84
10 176.21 4.27 5.24 Student -0.14 1.52 2.94 3.61 4.27 4.93 5.59 7.01 8.67
187.16 3.03 0.88 School 2.29 2.57 2.81 2.92 3.03 3.14 3.25 3.49 3.77
20 182.87 3.84 5.24 Student -0.57 1.09 2.51 3.18 3.84 4.50 5.16 6.58 8.24
190.06 3.03 0.88 School 2.28 2.56 2.80 2.91 3.03 3.14 3.25 3.49 3.77
25 185.40 3.68 5.24 Student -0.73 0.93 2.35 3.02 3.68 4.33 5.00 6.42 8.08
191.16 3.02 0.88 School 2.28 2.56 2.80 2.91 3.02 3.13 3.25 3.49 3.77
30 187.67 3.53 5.24 Student -0.88 0.78 2.20 2.87 3.53 4.19 4.85 6.27 7.93
192.15 3.02 0.88 School 2.28 2.56 2.80 2.91 3.02 3.13 3.25 3.48 3.76
35 189.77 3.39 5.24 Student -1.01 0.65 2.07 2.73 3.39 4.05 4.72 6.14 7.80
193.07 3.02 0.88 School 2.28 2.56 2.80 2.91 3.02 3.13 3.24 3.48 3.76
40 191.77 3.26 5.24 Student -1.14 0.52 1.94 2.61 3.26 3.92 4.59 6.01 7.67
193.94 3.02 0.88 School 2.28 2.56 2.80 2.91 3.02 3.13 3.24 3.48 3.76
45 193.70 3.14 5.24 Student -1.27 0.39 1.81 2.48 3.14 3.80 4.47 5.88 7.54
194.78 3.02 0.88 School 2.28 2.56 2.79 2.91 3.02 3.13 3.24 3.48 3.76
48 194.85 3.07 5.24 Student -1.34 0.32 1.74 2.41 3.07 3.72 4.39 5.81 7.47
195.27 3.02 0.88 School 2.28 2.55 2.79 2.91 3.02 3.13 3.24 3.48 3.76
50 195.60 3.02 5.24 Student -1.39 0.27 1.69 2.36 3.02 3.67 4.34 5.76 7.42
195.60 3.02 0.88 School 2.27 2.55 2.79 2.91 3.02 3.13 3.24 3.48 3.76
52 196.36 2.97 5.24 Student -1.44 0.22 1.64 2.31 2.97 3.62 4.29 5.71 7.37
195.93 3.02 0.88 School 2.27 2.55 2.79 2.90 3.02 3.13 3.24 3.48 3.76
55 197.51 2.89 5.24 Student -1.51 0.15 1.57 2.24 2.89 3.55 4.22 5.64 7.30
196.43 3.01 0.88 School 2.27 2.55 2.79 2.90 3.01 3.13 3.24 3.48 3.76
60 199.44 2.77 5.24 Student -1.64 0.02 1.44 2.11 2.77 3.43 4.09 5.51 7.17
197.27 3.01 0.88 School 2.27 2.55 2.79 2.90 3.01 3.12 3.24 3.48 3.75
65 201.44 2.64 5.24 Student -1.77 -0.11 1.31 1.98 2.64 3.30 3.97 5.38 7.05
198.14 3.01 0.88 School 2.27 2.55 2.79 2.90 3.01 3.12 3.24 3.47 3.75
70 203.54 2.50 5.24 Student -1.90 -0.24 1.18 1.85 2.50 3.16 3.83 5.25 6.91
199.06 3.01 0.88 School 2.27 2.55 2.79 2.90 3.01 3.12 3.23 3.47 3.75
75 205.81 2.36 5.24 Student -2.05 -0.39 1.03 1.70 2.36 3.01 3.68 5.10 6.76
200.05 3.01 0.88 School 2.27 2.55 2.79 2.90 3.01 3.12 3.23 3.47 3.75
80 208.34 2.19 5.24 Student -2.21 -0.55 0.87 1.54 2.19 2.85 3.52 4.94 6.60
201.15 3.01 0.88 School 2.27 2.54 2.78 2.90 3.01 3.12 3.23 3.47 3.75
85 211.29 2.00 5.24 Student -2.40 -0.74 0.68 1.35 2.00 2.66 3.33 4.75 6.41
202.43 3.00 0.88 School 2.26 2.54 2.78 2.89 3.00 3.12 3.23 3.47 3.75
90 215.00 1.76 5.24 Student -2.64 -0.98 0.44 1.11 1.76 2.42 3.09 4.51 6.17
204.04 3.00 0.88 School 2.26 2.54 2.78 2.89 3.00 3.11 3.22 3.46 3.74
CGI - Conditional Growth Index CGP - Conditional Growth Percentile
274

Table E.2.23: Reading Grade 4 From Last Winter To Winter Conditional Growth Percentile
Conditional Growth
Start Status Growth CGP 20 30 40 45 50 55 60 70 80
%ile RIT Mean SD CGI -0.84 -0.52 -0.25 -0.13 0.00 0.13 0.25 0.52 0.84
10 175.19 10.73 5.78 Student 5.86 7.70 9.26 10.00 10.73 11.46 12.19 13.76 15.59
186.85 8.69 1.34 School 7.56 7.99 8.35 8.52 8.69 8.86 9.03 9.39 9.82
20 182.09 9.89 5.78 Student 5.03 6.86 8.43 9.17 9.89 10.62 11.36 12.93 14.76
189.75 8.55 1.34 School 7.43 7.85 8.21 8.39 8.55 8.72 8.89 9.26 9.68
25 184.71 9.58 5.78 Student 4.71 6.55 8.11 8.85 9.58 10.30 11.04 12.61 14.44
190.85 8.50 1.34 School 7.37 7.80 8.16 8.34 8.50 8.67 8.84 9.21 9.63
30 187.07 9.29 5.78 Student 4.43 6.26 7.83 8.57 9.29 10.02 10.76 12.32 14.16
191.84 8.46 1.34 School 7.33 7.75 8.12 8.29 8.46 8.63 8.80 9.16 9.59
35 189.25 9.03 5.78 Student 4.16 6.00 7.56 8.30 9.03 9.76 10.49 12.06 13.89
192.76 8.42 1.34 School 7.29 7.71 8.08 8.25 8.42 8.58 8.76 9.12 9.55
40 191.32 8.78 5.78 Student 3.91 5.75 7.31 8.05 8.78 9.50 10.24 11.81 13.64
193.63 8.38 1.34 School 7.25 7.67 8.04 8.21 8.38 8.54 8.72 9.08 9.50
45 193.33 8.54 5.78 Student 3.67 5.51 7.07 7.81 8.54 9.26 10.00 11.57 13.40
194.47 8.34 1.34 School 7.21 7.63 8.00 8.17 8.34 8.51 8.68 9.04 9.47
48 194.51 8.39 5.78 Student 3.53 5.36 6.93 7.67 8.39 9.12 9.86 11.42 13.26
194.97 8.31 1.34 School 7.18 7.61 7.97 8.14 8.31 8.48 8.65 9.02 9.44
50 195.30 8.30 5.78 Student 3.43 5.27 6.83 7.57 8.30 9.02 9.76 11.33 13.16
195.30 8.30 1.34 School 7.17 7.59 7.96 8.13 8.30 8.47 8.64 9.00 9.43
52 196.08 8.20 5.78 Student 3.34 5.17 6.74 7.48 8.20 8.93 9.67 11.23 13.07
195.63 8.28 1.34 School 7.15 7.58 7.94 8.11 8.28 8.45 8.62 8.99 9.41
55 197.27 8.06 5.78 Student 3.20 5.03 6.60 7.33 8.06 8.79 9.52 11.09 12.92
196.13 8.26 1.34 School 7.13 7.56 7.92 8.09 8.26 8.43 8.60 8.96 9.39
60 199.27 7.82 5.78 Student 2.95 4.79 6.35 7.09 7.82 8.54 9.28 10.85 12.68
196.97 8.22 1.34 School 7.09 7.52 7.88 8.05 8.22 8.39 8.56 8.92 9.35
65 201.34 7.57 5.78 Student 2.70 4.54 6.10 6.84 7.57 8.29 9.03 10.60 12.43
197.84 8.18 1.34 School 7.05 7.48 7.84 8.01 8.18 8.35 8.52 8.88 9.31
70 203.53 7.30 5.78 Student 2.44 4.27 5.84 6.58 7.30 8.03 8.77 10.33 12.17
198.75 8.14 1.34 School 7.01 7.43 7.80 7.97 8.14 8.31 8.48 8.84 9.27
75 205.88 7.02 5.78 Student 2.15 3.99 5.55 6.29 7.02 7.75 8.48 10.05 11.88
199.74 8.09 1.34 School 6.96 7.39 7.75 7.92 8.09 8.26 8.43 8.80 9.22
80 208.50 6.70 5.78 Student 1.84 3.67 5.24 5.98 6.70 7.43 8.17 9.73 11.57
200.85 8.04 1.34 School 6.91 7.34 7.70 7.87 8.04 8.21 8.38 8.75 9.17
85 211.56 6.33 5.78 Student 1.47 3.30 4.87 5.61 6.33 7.06 7.80 9.36 11.20
202.13 7.98 1.34 School 6.85 7.28 7.64 7.81 7.98 8.15 8.32 8.69 9.11
90 215.41 5.87 5.78 Student 1.00 2.84 4.40 5.14 5.87 6.59 7.33 8.90 10.73
203.75 7.91 1.34 School 6.78 7.20 7.57 7.74 7.91 8.08 8.25 8.61 9.04
CGI - Conditional Growth Index CGP - Conditional Growth Percentile
275
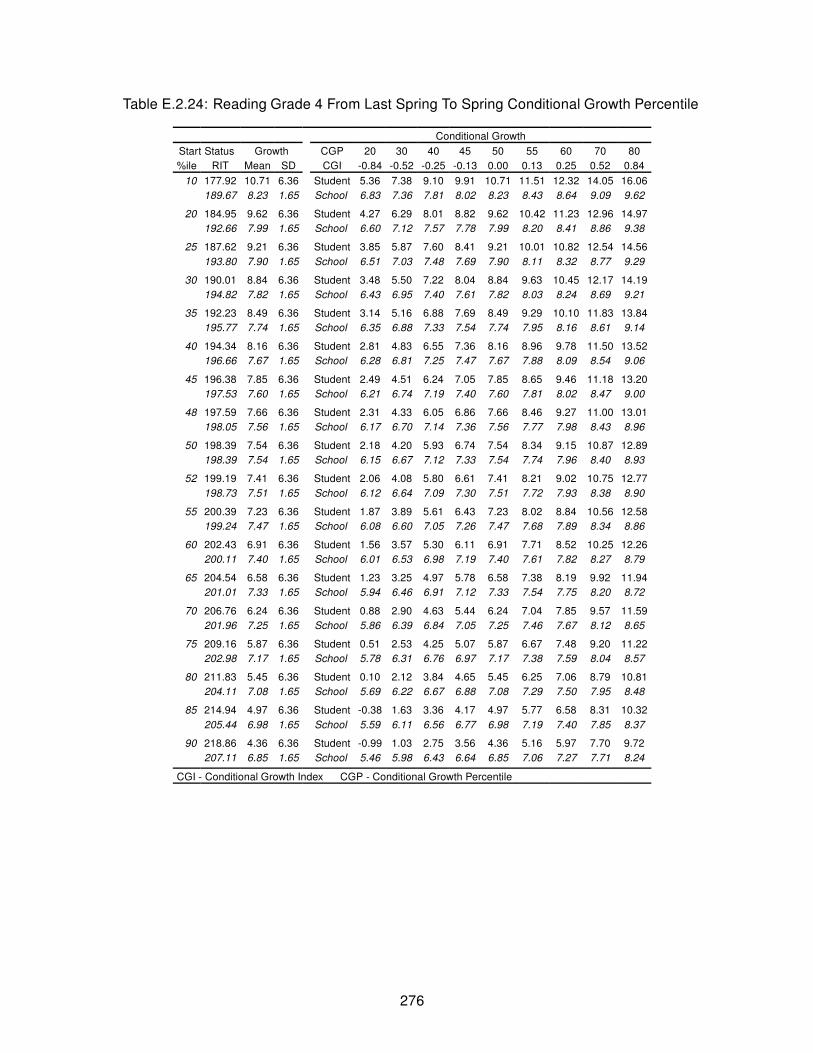
Table E.2.24: Reading Grade 4 From Last Spring To Spring Conditional Growth Percentile
Conditional Growth
Start Status Growth CGP 20 30 40 45 50 55 60 70 80
%ile RIT Mean SD CGI -0.84 -0.52 -0.25 -0.13 0.00 0.13 0.25 0.52 0.84
10 177.92 10.71 6.36 Student 5.36 7.38 9.10 9.91 10.71 11.51 12.32 14.05 16.06
189.67 8.23 1.65 School 6.83 7.36 7.81 8.02 8.23 8.43 8.64 9.09 9.62
20 184.95 9.62 6.36 Student 4.27 6.29 8.01 8.82 9.62 10.42 11.23 12.96 14.97
192.66 7.99 1.65 School 6.60 7.12 7.57 7.78 7.99 8.20 8.41 8.86 9.38
25 187.62 9.21 6.36 Student 3.85 5.87 7.60 8.41 9.21 10.01 10.82 12.54 14.56
193.80 7.90 1.65 School 6.51 7.03 7.48 7.69 7.90 8.11 8.32 8.77 9.29
30 190.01 8.84 6.36 Student 3.48 5.50 7.22 8.04 8.84 9.63 10.45 12.17 14.19
194.82 7.82 1.65 School 6.43 6.95 7.40 7.61 7.82 8.03 8.24 8.69 9.21
35 192.23 8.49 6.36 Student 3.14 5.16 6.88 7.69 8.49 9.29 10.10 11.83 13.84
195.77 7.74 1.65 School 6.35 6.88 7.33 7.54 7.74 7.95 8.16 8.61 9.14
40 194.34 8.16 6.36 Student 2.81 4.83 6.55 7.36 8.16 8.96 9.78 11.50 13.52
196.66 7.67 1.65 School 6.28 6.81 7.25 7.47 7.67 7.88 8.09 8.54 9.06
45 196.38 7.85 6.36 Student 2.49 4.51 6.24 7.05 7.85 8.65 9.46 11.18 13.20
197.53 7.60 1.65 School 6.21 6.74 7.19 7.40 7.60 7.81 8.02 8.47 9.00
48 197.59 7.66 6.36 Student 2.31 4.33 6.05 6.86 7.66 8.46 9.27 11.00 13.01
198.05 7.56 1.65 School 6.17 6.70 7.14 7.36 7.56 7.77 7.98 8.43 8.96
50 198.39 7.54 6.36 Student 2.18 4.20 5.93 6.74 7.54 8.34 9.15 10.87 12.89
198.39 7.54 1.65 School 6.15 6.67 7.12 7.33 7.54 7.74 7.96 8.40 8.93
52 199.19 7.41 6.36 Student 2.06 4.08 5.80 6.61 7.41 8.21 9.02 10.75 12.77
198.73 7.51 1.65 School 6.12 6.64 7.09 7.30 7.51 7.72 7.93 8.38 8.90
55 200.39 7.23 6.36 Student 1.87 3.89 5.61 6.43 7.23 8.02 8.84 10.56 12.58
199.24 7.47 1.65 School 6.08 6.60 7.05 7.26 7.47 7.68 7.89 8.34 8.86
60 202.43 6.91 6.36 Student 1.56 3.57 5.30 6.11 6.91 7.71 8.52 10.25 12.26
200.11 7.40 1.65 School 6.01 6.53 6.98 7.19 7.40 7.61 7.82 8.27 8.79
65 204.54 6.58 6.36 Student 1.23 3.25 4.97 5.78 6.58 7.38 8.19 9.92 11.94
201.01 7.33 1.65 School 5.94 6.46 6.91 7.12 7.33 7.54 7.75 8.20 8.72
70 206.76 6.24 6.36 Student 0.88 2.90 4.63 5.44 6.24 7.04 7.85 9.57 11.59
201.96 7.25 1.65 School 5.86 6.39 6.84 7.05 7.25 7.46 7.67 8.12 8.65
75 209.16 5.87 6.36 Student 0.51 2.53 4.25 5.07 5.87 6.67 7.48 9.20 11.22
202.98 7.17 1.65 School 5.78 6.31 6.76 6.97 7.17 7.38 7.59 8.04 8.57
80 211.83 5.45 6.36 Student 0.10 2.12 3.84 4.65 5.45 6.25 7.06 8.79 10.81
204.11 7.08 1.65 School 5.69 6.22 6.67 6.88 7.08 7.29 7.50 7.95 8.48
85 214.94 4.97 6.36 Student -0.38 1.63 3.36 4.17 4.97 5.77 6.58 8.31 10.32
205.44 6.98 1.65 School 5.59 6.11 6.56 6.77 6.98 7.19 7.40 7.85 8.37
90 218.86 4.36 6.36 Student -0.99 1.03 2.75 3.56 4.36 5.16 5.97 7.70 9.72
207.11 6.85 1.65 School 5.46 5.98 6.43 6.64 6.85 7.06 7.27 7.71 8.24
CGI - Conditional Growth Index CGP - Conditional Growth Percentile
276

Table E.2.25: Reading Grade 4 From Fall To N Fall Conditional Growth Percentile
Conditional Growth
Start Status Growth CGP 20 30 40 45 50 55 60 70 80
%ile RIT Mean SD CGI -0.84 -0.52 -0.25 -0.13 0.00 0.13 0.25 0.52 0.84
10 178.26 8.84 6.68 Student 3.22 5.34 7.15 8.00 8.84 9.68 10.53 12.34 14.46
189.85 7.37 1.56 School 6.05 6.55 6.97 7.17 7.37 7.56 7.76 8.19 8.68
20 185.09 8.36 6.68 Student 2.73 4.85 6.66 7.52 8.36 9.20 10.05 11.86 13.98
192.70 7.39 1.56 School 6.08 6.57 6.99 7.19 7.39 7.59 7.79 8.21 8.71
25 187.69 8.17 6.68 Student 2.55 4.67 6.48 7.33 8.17 9.01 9.87 11.68 13.80
193.79 7.40 1.56 School 6.08 6.58 7.00 7.20 7.40 7.60 7.79 8.22 8.71
30 190.02 8.01 6.68 Student 2.38 4.50 6.32 7.17 8.01 8.85 9.70 11.51 13.63
194.76 7.41 1.56 School 6.09 6.59 7.01 7.21 7.41 7.60 7.80 8.23 8.72
35 192.18 7.86 6.68 Student 2.23 4.35 6.16 7.02 7.86 8.70 9.55 11.36 13.48
195.66 7.41 1.56 School 6.10 6.59 7.02 7.22 7.41 7.61 7.81 8.23 8.73
40 194.23 7.71 6.68 Student 2.09 4.21 6.02 6.87 7.71 8.55 9.40 11.22 13.34
196.52 7.42 1.56 School 6.11 6.60 7.02 7.22 7.42 7.62 7.82 8.24 8.74
45 196.21 7.57 6.68 Student 1.95 4.07 5.88 6.73 7.57 8.41 9.26 11.08 13.20
197.35 7.43 1.56 School 6.11 6.61 7.03 7.23 7.43 7.62 7.82 8.25 8.74
48 197.38 7.49 6.68 Student 1.86 3.98 5.80 6.65 7.49 8.33 9.18 10.99 13.11
197.84 7.43 1.56 School 6.12 6.61 7.04 7.23 7.43 7.63 7.83 8.25 8.75
50 198.16 7.43 6.68 Student 1.81 3.93 5.74 6.59 7.43 8.27 9.13 10.94 13.06
198.16 7.43 1.56 School 6.12 6.61 7.04 7.24 7.43 7.63 7.83 8.25 8.75
52 198.94 7.38 6.68 Student 1.75 3.87 5.69 6.54 7.38 8.22 9.07 10.88 13.00
198.49 7.44 1.56 School 6.12 6.62 7.04 7.24 7.44 7.63 7.83 8.26 8.75
55 200.11 7.30 6.68 Student 1.67 3.79 5.60 6.46 7.30 8.14 8.99 10.80 12.92
198.98 7.44 1.56 School 6.13 6.62 7.04 7.24 7.44 7.64 7.84 8.26 8.76
60 202.10 7.16 6.68 Student 1.53 3.65 5.46 6.32 7.16 8.00 8.85 10.66 12.78
199.80 7.45 1.56 School 6.13 6.63 7.05 7.25 7.45 7.64 7.84 8.27 8.76
65 204.15 7.01 6.68 Student 1.39 3.51 5.32 6.17 7.01 7.85 8.70 10.52 12.64
200.66 7.45 1.56 School 6.14 6.63 7.06 7.26 7.45 7.65 7.85 8.27 8.77
70 206.31 6.86 6.68 Student 1.23 3.35 5.17 6.02 6.86 7.70 8.55 10.36 12.48
201.56 7.46 1.56 School 6.15 6.64 7.07 7.26 7.46 7.66 7.86 8.28 8.78
75 208.64 6.69 6.68 Student 1.07 3.19 5.00 5.85 6.69 7.53 8.39 10.20 12.32
202.54 7.47 1.56 School 6.15 6.65 7.07 7.27 7.47 7.66 7.86 8.29 8.78
80 211.23 6.51 6.68 Student 0.89 3.01 4.82 5.67 6.51 7.35 8.20 10.01 12.13
203.62 7.48 1.56 School 6.16 6.66 7.08 7.28 7.48 7.67 7.87 8.30 8.79
85 214.26 6.30 6.68 Student 0.67 2.79 4.60 5.46 6.30 7.14 7.99 9.80 11.92
204.88 7.49 1.56 School 6.17 6.67 7.09 7.29 7.49 7.68 7.88 8.31 8.80
90 218.07 6.03 6.68 Student 0.40 2.52 4.33 5.19 6.03 6.87 7.72 9.53 11.65
206.47 7.50 1.56 School 6.19 6.68 7.10 7.30 7.50 7.70 7.90 8.32 8.81
CGI - Conditional Growth Index CGP - Conditional Growth Percentile
277
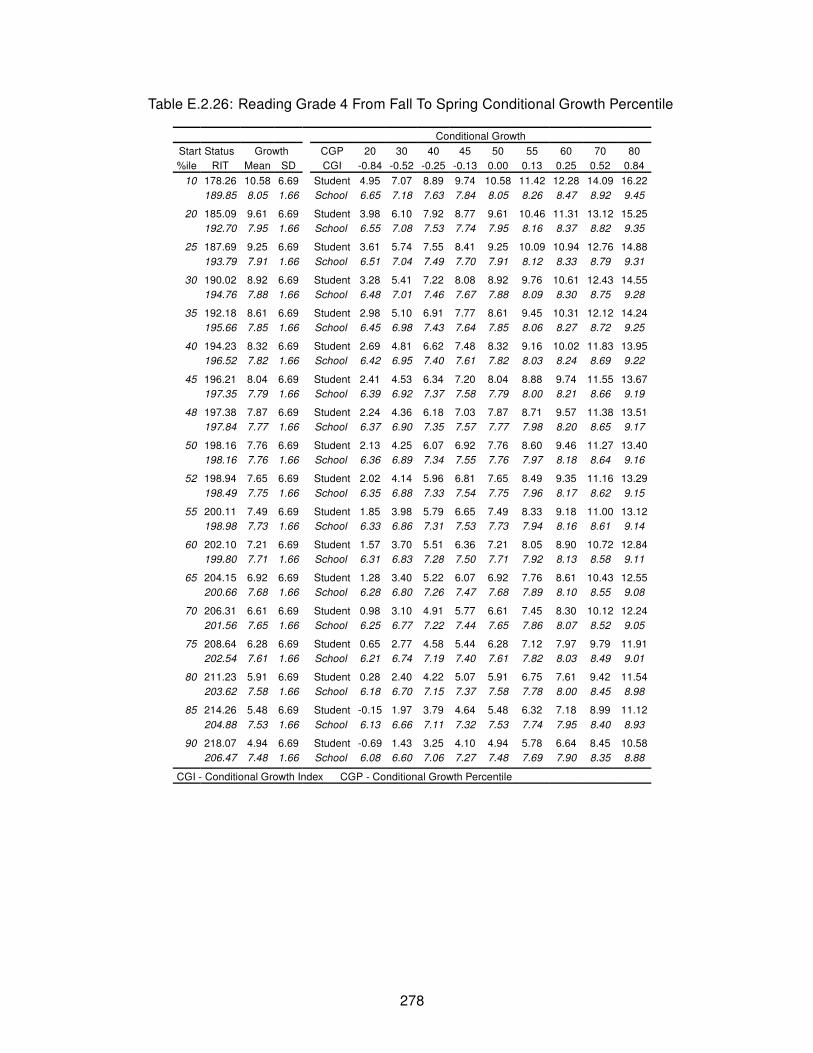
Table E.2.26: Reading Grade 4 From Fall To Spring Conditional Growth Percentile
Conditional Growth
Start Status Growth CGP 20 30 40 45 50 55 60 70 80
%ile RIT Mean SD CGI -0.84 -0.52 -0.25 -0.13 0.00 0.13 0.25 0.52 0.84
10 178.26 10.58 6.69 Student 4.95 7.07 8.89 9.74 10.58 11.42 12.28 14.09 16.22
189.85 8.05 1.66 School 6.65 7.18 7.63 7.84 8.05 8.26 8.47 8.92 9.45
20 185.09 9.61 6.69 Student 3.98 6.10 7.92 8.77 9.61 10.46 11.31 13.12 15.25
192.70 7.95 1.66 School 6.55 7.08 7.53 7.74 7.95 8.16 8.37 8.82 9.35
25 187.69 9.25 6.69 Student 3.61 5.74 7.55 8.41 9.25 10.09 10.94 12.76 14.88
193.79 7.91 1.66 School 6.51 7.04 7.49 7.70 7.91 8.12 8.33 8.79 9.31
30 190.02 8.92 6.69 Student 3.28 5.41 7.22 8.08 8.92 9.76 10.61 12.43 14.55
194.76 7.88 1.66 School 6.48 7.01 7.46 7.67 7.88 8.09 8.30 8.75 9.28
35 192.18 8.61 6.69 Student 2.98 5.10 6.91 7.77 8.61 9.45 10.31 12.12 14.24
195.66 7.85 1.66 School 6.45 6.98 7.43 7.64 7.85 8.06 8.27 8.72 9.25
40 194.23 8.32 6.69 Student 2.69 4.81 6.62 7.48 8.32 9.16 10.02 11.83 13.95
196.52 7.82 1.66 School 6.42 6.95 7.40 7.61 7.82 8.03 8.24 8.69 9.22
45 196.21 8.04 6.69 Student 2.41 4.53 6.34 7.20 8.04 8.88 9.74 11.55 13.67
197.35 7.79 1.66 School 6.39 6.92 7.37 7.58 7.79 8.00 8.21 8.66 9.19
48 197.38 7.87 6.69 Student 2.24 4.36 6.18 7.03 7.87 8.71 9.57 11.38 13.51
197.84 7.77 1.66 School 6.37 6.90 7.35 7.57 7.77 7.98 8.20 8.65 9.17
50 198.16 7.76 6.69 Student 2.13 4.25 6.07 6.92 7.76 8.60 9.46 11.27 13.40
198.16 7.76 1.66 School 6.36 6.89 7.34 7.55 7.76 7.97 8.18 8.64 9.16
52 198.94 7.65 6.69 Student 2.02 4.14 5.96 6.81 7.65 8.49 9.35 11.16 13.29
198.49 7.75 1.66 School 6.35 6.88 7.33 7.54 7.75 7.96 8.17 8.62 9.15
55 200.11 7.49 6.69 Student 1.85 3.98 5.79 6.65 7.49 8.33 9.18 11.00 13.12
198.98 7.73 1.66 School 6.33 6.86 7.31 7.53 7.73 7.94 8.16 8.61 9.14
60 202.10 7.21 6.69 Student 1.57 3.70 5.51 6.36 7.21 8.05 8.90 10.72 12.84
199.80 7.71 1.66 School 6.31 6.83 7.28 7.50 7.71 7.92 8.13 8.58 9.11
65 204.15 6.92 6.69 Student 1.28 3.40 5.22 6.07 6.92 7.76 8.61 10.43 12.55
200.66 7.68 1.66 School 6.28 6.80 7.26 7.47 7.68 7.89 8.10 8.55 9.08
70 206.31 6.61 6.69 Student 0.98 3.10 4.91 5.77 6.61 7.45 8.30 10.12 12.24
201.56 7.65 1.66 School 6.25 6.77 7.22 7.44 7.65 7.86 8.07 8.52 9.05
75 208.64 6.28 6.69 Student 0.65 2.77 4.58 5.44 6.28 7.12 7.97 9.79 11.91
202.54 7.61 1.66 School 6.21 6.74 7.19 7.40 7.61 7.82 8.03 8.49 9.01
80 211.23 5.91 6.69 Student 0.28 2.40 4.22 5.07 5.91 6.75 7.61 9.42 11.54
203.62 7.58 1.66 School 6.18 6.70 7.15 7.37 7.58 7.78 8.00 8.45 8.98
85 214.26 5.48 6.69 Student -0.15 1.97 3.79 4.64 5.48 6.32 7.18 8.99 11.12
204.88 7.53 1.66 School 6.13 6.66 7.11 7.32 7.53 7.74 7.95 8.40 8.93
90 218.07 4.94 6.69 Student -0.69 1.43 3.25 4.10 4.94 5.78 6.64 8.45 10.58
206.47 7.48 1.66 School 6.08 6.60 7.06 7.27 7.48 7.69 7.90 8.35 8.88
CGI - Conditional Growth Index CGP - Conditional Growth Percentile
278

Table E.2.27: Reading Grade 4 From Fall To Winter Conditional Growth Percentile
Conditional Growth
Start Status Growth CGP 20 30 40 45 50 55 60 70 80
%ile RIT Mean SD CGI -0.84 -0.52 -0.25 -0.13 0.00 0.13 0.25 0.52 0.84
10 178.26 7.43 5.33 Student 2.94 4.63 6.08 6.76 7.43 8.10 8.78 10.23 11.92
189.85 5.60 0.95 School 4.80 5.10 5.36 5.48 5.60 5.72 5.84 6.10 6.40
20 185.09 6.74 5.33 Student 2.26 3.95 5.39 6.07 6.74 7.41 8.10 9.54 11.23
192.70 5.54 0.95 School 4.74 5.04 5.30 5.42 5.54 5.66 5.78 6.04 6.34
25 187.69 6.48 5.33 Student 1.99 3.69 5.13 5.81 6.48 7.15 7.84 9.28 10.97
193.79 5.52 0.95 School 4.72 5.02 5.28 5.40 5.52 5.64 5.76 6.02 6.32
30 190.02 6.25 5.33 Student 1.76 3.45 4.90 5.58 6.25 6.92 7.60 9.05 10.74
194.76 5.50 0.95 School 4.70 5.00 5.26 5.38 5.50 5.62 5.74 6.00 6.30
35 192.18 6.03 5.33 Student 1.54 3.24 4.68 5.36 6.03 6.70 7.39 8.83 10.52
195.66 5.48 0.95 School 4.68 4.98 5.24 5.36 5.48 5.60 5.72 5.98 6.28
40 194.23 5.83 5.33 Student 1.34 3.03 4.48 5.16 5.83 6.50 7.18 8.63 10.32
196.52 5.47 0.95 School 4.67 4.97 5.22 5.35 5.47 5.59 5.71 5.96 6.27
45 196.21 5.63 5.33 Student 1.14 2.83 4.28 4.96 5.63 6.30 6.98 8.43 10.12
197.35 5.45 0.95 School 4.65 4.95 5.21 5.33 5.45 5.57 5.69 5.95 6.25
48 197.38 5.51 5.33 Student 1.02 2.71 4.16 4.84 5.51 6.18 6.86 8.31 10.00
197.84 5.44 0.95 School 4.64 4.94 5.20 5.32 5.44 5.56 5.68 5.94 6.24
50 198.16 5.43 5.33 Student 0.94 2.64 4.08 4.76 5.43 6.10 6.78 8.23 9.92
198.16 5.43 0.95 School 4.63 4.93 5.19 5.31 5.43 5.55 5.67 5.93 6.23
52 198.94 5.36 5.33 Student 0.87 2.56 4.00 4.69 5.36 6.03 6.71 8.15 9.84
198.49 5.43 0.95 School 4.63 4.93 5.19 5.31 5.43 5.55 5.67 5.93 6.23
55 200.11 5.24 5.33 Student 0.75 2.44 3.89 4.57 5.24 5.91 6.59 8.03 9.73
198.98 5.42 0.95 School 4.62 4.92 5.18 5.30 5.42 5.54 5.66 5.92 6.22
60 202.10 5.04 5.33 Student 0.55 2.24 3.69 4.37 5.04 5.71 6.39 7.84 9.53
199.80 5.40 0.95 School 4.60 4.90 5.16 5.28 5.40 5.52 5.64 5.90 6.20
65 204.15 4.83 5.33 Student 0.34 2.04 3.48 4.16 4.83 5.50 6.18 7.63 9.32
200.66 5.38 0.95 School 4.58 4.89 5.14 5.26 5.38 5.50 5.63 5.88 6.18
70 206.31 4.62 5.33 Student 0.13 1.82 3.27 3.95 4.62 5.29 5.97 7.41 9.11
201.56 5.37 0.95 School 4.57 4.87 5.13 5.25 5.37 5.49 5.61 5.87 6.17
75 208.64 4.38 5.33 Student -0.11 1.59 3.03 3.71 4.38 5.05 5.73 7.18 8.87
202.54 5.35 0.95 School 4.55 4.85 5.11 5.23 5.35 5.47 5.59 5.85 6.15
80 211.23 4.12 5.33 Student -0.37 1.33 2.77 3.45 4.12 4.79 5.47 6.92 8.61
203.62 5.33 0.95 School 4.53 4.83 5.09 5.21 5.33 5.45 5.57 5.83 6.13
85 214.26 3.82 5.33 Student -0.67 1.02 2.47 3.15 3.82 4.49 5.17 6.62 8.31
204.88 5.30 0.95 School 4.50 4.80 5.06 5.18 5.30 5.42 5.54 5.80 6.10
90 218.07 3.44 5.33 Student -1.05 0.64 2.09 2.77 3.44 4.11 4.79 6.23 7.93
206.47 5.27 0.95 School 4.47 4.77 5.03 5.15 5.27 5.39 5.51 5.77 6.07
CGI - Conditional Growth Index CGP - Conditional Growth Percentile
279

Table E.2.28: Reading Grade 4 From Winter To Spring Conditional Growth Percentile
Conditional Growth
Start Status Growth CGP 20 30 40 45 50 55 60 70 80
%ile RIT Mean SD CGI -0.84 -0.52 -0.25 -0.13 0.00 0.13 0.25 0.52 0.84
10 184.43 3.53 5.10 Student -0.76 0.86 2.24 2.89 3.53 4.17 4.83 6.21 7.83
195.36 2.32 0.72 School 1.71 1.94 2.13 2.22 2.32 2.41 2.50 2.69 2.92
20 191.01 3.12 5.10 Student -1.17 0.44 1.83 2.48 3.12 3.76 4.41 5.79 7.41
198.18 2.32 0.72 School 1.71 1.94 2.14 2.23 2.32 2.41 2.50 2.70 2.93
25 193.51 2.96 5.10 Student -1.33 0.29 1.67 2.32 2.96 3.60 4.26 5.64 7.26
199.26 2.32 0.72 School 1.72 1.94 2.14 2.23 2.32 2.41 2.50 2.70 2.93
30 195.75 2.82 5.10 Student -1.47 0.15 1.53 2.18 2.82 3.46 4.11 5.50 7.11
200.22 2.32 0.72 School 1.72 1.95 2.14 2.23 2.32 2.41 2.51 2.70 2.93
35 197.83 2.69 5.10 Student -1.60 0.02 1.40 2.05 2.69 3.33 3.98 5.37 6.98
201.12 2.33 0.72 School 1.72 1.95 2.14 2.23 2.33 2.42 2.51 2.70 2.93
40 199.81 2.57 5.10 Student -1.73 -0.11 1.28 1.93 2.57 3.21 3.86 5.24 6.86
201.97 2.33 0.72 School 1.72 1.95 2.14 2.24 2.33 2.42 2.51 2.70 2.93
45 201.72 2.45 5.10 Student -1.85 -0.23 1.16 1.81 2.45 3.09 3.74 5.12 6.74
202.79 2.33 0.72 School 1.72 1.95 2.15 2.24 2.33 2.42 2.51 2.71 2.93
48 202.85 2.38 5.10 Student -1.92 -0.30 1.08 1.74 2.38 3.02 3.67 5.05 6.67
203.27 2.33 0.72 School 1.72 1.95 2.15 2.24 2.33 2.42 2.51 2.71 2.93
50 203.60 2.33 5.10 Student -1.96 -0.35 1.04 1.69 2.33 2.97 3.62 5.00 6.62
203.60 2.33 0.72 School 1.72 1.95 2.15 2.24 2.33 2.42 2.51 2.71 2.94
52 204.35 2.28 5.10 Student -2.01 -0.39 0.99 1.64 2.28 2.92 3.57 4.96 6.58
203.92 2.33 0.72 School 1.72 1.95 2.15 2.24 2.33 2.42 2.51 2.71 2.94
55 205.47 2.21 5.10 Student -2.08 -0.46 0.92 1.57 2.21 2.85 3.50 4.89 6.50
204.40 2.33 0.72 School 1.72 1.95 2.15 2.24 2.33 2.42 2.51 2.71 2.94
60 207.38 2.09 5.10 Student -2.20 -0.58 0.80 1.45 2.09 2.73 3.38 4.77 6.38
205.22 2.33 0.72 School 1.73 1.95 2.15 2.24 2.33 2.42 2.51 2.71 2.94
65 209.36 1.97 5.10 Student -2.33 -0.71 0.68 1.33 1.97 2.61 3.26 4.64 6.26
206.07 2.33 0.72 School 1.73 1.96 2.15 2.24 2.33 2.42 2.52 2.71 2.94
70 211.44 1.84 5.10 Student -2.46 -0.84 0.54 1.20 1.84 2.48 3.13 4.51 6.13
206.97 2.34 0.72 School 1.73 1.96 2.15 2.24 2.34 2.43 2.52 2.71 2.94
75 213.68 1.70 5.10 Student -2.60 -0.98 0.40 1.06 1.70 2.34 2.99 4.37 5.99
207.93 2.34 0.72 School 1.73 1.96 2.15 2.25 2.34 2.43 2.52 2.71 2.94
80 216.18 1.54 5.10 Student -2.75 -1.14 0.25 0.90 1.54 2.18 2.83 4.21 5.83
209.01 2.34 0.72 School 1.73 1.96 2.16 2.25 2.34 2.43 2.52 2.72 2.94
85 219.10 1.36 5.10 Student -2.94 -1.32 0.06 0.72 1.36 2.00 2.65 4.03 5.65
210.26 2.34 0.72 School 1.73 1.96 2.16 2.25 2.34 2.43 2.52 2.72 2.95
90 222.77 1.13 5.10 Student -3.17 -1.55 -0.17 0.49 1.13 1.77 2.42 3.80 5.42
211.83 2.34 0.72 School 1.74 1.97 2.16 2.25 2.34 2.43 2.53 2.72 2.95
CGI - Conditional Growth Index CGP - Conditional Growth Percentile
280

Table E.2.29: Reading Grade 5 From Last Winter To Winter Conditional Growth Percentile
Conditional Growth
Start Status Growth CGP 20 30 40 45 50 55 60 70 80
%ile RIT Mean SD CGI -0.84 -0.52 -0.25 -0.13 0.00 0.13 0.25 0.52 0.84
10 183.69 9.05 6.08 Student 3.93 5.86 7.51 8.29 9.05 9.81 10.59 12.24 14.16
194.99 7.03 1.33 School 5.91 6.33 6.69 6.86 7.03 7.20 7.36 7.72 8.14
20 190.43 8.17 6.08 Student 3.06 4.99 6.64 7.41 8.17 8.94 9.71 11.36 13.29
197.85 6.85 1.33 School 5.73 6.15 6.51 6.68 6.85 7.02 7.18 7.54 7.96
25 192.99 7.84 6.08 Student 2.73 4.66 6.30 7.08 7.84 8.61 9.38 11.03 12.96
198.94 6.78 1.33 School 5.66 6.08 6.44 6.61 6.78 6.95 7.12 7.48 7.90
30 195.29 7.54 6.08 Student 2.43 4.36 6.01 6.78 7.54 8.31 9.08 10.73 12.66
199.91 6.72 1.33 School 5.60 6.02 6.38 6.55 6.72 6.88 7.05 7.41 7.83
35 197.42 7.27 6.08 Student 2.15 4.08 5.73 6.50 7.27 8.03 8.81 10.46 12.38
200.82 6.66 1.33 School 5.55 5.97 6.33 6.49 6.66 6.83 7.00 7.36 7.78
40 199.44 7.01 6.08 Student 1.89 3.82 5.47 6.24 7.01 7.77 8.55 10.19 12.12
201.68 6.61 1.33 School 5.49 5.91 6.27 6.44 6.61 6.77 6.94 7.30 7.72
45 201.40 6.75 6.08 Student 1.64 3.57 5.21 5.99 6.75 7.52 8.29 9.94 11.87
202.51 6.55 1.33 School 5.44 5.86 6.22 6.39 6.55 6.72 6.89 7.25 7.67
48 202.55 6.60 6.08 Student 1.49 3.42 5.06 5.84 6.60 7.37 8.14 9.79 11.72
203.00 6.52 1.33 School 5.41 5.83 6.19 6.36 6.52 6.69 6.86 7.22 7.64
50 203.32 6.50 6.08 Student 1.39 3.32 4.96 5.74 6.50 7.27 8.04 9.69 11.62
203.32 6.50 1.33 School 5.39 5.81 6.17 6.34 6.50 6.67 6.84 7.20 7.62
52 204.09 6.40 6.08 Student 1.29 3.22 4.86 5.64 6.40 7.17 7.94 9.59 11.52
203.65 6.48 1.33 School 5.37 5.79 6.15 6.32 6.48 6.65 6.82 7.18 7.60
55 205.25 6.25 6.08 Student 1.14 3.07 4.71 5.49 6.25 7.02 7.79 9.44 11.37
204.14 6.45 1.33 School 5.34 5.76 6.12 6.29 6.45 6.62 6.79 7.15 7.57
60 207.20 6.00 6.08 Student 0.88 2.81 4.46 5.24 6.00 6.76 7.54 9.19 11.12
204.97 6.40 1.33 School 5.28 5.70 6.06 6.23 6.40 6.57 6.74 7.09 7.52
65 209.23 5.74 6.08 Student 0.62 2.55 4.20 4.97 5.74 6.50 7.28 8.92 10.85
205.83 6.35 1.33 School 5.23 5.65 6.01 6.18 6.35 6.51 6.68 7.04 7.46
70 211.36 5.46 6.08 Student 0.35 2.27 3.92 4.70 5.46 6.23 7.00 8.65 10.58
206.73 6.29 1.33 School 5.17 5.59 5.95 6.12 6.29 6.45 6.62 6.98 7.40
75 213.66 5.16 6.08 Student 0.05 1.98 3.62 4.40 5.16 5.93 6.70 8.35 10.28
207.71 6.23 1.33 School 5.11 5.53 5.89 6.06 6.23 6.39 6.56 6.92 7.34
80 216.22 4.83 6.08 Student -0.28 1.64 3.29 4.07 4.83 5.60 6.37 8.02 9.95
208.79 6.16 1.33 School 5.04 5.46 5.82 5.99 6.16 6.32 6.49 6.85 7.27
85 219.20 4.44 6.08 Student -0.67 1.26 2.90 3.68 4.44 5.21 5.98 7.63 9.56
210.06 6.08 1.33 School 4.96 5.38 5.74 5.91 6.08 6.24 6.41 6.77 7.19
90 222.96 3.96 6.08 Student -1.16 0.77 2.42 3.19 3.96 4.72 5.50 7.14 9.07
211.65 5.98 1.33 School 4.86 5.28 5.64 5.81 5.98 6.14 6.31 6.67 7.09
CGI - Conditional Growth Index CGP - Conditional Growth Percentile
281

Table E.2.30: Reading Grade 5 From Last Spring To Spring Conditional Growth Percentile
Conditional Growth
Start Status Growth CGP 20 30 40 45 50 55 60 70 80
%ile RIT Mean SD CGI -0.84 -0.52 -0.25 -0.13 0.00 0.13 0.25 0.52 0.84
10 185.88 9.14 6.74 Student 3.47 5.60 7.43 8.29 9.14 9.99 10.85 12.68 14.82
197.33 6.67 1.71 School 5.23 5.77 6.23 6.45 6.67 6.88 7.10 7.56 8.10
20 192.73 8.05 6.74 Student 2.37 4.51 6.34 7.20 8.05 8.90 9.76 11.58 13.72
200.25 6.42 1.71 School 4.99 5.53 5.99 6.21 6.42 6.64 6.86 7.32 7.86
25 195.33 7.63 6.74 Student 1.96 4.10 5.92 6.79 7.63 8.48 9.34 11.17 13.31
201.36 6.33 1.71 School 4.89 5.44 5.90 6.12 6.33 6.55 6.76 7.23 7.77
30 197.67 7.26 6.74 Student 1.58 3.72 5.55 6.41 7.26 8.11 8.97 10.80 12.94
202.36 6.25 1.71 School 4.81 5.35 5.81 6.03 6.25 6.46 6.68 7.14 7.68
35 199.83 6.91 6.74 Student 1.24 3.38 5.21 6.07 6.91 7.76 8.62 10.45 12.59
203.28 6.17 1.71 School 4.73 5.27 5.74 5.96 6.17 6.38 6.60 7.07 7.61
40 201.89 6.59 6.74 Student 0.91 3.05 4.88 5.74 6.59 7.43 8.29 10.12 12.26
204.15 6.10 1.71 School 4.66 5.20 5.66 5.88 6.10 6.31 6.53 6.99 7.53
45 203.88 6.27 6.74 Student 0.59 2.73 4.56 5.42 6.27 7.12 7.98 9.81 11.94
205.00 6.03 1.71 School 4.59 5.13 5.59 5.81 6.03 6.24 6.46 6.92 7.46
48 205.05 6.08 6.74 Student 0.41 2.54 4.37 5.23 6.08 6.93 7.79 9.62 11.76
205.50 5.98 1.71 School 4.55 5.09 5.55 5.77 5.98 6.20 6.42 6.88 7.42
50 205.83 5.96 6.74 Student 0.28 2.42 4.25 5.11 5.96 6.80 7.67 9.49 11.63
205.83 5.96 1.71 School 4.52 5.06 5.52 5.74 5.96 6.17 6.39 6.85 7.39
52 206.62 5.83 6.74 Student 0.16 2.30 4.12 4.98 5.83 6.68 7.54 9.37 11.51
206.17 5.93 1.71 School 4.49 5.03 5.50 5.71 5.93 6.14 6.36 6.82 7.37
55 207.79 5.64 6.74 Student -0.03 2.11 3.94 4.80 5.64 6.49 7.35 9.18 11.32
206.67 5.89 1.71 School 4.45 4.99 5.45 5.67 5.89 6.10 6.32 6.78 7.32
60 209.78 5.33 6.74 Student -0.35 1.79 3.62 4.48 5.33 6.17 7.04 8.86 11.00
207.51 5.82 1.71 School 4.38 4.92 5.38 5.60 5.82 6.03 6.25 6.71 7.25
65 211.83 5.00 6.74 Student -0.68 1.46 3.29 4.15 5.00 5.85 6.71 8.54 10.67
208.39 5.74 1.71 School 4.31 4.85 5.31 5.53 5.74 5.96 6.18 6.64 7.18
70 214.00 4.65 6.74 Student -1.02 1.12 2.94 3.81 4.65 5.50 6.36 8.19 10.33
209.31 5.67 1.71 School 4.23 4.77 5.23 5.45 5.67 5.88 6.10 6.56 7.10
75 216.34 4.28 6.74 Student -1.40 0.74 2.57 3.43 4.28 5.13 5.99 7.82 9.96
210.31 5.58 1.71 School 4.15 4.69 5.15 5.37 5.58 5.80 6.01 6.48 7.02
80 218.94 3.87 6.74 Student -1.81 0.33 2.16 3.02 3.87 4.71 5.57 7.40 9.54
211.42 5.49 1.71 School 4.05 4.59 5.06 5.27 5.49 5.70 5.92 6.38 6.93
85 221.97 3.38 6.74 Student -2.29 -0.16 1.67 2.53 3.38 4.23 5.09 6.92 9.06
212.71 5.38 1.71 School 3.94 4.49 4.95 5.17 5.38 5.60 5.81 6.28 6.82
90 225.79 2.77 6.74 Student -2.90 -0.76 1.06 1.92 2.77 3.62 4.48 6.31 8.45
214.33 5.25 1.71 School 3.81 4.35 4.81 5.03 5.25 5.46 5.68 6.14 6.68
CGI - Conditional Growth Index CGP - Conditional Growth Percentile
282

Table E.2.31: Reading Grade 5 From Fall To N Fall Conditional Growth Percentile
Conditional Growth
Start Status Growth CGP 20 30 40 45 50 55 60 70 80
%ile RIT Mean SD CGI -0.84 -0.52 -0.25 -0.13 0.00 0.13 0.25 0.52 0.84
10 186.29 6.50 7.10 Student 0.53 2.78 4.70 5.61 6.50 7.39 8.30 10.22 12.47
197.64 5.62 1.58 School 4.29 4.79 5.22 5.42 5.62 5.82 6.02 6.45 6.95
20 192.94 6.14 7.10 Student 0.17 2.42 4.34 5.25 6.14 7.03 7.94 9.86 12.11
200.40 5.56 1.58 School 4.23 4.73 5.16 5.36 5.56 5.76 5.96 6.39 6.89
25 195.47 6.00 7.10 Student 0.03 2.28 4.20 5.11 6.00 6.89 7.80 9.72 11.97
201.45 5.54 1.58 School 4.21 4.71 5.14 5.34 5.54 5.74 5.94 6.37 6.87
30 197.74 5.88 7.10 Student -0.09 2.16 4.08 4.99 5.88 6.77 7.68 9.60 11.85
202.39 5.52 1.58 School 4.19 4.69 5.12 5.32 5.52 5.72 5.92 6.35 6.85
35 199.85 5.76 7.10 Student -0.21 2.04 3.97 4.87 5.76 6.66 7.56 9.49 11.74
203.26 5.50 1.58 School 4.17 4.67 5.10 5.30 5.50 5.70 5.90 6.33 6.83
40 201.84 5.66 7.10 Student -0.32 1.94 3.86 4.76 5.66 6.55 7.45 9.38 11.63
204.09 5.48 1.58 School 4.15 4.65 5.08 5.28 5.48 5.68 5.88 6.31 6.81
45 203.78 5.55 7.10 Student -0.42 1.83 3.75 4.66 5.55 6.44 7.35 9.27 11.52
204.89 5.47 1.58 School 4.14 4.64 5.06 5.27 5.47 5.66 5.87 6.29 6.80
48 204.92 5.49 7.10 Student -0.48 1.77 3.69 4.60 5.49 6.38 7.29 9.21 11.46
205.36 5.46 1.58 School 4.13 4.63 5.05 5.26 5.46 5.65 5.86 6.28 6.78
50 205.68 5.45 7.10 Student -0.52 1.73 3.65 4.56 5.45 6.34 7.25 9.17 11.42
205.68 5.45 1.58 School 4.12 4.62 5.05 5.25 5.45 5.65 5.85 6.28 6.78
52 206.44 5.41 7.10 Student -0.57 1.69 3.61 4.52 5.41 6.30 7.20 9.13 11.38
205.99 5.44 1.58 School 4.11 4.61 5.04 5.24 5.44 5.64 5.84 6.27 6.77
55 207.58 5.35 7.10 Student -0.63 1.62 3.55 4.45 5.35 6.24 7.14 9.07 11.32
206.47 5.43 1.58 School 4.10 4.60 5.03 5.23 5.43 5.63 5.83 6.26 6.76
60 209.51 5.24 7.10 Student -0.73 1.52 3.44 4.35 5.24 6.13 7.04 8.96 11.21
207.27 5.41 1.58 School 4.08 4.59 5.01 5.22 5.41 5.61 5.81 6.24 6.74
65 211.51 5.13 7.10 Student -0.84 1.41 3.33 4.24 5.13 6.02 6.93 8.85 11.10
208.10 5.40 1.58 School 4.07 4.57 5.00 5.20 5.40 5.59 5.80 6.22 6.73
70 213.61 5.02 7.10 Student -0.95 1.30 3.22 4.13 5.02 5.91 6.82 8.74 10.99
208.97 5.38 1.58 School 4.05 4.55 4.98 5.18 5.38 5.58 5.78 6.21 6.71
75 215.88 4.89 7.10 Student -1.08 1.17 3.10 4.00 4.89 5.79 6.69 8.62 10.87
209.91 5.36 1.58 School 4.03 4.53 4.96 5.16 5.36 5.56 5.76 6.19 6.69
80 218.41 4.76 7.10 Student -1.21 1.04 2.96 3.87 4.76 5.65 6.56 8.48 10.73
210.96 5.33 1.58 School 4.00 4.51 4.93 5.14 5.33 5.53 5.74 6.16 6.66
85 221.36 4.60 7.10 Student -1.37 0.88 2.80 3.71 4.60 5.49 6.40 8.32 10.57
212.18 5.31 1.58 School 3.98 4.48 4.91 5.11 5.31 5.51 5.71 6.14 6.64
90 225.07 4.40 7.10 Student -1.58 0.67 2.60 3.50 4.40 5.29 6.19 8.12 10.37
213.72 5.28 1.58 School 3.95 4.45 4.88 5.08 5.28 5.47 5.68 6.10 6.61
CGI - Conditional Growth Index CGP - Conditional Growth Percentile
283

Table E.2.32: Reading Grade 5 From Fall To Spring Conditional Growth Percentile
Conditional Growth
Start Status Growth CGP 20 30 40 45 50 55 60 70 80
%ile RIT Mean SD CGI -0.84 -0.52 -0.25 -0.13 0.00 0.13 0.25 0.52 0.84
10 186.29 8.80 6.84 Student 3.04 5.21 7.06 7.94 8.80 9.65 10.53 12.38 14.55
197.64 6.39 1.77 School 4.90 5.46 5.94 6.17 6.39 6.61 6.84 7.32 7.88
20 192.94 7.87 6.84 Student 2.12 4.29 6.14 7.02 7.87 8.73 9.61 11.46 13.63
200.40 6.29 1.77 School 4.80 5.37 5.85 6.07 6.29 6.52 6.74 7.22 7.78
25 195.47 7.53 6.84 Student 1.77 3.94 5.79 6.67 7.53 8.38 9.26 11.11 13.28
201.45 6.26 1.77 School 4.77 5.33 5.81 6.04 6.26 6.48 6.71 7.19 7.75
30 197.74 7.21 6.84 Student 1.46 3.63 5.48 6.35 7.21 8.07 8.94 10.80 12.97
202.39 6.23 1.77 School 4.74 5.30 5.78 6.00 6.23 6.45 6.67 7.15 7.72
35 199.85 6.92 6.84 Student 1.17 3.33 5.19 6.06 6.92 7.78 8.65 10.51 12.67
203.26 6.20 1.77 School 4.71 5.27 5.75 5.97 6.20 6.42 6.64 7.12 7.69
40 201.84 6.64 6.84 Student 0.89 3.06 4.91 5.78 6.64 7.50 8.38 10.23 12.40
204.09 6.17 1.77 School 4.68 5.24 5.72 5.95 6.17 6.39 6.62 7.10 7.66
45 203.78 6.38 6.84 Student 0.62 2.79 4.64 5.52 6.38 7.24 8.11 9.96 12.13
204.89 6.14 1.77 School 4.65 5.21 5.69 5.92 6.14 6.36 6.59 7.07 7.63
48 204.92 6.22 6.84 Student 0.46 2.63 4.49 5.36 6.22 7.08 7.95 9.80 11.97
205.36 6.12 1.77 School 4.63 5.20 5.68 5.90 6.12 6.35 6.57 7.05 7.61
50 205.68 6.11 6.84 Student 0.36 2.53 4.38 5.25 6.11 6.97 7.85 9.70 11.87
205.68 6.11 1.77 School 4.62 5.19 5.67 5.89 6.11 6.34 6.56 7.04 7.60
52 206.44 6.01 6.84 Student 0.25 2.42 4.28 5.15 6.01 6.87 7.74 9.59 11.76
205.99 6.10 1.77 School 4.61 5.17 5.65 5.88 6.10 6.33 6.55 7.03 7.59
55 207.58 5.85 6.84 Student 0.10 2.27 4.12 4.99 5.85 6.71 7.58 9.44 11.60
206.47 6.09 1.77 School 4.60 5.16 5.64 5.86 6.09 6.31 6.53 7.01 7.58
60 209.51 5.58 6.84 Student -0.17 2.00 3.85 4.72 5.58 6.44 7.32 9.17 11.34
207.27 6.06 1.77 School 4.57 5.13 5.61 5.84 6.06 6.28 6.51 6.99 7.55
65 211.51 5.31 6.84 Student -0.45 1.72 3.57 4.45 5.31 6.17 7.04 8.89 11.06
208.10 6.03 1.77 School 4.54 5.10 5.58 5.81 6.03 6.25 6.48 6.96 7.52
70 213.61 5.02 6.84 Student -0.74 1.43 3.28 4.16 5.02 5.88 6.75 8.60 10.77
208.97 6.00 1.77 School 4.51 5.07 5.55 5.78 6.00 6.22 6.45 6.93 7.49
75 215.88 4.70 6.84 Student -1.05 1.12 2.97 3.84 4.70 5.56 6.43 8.29 10.46
209.91 5.97 1.77 School 4.48 5.04 5.52 5.75 5.97 6.19 6.42 6.90 7.46
80 218.41 4.35 6.84 Student -1.40 0.77 2.62 3.49 4.35 5.21 6.08 7.94 10.11
210.96 5.93 1.77 School 4.44 5.01 5.48 5.71 5.93 6.16 6.38 6.86 7.42
85 221.36 3.94 6.84 Student -1.81 0.36 2.21 3.09 3.94 4.80 5.68 7.53 9.70
212.18 5.89 1.77 School 4.40 4.96 5.44 5.67 5.89 6.11 6.34 6.82 7.38
90 225.07 3.43 6.84 Student -2.32 -0.15 1.70 2.57 3.43 4.29 5.16 7.02 9.19
213.72 5.84 1.77 School 4.35 4.91 5.39 5.62 5.84 6.06 6.29 6.77 7.33
CGI - Conditional Growth Index CGP - Conditional Growth Percentile
284

Table E.2.33: Reading Grade 5 From Fall To Winter Conditional Growth Percentile
Conditional Growth
Start Status Growth CGP 20 30 40 45 50 55 60 70 80
%ile RIT Mean SD CGI -0.84 -0.52 -0.25 -0.13 0.00 0.13 0.25 0.52 0.84
10 186.29 6.08 5.39 Student 1.54 3.25 4.71 5.40 6.08 6.75 7.44 8.90 10.62
197.64 4.31 1.01 School 3.45 3.77 4.05 4.18 4.31 4.43 4.56 4.84 5.16
20 192.94 5.41 5.39 Student 0.87 2.59 4.05 4.74 5.41 6.09 6.78 8.24 9.95
200.40 4.25 1.01 School 3.40 3.72 3.99 4.12 4.25 4.38 4.51 4.78 5.10
25 195.47 5.16 5.39 Student 0.62 2.33 3.80 4.48 5.16 5.84 6.53 7.99 9.70
201.45 4.23 1.01 School 3.38 3.70 3.97 4.10 4.23 4.36 4.49 4.76 5.08
30 197.74 4.94 5.39 Student 0.40 2.11 3.57 4.26 4.94 5.61 6.30 7.77 9.48
202.39 4.21 1.01 School 3.36 3.68 3.96 4.09 4.21 4.34 4.47 4.74 5.06
35 199.85 4.73 5.39 Student 0.19 1.90 3.36 4.05 4.73 5.41 6.09 7.56 9.27
203.26 4.20 1.01 School 3.34 3.66 3.94 4.07 4.20 4.32 4.45 4.73 5.05
40 201.84 4.53 5.39 Student -0.01 1.70 3.16 3.85 4.53 5.21 5.90 7.36 9.07
204.09 4.18 1.01 School 3.33 3.65 3.92 4.05 4.18 4.31 4.44 4.71 5.03
45 203.78 4.34 5.39 Student -0.20 1.51 2.97 3.66 4.34 5.02 5.70 7.17 8.88
204.89 4.16 1.01 School 3.31 3.63 3.91 4.04 4.16 4.29 4.42 4.69 5.02
48 204.92 4.22 5.39 Student -0.32 1.39 2.86 3.55 4.22 4.90 5.59 7.05 8.76
205.36 4.15 1.01 School 3.30 3.62 3.90 4.03 4.15 4.28 4.41 4.68 5.01
50 205.68 4.15 5.39 Student -0.39 1.32 2.78 3.47 4.15 4.83 5.51 6.98 8.69
205.68 4.15 1.01 School 3.30 3.62 3.89 4.02 4.15 4.28 4.40 4.68 5.00
52 206.44 4.07 5.39 Student -0.47 1.24 2.71 3.39 4.07 4.75 5.44 6.90 8.61
205.99 4.14 1.01 School 3.29 3.61 3.89 4.01 4.14 4.27 4.40 4.67 4.99
55 207.58 3.96 5.39 Student -0.58 1.13 2.59 3.28 3.96 4.64 5.33 6.79 8.50
206.47 4.13 1.01 School 3.28 3.60 3.88 4.01 4.13 4.26 4.39 4.66 4.98
60 209.51 3.77 5.39 Student -0.77 0.94 2.40 3.09 3.77 4.44 5.13 6.60 8.31
207.27 4.12 1.01 School 3.27 3.59 3.86 3.99 4.12 4.24 4.37 4.65 4.97
65 211.51 3.57 5.39 Student -0.97 0.74 2.20 2.89 3.57 4.25 4.94 6.40 8.11
208.10 4.10 1.01 School 3.25 3.57 3.84 3.97 4.10 4.23 4.36 4.63 4.95
70 213.61 3.36 5.39 Student -1.18 0.53 1.99 2.68 3.36 4.04 4.73 6.19 7.90
208.97 4.08 1.01 School 3.23 3.55 3.83 3.96 4.08 4.21 4.34 4.61 4.94
75 215.88 3.13 5.39 Student -1.41 0.30 1.77 2.46 3.13 3.81 4.50 5.96 7.67
209.91 4.07 1.01 School 3.21 3.53 3.81 3.94 4.07 4.19 4.32 4.60 4.92
80 218.41 2.88 5.39 Student -1.66 0.05 1.52 2.20 2.88 3.56 4.25 5.71 7.42
210.96 4.05 1.01 School 3.19 3.51 3.79 3.92 4.05 4.17 4.30 4.58 4.90
85 221.36 2.59 5.39 Student -1.95 -0.24 1.22 1.91 2.59 3.27 3.96 5.42 7.13
212.18 4.02 1.01 School 3.17 3.49 3.76 3.89 4.02 4.15 4.28 4.55 4.87
90 225.07 2.22 5.39 Student -2.32 -0.61 0.85 1.54 2.22 2.90 3.59 5.05 6.76
213.72 3.99 1.01 School 3.14 3.46 3.73 3.86 3.99 4.12 4.25 4.52 4.84
CGI - Conditional Growth Index CGP - Conditional Growth Percentile
285
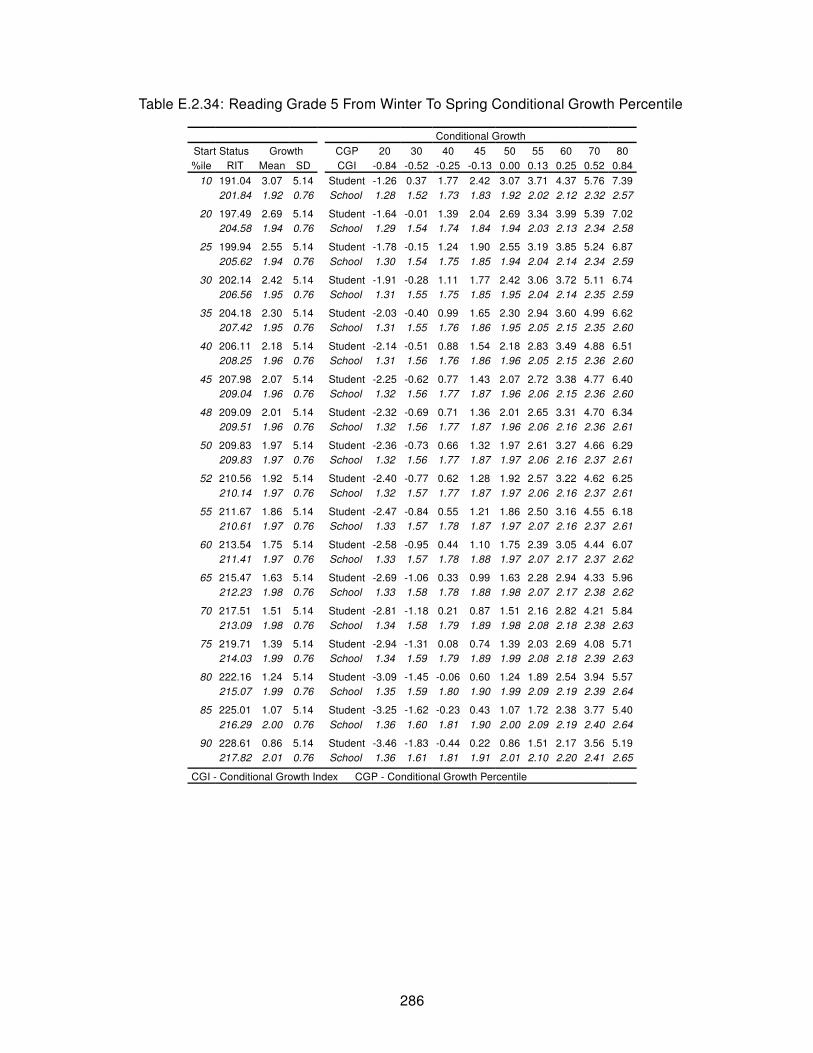
Table E.2.34: Reading Grade 5 From Winter To Spring Conditional Growth Percentile
Conditional Growth
Start Status Growth CGP 20 30 40 45 50 55 60 70 80
%ile RIT Mean SD CGI -0.84 -0.52 -0.25 -0.13 0.00 0.13 0.25 0.52 0.84
10 191.04 3.07 5.14 Student -1.26 0.37 1.77 2.42 3.07 3.71 4.37 5.76 7.39
201.84 1.92 0.76 School 1.28 1.52 1.73 1.83 1.92 2.02 2.12 2.32 2.57
20 197.49 2.69 5.14 Student -1.64 -0.01 1.39 2.04 2.69 3.34 3.99 5.39 7.02
204.58 1.94 0.76 School 1.29 1.54 1.74 1.84 1.94 2.03 2.13 2.34 2.58
25 199.94 2.55 5.14 Student -1.78 -0.15 1.24 1.90 2.55 3.19 3.85 5.24 6.87
205.62 1.94 0.76 School 1.30 1.54 1.75 1.85 1.94 2.04 2.14 2.34 2.59
30 202.14 2.42 5.14 Student -1.91 -0.28 1.11 1.77 2.42 3.06 3.72 5.11 6.74
206.56 1.95 0.76 School 1.31 1.55 1.75 1.85 1.95 2.04 2.14 2.35 2.59
35 204.18 2.30 5.14 Student -2.03 -0.40 0.99 1.65 2.30 2.94 3.60 4.99 6.62
207.42 1.95 0.76 School 1.31 1.55 1.76 1.86 1.95 2.05 2.15 2.35 2.60
40 206.11 2.18 5.14 Student -2.14 -0.51 0.88 1.54 2.18 2.83 3.49 4.88 6.51
208.25 1.96 0.76 School 1.31 1.56 1.76 1.86 1.96 2.05 2.15 2.36 2.60
45 207.98 2.07 5.14 Student -2.25 -0.62 0.77 1.43 2.07 2.72 3.38 4.77 6.40
209.04 1.96 0.76 School 1.32 1.56 1.77 1.87 1.96 2.06 2.15 2.36 2.60
48 209.09 2.01 5.14 Student -2.32 -0.69 0.71 1.36 2.01 2.65 3.31 4.70 6.34
209.51 1.96 0.76 School 1.32 1.56 1.77 1.87 1.96 2.06 2.16 2.36 2.61
50 209.83 1.97 5.14 Student -2.36 -0.73 0.66 1.32 1.97 2.61 3.27 4.66 6.29
209.83 1.97 0.76 School 1.32 1.56 1.77 1.87 1.97 2.06 2.16 2.37 2.61
52 210.56 1.92 5.14 Student -2.40 -0.77 0.62 1.28 1.92 2.57 3.22 4.62 6.25
210.14 1.97 0.76 School 1.32 1.57 1.77 1.87 1.97 2.06 2.16 2.37 2.61
55 211.67 1.86 5.14 Student -2.47 -0.84 0.55 1.21 1.86 2.50 3.16 4.55 6.18
210.61 1.97 0.76 School 1.33 1.57 1.78 1.87 1.97 2.07 2.16 2.37 2.61
60 213.54 1.75 5.14 Student -2.58 -0.95 0.44 1.10 1.75 2.39 3.05 4.44 6.07
211.41 1.97 0.76 School 1.33 1.57 1.78 1.88 1.97 2.07 2.17 2.37 2.62
65 215.47 1.63 5.14 Student -2.69 -1.06 0.33 0.99 1.63 2.28 2.94 4.33 5.96
212.23 1.98 0.76 School 1.33 1.58 1.78 1.88 1.98 2.07 2.17 2.38 2.62
70 217.51 1.51 5.14 Student -2.81 -1.18 0.21 0.87 1.51 2.16 2.82 4.21 5.84
213.09 1.98 0.76 School 1.34 1.58 1.79 1.89 1.98 2.08 2.18 2.38 2.63
75 219.71 1.39 5.14 Student -2.94 -1.31 0.08 0.74 1.39 2.03 2.69 4.08 5.71
214.03 1.99 0.76 School 1.34 1.59 1.79 1.89 1.99 2.08 2.18 2.39 2.63
80 222.16 1.24 5.14 Student -3.09 -1.45 -0.06 0.60 1.24 1.89 2.54 3.94 5.57
215.07 1.99 0.76 School 1.35 1.59 1.80 1.90 1.99 2.09 2.19 2.39 2.64
85 225.01 1.07 5.14 Student -3.25 -1.62 -0.23 0.43 1.07 1.72 2.38 3.77 5.40
216.29 2.00 0.76 School 1.36 1.60 1.81 1.90 2.00 2.09 2.19 2.40 2.64
90 228.61 0.86 5.14 Student -3.46 -1.83 -0.44 0.22 0.86 1.51 2.17 3.56 5.19
217.82 2.01 0.76 School 1.36 1.61 1.81 1.91 2.01 2.10 2.20 2.41 2.65
CGI - Conditional Growth Index CGP - Conditional Growth Percentile
286
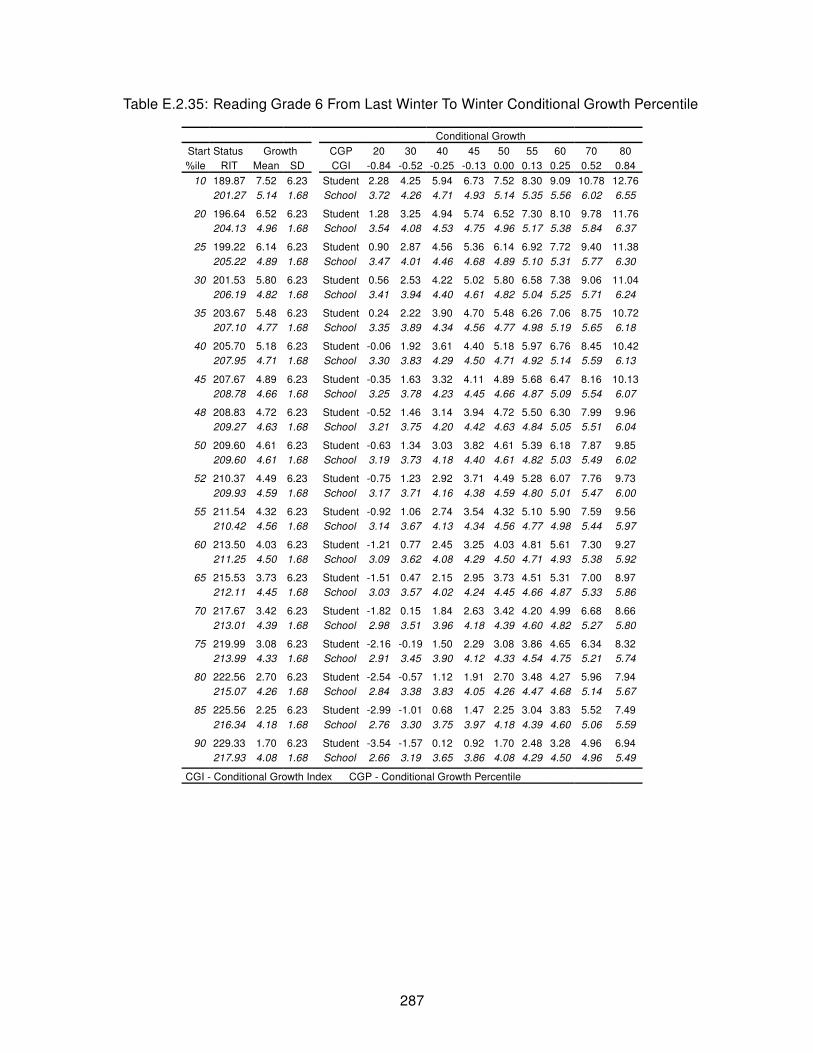
Table E.2.35: Reading Grade 6 From Last Winter To Winter Conditional Growth Percentile
Conditional Growth
Start Status Growth CGP 20 30 40 45 50 55 60 70 80
%ile RIT Mean SD CGI -0.84 -0.52 -0.25 -0.13 0.00 0.13 0.25 0.52 0.84
10 189.87 7.52 6.23 Student 2.28 4.25 5.94 6.73 7.52 8.30 9.09 10.78 12.76
201.27 5.14 1.68 School 3.72 4.26 4.71 4.93 5.14 5.35 5.56 6.02 6.55
20 196.64 6.52 6.23 Student 1.28 3.25 4.94 5.74 6.52 7.30 8.10 9.78 11.76
204.13 4.96 1.68 School 3.54 4.08 4.53 4.75 4.96 5.17 5.38 5.84 6.37
25 199.22 6.14 6.23 Student 0.90 2.87 4.56 5.36 6.14 6.92 7.72 9.40 11.38
205.22 4.89 1.68 School 3.47 4.01 4.46 4.68 4.89 5.10 5.31 5.77 6.30
30 201.53 5.80 6.23 Student 0.56 2.53 4.22 5.02 5.80 6.58 7.38 9.06 11.04
206.19 4.82 1.68 School 3.41 3.94 4.40 4.61 4.82 5.04 5.25 5.71 6.24
35 203.67 5.48 6.23 Student 0.24 2.22 3.90 4.70 5.48 6.26 7.06 8.75 10.72
207.10 4.77 1.68 School 3.35 3.89 4.34 4.56 4.77 4.98 5.19 5.65 6.18
40 205.70 5.18 6.23 Student -0.06 1.92 3.61 4.40 5.18 5.97 6.76 8.45 10.42
207.95 4.71 1.68 School 3.30 3.83 4.29 4.50 4.71 4.92 5.14 5.59 6.13
45 207.67 4.89 6.23 Student -0.35 1.63 3.32 4.11 4.89 5.68 6.47 8.16 10.13
208.78 4.66 1.68 School 3.25 3.78 4.23 4.45 4.66 4.87 5.09 5.54 6.07
48 208.83 4.72 6.23 Student -0.52 1.46 3.14 3.94 4.72 5.50 6.30 7.99 9.96
209.27 4.63 1.68 School 3.21 3.75 4.20 4.42 4.63 4.84 5.05 5.51 6.04
50 209.60 4.61 6.23 Student -0.63 1.34 3.03 3.82 4.61 5.39 6.18 7.87 9.85
209.60 4.61 1.68 School 3.19 3.73 4.18 4.40 4.61 4.82 5.03 5.49 6.02
52 210.37 4.49 6.23 Student -0.75 1.23 2.92 3.71 4.49 5.28 6.07 7.76 9.73
209.93 4.59 1.68 School 3.17 3.71 4.16 4.38 4.59 4.80 5.01 5.47 6.00
55 211.54 4.32 6.23 Student -0.92 1.06 2.74 3.54 4.32 5.10 5.90 7.59 9.56
210.42 4.56 1.68 School 3.14 3.67 4.13 4.34 4.56 4.77 4.98 5.44 5.97
60 213.50 4.03 6.23 Student -1.21 0.77 2.45 3.25 4.03 4.81 5.61 7.30 9.27
211.25 4.50 1.68 School 3.09 3.62 4.08 4.29 4.50 4.71 4.93 5.38 5.92
65 215.53 3.73 6.23 Student -1.51 0.47 2.15 2.95 3.73 4.51 5.31 7.00 8.97
212.11 4.45 1.68 School 3.03 3.57 4.02 4.24 4.45 4.66 4.87 5.33 5.86
70 217.67 3.42 6.23 Student -1.82 0.15 1.84 2.63 3.42 4.20 4.99 6.68 8.66
213.01 4.39 1.68 School 2.98 3.51 3.96 4.18 4.39 4.60 4.82 5.27 5.80
75 219.99 3.08 6.23 Student -2.16 -0.19 1.50 2.29 3.08 3.86 4.65 6.34 8.32
213.99 4.33 1.68 School 2.91 3.45 3.90 4.12 4.33 4.54 4.75 5.21 5.74
80 222.56 2.70 6.23 Student -2.54 -0.57 1.12 1.91 2.70 3.48 4.27 5.96 7.94
215.07 4.26 1.68 School 2.84 3.38 3.83 4.05 4.26 4.47 4.68 5.14 5.67
85 225.56 2.25 6.23 Student -2.99 -1.01 0.68 1.47 2.25 3.04 3.83 5.52 7.49
216.34 4.18 1.68 School 2.76 3.30 3.75 3.97 4.18 4.39 4.60 5.06 5.59
90 229.33 1.70 6.23 Student -3.54 -1.57 0.12 0.92 1.70 2.48 3.28 4.96 6.94
217.93 4.08 1.68 School 2.66 3.19 3.65 3.86 4.08 4.29 4.50 4.96 5.49
CGI - Conditional Growth Index CGP - Conditional Growth Percentile
287

Table E.2.36: Reading Grade 6 From Last Spring To Spring Conditional Growth Percentile
Conditional Growth
Start Status Growth CGP 20 30 40 45 50 55 60 70 80
%ile RIT Mean SD CGI -0.84 -0.52 -0.25 -0.13 0.00 0.13 0.25 0.52 0.84
10 191.15 8.01 6.87 Student 2.23 4.41 6.27 7.15 8.01 8.87 9.75 11.61 13.79
202.83 5.11 2.08 School 3.36 4.02 4.58 4.85 5.11 5.37 5.64 6.20 6.86
20 198.15 6.70 6.87 Student 0.92 3.10 4.96 5.84 6.70 7.57 8.44 10.31 12.48
205.82 4.80 2.08 School 3.05 3.71 4.27 4.54 4.80 5.06 5.32 5.89 6.55
25 200.81 6.21 6.87 Student 0.43 2.60 4.47 5.34 6.21 7.07 7.95 9.81 11.99
206.96 4.68 2.08 School 2.93 3.59 4.15 4.42 4.68 4.94 5.21 5.77 6.43
30 203.20 5.76 6.87 Student -0.02 2.16 4.02 4.90 5.76 6.62 7.50 9.36 11.54
207.98 4.57 2.08 School 2.82 3.48 4.05 4.31 4.57 4.83 5.10 5.66 6.32
35 205.42 5.35 6.87 Student -0.43 1.75 3.61 4.48 5.35 6.21 7.09 8.95 11.13
208.93 4.47 2.08 School 2.72 3.38 3.95 4.21 4.47 4.74 5.00 5.57 6.23
40 207.52 4.95 6.87 Student -0.83 1.35 3.21 4.09 4.95 5.82 6.70 8.56 10.74
209.83 4.38 2.08 School 2.63 3.29 3.85 4.12 4.38 4.64 4.91 5.47 6.13
45 209.55 4.58 6.87 Student -1.21 0.97 2.84 3.71 4.58 5.44 6.32 8.18 10.36
210.69 4.29 2.08 School 2.54 3.20 3.76 4.03 4.29 4.55 4.82 5.38 6.04
48 210.75 4.35 6.87 Student -1.43 0.75 2.61 3.49 4.35 5.21 6.09 7.95 10.13
211.21 4.24 2.08 School 2.49 3.15 3.71 3.98 4.24 4.50 4.76 5.33 5.99
50 211.55 4.20 6.87 Student -1.58 0.60 2.46 3.34 4.20 5.07 5.94 7.80 9.98
211.55 4.20 2.08 School 2.45 3.11 3.67 3.94 4.20 4.46 4.73 5.29 5.95
52 212.35 4.05 6.87 Student -1.73 0.45 2.31 3.19 4.05 4.92 5.79 7.65 9.83
211.89 4.17 2.08 School 2.42 3.08 3.64 3.90 4.17 4.43 4.69 5.26 5.92
55 213.55 3.83 6.87 Student -1.95 0.23 2.09 2.97 3.83 4.69 5.57 7.43 9.61
212.40 4.11 2.08 School 2.36 3.02 3.59 3.85 4.11 4.37 4.64 5.20 5.86
60 215.58 3.45 6.87 Student -2.33 -0.15 1.71 2.59 3.45 4.31 5.19 7.05 9.23
213.27 4.02 2.08 School 2.27 2.93 3.50 3.76 4.02 4.28 4.55 5.11 5.77
65 217.68 3.06 6.87 Student -2.72 -0.55 1.32 2.19 3.06 3.92 4.80 6.66 8.84
214.17 3.93 2.08 School 2.18 2.84 3.40 3.67 3.93 4.19 4.46 5.02 5.68
70 219.90 2.64 6.87 Student -3.14 -0.96 0.90 1.78 2.64 3.51 4.38 6.25 8.42
215.12 3.83 2.08 School 2.08 2.74 3.30 3.57 3.83 4.09 4.36 4.92 5.58
75 222.29 2.20 6.87 Student -3.58 -1.40 0.46 1.33 2.20 3.06 3.94 5.80 7.98
216.14 3.72 2.08 School 1.97 2.63 3.20 3.46 3.72 3.99 4.25 4.82 5.48
80 224.95 1.70 6.87 Student -4.08 -1.90 -0.04 0.84 1.70 2.56 3.44 5.30 7.48
217.28 3.61 2.08 School 1.86 2.52 3.08 3.35 3.61 3.87 4.13 4.70 5.36
85 228.05 1.12 6.87 Student -4.66 -2.48 -0.62 0.26 1.12 1.98 2.86 4.72 6.90
218.60 3.47 2.08 School 1.72 2.38 2.94 3.21 3.47 3.73 4.00 4.56 5.22
90 231.95 0.39 6.87 Student -5.39 -3.21 -1.35 -0.47 0.39 1.26 2.13 3.99 6.17
220.27 3.30 2.08 School 1.54 2.20 2.77 3.03 3.30 3.56 3.82 4.39 5.05
CGI - Conditional Growth Index CGP - Conditional Growth Percentile
288
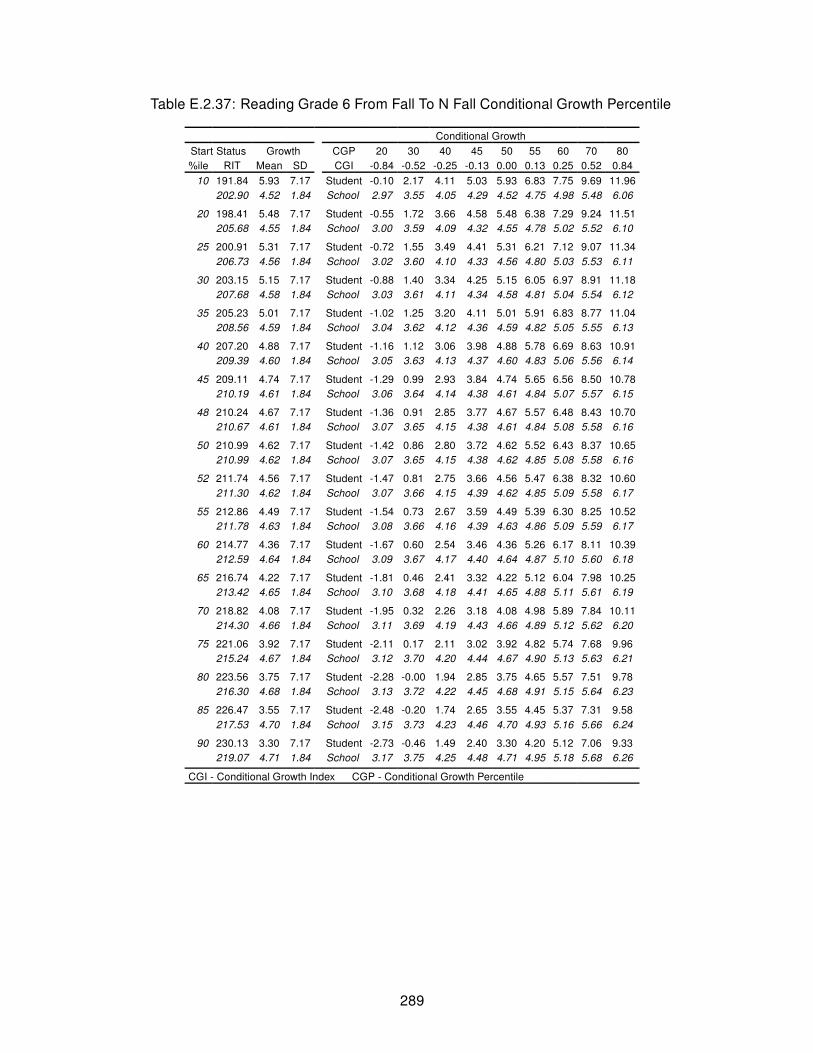
Table E.2.37: Reading Grade 6 From Fall To N Fall Conditional Growth Percentile
Conditional Growth
Start Status Growth CGP 20 30 40 45 50 55 60 70 80
%ile RIT Mean SD CGI -0.84 -0.52 -0.25 -0.13 0.00 0.13 0.25 0.52 0.84
10 191.84 5.93 7.17 Student -0.10 2.17 4.11 5.03 5.93 6.83 7.75 9.69 11.96
202.90 4.52 1.84 School 2.97 3.55 4.05 4.29 4.52 4.75 4.98 5.48 6.06
20 198.41 5.48 7.17 Student -0.55 1.72 3.66 4.58 5.48 6.38 7.29 9.24 11.51
205.68 4.55 1.84 School 3.00 3.59 4.09 4.32 4.55 4.78 5.02 5.52 6.10
25 200.91 5.31 7.17 Student -0.72 1.55 3.49 4.41 5.31 6.21 7.12 9.07 11.34
206.73 4.56 1.84 School 3.02 3.60 4.10 4.33 4.56 4.80 5.03 5.53 6.11
30 203.15 5.15 7.17 Student -0.88 1.40 3.34 4.25 5.15 6.05 6.97 8.91 11.18
207.68 4.58 1.84 School 3.03 3.61 4.11 4.34 4.58 4.81 5.04 5.54 6.12
35 205.23 5.01 7.17 Student -1.02 1.25 3.20 4.11 5.01 5.91 6.83 8.77 11.04
208.56 4.59 1.84 School 3.04 3.62 4.12 4.36 4.59 4.82 5.05 5.55 6.13
40 207.20 4.88 7.17 Student -1.16 1.12 3.06 3.98 4.88 5.78 6.69 8.63 10.91
209.39 4.60 1.84 School 3.05 3.63 4.13 4.37 4.60 4.83 5.06 5.56 6.14
45 209.11 4.74 7.17 Student -1.29 0.99 2.93 3.84 4.74 5.65 6.56 8.50 10.78
210.19 4.61 1.84 School 3.06 3.64 4.14 4.38 4.61 4.84 5.07 5.57 6.15
48 210.24 4.67 7.17 Student -1.36 0.91 2.85 3.77 4.67 5.57 6.48 8.43 10.70
210.67 4.61 1.84 School 3.07 3.65 4.15 4.38 4.61 4.84 5.08 5.58 6.16
50 210.99 4.62 7.17 Student -1.42 0.86 2.80 3.72 4.62 5.52 6.43 8.37 10.65
210.99 4.62 1.84 School 3.07 3.65 4.15 4.38 4.62 4.85 5.08 5.58 6.16
52 211.74 4.56 7.17 Student -1.47 0.81 2.75 3.66 4.56 5.47 6.38 8.32 10.60
211.30 4.62 1.84 School 3.07 3.66 4.15 4.39 4.62 4.85 5.09 5.58 6.17
55 212.86 4.49 7.17 Student -1.54 0.73 2.67 3.59 4.49 5.39 6.30 8.25 10.52
211.78 4.63 1.84 School 3.08 3.66 4.16 4.39 4.63 4.86 5.09 5.59 6.17
60 214.77 4.36 7.17 Student -1.67 0.60 2.54 3.46 4.36 5.26 6.17 8.11 10.39
212.59 4.64 1.84 School 3.09 3.67 4.17 4.40 4.64 4.87 5.10 5.60 6.18
65 216.74 4.22 7.17 Student -1.81 0.46 2.41 3.32 4.22 5.12 6.04 7.98 10.25
213.42 4.65 1.84 School 3.10 3.68 4.18 4.41 4.65 4.88 5.11 5.61 6.19
70 218.82 4.08 7.17 Student -1.95 0.32 2.26 3.18 4.08 4.98 5.89 7.84 10.11
214.30 4.66 1.84 School 3.11 3.69 4.19 4.43 4.66 4.89 5.12 5.62 6.20
75 221.06 3.92 7.17 Student -2.11 0.17 2.11 3.02 3.92 4.82 5.74 7.68 9.96
215.24 4.67 1.84 School 3.12 3.70 4.20 4.44 4.67 4.90 5.13 5.63 6.21
80 223.56 3.75 7.17 Student -2.28 -0.00 1.94 2.85 3.75 4.65 5.57 7.51 9.78
216.30 4.68 1.84 School 3.13 3.72 4.22 4.45 4.68 4.91 5.15 5.64 6.23
85 226.47 3.55 7.17 Student -2.48 -0.20 1.74 2.65 3.55 4.45 5.37 7.31 9.58
217.53 4.70 1.84 School 3.15 3.73 4.23 4.46 4.70 4.93 5.16 5.66 6.24
90 230.13 3.30 7.17 Student -2.73 -0.46 1.49 2.40 3.30 4.20 5.12 7.06 9.33
219.07 4.71 1.84 School 3.17 3.75 4.25 4.48 4.71 4.95 5.18 5.68 6.26
CGI - Conditional Growth Index CGP - Conditional Growth Percentile
289

Table E.2.38: Reading Grade 6 From Fall To Spring Conditional Growth Percentile
Conditional Growth
Start Status Growth CGP 20 30 40 45 50 55 60 70 80
%ile RIT Mean SD CGI -0.84 -0.52 -0.25 -0.13 0.00 0.13 0.25 0.52 0.84
10 191.84 7.34 6.91 Student 1.53 3.72 5.59 6.47 7.34 8.21 9.09 10.96 13.16
202.90 4.97 1.91 School 3.36 3.96 4.48 4.73 4.97 5.21 5.45 5.97 6.58
20 198.41 6.46 6.91 Student 0.65 2.84 4.71 5.59 6.46 7.33 8.21 10.08 12.27
205.68 4.90 1.91 School 3.29 3.89 4.41 4.66 4.90 5.14 5.38 5.90 6.51
25 200.91 6.12 6.91 Student 0.31 2.50 4.37 5.25 6.12 6.99 7.87 9.74 11.93
206.73 4.87 1.91 School 3.26 3.87 4.39 4.63 4.87 5.11 5.36 5.87 6.48
30 203.15 5.82 6.91 Student 0.01 2.20 4.07 4.95 5.82 6.69 7.57 9.44 11.63
207.68 4.85 1.91 School 3.24 3.84 4.36 4.61 4.85 5.09 5.33 5.85 6.46
35 205.23 5.54 6.91 Student -0.27 1.92 3.79 4.67 5.54 6.41 7.29 9.16 11.35
208.56 4.83 1.91 School 3.22 3.82 4.34 4.59 4.83 5.07 5.31 5.83 6.44
40 207.20 5.27 6.91 Student -0.54 1.65 3.52 4.41 5.27 6.14 7.02 8.90 11.09
209.39 4.80 1.91 School 3.19 3.80 4.32 4.56 4.80 5.04 5.29 5.81 6.41
45 209.11 5.02 6.91 Student -0.80 1.40 3.27 4.15 5.02 5.89 6.77 8.64 10.83
210.19 4.78 1.91 School 3.17 3.78 4.30 4.54 4.78 5.02 5.27 5.79 6.39
48 210.24 4.87 6.91 Student -0.95 1.24 3.12 4.00 4.87 5.73 6.62 8.49 10.68
210.67 4.77 1.91 School 3.16 3.77 4.29 4.53 4.77 5.01 5.26 5.78 6.38
50 210.99 4.76 6.91 Student -1.05 1.14 3.01 3.90 4.76 5.63 6.51 8.39 10.58
210.99 4.76 1.91 School 3.15 3.76 4.28 4.52 4.76 5.00 5.25 5.77 6.37
52 211.74 4.66 6.91 Student -1.15 1.04 2.91 3.80 4.66 5.53 6.41 8.29 10.48
211.30 4.76 1.91 School 3.15 3.75 4.27 4.52 4.76 5.00 5.24 5.76 6.37
55 212.86 4.51 6.91 Student -1.30 0.89 2.76 3.64 4.51 5.38 6.26 8.13 10.32
211.78 4.74 1.91 School 3.13 3.74 4.26 4.50 4.74 4.98 5.23 5.75 6.35
60 214.77 4.25 6.91 Student -1.56 0.63 2.51 3.39 4.25 5.12 6.00 7.88 10.07
212.59 4.72 1.91 School 3.11 3.72 4.24 4.48 4.72 4.96 5.21 5.73 6.33
65 216.74 3.99 6.91 Student -1.82 0.37 2.24 3.12 3.99 4.86 5.74 7.61 9.80
213.42 4.70 1.91 School 3.09 3.70 4.22 4.46 4.70 4.94 5.19 5.71 6.31
70 218.82 3.71 6.91 Student -2.10 0.09 1.96 2.84 3.71 4.58 5.46 7.33 9.52
214.30 4.68 1.91 School 3.07 3.68 4.20 4.44 4.68 4.92 5.17 5.68 6.29
75 221.06 3.41 6.91 Student -2.41 -0.21 1.66 2.54 3.41 4.28 5.16 7.03 9.22
215.24 4.66 1.91 School 3.05 3.65 4.17 4.42 4.66 4.90 5.14 5.66 6.27
80 223.56 3.07 6.91 Student -2.74 -0.55 1.32 2.20 3.07 3.94 4.82 6.69 8.88
216.30 4.63 1.91 School 3.02 3.63 4.15 4.39 4.63 4.87 5.12 5.63 6.24
85 226.47 2.68 6.91 Student -3.13 -0.94 0.93 1.81 2.68 3.55 4.43 6.30 8.49
217.53 4.60 1.91 School 2.99 3.60 4.12 4.36 4.60 4.84 5.09 5.60 6.21
90 230.13 2.19 6.91 Student -3.63 -1.44 0.44 1.32 2.19 3.05 3.94 5.81 8.00
219.07 4.56 1.91 School 2.95 3.56 4.08 4.32 4.56 4.80 5.05 5.56 6.17
CGI - Conditional Growth Index CGP - Conditional Growth Percentile
290
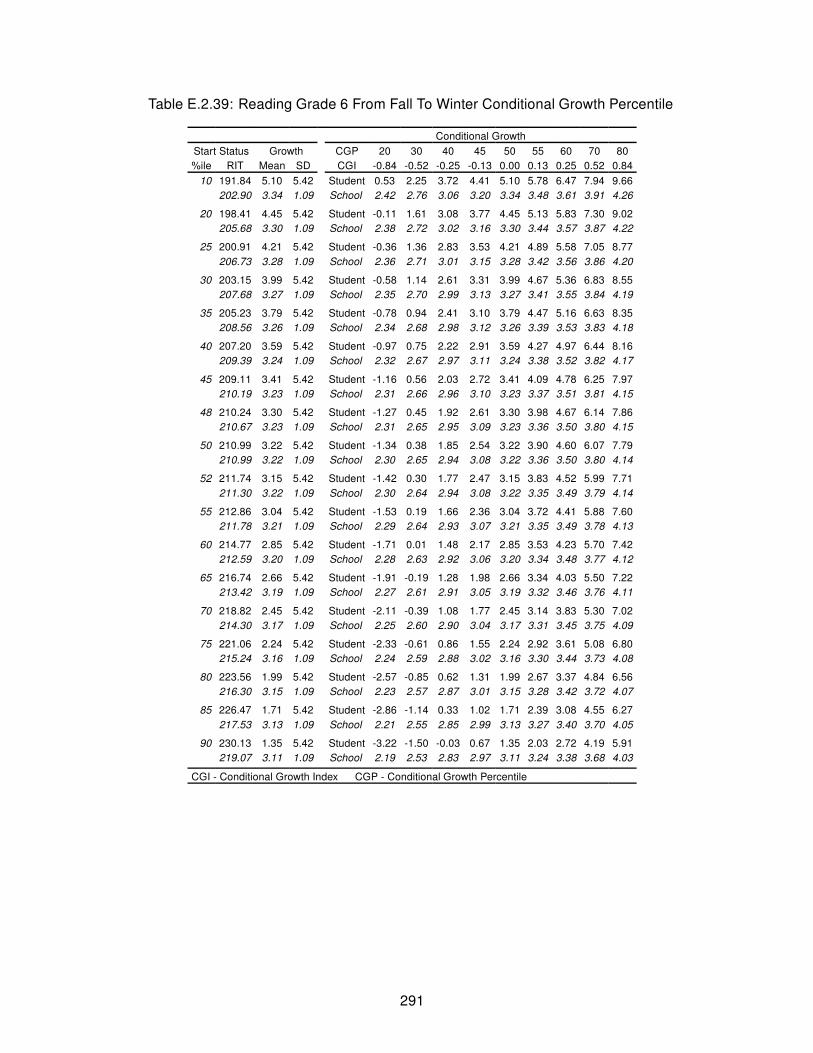
Table E.2.39: Reading Grade 6 From Fall To Winter Conditional Growth Percentile
Conditional Growth
Start Status Growth CGP 20 30 40 45 50 55 60 70 80
%ile RIT Mean SD CGI -0.84 -0.52 -0.25 -0.13 0.00 0.13 0.25 0.52 0.84
10 191.84 5.10 5.42 Student 0.53 2.25 3.72 4.41 5.10 5.78 6.47 7.94 9.66
202.90 3.34 1.09 School 2.42 2.76 3.06 3.20 3.34 3.48 3.61 3.91 4.26
20 198.41 4.45 5.42 Student -0.11 1.61 3.08 3.77 4.45 5.13 5.83 7.30 9.02
205.68 3.30 1.09 School 2.38 2.72 3.02 3.16 3.30 3.44 3.57 3.87 4.22
25 200.91 4.21 5.42 Student -0.36 1.36 2.83 3.53 4.21 4.89 5.58 7.05 8.77
206.73 3.28 1.09 School 2.36 2.71 3.01 3.15 3.28 3.42 3.56 3.86 4.20
30 203.15 3.99 5.42 Student -0.58 1.14 2.61 3.31 3.99 4.67 5.36 6.83 8.55
207.68 3.27 1.09 School 2.35 2.70 2.99 3.13 3.27 3.41 3.55 3.84 4.19
35 205.23 3.79 5.42 Student -0.78 0.94 2.41 3.10 3.79 4.47 5.16 6.63 8.35
208.56 3.26 1.09 School 2.34 2.68 2.98 3.12 3.26 3.39 3.53 3.83 4.18
40 207.20 3.59 5.42 Student -0.97 0.75 2.22 2.91 3.59 4.27 4.97 6.44 8.16
209.39 3.24 1.09 School 2.32 2.67 2.97 3.11 3.24 3.38 3.52 3.82 4.17
45 209.11 3.41 5.42 Student -1.16 0.56 2.03 2.72 3.41 4.09 4.78 6.25 7.97
210.19 3.23 1.09 School 2.31 2.66 2.96 3.10 3.23 3.37 3.51 3.81 4.15
48 210.24 3.30 5.42 Student -1.27 0.45 1.92 2.61 3.30 3.98 4.67 6.14 7.86
210.67 3.23 1.09 School 2.31 2.65 2.95 3.09 3.23 3.36 3.50 3.80 4.15
50 210.99 3.22 5.42 Student -1.34 0.38 1.85 2.54 3.22 3.90 4.60 6.07 7.79
210.99 3.22 1.09 School 2.30 2.65 2.94 3.08 3.22 3.36 3.50 3.80 4.14
52 211.74 3.15 5.42 Student -1.42 0.30 1.77 2.47 3.15 3.83 4.52 5.99 7.71
211.30 3.22 1.09 School 2.30 2.64 2.94 3.08 3.22 3.35 3.49 3.79 4.14
55 212.86 3.04 5.42 Student -1.53 0.19 1.66 2.36 3.04 3.72 4.41 5.88 7.60
211.78 3.21 1.09 School 2.29 2.64 2.93 3.07 3.21 3.35 3.49 3.78 4.13
60 214.77 2.85 5.42 Student -1.71 0.01 1.48 2.17 2.85 3.53 4.23 5.70 7.42
212.59 3.20 1.09 School 2.28 2.63 2.92 3.06 3.20 3.34 3.48 3.77 4.12
65 216.74 2.66 5.42 Student -1.91 -0.19 1.28 1.98 2.66 3.34 4.03 5.50 7.22
213.42 3.19 1.09 School 2.27 2.61 2.91 3.05 3.19 3.32 3.46 3.76 4.11
70 218.82 2.45 5.42 Student -2.11 -0.39 1.08 1.77 2.45 3.14 3.83 5.30 7.02
214.30 3.17 1.09 School 2.25 2.60 2.90 3.04 3.17 3.31 3.45 3.75 4.09
75 221.06 2.24 5.42 Student -2.33 -0.61 0.86 1.55 2.24 2.92 3.61 5.08 6.80
215.24 3.16 1.09 School 2.24 2.59 2.88 3.02 3.16 3.30 3.44 3.73 4.08
80 223.56 1.99 5.42 Student -2.57 -0.85 0.62 1.31 1.99 2.67 3.37 4.84 6.56
216.30 3.15 1.09 School 2.23 2.57 2.87 3.01 3.15 3.28 3.42 3.72 4.07
85 226.47 1.71 5.42 Student -2.86 -1.14 0.33 1.02 1.71 2.39 3.08 4.55 6.27
217.53 3.13 1.09 School 2.21 2.55 2.85 2.99 3.13 3.27 3.40 3.70 4.05
90 230.13 1.35 5.42 Student -3.22 -1.50 -0.03 0.67 1.35 2.03 2.72 4.19 5.91
219.07 3.11 1.09 School 2.19 2.53 2.83 2.97 3.11 3.24 3.38 3.68 4.03
CGI - Conditional Growth Index CGP - Conditional Growth Percentile
291

Table E.2.40: Reading Grade 6 From Winter To Spring Conditional Growth Percentile
Conditional Growth
Start Status Growth CGP 20 30 40 45 50 55 60 70 80
%ile RIT Mean SD CGI -0.84 -0.52 -0.25 -0.13 0.00 0.13 0.25 0.52 0.84
10 195.59 2.58 5.16 Student -1.76 -0.13 1.27 1.93 2.58 3.23 3.89 5.29 6.92
206.12 1.45 0.82 School 0.76 1.02 1.24 1.34 1.45 1.55 1.65 1.88 2.14
20 201.98 2.22 5.16 Student -2.12 -0.48 0.92 1.58 2.22 2.87 3.53 4.93 6.57
208.89 1.48 0.82 School 0.79 1.05 1.27 1.38 1.48 1.58 1.69 1.91 2.17
25 204.41 2.09 5.16 Student -2.25 -0.62 0.78 1.44 2.09 2.74 3.40 4.80 6.43
209.95 1.49 0.82 School 0.80 1.06 1.28 1.39 1.49 1.60 1.70 1.92 2.18
30 206.59 1.97 5.16 Student -2.38 -0.74 0.66 1.32 1.97 2.62 3.27 4.67 6.31
210.90 1.50 0.82 School 0.81 1.07 1.30 1.40 1.50 1.61 1.71 1.93 2.19
35 208.61 1.85 5.16 Student -2.49 -0.85 0.55 1.21 1.85 2.50 3.16 4.56 6.20
211.78 1.51 0.82 School 0.82 1.08 1.31 1.41 1.51 1.62 1.72 1.94 2.20
40 210.53 1.75 5.16 Student -2.60 -0.96 0.44 1.10 1.75 2.40 3.06 4.45 6.09
212.61 1.52 0.82 School 0.83 1.09 1.32 1.42 1.52 1.63 1.73 1.95 2.21
45 212.38 1.64 5.16 Student -2.70 -1.06 0.34 1.00 1.64 2.29 2.95 4.35 5.99
213.41 1.53 0.82 School 0.84 1.10 1.33 1.43 1.53 1.64 1.74 1.96 2.22
48 213.48 1.58 5.16 Student -2.76 -1.12 0.28 0.93 1.58 2.23 2.89 4.29 5.93
213.89 1.54 0.82 School 0.85 1.11 1.33 1.44 1.54 1.64 1.75 1.97 2.23
50 214.21 1.54 5.16 Student -2.80 -1.16 0.24 0.89 1.54 2.19 2.85 4.25 5.89
214.21 1.54 0.82 School 0.85 1.11 1.33 1.44 1.54 1.65 1.75 1.97 2.23
52 214.94 1.50 5.16 Student -2.84 -1.20 0.19 0.85 1.50 2.15 2.81 4.21 5.85
214.53 1.55 0.82 School 0.86 1.12 1.34 1.44 1.55 1.65 1.75 1.98 2.24
55 216.03 1.44 5.16 Student -2.90 -1.27 0.13 0.79 1.44 2.09 2.75 4.15 5.78
215.00 1.55 0.82 School 0.86 1.12 1.34 1.45 1.55 1.66 1.76 1.98 2.24
60 217.89 1.34 5.16 Student -3.01 -1.37 0.03 0.69 1.34 1.99 2.64 4.04 5.68
215.81 1.56 0.82 School 0.87 1.13 1.35 1.46 1.56 1.66 1.77 1.99 2.25
65 219.81 1.23 5.16 Student -3.11 -1.48 -0.08 0.58 1.23 1.88 2.54 3.94 5.57
216.64 1.57 0.82 School 0.88 1.14 1.36 1.47 1.57 1.67 1.78 2.00 2.26
70 221.83 1.12 5.16 Student -3.23 -1.59 -0.19 0.47 1.12 1.77 2.43 3.82 5.46
217.52 1.58 0.82 School 0.89 1.15 1.37 1.48 1.58 1.69 1.79 2.01 2.27
75 224.01 1.00 5.16 Student -3.35 -1.71 -0.31 0.35 1.00 1.64 2.30 3.70 5.34
218.47 1.59 0.82 School 0.90 1.16 1.39 1.49 1.59 1.70 1.80 2.02 2.28
80 226.44 0.86 5.16 Student -3.48 -1.84 -0.45 0.21 0.86 1.51 2.17 3.57 5.20
219.52 1.61 0.82 School 0.92 1.18 1.40 1.50 1.61 1.71 1.81 2.04 2.30
85 229.27 0.70 5.16 Student -3.64 -2.00 -0.60 0.05 0.70 1.35 2.01 3.41 5.05
220.75 1.62 0.82 School 0.93 1.19 1.41 1.52 1.62 1.72 1.83 2.05 2.31
90 232.83 0.50 5.16 Student -3.84 -2.20 -0.80 -0.14 0.50 1.15 1.81 3.21 4.85
222.30 1.64 0.82 School 0.95 1.21 1.43 1.54 1.64 1.74 1.85 2.07 2.33
CGI - Conditional Growth Index CGP - Conditional Growth Percentile
292

Table E.2.41: Reading Grade 7 From Last Winter To Winter Conditional Growth Percentile
Conditional Growth
Start Status Growth CGP 20 30 40 45 50 55 60 70 80
%ile RIT Mean SD CGI -0.84 -0.52 -0.25 -0.13 0.00 0.13 0.25 0.52 0.84
10 192.96 6.29 5.87 Student 1.35 3.21 4.80 5.55 6.29 7.02 7.77 9.36 11.23
204.21 4.50 1.48 School 3.25 3.72 4.12 4.31 4.50 4.68 4.87 5.27 5.74
20 199.82 5.49 5.87 Student 0.55 2.41 4.00 4.75 5.49 6.23 6.98 8.57 10.43
207.20 4.32 1.48 School 3.07 3.54 3.94 4.13 4.32 4.50 4.69 5.09 5.56
25 202.43 5.19 5.87 Student 0.25 2.11 3.70 4.45 5.19 5.93 6.68 8.27 10.13
208.34 4.25 1.48 School 3.00 3.47 3.87 4.06 4.25 4.43 4.62 5.02 5.49
30 204.77 4.92 5.87 Student -0.02 1.84 3.43 4.18 4.92 5.66 6.40 8.00 9.86
209.37 4.19 1.48 School 2.94 3.41 3.81 4.00 4.19 4.37 4.56 4.96 5.43
35 206.93 4.67 5.87 Student -0.27 1.59 3.18 3.93 4.67 5.40 6.15 7.74 9.61
210.31 4.13 1.48 School 2.88 3.35 3.75 3.94 4.13 4.32 4.50 4.91 5.38
40 208.99 4.43 5.87 Student -0.51 1.35 2.94 3.69 4.43 5.17 5.92 7.51 9.37
211.21 4.07 1.48 School 2.83 3.30 3.70 3.89 4.07 4.26 4.45 4.85 5.32
45 210.98 4.20 5.87 Student -0.74 1.12 2.71 3.46 4.20 4.93 5.68 7.28 9.14
212.08 4.02 1.48 School 2.78 3.25 3.65 3.84 4.02 4.21 4.40 4.80 5.27
48 212.16 4.06 5.87 Student -0.88 0.98 2.57 3.32 4.06 4.80 5.55 7.14 9.00
212.60 3.99 1.48 School 2.74 3.21 3.62 3.80 3.99 4.18 4.37 4.77 5.24
50 212.94 3.97 5.87 Student -0.97 0.89 2.48 3.23 3.97 4.71 5.46 7.05 8.91
212.94 3.97 1.48 School 2.72 3.19 3.60 3.78 3.97 4.16 4.35 4.75 5.22
52 213.72 3.88 5.87 Student -1.06 0.80 2.39 3.14 3.88 4.62 5.37 6.96 8.82
213.28 3.95 1.48 School 2.70 3.17 3.57 3.76 3.95 4.14 4.32 4.73 5.20
55 214.90 3.74 5.87 Student -1.20 0.67 2.26 3.01 3.74 4.48 5.23 6.82 8.68
213.80 3.92 1.48 School 2.67 3.14 3.54 3.73 3.92 4.10 4.29 4.70 5.16
60 216.89 3.51 5.87 Student -1.43 0.43 2.03 2.78 3.51 4.25 5.00 6.59 8.45
214.67 3.87 1.48 School 2.62 3.09 3.49 3.68 3.87 4.05 4.24 4.64 5.11
65 218.95 3.27 5.87 Student -1.67 0.20 1.79 2.54 3.27 4.01 4.76 6.35 8.21
215.57 3.81 1.48 School 2.57 3.04 3.44 3.63 3.81 4.00 4.19 4.59 5.06
70 221.12 3.02 5.87 Student -1.92 -0.05 1.54 2.29 3.02 3.76 4.51 6.10 7.96
216.52 3.75 1.48 School 2.51 2.98 3.38 3.57 3.75 3.94 4.13 4.53 5.00
75 223.46 2.75 5.87 Student -2.19 -0.33 1.26 2.01 2.75 3.49 4.24 5.83 7.69
217.54 3.69 1.48 School 2.45 2.92 3.32 3.51 3.69 3.88 4.07 4.47 4.94
80 226.06 2.45 5.87 Student -2.49 -0.63 0.96 1.71 2.45 3.19 3.94 5.53 7.39
218.68 3.62 1.48 School 2.38 2.85 3.25 3.44 3.62 3.81 4.00 4.40 4.87
85 229.10 2.10 5.87 Student -2.84 -0.98 0.61 1.36 2.10 2.84 3.58 5.18 7.04
220.00 3.54 1.48 School 2.30 2.77 3.17 3.36 3.54 3.73 3.92 4.32 4.79
90 232.92 1.65 5.87 Student -3.28 -1.42 0.17 0.92 1.65 2.39 3.14 4.73 6.59
221.68 3.44 1.48 School 2.20 2.67 3.07 3.26 3.44 3.63 3.82 4.22 4.69
CGI - Conditional Growth Index CGP - Conditional Growth Percentile
293

Table E.2.42: Reading Grade 7 From Last Spring To Spring Conditional Growth Percentile
Conditional Growth
Start Status Growth CGP 20 30 40 45 50 55 60 70 80
%ile RIT Mean SD CGI -0.84 -0.52 -0.25 -0.13 0.00 0.13 0.25 0.52 0.84
10 193.59 7.10 6.57 Student 1.56 3.65 5.43 6.27 7.10 7.92 8.76 10.54 12.63
205.16 4.80 1.94 School 3.17 3.78 4.31 4.56 4.80 5.05 5.30 5.82 6.44
20 200.71 5.97 6.57 Student 0.44 2.53 4.31 5.15 5.97 6.80 7.64 9.42 11.51
208.31 4.47 1.94 School 2.83 3.45 3.98 4.22 4.47 4.71 4.96 5.49 6.10
25 203.41 5.55 6.57 Student 0.01 2.10 3.88 4.72 5.55 6.37 7.21 8.99 11.08
209.50 4.34 1.94 School 2.71 3.32 3.85 4.10 4.34 4.58 4.83 5.36 5.97
30 205.84 5.16 6.57 Student -0.37 1.72 3.50 4.34 5.16 5.99 6.83 8.61 10.70
210.58 4.23 1.94 School 2.59 3.21 3.73 3.98 4.23 4.47 4.72 5.24 5.86
35 208.09 4.81 6.57 Student -0.72 1.36 3.14 3.98 4.81 5.64 6.47 8.26 10.34
211.57 4.12 1.94 School 2.49 3.10 3.63 3.88 4.12 4.36 4.61 5.14 5.75
40 210.23 4.47 6.57 Student -1.06 1.02 2.81 3.65 4.47 5.30 6.14 7.92 10.01
212.52 4.02 1.94 School 2.38 3.00 3.53 3.78 4.02 4.26 4.51 5.04 5.65
45 212.30 4.15 6.57 Student -1.39 0.70 2.48 3.32 4.15 4.97 5.81 7.59 9.68
213.43 3.92 1.94 School 2.29 2.90 3.43 3.68 3.92 4.17 4.41 4.94 5.56
48 213.52 3.95 6.57 Student -1.58 0.51 2.29 3.13 3.95 4.78 5.62 7.40 9.49
213.97 3.86 1.94 School 2.23 2.85 3.37 3.62 3.86 4.11 4.36 4.88 5.50
50 214.33 3.83 6.57 Student -1.71 0.38 2.16 3.00 3.83 4.65 5.49 7.27 9.36
214.33 3.83 1.94 School 2.19 2.81 3.33 3.58 3.83 4.07 4.32 4.84 5.46
52 215.14 3.70 6.57 Student -1.84 0.25 2.03 2.87 3.70 4.52 5.36 7.15 9.23
214.69 3.79 1.94 School 2.15 2.77 3.30 3.54 3.79 4.03 4.28 4.81 5.42
55 216.37 3.51 6.57 Student -2.03 0.06 1.84 2.68 3.51 4.33 5.17 6.95 9.04
215.23 3.73 1.94 School 2.10 2.71 3.24 3.49 3.73 3.97 4.22 4.75 5.36
60 218.43 3.18 6.57 Student -2.35 -0.27 1.51 2.35 3.18 4.01 4.85 6.63 8.71
216.15 3.63 1.94 School 2.00 2.61 3.14 3.39 3.63 3.88 4.12 4.65 5.27
65 220.57 2.84 6.57 Student -2.69 -0.61 1.18 2.02 2.84 3.67 4.51 6.29 8.38
217.09 3.53 1.94 School 1.90 2.51 3.04 3.29 3.53 3.78 4.02 4.55 5.17
70 222.82 2.49 6.57 Student -3.05 -0.96 0.82 1.66 2.49 3.31 4.15 5.94 8.02
218.09 3.43 1.94 School 1.79 2.41 2.93 3.18 3.43 3.67 3.92 4.44 5.06
75 225.25 2.10 6.57 Student -3.43 -1.34 0.44 1.28 2.10 2.93 3.77 5.55 7.64
219.16 3.31 1.94 School 1.68 2.29 2.82 3.07 3.31 3.56 3.80 4.33 4.95
80 227.96 1.68 6.57 Student -3.86 -1.77 0.01 0.85 1.68 2.50 3.34 5.13 7.21
220.36 3.18 1.94 School 1.55 2.17 2.69 2.94 3.18 3.43 3.68 4.20 4.82
85 231.11 1.18 6.57 Student -4.35 -2.27 -0.48 0.35 1.18 2.01 2.85 4.63 6.71
221.75 3.04 1.94 School 1.40 2.02 2.54 2.79 3.04 3.28 3.53 4.05 4.67
90 235.08 0.56 6.57 Student -4.98 -2.89 -1.11 -0.27 0.56 1.38 2.22 4.00 6.09
223.51 2.85 1.94 School 1.21 1.83 2.36 2.60 2.85 3.09 3.34 3.87 4.48
CGI - Conditional Growth Index CGP - Conditional Growth Percentile
294

Table E.2.43: Reading Grade 7 From Fall To N Fall Conditional Growth Percentile
Conditional Growth
Start Status Growth CGP 20 30 40 45 50 55 60 70 80
%ile RIT Mean SD CGI -0.84 -0.52 -0.25 -0.13 0.00 0.13 0.25 0.52 0.84
10 194.82 5.02 6.77 Student -0.68 1.47 3.30 4.17 5.02 5.87 6.73 8.57 10.71
206.03 3.89 1.67 School 2.49 3.02 3.47 3.68 3.89 4.10 4.32 4.77 5.30
20 201.56 4.64 6.77 Student -1.05 1.10 2.93 3.79 4.64 5.50 6.36 8.19 10.34
208.92 3.91 1.67 School 2.50 3.03 3.48 3.70 3.91 4.12 4.33 4.78 5.31
25 204.12 4.50 6.77 Student -1.19 0.96 2.79 3.65 4.50 5.35 6.22 8.05 10.20
210.02 3.91 1.67 School 2.51 3.04 3.49 3.70 3.91 4.12 4.33 4.79 5.32
30 206.42 4.38 6.77 Student -1.32 0.83 2.66 3.53 4.38 5.23 6.09 7.92 10.07
211.00 3.92 1.67 School 2.51 3.04 3.49 3.71 3.92 4.13 4.34 4.79 5.32
35 208.55 4.26 6.77 Student -1.44 0.71 2.54 3.41 4.26 5.11 5.97 7.81 9.95
211.92 3.92 1.67 School 2.51 3.04 3.50 3.71 3.92 4.13 4.34 4.80 5.33
40 210.57 4.15 6.77 Student -1.55 0.60 2.43 3.30 4.15 5.00 5.86 7.69 9.84
212.78 3.92 1.67 School 2.52 3.05 3.50 3.71 3.92 4.13 4.35 4.80 5.33
45 212.52 4.04 6.77 Student -1.66 0.49 2.32 3.19 4.04 4.89 5.75 7.59 9.73
213.62 3.93 1.67 School 2.52 3.05 3.51 3.72 3.93 4.14 4.35 4.80 5.33
48 213.68 3.97 6.77 Student -1.72 0.43 2.26 3.12 3.97 4.82 5.69 7.52 9.67
214.12 3.93 1.67 School 2.52 3.05 3.51 3.72 3.93 4.14 4.35 4.81 5.34
50 214.45 3.93 6.77 Student -1.76 0.38 2.22 3.08 3.93 4.78 5.65 7.48 9.63
214.45 3.93 1.67 School 2.53 3.06 3.51 3.72 3.93 4.14 4.36 4.81 5.34
52 215.22 3.89 6.77 Student -1.80 0.34 2.18 3.04 3.89 4.74 5.60 7.44 9.58
214.78 3.93 1.67 School 2.53 3.06 3.51 3.72 3.93 4.14 4.36 4.81 5.34
55 216.37 3.83 6.77 Student -1.87 0.28 2.11 2.98 3.83 4.68 5.54 7.37 9.52
215.27 3.94 1.67 School 2.53 3.06 3.51 3.73 3.94 4.15 4.36 4.81 5.34
60 218.33 3.72 6.77 Student -1.98 0.17 2.00 2.87 3.72 4.57 5.43 7.27 9.41
216.11 3.94 1.67 School 2.53 3.06 3.52 3.73 3.94 4.15 4.36 4.82 5.35
65 220.35 3.61 6.77 Student -2.09 0.06 1.89 2.76 3.61 4.46 5.32 7.15 9.30
216.98 3.94 1.67 School 2.54 3.07 3.52 3.73 3.94 4.15 4.37 4.82 5.35
70 222.48 3.49 6.77 Student -2.21 -0.06 1.77 2.64 3.49 4.34 5.20 7.04 9.18
217.89 3.95 1.67 School 2.54 3.07 3.52 3.74 3.95 4.16 4.37 4.82 5.35
75 224.78 3.36 6.77 Student -2.33 -0.19 1.65 2.51 3.36 4.21 5.07 6.91 9.05
218.88 3.95 1.67 School 2.55 3.08 3.53 3.74 3.95 4.16 4.38 4.83 5.36
80 227.34 3.22 6.77 Student -2.48 -0.33 1.50 2.37 3.22 4.07 4.93 6.77 8.91
219.97 3.96 1.67 School 2.55 3.08 3.53 3.75 3.96 4.17 4.38 4.83 5.36
85 230.32 3.05 6.77 Student -2.64 -0.49 1.34 2.20 3.05 3.90 4.77 6.60 8.75
221.25 3.96 1.67 School 2.56 3.09 3.54 3.75 3.96 4.17 4.39 4.84 5.37
90 234.07 2.85 6.77 Student -2.85 -0.70 1.13 2.00 2.85 3.70 4.56 6.39 8.54
222.86 3.97 1.67 School 2.57 3.10 3.55 3.76 3.97 4.18 4.39 4.85 5.38
CGI - Conditional Growth Index CGP - Conditional Growth Percentile
295

Table E.2.44: Reading Grade 7 From Fall To Spring Conditional Growth Percentile
Conditional Growth
Start Status Growth CGP 20 30 40 45 50 55 60 70 80
%ile RIT Mean SD CGI -0.84 -0.52 -0.25 -0.13 0.00 0.13 0.25 0.52 0.84
10 194.82 6.04 6.87 Student 0.26 2.44 4.30 5.18 6.04 6.91 7.78 9.65 11.82
206.03 3.88 1.83 School 2.34 2.92 3.42 3.65 3.88 4.11 4.34 4.84 5.42
20 201.56 5.24 6.87 Student -0.54 1.64 3.50 4.38 5.24 6.11 6.98 8.84 11.02
208.92 3.82 1.83 School 2.29 2.87 3.36 3.59 3.82 4.05 4.29 4.78 5.36
25 204.12 4.94 6.87 Student -0.84 1.34 3.20 4.08 4.94 5.80 6.68 8.54 10.72
210.02 3.80 1.83 School 2.26 2.84 3.34 3.57 3.80 4.03 4.26 4.76 5.34
30 206.42 4.67 6.87 Student -1.12 1.06 2.93 3.80 4.67 5.53 6.41 8.27 10.45
211.00 3.78 1.83 School 2.24 2.82 3.32 3.55 3.78 4.01 4.24 4.74 5.32
35 208.55 4.41 6.87 Student -1.37 0.81 2.67 3.55 4.41 5.27 6.15 8.01 10.19
211.92 3.76 1.83 School 2.22 2.80 3.30 3.53 3.76 3.99 4.22 4.72 5.30
40 210.57 4.17 6.87 Student -1.61 0.57 2.43 3.31 4.17 5.03 5.91 7.77 9.95
212.78 3.74 1.83 School 2.21 2.79 3.28 3.51 3.74 3.97 4.21 4.70 5.28
45 212.52 3.94 6.87 Student -1.84 0.34 2.20 3.08 3.94 4.80 5.68 7.54 9.72
213.62 3.73 1.83 School 2.19 2.77 3.26 3.50 3.73 3.96 4.19 4.68 5.26
48 213.68 3.80 6.87 Student -1.98 0.20 2.06 2.94 3.80 4.66 5.54 7.40 9.58
214.12 3.72 1.83 School 2.18 2.76 3.25 3.49 3.72 3.95 4.18 4.67 5.25
50 214.45 3.71 6.87 Student -2.07 0.11 1.97 2.85 3.71 4.57 5.45 7.31 9.49
214.45 3.71 1.83 School 2.17 2.75 3.25 3.48 3.71 3.94 4.17 4.67 5.25
52 215.22 3.62 6.87 Student -2.16 0.02 1.88 2.76 3.62 4.48 5.36 7.22 9.40
214.78 3.70 1.83 School 2.17 2.75 3.24 3.47 3.70 3.93 4.17 4.66 5.24
55 216.37 3.48 6.87 Student -2.30 -0.12 1.74 2.62 3.48 4.34 5.22 7.08 9.26
215.27 3.69 1.83 School 2.16 2.74 3.23 3.46 3.69 3.92 4.16 4.65 5.23
60 218.33 3.25 6.87 Student -2.53 -0.35 1.51 2.39 3.25 4.11 4.99 6.85 9.03
216.11 3.68 1.83 School 2.14 2.72 3.21 3.45 3.68 3.91 4.14 4.63 5.21
65 220.35 3.01 6.87 Student -2.77 -0.59 1.27 2.15 3.01 3.87 4.75 6.61 8.79
216.98 3.66 1.83 School 2.12 2.70 3.20 3.43 3.66 3.89 4.12 4.62 5.20
70 222.48 2.75 6.87 Student -3.03 -0.85 1.01 1.89 2.75 3.62 4.49 6.36 8.54
217.89 3.64 1.83 School 2.10 2.68 3.18 3.41 3.64 3.87 4.10 4.60 5.18
75 224.78 2.48 6.87 Student -3.30 -1.12 0.74 1.62 2.48 3.34 4.22 6.08 8.26
218.88 3.62 1.83 School 2.08 2.66 3.16 3.39 3.62 3.85 4.08 4.58 5.16
80 227.34 2.18 6.87 Student -3.60 -1.42 0.44 1.31 2.18 3.04 3.92 5.78 7.96
219.97 3.60 1.83 School 2.06 2.64 3.13 3.37 3.60 3.83 4.06 4.55 5.13
85 230.32 1.82 6.87 Student -3.96 -1.78 0.08 0.96 1.82 2.69 3.56 5.42 7.60
221.25 3.57 1.83 School 2.03 2.61 3.11 3.34 3.57 3.80 4.03 4.53 5.11
90 234.07 1.38 6.87 Student -4.40 -2.23 -0.36 0.51 1.38 2.24 3.12 4.98 7.16
222.86 3.54 1.83 School 2.00 2.58 3.08 3.31 3.54 3.77 4.00 4.50 5.08
CGI - Conditional Growth Index CGP - Conditional Growth Percentile
296

Table E.2.45: Reading Grade 7 From Fall To Winter Conditional Growth Percentile
Conditional Growth
Start Status Growth CGP 20 30 40 45 50 55 60 70 80
%ile RIT Mean SD CGI -0.84 -0.52 -0.25 -0.13 0.00 0.13 0.25 0.52 0.84
10 194.82 4.19 5.42 Student -0.37 1.35 2.82 3.51 4.19 4.87 5.56 7.03 8.75
206.03 2.56 1.04 School 1.68 2.01 2.30 2.43 2.56 2.69 2.83 3.11 3.44
20 201.56 3.60 5.42 Student -0.96 0.75 2.22 2.91 3.60 4.28 4.97 6.44 8.15
208.92 2.53 1.04 School 1.65 1.98 2.26 2.40 2.53 2.66 2.79 3.07 3.41
25 204.12 3.37 5.42 Student -1.19 0.53 2.00 2.69 3.37 4.05 4.74 6.21 7.93
210.02 2.51 1.04 School 1.64 1.97 2.25 2.38 2.51 2.65 2.78 3.06 3.39
30 206.42 3.17 5.42 Student -1.39 0.33 1.80 2.49 3.17 3.85 4.54 6.01 7.73
211.00 2.50 1.04 School 1.62 1.96 2.24 2.37 2.50 2.63 2.77 3.05 3.38
35 208.55 2.98 5.42 Student -1.58 0.14 1.61 2.30 2.98 3.66 4.35 5.82 7.54
211.92 2.49 1.04 School 1.61 1.95 2.23 2.36 2.49 2.62 2.76 3.04 3.37
40 210.57 2.80 5.42 Student -1.76 -0.04 1.43 2.12 2.80 3.48 4.18 5.64 7.36
212.78 2.48 1.04 School 1.60 1.94 2.22 2.35 2.48 2.61 2.75 3.03 3.36
45 212.52 2.63 5.42 Student -1.93 -0.21 1.26 1.95 2.63 3.31 4.00 5.47 7.19
213.62 2.47 1.04 School 1.59 1.93 2.21 2.34 2.47 2.60 2.74 3.02 3.35
48 213.68 2.53 5.42 Student -2.03 -0.31 1.16 1.85 2.53 3.21 3.90 5.37 7.09
214.12 2.47 1.04 School 1.59 1.92 2.20 2.34 2.47 2.60 2.73 3.01 3.35
50 214.45 2.46 5.42 Student -2.10 -0.38 1.09 1.78 2.46 3.14 3.84 5.30 7.02
214.45 2.46 1.04 School 1.58 1.92 2.20 2.33 2.46 2.59 2.73 3.01 3.34
52 215.22 2.40 5.42 Student -2.16 -0.45 1.02 1.71 2.40 3.08 3.77 5.24 6.95
214.78 2.46 1.04 School 1.58 1.91 2.19 2.33 2.46 2.59 2.72 3.01 3.34
55 216.37 2.29 5.42 Student -2.27 -0.55 0.92 1.61 2.29 2.97 3.67 5.13 6.85
215.27 2.45 1.04 School 1.57 1.91 2.19 2.32 2.45 2.58 2.72 3.00 3.33
60 218.33 2.12 5.42 Student -2.44 -0.72 0.75 1.44 2.12 2.80 3.49 4.96 6.68
216.11 2.44 1.04 School 1.57 1.90 2.18 2.31 2.44 2.57 2.71 2.99 3.32
65 220.35 1.94 5.42 Student -2.61 -0.90 0.57 1.26 1.94 2.63 3.32 4.79 6.50
216.98 2.43 1.04 School 1.55 1.89 2.17 2.30 2.43 2.56 2.70 2.98 3.31
70 222.48 1.76 5.42 Student -2.80 -1.08 0.39 1.08 1.76 2.44 3.13 4.60 6.32
217.89 2.42 1.04 School 1.54 1.88 2.16 2.29 2.42 2.55 2.69 2.97 3.30
75 224.78 1.56 5.42 Student -3.00 -1.29 0.18 0.87 1.56 2.24 2.93 4.40 6.11
218.88 2.41 1.04 School 1.53 1.86 2.15 2.28 2.41 2.54 2.68 2.96 3.29
80 227.34 1.33 5.42 Student -3.23 -1.51 -0.04 0.65 1.33 2.01 2.70 4.17 5.89
219.97 2.40 1.04 School 1.52 1.85 2.13 2.27 2.40 2.53 2.66 2.95 3.28
85 230.32 1.07 5.42 Student -3.49 -1.77 -0.30 0.39 1.07 1.75 2.44 3.91 5.63
221.25 2.38 1.04 School 1.51 1.84 2.12 2.25 2.38 2.51 2.65 2.93 3.26
90 234.07 0.74 5.42 Student -3.82 -2.10 -0.63 0.06 0.74 1.42 2.11 3.58 5.30
222.86 2.36 1.04 School 1.49 1.82 2.10 2.23 2.36 2.50 2.63 2.91 3.24
CGI - Conditional Growth Index CGP - Conditional Growth Percentile
297

Table E.2.46: Reading Grade 7 From Winter To Spring Conditional Growth Percentile
Conditional Growth
Start Status Growth CGP 20 30 40 45 50 55 60 70 80
%ile RIT Mean SD CGI -0.84 -0.52 -0.25 -0.13 0.00 0.13 0.25 0.52 0.84
10 197.71 2.20 5.15 Student -2.13 -0.50 0.90 1.55 2.20 2.85 3.50 4.90 6.53
208.49 1.16 0.78 School 0.50 0.75 0.96 1.06 1.16 1.26 1.36 1.57 1.82
20 204.30 1.87 5.15 Student -2.46 -0.83 0.57 1.23 1.87 2.52 3.18 4.57 6.21
211.38 1.19 0.78 School 0.53 0.78 0.99 1.09 1.19 1.29 1.39 1.60 1.85
25 206.81 1.75 5.15 Student -2.58 -0.95 0.44 1.10 1.75 2.40 3.05 4.45 6.08
212.48 1.20 0.78 School 0.54 0.79 1.00 1.10 1.20 1.30 1.40 1.61 1.86
30 209.06 1.64 5.15 Student -2.70 -1.06 0.33 0.99 1.64 2.28 2.94 4.34 5.97
213.46 1.21 0.78 School 0.55 0.80 1.01 1.11 1.21 1.31 1.41 1.62 1.87
35 211.14 1.53 5.15 Student -2.80 -1.17 0.23 0.89 1.53 2.18 2.84 4.23 5.87
214.38 1.22 0.78 School 0.56 0.81 1.02 1.12 1.22 1.32 1.42 1.63 1.88
40 213.12 1.44 5.15 Student -2.90 -1.26 0.13 0.79 1.44 2.08 2.74 4.14 5.77
215.25 1.23 0.78 School 0.57 0.82 1.03 1.13 1.23 1.33 1.43 1.64 1.89
45 215.03 1.34 5.15 Student -2.99 -1.36 0.04 0.69 1.34 1.99 2.64 4.04 5.67
216.09 1.24 0.78 School 0.58 0.83 1.04 1.14 1.24 1.34 1.44 1.65 1.90
48 216.16 1.28 5.15 Student -3.05 -1.42 -0.02 0.64 1.28 1.93 2.59 3.98 5.62
216.58 1.24 0.78 School 0.58 0.83 1.05 1.15 1.24 1.34 1.44 1.65 1.90
50 216.91 1.25 5.15 Student -3.09 -1.45 -0.06 0.60 1.25 1.89 2.55 3.95 5.58
216.91 1.25 0.78 School 0.59 0.84 1.05 1.15 1.25 1.35 1.45 1.66 1.91
52 217.66 1.21 5.15 Student -3.12 -1.49 -0.09 0.56 1.21 1.86 2.51 3.91 5.54
217.24 1.25 0.78 School 0.59 0.84 1.05 1.15 1.25 1.35 1.45 1.66 1.91
55 218.79 1.15 5.15 Student -3.18 -1.55 -0.15 0.51 1.15 1.80 2.46 3.85 5.49
217.74 1.26 0.78 School 0.60 0.84 1.06 1.16 1.26 1.35 1.45 1.67 1.91
60 220.71 1.06 5.15 Student -3.27 -1.64 -0.25 0.41 1.06 1.71 2.36 3.76 5.39
218.58 1.26 0.78 School 0.61 0.85 1.07 1.17 1.26 1.36 1.46 1.67 1.92
65 222.68 0.96 5.15 Student -3.37 -1.74 -0.34 0.31 0.96 1.61 2.26 3.66 5.29
219.44 1.27 0.78 School 0.61 0.86 1.07 1.17 1.27 1.37 1.47 1.68 1.93
70 224.77 0.86 5.15 Student -3.48 -1.84 -0.45 0.21 0.86 1.50 2.16 3.56 5.19
220.36 1.28 0.78 School 0.62 0.87 1.08 1.18 1.28 1.38 1.48 1.69 1.94
75 227.02 0.75 5.15 Student -3.59 -1.95 -0.56 0.10 0.75 1.39 2.05 3.44 5.08
221.34 1.29 0.78 School 0.63 0.88 1.09 1.19 1.29 1.39 1.49 1.70 1.95
80 229.52 0.62 5.15 Student -3.71 -2.08 -0.68 -0.03 0.62 1.27 1.92 3.32 4.95
222.44 1.30 0.78 School 0.64 0.89 1.11 1.21 1.30 1.40 1.50 1.71 1.96
85 232.44 0.48 5.15 Student -3.86 -2.22 -0.83 -0.17 0.48 1.12 1.78 3.18 4.81
223.72 1.32 0.78 School 0.66 0.91 1.12 1.22 1.32 1.42 1.52 1.73 1.98
90 236.11 0.29 5.15 Student -4.04 -2.41 -1.01 -0.35 0.29 0.94 1.60 2.99 4.63
225.33 1.33 0.78 School 0.67 0.92 1.13 1.23 1.33 1.43 1.53 1.74 1.99
CGI - Conditional Growth Index CGP - Conditional Growth Percentile
298

Table E.2.47: Reading Grade 8 From Last Winter To Winter Conditional Growth Percentile
Conditional Growth
Start Status Growth CGP 20 30 40 45 50 55 60 70 80
%ile RIT Mean SD CGI -0.84 -0.52 -0.25 -0.13 0.00 0.13 0.25 0.52 0.84
10 195.64 5.71 6.68 Student 0.09 2.21 4.02 4.87 5.71 6.55 7.40 9.21 11.33
206.19 3.69 1.76 School 2.21 2.77 3.24 3.47 3.69 3.91 4.13 4.61 5.17
20 202.48 4.96 6.68 Student -0.66 1.46 3.27 4.12 4.96 5.80 6.65 8.46 10.58
209.41 3.63 1.76 School 2.16 2.71 3.19 3.41 3.63 3.85 4.08 4.55 5.11
25 205.08 4.67 6.68 Student -0.95 1.17 2.98 3.83 4.67 5.51 6.37 8.18 10.30
210.63 3.61 1.76 School 2.13 2.69 3.17 3.39 3.61 3.83 4.06 4.53 5.09
30 207.41 4.42 6.68 Student -1.20 0.92 2.73 3.58 4.42 5.26 6.11 7.92 10.04
211.73 3.59 1.76 School 2.12 2.67 3.15 3.37 3.59 3.81 4.04 4.51 5.07
35 209.57 4.18 6.68 Student -1.44 0.68 2.49 3.34 4.18 5.02 5.87 7.68 9.80
212.75 3.57 1.76 School 2.10 2.65 3.13 3.35 3.57 3.80 4.02 4.50 5.05
40 211.62 3.96 6.68 Student -1.66 0.45 2.26 3.12 3.96 4.80 5.65 7.46 9.58
213.71 3.56 1.76 School 2.08 2.64 3.11 3.34 3.56 3.78 4.00 4.48 5.04
45 213.61 3.74 6.68 Student -1.88 0.24 2.05 2.90 3.74 4.58 5.43 7.24 9.36
214.64 3.54 1.76 School 2.06 2.62 3.10 3.32 3.54 3.76 3.99 4.46 5.02
48 214.78 3.61 6.68 Student -2.01 0.11 1.92 2.77 3.61 4.45 5.30 7.11 9.23
215.20 3.53 1.76 School 2.05 2.61 3.09 3.31 3.53 3.75 3.98 4.45 5.01
50 215.56 3.53 6.68 Student -2.10 0.02 1.83 2.69 3.53 4.36 5.22 7.03 9.15
215.56 3.53 1.76 School 2.05 2.60 3.08 3.30 3.53 3.75 3.97 4.45 5.00
52 216.34 3.44 6.68 Student -2.18 -0.06 1.75 2.60 3.44 4.28 5.13 6.94 9.06
215.93 3.52 1.76 School 2.04 2.60 3.07 3.30 3.52 3.74 3.96 4.44 5.00
55 217.52 3.31 6.68 Student -2.31 -0.19 1.62 2.47 3.31 4.15 5.00 6.81 8.93
216.48 3.51 1.76 School 2.03 2.59 3.06 3.29 3.51 3.73 3.95 4.43 4.99
60 219.50 3.09 6.68 Student -2.53 -0.41 1.40 2.25 3.09 3.93 4.79 6.60 8.72
217.41 3.49 1.76 School 2.02 2.57 3.05 3.27 3.49 3.71 3.94 4.41 4.97
65 221.55 2.87 6.68 Student -2.75 -0.63 1.18 2.03 2.87 3.71 4.56 6.37 8.49
218.38 3.48 1.76 School 2.00 2.56 3.03 3.26 3.48 3.70 3.92 4.40 4.95
70 223.71 2.63 6.68 Student -2.99 -0.87 0.94 1.79 2.63 3.47 4.32 6.13 8.25
219.40 3.46 1.76 School 1.98 2.54 3.01 3.24 3.46 3.68 3.90 4.38 4.94
75 226.05 2.38 6.68 Student -3.24 -1.13 0.68 1.54 2.38 3.22 4.07 5.88 8.00
220.49 3.44 1.76 School 1.96 2.52 2.99 3.22 3.44 3.66 3.88 4.36 4.92
80 228.64 2.09 6.68 Student -3.53 -1.41 0.40 1.25 2.09 2.93 3.78 5.59 7.71
221.71 3.42 1.76 School 1.94 2.50 2.97 3.20 3.42 3.64 3.86 4.34 4.90
85 231.67 1.76 6.68 Student -3.86 -1.74 0.07 0.92 1.76 2.60 3.45 5.26 7.38
223.14 3.39 1.76 School 1.92 2.47 2.95 3.17 3.39 3.61 3.84 4.31 4.87
90 235.48 1.34 6.68 Student -4.28 -2.16 -0.35 0.50 1.34 2.18 3.04 4.85 6.96
224.93 3.36 1.76 School 1.88 2.44 2.92 3.14 3.36 3.58 3.81 4.28 4.84
CGI - Conditional Growth Index CGP - Conditional Growth Percentile
299

Table E.2.48: Reading Grade 8 From Last Spring To Spring Conditional Growth Percentile
Conditional Growth
Start Status Growth CGP 20 30 40 45 50 55 60 70 80
%ile RIT Mean SD CGI -0.84 -0.52 -0.25 -0.13 0.00 0.13 0.25 0.52 0.84
10 196.62 6.08 7.96 Student -0.63 1.90 4.06 5.08 6.08 7.08 8.10 10.25 12.78
207.55 3.36 2.23 School 1.49 2.19 2.80 3.08 3.36 3.64 3.93 4.53 5.24
20 203.61 5.05 7.96 Student -1.65 0.88 3.03 4.05 5.05 6.05 7.07 9.23 11.75
210.79 3.27 2.23 School 1.39 2.10 2.70 2.99 3.27 3.55 3.83 4.44 5.14
25 206.27 4.66 7.96 Student -2.04 0.49 2.64 3.66 4.66 5.66 6.68 8.84 11.36
212.02 3.23 2.23 School 1.36 2.06 2.67 2.95 3.23 3.51 3.80 4.40 5.11
30 208.65 4.31 7.96 Student -2.39 0.14 2.29 3.31 4.31 5.31 6.33 8.49 11.01
213.13 3.20 2.23 School 1.33 2.03 2.64 2.92 3.20 3.48 3.77 4.37 5.08
35 210.86 3.99 7.96 Student -2.72 -0.19 1.97 2.99 3.99 4.99 6.01 8.16 10.69
214.15 3.17 2.23 School 1.30 2.00 2.61 2.89 3.17 3.45 3.74 4.34 5.05
40 212.96 3.68 7.96 Student -3.02 -0.50 1.66 2.68 3.68 4.68 5.70 7.86 10.38
215.12 3.14 2.23 School 1.27 1.97 2.58 2.86 3.14 3.42 3.71 4.31 5.02
45 214.99 3.38 7.96 Student -3.32 -0.79 1.36 2.38 3.38 4.38 5.40 7.56 10.08
216.06 3.12 2.23 School 1.24 1.95 2.55 2.84 3.12 3.40 3.68 4.28 4.99
48 216.19 3.21 7.96 Student -3.50 -0.97 1.19 2.20 3.21 4.21 5.22 7.38 9.91
216.62 3.10 2.23 School 1.22 1.93 2.53 2.82 3.10 3.38 3.66 4.27 4.97
50 216.99 3.09 7.96 Student -3.61 -1.09 1.07 2.09 3.09 4.09 5.11 7.27 9.79
216.99 3.09 2.23 School 1.21 1.92 2.52 2.81 3.09 3.37 3.65 4.26 4.96
52 217.78 2.97 7.96 Student -3.73 -1.20 0.95 1.97 2.97 3.97 4.99 7.15 9.67
217.35 3.08 2.23 School 1.20 1.91 2.51 2.80 3.08 3.36 3.64 4.25 4.95
55 218.98 2.80 7.96 Student -3.91 -1.38 0.78 1.79 2.80 3.80 4.81 6.97 9.50
217.91 3.06 2.23 School 1.19 1.89 2.50 2.78 3.06 3.34 3.63 4.23 4.94
60 221.01 2.50 7.96 Student -4.21 -1.68 0.48 1.50 2.50 3.50 4.52 6.67 9.20
218.85 3.03 2.23 School 1.16 1.87 2.47 2.75 3.03 3.31 3.60 4.20 4.91
65 223.11 2.19 7.96 Student -4.51 -1.99 0.17 1.19 2.19 3.19 4.21 6.37 8.89
219.82 3.01 2.23 School 1.13 1.84 2.44 2.73 3.01 3.29 3.57 4.17 4.88
70 225.32 1.87 7.96 Student -4.84 -2.31 -0.15 0.86 1.87 2.87 3.88 6.04 8.57
220.84 2.98 2.23 School 1.10 1.81 2.41 2.70 2.98 3.26 3.54 4.15 4.85
75 227.71 1.52 7.96 Student -5.19 -2.66 -0.50 0.51 1.52 2.52 3.53 5.69 8.22
221.95 2.94 2.23 School 1.07 1.78 2.38 2.66 2.94 3.22 3.51 4.11 4.82
80 230.36 1.13 7.96 Student -5.58 -3.05 -0.89 0.12 1.13 2.13 3.14 5.30 7.83
223.18 2.91 2.23 School 1.03 1.74 2.34 2.63 2.91 3.19 3.47 4.08 4.78
85 233.46 0.67 7.96 Student -6.03 -3.51 -1.35 -0.33 0.67 1.67 2.69 4.85 7.37
224.61 2.87 2.23 School 0.99 1.70 2.30 2.59 2.87 3.15 3.43 4.04 4.74
90 237.35 0.10 7.96 Student -6.60 -4.08 -1.92 -0.90 0.10 1.10 2.12 4.28 6.80
226.42 2.81 2.23 School 0.94 1.65 2.25 2.53 2.81 3.09 3.38 3.98 4.69
CGI - Conditional Growth Index CGP - Conditional Growth Percentile
300

Table E.2.49: Reading Grade 8 From Fall To N Fall Conditional Growth Percentile
Conditional Growth
Start Status Growth CGP 20 30 40 45 50 55 60 70 80
%ile RIT Mean SD CGI -0.84 -0.52 -0.25 -0.13 0.00 0.13 0.25 0.52 0.84
10 197.10 3.05 7.83 Student -3.54 -1.06 1.06 2.06 3.05 4.03 5.03 7.15 9.64
207.67 2.81 1.97 School 1.15 1.77 2.31 2.56 2.81 3.06 3.31 3.84 4.47
20 204.01 3.07 7.83 Student -3.52 -1.03 1.09 2.09 3.07 4.06 5.06 7.18 9.66
210.95 2.92 1.97 School 1.25 1.88 2.42 2.67 2.92 3.16 3.42 3.95 4.58
25 206.64 3.08 7.83 Student -3.51 -1.02 1.10 2.10 3.08 4.07 5.07 7.19 9.67
212.20 2.96 1.97 School 1.30 1.92 2.46 2.71 2.96 3.21 3.46 3.99 4.62
30 209.00 3.09 7.83 Student -3.50 -1.01 1.11 2.11 3.09 4.08 5.08 7.20 9.68
213.32 2.99 1.97 School 1.33 1.96 2.49 2.75 2.99 3.24 3.50 4.03 4.66
35 211.18 3.10 7.83 Student -3.49 -1.01 1.12 2.12 3.10 4.08 5.08 7.21 9.69
214.36 3.03 1.97 School 1.37 1.99 2.53 2.78 3.03 3.28 3.53 4.06 4.69
40 213.26 3.11 7.83 Student -3.48 -1.00 1.12 2.12 3.11 4.09 5.09 7.21 9.70
215.35 3.06 1.97 School 1.40 2.03 2.56 2.81 3.06 3.31 3.56 4.10 4.72
45 215.26 3.12 7.83 Student -3.47 -0.99 1.13 2.13 3.12 4.10 5.10 7.22 9.71
216.30 3.09 1.97 School 1.43 2.06 2.59 2.85 3.09 3.34 3.59 4.13 4.76
48 216.45 3.12 7.83 Student -3.47 -0.99 1.14 2.14 3.12 4.11 5.10 7.23 9.71
216.87 3.11 1.97 School 1.45 2.08 2.61 2.86 3.11 3.36 3.61 4.15 4.77
50 217.24 3.12 7.83 Student -3.47 -0.98 1.14 2.14 3.12 4.11 5.11 7.23 9.71
217.24 3.12 1.97 School 1.46 2.09 2.62 2.88 3.12 3.37 3.62 4.16 4.79
52 218.03 3.13 7.83 Student -3.46 -0.98 1.14 2.14 3.13 4.11 5.11 7.23 9.72
217.61 3.14 1.97 School 1.47 2.10 2.64 2.89 3.14 3.38 3.64 4.17 4.80
55 219.21 3.13 7.83 Student -3.46 -0.97 1.15 2.15 3.13 4.12 5.12 7.24 9.72
218.18 3.16 1.97 School 1.49 2.12 2.65 2.91 3.16 3.40 3.66 4.19 4.82
60 221.22 3.14 7.83 Student -3.45 -0.97 1.16 2.16 3.14 4.12 5.12 7.25 9.73
219.13 3.19 1.97 School 1.52 2.15 2.69 2.94 3.19 3.43 3.69 4.22 4.85
65 223.30 3.15 7.83 Student -3.44 -0.96 1.16 2.16 3.15 4.13 5.13 7.25 9.74
220.12 3.22 1.97 School 1.56 2.18 2.72 2.97 3.22 3.47 3.72 4.25 4.88
70 225.48 3.16 7.83 Student -3.43 -0.95 1.17 2.17 3.16 4.14 5.14 7.26 9.75
221.16 3.25 1.97 School 1.59 2.22 2.75 3.01 3.25 3.50 3.75 4.29 4.92
75 227.84 3.17 7.83 Student -3.42 -0.94 1.18 2.18 3.17 4.15 5.15 7.27 9.76
222.28 3.29 1.97 School 1.63 2.25 2.79 3.04 3.29 3.54 3.79 4.33 4.95
80 230.47 3.18 7.83 Student -3.41 -0.93 1.19 2.19 3.18 4.16 5.16 7.28 9.77
223.52 3.33 1.97 School 1.67 2.30 2.83 3.08 3.33 3.58 3.83 4.37 4.99
85 233.53 3.19 7.83 Student -3.40 -0.92 1.20 2.20 3.19 4.17 5.17 7.29 9.78
224.98 3.38 1.97 School 1.72 2.34 2.88 3.13 3.38 3.63 3.88 4.42 5.04
90 237.38 3.20 7.83 Student -3.39 -0.90 1.22 2.22 3.20 4.19 5.19 7.31 9.79
226.81 3.44 1.97 School 1.78 2.40 2.94 3.19 3.44 3.69 3.94 4.48 5.10
CGI - Conditional Growth Index CGP - Conditional Growth Percentile
301

Table E.2.50: Reading Grade 8 From Fall To Spring Conditional Growth Percentile
Conditional Growth
Start Status Growth CGP 20 30 40 45 50 55 60 70 80
%ile RIT Mean SD CGI -0.84 -0.52 -0.25 -0.13 0.00 0.13 0.25 0.52 0.84
10 197.10 5.56 7.91 Student -1.10 1.41 3.55 4.56 5.56 6.55 7.56 9.70 12.21
207.67 3.25 2.23 School 1.37 2.08 2.68 2.97 3.25 3.53 3.81 4.42 5.12
20 204.01 4.62 7.91 Student -2.03 0.48 2.62 3.63 4.62 5.62 6.62 8.77 11.28
210.95 3.11 2.23 School 1.23 1.94 2.54 2.83 3.11 3.39 3.67 4.28 4.98
25 206.64 4.27 7.91 Student -2.39 0.12 2.26 3.27 4.27 5.26 6.27 8.41 10.92
212.20 3.05 2.23 School 1.18 1.88 2.49 2.77 3.05 3.33 3.62 4.22 4.93
30 209.00 3.95 7.91 Student -2.71 -0.20 1.94 2.95 3.95 4.94 5.95 8.09 10.60
213.32 3.00 2.23 School 1.13 1.83 2.44 2.72 3.00 3.28 3.57 4.17 4.88
35 211.18 3.65 7.91 Student -3.00 -0.49 1.65 2.66 3.65 4.65 5.66 7.80 10.31
214.36 2.96 2.23 School 1.08 1.79 2.39 2.68 2.96 3.24 3.52 4.13 4.84
40 213.26 3.37 7.91 Student -3.28 -0.77 1.37 2.38 3.37 4.37 5.38 7.52 10.03
215.35 2.92 2.23 School 1.04 1.75 2.35 2.64 2.92 3.20 3.48 4.09 4.79
45 215.26 3.10 7.91 Student -3.55 -1.04 1.10 2.11 3.10 4.10 5.10 7.25 9.76
216.30 2.88 2.23 School 1.00 1.71 2.31 2.60 2.88 3.16 3.44 4.04 4.75
48 216.45 2.94 7.91 Student -3.71 -1.21 0.94 1.95 2.94 3.93 4.94 7.09 9.60
216.87 2.85 2.23 School 0.97 1.68 2.29 2.57 2.85 3.13 3.42 4.02 4.73
50 217.24 2.83 7.91 Student -3.82 -1.31 0.83 1.84 2.83 3.83 4.84 6.98 9.49
217.24 2.83 2.23 School 0.96 1.67 2.27 2.55 2.83 3.11 3.40 4.00 4.71
52 218.03 2.73 7.91 Student -3.93 -1.42 0.72 1.73 2.73 3.72 4.73 6.87 9.38
217.61 2.82 2.23 School 0.94 1.65 2.25 2.54 2.82 3.10 3.38 3.99 4.69
55 219.21 2.57 7.91 Student -4.09 -1.58 0.56 1.57 2.57 3.56 4.57 6.71 9.22
218.18 2.79 2.23 School 0.92 1.62 2.23 2.51 2.79 3.07 3.36 3.96 4.67
60 221.22 2.30 7.91 Student -4.36 -1.85 0.29 1.30 2.30 3.29 4.30 6.44 8.95
219.13 2.75 2.23 School 0.88 1.58 2.19 2.47 2.75 3.03 3.32 3.92 4.63
65 223.30 2.02 7.91 Student -4.64 -2.13 0.01 1.02 2.02 3.01 4.02 6.16 8.67
220.12 2.71 2.23 School 0.83 1.54 2.15 2.43 2.71 2.99 3.28 3.88 4.59
70 225.48 1.72 7.91 Student -4.93 -2.43 -0.28 0.73 1.72 2.71 3.72 5.87 8.38
221.16 2.67 2.23 School 0.79 1.50 2.10 2.39 2.67 2.95 3.23 3.83 4.54
75 227.84 1.40 7.91 Student -5.25 -2.74 -0.60 0.41 1.40 2.40 3.41 5.55 8.06
222.28 2.62 2.23 School 0.74 1.45 2.05 2.34 2.62 2.90 3.18 3.79 4.49
80 230.47 1.05 7.91 Student -5.61 -3.10 -0.96 0.05 1.05 2.04 3.05 5.19 7.70
223.52 2.56 2.23 School 0.69 1.39 2.00 2.28 2.56 2.84 3.13 3.73 4.44
85 233.53 0.63 7.91 Student -6.02 -3.51 -1.37 -0.36 0.63 1.63 2.64 4.78 7.29
224.98 2.50 2.23 School 0.62 1.33 1.94 2.22 2.50 2.78 3.06 3.67 4.38
90 237.38 0.11 7.91 Student -6.54 -4.03 -1.89 -0.88 0.11 1.11 2.12 4.26 6.77
226.81 2.42 2.23 School 0.54 1.25 1.86 2.14 2.42 2.70 2.99 3.59 4.30
CGI - Conditional Growth Index CGP - Conditional Growth Percentile
302

Table E.2.51: Reading Grade 8 From Fall To Winter Conditional Growth Percentile
Conditional Growth
Start Status Growth CGP 20 30 40 45 50 55 60 70 80
%ile RIT Mean SD CGI -0.84 -0.52 -0.25 -0.13 0.00 0.13 0.25 0.52 0.84
10 197.10 3.78 5.85 Student -1.14 0.71 2.30 3.05 3.78 4.52 5.27 6.85 8.71
207.67 2.08 1.27 School 1.01 1.42 1.76 1.92 2.08 2.24 2.41 2.75 3.16
20 204.01 3.12 5.85 Student -1.81 0.05 1.64 2.38 3.12 3.85 4.60 6.19 8.05
210.95 2.00 1.27 School 0.93 1.34 1.68 1.84 2.00 2.16 2.33 2.67 3.08
25 206.64 2.87 5.85 Student -2.06 -0.20 1.38 2.13 2.87 3.60 4.35 5.94 7.79
212.20 1.97 1.27 School 0.90 1.30 1.65 1.81 1.97 2.13 2.30 2.64 3.05
30 209.00 2.64 5.85 Student -2.29 -0.43 1.16 1.90 2.64 3.38 4.12 5.71 7.57
213.32 1.94 1.27 School 0.87 1.28 1.62 1.78 1.94 2.10 2.27 2.61 3.02
35 211.18 2.43 5.85 Student -2.50 -0.64 0.95 1.69 2.43 3.17 3.91 5.50 7.36
214.36 1.92 1.27 School 0.85 1.25 1.60 1.76 1.92 2.08 2.24 2.59 2.99
40 213.26 2.23 5.85 Student -2.70 -0.84 0.75 1.49 2.23 2.97 3.71 5.30 7.16
215.35 1.89 1.27 School 0.82 1.23 1.57 1.73 1.89 2.05 2.22 2.56 2.97
45 215.26 2.04 5.85 Student -2.89 -1.03 0.55 1.30 2.04 2.77 3.52 5.11 6.97
216.30 1.87 1.27 School 0.80 1.20 1.55 1.71 1.87 2.03 2.19 2.54 2.94
48 216.45 1.92 5.85 Student -3.00 -1.15 0.44 1.19 1.92 2.66 3.41 4.99 6.85
216.87 1.86 1.27 School 0.78 1.19 1.53 1.70 1.86 2.02 2.18 2.53 2.93
50 217.24 1.85 5.85 Student -3.08 -1.22 0.36 1.11 1.85 2.58 3.33 4.92 6.78
217.24 1.85 1.27 School 0.78 1.18 1.53 1.69 1.85 2.01 2.17 2.52 2.92
52 218.03 1.77 5.85 Student -3.15 -1.30 0.29 1.04 1.77 2.51 3.26 4.84 6.70
217.61 1.84 1.27 School 0.77 1.17 1.52 1.68 1.84 2.00 2.16 2.51 2.91
55 219.21 1.66 5.85 Student -3.27 -1.41 0.18 0.92 1.66 2.39 3.14 4.73 6.59
218.18 1.82 1.27 School 0.75 1.16 1.50 1.66 1.82 1.98 2.15 2.49 2.90
60 221.22 1.47 5.85 Student -3.46 -1.60 -0.02 0.73 1.47 2.20 2.95 4.54 6.39
219.13 1.80 1.27 School 0.73 1.13 1.48 1.64 1.80 1.96 2.12 2.47 2.87
65 223.30 1.27 5.85 Student -3.66 -1.80 -0.22 0.53 1.27 2.00 2.75 4.34 6.19
220.12 1.78 1.27 School 0.70 1.11 1.45 1.62 1.78 1.94 2.10 2.45 2.85
70 225.48 1.06 5.85 Student -3.87 -2.01 -0.43 0.32 1.06 1.79 2.54 4.13 5.98
221.16 1.75 1.27 School 0.68 1.08 1.43 1.59 1.75 1.91 2.07 2.42 2.82
75 227.84 0.83 5.85 Student -4.10 -2.24 -0.65 0.09 0.83 1.57 2.31 3.90 5.76
222.28 1.72 1.27 School 0.65 1.06 1.40 1.56 1.72 1.88 2.05 2.39 2.80
80 230.47 0.58 5.85 Student -4.35 -2.49 -0.91 -0.16 0.58 1.31 2.06 3.65 5.50
223.52 1.69 1.27 School 0.62 1.02 1.37 1.53 1.69 1.85 2.02 2.36 2.77
85 233.53 0.28 5.85 Student -4.64 -2.79 -1.20 -0.45 0.28 1.02 1.77 3.35 5.21
224.98 1.66 1.27 School 0.58 0.99 1.33 1.50 1.66 1.82 1.98 2.33 2.73
90 237.38 -0.09 5.85 Student -5.01 -3.16 -1.57 -0.82 -0.09 0.65 1.40 2.98 4.84
226.81 1.61 1.27 School 0.54 0.94 1.29 1.45 1.61 1.77 1.93 2.28 2.68
CGI - Conditional Growth Index CGP - Conditional Growth Percentile
303

Table E.2.52: Reading Grade 8 From Winter To Spring Conditional Growth Percentile
Conditional Growth
Start Status Growth CGP 20 30 40 45 50 55 60 70 80
%ile RIT Mean SD CGI -0.84 -0.52 -0.25 -0.13 0.00 0.13 0.25 0.52 0.84
10 199.40 1.77 5.45 Student -2.81 -1.08 0.39 1.09 1.77 2.46 3.16 4.63 6.36
209.61 0.95 0.97 School 0.14 0.44 0.71 0.83 0.95 1.07 1.20 1.46 1.76
20 206.16 1.50 5.45 Student -3.08 -1.35 0.12 0.82 1.50 2.19 2.88 4.36 6.09
212.87 0.96 0.97 School 0.15 0.46 0.72 0.84 0.96 1.08 1.21 1.47 1.78
25 208.72 1.40 5.45 Student -3.19 -1.46 0.02 0.72 1.40 2.09 2.78 4.26 5.99
214.10 0.97 0.97 School 0.15 0.46 0.72 0.85 0.97 1.09 1.21 1.47 1.78
30 211.03 1.31 5.45 Student -3.28 -1.55 -0.07 0.62 1.31 1.99 2.69 4.17 5.90
215.21 0.97 0.97 School 0.16 0.47 0.73 0.85 0.97 1.09 1.22 1.48 1.79
35 213.17 1.22 5.45 Student -3.36 -1.64 -0.16 0.54 1.22 1.91 2.60 4.08 5.81
216.24 0.98 0.97 School 0.16 0.47 0.73 0.85 0.98 1.10 1.22 1.48 1.79
40 215.19 1.14 5.45 Student -3.45 -1.72 -0.24 0.46 1.14 1.83 2.52 4.00 5.73
217.21 0.98 0.97 School 0.17 0.47 0.73 0.86 0.98 1.10 1.22 1.49 1.79
45 217.16 1.06 5.45 Student -3.52 -1.79 -0.32 0.38 1.06 1.75 2.44 3.92 5.65
218.16 0.98 0.97 School 0.17 0.48 0.74 0.86 0.98 1.10 1.23 1.49 1.80
48 218.32 1.02 5.45 Student -3.57 -1.84 -0.36 0.33 1.02 1.70 2.40 3.88 5.61
218.72 0.99 0.97 School 0.17 0.48 0.74 0.86 0.99 1.11 1.23 1.49 1.80
50 219.09 0.99 5.45 Student -3.60 -1.87 -0.39 0.30 0.99 1.67 2.37 3.85 5.57
219.09 0.99 0.97 School 0.17 0.48 0.74 0.87 0.99 1.11 1.23 1.49 1.80
52 219.86 0.96 5.45 Student -3.63 -1.90 -0.43 0.27 0.96 1.64 2.34 3.81 5.54
219.46 0.99 0.97 School 0.17 0.48 0.74 0.87 0.99 1.11 1.23 1.49 1.80
55 221.02 0.91 5.45 Student -3.68 -1.95 -0.47 0.22 0.91 1.59 2.29 3.77 5.50
220.02 0.99 0.97 School 0.18 0.48 0.75 0.87 0.99 1.11 1.23 1.50 1.80
60 222.98 0.83 5.45 Student -3.76 -2.03 -0.55 0.15 0.83 1.52 2.21 3.69 5.42
220.96 0.99 0.97 School 0.18 0.49 0.75 0.87 0.99 1.12 1.24 1.50 1.81
65 225.01 0.75 5.45 Student -3.84 -2.11 -0.63 0.06 0.75 1.43 2.13 3.61 5.34
221.94 1.00 0.97 School 0.18 0.49 0.75 0.88 1.00 1.12 1.24 1.50 1.81
70 227.15 0.66 5.45 Student -3.92 -2.19 -0.72 -0.02 0.66 1.35 2.05 3.52 5.25
222.96 1.00 0.97 School 0.19 0.49 0.76 0.88 1.00 1.12 1.25 1.51 1.81
75 229.45 0.57 5.45 Student -4.02 -2.29 -0.81 -0.11 0.57 1.26 1.95 3.43 5.16
224.07 1.01 0.97 School 0.19 0.50 0.76 0.88 1.01 1.13 1.25 1.51 1.82
80 232.02 0.47 5.45 Student -4.12 -2.39 -0.91 -0.22 0.47 1.15 1.85 3.33 5.06
225.31 1.01 0.97 School 0.20 0.50 0.77 0.89 1.01 1.13 1.26 1.52 1.82
85 235.01 0.35 5.45 Student -4.24 -2.51 -1.03 -0.34 0.35 1.03 1.73 3.21 4.94
226.75 1.02 0.97 School 0.20 0.51 0.77 0.89 1.02 1.14 1.26 1.52 1.83
90 238.78 0.20 5.45 Student -4.39 -2.66 -1.18 -0.49 0.20 0.88 1.58 3.06 4.79
228.56 1.02 0.97 School 0.21 0.52 0.78 0.90 1.02 1.14 1.27 1.53 1.84
CGI - Conditional Growth Index CGP - Conditional Growth Percentile
304

Table E.2.53: Reading Grade 9 From Last Winter To Winter Conditional Growth Percentile
Conditional Growth
Start Status Growth CGP 20 30 40 45 50 55 60 70 80
%ile RIT Mean SD CGI -0.84 -0.52 -0.25 -0.13 0.00 0.13 0.25 0.52 0.84
10 199.00 4.65 7.26 Student -1.46 0.85 2.81 3.74 4.65 5.57 6.49 8.46 10.76
210.06 2.40 2.16 School 0.59 1.27 1.86 2.13 2.40 2.68 2.95 3.54 4.22
20 205.99 3.71 7.26 Student -2.40 -0.10 1.87 2.79 3.71 4.62 5.55 7.51 9.82
213.25 2.23 2.16 School 0.42 1.10 1.68 1.96 2.23 2.50 2.78 3.36 4.05
25 208.65 3.35 7.26 Student -2.76 -0.46 1.51 2.44 3.35 4.26 5.19 7.15 9.46
214.47 2.16 2.16 School 0.35 1.03 1.62 1.89 2.16 2.44 2.71 3.30 3.98
30 211.04 3.03 7.26 Student -3.08 -0.78 1.19 2.11 3.03 3.94 4.86 6.83 9.13
215.56 2.10 2.16 School 0.29 0.97 1.56 1.83 2.10 2.38 2.65 3.24 3.92
35 213.25 2.73 7.26 Student -3.38 -1.08 0.89 1.81 2.73 3.64 4.57 6.53 8.84
216.57 2.05 2.16 School 0.23 0.92 1.50 1.78 2.05 2.32 2.60 3.18 3.87
40 215.34 2.44 7.26 Student -3.67 -1.36 0.60 1.53 2.44 3.35 4.28 6.25 8.55
217.53 2.00 2.16 School 0.18 0.87 1.45 1.73 2.00 2.27 2.54 3.13 3.81
45 217.37 2.17 7.26 Student -3.94 -1.64 0.33 1.26 2.17 3.08 4.01 5.97 8.28
218.46 1.95 2.16 School 0.13 0.82 1.40 1.68 1.95 2.22 2.49 3.08 3.76
48 218.57 2.01 7.26 Student -4.10 -1.80 0.17 1.09 2.01 2.92 3.84 5.81 8.11
219.01 1.92 2.16 School 0.10 0.79 1.37 1.65 1.92 2.19 2.46 3.05 3.73
50 219.37 1.90 7.26 Student -4.21 -1.91 0.06 0.99 1.90 2.81 3.74 5.70 8.01
219.37 1.90 2.16 School 0.08 0.77 1.35 1.63 1.90 2.17 2.44 3.03 3.71
52 220.17 1.79 7.26 Student -4.32 -2.02 -0.05 0.88 1.79 2.70 3.63 5.60 7.90
219.74 1.88 2.16 School 0.06 0.75 1.33 1.61 1.88 2.15 2.42 3.01 3.69
55 221.37 1.63 7.26 Student -4.48 -2.18 -0.21 0.71 1.63 2.54 3.47 5.43 7.74
220.29 1.85 2.16 School 0.03 0.72 1.30 1.58 1.85 2.12 2.39 2.98 3.66
60 223.40 1.35 7.26 Student -4.76 -2.45 -0.49 0.44 1.35 2.26 3.19 5.16 7.46
221.21 1.80 2.16 School -0.02 0.67 1.25 1.53 1.80 2.07 2.34 2.93 3.61
65 225.50 1.07 7.26 Student -5.04 -2.74 -0.77 0.16 1.07 1.98 2.91 4.88 7.18
222.17 1.74 2.16 School -0.07 0.61 1.20 1.47 1.74 2.02 2.29 2.88 3.56
70 227.71 0.77 7.26 Student -5.34 -3.04 -1.07 -0.14 0.77 1.68 2.61 4.58 6.88
223.18 1.69 2.16 School -0.13 0.56 1.14 1.42 1.69 1.96 2.24 2.82 3.51
75 230.09 0.45 7.26 Student -5.66 -3.36 -1.39 -0.47 0.45 1.36 2.29 4.25 6.56
224.27 1.63 2.16 School -0.18 0.50 1.08 1.36 1.63 1.90 2.18 2.76 3.45
80 232.75 0.09 7.26 Student -6.02 -3.72 -1.75 -0.82 0.09 1.00 1.93 3.89 6.20
225.49 1.56 2.16 School -0.25 0.43 1.02 1.29 1.56 1.84 2.11 2.70 3.38
85 235.85 -0.33 7.26 Student -6.44 -4.14 -2.17 -1.24 -0.33 0.58 1.51 3.48 5.78
226.91 1.49 2.16 School -0.33 0.36 0.94 1.22 1.49 1.76 2.03 2.62 3.30
90 239.74 -0.86 7.26 Student -6.97 -4.67 -2.70 -1.77 -0.86 0.05 0.98 2.95 5.25
228.69 1.39 2.16 School -0.43 0.26 0.84 1.12 1.39 1.66 1.94 2.52 3.21
CGI - Conditional Growth Index CGP - Conditional Growth Percentile
305

Table E.2.54: Reading Grade 9 From Last Spring To Spring Conditional Growth Percentile
Conditional Growth
Start Status Growth CGP 20 30 40 45 50 55 60 70 80
%ile RIT Mean SD CGI -0.84 -0.52 -0.25 -0.13 0.00 0.13 0.25 0.52 0.84
10 199.09 4.95 8.32 Student -2.06 0.58 2.84 3.90 4.95 5.99 7.06 9.31 11.95
210.67 2.33 2.67 School 0.08 0.93 1.66 2.00 2.33 2.67 3.01 3.73 4.58
20 206.41 3.75 8.32 Student -3.25 -0.61 1.65 2.71 3.75 4.80 5.86 8.12 10.76
214.01 2.04 2.67 School -0.21 0.64 1.36 1.70 2.04 2.37 2.72 3.44 4.29
25 209.18 3.30 8.32 Student -3.70 -1.06 1.19 2.26 3.30 4.35 5.41 7.67 10.31
215.28 1.93 2.67 School -0.32 0.52 1.25 1.59 1.93 2.26 2.60 3.33 4.18
30 211.68 2.90 8.32 Student -4.11 -1.47 0.79 1.85 2.90 3.94 5.00 7.26 9.90
216.42 1.83 2.67 School -0.42 0.42 1.15 1.49 1.83 2.16 2.50 3.23 4.08
35 213.99 2.52 8.32 Student -4.49 -1.85 0.41 1.47 2.52 3.57 4.63 6.88 9.52
217.47 1.73 2.67 School -0.52 0.33 1.06 1.40 1.73 2.07 2.41 3.13 3.98
40 216.18 2.16 8.32 Student -4.84 -2.20 0.05 1.12 2.16 3.21 4.27 6.53 9.17
218.47 1.64 2.67 School -0.60 0.24 0.97 1.31 1.64 1.98 2.32 3.05 3.89
45 218.31 1.82 8.32 Student -5.19 -2.55 -0.29 0.77 1.82 2.86 3.92 6.18 8.82
219.44 1.56 2.67 School -0.69 0.16 0.88 1.22 1.56 1.90 2.24 2.96 3.81
48 219.56 1.61 8.32 Student -5.39 -2.75 -0.50 0.57 1.61 2.66 3.72 5.98 8.62
220.01 1.51 2.67 School -0.74 0.11 0.83 1.17 1.51 1.84 2.19 2.91 3.76
50 220.40 1.48 8.32 Student -5.53 -2.89 -0.63 0.43 1.48 2.52 3.58 5.84 8.48
220.40 1.48 2.67 School -0.77 0.07 0.80 1.14 1.48 1.81 2.15 2.88 3.72
52 221.23 1.34 8.32 Student -5.67 -3.03 -0.77 0.29 1.34 2.39 3.45 5.70 8.35
220.78 1.44 2.67 School -0.81 0.04 0.76 1.11 1.44 1.78 2.12 2.84 3.69
55 222.48 1.14 8.32 Student -5.87 -3.23 -0.97 0.09 1.14 2.18 3.24 5.50 8.14
221.35 1.39 2.67 School -0.86 -0.01 0.71 1.06 1.39 1.73 2.07 2.79 3.64
60 224.61 0.79 8.32 Student -6.22 -3.58 -1.32 -0.26 0.79 1.84 2.90 5.15 7.80
222.32 1.31 2.67 School -0.94 -0.10 0.63 0.97 1.31 1.64 1.98 2.71 3.56
65 226.80 0.43 8.32 Student -6.57 -3.93 -1.68 -0.61 0.43 1.48 2.54 4.80 7.44
223.32 1.22 2.67 School -1.03 -0.18 0.54 0.88 1.22 1.55 1.89 2.62 3.47
70 229.11 0.06 8.32 Student -6.95 -4.31 -2.05 -0.99 0.06 1.10 2.16 4.42 7.06
224.37 1.13 2.67 School -1.12 -0.28 0.45 0.79 1.13 1.46 1.80 2.53 3.37
75 231.61 -0.35 8.32 Student -7.36 -4.72 -2.46 -1.40 -0.35 0.69 1.76 4.01 6.65
225.51 1.02 2.67 School -1.22 -0.38 0.35 0.69 1.02 1.36 1.70 2.43 3.27
80 234.38 -0.80 8.32 Student -7.81 -5.17 -2.91 -1.85 -0.80 0.24 1.30 3.56 6.20
226.78 0.91 2.67 School -1.34 -0.49 0.24 0.58 0.91 1.25 1.59 2.31 3.16
85 237.62 -1.33 8.32 Student -8.34 -5.70 -3.44 -2.38 -1.33 -0.29 0.78 3.03 5.67
228.26 0.78 2.67 School -1.47 -0.62 0.11 0.45 0.78 1.12 1.46 2.18 3.03
90 241.70 -2.00 8.32 Student -9.00 -6.36 -4.10 -3.04 -2.00 -0.95 0.11 2.37 5.01
230.12 0.62 2.67 School -1.63 -0.78 -0.06 0.28 0.62 0.95 1.30 2.02 2.87
CGI - Conditional Growth Index CGP - Conditional Growth Percentile
306

Table E.2.55: Reading Grade 9 From Fall To N Fall Conditional Growth Percentile
Conditional Growth
Start Status Growth CGP 20 30 40 45 50 55 60 70 80
%ile RIT Mean SD CGI -0.84 -0.52 -0.25 -0.13 0.00 0.13 0.25 0.52 0.84
10 200.12 2.17 7.84 Student -4.43 -1.94 0.18 1.18 2.17 3.15 4.15 6.28 8.76
211.08 1.58 2.17 School -0.25 0.44 1.03 1.30 1.58 1.85 2.12 2.71 3.40
20 207.02 2.09 7.84 Student -4.51 -2.02 0.10 1.10 2.09 3.07 4.07 6.20 8.68
214.21 1.70 2.17 School -0.13 0.56 1.15 1.42 1.70 1.97 2.24 2.83 3.52
25 209.64 2.05 7.84 Student -4.54 -2.06 0.07 1.07 2.05 3.04 4.04 6.16 8.65
215.41 1.74 2.17 School -0.08 0.60 1.19 1.47 1.74 2.01 2.29 2.88 3.57
30 211.99 2.03 7.84 Student -4.57 -2.08 0.04 1.04 2.03 3.01 4.01 6.14 8.62
216.48 1.78 2.17 School -0.04 0.65 1.23 1.51 1.78 2.06 2.33 2.92 3.61
35 214.17 2.00 7.84 Student -4.60 -2.11 0.01 1.01 2.00 2.98 3.98 6.11 8.60
217.47 1.82 2.17 School -0.00 0.68 1.27 1.55 1.82 2.09 2.37 2.96 3.65
40 216.24 1.97 7.84 Student -4.62 -2.14 -0.01 0.99 1.97 2.96 3.96 6.08 8.57
218.41 1.86 2.17 School 0.03 0.72 1.31 1.58 1.86 2.13 2.41 2.99 3.68
45 218.24 1.95 7.84 Student -4.65 -2.16 -0.04 0.97 1.95 2.93 3.94 6.06 8.55
219.32 1.89 2.17 School 0.07 0.76 1.34 1.62 1.89 2.16 2.44 3.03 3.72
48 219.43 1.94 7.84 Student -4.66 -2.17 -0.05 0.95 1.94 2.92 3.92 6.05 8.53
219.86 1.91 2.17 School 0.09 0.78 1.36 1.64 1.91 2.18 2.46 3.05 3.74
50 220.22 1.93 7.84 Student -4.67 -2.18 -0.06 0.94 1.93 2.91 3.91 6.04 8.52
220.22 1.93 2.17 School 0.10 0.79 1.38 1.65 1.93 2.20 2.48 3.06 3.75
52 221.00 1.92 7.84 Student -4.68 -2.19 -0.07 0.93 1.92 2.90 3.90 6.03 8.51
220.57 1.94 2.17 School 0.12 0.80 1.39 1.67 1.94 2.21 2.49 3.08 3.76
55 222.19 1.90 7.84 Student -4.69 -2.21 -0.08 0.92 1.90 2.89 3.89 6.01 8.50
221.11 1.96 2.17 School 0.14 0.82 1.41 1.69 1.96 2.23 2.51 3.10 3.79
60 224.19 1.88 7.84 Student -4.72 -2.23 -0.11 0.89 1.88 2.86 3.86 5.99 8.47
222.02 2.00 2.17 School 0.17 0.86 1.45 1.72 2.00 2.27 2.54 3.13 3.82
65 226.26 1.85 7.84 Student -4.74 -2.26 -0.13 0.87 1.85 2.84 3.84 5.96 8.45
222.96 2.03 2.17 School 0.21 0.90 1.48 1.76 2.03 2.30 2.58 3.17 3.86
70 228.44 1.83 7.84 Student -4.77 -2.28 -0.16 0.84 1.83 2.81 3.81 5.94 8.42
223.96 2.07 2.17 School 0.25 0.93 1.52 1.80 2.07 2.34 2.62 3.21 3.89
75 230.79 1.80 7.84 Student -4.80 -2.31 -0.19 0.81 1.80 2.78 3.78 5.91 8.39
225.03 2.11 2.17 School 0.29 0.97 1.56 1.84 2.11 2.38 2.66 3.25 3.94
80 233.41 1.77 7.84 Student -4.83 -2.34 -0.22 0.78 1.77 2.75 3.75 5.88 8.36
226.22 2.16 2.17 School 0.33 1.02 1.61 1.88 2.16 2.43 2.71 3.29 3.98
85 236.47 1.73 7.84 Student -4.87 -2.38 -0.26 0.75 1.73 2.72 3.72 5.84 8.33
227.61 2.21 2.17 School 0.39 1.07 1.66 1.94 2.21 2.48 2.76 3.35 4.03
90 240.31 1.68 7.84 Student -4.91 -2.43 -0.30 0.70 1.68 2.67 3.67 5.79 8.28
229.36 2.28 2.17 School 0.45 1.14 1.73 2.00 2.28 2.55 2.83 3.41 4.10
CGI - Conditional Growth Index CGP - Conditional Growth Percentile
307

Table E.2.56: Reading Grade 9 From Fall To Spring Conditional Growth Percentile
Conditional Growth
Start Status Growth CGP 20 30 40 45 50 55 60 70 80
%ile RIT Mean SD CGI -0.84 -0.52 -0.25 -0.13 0.00 0.13 0.25 0.52 0.84
10 200.12 4.18 8.65 Student -3.10 -0.36 1.99 3.09 4.18 5.27 6.37 8.72 11.46
211.08 1.77 2.32 School -0.18 0.55 1.18 1.48 1.77 2.06 2.36 2.98 3.72
20 207.02 3.31 8.65 Student -3.97 -1.22 1.12 2.23 3.31 4.40 5.51 7.85 10.59
214.21 1.73 2.32 School -0.22 0.51 1.14 1.44 1.73 2.02 2.32 2.94 3.68
25 209.64 2.98 8.65 Student -4.30 -1.55 0.79 1.90 2.98 4.07 5.18 7.52 10.27
215.41 1.71 2.32 School -0.24 0.50 1.13 1.42 1.71 2.01 2.30 2.93 3.67
30 211.99 2.69 8.65 Student -4.59 -1.85 0.50 1.60 2.69 3.78 4.88 7.23 9.97
216.48 1.70 2.32 School -0.25 0.49 1.11 1.41 1.70 1.99 2.29 2.92 3.65
35 214.17 2.41 8.65 Student -4.87 -2.12 0.22 1.33 2.41 3.50 4.61 6.95 9.70
217.47 1.69 2.32 School -0.26 0.47 1.10 1.40 1.69 1.98 2.28 2.90 3.64
40 216.24 2.15 8.65 Student -5.13 -2.38 -0.04 1.07 2.15 3.24 4.35 6.69 9.44
218.41 1.68 2.32 School -0.27 0.46 1.09 1.39 1.68 1.97 2.26 2.89 3.63
45 218.24 1.90 8.65 Student -5.38 -2.63 -0.29 0.82 1.90 2.99 4.09 6.44 9.18
219.32 1.67 2.32 School -0.28 0.45 1.08 1.38 1.67 1.96 2.25 2.88 3.62
48 219.43 1.75 8.65 Student -5.53 -2.78 -0.44 0.67 1.75 2.84 3.95 6.29 9.04
219.86 1.66 2.32 School -0.29 0.44 1.07 1.37 1.66 1.95 2.25 2.88 3.61
50 220.22 1.66 8.65 Student -5.63 -2.88 -0.54 0.57 1.66 2.74 3.85 6.19 8.94
220.22 1.66 2.32 School -0.30 0.44 1.07 1.36 1.66 1.95 2.24 2.87 3.61
52 221.00 1.56 8.65 Student -5.72 -2.98 -0.64 0.47 1.56 2.64 3.75 6.09 8.84
220.57 1.65 2.32 School -0.30 0.44 1.06 1.36 1.65 1.94 2.24 2.87 3.60
55 222.19 1.41 8.65 Student -5.87 -3.13 -0.78 0.32 1.41 2.50 3.60 5.94 8.69
221.11 1.64 2.32 School -0.31 0.43 1.06 1.35 1.64 1.94 2.23 2.86 3.59
60 224.19 1.16 8.65 Student -6.12 -3.38 -1.04 0.07 1.16 2.24 3.35 5.69 8.44
222.02 1.63 2.32 School -0.32 0.42 1.05 1.34 1.63 1.92 2.22 2.85 3.58
65 226.26 0.90 8.65 Student -6.38 -3.64 -1.30 -0.19 0.90 1.98 3.09 5.43 8.18
222.96 1.62 2.32 School -0.33 0.41 1.03 1.33 1.62 1.91 2.21 2.84 3.57
70 228.44 0.62 8.65 Student -6.66 -3.91 -1.57 -0.46 0.62 1.71 2.81 5.16 7.90
223.96 1.61 2.32 School -0.34 0.39 1.02 1.32 1.61 1.90 2.20 2.82 3.56
75 230.79 0.33 8.65 Student -6.95 -4.21 -1.86 -0.76 0.33 1.41 2.52 4.86 7.61
225.03 1.60 2.32 School -0.35 0.38 1.01 1.30 1.60 1.89 2.18 2.81 3.55
80 233.41 -0.00 8.65 Student -7.28 -4.54 -2.19 -1.09 -0.00 1.08 2.19 4.53 7.28
226.22 1.58 2.32 School -0.37 0.37 0.99 1.29 1.58 1.87 2.17 2.80 3.53
85 236.47 -0.39 8.65 Student -7.67 -4.92 -2.58 -1.47 -0.39 0.70 1.81 4.15 6.90
227.61 1.56 2.32 School -0.39 0.35 0.98 1.27 1.56 1.86 2.15 2.78 3.51
90 240.31 -0.87 8.65 Student -8.15 -5.41 -3.06 -1.96 -0.87 0.22 1.32 3.67 6.41
229.36 1.54 2.32 School -0.41 0.33 0.96 1.25 1.54 1.83 2.13 2.76 3.49
CGI - Conditional Growth Index CGP - Conditional Growth Percentile
308

Table E.2.57: Reading Grade 9 From Fall To Winter Conditional Growth Percentile
Conditional Growth
Start Status Growth CGP 20 30 40 45 50 55 60 70 80
%ile RIT Mean SD CGI -0.84 -0.52 -0.25 -0.13 0.00 0.13 0.25 0.52 0.84
10 200.12 2.88 6.19 Student -2.33 -0.37 1.31 2.10 2.88 3.66 4.45 6.13 8.09
211.08 1.12 1.32 School 0.00 0.42 0.78 0.95 1.12 1.28 1.45 1.81 2.23
20 207.02 2.25 6.19 Student -2.96 -1.00 0.68 1.47 2.25 3.03 3.82 5.50 7.46
214.21 1.10 1.32 School -0.02 0.40 0.76 0.93 1.10 1.26 1.43 1.79 2.21
25 209.64 2.01 6.19 Student -3.20 -1.23 0.44 1.24 2.01 2.79 3.58 5.26 7.23
215.41 1.09 1.32 School -0.03 0.39 0.75 0.92 1.09 1.25 1.42 1.78 2.20
30 211.99 1.80 6.19 Student -3.41 -1.45 0.23 1.02 1.80 2.58 3.37 5.05 7.01
216.48 1.08 1.32 School -0.03 0.39 0.74 0.91 1.08 1.25 1.42 1.77 2.19
35 214.17 1.60 6.19 Student -3.61 -1.65 0.03 0.82 1.60 2.38 3.17 4.85 6.81
217.47 1.07 1.32 School -0.04 0.38 0.74 0.91 1.07 1.24 1.41 1.77 2.19
40 216.24 1.41 6.19 Student -3.80 -1.83 -0.15 0.64 1.41 2.19 2.98 4.66 6.63
218.41 1.07 1.32 School -0.05 0.37 0.73 0.90 1.07 1.23 1.40 1.76 2.18
45 218.24 1.23 6.19 Student -3.98 -2.02 -0.34 0.45 1.23 2.01 2.80 4.48 6.44
219.32 1.06 1.32 School -0.06 0.37 0.72 0.89 1.06 1.23 1.40 1.75 2.17
48 219.43 1.12 6.19 Student -4.09 -2.12 -0.44 0.35 1.12 1.90 2.69 4.37 6.34
219.86 1.06 1.32 School -0.06 0.36 0.72 0.89 1.06 1.22 1.39 1.75 2.17
50 220.22 1.05 6.19 Student -4.16 -2.19 -0.52 0.28 1.05 1.83 2.62 4.30 6.27
220.22 1.05 1.32 School -0.06 0.36 0.72 0.89 1.05 1.22 1.39 1.75 2.17
52 221.00 0.98 6.19 Student -4.23 -2.27 -0.59 0.20 0.98 1.76 2.55 4.23 6.19
220.57 1.05 1.32 School -0.06 0.36 0.72 0.88 1.05 1.22 1.39 1.75 2.17
55 222.19 0.87 6.19 Student -4.34 -2.37 -0.69 0.10 0.87 1.65 2.44 4.12 6.09
221.11 1.05 1.32 School -0.07 0.35 0.71 0.88 1.05 1.21 1.38 1.74 2.16
60 224.19 0.69 6.19 Student -4.52 -2.55 -0.88 -0.09 0.69 1.47 2.26 3.94 5.90
222.02 1.04 1.32 School -0.07 0.35 0.71 0.87 1.04 1.21 1.38 1.74 2.16
65 226.26 0.51 6.19 Student -4.71 -2.74 -1.06 -0.27 0.51 1.28 2.07 3.75 5.72
222.96 1.03 1.32 School -0.08 0.34 0.70 0.87 1.03 1.20 1.37 1.73 2.15
70 228.44 0.31 6.19 Student -4.90 -2.94 -1.26 -0.47 0.31 1.09 1.88 3.55 5.52
223.96 1.03 1.32 School -0.09 0.33 0.69 0.86 1.03 1.19 1.36 1.72 2.14
75 230.79 0.09 6.19 Student -5.12 -3.15 -1.48 -0.68 0.09 0.87 1.66 3.34 5.31
225.03 1.02 1.32 School -0.10 0.32 0.68 0.85 1.02 1.19 1.36 1.71 2.13
80 233.41 -0.14 6.19 Student -5.36 -3.39 -1.71 -0.92 -0.14 0.63 1.42 3.10 5.07
226.22 1.01 1.32 School -0.10 0.32 0.68 0.84 1.01 1.18 1.35 1.71 2.13
85 236.47 -0.42 6.19 Student -5.63 -3.67 -1.99 -1.20 -0.42 0.36 1.15 2.83 4.79
227.61 1.00 1.32 School -0.11 0.31 0.67 0.83 1.00 1.17 1.34 1.70 2.12
90 240.31 -0.77 6.19 Student -5.98 -4.02 -2.34 -1.55 -0.77 0.01 0.80 2.48 4.44
229.36 0.99 1.32 School -0.13 0.29 0.65 0.82 0.99 1.16 1.32 1.68 2.10
CGI - Conditional Growth Index CGP - Conditional Growth Percentile
309

Table E.2.58: Reading Grade 9 From Winter To Spring Conditional Growth Percentile
Conditional Growth
Start Status Growth CGP 20 30 40 45 50 55 60 70 80
%ile RIT Mean SD CGI -0.84 -0.52 -0.25 -0.13 0.00 0.13 0.25 0.52 0.84
10 201.35 1.06 5.67 Student -3.71 -1.92 -0.38 0.34 1.06 1.77 2.49 4.03 5.83
212.04 0.42 0.98 School -0.41 -0.10 0.17 0.29 0.42 0.54 0.66 0.93 1.24
20 208.19 0.90 5.67 Student -3.87 -2.07 -0.54 0.19 0.90 1.61 2.34 3.87 5.67
215.21 0.48 0.98 School -0.35 -0.04 0.23 0.36 0.48 0.60 0.73 1.00 1.31
25 210.78 0.84 5.67 Student -3.93 -2.13 -0.59 0.13 0.84 1.55 2.28 3.81 5.61
216.41 0.50 0.98 School -0.32 -0.01 0.25 0.38 0.50 0.63 0.75 1.02 1.33
30 213.12 0.79 5.67 Student -3.98 -2.18 -0.65 0.08 0.79 1.50 2.22 3.76 5.56
217.49 0.53 0.98 School -0.30 0.01 0.28 0.40 0.53 0.65 0.78 1.04 1.35
35 215.28 0.74 5.67 Student -4.03 -2.23 -0.70 0.03 0.74 1.45 2.17 3.71 5.51
218.49 0.55 0.98 School -0.28 0.03 0.30 0.42 0.55 0.67 0.80 1.06 1.37
40 217.33 0.69 5.67 Student -4.08 -2.28 -0.74 -0.02 0.69 1.40 2.13 3.66 5.46
219.44 0.57 0.98 School -0.26 0.05 0.32 0.44 0.57 0.69 0.81 1.08 1.39
45 219.32 0.65 5.67 Student -4.12 -2.33 -0.79 -0.07 0.65 1.36 2.08 3.62 5.42
220.36 0.58 0.98 School -0.24 0.07 0.33 0.46 0.58 0.71 0.83 1.10 1.41
48 220.49 0.62 5.67 Student -4.15 -2.35 -0.82 -0.09 0.62 1.33 2.06 3.59 5.39
220.91 0.59 0.98 School -0.23 0.08 0.35 0.47 0.59 0.72 0.84 1.11 1.42
50 221.27 0.60 5.67 Student -4.17 -2.37 -0.83 -0.11 0.60 1.31 2.04 3.57 5.37
221.27 0.60 0.98 School -0.23 0.09 0.35 0.48 0.60 0.73 0.85 1.12 1.43
52 222.05 0.58 5.67 Student -4.19 -2.39 -0.85 -0.13 0.58 1.30 2.02 3.56 5.35
221.63 0.61 0.98 School -0.22 0.09 0.36 0.49 0.61 0.73 0.86 1.13 1.44
55 223.22 0.56 5.67 Student -4.21 -2.41 -0.88 -0.15 0.56 1.27 1.99 3.53 5.33
222.17 0.62 0.98 School -0.21 0.10 0.37 0.50 0.62 0.74 0.87 1.14 1.45
60 225.21 0.51 5.67 Student -4.26 -2.46 -0.92 -0.20 0.51 1.22 1.95 3.48 5.28
223.09 0.64 0.98 School -0.19 0.12 0.39 0.51 0.64 0.76 0.89 1.15 1.47
65 227.26 0.47 5.67 Student -4.30 -2.51 -0.97 -0.25 0.47 1.18 1.90 3.44 5.23
224.04 0.66 0.98 School -0.17 0.14 0.41 0.53 0.66 0.78 0.91 1.17 1.49
70 229.42 0.42 5.67 Student -4.35 -2.56 -1.02 -0.30 0.42 1.13 1.85 3.39 5.19
225.05 0.68 0.98 School -0.15 0.16 0.43 0.55 0.68 0.80 0.93 1.19 1.51
75 231.75 0.36 5.67 Student -4.41 -2.61 -1.07 -0.35 0.36 1.07 1.80 3.33 5.13
226.13 0.70 0.98 School -0.13 0.18 0.45 0.58 0.70 0.82 0.95 1.22 1.53
80 234.35 0.30 5.67 Student -4.47 -2.67 -1.13 -0.41 0.30 1.02 1.74 3.28 5.07
227.33 0.72 0.98 School -0.10 0.21 0.47 0.60 0.72 0.85 0.97 1.24 1.55
85 237.38 0.23 5.67 Student -4.54 -2.74 -1.20 -0.48 0.23 0.95 1.67 3.21 5.00
228.74 0.75 0.98 School -0.08 0.24 0.50 0.63 0.75 0.88 1.00 1.27 1.58
90 241.19 0.15 5.67 Student -4.62 -2.82 -1.29 -0.56 0.15 0.86 1.58 3.12 4.92
230.50 0.79 0.98 School -0.04 0.27 0.54 0.66 0.79 0.91 1.04 1.30 1.62
CGI - Conditional Growth Index CGP - Conditional Growth Percentile
310

Table E.2.59: Reading Grade 10 From Last Winter To Winter Conditional Growth Percentile
Conditional Growth
Start Status Growth CGP 20 30 40 45 50 55 60 70 80
%ile RIT Mean SD CGI -0.84 -0.52 -0.25 -0.13 0.00 0.13 0.25 0.52 0.84
10 197.49 4.22 7.21 Student -1.85 0.44 2.39 3.31 4.22 5.12 6.04 7.99 10.28
208.18 2.69 2.03 School 0.98 1.63 2.18 2.44 2.69 2.95 3.21 3.76 4.40
20 204.90 3.44 7.21 Student -2.62 -0.34 1.61 2.53 3.44 4.35 5.27 7.22 9.50
211.91 2.44 2.03 School 0.73 1.37 1.92 2.18 2.44 2.69 2.95 3.50 4.15
25 207.71 3.14 7.21 Student -2.92 -0.63 1.32 2.24 3.14 4.05 4.97 6.92 9.21
213.33 2.34 2.03 School 0.63 1.28 1.83 2.09 2.34 2.60 2.86 3.41 4.05
30 210.23 2.88 7.21 Student -3.18 -0.90 1.05 1.97 2.88 3.79 4.71 6.66 8.94
214.61 2.26 2.03 School 0.55 1.19 1.74 2.00 2.26 2.51 2.77 3.32 3.97
35 212.58 2.63 7.21 Student -3.43 -1.14 0.81 1.73 2.63 3.54 4.46 6.41 8.70
215.79 2.18 2.03 School 0.47 1.11 1.66 1.92 2.18 2.43 2.69 3.24 3.89
40 214.80 2.40 7.21 Student -3.66 -1.38 0.58 1.50 2.40 3.31 4.23 6.18 8.47
216.91 2.10 2.03 School 0.39 1.03 1.59 1.84 2.10 2.36 2.61 3.17 3.81
45 216.95 2.18 7.21 Student -3.89 -1.60 0.35 1.27 2.18 3.08 4.00 5.95 8.24
217.99 2.03 2.03 School 0.32 0.96 1.51 1.77 2.03 2.28 2.54 3.09 3.74
48 218.22 2.04 7.21 Student -4.02 -1.74 0.22 1.14 2.04 2.95 3.87 5.82 8.11
218.63 1.98 2.03 School 0.27 0.92 1.47 1.73 1.98 2.24 2.50 3.05 3.69
50 219.06 1.95 7.21 Student -4.11 -1.82 0.13 1.05 1.95 2.86 3.78 5.73 8.02
219.06 1.95 2.03 School 0.24 0.89 1.44 1.70 1.95 2.21 2.47 3.02 3.66
52 219.90 1.87 7.21 Student -4.20 -1.91 0.04 0.96 1.87 2.77 3.69 5.64 7.93
219.49 1.93 2.03 School 0.22 0.86 1.41 1.67 1.93 2.18 2.44 2.99 3.64
55 221.17 1.73 7.21 Student -4.33 -2.05 -0.09 0.83 1.73 2.64 3.56 5.51 7.80
220.13 1.88 2.03 School 0.17 0.82 1.37 1.63 1.88 2.14 2.40 2.95 3.59
60 223.32 1.51 7.21 Student -4.56 -2.27 -0.32 0.60 1.51 2.41 3.33 5.29 7.57
221.21 1.81 2.03 School 0.10 0.74 1.29 1.55 1.81 2.06 2.32 2.87 3.52
65 225.54 1.27 7.21 Student -4.79 -2.50 -0.55 0.37 1.27 2.18 3.10 5.05 7.34
222.33 1.73 2.03 School 0.02 0.67 1.22 1.48 1.73 1.99 2.25 2.80 3.44
70 227.89 1.03 7.21 Student -5.04 -2.75 -0.80 0.12 1.03 1.93 2.85 4.81 7.09
223.51 1.65 2.03 School -0.06 0.59 1.14 1.40 1.65 1.91 2.17 2.72 3.36
75 230.41 0.76 7.21 Student -5.30 -3.01 -1.06 -0.14 0.76 1.67 2.59 4.54 6.83
224.79 1.57 2.03 School -0.14 0.50 1.05 1.31 1.57 1.82 2.08 2.63 3.28
80 233.22 0.47 7.21 Student -5.59 -3.31 -1.36 -0.44 0.47 1.37 2.29 4.25 6.53
226.21 1.47 2.03 School -0.24 0.41 0.96 1.22 1.47 1.73 1.99 2.54 3.18
85 236.50 0.13 7.21 Student -5.94 -3.65 -1.70 -0.78 0.13 1.03 1.95 3.90 6.19
227.86 1.36 2.03 School -0.35 0.29 0.84 1.10 1.36 1.61 1.87 2.42 3.07
90 240.63 -0.31 7.21 Student -6.37 -4.09 -2.13 -1.21 -0.31 0.60 1.52 3.47 5.76
229.94 1.22 2.03 School -0.49 0.15 0.70 0.96 1.22 1.47 1.73 2.28 2.93
CGI - Conditional Growth Index CGP - Conditional Growth Percentile
311

Table E.2.60: Reading Grade 10 From Last Spring To Spring Conditional Growth Percentile
Conditional Growth
Start Status Growth CGP 20 30 40 45 50 55 60 70 80
%ile RIT Mean SD CGI -0.84 -0.52 -0.25 -0.13 0.00 0.13 0.25 0.52 0.84
10 196.61 5.47 9.13 Student -2.21 0.68 3.16 4.32 5.47 6.62 7.78 10.26 13.16
208.14 2.93 2.79 School 0.59 1.47 2.22 2.58 2.93 3.28 3.64 4.39 5.27
20 204.45 4.18 9.13 Student -3.50 -0.61 1.87 3.04 4.18 5.33 6.50 8.97 11.87
212.03 2.51 2.79 School 0.17 1.05 1.81 2.16 2.51 2.86 3.22 3.97 4.86
25 207.43 3.69 9.13 Student -3.99 -1.10 1.38 2.55 3.69 4.84 6.01 8.48 11.38
213.51 2.35 2.79 School 0.01 0.89 1.65 2.00 2.35 2.70 3.06 3.82 4.70
30 210.11 3.25 9.13 Student -4.43 -1.54 0.94 2.11 3.25 4.40 5.57 8.04 10.94
214.83 2.21 2.79 School -0.13 0.75 1.51 1.86 2.21 2.56 2.92 3.67 4.56
35 212.59 2.85 9.13 Student -4.84 -1.94 0.53 1.70 2.85 3.99 5.16 7.63 10.53
216.06 2.08 2.79 School -0.26 0.62 1.38 1.73 2.08 2.43 2.79 3.54 4.43
40 214.95 2.46 9.13 Student -5.23 -2.33 0.15 1.31 2.46 3.61 4.77 7.25 10.14
217.23 1.96 2.79 School -0.39 0.49 1.25 1.61 1.96 2.31 2.66 3.42 4.30
45 217.22 2.08 9.13 Student -5.60 -2.70 -0.23 0.94 2.08 3.23 4.40 6.87 9.77
218.36 1.84 2.79 School -0.51 0.37 1.13 1.48 1.84 2.19 2.54 3.30 4.18
48 218.57 1.86 9.13 Student -5.82 -2.92 -0.45 0.72 1.86 3.01 4.18 6.65 9.55
219.02 1.76 2.79 School -0.58 0.30 1.06 1.41 1.76 2.11 2.47 3.22 4.11
50 219.47 1.72 9.13 Student -5.97 -3.07 -0.60 0.57 1.72 2.86 4.03 6.50 9.40
219.47 1.72 2.79 School -0.63 0.26 1.01 1.37 1.72 2.07 2.42 3.18 4.06
52 220.36 1.57 9.13 Student -6.12 -3.22 -0.74 0.42 1.57 2.72 3.88 6.36 9.25
219.91 1.67 2.79 School -0.68 0.21 0.96 1.32 1.67 2.02 2.37 3.13 4.01
55 221.71 1.35 9.13 Student -6.34 -3.44 -0.97 0.20 1.35 2.50 3.66 6.14 9.03
220.58 1.60 2.79 School -0.75 0.14 0.89 1.25 1.60 1.95 2.30 3.06 3.94
60 223.99 0.97 9.13 Student -6.71 -3.81 -1.34 -0.17 0.97 2.12 3.29 5.76 8.66
221.71 1.48 2.79 School -0.87 0.02 0.77 1.13 1.48 1.83 2.18 2.94 3.82
65 226.34 0.59 9.13 Student -7.10 -4.20 -1.73 -0.56 0.59 1.73 2.90 5.37 8.27
222.87 1.35 2.79 School -0.99 -0.11 0.65 1.00 1.35 1.70 2.06 2.81 3.70
70 228.82 0.18 9.13 Student -7.50 -4.61 -2.13 -0.97 0.18 1.33 2.49 4.97 7.86
224.10 1.22 2.79 School -1.13 -0.24 0.51 0.87 1.22 1.57 1.93 2.68 3.56
75 231.50 -0.26 9.13 Student -7.94 -5.05 -2.57 -1.41 -0.26 0.89 2.05 4.53 7.42
225.43 1.08 2.79 School -1.27 -0.38 0.37 0.73 1.08 1.43 1.78 2.54 3.42
80 234.48 -0.75 9.13 Student -8.43 -5.54 -3.06 -1.90 -0.75 0.40 1.56 4.04 6.93
226.90 0.92 2.79 School -1.43 -0.54 0.21 0.57 0.92 1.27 1.62 2.38 3.26
85 237.95 -1.32 9.13 Student -9.01 -6.11 -3.63 -2.47 -1.32 -0.17 0.99 3.47 6.36
228.63 0.73 2.79 School -1.61 -0.73 0.03 0.38 0.73 1.08 1.44 2.20 3.08
90 242.33 -2.04 9.13 Student -9.72 -6.83 -4.35 -3.19 -2.04 -0.89 0.27 2.75 5.64
230.79 0.50 2.79 School -1.84 -0.96 -0.20 0.15 0.50 0.85 1.21 1.96 2.85
CGI - Conditional Growth Index CGP - Conditional Growth Percentile
312

Table E.2.61: Reading Grade 10 From Fall To N Fall Conditional Growth Percentile
Conditional Growth
Start Status Growth CGP 20 30 40 45 50 55 60 70 80
%ile RIT Mean SD CGI -0.84 -0.52 -0.25 -0.13 0.00 0.13 0.25 0.52 0.84
10 198.84 0.31 8.34 Student -6.70 -4.06 -1.80 -0.73 0.31 1.36 2.43 4.69 7.33
209.95 0.72 2.27 School -1.19 -0.47 0.14 0.43 0.72 1.00 1.29 1.91 2.63
20 206.26 0.51 8.34 Student -6.51 -3.87 -1.61 -0.54 0.51 1.55 2.62 4.88 7.52
213.56 0.77 2.27 School -1.14 -0.42 0.20 0.49 0.77 1.06 1.35 1.96 2.68
25 209.08 0.58 8.34 Student -6.44 -3.79 -1.53 -0.47 0.58 1.63 2.69 4.95 7.59
214.92 0.79 2.27 School -1.12 -0.40 0.22 0.51 0.79 1.08 1.37 1.98 2.70
30 211.61 0.64 8.34 Student -6.37 -3.73 -1.47 -0.40 0.64 1.69 2.76 5.01 7.66
216.15 0.81 2.27 School -1.10 -0.38 0.23 0.52 0.81 1.09 1.38 2.00 2.72
35 213.95 0.70 8.34 Student -6.31 -3.67 -1.41 -0.34 0.70 1.75 2.82 5.08 7.72
217.29 0.83 2.27 School -1.08 -0.36 0.25 0.54 0.83 1.11 1.40 2.02 2.73
40 216.17 0.76 8.34 Student -6.26 -3.61 -1.35 -0.29 0.76 1.81 2.87 5.13 7.78
218.37 0.84 2.27 School -1.07 -0.35 0.27 0.56 0.84 1.13 1.42 2.03 2.75
45 218.33 0.82 8.34 Student -6.20 -3.56 -1.30 -0.23 0.82 1.86 2.93 5.19 7.83
219.42 0.86 2.27 School -1.05 -0.33 0.28 0.57 0.86 1.14 1.43 2.05 2.77
48 219.60 0.85 8.34 Student -6.17 -3.52 -1.26 -0.20 0.85 1.90 2.96 5.22 7.87
220.03 0.86 2.27 School -1.04 -0.32 0.29 0.58 0.86 1.15 1.44 2.05 2.77
50 220.44 0.87 8.34 Student -6.15 -3.50 -1.24 -0.18 0.87 1.92 2.98 5.24 7.89
220.44 0.87 2.27 School -1.04 -0.32 0.30 0.59 0.87 1.16 1.45 2.06 2.78
52 221.29 0.89 8.34 Student -6.12 -3.48 -1.22 -0.15 0.89 1.94 3.00 5.26 7.91
220.85 0.88 2.27 School -1.03 -0.31 0.30 0.59 0.88 1.16 1.45 2.07 2.79
55 222.56 0.93 8.34 Student -6.09 -3.45 -1.19 -0.12 0.93 1.97 3.04 5.30 7.94
221.47 0.89 2.27 School -1.02 -0.30 0.31 0.60 0.89 1.17 1.46 2.08 2.80
60 224.71 0.98 8.34 Student -6.04 -3.39 -1.13 -0.07 0.98 2.03 3.09 5.35 8.00
222.52 0.90 2.27 School -1.01 -0.29 0.33 0.62 0.90 1.19 1.48 2.09 2.81
65 226.94 1.04 8.34 Student -5.98 -3.33 -1.07 -0.01 1.04 2.09 3.15 5.41 8.05
223.60 0.92 2.27 School -0.99 -0.27 0.34 0.63 0.92 1.20 1.49 2.11 2.83
70 229.28 1.10 8.34 Student -5.92 -3.27 -1.01 0.05 1.10 2.15 3.21 5.47 8.11
224.74 0.93 2.27 School -0.98 -0.26 0.36 0.65 0.93 1.22 1.51 2.12 2.84
75 231.81 1.16 8.34 Student -5.85 -3.21 -0.95 0.12 1.16 2.21 3.28 5.54 8.18
225.96 0.95 2.27 School -0.96 -0.24 0.38 0.67 0.95 1.24 1.53 2.14 2.86
80 234.63 1.24 8.34 Student -5.78 -3.14 -0.88 0.19 1.24 2.28 3.35 5.61 8.25
227.33 0.97 2.27 School -0.94 -0.22 0.40 0.69 0.97 1.26 1.55 2.16 2.88
85 237.91 1.32 8.34 Student -5.70 -3.05 -0.79 0.27 1.32 2.37 3.43 5.69 8.34
228.93 0.99 2.27 School -0.92 -0.20 0.42 0.71 0.99 1.28 1.57 2.18 2.90
90 242.04 1.43 8.34 Student -5.59 -2.94 -0.68 0.38 1.43 2.48 3.54 5.80 8.44
230.93 1.02 2.27 School -0.89 -0.17 0.45 0.74 1.02 1.31 1.60 2.21 2.93
CGI - Conditional Growth Index CGP - Conditional Growth Percentile
313

Table E.2.62: Reading Grade 10 From Fall To Spring Conditional Growth Percentile
Conditional Growth
Start Status Growth CGP 20 30 40 45 50 55 60 70 80
%ile RIT Mean SD CGI -0.84 -0.52 -0.25 -0.13 0.00 0.13 0.25 0.52 0.84
10 198.84 3.47 9.42 Student -4.46 -1.47 1.08 2.28 3.47 4.65 5.85 8.41 11.39
209.95 1.11 2.77 School -1.22 -0.34 0.41 0.76 1.11 1.46 1.81 2.56 3.44
20 206.26 2.53 9.42 Student -5.40 -2.41 0.14 1.35 2.53 3.71 4.92 7.47 10.46
213.56 0.98 2.77 School -1.35 -0.47 0.28 0.63 0.98 1.33 1.68 2.43 3.31
25 209.08 2.17 9.42 Student -5.75 -2.77 -0.21 0.99 2.17 3.36 4.56 7.11 10.10
214.92 0.93 2.77 School -1.40 -0.52 0.23 0.59 0.93 1.28 1.63 2.38 3.26
30 211.61 1.85 9.42 Student -6.07 -3.09 -0.53 0.67 1.85 3.04 4.24 6.79 9.78
216.15 0.89 2.77 School -1.44 -0.56 0.19 0.54 0.89 1.24 1.59 2.34 3.22
35 213.95 1.56 9.42 Student -6.37 -3.38 -0.83 0.37 1.56 2.74 3.94 6.50 9.49
217.29 0.85 2.77 School -1.48 -0.60 0.15 0.50 0.85 1.20 1.55 2.30 3.18
40 216.17 1.28 9.42 Student -6.65 -3.66 -1.11 0.09 1.28 2.46 3.66 6.22 9.21
218.37 0.81 2.77 School -1.52 -0.64 0.11 0.46 0.81 1.16 1.51 2.26 3.14
45 218.33 1.01 9.42 Student -6.92 -3.93 -1.38 -0.18 1.01 2.19 3.39 5.95 8.93
219.42 0.77 2.77 School -1.56 -0.68 0.07 0.43 0.77 1.12 1.48 2.23 3.10
48 219.60 0.85 9.42 Student -7.08 -4.09 -1.54 -0.34 0.85 2.03 3.23 5.79 8.77
220.03 0.75 2.77 School -1.58 -0.70 0.05 0.41 0.75 1.10 1.45 2.20 3.08
50 220.44 0.74 9.42 Student -7.19 -4.20 -1.65 -0.45 0.74 1.92 3.12 5.68 8.67
220.44 0.74 2.77 School -1.59 -0.71 0.04 0.39 0.74 1.09 1.44 2.19 3.07
52 221.29 0.63 9.42 Student -7.30 -4.31 -1.75 -0.55 0.63 1.82 3.02 5.57 8.56
220.85 0.72 2.77 School -1.61 -0.73 0.02 0.38 0.72 1.07 1.43 2.18 3.05
55 222.56 0.47 9.42 Student -7.46 -4.47 -1.92 -0.71 0.47 1.65 2.86 5.41 8.40
221.47 0.70 2.77 School -1.63 -0.75 0.00 0.35 0.70 1.05 1.40 2.15 3.03
60 224.71 0.20 9.42 Student -7.73 -4.74 -2.19 -0.98 0.20 1.38 2.59 5.14 8.13
222.52 0.67 2.77 School -1.66 -0.79 -0.04 0.32 0.67 1.01 1.37 2.12 3.00
65 226.94 -0.08 9.42 Student -8.01 -5.02 -2.47 -1.27 -0.08 1.10 2.31 4.86 7.85
223.60 0.63 2.77 School -1.70 -0.82 -0.07 0.28 0.63 0.98 1.33 2.08 2.96
70 229.28 -0.38 9.42 Student -8.31 -5.32 -2.76 -1.56 -0.38 0.81 2.01 4.56 7.55
224.74 0.59 2.77 School -1.74 -0.86 -0.11 0.24 0.59 0.93 1.29 2.04 2.92
75 231.81 -0.70 9.42 Student -8.63 -5.64 -3.08 -1.88 -0.70 0.49 1.69 4.24 7.23
225.96 0.54 2.77 School -1.79 -0.91 -0.16 0.20 0.54 0.89 1.24 2.00 2.87
80 234.63 -1.05 9.42 Student -8.98 -5.99 -3.44 -2.24 -1.05 0.13 1.33 3.89 6.88
227.33 0.50 2.77 School -1.83 -0.96 -0.21 0.15 0.50 0.84 1.20 1.95 2.83
85 237.91 -1.47 9.42 Student -9.40 -6.41 -3.85 -2.65 -1.47 -0.28 0.92 3.47 6.46
228.93 0.44 2.77 School -1.89 -1.01 -0.26 0.09 0.44 0.79 1.14 1.89 2.77
90 242.04 -1.99 9.42 Student -9.92 -6.93 -4.38 -3.17 -1.99 -0.80 0.40 2.95 5.94
230.93 0.37 2.77 School -1.96 -1.08 -0.33 0.02 0.37 0.72 1.07 1.82 2.70
CGI - Conditional Growth Index CGP - Conditional Growth Percentile
314

Table E.2.63: Reading Grade 10 From Fall To Winter Conditional Growth Percentile
Conditional Growth
Start Status Growth CGP 20 30 40 45 50 55 60 70 80
%ile RIT Mean SD CGI -0.84 -0.52 -0.25 -0.13 0.00 0.13 0.25 0.52 0.84
10 198.84 2.48 6.55 Student -3.03 -0.95 0.82 1.66 2.48 3.31 4.14 5.92 8.00
209.95 0.78 1.58 School -0.55 -0.05 0.38 0.58 0.78 0.98 1.18 1.61 2.11
20 206.26 1.83 6.55 Student -3.69 -1.61 0.17 1.00 1.83 2.65 3.49 5.26 7.34
213.56 0.71 1.58 School -0.62 -0.12 0.31 0.51 0.71 0.91 1.11 1.54 2.04
25 209.08 1.58 6.55 Student -3.93 -1.86 -0.08 0.75 1.58 2.40 3.24 5.01 7.09
214.92 0.68 1.58 School -0.65 -0.15 0.28 0.48 0.68 0.88 1.08 1.51 2.01
30 211.61 1.35 6.55 Student -4.16 -2.08 -0.31 0.53 1.35 2.18 3.01 4.79 6.87
216.15 0.66 1.58 School -0.67 -0.17 0.26 0.46 0.66 0.86 1.06 1.49 1.99
35 213.95 1.15 6.55 Student -4.37 -2.29 -0.51 0.32 1.15 1.97 2.81 4.58 6.66
217.29 0.63 1.58 School -0.70 -0.20 0.23 0.44 0.63 0.83 1.03 1.46 1.97
40 216.17 0.95 6.55 Student -4.56 -2.49 -0.71 0.13 0.95 1.77 2.61 4.38 6.46
218.37 0.61 1.58 School -0.72 -0.22 0.21 0.41 0.61 0.81 1.01 1.44 1.94
45 218.33 0.76 6.55 Student -4.75 -2.68 -0.90 -0.06 0.76 1.58 2.42 4.19 6.27
219.42 0.59 1.58 School -0.74 -0.24 0.19 0.39 0.59 0.79 0.99 1.42 1.92
48 219.60 0.65 6.55 Student -4.87 -2.79 -1.01 -0.18 0.65 1.47 2.30 4.08 6.16
220.03 0.58 1.58 School -0.75 -0.25 0.18 0.38 0.58 0.78 0.98 1.41 1.91
50 220.44 0.57 6.55 Student -4.94 -2.86 -1.09 -0.25 0.57 1.39 2.23 4.01 6.08
220.44 0.57 1.58 School -0.76 -0.26 0.17 0.37 0.57 0.77 0.97 1.40 1.90
52 221.29 0.50 6.55 Student -5.02 -2.94 -1.16 -0.33 0.50 1.32 2.15 3.93 6.01
220.85 0.56 1.58 School -0.77 -0.27 0.16 0.36 0.56 0.76 0.96 1.39 1.89
55 222.56 0.38 6.55 Student -5.13 -3.05 -1.28 -0.44 0.38 1.21 2.04 3.82 5.90
221.47 0.55 1.58 School -0.78 -0.28 0.15 0.35 0.55 0.75 0.95 1.38 1.88
60 224.71 0.19 6.55 Student -5.32 -3.24 -1.47 -0.63 0.19 1.02 1.85 3.63 5.70
222.52 0.53 1.58 School -0.80 -0.30 0.13 0.33 0.53 0.73 0.93 1.36 1.86
65 226.94 -0.00 6.55 Student -5.52 -3.44 -1.66 -0.83 -0.00 0.82 1.65 3.43 5.51
223.60 0.51 1.58 School -0.83 -0.32 0.11 0.31 0.51 0.71 0.91 1.34 1.84
70 229.28 -0.21 6.55 Student -5.72 -3.65 -1.87 -1.04 -0.21 0.61 1.45 3.22 5.30
224.74 0.48 1.58 School -0.85 -0.35 0.08 0.28 0.48 0.68 0.88 1.31 1.82
75 231.81 -0.44 6.55 Student -5.95 -3.87 -2.10 -1.26 -0.44 0.39 1.22 3.00 5.08
225.96 0.46 1.58 School -0.87 -0.37 0.06 0.26 0.46 0.66 0.86 1.29 1.79
80 234.63 -0.69 6.55 Student -6.20 -4.12 -2.35 -1.51 -0.69 0.14 0.97 2.75 4.83
227.33 0.43 1.58 School -0.90 -0.40 0.03 0.23 0.43 0.63 0.83 1.26 1.76
85 237.91 -0.98 6.55 Student -6.49 -4.41 -2.64 -1.80 -0.98 -0.15 0.68 2.46 4.54
228.93 0.40 1.58 School -0.93 -0.43 -0.00 0.20 0.40 0.60 0.80 1.23 1.73
90 242.04 -1.34 6.55 Student -6.86 -4.78 -3.00 -2.17 -1.34 -0.52 0.32 2.09 4.17
230.93 0.36 1.58 School -0.97 -0.47 -0.04 0.16 0.36 0.56 0.76 1.19 1.69
CGI - Conditional Growth Index CGP - Conditional Growth Percentile
315

Table E.2.64: Reading Grade 10 From Winter To Spring Conditional Growth Percentile
Conditional Growth
Start Status Growth CGP 20 30 40 45 50 55 60 70 80
%ile RIT Mean SD CGI -0.84 -0.52 -0.25 -0.13 0.00 0.13 0.25 0.52 0.84
10 199.61 0.48 5.90 Student -4.49 -2.61 -1.01 -0.26 0.48 1.22 1.98 3.58 5.45
210.54 0.03 1.19 School -0.97 -0.59 -0.27 -0.12 0.03 0.18 0.33 0.65 1.03
20 206.96 0.37 5.90 Student -4.59 -2.72 -1.12 -0.37 0.37 1.12 1.87 3.47 5.34
214.13 0.08 1.19 School -0.92 -0.55 -0.22 -0.07 0.08 0.23 0.38 0.70 1.08
25 209.75 0.33 5.90 Student -4.64 -2.76 -1.16 -0.41 0.33 1.08 1.83 3.43 5.30
215.50 0.10 1.19 School -0.91 -0.53 -0.21 -0.05 0.10 0.24 0.40 0.72 1.10
30 212.26 0.30 5.90 Student -4.67 -2.80 -1.20 -0.45 0.30 1.04 1.79 3.39 5.27
216.73 0.11 1.19 School -0.89 -0.51 -0.19 -0.04 0.11 0.26 0.41 0.74 1.11
35 214.58 0.26 5.90 Student -4.71 -2.83 -1.23 -0.48 0.26 1.00 1.76 3.36 5.23
217.86 0.13 1.19 School -0.88 -0.50 -0.18 -0.02 0.13 0.28 0.43 0.75 1.13
40 216.78 0.23 5.90 Student -4.74 -2.87 -1.27 -0.51 0.23 0.97 1.73 3.33 5.20
218.94 0.14 1.19 School -0.86 -0.48 -0.16 -0.01 0.14 0.29 0.44 0.76 1.14
45 218.92 0.20 5.90 Student -4.77 -2.90 -1.30 -0.54 0.20 0.94 1.69 3.29 5.17
219.99 0.15 1.19 School -0.85 -0.47 -0.15 0.00 0.15 0.30 0.46 0.78 1.16
48 220.18 0.18 5.90 Student -4.79 -2.92 -1.32 -0.56 0.18 0.92 1.68 3.28 5.15
220.60 0.16 1.19 School -0.84 -0.46 -0.14 0.01 0.16 0.31 0.46 0.79 1.16
50 221.01 0.17 5.90 Student -4.80 -2.93 -1.33 -0.57 0.17 0.91 1.66 3.26 5.14
221.01 0.17 1.19 School -0.83 -0.46 -0.13 0.02 0.17 0.32 0.47 0.79 1.17
52 221.85 0.16 5.90 Student -4.81 -2.94 -1.34 -0.59 0.16 0.90 1.65 3.25 5.12
221.42 0.17 1.19 School -0.83 -0.45 -0.13 0.02 0.17 0.32 0.47 0.80 1.18
55 223.11 0.14 5.90 Student -4.83 -2.96 -1.36 -0.60 0.14 0.88 1.63 3.23 5.11
222.04 0.18 1.19 School -0.82 -0.44 -0.12 0.03 0.18 0.33 0.48 0.81 1.18
60 225.25 0.11 5.90 Student -4.86 -2.99 -1.39 -0.64 0.11 0.85 1.60 3.20 5.07
223.09 0.20 1.19 School -0.81 -0.43 -0.11 0.05 0.20 0.34 0.50 0.82 1.20
65 227.45 0.07 5.90 Student -4.90 -3.02 -1.42 -0.67 0.07 0.82 1.57 3.17 5.04
224.16 0.21 1.19 School -0.79 -0.41 -0.09 0.06 0.21 0.36 0.51 0.83 1.21
70 229.77 0.04 5.90 Student -4.93 -3.06 -1.46 -0.70 0.04 0.78 1.54 3.14 5.01
225.30 0.22 1.19 School -0.78 -0.40 -0.08 0.07 0.22 0.37 0.53 0.85 1.23
75 232.28 0.00 5.90 Student -4.97 -3.09 -1.49 -0.74 0.00 0.74 1.50 3.10 4.97
226.53 0.24 1.19 School -0.76 -0.38 -0.06 0.09 0.24 0.39 0.54 0.86 1.24
80 235.07 -0.04 5.90 Student -5.01 -3.13 -1.53 -0.78 -0.04 0.70 1.46 3.06 4.93
227.89 0.26 1.19 School -0.74 -0.37 -0.04 0.11 0.26 0.41 0.56 0.88 1.26
85 238.32 -0.09 5.90 Student -5.05 -3.18 -1.58 -0.83 -0.09 0.66 1.41 3.01 4.88
229.49 0.28 1.19 School -0.72 -0.34 -0.02 0.13 0.28 0.43 0.58 0.90 1.28
90 242.42 -0.15 5.90 Student -5.11 -3.24 -1.64 -0.89 -0.15 0.60 1.35 2.95 4.82
231.49 0.31 1.19 School -0.70 -0.32 0.00 0.16 0.31 0.46 0.61 0.93 1.31
CGI - Conditional Growth Index CGP - Conditional Growth Percentile
316

Appendix E.3 - Language Usage
Table E.3.1: Language Usage Grade 2 From Last Winter To Winter Conditional Growth Percentile
Conditional Growth
Start Status Growth CGP 20 30 40 45 50 55 60 70 80
%ile RIT Mean SD CGI -0.84 -0.52 -0.25 -0.13 0.00 0.13 0.25 0.52 0.84
10 146.42 20.60 6.31 Student 15.29 17.29 19.00 19.81 20.60 21.39 22.20 23.91 25.91
160.04 16.95 2.34 School 14.98 15.72 16.36 16.66 16.95 17.24 17.54 18.18 18.92
20 154.37 18.81 6.31 Student 13.50 15.50 17.21 18.02 18.81 19.60 20.41 22.12 24.12
163.31 16.41 2.34 School 14.44 15.19 15.82 16.12 16.41 16.71 17.00 17.64 18.38
25 157.38 18.13 6.31 Student 12.82 14.82 16.53 17.34 18.13 18.92 19.73 21.44 23.44
164.55 16.21 2.34 School 14.24 14.98 15.61 15.91 16.21 16.50 16.80 17.43 18.17
30 160.09 17.52 6.31 Student 12.20 14.21 15.92 16.72 17.52 18.31 19.12 20.83 22.83
165.66 16.02 2.34 School 14.06 14.80 15.43 15.73 16.02 16.32 16.62 17.25 17.99
35 162.60 16.95 6.31 Student 11.64 13.64 15.35 16.16 16.95 17.74 18.55 20.26 22.26
166.70 15.85 2.34 School 13.89 14.63 15.26 15.56 15.85 16.15 16.45 17.08 17.82
40 164.98 16.41 6.31 Student 11.10 13.10 14.81 15.62 16.41 17.21 18.01 19.72 21.73
167.68 15.69 2.34 School 13.72 14.47 15.10 15.40 15.69 15.99 16.28 16.92 17.66
45 167.29 15.89 6.31 Student 10.58 12.58 14.29 15.10 15.89 16.69 17.49 19.20 21.21
168.62 15.54 2.34 School 13.57 14.31 14.94 15.24 15.54 15.83 16.13 16.76 17.50
48 168.65 15.59 6.31 Student 10.27 12.28 13.99 14.79 15.59 16.38 17.19 18.90 20.90
169.19 15.44 2.34 School 13.48 14.22 14.85 15.15 15.44 15.74 16.04 16.67 17.41
50 169.56 15.38 6.31 Student 10.07 12.07 13.78 14.59 15.38 16.18 16.98 18.69 20.70
169.56 15.38 2.34 School 13.41 14.16 14.79 15.09 15.38 15.68 15.97 16.61 17.35
52 170.46 15.18 6.31 Student 9.87 11.87 13.58 14.38 15.18 15.97 16.78 18.49 20.49
169.93 15.32 2.34 School 13.35 14.09 14.73 15.03 15.32 15.61 15.91 16.55 17.29
55 171.83 14.87 6.31 Student 9.56 11.56 13.27 14.08 14.87 15.66 16.47 18.18 20.18
170.49 15.23 2.34 School 13.26 14.00 14.64 14.93 15.23 15.52 15.82 16.45 17.20
60 174.13 14.35 6.31 Student 9.04 11.04 12.75 13.56 14.35 15.14 15.95 17.66 19.66
171.44 15.07 2.34 School 13.10 13.85 14.48 14.78 15.07 15.37 15.66 16.30 17.04
65 176.51 13.81 6.31 Student 8.50 10.50 12.21 13.02 13.81 14.61 15.41 17.12 19.13
172.42 14.91 2.34 School 12.94 13.69 14.32 14.62 14.91 15.20 15.50 16.14 16.88
70 179.02 13.25 6.31 Student 7.93 9.94 11.65 12.45 13.25 14.04 14.85 16.56 18.56
173.45 14.74 2.34 School 12.77 13.51 14.15 14.45 14.74 15.03 15.33 15.97 16.71
75 181.73 12.64 6.31 Student 7.32 9.33 11.04 11.84 12.64 13.43 14.24 15.95 17.95
174.57 14.56 2.34 School 12.59 13.33 13.97 14.26 14.56 14.85 15.15 15.78 16.52
80 184.75 11.96 6.31 Student 6.64 8.64 10.36 11.16 11.96 12.75 13.55 15.27 17.27
175.81 14.35 2.34 School 12.39 13.13 13.76 14.06 14.35 14.65 14.95 15.58 16.32
85 188.27 11.16 6.31 Student 5.85 7.85 9.56 10.37 11.16 11.96 12.76 14.47 16.48
177.25 14.11 2.34 School 12.15 12.89 13.52 13.82 14.11 14.41 14.71 15.34 16.08
90 192.69 10.16 6.31 Student 4.85 6.85 8.56 9.37 10.16 10.96 11.76 13.47 15.48
179.07 13.82 2.34 School 11.85 12.59 13.22 13.52 13.82 14.11 14.41 15.04 15.78
CGI - Conditional Growth Index CGP - Conditional Growth Percentile
317

Table E.3.2: Language Usage Grade 2 From Last Spring To Spring Conditional Growth Percentile
Conditional Growth
Start Status Growth CGP 20 30 40 45 50 55 60 70 80
%ile RIT Mean SD CGI -0.84 -0.52 -0.25 -0.13 0.00 0.13 0.25 0.52 0.84
10 151.23 20.86 7.12 Student 14.87 17.13 19.06 19.97 20.86 21.76 22.67 24.60 26.86
166.15 15.47 2.69 School 13.21 14.06 14.79 15.13 15.47 15.81 16.15 16.88 17.73
20 159.90 18.23 7.12 Student 12.23 14.49 16.42 17.33 18.23 19.12 20.03 21.96 24.22
169.70 14.69 2.69 School 12.42 13.28 14.00 14.35 14.69 15.02 15.37 16.09 16.95
25 163.20 17.23 7.12 Student 11.23 13.49 15.42 16.33 17.23 18.12 19.03 20.96 23.22
171.05 14.39 2.69 School 12.13 12.98 13.71 14.05 14.39 14.73 15.07 15.80 16.65
30 166.16 16.33 7.12 Student 10.33 12.59 14.52 15.43 16.33 17.22 18.13 20.06 22.32
172.26 14.12 2.69 School 11.86 12.71 13.44 13.78 14.12 14.46 14.80 15.53 16.38
35 168.90 15.49 7.12 Student 9.50 11.76 13.69 14.60 15.49 16.39 17.30 19.23 21.49
173.39 13.87 2.69 School 11.61 12.46 13.19 13.53 13.87 14.21 14.55 15.28 16.13
40 171.50 14.70 7.12 Student 8.71 10.97 12.90 13.81 14.70 15.60 16.51 18.44 20.70
174.45 13.64 2.69 School 11.38 12.23 12.96 13.30 13.64 13.97 14.32 15.05 15.90
45 174.02 13.94 7.12 Student 7.94 10.20 12.13 13.04 13.94 14.83 15.74 17.67 19.93
175.48 13.41 2.69 School 11.15 12.00 12.73 13.07 13.41 13.75 14.09 14.82 15.67
48 175.51 13.49 7.12 Student 7.49 9.75 11.68 12.59 13.49 14.38 15.29 17.22 19.48
176.09 13.27 2.69 School 11.01 11.87 12.59 12.94 13.27 13.61 13.96 14.68 15.54
50 176.50 13.18 7.12 Student 7.19 9.45 11.38 12.29 13.18 14.08 14.99 16.92 19.18
176.50 13.18 2.69 School 10.92 11.78 12.50 12.85 13.18 13.52 13.87 14.59 15.45
52 177.49 12.88 7.12 Student 6.89 9.15 11.08 11.99 12.88 13.78 14.69 16.62 18.88
176.90 13.10 2.69 School 10.83 11.69 12.41 12.76 13.10 13.43 13.78 14.50 15.36
55 178.98 12.43 7.12 Student 6.44 8.70 10.63 11.54 12.43 13.33 14.24 16.17 18.43
177.51 12.96 2.69 School 10.70 11.55 12.28 12.62 12.96 13.30 13.64 14.37 15.22
60 181.49 11.67 7.12 Student 5.67 7.93 9.86 10.77 11.67 12.56 13.47 15.40 17.66
178.54 12.73 2.69 School 10.47 11.32 12.05 12.40 12.73 13.07 13.41 14.14 14.99
65 184.10 10.88 7.12 Student 4.88 7.14 9.07 9.98 10.88 11.77 12.68 14.61 16.87
179.61 12.50 2.69 School 10.24 11.09 11.82 12.16 12.50 12.84 13.18 13.91 14.76
70 186.84 10.04 7.12 Student 4.05 6.31 8.24 9.15 10.04 10.94 11.85 13.78 16.04
180.73 12.25 2.69 School 9.99 10.84 11.57 11.91 12.25 12.59 12.93 13.66 14.51
75 189.80 9.14 7.12 Student 3.15 5.41 7.34 8.25 9.14 10.04 10.95 12.88 15.14
181.94 11.98 2.69 School 9.72 10.57 11.30 11.64 11.98 12.32 12.66 13.39 14.24
80 193.09 8.14 7.12 Student 2.15 4.41 6.34 7.25 8.14 9.04 9.95 11.88 14.14
183.29 11.68 2.69 School 9.42 10.28 11.00 11.35 11.68 12.02 12.37 13.09 13.95
85 196.94 6.98 7.12 Student 0.98 3.24 5.17 6.08 6.98 7.87 8.78 10.71 12.97
184.87 11.34 2.69 School 9.08 9.93 10.66 11.00 11.34 11.67 12.02 12.75 13.60
90 201.77 5.51 7.12 Student -0.49 1.77 3.70 4.61 5.51 6.40 7.31 9.24 11.50
186.85 10.90 2.69 School 8.64 9.49 10.22 10.56 10.90 11.24 11.58 12.31 13.16
CGI - Conditional Growth Index CGP - Conditional Growth Percentile
318
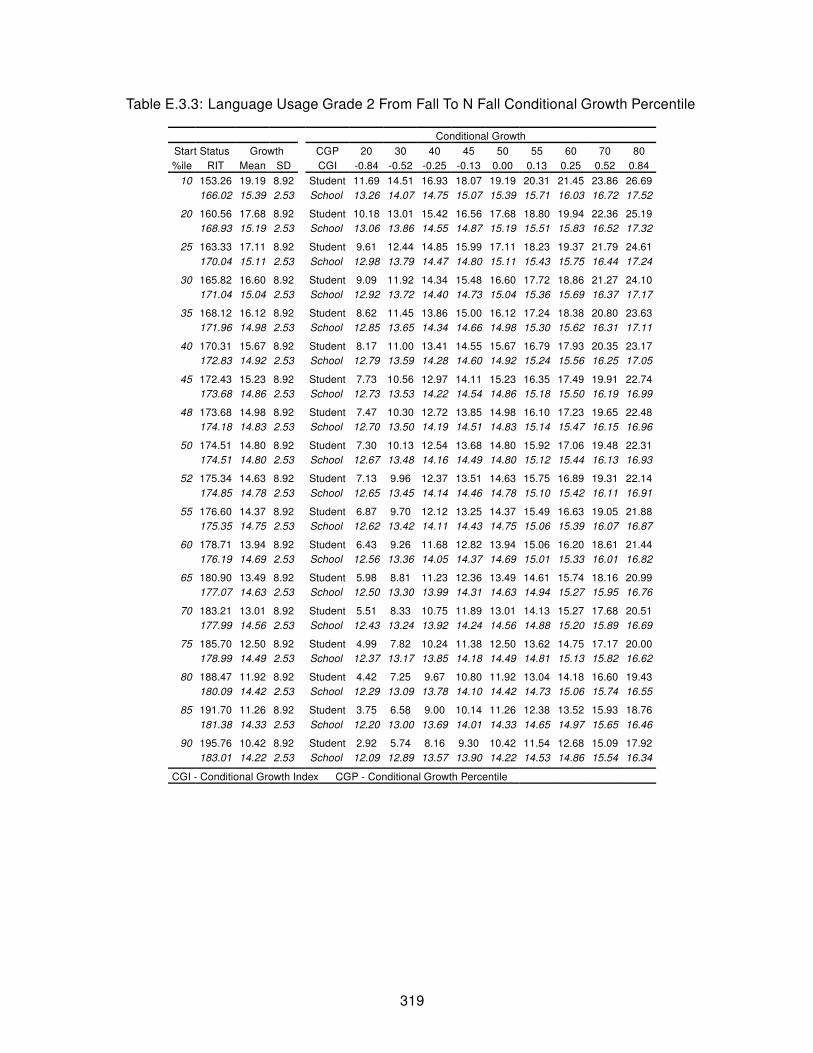
Table E.3.3: Language Usage Grade 2 From Fall To N Fall Conditional Growth Percentile
Conditional Growth
Start Status Growth CGP 20 30 40 45 50 55 60 70 80
%ile RIT Mean SD CGI -0.84 -0.52 -0.25 -0.13 0.00 0.13 0.25 0.52 0.84
10 153.26 19.19 8.92 Student 11.69 14.51 16.93 18.07 19.19 20.31 21.45 23.86 26.69
166.02 15.39 2.53 School 13.26 14.07 14.75 15.07 15.39 15.71 16.03 16.72 17.52
20 160.56 17.68 8.92 Student 10.18 13.01 15.42 16.56 17.68 18.80 19.94 22.36 25.19
168.93 15.19 2.53 School 13.06 13.86 14.55 14.87 15.19 15.51 15.83 16.52 17.32
25 163.33 17.11 8.92 Student 9.61 12.44 14.85 15.99 17.11 18.23 19.37 21.79 24.61
170.04 15.11 2.53 School 12.98 13.79 14.47 14.80 15.11 15.43 15.75 16.44 17.24
30 165.82 16.60 8.92 Student 9.09 11.92 14.34 15.48 16.60 17.72 18.86 21.27 24.10
171.04 15.04 2.53 School 12.92 13.72 14.40 14.73 15.04 15.36 15.69 16.37 17.17
35 168.12 16.12 8.92 Student 8.62 11.45 13.86 15.00 16.12 17.24 18.38 20.80 23.63
171.96 14.98 2.53 School 12.85 13.65 14.34 14.66 14.98 15.30 15.62 16.31 17.11
40 170.31 15.67 8.92 Student 8.17 11.00 13.41 14.55 15.67 16.79 17.93 20.35 23.17
172.83 14.92 2.53 School 12.79 13.59 14.28 14.60 14.92 15.24 15.56 16.25 17.05
45 172.43 15.23 8.92 Student 7.73 10.56 12.97 14.11 15.23 16.35 17.49 19.91 22.74
173.68 14.86 2.53 School 12.73 13.53 14.22 14.54 14.86 15.18 15.50 16.19 16.99
48 173.68 14.98 8.92 Student 7.47 10.30 12.72 13.85 14.98 16.10 17.23 19.65 22.48
174.18 14.83 2.53 School 12.70 13.50 14.19 14.51 14.83 15.14 15.47 16.15 16.96
50 174.51 14.80 8.92 Student 7.30 10.13 12.54 13.68 14.80 15.92 17.06 19.48 22.31
174.51 14.80 2.53 School 12.67 13.48 14.16 14.49 14.80 15.12 15.44 16.13 16.93
52 175.34 14.63 8.92 Student 7.13 9.96 12.37 13.51 14.63 15.75 16.89 19.31 22.14
174.85 14.78 2.53 School 12.65 13.45 14.14 14.46 14.78 15.10 15.42 16.11 16.91
55 176.60 14.37 8.92 Student 6.87 9.70 12.12 13.25 14.37 15.49 16.63 19.05 21.88
175.35 14.75 2.53 School 12.62 13.42 14.11 14.43 14.75 15.06 15.39 16.07 16.87
60 178.71 13.94 8.92 Student 6.43 9.26 11.68 12.82 13.94 15.06 16.20 18.61 21.44
176.19 14.69 2.53 School 12.56 13.36 14.05 14.37 14.69 15.01 15.33 16.01 16.82
65 180.90 13.49 8.92 Student 5.98 8.81 11.23 12.36 13.49 14.61 15.74 18.16 20.99
177.07 14.63 2.53 School 12.50 13.30 13.99 14.31 14.63 14.94 15.27 15.95 16.76
70 183.21 13.01 8.92 Student 5.51 8.33 10.75 11.89 13.01 14.13 15.27 17.68 20.51
177.99 14.56 2.53 School 12.43 13.24 13.92 14.24 14.56 14.88 15.20 15.89 16.69
75 185.70 12.50 8.92 Student 4.99 7.82 10.24 11.38 12.50 13.62 14.75 17.17 20.00
178.99 14.49 2.53 School 12.37 13.17 13.85 14.18 14.49 14.81 15.13 15.82 16.62
80 188.47 11.92 8.92 Student 4.42 7.25 9.67 10.80 11.92 13.04 14.18 16.60 19.43
180.09 14.42 2.53 School 12.29 13.09 13.78 14.10 14.42 14.73 15.06 15.74 16.55
85 191.70 11.26 8.92 Student 3.75 6.58 9.00 10.14 11.26 12.38 13.52 15.93 18.76
181.38 14.33 2.53 School 12.20 13.00 13.69 14.01 14.33 14.65 14.97 15.65 16.46
90 195.76 10.42 8.92 Student 2.92 5.74 8.16 9.30 10.42 11.54 12.68 15.09 17.92
183.01 14.22 2.53 School 12.09 12.89 13.57 13.90 14.22 14.53 14.86 15.54 16.34
CGI - Conditional Growth Index CGP - Conditional Growth Percentile
319
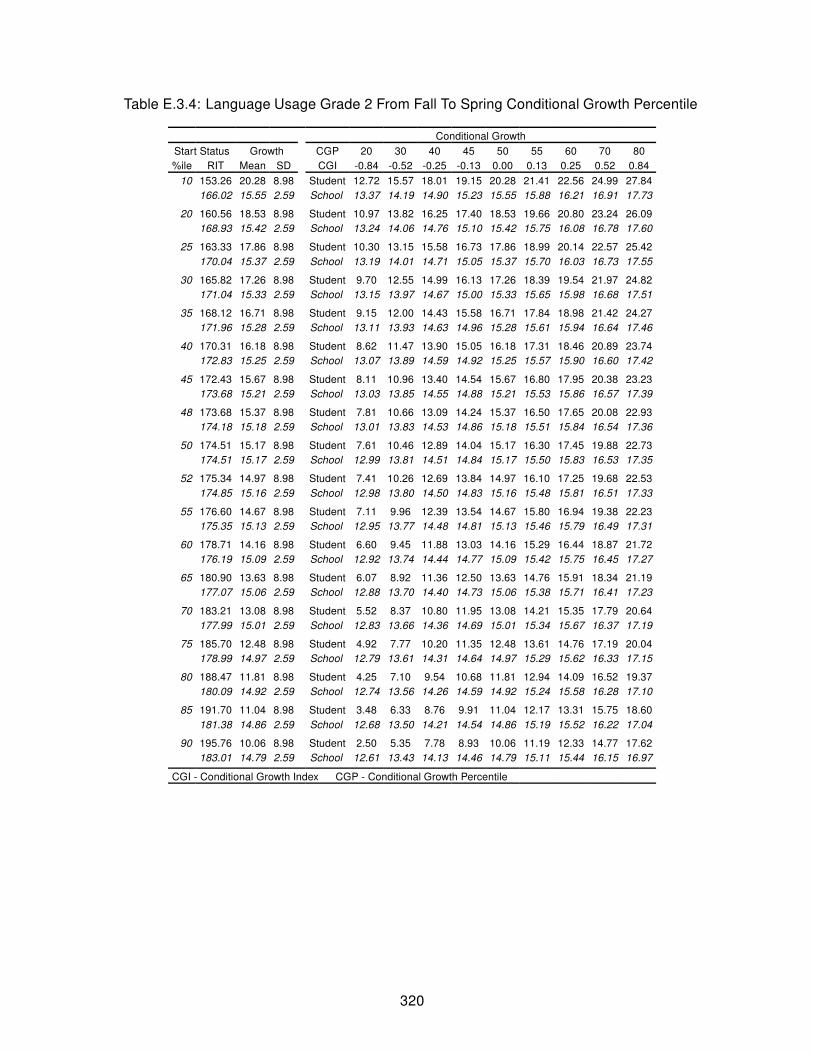
Table E.3.4: Language Usage Grade 2 From Fall To Spring Conditional Growth Percentile
Conditional Growth
Start Status Growth CGP 20 30 40 45 50 55 60 70 80
%ile RIT Mean SD CGI -0.84 -0.52 -0.25 -0.13 0.00 0.13 0.25 0.52 0.84
10 153.26 20.28 8.98 Student 12.72 15.57 18.01 19.15 20.28 21.41 22.56 24.99 27.84
166.02 15.55 2.59 School 13.37 14.19 14.90 15.23 15.55 15.88 16.21 16.91 17.73
20 160.56 18.53 8.98 Student 10.97 13.82 16.25 17.40 18.53 19.66 20.80 23.24 26.09
168.93 15.42 2.59 School 13.24 14.06 14.76 15.10 15.42 15.75 16.08 16.78 17.60
25 163.33 17.86 8.98 Student 10.30 13.15 15.58 16.73 17.86 18.99 20.14 22.57 25.42
170.04 15.37 2.59 School 13.19 14.01 14.71 15.05 15.37 15.70 16.03 16.73 17.55
30 165.82 17.26 8.98 Student 9.70 12.55 14.99 16.13 17.26 18.39 19.54 21.97 24.82
171.04 15.33 2.59 School 13.15 13.97 14.67 15.00 15.33 15.65 15.98 16.68 17.51
35 168.12 16.71 8.98 Student 9.15 12.00 14.43 15.58 16.71 17.84 18.98 21.42 24.27
171.96 15.28 2.59 School 13.11 13.93 14.63 14.96 15.28 15.61 15.94 16.64 17.46
40 170.31 16.18 8.98 Student 8.62 11.47 13.90 15.05 16.18 17.31 18.46 20.89 23.74
172.83 15.25 2.59 School 13.07 13.89 14.59 14.92 15.25 15.57 15.90 16.60 17.42
45 172.43 15.67 8.98 Student 8.11 10.96 13.40 14.54 15.67 16.80 17.95 20.38 23.23
173.68 15.21 2.59 School 13.03 13.85 14.55 14.88 15.21 15.53 15.86 16.57 17.39
48 173.68 15.37 8.98 Student 7.81 10.66 13.09 14.24 15.37 16.50 17.65 20.08 22.93
174.18 15.18 2.59 School 13.01 13.83 14.53 14.86 15.18 15.51 15.84 16.54 17.36
50 174.51 15.17 8.98 Student 7.61 10.46 12.89 14.04 15.17 16.30 17.45 19.88 22.73
174.51 15.17 2.59 School 12.99 13.81 14.51 14.84 15.17 15.50 15.83 16.53 17.35
52 175.34 14.97 8.98 Student 7.41 10.26 12.69 13.84 14.97 16.10 17.25 19.68 22.53
174.85 15.16 2.59 School 12.98 13.80 14.50 14.83 15.16 15.48 15.81 16.51 17.33
55 176.60 14.67 8.98 Student 7.11 9.96 12.39 13.54 14.67 15.80 16.94 19.38 22.23
175.35 15.13 2.59 School 12.95 13.77 14.48 14.81 15.13 15.46 15.79 16.49 17.31
60 178.71 14.16 8.98 Student 6.60 9.45 11.88 13.03 14.16 15.29 16.44 18.87 21.72
176.19 15.09 2.59 School 12.92 13.74 14.44 14.77 15.09 15.42 15.75 16.45 17.27
65 180.90 13.63 8.98 Student 6.07 8.92 11.36 12.50 13.63 14.76 15.91 18.34 21.19
177.07 15.06 2.59 School 12.88 13.70 14.40 14.73 15.06 15.38 15.71 16.41 17.23
70 183.21 13.08 8.98 Student 5.52 8.37 10.80 11.95 13.08 14.21 15.35 17.79 20.64
177.99 15.01 2.59 School 12.83 13.66 14.36 14.69 15.01 15.34 15.67 16.37 17.19
75 185.70 12.48 8.98 Student 4.92 7.77 10.20 11.35 12.48 13.61 14.76 17.19 20.04
178.99 14.97 2.59 School 12.79 13.61 14.31 14.64 14.97 15.29 15.62 16.33 17.15
80 188.47 11.81 8.98 Student 4.25 7.10 9.54 10.68 11.81 12.94 14.09 16.52 19.37
180.09 14.92 2.59 School 12.74 13.56 14.26 14.59 14.92 15.24 15.58 16.28 17.10
85 191.70 11.04 8.98 Student 3.48 6.33 8.76 9.91 11.04 12.17 13.31 15.75 18.60
181.38 14.86 2.59 School 12.68 13.50 14.21 14.54 14.86 15.19 15.52 16.22 17.04
90 195.76 10.06 8.98 Student 2.50 5.35 7.78 8.93 10.06 11.19 12.33 14.77 17.62
183.01 14.79 2.59 School 12.61 13.43 14.13 14.46 14.79 15.11 15.44 16.15 16.97
CGI - Conditional Growth Index CGP - Conditional Growth Percentile
320

Table E.3.5: Language Usage Grade 2 From Fall To Winter Conditional Growth Percentile
Conditional Growth
Start Status Growth CGP 20 30 40 45 50 55 60 70 80
%ile RIT Mean SD CGI -0.84 -0.52 -0.25 -0.13 0.00 0.13 0.25 0.52 0.84
10 153.26 13.65 6.11 Student 8.50 10.44 12.10 12.88 13.65 14.41 15.19 16.85 18.79
166.02 10.65 1.48 School 9.40 9.87 10.27 10.46 10.65 10.83 11.02 11.42 11.89
20 160.56 12.54 6.11 Student 7.40 9.34 10.99 11.77 12.54 13.31 14.09 15.75 17.68
168.93 10.57 1.48 School 9.32 9.79 10.20 10.38 10.57 10.76 10.95 11.35 11.82
25 163.33 12.12 6.11 Student 6.98 8.92 10.57 11.35 12.12 12.89 13.67 15.33 17.26
170.04 10.54 1.48 School 9.30 9.77 10.17 10.36 10.54 10.73 10.92 11.32 11.79
30 165.82 11.74 6.11 Student 6.60 8.54 10.20 10.98 11.74 12.51 13.29 14.95 16.89
171.04 10.52 1.48 School 9.27 9.74 10.14 10.33 10.52 10.70 10.89 11.29 11.76
35 168.12 11.39 6.11 Student 6.25 8.19 9.85 10.63 11.39 12.16 12.94 14.60 16.54
171.96 10.49 1.48 School 9.25 9.72 10.12 10.31 10.49 10.68 10.87 11.27 11.74
40 170.31 11.06 6.11 Student 5.92 7.86 9.51 10.30 11.06 11.83 12.61 14.27 16.21
172.83 10.47 1.48 School 9.22 9.69 10.09 10.28 10.47 10.66 10.84 11.25 11.72
45 172.43 10.74 6.11 Student 5.60 7.54 9.19 9.97 10.74 11.51 12.29 13.95 15.89
173.68 10.45 1.48 School 9.20 9.67 10.07 10.26 10.45 10.63 10.82 11.22 11.69
48 173.68 10.55 6.11 Student 5.41 7.35 9.00 9.78 10.55 11.32 12.10 13.76 15.70
174.18 10.44 1.48 School 9.19 9.66 10.06 10.25 10.44 10.62 10.81 11.21 11.68
50 174.51 10.43 6.11 Student 5.28 7.22 8.88 9.66 10.43 11.19 11.98 13.63 15.57
174.51 10.43 1.48 School 9.18 9.65 10.05 10.24 10.43 10.61 10.80 11.20 11.67
52 175.34 10.30 6.11 Student 5.16 7.10 8.75 9.53 10.30 11.07 11.85 13.51 15.44
174.85 10.42 1.48 School 9.17 9.64 10.04 10.23 10.42 10.60 10.79 11.19 11.66
55 176.60 10.11 6.11 Student 4.97 6.91 8.56 9.34 10.11 10.88 11.66 13.32 15.25
175.35 10.41 1.48 School 9.16 9.63 10.03 10.22 10.41 10.59 10.78 11.18 11.65
60 178.71 9.79 6.11 Student 4.65 6.59 8.24 9.02 9.79 10.56 11.34 13.00 14.93
176.19 10.38 1.48 School 9.14 9.61 10.01 10.20 10.38 10.57 10.76 11.16 11.63
65 180.90 9.46 6.11 Student 4.32 6.25 7.91 8.69 9.46 10.23 11.01 12.66 14.60
177.07 10.36 1.48 School 9.12 9.58 9.99 10.18 10.36 10.55 10.74 11.14 11.61
70 183.21 9.11 6.11 Student 3.97 5.90 7.56 8.34 9.11 9.88 10.66 12.31 14.25
177.99 10.34 1.48 School 9.09 9.56 9.96 10.15 10.34 10.52 10.71 11.11 11.58
75 185.70 8.73 6.11 Student 3.59 5.53 7.18 7.96 8.73 9.50 10.28 11.94 13.88
178.99 10.31 1.48 School 9.07 9.54 9.94 10.13 10.31 10.50 10.69 11.09 11.56
80 188.47 8.31 6.11 Student 3.17 5.11 6.76 7.55 8.31 9.08 9.86 11.52 13.46
180.09 10.28 1.48 School 9.04 9.51 9.91 10.10 10.28 10.47 10.66 11.06 11.53
85 191.70 7.82 6.11 Student 2.68 4.62 6.28 7.06 7.82 8.59 9.37 11.03 12.97
181.38 10.25 1.48 School 9.00 9.47 9.88 10.06 10.25 10.44 10.63 11.03 11.50
90 195.76 7.21 6.11 Student 2.06 4.00 5.66 6.44 7.21 7.98 8.76 10.41 12.35
183.01 10.21 1.48 School 8.96 9.43 9.83 10.02 10.21 10.39 10.58 10.98 11.45
CGI - Conditional Growth Index CGP - Conditional Growth Percentile
321

Table E.3.6: Language Usage Grade 2 From Winter To Spring Conditional Growth Percentile
Conditional Growth
Start Status Growth CGP 20 30 40 45 50 55 60 70 80
%ile RIT Mean SD CGI -0.84 -0.52 -0.25 -0.13 0.00 0.13 0.25 0.52 0.84
10 165.28 5.93 5.62 Student 1.20 2.99 4.51 5.23 5.93 6.64 7.36 8.88 10.66
176.45 4.59 1.11 School 3.65 4.00 4.30 4.45 4.59 4.73 4.87 5.17 5.52
20 172.03 5.52 5.62 Student 0.80 2.58 4.10 4.82 5.52 6.23 6.95 8.47 10.25
179.36 4.64 1.11 School 3.70 4.06 4.36 4.50 4.64 4.78 4.92 5.22 5.57
25 174.59 5.37 5.62 Student 0.64 2.42 3.95 4.66 5.37 6.08 6.79 8.32 10.10
180.47 4.66 1.11 School 3.73 4.08 4.38 4.52 4.66 4.80 4.94 5.24 5.59
30 176.90 5.23 5.62 Student 0.50 2.28 3.81 4.52 5.23 5.94 6.65 8.18 9.96
181.46 4.68 1.11 School 3.74 4.10 4.40 4.54 4.68 4.82 4.96 5.26 5.61
35 179.03 5.10 5.62 Student 0.37 2.15 3.68 4.39 5.10 5.81 6.52 8.05 9.83
182.39 4.70 1.11 School 3.76 4.11 4.41 4.56 4.70 4.84 4.98 5.28 5.63
40 181.05 4.98 5.62 Student 0.25 2.03 3.55 4.27 4.98 5.68 6.40 7.92 9.71
183.26 4.71 1.11 School 3.78 4.13 4.43 4.57 4.71 4.85 4.99 5.29 5.65
45 183.01 4.86 5.62 Student 0.13 1.91 3.44 4.15 4.86 5.57 6.28 7.81 9.59
184.11 4.73 1.11 School 3.79 4.15 4.45 4.59 4.73 4.87 5.01 5.31 5.66
48 184.17 4.79 5.62 Student 0.06 1.84 3.37 4.08 4.79 5.50 6.21 7.74 9.52
184.61 4.74 1.11 School 3.80 4.15 4.46 4.60 4.74 4.88 5.02 5.32 5.67
50 184.94 4.74 5.62 Student 0.01 1.80 3.32 4.04 4.74 5.45 6.17 7.69 9.47
184.94 4.74 1.11 School 3.81 4.16 4.46 4.60 4.74 4.88 5.02 5.33 5.68
52 185.71 4.70 5.62 Student -0.03 1.75 3.27 3.99 4.70 5.40 6.12 7.64 9.43
185.27 4.75 1.11 School 3.81 4.17 4.47 4.61 4.75 4.89 5.03 5.33 5.68
55 186.87 4.63 5.62 Student -0.10 1.68 3.20 3.92 4.63 5.33 6.05 7.57 9.36
185.77 4.76 1.11 School 3.82 4.18 4.48 4.62 4.76 4.90 5.04 5.34 5.69
60 188.83 4.51 5.62 Student -0.22 1.56 3.08 3.80 4.51 5.21 5.93 7.45 9.24
186.62 4.77 1.11 School 3.84 4.19 4.49 4.63 4.77 4.91 5.06 5.36 5.71
65 190.85 4.39 5.62 Student -0.34 1.44 2.96 3.68 4.39 5.09 5.81 7.33 9.11
187.49 4.79 1.11 School 3.86 4.21 4.51 4.65 4.79 4.93 5.07 5.37 5.73
70 192.98 4.26 5.62 Student -0.47 1.31 2.83 3.55 4.26 4.96 5.68 7.20 8.99
188.42 4.81 1.11 School 3.87 4.23 4.53 4.67 4.81 4.95 5.09 5.39 5.74
75 195.29 4.12 5.62 Student -0.61 1.17 2.69 3.41 4.12 4.82 5.54 7.06 8.85
189.41 4.83 1.11 School 3.89 4.24 4.54 4.69 4.83 4.97 5.11 5.41 5.76
80 197.85 3.96 5.62 Student -0.77 1.02 2.54 3.26 3.96 4.67 5.39 6.91 8.69
190.52 4.85 1.11 School 3.91 4.26 4.57 4.71 4.85 4.99 5.13 5.43 5.78
85 200.84 3.78 5.62 Student -0.95 0.83 2.36 3.07 3.78 4.49 5.20 6.73 8.51
191.81 4.87 1.11 School 3.94 4.29 4.59 4.73 4.87 5.01 5.15 5.45 5.81
90 204.60 3.55 5.62 Student -1.18 0.61 2.13 2.85 3.55 4.26 4.98 6.50 8.28
193.43 4.90 1.11 School 3.97 4.32 4.62 4.76 4.90 5.04 5.18 5.48 5.84
CGI - Conditional Growth Index CGP - Conditional Growth Percentile
322

Table E.3.7: Language Usage Grade 3 From Last Winter To Winter Conditional Growth Percentile
Conditional Growth
Start Status Growth CGP 20 30 40 45 50 55 60 70 80
%ile RIT Mean SD CGI -0.84 -0.52 -0.25 -0.13 0.00 0.13 0.25 0.52 0.84
10 164.59 15.57 5.79 Student 10.70 12.54 14.11 14.85 15.57 16.30 17.04 18.61 20.45
176.45 12.78 1.62 School 11.41 11.93 12.37 12.57 12.78 12.98 13.19 13.62 14.14
20 171.51 14.38 5.79 Student 9.50 11.34 12.91 13.65 14.38 15.10 15.84 17.41 19.25
179.30 12.54 1.62 School 11.18 11.69 12.13 12.34 12.54 12.74 12.95 13.39 13.90
25 174.14 13.92 5.79 Student 9.05 10.88 12.45 13.19 13.92 14.65 15.39 16.96 18.79
180.38 12.45 1.62 School 11.09 11.60 12.04 12.25 12.45 12.65 12.86 13.30 13.81
30 176.50 13.51 5.79 Student 8.64 10.48 12.05 12.78 13.51 14.24 14.98 16.55 18.38
181.35 12.37 1.62 School 11.01 11.52 11.96 12.16 12.37 12.57 12.78 13.22 13.73
35 178.69 13.13 5.79 Student 8.26 10.10 11.67 12.41 13.13 13.86 14.60 16.17 18.01
182.25 12.29 1.62 School 10.93 11.44 11.88 12.09 12.29 12.50 12.70 13.14 13.66
40 180.76 12.77 5.79 Student 7.90 9.74 11.31 12.05 12.77 13.50 14.24 15.81 17.65
183.11 12.22 1.62 School 10.86 11.37 11.81 12.02 12.22 12.43 12.63 13.07 13.58
45 182.77 12.43 5.79 Student 7.55 9.39 10.96 11.70 12.43 13.15 13.89 15.46 17.30
183.93 12.15 1.62 School 10.79 11.30 11.74 11.95 12.15 12.36 12.56 13.00 13.52
48 183.96 12.22 5.79 Student 7.35 9.19 10.75 11.49 12.22 12.95 13.69 15.26 17.09
184.42 12.11 1.62 School 10.75 11.26 11.70 11.91 12.11 12.32 12.52 12.96 13.47
50 184.75 12.09 5.79 Student 7.21 9.05 10.62 11.36 12.09 12.81 13.55 15.12 16.96
184.75 12.09 1.62 School 10.72 11.24 11.67 11.88 12.09 12.29 12.50 12.93 13.45
52 185.54 11.95 5.79 Student 7.08 8.91 10.48 11.22 11.95 12.68 13.42 14.98 16.82
185.07 12.06 1.62 School 10.70 11.21 11.65 11.85 12.06 12.26 12.47 12.91 13.42
55 186.73 11.74 5.79 Student 6.87 8.71 10.28 11.02 11.74 12.47 13.21 14.78 16.62
185.56 12.02 1.62 School 10.65 11.17 11.61 11.81 12.02 12.22 12.43 12.87 13.38
60 188.73 11.40 5.79 Student 6.52 8.36 9.93 10.67 11.40 12.12 12.86 14.43 16.27
186.39 11.95 1.62 School 10.59 11.10 11.54 11.75 11.95 12.15 12.36 12.80 13.31
65 190.81 11.04 5.79 Student 6.16 8.00 9.57 10.31 11.04 11.76 12.50 14.07 15.91
187.25 11.88 1.62 School 10.51 11.03 11.47 11.67 11.88 12.08 12.29 12.73 13.24
70 193.00 10.66 5.79 Student 5.79 7.62 9.19 9.93 10.66 11.39 12.12 13.69 15.53
188.15 11.80 1.62 School 10.44 10.95 11.39 11.60 11.80 12.01 12.21 12.65 13.16
75 195.36 10.25 5.79 Student 5.38 7.21 8.78 9.52 10.25 10.98 11.72 13.29 15.12
189.12 11.72 1.62 School 10.36 10.87 11.31 11.52 11.72 11.92 12.13 12.57 13.08
80 197.99 9.79 5.79 Student 4.92 6.76 8.33 9.07 9.79 10.52 11.26 12.83 14.67
190.20 11.63 1.62 School 10.27 10.78 11.22 11.43 11.63 11.83 12.04 12.48 12.99
85 201.05 9.26 5.79 Student 4.39 6.23 7.80 8.54 9.26 9.99 10.73 12.30 14.14
191.46 11.53 1.62 School 10.16 10.68 11.12 11.32 11.53 11.73 11.94 12.38 12.89
90 204.90 8.60 5.79 Student 3.73 5.56 7.13 7.87 8.60 9.32 10.06 11.63 13.47
193.05 11.39 1.62 School 10.03 10.55 10.98 11.19 11.39 11.60 11.80 12.24 12.76
CGI - Conditional Growth Index CGP - Conditional Growth Percentile
323

Table E.3.8: Language Usage Grade 3 From Last Spring To Spring Conditional Growth Percentile
Conditional Growth
Start Status Growth CGP 20 30 40 45 50 55 60 70 80
%ile RIT Mean SD CGI -0.84 -0.52 -0.25 -0.13 0.00 0.13 0.25 0.52 0.84
10 168.99 14.85 6.37 Student 9.49 11.51 13.24 14.05 14.85 15.65 16.46 18.19 20.21
180.82 11.64 2.10 School 9.88 10.54 11.11 11.38 11.64 11.90 12.17 12.74 13.41
20 176.04 13.35 6.37 Student 7.98 10.00 11.73 12.54 13.35 14.15 14.96 16.69 18.71
183.81 11.24 2.10 School 9.47 10.14 10.71 10.97 11.24 11.50 11.77 12.34 13.00
25 178.71 12.77 6.37 Student 7.41 9.43 11.16 11.97 12.77 13.57 14.39 16.11 18.13
184.94 11.08 2.10 School 9.32 9.98 10.55 10.82 11.08 11.35 11.62 12.18 12.85
30 181.12 12.26 6.37 Student 6.90 8.92 10.65 11.46 12.26 13.06 13.87 15.60 17.62
185.96 10.95 2.10 School 9.18 9.85 10.42 10.68 10.95 11.21 11.48 12.05 12.71
35 183.34 11.78 6.37 Student 6.42 8.44 10.17 10.98 11.78 12.58 13.40 15.12 17.15
186.90 10.82 2.10 School 9.05 9.72 10.29 10.56 10.82 11.08 11.35 11.92 12.58
40 185.46 11.33 6.37 Student 5.97 7.99 9.72 10.53 11.33 12.13 12.95 14.67 16.69
187.79 10.70 2.10 School 8.93 9.60 10.17 10.43 10.70 10.96 11.23 11.80 12.46
45 187.50 10.90 6.37 Student 5.53 7.55 9.28 10.10 10.90 11.70 12.51 14.24 16.26
188.66 10.58 2.10 School 8.82 9.48 10.05 10.32 10.58 10.84 11.11 11.68 12.35
48 188.71 10.64 6.37 Student 5.28 7.30 9.02 9.84 10.64 11.44 12.25 13.98 16.00
189.17 10.51 2.10 School 8.75 9.41 9.98 10.25 10.51 10.78 11.04 11.61 12.28
50 189.51 10.47 6.37 Student 5.10 7.12 8.85 9.67 10.47 11.27 12.08 13.81 15.83
189.51 10.47 2.10 School 8.70 9.37 9.93 10.20 10.47 10.73 11.00 11.57 12.23
52 190.32 10.29 6.37 Student 4.93 6.95 8.68 9.49 10.29 11.09 11.91 13.63 15.66
189.85 10.42 2.10 School 8.65 9.32 9.89 10.16 10.42 10.68 10.95 11.52 12.18
55 191.53 10.04 6.37 Student 4.67 6.69 8.42 9.24 10.04 10.84 11.65 13.38 15.40
190.37 10.35 2.10 School 8.59 9.25 9.82 10.09 10.35 10.61 10.88 11.45 12.12
60 193.57 9.60 6.37 Student 4.24 6.26 7.98 8.80 9.60 10.40 11.21 12.94 14.96
191.23 10.23 2.10 School 8.47 9.13 9.70 9.97 10.23 10.50 10.76 11.33 12.00
65 195.68 9.15 6.37 Student 3.79 5.81 7.53 8.35 9.15 9.95 10.76 12.49 14.51
192.13 10.11 2.10 School 8.35 9.01 9.58 9.85 10.11 10.38 10.64 11.21 11.88
70 197.91 8.67 6.37 Student 3.31 5.33 7.06 7.87 8.67 9.47 10.29 12.01 14.03
193.07 9.98 2.10 School 8.22 8.89 9.45 9.72 9.98 10.25 10.52 11.08 11.75
75 200.31 8.16 6.37 Student 2.80 4.82 6.54 7.36 8.16 8.96 9.77 11.50 13.52
194.09 9.85 2.10 School 8.08 8.75 9.32 9.58 9.85 10.11 10.38 10.95 11.61
80 202.99 7.59 6.37 Student 2.22 4.25 5.97 6.79 7.59 8.39 9.20 10.93 12.95
195.22 9.69 2.10 School 7.93 8.59 9.16 9.43 9.69 9.96 10.23 10.79 11.46
85 206.11 6.92 6.37 Student 1.56 3.58 5.31 6.12 6.92 7.72 8.53 10.26 12.28
196.54 9.52 2.10 School 7.75 8.42 8.98 9.25 9.52 9.78 10.05 10.62 11.28
90 210.03 6.08 6.37 Student 0.72 2.74 4.47 5.28 6.08 6.88 7.69 9.42 11.44
198.20 9.29 2.10 School 7.53 8.19 8.76 9.03 9.29 9.55 9.82 10.39 11.06
CGI - Conditional Growth Index CGP - Conditional Growth Percentile
324

Table E.3.9: Language Usage Grade 3 From Fall To N Fall Conditional Growth Percentile
Conditional Growth
Start Status Growth CGP 20 30 40 45 50 55 60 70 80
%ile RIT Mean SD CGI -0.84 -0.52 -0.25 -0.13 0.00 0.13 0.25 0.52 0.84
10 169.93 12.28 7.41 Student 6.04 8.39 10.40 11.35 12.28 13.21 14.15 16.16 18.51
181.34 10.25 1.96 School 8.60 9.22 9.75 10.00 10.25 10.49 10.74 11.28 11.90
20 176.62 11.46 7.41 Student 5.22 7.57 9.58 10.53 11.46 12.39 13.34 15.35 17.70
184.11 10.13 1.96 School 8.48 9.10 9.63 9.88 10.13 10.37 10.62 11.16 11.78
25 179.16 11.15 7.41 Student 4.91 7.26 9.27 10.22 11.15 12.08 13.03 15.04 17.39
185.16 10.08 1.96 School 8.43 9.05 9.59 9.84 10.08 10.33 10.58 11.11 11.73
30 181.44 10.87 7.41 Student 4.64 6.99 8.99 9.94 10.87 11.80 12.75 14.76 17.11
186.11 10.04 1.96 School 8.39 9.01 9.54 9.80 10.04 10.29 10.54 11.07 11.69
35 183.55 10.61 7.41 Student 4.38 6.73 8.74 9.68 10.61 11.54 12.49 14.50 16.85
186.98 10.00 1.96 School 8.35 8.98 9.51 9.76 10.00 10.25 10.50 11.03 11.65
40 185.56 10.37 7.41 Student 4.13 6.48 8.49 9.44 10.37 11.30 12.25 14.25 16.60
187.81 9.97 1.96 School 8.32 8.94 9.47 9.72 9.97 10.21 10.46 10.99 11.62
45 187.50 10.13 7.41 Student 3.90 6.25 8.25 9.20 10.13 11.06 12.01 14.02 16.37
188.62 9.93 1.96 School 8.28 8.90 9.44 9.69 9.93 10.18 10.43 10.96 11.58
48 188.65 9.99 7.41 Student 3.75 6.11 8.11 9.06 9.99 10.92 11.87 13.88 16.23
189.09 9.91 1.96 School 8.26 8.88 9.42 9.67 9.91 10.16 10.41 10.94 11.56
50 189.41 9.90 7.41 Student 3.66 6.01 8.02 8.97 9.90 10.83 11.78 13.78 16.13
189.41 9.90 1.96 School 8.25 8.87 9.40 9.65 9.90 10.14 10.39 10.93 11.55
52 190.17 9.80 7.41 Student 3.57 5.92 7.93 8.87 9.80 10.74 11.68 13.69 16.04
189.72 9.88 1.96 School 8.24 8.86 9.39 9.64 9.88 10.13 10.38 10.91 11.53
55 191.32 9.66 7.41 Student 3.43 5.78 7.79 8.73 9.66 10.60 11.54 13.55 15.90
190.20 9.86 1.96 School 8.21 8.84 9.37 9.62 9.86 10.11 10.36 10.89 11.51
60 193.26 9.43 7.41 Student 3.19 5.54 7.55 8.50 9.43 10.36 11.30 13.31 15.66
191.00 9.83 1.96 School 8.18 8.80 9.33 9.58 9.83 10.07 10.32 10.86 11.48
65 195.27 9.18 7.41 Student 2.95 5.30 7.31 8.25 9.18 10.11 11.06 13.07 15.42
191.83 9.79 1.96 School 8.14 8.77 9.30 9.55 9.79 10.04 10.29 10.82 11.44
70 197.38 8.92 7.41 Student 2.69 5.04 7.05 7.99 8.92 9.86 10.80 12.81 15.16
192.71 9.75 1.96 School 8.11 8.73 9.26 9.51 9.75 10.00 10.25 10.78 11.40
75 199.66 8.65 7.41 Student 2.41 4.76 6.77 7.71 8.65 9.58 10.52 12.53 14.88
193.65 9.71 1.96 School 8.06 8.69 9.22 9.47 9.71 9.96 10.21 10.74 11.36
80 202.20 8.34 7.41 Student 2.10 4.45 6.46 7.40 8.34 9.27 10.21 12.22 14.57
194.71 9.67 1.96 School 8.02 8.64 9.17 9.42 9.67 9.91 10.16 10.70 11.32
85 205.16 7.97 7.41 Student 1.74 4.09 6.10 7.04 7.97 8.90 9.85 11.86 14.21
195.93 9.61 1.96 School 7.97 8.59 9.12 9.37 9.61 9.86 10.11 10.64 11.26
90 208.89 7.52 7.41 Student 1.28 3.63 5.64 6.59 7.52 8.45 9.40 11.40 13.75
197.48 9.55 1.96 School 7.90 8.52 9.05 9.30 9.55 9.79 10.04 10.57 11.20
CGI - Conditional Growth Index CGP - Conditional Growth Percentile
325

Table E.3.10: Language Usage Grade 3 From Fall To Spring Conditional Growth Percentile
Conditional Growth
Start Status Growth CGP 20 30 40 45 50 55 60 70 80
%ile RIT Mean SD CGI -0.84 -0.52 -0.25 -0.13 0.00 0.13 0.25 0.52 0.84
10 169.93 14.41 7.09 Student 8.45 10.69 12.62 13.52 14.41 15.30 16.21 18.13 20.38
181.34 11.17 2.21 School 9.31 10.01 10.61 10.89 11.17 11.45 11.73 12.33 13.03
20 176.62 13.09 7.09 Student 7.13 9.38 11.30 12.20 13.09 13.98 14.89 16.81 19.06
184.11 10.97 2.21 School 9.11 9.81 10.41 10.69 10.97 11.24 11.53 12.12 12.83
25 179.16 12.59 7.09 Student 6.63 8.87 10.80 11.70 12.59 13.48 14.39 16.31 18.56
185.16 10.89 2.21 School 9.03 9.73 10.33 10.61 10.89 11.16 11.45 12.05 12.75
30 181.44 12.14 7.09 Student 6.18 8.42 10.35 11.25 12.14 13.03 13.94 15.86 18.11
186.11 10.82 2.21 School 8.96 9.66 10.26 10.54 10.82 11.09 11.38 11.97 12.68
35 183.55 11.72 7.09 Student 5.76 8.01 9.93 10.83 11.72 12.62 13.52 15.44 17.69
186.98 10.75 2.21 School 8.89 9.59 10.19 10.47 10.75 11.03 11.31 11.91 12.61
40 185.56 11.33 7.09 Student 5.36 7.61 9.53 10.44 11.33 12.22 13.12 15.05 17.29
187.81 10.69 2.21 School 8.83 9.53 10.13 10.41 10.69 10.97 11.25 11.85 12.55
45 187.50 10.95 7.09 Student 4.98 7.23 9.15 10.06 10.95 11.84 12.74 14.66 16.91
188.62 10.63 2.21 School 8.77 9.47 10.07 10.35 10.63 10.91 11.19 11.79 12.49
48 188.65 10.72 7.09 Student 4.76 7.00 8.92 9.83 10.72 11.61 12.52 14.44 16.68
189.09 10.59 2.21 School 8.73 9.43 10.03 10.32 10.59 10.87 11.15 11.75 12.45
50 189.41 10.57 7.09 Student 4.60 6.85 8.77 9.68 10.57 11.46 12.37 14.29 16.53
189.41 10.57 2.21 School 8.71 9.41 10.01 10.29 10.57 10.85 11.13 11.73 12.43
52 190.17 10.42 7.09 Student 4.45 6.70 8.62 9.53 10.42 11.31 12.21 14.14 16.38
189.72 10.55 2.21 School 8.69 9.39 9.99 10.27 10.55 10.82 11.11 11.70 12.41
55 191.32 10.19 7.09 Student 4.23 6.48 8.40 9.30 10.19 11.08 11.99 13.91 16.16
190.20 10.51 2.21 School 8.65 9.35 9.95 10.23 10.51 10.79 11.07 11.67 12.37
60 193.26 9.81 7.09 Student 3.85 6.09 8.01 8.92 9.81 10.70 11.61 13.53 15.77
191.00 10.45 2.21 School 8.59 9.29 9.89 10.17 10.45 10.73 11.01 11.61 12.31
65 195.27 9.41 7.09 Student 3.45 5.70 7.62 8.52 9.41 10.31 11.21 13.13 15.38
191.83 10.39 2.21 School 8.53 9.23 9.83 10.11 10.39 10.67 10.95 11.55 12.25
70 197.38 9.00 7.09 Student 3.03 5.28 7.20 8.11 9.00 9.89 10.79 12.71 14.96
192.71 10.32 2.21 School 8.46 9.16 9.76 10.05 10.32 10.60 10.88 11.48 12.18
75 199.66 8.55 7.09 Student 2.58 4.83 6.75 7.66 8.55 9.44 10.34 12.26 14.51
193.65 10.25 2.21 School 8.39 9.09 9.69 9.97 10.25 10.53 10.81 11.41 12.11
80 202.20 8.05 7.09 Student 2.08 4.33 6.25 7.16 8.05 8.94 9.84 11.76 14.01
194.71 10.17 2.21 School 8.31 9.02 9.61 9.90 10.17 10.45 10.73 11.33 12.03
85 205.16 7.46 7.09 Student 1.50 3.75 5.67 6.57 7.46 8.35 9.26 11.18 13.43
195.93 10.08 2.21 School 8.22 8.92 9.52 9.80 10.08 10.36 10.64 11.24 11.94
90 208.89 6.73 7.09 Student 0.76 3.01 4.93 5.84 6.73 7.62 8.52 10.44 12.69
197.48 9.97 2.21 School 8.11 8.81 9.41 9.69 9.97 10.24 10.53 11.13 11.83
CGI - Conditional Growth Index CGP - Conditional Growth Percentile
326
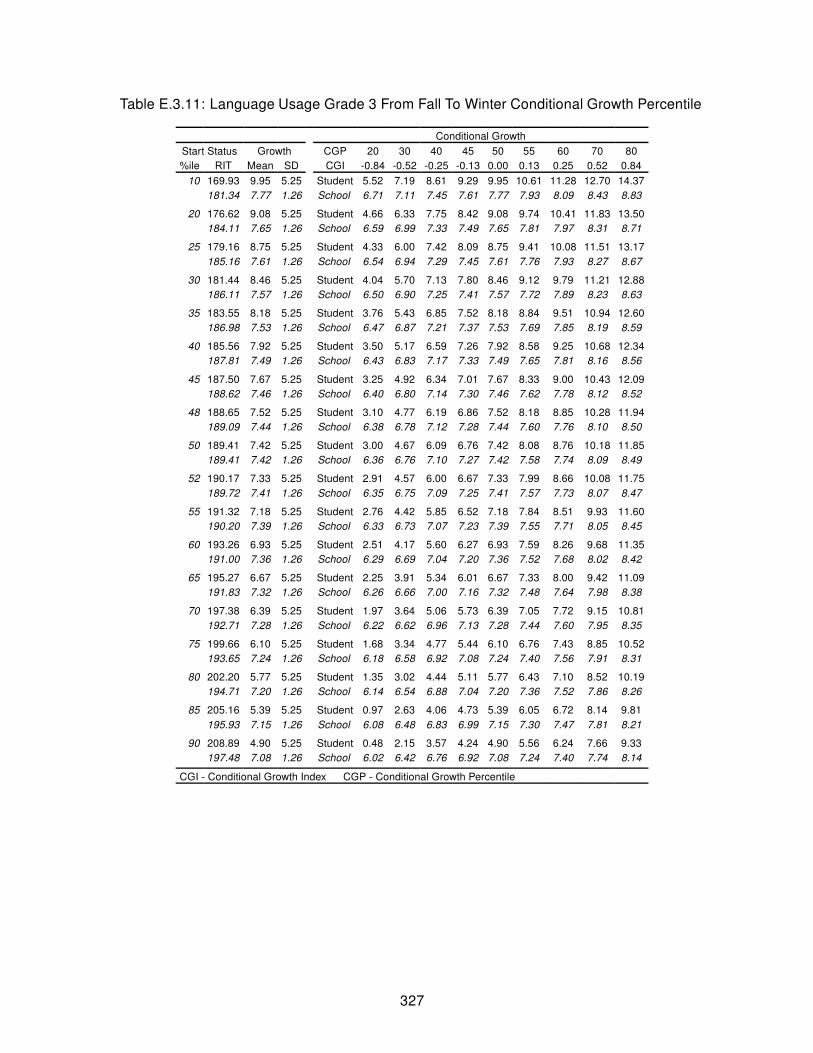
Table E.3.11: Language Usage Grade 3 From Fall To Winter Conditional Growth Percentile
Conditional Growth
Start Status Growth CGP 20 30 40 45 50 55 60 70 80
%ile RIT Mean SD CGI -0.84 -0.52 -0.25 -0.13 0.00 0.13 0.25 0.52 0.84
10 169.93 9.95 5.25 Student 5.52 7.19 8.61 9.29 9.95 10.61 11.28 12.70 14.37
181.34 7.77 1.26 School 6.71 7.11 7.45 7.61 7.77 7.93 8.09 8.43 8.83
20 176.62 9.08 5.25 Student 4.66 6.33 7.75 8.42 9.08 9.74 10.41 11.83 13.50
184.11 7.65 1.26 School 6.59 6.99 7.33 7.49 7.65 7.81 7.97 8.31 8.71
25 179.16 8.75 5.25 Student 4.33 6.00 7.42 8.09 8.75 9.41 10.08 11.51 13.17
185.16 7.61 1.26 School 6.54 6.94 7.29 7.45 7.61 7.76 7.93 8.27 8.67
30 181.44 8.46 5.25 Student 4.04 5.70 7.13 7.80 8.46 9.12 9.79 11.21 12.88
186.11 7.57 1.26 School 6.50 6.90 7.25 7.41 7.57 7.72 7.89 8.23 8.63
35 183.55 8.18 5.25 Student 3.76 5.43 6.85 7.52 8.18 8.84 9.51 10.94 12.60
186.98 7.53 1.26 School 6.47 6.87 7.21 7.37 7.53 7.69 7.85 8.19 8.59
40 185.56 7.92 5.25 Student 3.50 5.17 6.59 7.26 7.92 8.58 9.25 10.68 12.34
187.81 7.49 1.26 School 6.43 6.83 7.17 7.33 7.49 7.65 7.81 8.16 8.56
45 187.50 7.67 5.25 Student 3.25 4.92 6.34 7.01 7.67 8.33 9.00 10.43 12.09
188.62 7.46 1.26 School 6.40 6.80 7.14 7.30 7.46 7.62 7.78 8.12 8.52
48 188.65 7.52 5.25 Student 3.10 4.77 6.19 6.86 7.52 8.18 8.85 10.28 11.94
189.09 7.44 1.26 School 6.38 6.78 7.12 7.28 7.44 7.60 7.76 8.10 8.50
50 189.41 7.42 5.25 Student 3.00 4.67 6.09 6.76 7.42 8.08 8.76 10.18 11.85
189.41 7.42 1.26 School 6.36 6.76 7.10 7.27 7.42 7.58 7.74 8.09 8.49
52 190.17 7.33 5.25 Student 2.91 4.57 6.00 6.67 7.33 7.99 8.66 10.08 11.75
189.72 7.41 1.26 School 6.35 6.75 7.09 7.25 7.41 7.57 7.73 8.07 8.47
55 191.32 7.18 5.25 Student 2.76 4.42 5.85 6.52 7.18 7.84 8.51 9.93 11.60
190.20 7.39 1.26 School 6.33 6.73 7.07 7.23 7.39 7.55 7.71 8.05 8.45
60 193.26 6.93 5.25 Student 2.51 4.17 5.60 6.27 6.93 7.59 8.26 9.68 11.35
191.00 7.36 1.26 School 6.29 6.69 7.04 7.20 7.36 7.52 7.68 8.02 8.42
65 195.27 6.67 5.25 Student 2.25 3.91 5.34 6.01 6.67 7.33 8.00 9.42 11.09
191.83 7.32 1.26 School 6.26 6.66 7.00 7.16 7.32 7.48 7.64 7.98 8.38
70 197.38 6.39 5.25 Student 1.97 3.64 5.06 5.73 6.39 7.05 7.72 9.15 10.81
192.71 7.28 1.26 School 6.22 6.62 6.96 7.13 7.28 7.44 7.60 7.95 8.35
75 199.66 6.10 5.25 Student 1.68 3.34 4.77 5.44 6.10 6.76 7.43 8.85 10.52
193.65 7.24 1.26 School 6.18 6.58 6.92 7.08 7.24 7.40 7.56 7.91 8.31
80 202.20 5.77 5.25 Student 1.35 3.02 4.44 5.11 5.77 6.43 7.10 8.52 10.19
194.71 7.20 1.26 School 6.14 6.54 6.88 7.04 7.20 7.36 7.52 7.86 8.26
85 205.16 5.39 5.25 Student 0.97 2.63 4.06 4.73 5.39 6.05 6.72 8.14 9.81
195.93 7.15 1.26 School 6.08 6.48 6.83 6.99 7.15 7.30 7.47 7.81 8.21
90 208.89 4.90 5.25 Student 0.48 2.15 3.57 4.24 4.90 5.56 6.24 7.66 9.33
197.48 7.08 1.26 School 6.02 6.42 6.76 6.92 7.08 7.24 7.40 7.74 8.14
CGI - Conditional Growth Index CGP - Conditional Growth Percentile
327

Table E.3.12: Language Usage Grade 3 From Winter To Spring Conditional Growth Percentile
Conditional Growth
Start Status Growth CGP 20 30 40 45 50 55 60 70 80
%ile RIT Mean SD CGI -0.84 -0.52 -0.25 -0.13 0.00 0.13 0.25 0.52 0.84
10 178.59 4.46 4.95 Student 0.29 1.86 3.20 3.83 4.46 5.08 5.71 7.05 8.62
188.94 3.15 0.97 School 2.33 2.64 2.90 3.03 3.15 3.27 3.39 3.66 3.96
20 184.85 4.01 4.95 Student -0.16 1.41 2.75 3.38 4.01 4.63 5.26 6.60 8.17
191.65 3.15 0.97 School 2.33 2.64 2.90 3.03 3.15 3.27 3.39 3.66 3.96
25 187.23 3.84 4.95 Student -0.33 1.24 2.58 3.21 3.84 4.46 5.09 6.43 8.00
192.68 3.15 0.97 School 2.33 2.64 2.90 3.03 3.15 3.27 3.39 3.66 3.96
30 189.37 3.68 4.95 Student -0.49 1.08 2.43 3.06 3.68 4.30 4.94 6.28 7.85
193.61 3.15 0.97 School 2.33 2.64 2.90 3.02 3.15 3.27 3.39 3.65 3.96
35 191.35 3.54 4.95 Student -0.63 0.94 2.28 2.92 3.54 4.16 4.79 6.14 7.71
194.46 3.15 0.97 School 2.33 2.64 2.90 3.02 3.15 3.27 3.39 3.65 3.96
40 193.23 3.40 4.95 Student -0.76 0.81 2.15 2.78 3.40 4.03 4.66 6.00 7.57
195.27 3.15 0.97 School 2.33 2.64 2.90 3.02 3.15 3.27 3.39 3.65 3.96
45 195.05 3.27 4.95 Student -0.89 0.68 2.02 2.65 3.27 3.90 4.53 5.87 7.44
196.06 3.15 0.97 School 2.33 2.64 2.90 3.02 3.15 3.27 3.39 3.65 3.96
48 196.12 3.20 4.95 Student -0.97 0.60 1.94 2.57 3.20 3.82 4.45 5.79 7.36
196.53 3.14 0.97 School 2.33 2.64 2.90 3.02 3.14 3.27 3.39 3.65 3.96
50 196.83 3.14 4.95 Student -1.02 0.55 1.89 2.52 3.14 3.77 4.40 5.74 7.31
196.83 3.14 0.97 School 2.33 2.64 2.90 3.02 3.14 3.27 3.39 3.65 3.96
52 197.55 3.09 4.95 Student -1.07 0.50 1.84 2.47 3.09 3.72 4.35 5.69 7.26
197.14 3.14 0.97 School 2.33 2.64 2.90 3.02 3.14 3.27 3.39 3.65 3.96
55 198.62 3.02 4.95 Student -1.15 0.42 1.76 2.39 3.02 3.64 4.27 5.61 7.18
197.61 3.14 0.97 School 2.33 2.64 2.90 3.02 3.14 3.27 3.39 3.65 3.96
60 200.44 2.89 4.95 Student -1.28 0.29 1.63 2.26 2.89 3.51 4.14 5.48 7.05
198.39 3.14 0.97 School 2.33 2.64 2.90 3.02 3.14 3.27 3.39 3.65 3.96
65 202.32 2.75 4.95 Student -1.42 0.15 1.50 2.13 2.75 3.37 4.00 5.35 6.92
199.21 3.14 0.97 School 2.33 2.64 2.90 3.02 3.14 3.27 3.39 3.65 3.96
70 204.30 2.61 4.95 Student -1.56 0.01 1.35 1.99 2.61 3.23 3.86 5.20 6.78
200.06 3.14 0.97 School 2.33 2.63 2.90 3.02 3.14 3.26 3.39 3.65 3.96
75 206.44 2.45 4.95 Student -1.71 -0.14 1.20 1.83 2.45 3.08 3.71 5.05 6.62
200.99 3.14 0.97 School 2.33 2.63 2.90 3.02 3.14 3.26 3.39 3.65 3.96
80 208.81 2.28 4.95 Student -1.88 -0.31 1.03 1.66 2.28 2.91 3.54 4.88 6.45
202.02 3.14 0.97 School 2.33 2.63 2.90 3.02 3.14 3.26 3.39 3.65 3.96
85 211.59 2.08 4.95 Student -2.08 -0.51 0.83 1.46 2.08 2.71 3.34 4.68 6.25
203.21 3.14 0.97 School 2.33 2.63 2.90 3.02 3.14 3.26 3.39 3.65 3.96
90 215.08 1.83 4.95 Student -2.34 -0.76 0.58 1.21 1.83 2.45 3.09 4.43 6.00
204.72 3.14 0.97 School 2.33 2.63 2.90 3.02 3.14 3.26 3.39 3.65 3.96
CGI - Conditional Growth Index CGP - Conditional Growth Percentile
328

Table E.3.13: Language Usage Grade 4 From Last Winter To Winter Conditional Growth Percentile
Conditional Growth
Start Status Growth CGP 20 30 40 45 50 55 60 70 80
%ile RIT Mean SD CGI -0.84 -0.52 -0.25 -0.13 0.00 0.13 0.25 0.52 0.84
10 177.40 10.71 5.42 Student 6.15 7.87 9.34 10.03 10.71 11.39 12.08 13.55 15.27
188.58 8.49 1.43 School 7.28 7.74 8.13 8.31 8.49 8.67 8.85 9.24 9.69
20 183.97 9.73 5.42 Student 5.17 6.89 8.36 9.05 9.73 10.42 11.11 12.58 14.29
191.31 8.28 1.43 School 7.07 7.53 7.91 8.10 8.28 8.45 8.64 9.03 9.48
25 186.46 9.36 5.42 Student 4.80 6.52 7.99 8.68 9.36 10.04 10.74 12.21 13.92
192.35 8.19 1.43 School 6.99 7.44 7.83 8.01 8.19 8.37 8.56 8.94 9.40
30 188.71 9.03 5.42 Student 4.47 6.19 7.66 8.35 9.03 9.71 10.40 11.87 13.59
193.28 8.12 1.43 School 6.92 7.37 7.76 7.94 8.12 8.30 8.48 8.87 9.33
35 190.78 8.72 5.42 Student 4.16 5.88 7.35 8.04 8.72 9.40 10.10 11.56 13.28
194.15 8.05 1.43 School 6.85 7.30 7.69 7.87 8.05 8.23 8.42 8.80 9.26
40 192.76 8.43 5.42 Student 3.87 5.59 7.06 7.75 8.43 9.11 9.80 11.27 12.99
194.97 7.99 1.43 School 6.79 7.24 7.63 7.81 7.99 8.17 8.35 8.74 9.19
45 194.66 8.15 5.42 Student 3.59 5.31 6.77 7.47 8.15 8.83 9.52 10.99 12.71
195.76 7.93 1.43 School 6.73 7.18 7.57 7.75 7.93 8.11 8.29 8.68 9.13
48 195.79 7.98 5.42 Student 3.42 5.14 6.61 7.30 7.98 8.66 9.35 10.82 12.54
196.23 7.89 1.43 School 6.69 7.14 7.53 7.71 7.89 8.07 8.25 8.64 9.10
50 196.54 7.87 5.42 Student 3.31 5.03 6.50 7.19 7.87 8.55 9.24 10.71 12.43
196.54 7.87 1.43 School 6.66 7.12 7.51 7.69 7.87 8.05 8.23 8.62 9.07
52 197.29 7.76 5.42 Student 3.20 4.92 6.38 7.08 7.76 8.44 9.13 10.60 12.32
196.85 7.84 1.43 School 6.64 7.09 7.48 7.66 7.84 8.02 8.21 8.59 9.05
55 198.42 7.59 5.42 Student 3.03 4.75 6.22 6.91 7.59 8.27 8.96 10.43 12.15
197.32 7.81 1.43 School 6.60 7.06 7.45 7.63 7.81 7.99 8.17 8.56 9.01
60 200.33 7.31 5.42 Student 2.75 4.47 5.93 6.63 7.31 7.99 8.68 10.15 11.87
198.12 7.75 1.43 School 6.54 7.00 7.38 7.57 7.75 7.93 8.11 8.50 8.95
65 202.30 7.01 5.42 Student 2.45 4.17 5.64 6.33 7.01 7.69 8.39 9.86 11.57
198.94 7.68 1.43 School 6.48 6.93 7.32 7.50 7.68 7.86 8.04 8.43 8.89
70 204.38 6.71 5.42 Student 2.15 3.86 5.33 6.02 6.71 7.39 8.08 9.55 11.27
199.80 7.61 1.43 School 6.41 6.86 7.25 7.44 7.61 7.79 7.98 8.36 8.82
75 206.62 6.37 5.42 Student 1.81 3.53 5.00 5.69 6.37 7.05 7.75 9.21 10.93
200.73 7.54 1.43 School 6.34 6.79 7.18 7.36 7.54 7.72 7.90 8.29 8.75
80 209.11 6.00 5.42 Student 1.44 3.16 4.63 5.32 6.00 6.68 7.37 8.84 10.56
201.77 7.46 1.43 School 6.26 6.71 7.10 7.28 7.46 7.64 7.82 8.21 8.67
85 212.02 5.57 5.42 Student 1.01 2.73 4.20 4.89 5.57 6.25 6.94 8.41 10.13
202.98 7.37 1.43 School 6.16 6.62 7.01 7.19 7.37 7.55 7.73 8.12 8.57
90 215.69 5.03 5.42 Student 0.47 2.19 3.65 4.35 5.03 5.71 6.40 7.87 9.59
204.50 7.25 1.43 School 6.05 6.50 6.89 7.07 7.25 7.43 7.61 8.00 8.45
CGI - Conditional Growth Index CGP - Conditional Growth Percentile
329

Table E.3.14: Language Usage Grade 4 From Last Spring To Spring Conditional Growth Percentile
Conditional Growth
Start Status Growth CGP 20 30 40 45 50 55 60 70 80
%ile RIT Mean SD CGI -0.84 -0.52 -0.25 -0.13 0.00 0.13 0.25 0.52 0.84
10 180.59 10.38 5.97 Student 5.36 7.25 8.87 9.63 10.38 11.13 11.89 13.51 15.41
191.72 7.76 1.84 School 6.21 6.80 7.30 7.53 7.76 7.99 8.23 8.73 9.31
20 187.20 9.17 5.97 Student 4.15 6.04 7.66 8.42 9.17 9.92 10.69 12.30 14.20
194.50 7.45 1.84 School 5.90 6.49 6.99 7.22 7.45 7.68 7.92 8.42 9.00
25 189.71 8.71 5.97 Student 3.69 5.58 7.20 7.96 8.71 9.46 10.23 11.84 13.74
195.56 7.33 1.84 School 5.79 6.37 6.87 7.10 7.33 7.57 7.80 8.30 8.88
30 191.96 8.30 5.97 Student 3.28 5.17 6.79 7.55 8.30 9.05 9.81 11.43 13.33
196.51 7.23 1.84 School 5.68 6.26 6.76 7.00 7.23 7.46 7.70 8.19 8.78
35 194.05 7.92 5.97 Student 2.89 4.79 6.41 7.17 7.92 8.67 9.43 11.05 12.94
197.39 7.13 1.84 School 5.58 6.17 6.66 6.90 7.13 7.36 7.60 8.10 8.68
40 196.03 7.56 5.97 Student 2.53 4.42 6.04 6.80 7.56 8.31 9.07 10.69 12.58
198.23 7.04 1.84 School 5.49 6.07 6.57 6.81 7.04 7.27 7.50 8.00 8.59
45 197.95 7.20 5.97 Student 2.18 4.07 5.69 6.45 7.20 7.95 8.72 10.34 12.23
199.04 6.95 1.84 School 5.40 5.98 6.48 6.72 6.95 7.18 7.41 7.91 8.50
48 199.08 7.00 5.97 Student 1.97 3.87 5.48 6.25 7.00 7.75 8.51 10.13 12.02
199.52 6.89 1.84 School 5.35 5.93 6.43 6.66 6.89 7.13 7.36 7.86 8.44
50 199.83 6.86 5.97 Student 1.83 3.73 5.35 6.11 6.86 7.61 8.37 9.99 11.88
199.83 6.86 1.84 School 5.31 5.89 6.39 6.63 6.86 7.09 7.32 7.82 8.41
52 200.59 6.72 5.97 Student 1.70 3.59 5.21 5.97 6.72 7.47 8.23 9.85 11.75
200.15 6.82 1.84 School 5.27 5.86 6.36 6.59 6.82 7.05 7.29 7.79 8.37
55 201.72 6.51 5.97 Student 1.49 3.38 5.00 5.76 6.51 7.26 8.03 9.64 11.54
200.63 6.77 1.84 School 5.22 5.80 6.30 6.54 6.77 7.00 7.24 7.74 8.32
60 203.64 6.16 5.97 Student 1.14 3.03 4.65 5.41 6.16 6.91 7.67 9.29 11.19
201.44 6.68 1.84 School 5.13 5.71 6.21 6.45 6.68 6.91 7.15 7.64 8.23
65 205.62 5.80 5.97 Student 0.77 2.67 4.29 5.05 5.80 6.55 7.31 8.93 10.82
202.27 6.59 1.84 School 5.04 5.62 6.12 6.36 6.59 6.82 7.05 7.55 8.14
70 207.71 5.42 5.97 Student 0.39 2.29 3.90 4.67 5.42 6.17 6.93 8.55 10.44
203.16 6.49 1.84 School 4.94 5.52 6.02 6.26 6.49 6.72 6.95 7.45 8.04
75 209.96 5.00 5.97 Student -0.02 1.87 3.49 4.25 5.00 5.75 6.52 8.14 10.03
204.11 6.38 1.84 School 4.83 5.42 5.92 6.15 6.38 6.61 6.85 7.35 7.93
80 212.47 4.54 5.97 Student -0.48 1.41 3.03 3.79 4.54 5.29 6.06 7.68 9.57
205.16 6.26 1.84 School 4.72 5.30 5.80 6.03 6.26 6.50 6.73 7.23 7.81
85 215.40 4.01 5.97 Student -1.02 0.88 2.50 3.26 4.01 4.76 5.52 7.14 9.03
206.40 6.13 1.84 School 4.58 5.16 5.66 5.90 6.13 6.36 6.59 7.09 7.68
90 219.08 3.34 5.97 Student -1.69 0.20 1.82 2.58 3.34 4.09 4.85 6.47 8.36
207.95 5.95 1.84 School 4.40 4.99 5.49 5.72 5.95 6.19 6.42 6.92 7.50
CGI - Conditional Growth Index CGP - Conditional Growth Percentile
330
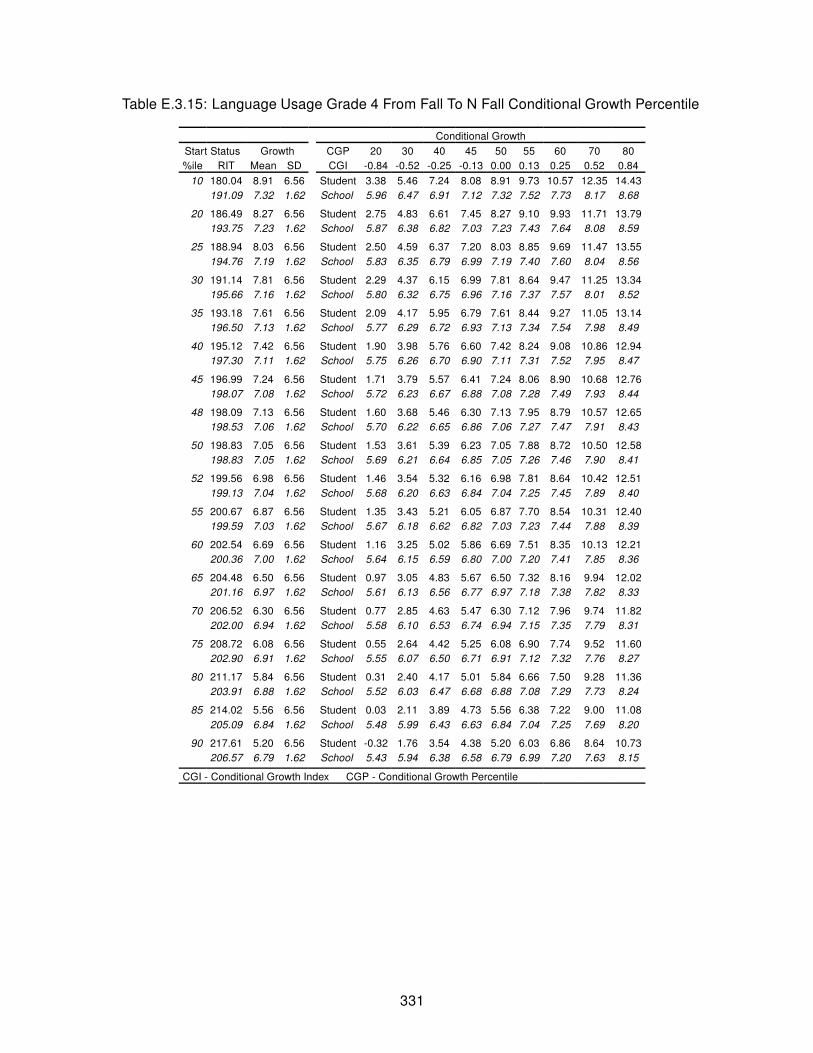
Table E.3.15: Language Usage Grade 4 From Fall To N Fall Conditional Growth Percentile
Conditional Growth
Start Status Growth CGP 20 30 40 45 50 55 60 70 80
%ile RIT Mean SD CGI -0.84 -0.52 -0.25 -0.13 0.00 0.13 0.25 0.52 0.84
10 180.04 8.91 6.56 Student 3.38 5.46 7.24 8.08 8.91 9.73 10.57 12.35 14.43
191.09 7.32 1.62 School 5.96 6.47 6.91 7.12 7.32 7.52 7.73 8.17 8.68
20 186.49 8.27 6.56 Student 2.75 4.83 6.61 7.45 8.27 9.10 9.93 11.71 13.79
193.75 7.23 1.62 School 5.87 6.38 6.82 7.03 7.23 7.43 7.64 8.08 8.59
25 188.94 8.03 6.56 Student 2.50 4.59 6.37 7.20 8.03 8.85 9.69 11.47 13.55
194.76 7.19 1.62 School 5.83 6.35 6.79 6.99 7.19 7.40 7.60 8.04 8.56
30 191.14 7.81 6.56 Student 2.29 4.37 6.15 6.99 7.81 8.64 9.47 11.25 13.34
195.66 7.16 1.62 School 5.80 6.32 6.75 6.96 7.16 7.37 7.57 8.01 8.52
35 193.18 7.61 6.56 Student 2.09 4.17 5.95 6.79 7.61 8.44 9.27 11.05 13.14
196.50 7.13 1.62 School 5.77 6.29 6.72 6.93 7.13 7.34 7.54 7.98 8.49
40 195.12 7.42 6.56 Student 1.90 3.98 5.76 6.60 7.42 8.24 9.08 10.86 12.94
197.30 7.11 1.62 School 5.75 6.26 6.70 6.90 7.11 7.31 7.52 7.95 8.47
45 196.99 7.24 6.56 Student 1.71 3.79 5.57 6.41 7.24 8.06 8.90 10.68 12.76
198.07 7.08 1.62 School 5.72 6.23 6.67 6.88 7.08 7.28 7.49 7.93 8.44
48 198.09 7.13 6.56 Student 1.60 3.68 5.46 6.30 7.13 7.95 8.79 10.57 12.65
198.53 7.06 1.62 School 5.70 6.22 6.65 6.86 7.06 7.27 7.47 7.91 8.43
50 198.83 7.05 6.56 Student 1.53 3.61 5.39 6.23 7.05 7.88 8.72 10.50 12.58
198.83 7.05 1.62 School 5.69 6.21 6.64 6.85 7.05 7.26 7.46 7.90 8.41
52 199.56 6.98 6.56 Student 1.46 3.54 5.32 6.16 6.98 7.81 8.64 10.42 12.51
199.13 7.04 1.62 School 5.68 6.20 6.63 6.84 7.04 7.25 7.45 7.89 8.40
55 200.67 6.87 6.56 Student 1.35 3.43 5.21 6.05 6.87 7.70 8.54 10.31 12.40
199.59 7.03 1.62 School 5.67 6.18 6.62 6.82 7.03 7.23 7.44 7.88 8.39
60 202.54 6.69 6.56 Student 1.16 3.25 5.02 5.86 6.69 7.51 8.35 10.13 12.21
200.36 7.00 1.62 School 5.64 6.15 6.59 6.80 7.00 7.20 7.41 7.85 8.36
65 204.48 6.50 6.56 Student 0.97 3.05 4.83 5.67 6.50 7.32 8.16 9.94 12.02
201.16 6.97 1.62 School 5.61 6.13 6.56 6.77 6.97 7.18 7.38 7.82 8.33
70 206.52 6.30 6.56 Student 0.77 2.85 4.63 5.47 6.30 7.12 7.96 9.74 11.82
202.00 6.94 1.62 School 5.58 6.10 6.53 6.74 6.94 7.15 7.35 7.79 8.31
75 208.72 6.08 6.56 Student 0.55 2.64 4.42 5.25 6.08 6.90 7.74 9.52 11.60
202.90 6.91 1.62 School 5.55 6.07 6.50 6.71 6.91 7.12 7.32 7.76 8.27
80 211.17 5.84 6.56 Student 0.31 2.40 4.17 5.01 5.84 6.66 7.50 9.28 11.36
203.91 6.88 1.62 School 5.52 6.03 6.47 6.68 6.88 7.08 7.29 7.73 8.24
85 214.02 5.56 6.56 Student 0.03 2.11 3.89 4.73 5.56 6.38 7.22 9.00 11.08
205.09 6.84 1.62 School 5.48 5.99 6.43 6.63 6.84 7.04 7.25 7.69 8.20
90 217.61 5.20 6.56 Student -0.32 1.76 3.54 4.38 5.20 6.03 6.86 8.64 10.73
206.57 6.79 1.62 School 5.43 5.94 6.38 6.58 6.79 6.99 7.20 7.63 8.15
CGI - Conditional Growth Index CGP - Conditional Growth Percentile
331

Table E.3.16: Language Usage Grade 4 From Fall To Spring Conditional Growth Percentile
Conditional Growth
Start Status Growth CGP 20 30 40 45 50 55 60 70 80
%ile RIT Mean SD CGI -0.84 -0.52 -0.25 -0.13 0.00 0.13 0.25 0.52 0.84
10 180.04 11.20 6.39 Student 5.82 7.85 9.58 10.40 11.20 12.00 12.82 14.55 16.58
191.09 8.35 1.75 School 6.88 7.44 7.91 8.13 8.35 8.57 8.80 9.27 9.82
20 186.49 10.05 6.39 Student 4.68 6.70 8.44 9.25 10.05 10.86 11.67 13.41 15.43
193.75 8.18 1.75 School 6.71 7.27 7.74 7.97 8.18 8.40 8.63 9.10 9.66
25 188.94 9.62 6.39 Student 4.24 6.27 8.00 8.82 9.62 10.42 11.24 12.97 15.00
194.76 8.12 1.75 School 6.65 7.20 7.68 7.90 8.12 8.34 8.56 9.04 9.59
30 191.14 9.23 6.39 Student 3.85 5.88 7.61 8.43 9.23 10.03 10.85 12.58 14.61
195.66 8.06 1.75 School 6.59 7.15 7.62 7.84 8.06 8.28 8.51 8.98 9.53
35 193.18 8.87 6.39 Student 3.49 5.52 7.25 8.06 8.87 9.67 10.49 12.22 14.25
196.50 8.01 1.75 School 6.54 7.09 7.57 7.79 8.01 8.23 8.45 8.93 9.48
40 195.12 8.52 6.39 Student 3.14 5.17 6.90 7.72 8.52 9.33 10.14 11.87 13.90
197.30 7.96 1.75 School 6.49 7.04 7.52 7.74 7.96 8.18 8.40 8.88 9.43
45 196.99 8.19 6.39 Student 2.81 4.84 6.57 7.39 8.19 8.99 9.81 11.54 13.57
198.07 7.91 1.75 School 6.44 6.99 7.47 7.69 7.91 8.13 8.35 8.83 9.38
48 198.09 7.99 6.39 Student 2.62 4.64 6.37 7.19 7.99 8.80 9.61 11.35 13.37
198.53 7.88 1.75 School 6.41 6.97 7.44 7.66 7.88 8.10 8.33 8.80 9.35
50 198.83 7.86 6.39 Student 2.49 4.51 6.24 7.06 7.86 8.67 9.48 11.21 13.24
198.83 7.86 1.75 School 6.39 6.95 7.42 7.64 7.86 8.08 8.31 8.78 9.33
52 199.56 7.73 6.39 Student 2.35 4.38 6.11 6.93 7.73 8.54 9.35 11.08 13.11
199.13 7.84 1.75 School 6.37 6.93 7.40 7.62 7.84 8.06 8.29 8.76 9.32
55 200.67 7.54 6.39 Student 2.16 4.19 5.92 6.73 7.54 8.34 9.16 10.89 12.91
199.59 7.82 1.75 School 6.34 6.90 7.37 7.60 7.82 8.04 8.26 8.73 9.29
60 202.54 7.20 6.39 Student 1.83 3.85 5.58 6.40 7.20 8.01 8.82 10.55 12.58
200.36 7.77 1.75 School 6.30 6.85 7.32 7.55 7.77 7.99 8.21 8.68 9.24
65 204.48 6.86 6.39 Student 1.48 3.51 5.24 6.06 6.86 7.66 8.48 10.21 12.24
201.16 7.72 1.75 School 6.24 6.80 7.27 7.50 7.72 7.94 8.16 8.63 9.19
70 206.52 6.50 6.39 Student 1.12 3.15 4.88 5.69 6.50 7.30 8.12 9.85 11.88
202.00 7.66 1.75 School 6.19 6.75 7.22 7.44 7.66 7.88 8.11 8.58 9.13
75 208.72 6.11 6.39 Student 0.73 2.76 4.49 5.30 6.11 6.91 7.73 9.46 11.49
202.90 7.61 1.75 School 6.13 6.69 7.16 7.39 7.61 7.83 8.05 8.52 9.08
80 211.17 5.67 6.39 Student 0.29 2.32 4.05 4.87 5.67 6.47 7.29 9.02 11.05
203.91 7.54 1.75 School 6.07 6.63 7.10 7.32 7.54 7.76 7.98 8.46 9.01
85 214.02 5.16 6.39 Student -0.21 1.81 3.55 4.36 5.16 5.97 6.78 8.52 10.54
205.09 7.47 1.75 School 6.00 6.55 7.02 7.25 7.47 7.69 7.91 8.38 8.94
90 217.61 4.53 6.39 Student -0.85 1.18 2.91 3.72 4.53 5.33 6.15 7.88 9.90
206.57 7.37 1.75 School 5.90 6.46 6.93 7.15 7.37 7.59 7.82 8.29 8.85
CGI - Conditional Growth Index CGP - Conditional Growth Percentile
332

Table E.3.17: Language Usage Grade 4 From Fall To Winter Conditional Growth Percentile
Conditional Growth
Start Status Growth CGP 20 30 40 45 50 55 60 70 80
%ile RIT Mean SD CGI -0.84 -0.52 -0.25 -0.13 0.00 0.13 0.25 0.52 0.84
10 180.04 7.82 4.96 Student 3.65 5.22 6.57 7.20 7.82 8.45 9.08 10.43 12.00
191.09 5.86 1.00 School 5.02 5.34 5.61 5.73 5.86 5.99 6.11 6.38 6.70
20 186.49 7.05 4.96 Student 2.88 4.45 5.80 6.43 7.05 7.68 8.31 9.66 11.23
193.75 5.76 1.00 School 4.92 5.24 5.51 5.64 5.76 5.89 6.02 6.29 6.61
25 188.94 6.76 4.96 Student 2.59 4.16 5.50 6.14 6.76 7.38 8.02 9.36 10.94
194.76 5.73 1.00 School 4.89 5.20 5.47 5.60 5.73 5.85 5.98 6.25 6.57
30 191.14 6.50 4.96 Student 2.32 3.90 5.24 5.88 6.50 7.12 7.76 9.10 10.67
195.66 5.69 1.00 School 4.85 5.17 5.44 5.57 5.69 5.82 5.95 6.22 6.54
35 193.18 6.25 4.96 Student 2.08 3.65 5.00 5.63 6.25 6.88 7.51 8.86 10.43
196.50 5.66 1.00 School 4.82 5.14 5.41 5.54 5.66 5.79 5.92 6.19 6.51
40 195.12 6.02 4.96 Student 1.85 3.42 4.77 5.40 6.02 6.65 7.28 8.63 10.20
197.30 5.64 1.00 School 4.79 5.11 5.38 5.51 5.64 5.76 5.89 6.16 6.48
45 196.99 5.80 4.96 Student 1.63 3.20 4.54 5.18 5.80 6.42 7.06 8.40 9.97
198.07 5.61 1.00 School 4.77 5.08 5.35 5.48 5.61 5.73 5.86 6.13 6.45
48 198.09 5.67 4.96 Student 1.49 3.07 4.41 5.04 5.67 6.29 6.92 8.27 9.84
198.53 5.59 1.00 School 4.75 5.07 5.34 5.47 5.59 5.72 5.84 6.12 6.43
50 198.83 5.58 4.96 Student 1.41 2.98 4.32 4.96 5.58 6.20 6.84 8.18 9.75
198.83 5.58 1.00 School 4.74 5.06 5.33 5.45 5.58 5.71 5.83 6.10 6.42
52 199.56 5.49 4.96 Student 1.32 2.89 4.24 4.87 5.49 6.12 6.75 8.09 9.67
199.13 5.57 1.00 School 4.73 5.04 5.32 5.44 5.57 5.69 5.82 6.09 6.41
55 200.67 5.36 4.96 Student 1.19 2.76 4.10 4.74 5.36 5.98 6.62 7.96 9.53
199.59 5.55 1.00 School 4.71 5.03 5.30 5.43 5.55 5.68 5.81 6.08 6.39
60 202.54 5.14 4.96 Student 0.96 2.54 3.88 4.51 5.14 5.76 6.39 7.74 9.31
200.36 5.52 1.00 School 4.68 5.00 5.27 5.40 5.52 5.65 5.78 6.05 6.37
65 204.48 4.91 4.96 Student 0.73 2.30 3.65 4.28 4.91 5.53 6.16 7.51 9.08
201.16 5.50 1.00 School 4.65 4.97 5.24 5.37 5.50 5.62 5.75 6.02 6.34
70 206.52 4.66 4.96 Student 0.49 2.06 3.41 4.04 4.66 5.29 5.92 7.26 8.84
202.00 5.47 1.00 School 4.62 4.94 5.21 5.34 5.47 5.59 5.72 5.99 6.31
75 208.72 4.40 4.96 Student 0.22 1.80 3.14 3.78 4.40 5.02 5.66 7.00 8.57
202.90 5.43 1.00 School 4.59 4.91 5.18 5.31 5.43 5.56 5.69 5.96 6.27
80 211.17 4.11 4.96 Student -0.07 1.51 2.85 3.48 4.11 4.73 5.36 6.71 8.28
203.91 5.40 1.00 School 4.56 4.87 5.14 5.27 5.40 5.52 5.65 5.92 6.24
85 214.02 3.77 4.96 Student -0.41 1.16 2.51 3.14 3.77 4.39 5.02 6.37 7.94
205.09 5.35 1.00 School 4.51 4.83 5.10 5.23 5.35 5.48 5.61 5.88 6.19
90 217.61 3.34 4.96 Student -0.84 0.73 2.08 2.71 3.34 3.96 4.59 5.94 7.51
206.57 5.30 1.00 School 4.46 4.78 5.05 5.17 5.30 5.43 5.55 5.82 6.14
CGI - Conditional Growth Index CGP - Conditional Growth Percentile
333

Table E.3.18: Language Usage Grade 4 From Winter To Spring Conditional Growth Percentile
Conditional Growth
Start Status Growth CGP 20 30 40 45 50 55 60 70 80
%ile RIT Mean SD CGI -0.84 -0.52 -0.25 -0.13 0.00 0.13 0.25 0.52 0.84
10 186.69 3.60 4.73 Student -0.38 1.12 2.41 3.01 3.60 4.20 4.80 6.08 7.59
196.84 2.33 0.77 School 1.68 1.93 2.13 2.23 2.33 2.42 2.52 2.73 2.97
20 192.77 3.15 4.73 Student -0.83 0.67 1.95 2.56 3.15 3.74 4.35 5.63 7.13
199.44 2.31 0.77 School 1.67 1.91 2.12 2.22 2.31 2.41 2.51 2.71 2.96
25 195.08 2.98 4.73 Student -1.00 0.50 1.78 2.38 2.98 3.57 4.18 5.46 6.96
200.43 2.31 0.77 School 1.66 1.90 2.11 2.21 2.31 2.40 2.50 2.71 2.95
30 197.16 2.82 4.73 Student -1.16 0.34 1.63 2.23 2.82 3.42 4.02 5.30 6.81
201.31 2.30 0.77 School 1.66 1.90 2.11 2.21 2.30 2.40 2.50 2.70 2.95
35 199.08 2.68 4.73 Student -1.30 0.20 1.48 2.09 2.68 3.27 3.88 5.16 6.66
202.13 2.30 0.77 School 1.65 1.89 2.10 2.20 2.30 2.39 2.49 2.70 2.94
40 200.91 2.54 4.73 Student -1.44 0.06 1.35 1.95 2.54 3.14 3.74 5.03 6.53
202.91 2.29 0.77 School 1.65 1.89 2.10 2.20 2.29 2.39 2.49 2.69 2.94
45 202.67 2.41 4.73 Student -1.57 -0.07 1.21 1.82 2.41 3.01 3.61 4.89 6.39
203.67 2.29 0.77 School 1.64 1.89 2.09 2.19 2.29 2.38 2.48 2.69 2.93
48 203.72 2.33 4.73 Student -1.65 -0.15 1.14 1.74 2.33 2.93 3.53 4.82 6.32
204.11 2.29 0.77 School 1.64 1.88 2.09 2.19 2.29 2.38 2.48 2.69 2.93
50 204.41 2.28 4.73 Student -1.70 -0.20 1.08 1.69 2.28 2.88 3.48 4.76 6.26
204.41 2.28 0.77 School 1.64 1.88 2.09 2.19 2.28 2.38 2.48 2.69 2.93
52 205.10 2.23 4.73 Student -1.75 -0.25 1.03 1.64 2.23 2.83 3.43 4.71 6.21
204.71 2.28 0.77 School 1.64 1.88 2.09 2.19 2.28 2.38 2.48 2.68 2.93
55 206.15 2.15 4.73 Student -1.83 -0.33 0.96 1.56 2.15 2.75 3.35 4.63 6.14
205.15 2.28 0.77 School 1.63 1.88 2.08 2.18 2.28 2.38 2.47 2.68 2.92
60 207.91 2.02 4.73 Student -1.96 -0.46 0.82 1.43 2.02 2.62 3.22 4.50 6.00
205.91 2.27 0.77 School 1.63 1.87 2.08 2.18 2.27 2.37 2.47 2.68 2.92
65 209.74 1.89 4.73 Student -2.10 -0.59 0.69 1.29 1.89 2.48 3.08 4.37 5.87
206.69 2.27 0.77 School 1.62 1.87 2.08 2.17 2.27 2.37 2.46 2.67 2.92
70 211.66 1.74 4.73 Student -2.24 -0.74 0.54 1.15 1.74 2.34 2.94 4.22 5.72
207.51 2.27 0.77 School 1.62 1.86 2.07 2.17 2.27 2.36 2.46 2.67 2.91
75 213.74 1.59 4.73 Student -2.39 -0.89 0.39 0.99 1.59 2.18 2.79 4.07 5.57
208.39 2.26 0.77 School 1.61 1.86 2.07 2.16 2.26 2.36 2.45 2.66 2.91
80 216.05 1.42 4.73 Student -2.57 -1.06 0.22 0.82 1.42 2.01 2.61 3.90 5.40
209.38 2.25 0.77 School 1.61 1.85 2.06 2.16 2.25 2.35 2.45 2.66 2.90
85 218.74 1.22 4.73 Student -2.77 -1.27 0.02 0.62 1.22 1.81 2.41 3.70 5.20
210.53 2.25 0.77 School 1.60 1.85 2.05 2.15 2.25 2.34 2.44 2.65 2.89
90 222.13 0.96 4.73 Student -3.02 -1.52 -0.24 0.37 0.96 1.56 2.16 3.44 4.94
211.98 2.24 0.77 School 1.59 1.84 2.04 2.14 2.24 2.34 2.43 2.64 2.88
CGI - Conditional Growth Index CGP - Conditional Growth Percentile
334

Table E.3.19: Language Usage Grade 5 From Last Winter To Winter Conditional Growth Percentile
Conditional Growth
Start Status Growth CGP 20 30 40 45 50 55 60 70 80
%ile RIT Mean SD CGI -0.84 -0.52 -0.25 -0.13 0.00 0.13 0.25 0.52 0.84
10 185.83 8.56 5.68 Student 3.78 5.58 7.12 7.85 8.56 9.28 10.00 11.54 13.35
196.53 6.35 1.60 School 5.01 5.51 5.95 6.15 6.35 6.55 6.76 7.19 7.70
20 192.07 7.58 5.68 Student 2.79 4.60 6.14 6.86 7.58 8.29 9.02 10.56 12.36
199.10 6.12 1.60 School 4.78 5.29 5.72 5.92 6.12 6.33 6.53 6.96 7.47
25 194.44 7.20 5.68 Student 2.42 4.22 5.76 6.49 7.20 7.92 8.64 10.18 11.99
200.08 6.04 1.60 School 4.69 5.20 5.63 5.84 6.04 6.24 6.44 6.88 7.38
30 196.57 6.87 5.68 Student 2.08 3.89 5.43 6.15 6.87 7.58 8.31 9.85 11.65
200.95 5.96 1.60 School 4.62 5.12 5.56 5.76 5.96 6.16 6.37 6.80 7.31
35 198.55 6.55 5.68 Student 1.77 3.57 5.11 5.84 6.55 7.27 7.99 9.54 11.34
201.76 5.89 1.60 School 4.55 5.05 5.48 5.69 5.89 6.09 6.29 6.73 7.23
40 200.42 6.26 5.68 Student 1.47 3.28 4.82 5.54 6.26 6.97 7.70 9.24 11.04
202.53 5.82 1.60 School 4.48 4.98 5.42 5.62 5.82 6.02 6.23 6.66 7.17
45 202.23 5.97 5.68 Student 1.19 2.99 4.53 5.26 5.97 6.69 7.41 8.95 10.76
203.28 5.76 1.60 School 4.41 4.92 5.35 5.55 5.76 5.96 6.16 6.59 7.10
48 203.30 5.80 5.68 Student 1.02 2.82 4.36 5.09 5.80 6.52 7.24 8.78 10.59
203.72 5.72 1.60 School 4.37 4.88 5.31 5.52 5.72 5.92 6.12 6.55 7.06
50 204.01 5.69 5.68 Student 0.91 2.71 4.25 4.98 5.69 6.41 7.13 8.67 10.47
204.01 5.69 1.60 School 4.35 4.85 5.29 5.49 5.69 5.89 6.10 6.53 7.03
52 204.72 5.58 5.68 Student 0.79 2.60 4.14 4.86 5.58 6.29 7.02 8.56 10.36
204.30 5.66 1.60 School 4.32 4.83 5.26 5.46 5.66 5.87 6.07 6.50 7.01
55 205.79 5.41 5.68 Student 0.62 2.43 3.97 4.69 5.41 6.12 6.85 8.39 10.19
204.75 5.63 1.60 School 4.28 4.79 5.22 5.43 5.63 5.83 6.03 6.46 6.97
60 207.61 5.12 5.68 Student 0.34 2.14 3.68 4.41 5.12 5.84 6.56 8.10 9.91
205.49 5.56 1.60 School 4.22 4.72 5.16 5.36 5.56 5.76 5.96 6.40 6.90
65 209.48 4.83 5.68 Student 0.04 1.85 3.39 4.11 4.83 5.54 6.27 7.81 9.61
206.26 5.49 1.60 School 4.15 4.65 5.09 5.29 5.49 5.69 5.90 6.33 6.84
70 211.45 4.52 5.68 Student -0.27 1.53 3.07 3.80 4.52 5.23 5.96 7.50 9.30
207.07 5.42 1.60 School 4.08 4.58 5.02 5.22 5.42 5.62 5.83 6.26 6.76
75 213.58 4.18 5.68 Student -0.61 1.20 2.74 3.46 4.18 4.89 5.62 7.16 8.96
207.95 5.34 1.60 School 4.00 4.51 4.94 5.14 5.34 5.54 5.75 6.18 6.69
80 215.95 3.80 5.68 Student -0.98 0.82 2.36 3.09 3.80 4.52 5.24 6.78 8.59
208.92 5.26 1.60 School 3.91 4.42 4.85 5.06 5.26 5.46 5.66 6.09 6.60
85 218.71 3.37 5.68 Student -1.42 0.39 1.93 2.65 3.37 4.08 4.81 6.35 8.15
210.06 5.16 1.60 School 3.81 4.32 4.75 4.96 5.16 5.36 5.56 5.99 6.50
90 222.19 2.82 5.68 Student -1.97 -0.16 1.38 2.10 2.82 3.53 4.26 5.80 7.60
211.49 5.03 1.60 School 3.69 4.19 4.63 4.83 5.03 5.23 5.43 5.87 6.37
CGI - Conditional Growth Index CGP - Conditional Growth Percentile
335

Table E.3.20: Language Usage Grade 5 From Last Spring To Spring Conditional Growth Percentile
Conditional Growth
Start Status Growth CGP 20 30 40 45 50 55 60 70 80
%ile RIT Mean SD CGI -0.84 -0.52 -0.25 -0.13 0.00 0.13 0.25 0.52 0.84
10 188.04 8.49 6.18 Student 3.29 5.25 6.93 7.72 8.49 9.27 10.06 11.73 13.69
198.71 5.97 1.92 School 4.35 4.96 5.49 5.73 5.97 6.22 6.46 6.98 7.59
20 194.35 7.31 6.18 Student 2.11 4.07 5.74 6.53 7.31 8.09 8.88 10.55 12.51
201.35 5.66 1.92 School 4.04 4.65 5.17 5.41 5.66 5.90 6.14 6.66 7.28
25 196.75 6.86 6.18 Student 1.66 3.62 5.29 6.08 6.86 7.64 8.43 10.10 12.06
202.36 5.53 1.92 School 3.91 4.53 5.05 5.29 5.53 5.78 6.02 6.54 7.15
30 198.90 6.46 6.18 Student 1.26 3.22 4.89 5.68 6.46 7.23 8.02 9.70 11.66
203.26 5.43 1.92 School 3.81 4.42 4.94 5.18 5.43 5.67 5.91 6.44 7.05
35 200.89 6.08 6.18 Student 0.88 2.84 4.52 5.31 6.08 6.86 7.65 9.32 11.29
204.10 5.33 1.92 School 3.71 4.32 4.84 5.08 5.33 5.57 5.81 6.34 6.95
40 202.79 5.73 6.18 Student 0.53 2.49 4.16 4.95 5.73 6.51 7.29 8.97 10.93
204.89 5.23 1.92 School 3.61 4.22 4.74 4.99 5.23 5.47 5.72 6.24 6.85
45 204.62 5.39 6.18 Student 0.18 2.14 3.82 4.61 5.39 6.16 6.95 8.63 10.59
205.66 5.14 1.92 School 3.52 4.13 4.65 4.90 5.14 5.38 5.63 6.15 6.76
48 205.70 5.18 6.18 Student -0.02 1.94 3.62 4.41 5.18 5.96 6.75 8.42 10.38
206.12 5.08 1.92 School 3.46 4.07 4.60 4.84 5.08 5.33 5.57 6.09 6.70
50 206.42 5.05 6.18 Student -0.15 1.81 3.48 4.27 5.05 5.82 6.61 8.29 10.25
206.42 5.05 1.92 School 3.43 4.04 4.56 4.81 5.05 5.29 5.53 6.06 6.67
52 207.14 4.91 6.18 Student -0.29 1.67 3.35 4.14 4.91 5.69 6.48 8.15 10.11
206.72 5.01 1.92 School 3.39 4.00 4.52 4.77 5.01 5.25 5.50 6.02 6.63
55 208.22 4.71 6.18 Student -0.49 1.47 3.14 3.93 4.71 5.49 6.28 7.95 9.91
207.17 4.96 1.92 School 3.34 3.95 4.47 4.71 4.96 5.20 5.44 5.97 6.58
60 210.05 4.37 6.18 Student -0.84 1.12 2.80 3.59 4.37 5.14 5.93 7.61 9.57
207.94 4.86 1.92 School 3.24 3.85 4.38 4.62 4.86 5.11 5.35 5.87 6.48
65 211.94 4.01 6.18 Student -1.19 0.77 2.45 3.23 4.01 4.79 5.58 7.25 9.21
208.74 4.77 1.92 School 3.15 3.76 4.28 4.53 4.77 5.01 5.26 5.78 6.39
70 213.94 3.64 6.18 Student -1.56 0.40 2.07 2.86 3.64 4.41 5.20 6.88 8.84
209.57 4.67 1.92 School 3.05 3.66 4.18 4.43 4.67 4.91 5.16 5.68 6.29
75 216.09 3.23 6.18 Student -1.97 -0.01 1.67 2.46 3.23 4.01 4.80 6.47 8.44
210.48 4.56 1.92 School 2.94 3.55 4.07 4.32 4.56 4.80 5.05 5.57 6.18
80 218.49 2.78 6.18 Student -2.42 -0.46 1.22 2.01 2.78 3.56 4.35 6.03 7.99
211.48 4.44 1.92 School 2.82 3.43 3.95 4.20 4.44 4.68 4.93 5.45 6.06
85 221.28 2.26 6.18 Student -2.94 -0.98 0.69 1.48 2.26 3.04 3.83 5.50 7.46
212.66 4.30 1.92 School 2.68 3.29 3.81 4.06 4.30 4.54 4.79 5.31 5.92
90 224.79 1.60 6.18 Student -3.60 -1.64 0.04 0.82 1.60 2.38 3.17 4.84 6.80
214.13 4.12 1.92 School 2.50 3.11 3.63 3.88 4.12 4.36 4.61 5.13 5.74
CGI - Conditional Growth Index CGP - Conditional Growth Percentile
336
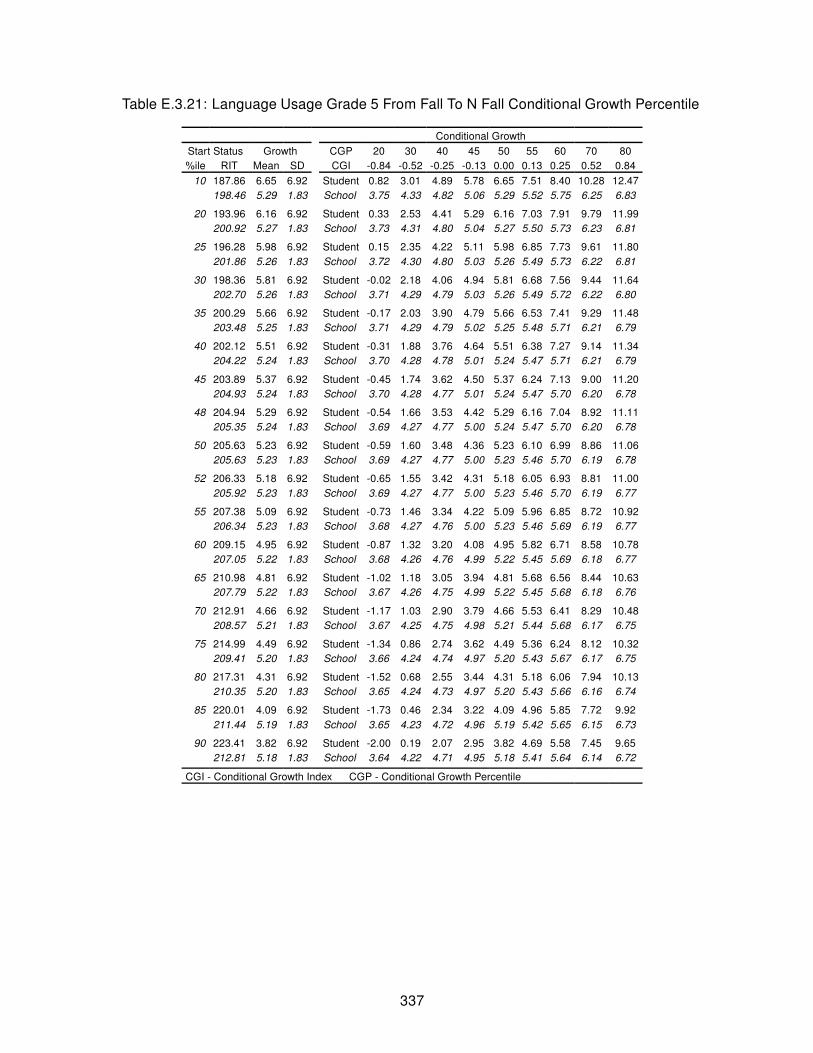
Table E.3.21: Language Usage Grade 5 From Fall To N Fall Conditional Growth Percentile
Conditional Growth
Start Status Growth CGP 20 30 40 45 50 55 60 70 80
%ile RIT Mean SD CGI -0.84 -0.52 -0.25 -0.13 0.00 0.13 0.25 0.52 0.84
10 187.86 6.65 6.92 Student 0.82 3.01 4.89 5.78 6.65 7.51 8.40 10.28 12.47
198.46 5.29 1.83 School 3.75 4.33 4.82 5.06 5.29 5.52 5.75 6.25 6.83
20 193.96 6.16 6.92 Student 0.33 2.53 4.41 5.29 6.16 7.03 7.91 9.79 11.99
200.92 5.27 1.83 School 3.73 4.31 4.80 5.04 5.27 5.50 5.73 6.23 6.81
25 196.28 5.98 6.92 Student 0.15 2.35 4.22 5.11 5.98 6.85 7.73 9.61 11.80
201.86 5.26 1.83 School 3.72 4.30 4.80 5.03 5.26 5.49 5.73 6.22 6.81
30 198.36 5.81 6.92 Student -0.02 2.18 4.06 4.94 5.81 6.68 7.56 9.44 11.64
202.70 5.26 1.83 School 3.71 4.29 4.79 5.03 5.26 5.49 5.72 6.22 6.80
35 200.29 5.66 6.92 Student -0.17 2.03 3.90 4.79 5.66 6.53 7.41 9.29 11.48
203.48 5.25 1.83 School 3.71 4.29 4.79 5.02 5.25 5.48 5.71 6.21 6.79
40 202.12 5.51 6.92 Student -0.31 1.88 3.76 4.64 5.51 6.38 7.27 9.14 11.34
204.22 5.24 1.83 School 3.70 4.28 4.78 5.01 5.24 5.47 5.71 6.21 6.79
45 203.89 5.37 6.92 Student -0.45 1.74 3.62 4.50 5.37 6.24 7.13 9.00 11.20
204.93 5.24 1.83 School 3.70 4.28 4.77 5.01 5.24 5.47 5.70 6.20 6.78
48 204.94 5.29 6.92 Student -0.54 1.66 3.53 4.42 5.29 6.16 7.04 8.92 11.11
205.35 5.24 1.83 School 3.69 4.27 4.77 5.00 5.24 5.47 5.70 6.20 6.78
50 205.63 5.23 6.92 Student -0.59 1.60 3.48 4.36 5.23 6.10 6.99 8.86 11.06
205.63 5.23 1.83 School 3.69 4.27 4.77 5.00 5.23 5.46 5.70 6.19 6.78
52 206.33 5.18 6.92 Student -0.65 1.55 3.42 4.31 5.18 6.05 6.93 8.81 11.00
205.92 5.23 1.83 School 3.69 4.27 4.77 5.00 5.23 5.46 5.70 6.19 6.77
55 207.38 5.09 6.92 Student -0.73 1.46 3.34 4.22 5.09 5.96 6.85 8.72 10.92
206.34 5.23 1.83 School 3.68 4.27 4.76 5.00 5.23 5.46 5.69 6.19 6.77
60 209.15 4.95 6.92 Student -0.87 1.32 3.20 4.08 4.95 5.82 6.71 8.58 10.78
207.05 5.22 1.83 School 3.68 4.26 4.76 4.99 5.22 5.45 5.69 6.18 6.77
65 210.98 4.81 6.92 Student -1.02 1.18 3.05 3.94 4.81 5.68 6.56 8.44 10.63
207.79 5.22 1.83 School 3.67 4.26 4.75 4.99 5.22 5.45 5.68 6.18 6.76
70 212.91 4.66 6.92 Student -1.17 1.03 2.90 3.79 4.66 5.53 6.41 8.29 10.48
208.57 5.21 1.83 School 3.67 4.25 4.75 4.98 5.21 5.44 5.68 6.17 6.75
75 214.99 4.49 6.92 Student -1.34 0.86 2.74 3.62 4.49 5.36 6.24 8.12 10.32
209.41 5.20 1.83 School 3.66 4.24 4.74 4.97 5.20 5.43 5.67 6.17 6.75
80 217.31 4.31 6.92 Student -1.52 0.68 2.55 3.44 4.31 5.18 6.06 7.94 10.13
210.35 5.20 1.83 School 3.65 4.24 4.73 4.97 5.20 5.43 5.66 6.16 6.74
85 220.01 4.09 6.92 Student -1.73 0.46 2.34 3.22 4.09 4.96 5.85 7.72 9.92
211.44 5.19 1.83 School 3.65 4.23 4.72 4.96 5.19 5.42 5.65 6.15 6.73
90 223.41 3.82 6.92 Student -2.00 0.19 2.07 2.95 3.82 4.69 5.58 7.45 9.65
212.81 5.18 1.83 School 3.64 4.22 4.71 4.95 5.18 5.41 5.64 6.14 6.72
CGI - Conditional Growth Index CGP - Conditional Growth Percentile
337

Table E.3.22: Language Usage Grade 5 From Fall To Spring Conditional Growth Percentile
Conditional Growth
Start Status Growth CGP 20 30 40 45 50 55 60 70 80
%ile RIT Mean SD CGI -0.84 -0.52 -0.25 -0.13 0.00 0.13 0.25 0.52 0.84
10 187.86 8.81 6.37 Student 3.45 5.47 7.20 8.01 8.81 9.61 10.43 12.15 14.17
198.46 6.12 1.70 School 4.69 5.23 5.69 5.91 6.12 6.33 6.55 7.01 7.55
20 193.96 7.79 6.37 Student 2.42 4.45 6.17 6.99 7.79 8.59 9.40 11.13 13.15
200.92 6.02 1.70 School 4.59 5.13 5.59 5.81 6.02 6.24 6.45 6.91 7.45
25 196.28 7.40 6.37 Student 2.04 4.06 5.78 6.60 7.40 8.20 9.01 10.74 12.76
201.86 5.98 1.70 School 4.55 5.09 5.55 5.77 5.98 6.20 6.41 6.88 7.41
30 198.36 7.05 6.37 Student 1.69 3.71 5.44 6.25 7.05 7.85 8.66 10.39 12.41
202.70 5.95 1.70 School 4.52 5.06 5.52 5.74 5.95 6.16 6.38 6.84 7.38
35 200.29 6.73 6.37 Student 1.36 3.38 5.11 5.93 6.73 7.53 8.34 10.07 12.09
203.48 5.92 1.70 School 4.49 5.03 5.49 5.70 5.92 6.13 6.35 6.81 7.35
40 202.12 6.42 6.37 Student 1.06 3.08 4.81 5.62 6.42 7.22 8.03 9.76 11.78
204.22 5.89 1.70 School 4.46 5.00 5.46 5.67 5.89 6.10 6.32 6.78 7.32
45 203.89 6.12 6.37 Student 0.76 2.78 4.51 5.32 6.12 6.92 7.74 9.47 11.49
204.93 5.86 1.70 School 4.43 4.97 5.43 5.65 5.86 6.07 6.29 6.75 7.29
48 204.94 5.95 6.37 Student 0.58 2.61 4.33 5.15 5.95 6.75 7.56 9.29 11.31
205.35 5.84 1.70 School 4.41 4.95 5.41 5.63 5.84 6.06 6.27 6.73 7.27
50 205.63 5.83 6.37 Student 0.47 2.49 4.22 5.03 5.83 6.63 7.45 9.17 11.19
205.63 5.83 1.70 School 4.40 4.94 5.40 5.62 5.83 6.04 6.26 6.72 7.26
52 206.33 5.71 6.37 Student 0.35 2.37 4.10 4.91 5.71 6.52 7.33 9.06 11.08
205.92 5.82 1.70 School 4.39 4.93 5.39 5.61 5.82 6.03 6.25 6.71 7.25
55 207.38 5.54 6.37 Student 0.17 2.20 3.92 4.74 5.54 6.34 7.15 8.88 10.90
206.34 5.80 1.70 School 4.37 4.91 5.37 5.59 5.80 6.02 6.23 6.69 7.23
60 209.15 5.24 6.37 Student -0.12 1.90 3.63 4.44 5.24 6.04 6.86 8.58 10.61
207.05 5.77 1.70 School 4.34 4.88 5.34 5.56 5.77 5.99 6.20 6.67 7.20
65 210.98 4.93 6.37 Student -0.43 1.59 3.32 4.13 4.93 5.74 6.55 8.28 10.30
207.79 5.74 1.70 School 4.31 4.85 5.31 5.53 5.74 5.96 6.17 6.64 7.17
70 212.91 4.61 6.37 Student -0.75 1.27 3.00 3.81 4.61 5.41 6.23 7.95 9.98
208.57 5.71 1.70 School 4.28 4.82 5.28 5.50 5.71 5.93 6.14 6.60 7.14
75 214.99 4.26 6.37 Student -1.10 0.92 2.65 3.46 4.26 5.06 5.88 7.60 9.63
209.41 5.68 1.70 School 4.25 4.79 5.25 5.46 5.68 5.89 6.11 6.57 7.11
80 217.31 3.87 6.37 Student -1.49 0.53 2.26 3.07 3.87 4.67 5.49 7.22 9.24
210.35 5.64 1.70 School 4.21 4.75 5.21 5.43 5.64 5.85 6.07 6.53 7.07
85 220.01 3.42 6.37 Student -1.94 0.08 1.81 2.62 3.42 4.22 5.04 6.76 8.78
211.44 5.60 1.70 School 4.17 4.70 5.17 5.38 5.60 5.81 6.03 6.49 7.03
90 223.41 2.85 6.37 Student -2.51 -0.49 1.24 2.05 2.85 3.65 4.47 6.19 8.21
212.81 5.54 1.70 School 4.11 4.65 5.11 5.33 5.54 5.75 5.97 6.43 6.97
CGI - Conditional Growth Index CGP - Conditional Growth Percentile
338

Table E.3.23: Language Usage Grade 5 From Fall To Winter Conditional Growth Percentile
Conditional Growth
Start Status Growth CGP 20 30 40 45 50 55 60 70 80
%ile RIT Mean SD CGI -0.84 -0.52 -0.25 -0.13 0.00 0.13 0.25 0.52 0.84
10 187.86 6.13 4.96 Student 1.96 3.53 4.87 5.50 6.13 6.75 7.38 8.73 10.30
198.46 4.23 0.97 School 3.42 3.72 3.99 4.11 4.23 4.36 4.48 4.74 5.05
20 193.96 5.42 4.96 Student 1.25 2.82 4.16 4.80 5.42 6.04 6.68 8.02 9.59
200.92 4.18 0.97 School 3.36 3.67 3.93 4.05 4.18 4.30 4.42 4.69 5.00
25 196.28 5.15 4.96 Student 0.98 2.55 3.90 4.53 5.15 5.77 6.41 7.75 9.32
201.86 4.16 0.97 School 3.34 3.65 3.91 4.03 4.16 4.28 4.40 4.67 4.97
30 198.36 4.91 4.96 Student 0.74 2.31 3.65 4.29 4.91 5.53 6.17 7.51 9.08
202.70 4.14 0.97 School 3.32 3.63 3.89 4.01 4.14 4.26 4.38 4.65 4.95
35 200.29 4.69 4.96 Student 0.52 2.09 3.43 4.06 4.69 5.31 5.94 7.29 8.86
203.48 4.12 0.97 School 3.30 3.61 3.87 4.00 4.12 4.24 4.36 4.63 4.94
40 202.12 4.48 4.96 Student 0.30 1.88 3.22 3.85 4.48 5.10 5.73 7.07 8.65
204.22 4.10 0.97 School 3.28 3.59 3.85 3.98 4.10 4.22 4.35 4.61 4.92
45 203.89 4.27 4.96 Student 0.10 1.67 3.01 3.65 4.27 4.89 5.53 6.87 8.44
204.93 4.08 0.97 School 3.27 3.57 3.84 3.96 4.08 4.21 4.33 4.59 4.90
48 204.94 4.15 4.96 Student -0.02 1.55 2.89 3.53 4.15 4.77 5.40 6.75 8.32
205.35 4.07 0.97 School 3.26 3.56 3.83 3.95 4.07 4.20 4.32 4.58 4.89
50 205.63 4.07 4.96 Student -0.10 1.47 2.81 3.45 4.07 4.69 5.32 6.67 8.24
205.63 4.07 0.97 School 3.25 3.56 3.82 3.95 4.07 4.19 4.31 4.58 4.89
52 206.33 3.99 4.96 Student -0.18 1.39 2.73 3.36 3.99 4.61 5.24 6.59 8.16
205.92 4.06 0.97 School 3.24 3.55 3.82 3.94 4.06 4.18 4.31 4.57 4.88
55 207.38 3.87 4.96 Student -0.31 1.27 2.61 3.24 3.87 4.49 5.12 6.47 8.04
206.34 4.05 0.97 School 3.23 3.54 3.81 3.93 4.05 4.17 4.30 4.56 4.87
60 209.15 3.66 4.96 Student -0.51 1.06 2.41 3.04 3.66 4.28 4.92 6.26 7.83
207.05 4.04 0.97 School 3.22 3.53 3.79 3.91 4.04 4.16 4.28 4.54 4.85
65 210.98 3.45 4.96 Student -0.72 0.85 2.19 2.83 3.45 4.07 4.70 6.05 7.62
207.79 4.02 0.97 School 3.20 3.51 3.77 3.90 4.02 4.14 4.26 4.53 4.84
70 212.91 3.23 4.96 Student -0.95 0.63 1.97 2.60 3.23 3.85 4.48 5.82 7.40
208.57 4.00 0.97 School 3.18 3.49 3.75 3.88 4.00 4.12 4.25 4.51 4.82
75 214.99 2.98 4.96 Student -1.19 0.38 1.73 2.36 2.98 3.61 4.24 5.58 7.16
209.41 3.98 0.97 School 3.16 3.47 3.73 3.86 3.98 4.10 4.23 4.49 4.80
80 217.31 2.72 4.96 Student -1.46 0.12 1.46 2.09 2.72 3.34 3.97 5.32 6.89
210.35 3.96 0.97 School 3.14 3.45 3.71 3.84 3.96 4.08 4.21 4.47 4.78
85 220.01 2.40 4.96 Student -1.77 -0.20 1.15 1.78 2.40 3.03 3.66 5.00 6.57
211.44 3.93 0.97 School 3.12 3.42 3.69 3.81 3.93 4.06 4.18 4.44 4.75
90 223.41 2.01 4.96 Student -2.16 -0.59 0.75 1.39 2.01 2.63 3.26 4.61 6.18
212.81 3.90 0.97 School 3.08 3.39 3.66 3.78 3.90 4.02 4.15 4.41 4.72
CGI - Conditional Growth Index CGP - Conditional Growth Percentile
339

Table E.3.24: Language Usage Grade 5 From Winter To Spring Conditional Growth Percentile
Conditional Growth
Start Status Growth CGP 20 30 40 45 50 55 60 70 80
%ile RIT Mean SD CGI -0.84 -0.52 -0.25 -0.13 0.00 0.13 0.25 0.52 0.84
10 192.75 2.94 4.72 Student -1.04 0.46 1.74 2.34 2.94 3.53 4.13 5.41 6.91
202.58 1.72 0.74 School 1.10 1.34 1.54 1.63 1.72 1.81 1.91 2.11 2.34
20 198.57 2.53 4.72 Student -1.44 0.06 1.34 1.94 2.53 3.13 3.73 5.01 6.51
205.03 1.74 0.74 School 1.12 1.35 1.55 1.64 1.74 1.83 1.92 2.12 2.36
25 200.78 2.38 4.72 Student -1.60 -0.10 1.18 1.79 2.38 2.97 3.58 4.86 6.36
205.96 1.74 0.74 School 1.12 1.36 1.56 1.65 1.74 1.83 1.93 2.13 2.36
30 202.77 2.24 4.72 Student -1.73 -0.23 1.05 1.65 2.24 2.84 3.44 4.72 6.22
206.79 1.75 0.74 School 1.13 1.36 1.56 1.65 1.75 1.84 1.93 2.13 2.37
35 204.61 2.12 4.72 Student -1.86 -0.36 0.92 1.52 2.12 2.71 3.31 4.59 6.09
207.56 1.75 0.74 School 1.13 1.37 1.56 1.66 1.75 1.84 1.94 2.14 2.37
40 206.35 1.99 4.72 Student -1.98 -0.48 0.80 1.40 1.99 2.59 3.19 4.47 5.97
208.30 1.75 0.74 School 1.14 1.37 1.57 1.66 1.75 1.85 1.94 2.14 2.37
45 208.04 1.88 4.72 Student -2.10 -0.60 0.68 1.28 1.88 2.47 3.07 4.35 5.85
209.00 1.76 0.74 School 1.14 1.37 1.57 1.67 1.76 1.85 1.95 2.14 2.38
48 209.04 1.81 4.72 Student -2.17 -0.67 0.61 1.22 1.81 2.40 3.01 4.29 5.78
209.42 1.76 0.74 School 1.14 1.38 1.58 1.67 1.76 1.85 1.95 2.15 2.38
50 209.70 1.76 4.72 Student -2.21 -0.71 0.57 1.17 1.76 2.36 2.96 4.24 5.74
209.70 1.76 0.74 School 1.14 1.38 1.58 1.67 1.76 1.86 1.95 2.15 2.38
52 210.37 1.72 4.72 Student -2.26 -0.76 0.52 1.12 1.72 2.31 2.91 4.19 5.69
209.98 1.76 0.74 School 1.15 1.38 1.58 1.67 1.76 1.86 1.95 2.15 2.38
55 211.36 1.65 4.72 Student -2.33 -0.83 0.45 1.05 1.65 2.24 2.84 4.12 5.62
210.40 1.77 0.74 School 1.15 1.38 1.58 1.67 1.77 1.86 1.95 2.15 2.39
60 213.05 1.53 4.72 Student -2.44 -0.95 0.33 0.94 1.53 2.12 2.73 4.01 5.51
211.11 1.77 0.74 School 1.15 1.39 1.58 1.68 1.77 1.86 1.96 2.16 2.39
65 214.80 1.41 4.72 Student -2.57 -1.07 0.21 0.82 1.41 2.00 2.61 3.89 5.39
211.84 1.78 0.74 School 1.16 1.39 1.59 1.68 1.78 1.87 1.96 2.16 2.39
70 216.64 1.28 4.72 Student -2.69 -1.19 0.09 0.69 1.28 1.88 2.48 3.76 5.26
212.62 1.78 0.74 School 1.16 1.39 1.59 1.69 1.78 1.87 1.97 2.17 2.40
75 218.62 1.15 4.72 Student -2.83 -1.33 -0.05 0.55 1.15 1.74 2.34 3.62 5.12
213.45 1.78 0.74 School 1.17 1.40 1.60 1.69 1.78 1.88 1.97 2.17 2.40
80 220.83 0.99 4.72 Student -2.98 -1.48 -0.20 0.40 0.99 1.59 2.19 3.47 4.97
214.38 1.79 0.74 School 1.17 1.40 1.60 1.70 1.79 1.88 1.98 2.18 2.41
85 223.41 0.81 4.72 Student -3.16 -1.66 -0.38 0.22 0.81 1.41 2.01 3.29 4.79
215.46 1.80 0.74 School 1.18 1.41 1.61 1.70 1.80 1.89 1.98 2.18 2.41
90 226.65 0.59 4.72 Student -3.39 -1.89 -0.61 -0.00 0.59 1.18 1.79 3.07 4.57
216.82 1.80 0.74 School 1.18 1.42 1.62 1.71 1.80 1.90 1.99 2.19 2.42
CGI - Conditional Growth Index CGP - Conditional Growth Percentile
340
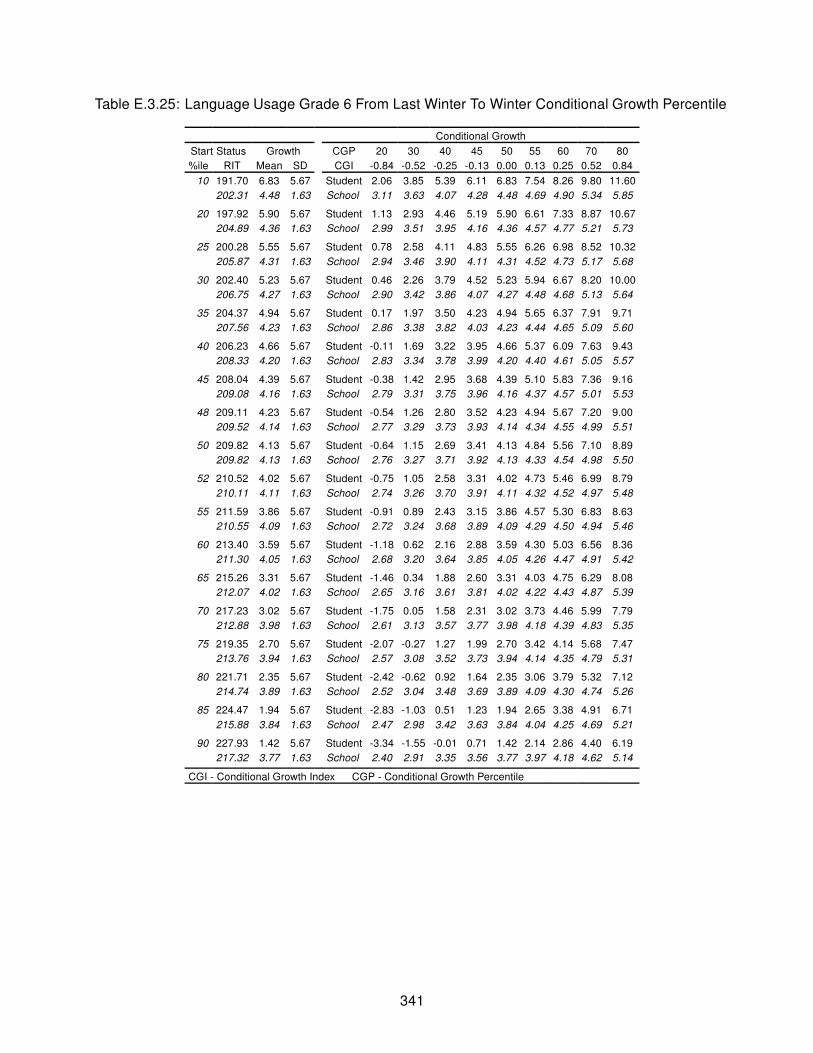
Table E.3.25: Language Usage Grade 6 From Last Winter To Winter Conditional Growth Percentile
Conditional Growth
Start Status Growth CGP 20 30 40 45 50 55 60 70 80
%ile RIT Mean SD CGI -0.84 -0.52 -0.25 -0.13 0.00 0.13 0.25 0.52 0.84
10 191.70 6.83 5.67 Student 2.06 3.85 5.39 6.11 6.83 7.54 8.26 9.80 11.60
202.31 4.48 1.63 School 3.11 3.63 4.07 4.28 4.48 4.69 4.90 5.34 5.85
20 197.92 5.90 5.67 Student 1.13 2.93 4.46 5.19 5.90 6.61 7.33 8.87 10.67
204.89 4.36 1.63 School 2.99 3.51 3.95 4.16 4.36 4.57 4.77 5.21 5.73
25 200.28 5.55 5.67 Student 0.78 2.58 4.11 4.83 5.55 6.26 6.98 8.52 10.32
205.87 4.31 1.63 School 2.94 3.46 3.90 4.11 4.31 4.52 4.73 5.17 5.68
30 202.40 5.23 5.67 Student 0.46 2.26 3.79 4.52 5.23 5.94 6.67 8.20 10.00
206.75 4.27 1.63 School 2.90 3.42 3.86 4.07 4.27 4.48 4.68 5.13 5.64
35 204.37 4.94 5.67 Student 0.17 1.97 3.50 4.23 4.94 5.65 6.37 7.91 9.71
207.56 4.23 1.63 School 2.86 3.38 3.82 4.03 4.23 4.44 4.65 5.09 5.60
40 206.23 4.66 5.67 Student -0.11 1.69 3.22 3.95 4.66 5.37 6.09 7.63 9.43
208.33 4.20 1.63 School 2.83 3.34 3.78 3.99 4.20 4.40 4.61 5.05 5.57
45 208.04 4.39 5.67 Student -0.38 1.42 2.95 3.68 4.39 5.10 5.83 7.36 9.16
209.08 4.16 1.63 School 2.79 3.31 3.75 3.96 4.16 4.37 4.57 5.01 5.53
48 209.11 4.23 5.67 Student -0.54 1.26 2.80 3.52 4.23 4.94 5.67 7.20 9.00
209.52 4.14 1.63 School 2.77 3.29 3.73 3.93 4.14 4.34 4.55 4.99 5.51
50 209.82 4.13 5.67 Student -0.64 1.15 2.69 3.41 4.13 4.84 5.56 7.10 8.89
209.82 4.13 1.63 School 2.76 3.27 3.71 3.92 4.13 4.33 4.54 4.98 5.50
52 210.52 4.02 5.67 Student -0.75 1.05 2.58 3.31 4.02 4.73 5.46 6.99 8.79
210.11 4.11 1.63 School 2.74 3.26 3.70 3.91 4.11 4.32 4.52 4.97 5.48
55 211.59 3.86 5.67 Student -0.91 0.89 2.43 3.15 3.86 4.57 5.30 6.83 8.63
210.55 4.09 1.63 School 2.72 3.24 3.68 3.89 4.09 4.29 4.50 4.94 5.46
60 213.40 3.59 5.67 Student -1.18 0.62 2.16 2.88 3.59 4.30 5.03 6.56 8.36
211.30 4.05 1.63 School 2.68 3.20 3.64 3.85 4.05 4.26 4.47 4.91 5.42
65 215.26 3.31 5.67 Student -1.46 0.34 1.88 2.60 3.31 4.03 4.75 6.29 8.08
212.07 4.02 1.63 School 2.65 3.16 3.61 3.81 4.02 4.22 4.43 4.87 5.39
70 217.23 3.02 5.67 Student -1.75 0.05 1.58 2.31 3.02 3.73 4.46 5.99 7.79
212.88 3.98 1.63 School 2.61 3.13 3.57 3.77 3.98 4.18 4.39 4.83 5.35
75 219.35 2.70 5.67 Student -2.07 -0.27 1.27 1.99 2.70 3.42 4.14 5.68 7.47
213.76 3.94 1.63 School 2.57 3.08 3.52 3.73 3.94 4.14 4.35 4.79 5.31
80 221.71 2.35 5.67 Student -2.42 -0.62 0.92 1.64 2.35 3.06 3.79 5.32 7.12
214.74 3.89 1.63 School 2.52 3.04 3.48 3.69 3.89 4.09 4.30 4.74 5.26
85 224.47 1.94 5.67 Student -2.83 -1.03 0.51 1.23 1.94 2.65 3.38 4.91 6.71
215.88 3.84 1.63 School 2.47 2.98 3.42 3.63 3.84 4.04 4.25 4.69 5.21
90 227.93 1.42 5.67 Student -3.34 -1.55 -0.01 0.71 1.42 2.14 2.86 4.40 6.19
217.32 3.77 1.63 School 2.40 2.91 3.35 3.56 3.77 3.97 4.18 4.62 5.14
CGI - Conditional Growth Index CGP - Conditional Growth Percentile
341

Table E.3.26: Language Usage Grade 6 From Last Spring To Spring Conditional Growth Percentile
Conditional Growth
Start Status Growth CGP 20 30 40 45 50 55 60 70 80
%ile RIT Mean SD CGI -0.84 -0.52 -0.25 -0.13 0.00 0.13 0.25 0.52 0.84
10 193.19 6.85 6.18 Student 1.66 3.62 5.29 6.08 6.85 7.63 8.42 10.09 12.05
203.97 4.11 1.90 School 2.51 3.11 3.63 3.87 4.11 4.34 4.59 5.10 5.70
20 199.54 5.73 6.18 Student 0.54 2.50 4.17 4.96 5.73 6.51 7.30 8.97 10.93
206.61 3.93 1.90 School 2.33 2.93 3.45 3.69 3.93 4.17 4.41 4.92 5.53
25 201.95 5.31 6.18 Student 0.11 2.07 3.74 4.53 5.31 6.08 6.87 8.55 10.51
207.62 3.86 1.90 School 2.27 2.87 3.38 3.62 3.86 4.10 4.34 4.86 5.46
30 204.11 4.93 6.18 Student -0.27 1.69 3.36 4.15 4.93 5.70 6.49 8.17 10.12
208.52 3.80 1.90 School 2.21 2.81 3.32 3.56 3.80 4.04 4.28 4.80 5.40
35 206.11 4.57 6.18 Student -0.63 1.33 3.01 3.80 4.57 5.35 6.14 7.81 9.77
209.35 3.75 1.90 School 2.15 2.75 3.27 3.51 3.75 3.98 4.23 4.74 5.34
40 208.02 4.24 6.18 Student -0.96 1.00 2.67 3.46 4.24 5.01 5.80 7.48 9.43
210.15 3.69 1.90 School 2.10 2.70 3.21 3.45 3.69 3.93 4.17 4.69 5.29
45 209.86 3.91 6.18 Student -1.29 0.67 2.35 3.14 3.91 4.69 5.48 7.15 9.11
210.91 3.64 1.90 School 2.05 2.65 3.16 3.40 3.64 3.88 4.12 4.64 5.24
48 210.95 3.72 6.18 Student -1.48 0.48 2.15 2.94 3.72 4.49 5.28 6.96 8.92
211.37 3.61 1.90 School 2.01 2.62 3.13 3.37 3.61 3.85 4.09 4.61 5.21
50 211.67 3.59 6.18 Student -1.61 0.35 2.03 2.82 3.59 4.37 5.16 6.83 8.79
211.67 3.59 1.90 School 1.99 2.60 3.11 3.35 3.59 3.83 4.07 4.59 5.19
52 212.39 3.46 6.18 Student -1.73 0.22 1.90 2.69 3.46 4.24 5.03 6.70 8.66
211.97 3.57 1.90 School 1.97 2.58 3.09 3.33 3.57 3.81 4.05 4.57 5.17
55 213.48 3.27 6.18 Student -1.93 0.03 1.71 2.50 3.27 4.05 4.84 6.51 8.47
212.42 3.54 1.90 School 1.94 2.55 3.06 3.30 3.54 3.78 4.02 4.54 5.14
60 215.32 2.95 6.18 Student -2.25 -0.29 1.38 2.17 2.95 3.72 4.51 6.18 8.14
213.19 3.49 1.90 School 1.89 2.49 3.01 3.25 3.49 3.73 3.97 4.48 5.09
65 217.22 2.61 6.18 Student -2.59 -0.63 1.05 1.83 2.61 3.39 4.17 5.85 7.81
213.99 3.44 1.90 School 1.84 2.44 2.96 3.20 3.44 3.67 3.92 4.43 5.03
70 219.23 2.26 6.18 Student -2.94 -0.98 0.69 1.48 2.26 3.03 3.82 5.49 7.45
214.82 3.38 1.90 School 1.78 2.39 2.90 3.14 3.38 3.62 3.86 4.38 4.98
75 221.39 1.87 6.18 Student -3.32 -1.37 0.31 1.10 1.87 2.65 3.44 5.11 7.07
215.72 3.32 1.90 School 1.72 2.33 2.84 3.08 3.32 3.56 3.80 4.31 4.92
80 223.80 1.45 6.18 Student -3.75 -1.79 -0.12 0.67 1.45 2.22 3.01 4.69 6.65
216.73 3.25 1.90 School 1.66 2.26 2.77 3.01 3.25 3.49 3.73 4.25 4.85
85 226.61 0.95 6.18 Student -4.25 -2.29 -0.61 0.18 0.95 1.73 2.52 4.19 6.15
217.90 3.17 1.90 School 1.58 2.18 2.69 2.94 3.17 3.41 3.66 4.17 4.77
90 230.15 0.33 6.18 Student -4.87 -2.91 -1.24 -0.45 0.33 1.10 1.89 3.57 5.53
219.37 3.08 1.90 School 1.48 2.08 2.60 2.84 3.08 3.31 3.56 4.07 4.67
CGI - Conditional Growth Index CGP - Conditional Growth Percentile
342

Table E.3.27: Language Usage Grade 6 From Fall To N Fall Conditional Growth Percentile
Conditional Growth
Start Status Growth CGP 20 30 40 45 50 55 60 70 80
%ile RIT Mean SD CGI -0.84 -0.52 -0.25 -0.13 0.00 0.13 0.25 0.52 0.84
10 193.05 5.27 6.75 Student -0.42 1.73 3.56 4.42 5.27 6.12 6.98 8.81 10.95
203.27 3.69 1.79 School 2.19 2.76 3.24 3.47 3.69 3.92 4.15 4.63 5.20
20 199.12 4.77 6.75 Student -0.91 1.23 3.06 3.92 4.77 5.62 6.48 8.31 10.45
205.83 3.74 1.79 School 2.23 2.80 3.28 3.51 3.74 3.96 4.19 4.67 5.24
25 201.42 4.58 6.75 Student -1.10 1.04 2.87 3.73 4.58 5.43 6.29 8.12 10.26
206.80 3.75 1.79 School 2.25 2.82 3.30 3.53 3.75 3.98 4.20 4.69 5.25
30 203.49 4.41 6.75 Student -1.27 0.87 2.70 3.56 4.41 5.26 6.12 7.95 10.09
207.68 3.77 1.79 School 2.26 2.83 3.31 3.54 3.77 3.99 4.22 4.70 5.27
35 205.41 4.25 6.75 Student -1.43 0.71 2.54 3.40 4.25 5.10 5.96 7.79 9.94
208.49 3.78 1.79 School 2.28 2.84 3.33 3.55 3.78 4.00 4.23 4.72 5.28
40 207.23 4.10 6.75 Student -1.58 0.56 2.39 3.25 4.10 4.95 5.81 7.64 9.79
209.25 3.79 1.79 School 2.29 2.85 3.34 3.57 3.79 4.02 4.24 4.73 5.29
45 208.99 3.96 6.75 Student -1.73 0.42 2.25 3.11 3.96 4.81 5.67 7.50 9.64
210.00 3.80 1.79 School 2.30 2.87 3.35 3.58 3.80 4.03 4.26 4.74 5.31
48 210.04 3.87 6.75 Student -1.81 0.33 2.16 3.02 3.87 4.72 5.58 7.41 9.56
210.44 3.81 1.79 School 2.31 2.87 3.36 3.59 3.81 4.03 4.26 4.75 5.31
50 210.73 3.82 6.75 Student -1.87 0.27 2.10 2.97 3.82 4.66 5.53 7.36 9.50
210.73 3.82 1.79 School 2.31 2.88 3.36 3.59 3.82 4.04 4.27 4.75 5.32
52 211.42 3.76 6.75 Student -1.93 0.22 2.05 2.91 3.76 4.61 5.47 7.30 9.44
211.02 3.82 1.79 School 2.32 2.88 3.37 3.60 3.82 4.04 4.27 4.76 5.32
55 212.46 3.67 6.75 Student -2.01 0.13 1.96 2.82 3.67 4.52 5.38 7.21 9.36
211.46 3.83 1.79 School 2.32 2.89 3.37 3.60 3.83 4.05 4.28 4.76 5.33
60 214.22 3.53 6.75 Student -2.16 -0.01 1.82 2.68 3.53 4.38 5.24 7.07 9.21
212.20 3.84 1.79 School 2.34 2.90 3.39 3.61 3.84 4.06 4.29 4.78 5.34
65 216.04 3.38 6.75 Student -2.31 -0.16 1.67 2.53 3.38 4.23 5.09 6.92 9.06
212.97 3.85 1.79 School 2.35 2.92 3.40 3.63 3.85 4.08 4.30 4.79 5.35
70 217.96 3.22 6.75 Student -2.46 -0.32 1.51 2.37 3.22 4.07 4.93 6.76 8.90
213.78 3.86 1.79 School 2.36 2.93 3.41 3.64 3.86 4.09 4.32 4.80 5.37
75 220.03 3.05 6.75 Student -2.63 -0.49 1.34 2.20 3.05 3.90 4.76 6.59 8.73
214.65 3.88 1.79 School 2.38 2.94 3.43 3.65 3.88 4.10 4.33 4.82 5.38
80 222.34 2.86 6.75 Student -2.82 -0.68 1.15 2.01 2.86 3.71 4.57 6.40 8.54
215.62 3.89 1.79 School 2.39 2.96 3.44 3.67 3.89 4.12 4.35 4.83 5.40
85 225.02 2.64 6.75 Student -3.04 -0.90 0.93 1.79 2.64 3.49 4.35 6.18 8.32
216.76 3.91 1.79 School 2.41 2.98 3.46 3.69 3.91 4.14 4.37 4.85 5.42
90 228.40 2.36 6.75 Student -3.32 -1.18 0.65 1.51 2.36 3.21 4.07 5.90 8.05
218.18 3.94 1.79 School 2.43 3.00 3.48 3.71 3.94 4.16 4.39 4.87 5.44
CGI - Conditional Growth Index CGP - Conditional Growth Percentile
343

Table E.3.28: Language Usage Grade 6 From Fall To Spring Conditional Growth Percentile
Conditional Growth
Start Status Growth CGP 20 30 40 45 50 55 60 70 80
%ile RIT Mean SD CGI -0.84 -0.52 -0.25 -0.13 0.00 0.13 0.25 0.52 0.84
10 193.05 7.22 6.51 Student 1.75 3.81 5.58 6.41 7.22 8.04 8.87 10.64 12.70
203.27 4.76 1.81 School 3.24 3.81 4.30 4.54 4.76 4.99 5.22 5.71 6.29
20 199.12 6.30 6.51 Student 0.82 2.89 4.65 5.48 6.30 7.12 7.95 9.71 11.78
205.83 4.68 1.81 School 3.16 3.74 4.23 4.46 4.68 4.91 5.14 5.63 6.21
25 201.42 5.95 6.51 Student 0.47 2.54 4.30 5.13 5.95 6.77 7.60 9.36 11.43
206.80 4.65 1.81 School 3.13 3.71 4.20 4.43 4.65 4.88 5.11 5.60 6.18
30 203.49 5.63 6.51 Student 0.16 2.22 3.99 4.82 5.63 6.45 7.28 9.05 11.11
207.68 4.63 1.81 School 3.10 3.68 4.17 4.40 4.63 4.85 5.09 5.58 6.15
35 205.41 5.34 6.51 Student -0.13 1.93 3.69 4.52 5.34 6.16 6.99 8.75 10.82
208.49 4.60 1.81 School 3.08 3.65 4.14 4.38 4.60 4.83 5.06 5.55 6.13
40 207.23 5.07 6.51 Student -0.41 1.65 3.42 4.25 5.07 5.88 6.71 8.48 10.54
209.25 4.58 1.81 School 3.06 3.63 4.12 4.35 4.58 4.81 5.04 5.53 6.10
45 208.99 4.80 6.51 Student -0.68 1.39 3.15 3.98 4.80 5.61 6.45 8.21 10.27
210.00 4.56 1.81 School 3.03 3.61 4.10 4.33 4.56 4.78 5.01 5.51 6.08
48 210.04 4.64 6.51 Student -0.84 1.23 2.99 3.82 4.64 5.46 6.29 8.05 10.11
210.44 4.54 1.81 School 3.02 3.59 4.08 4.31 4.54 4.77 5.00 5.49 6.07
50 210.73 4.53 6.51 Student -0.94 1.12 2.88 3.72 4.53 5.35 6.18 7.95 10.01
210.73 4.53 1.81 School 3.01 3.58 4.07 4.31 4.53 4.76 4.99 5.48 6.06
52 211.42 4.43 6.51 Student -1.05 1.02 2.78 3.61 4.43 5.25 6.08 7.84 9.90
211.02 4.52 1.81 School 3.00 3.58 4.07 4.30 4.52 4.75 4.98 5.47 6.05
55 212.46 4.27 6.51 Student -1.21 0.86 2.62 3.45 4.27 5.09 5.92 7.68 9.75
211.46 4.51 1.81 School 2.99 3.56 4.05 4.28 4.51 4.74 4.97 5.46 6.03
60 214.22 4.00 6.51 Student -1.47 0.59 2.35 3.18 4.00 4.82 5.65 7.41 9.48
212.20 4.49 1.81 School 2.96 3.54 4.03 4.26 4.49 4.72 4.95 5.44 6.01
65 216.04 3.72 6.51 Student -1.75 0.31 2.08 2.91 3.72 4.54 5.37 7.14 9.20
212.97 4.46 1.81 School 2.94 3.51 4.01 4.24 4.46 4.69 4.92 5.41 5.99
70 217.96 3.43 6.51 Student -2.04 0.02 1.78 2.61 3.43 4.25 5.08 6.84 8.91
213.78 4.44 1.81 School 2.92 3.49 3.98 4.21 4.44 4.67 4.90 5.39 5.96
75 220.03 3.12 6.51 Student -2.36 -0.29 1.47 2.30 3.12 3.93 4.77 6.53 8.59
214.65 4.41 1.81 School 2.89 3.46 3.95 4.18 4.41 4.64 4.87 5.36 5.94
80 222.34 2.77 6.51 Student -2.71 -0.65 1.12 1.95 2.77 3.58 4.41 6.18 8.24
215.62 4.38 1.81 School 2.86 3.43 3.92 4.15 4.38 4.61 4.84 5.33 5.91
85 225.02 2.36 6.51 Student -3.12 -1.05 0.71 1.54 2.36 3.17 4.01 5.77 7.83
216.76 4.35 1.81 School 2.82 3.40 3.89 4.12 4.35 4.57 4.81 5.30 5.87
90 228.40 1.84 6.51 Student -3.63 -1.57 0.19 1.02 1.84 2.66 3.49 5.25 7.32
218.18 4.30 1.81 School 2.78 3.35 3.84 4.08 4.30 4.53 4.76 5.25 5.83
CGI - Conditional Growth Index CGP - Conditional Growth Percentile
344

Table E.3.29: Language Usage Grade 6 From Fall To Winter Conditional Growth Percentile
Conditional Growth
Start Status Growth CGP 20 30 40 45 50 55 60 70 80
%ile RIT Mean SD CGI -0.84 -0.52 -0.25 -0.13 0.00 0.13 0.25 0.52 0.84
10 193.05 5.11 5.02 Student 0.88 2.48 3.84 4.48 5.11 5.74 6.38 7.74 9.33
203.27 3.34 1.03 School 2.47 2.80 3.08 3.21 3.34 3.47 3.61 3.89 4.22
20 199.12 4.46 5.02 Student 0.23 1.83 3.19 3.83 4.46 5.09 5.73 7.09 8.68
205.83 3.30 1.03 School 2.43 2.76 3.04 3.17 3.30 3.43 3.56 3.84 4.17
25 201.42 4.21 5.02 Student -0.01 1.58 2.94 3.58 4.21 4.84 5.48 6.84 8.44
206.80 3.28 1.03 School 2.41 2.74 3.02 3.15 3.28 3.41 3.54 3.82 4.15
30 203.49 3.99 5.02 Student -0.24 1.36 2.72 3.36 3.99 4.62 5.26 6.62 8.21
207.68 3.27 1.03 School 2.40 2.72 3.00 3.14 3.27 3.40 3.53 3.81 4.14
35 205.41 3.78 5.02 Student -0.44 1.15 2.51 3.15 3.78 4.41 5.05 6.42 8.01
208.49 3.25 1.03 School 2.38 2.71 2.99 3.12 3.25 3.38 3.51 3.80 4.12
40 207.23 3.59 5.02 Student -0.64 0.96 2.32 2.96 3.59 4.22 4.86 6.22 7.81
209.25 3.24 1.03 School 2.37 2.70 2.98 3.11 3.24 3.37 3.50 3.78 4.11
45 208.99 3.40 5.02 Student -0.83 0.77 2.13 2.77 3.40 4.03 4.67 6.03 7.62
210.00 3.23 1.03 School 2.35 2.68 2.96 3.10 3.23 3.36 3.49 3.77 4.10
48 210.04 3.29 5.02 Student -0.94 0.65 2.02 2.66 3.29 3.92 4.56 5.92 7.51
210.44 3.22 1.03 School 2.35 2.68 2.96 3.09 3.22 3.35 3.48 3.76 4.09
50 210.73 3.21 5.02 Student -1.01 0.58 1.94 2.58 3.21 3.84 4.48 5.85 7.44
210.73 3.21 1.03 School 2.34 2.67 2.95 3.08 3.21 3.34 3.48 3.76 4.08
52 211.42 3.14 5.02 Student -1.09 0.51 1.87 2.51 3.14 3.77 4.41 5.77 7.36
211.02 3.21 1.03 School 2.34 2.67 2.95 3.08 3.21 3.34 3.47 3.75 4.08
55 212.46 3.03 5.02 Student -1.20 0.39 1.76 2.40 3.03 3.66 4.30 5.66 7.25
211.46 3.20 1.03 School 2.33 2.66 2.94 3.07 3.20 3.33 3.46 3.74 4.07
60 214.22 2.84 5.02 Student -1.39 0.21 1.57 2.21 2.84 3.47 4.11 5.47 7.06
212.20 3.19 1.03 School 2.32 2.64 2.92 3.06 3.19 3.32 3.45 3.73 4.06
65 216.04 2.64 5.02 Student -1.58 0.01 1.37 2.01 2.64 3.27 3.91 5.28 6.87
212.97 3.17 1.03 School 2.30 2.63 2.91 3.04 3.17 3.30 3.44 3.72 4.04
70 217.96 2.44 5.02 Student -1.79 -0.20 1.17 1.81 2.44 3.07 3.71 5.07 6.66
213.78 3.16 1.03 School 2.29 2.62 2.90 3.03 3.16 3.29 3.42 3.70 4.03
75 220.03 2.21 5.02 Student -2.01 -0.42 0.94 1.58 2.21 2.85 3.49 4.85 6.44
214.65 3.14 1.03 School 2.27 2.60 2.88 3.01 3.14 3.27 3.41 3.69 4.01
80 222.34 1.97 5.02 Student -2.26 -0.66 0.70 1.34 1.97 2.60 3.24 4.60 6.19
215.62 3.13 1.03 School 2.26 2.58 2.86 3.00 3.13 3.26 3.39 3.67 4.00
85 225.02 1.68 5.02 Student -2.55 -0.95 0.41 1.05 1.68 2.31 2.95 4.31 5.90
216.76 3.11 1.03 School 2.24 2.56 2.84 2.98 3.11 3.24 3.37 3.65 3.98
90 228.40 1.32 5.02 Student -2.91 -1.32 0.05 0.69 1.32 1.95 2.59 3.95 5.54
218.18 3.08 1.03 School 2.21 2.54 2.82 2.95 3.08 3.21 3.34 3.62 3.95
CGI - Conditional Growth Index CGP - Conditional Growth Percentile
345

Table E.3.30: Language Usage Grade 6 From Winter To Spring Conditional Growth Percentile
Conditional Growth
Start Status Growth CGP 20 30 40 45 50 55 60 70 80
%ile RIT Mean SD CGI -0.84 -0.52 -0.25 -0.13 0.00 0.13 0.25 0.52 0.84
10 196.90 2.33 4.76 Student -1.67 -0.16 1.13 1.74 2.33 2.93 3.54 4.83 6.34
206.50 1.24 0.78 School 0.59 0.83 1.04 1.14 1.24 1.34 1.44 1.65 1.90
20 202.75 1.99 4.76 Student -2.02 -0.51 0.78 1.39 1.99 2.58 3.19 4.48 5.99
209.05 1.27 0.78 School 0.61 0.86 1.07 1.17 1.27 1.37 1.47 1.68 1.92
25 204.97 1.85 4.76 Student -2.15 -0.64 0.65 1.26 1.85 2.45 3.06 4.35 5.86
210.02 1.28 0.78 School 0.62 0.87 1.08 1.18 1.28 1.38 1.48 1.69 1.93
30 206.97 1.74 4.76 Student -2.27 -0.76 0.53 1.14 1.74 2.33 2.94 4.23 5.74
210.90 1.29 0.78 School 0.63 0.88 1.09 1.19 1.29 1.39 1.48 1.70 1.94
35 208.82 1.63 4.76 Student -2.38 -0.87 0.42 1.03 1.63 2.22 2.83 4.12 5.63
211.70 1.30 0.78 School 0.64 0.89 1.10 1.20 1.30 1.39 1.49 1.70 1.95
40 210.57 1.52 4.76 Student -2.49 -0.98 0.31 0.92 1.52 2.12 2.73 4.02 5.53
212.47 1.30 0.78 School 0.65 0.90 1.11 1.21 1.30 1.40 1.50 1.71 1.96
45 212.27 1.42 4.76 Student -2.59 -1.08 0.21 0.82 1.42 2.02 2.63 3.92 5.43
213.21 1.31 0.78 School 0.66 0.90 1.12 1.21 1.31 1.41 1.51 1.72 1.97
48 213.27 1.36 4.76 Student -2.65 -1.14 0.15 0.76 1.36 1.96 2.57 3.86 5.37
213.65 1.32 0.78 School 0.66 0.91 1.12 1.22 1.32 1.42 1.51 1.73 1.97
50 213.94 1.32 4.76 Student -2.69 -1.18 0.11 0.72 1.32 1.92 2.53 3.82 5.33
213.94 1.32 0.78 School 0.67 0.91 1.12 1.22 1.32 1.42 1.52 1.73 1.98
52 214.61 1.28 4.76 Student -2.73 -1.22 0.07 0.68 1.28 1.88 2.49 3.78 5.29
214.23 1.32 0.78 School 0.67 0.92 1.13 1.23 1.32 1.42 1.52 1.73 1.98
55 215.61 1.22 4.76 Student -2.78 -1.28 0.02 0.62 1.22 1.82 2.43 3.72 5.23
214.67 1.33 0.78 School 0.67 0.92 1.13 1.23 1.33 1.43 1.53 1.74 1.98
60 217.31 1.12 4.76 Student -2.89 -1.38 -0.09 0.52 1.12 1.72 2.33 3.62 5.13
215.41 1.34 0.78 School 0.68 0.93 1.14 1.24 1.34 1.43 1.53 1.74 1.99
65 219.06 1.02 4.76 Student -2.99 -1.48 -0.19 0.42 1.02 1.61 2.22 3.51 5.02
216.18 1.34 0.78 School 0.69 0.94 1.15 1.25 1.34 1.44 1.54 1.75 2.00
70 220.91 0.91 4.76 Student -3.10 -1.59 -0.30 0.31 0.91 1.50 2.11 3.40 4.91
216.99 1.35 0.78 School 0.70 0.94 1.16 1.26 1.35 1.45 1.55 1.76 2.01
75 222.91 0.79 4.76 Student -3.22 -1.71 -0.42 0.19 0.79 1.38 1.99 3.28 4.79
217.86 1.36 0.78 School 0.71 0.95 1.17 1.26 1.36 1.46 1.56 1.77 2.02
80 225.13 0.65 4.76 Student -3.35 -1.84 -0.55 0.06 0.65 1.25 1.86 3.15 4.66
218.83 1.37 0.78 School 0.72 0.96 1.18 1.28 1.37 1.47 1.57 1.78 2.03
85 227.72 0.50 4.76 Student -3.51 -2.00 -0.71 -0.10 0.50 1.10 1.71 3.00 4.51
219.96 1.38 0.78 School 0.73 0.98 1.19 1.29 1.38 1.48 1.58 1.79 2.04
90 230.98 0.31 4.76 Student -3.70 -2.19 -0.90 -0.29 0.31 0.90 1.51 2.80 4.31
221.38 1.40 0.78 School 0.75 0.99 1.20 1.30 1.40 1.50 1.60 1.81 2.06
CGI - Conditional Growth Index CGP - Conditional Growth Percentile
346

Table E.3.31: Language Usage Grade 7 From Last Winter To Winter Conditional Growth Percentile
Conditional Growth
Start Status Growth CGP 20 30 40 45 50 55 60 70 80
%ile RIT Mean SD CGI -0.84 -0.52 -0.25 -0.13 0.00 0.13 0.25 0.52 0.84
10 195.13 5.49 5.40 Student 0.95 2.66 4.12 4.81 5.49 6.17 6.86 8.32 10.04
205.44 3.76 1.43 School 2.55 3.01 3.39 3.58 3.76 3.94 4.12 4.51 4.96
20 201.35 4.73 5.40 Student 0.19 1.90 3.36 4.05 4.73 5.41 6.10 7.56 9.28
208.11 3.59 1.43 School 2.39 2.84 3.23 3.41 3.59 3.77 3.96 4.34 4.80
25 203.71 4.44 5.40 Student -0.10 1.61 3.07 3.76 4.44 5.12 5.81 7.27 8.99
209.13 3.53 1.43 School 2.32 2.78 3.17 3.35 3.53 3.71 3.89 4.28 4.74
30 205.83 4.18 5.40 Student -0.36 1.35 2.81 3.50 4.18 4.86 5.55 7.01 8.73
210.04 3.47 1.43 School 2.27 2.72 3.11 3.29 3.47 3.65 3.84 4.23 4.68
35 207.79 3.94 5.40 Student -0.60 1.11 2.57 3.26 3.94 4.62 5.31 6.77 8.49
210.89 3.42 1.43 School 2.21 2.67 3.06 3.24 3.42 3.60 3.78 4.17 4.63
40 209.65 3.71 5.40 Student -0.83 0.88 2.35 3.04 3.71 4.39 5.08 6.55 8.26
211.69 3.37 1.43 School 2.17 2.62 3.01 3.19 3.37 3.55 3.74 4.12 4.58
45 211.46 3.49 5.40 Student -1.05 0.66 2.13 2.82 3.49 4.17 4.86 6.33 8.04
212.47 3.32 1.43 School 2.12 2.57 2.96 3.14 3.32 3.50 3.69 4.08 4.53
48 212.52 3.36 5.40 Student -1.18 0.53 2.00 2.68 3.36 4.04 4.73 6.19 7.91
212.93 3.30 1.43 School 2.09 2.54 2.93 3.12 3.30 3.48 3.66 4.05 4.50
50 213.23 3.28 5.40 Student -1.27 0.45 1.91 2.60 3.28 3.96 4.64 6.11 7.82
213.23 3.28 1.43 School 2.07 2.52 2.91 3.10 3.28 3.46 3.64 4.03 4.48
52 213.94 3.19 5.40 Student -1.35 0.36 1.82 2.51 3.19 3.87 4.56 6.02 7.73
213.54 3.26 1.43 School 2.05 2.51 2.89 3.08 3.26 3.44 3.62 4.01 4.46
55 215.01 3.06 5.40 Student -1.48 0.23 1.69 2.38 3.06 3.74 4.43 5.89 7.60
214.00 3.23 1.43 School 2.02 2.48 2.87 3.05 3.23 3.41 3.59 3.98 4.44
60 216.81 2.84 5.40 Student -1.71 0.01 1.47 2.16 2.84 3.52 4.21 5.67 7.38
214.77 3.18 1.43 School 1.97 2.43 2.82 3.00 3.18 3.36 3.54 3.93 4.39
65 218.67 2.61 5.40 Student -1.93 -0.22 1.24 1.93 2.61 3.29 3.98 5.44 7.16
215.58 3.13 1.43 School 1.93 2.38 2.77 2.95 3.13 3.31 3.50 3.88 4.34
70 220.64 2.37 5.40 Student -2.17 -0.46 1.00 1.69 2.37 3.05 3.74 5.20 6.92
216.42 3.08 1.43 School 1.87 2.33 2.72 2.90 3.08 3.26 3.44 3.83 4.29
75 222.76 2.11 5.40 Student -2.43 -0.72 0.74 1.43 2.11 2.79 3.48 4.94 6.66
217.33 3.02 1.43 School 1.82 2.27 2.66 2.84 3.02 3.20 3.39 3.78 4.23
80 225.12 1.82 5.40 Student -2.72 -1.01 0.45 1.14 1.82 2.50 3.19 4.65 6.37
218.35 2.96 1.43 School 1.75 2.21 2.60 2.78 2.96 3.14 3.32 3.71 4.17
85 227.87 1.49 5.40 Student -3.06 -1.35 0.12 0.81 1.49 2.16 2.85 4.32 6.03
219.54 2.89 1.43 School 1.68 2.14 2.52 2.71 2.89 3.07 3.25 3.64 4.09
90 231.33 1.06 5.40 Student -3.48 -1.77 -0.31 0.38 1.06 1.74 2.43 3.89 5.61
221.03 2.80 1.43 School 1.59 2.04 2.43 2.62 2.80 2.98 3.16 3.55 4.00
CGI - Conditional Growth Index CGP - Conditional Growth Percentile
347
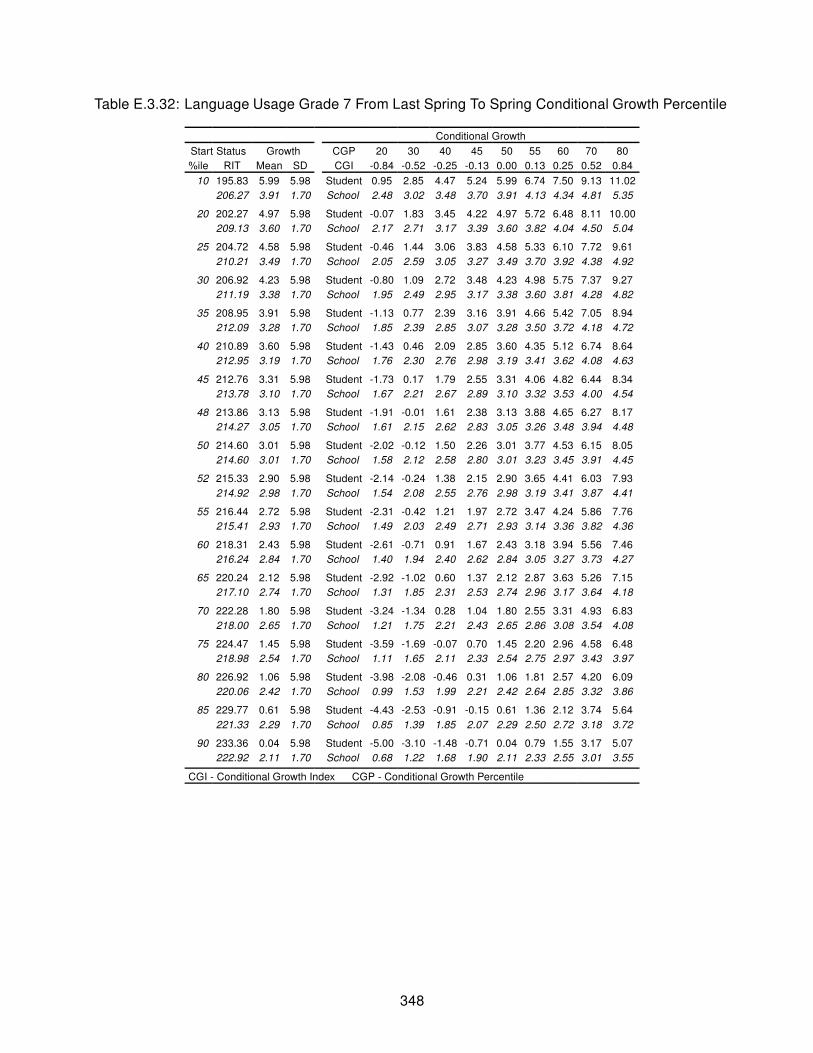
Table E.3.32: Language Usage Grade 7 From Last Spring To Spring Conditional Growth Percentile
Conditional Growth
Start Status Growth CGP 20 30 40 45 50 55 60 70 80
%ile RIT Mean SD CGI -0.84 -0.52 -0.25 -0.13 0.00 0.13 0.25 0.52 0.84
10 195.83 5.99 5.98 Student 0.95 2.85 4.47 5.24 5.99 6.74 7.50 9.13 11.02
206.27 3.91 1.70 School 2.48 3.02 3.48 3.70 3.91 4.13 4.34 4.81 5.35
20 202.27 4.97 5.98 Student -0.07 1.83 3.45 4.22 4.97 5.72 6.48 8.11 10.00
209.13 3.60 1.70 School 2.17 2.71 3.17 3.39 3.60 3.82 4.04 4.50 5.04
25 204.72 4.58 5.98 Student -0.46 1.44 3.06 3.83 4.58 5.33 6.10 7.72 9.61
210.21 3.49 1.70 School 2.05 2.59 3.05 3.27 3.49 3.70 3.92 4.38 4.92
30 206.92 4.23 5.98 Student -0.80 1.09 2.72 3.48 4.23 4.98 5.75 7.37 9.27
211.19 3.38 1.70 School 1.95 2.49 2.95 3.17 3.38 3.60 3.81 4.28 4.82
35 208.95 3.91 5.98 Student -1.13 0.77 2.39 3.16 3.91 4.66 5.42 7.05 8.94
212.09 3.28 1.70 School 1.85 2.39 2.85 3.07 3.28 3.50 3.72 4.18 4.72
40 210.89 3.60 5.98 Student -1.43 0.46 2.09 2.85 3.60 4.35 5.12 6.74 8.64
212.95 3.19 1.70 School 1.76 2.30 2.76 2.98 3.19 3.41 3.62 4.08 4.63
45 212.76 3.31 5.98 Student -1.73 0.17 1.79 2.55 3.31 4.06 4.82 6.44 8.34
213.78 3.10 1.70 School 1.67 2.21 2.67 2.89 3.10 3.32 3.53 4.00 4.54
48 213.86 3.13 5.98 Student -1.91 -0.01 1.61 2.38 3.13 3.88 4.65 6.27 8.17
214.27 3.05 1.70 School 1.61 2.15 2.62 2.83 3.05 3.26 3.48 3.94 4.48
50 214.60 3.01 5.98 Student -2.02 -0.12 1.50 2.26 3.01 3.77 4.53 6.15 8.05
214.60 3.01 1.70 School 1.58 2.12 2.58 2.80 3.01 3.23 3.45 3.91 4.45
52 215.33 2.90 5.98 Student -2.14 -0.24 1.38 2.15 2.90 3.65 4.41 6.03 7.93
214.92 2.98 1.70 School 1.54 2.08 2.55 2.76 2.98 3.19 3.41 3.87 4.41
55 216.44 2.72 5.98 Student -2.31 -0.42 1.21 1.97 2.72 3.47 4.24 5.86 7.76
215.41 2.93 1.70 School 1.49 2.03 2.49 2.71 2.93 3.14 3.36 3.82 4.36
60 218.31 2.43 5.98 Student -2.61 -0.71 0.91 1.67 2.43 3.18 3.94 5.56 7.46
216.24 2.84 1.70 School 1.40 1.94 2.40 2.62 2.84 3.05 3.27 3.73 4.27
65 220.24 2.12 5.98 Student -2.92 -1.02 0.60 1.37 2.12 2.87 3.63 5.26 7.15
217.10 2.74 1.70 School 1.31 1.85 2.31 2.53 2.74 2.96 3.17 3.64 4.18
70 222.28 1.80 5.98 Student -3.24 -1.34 0.28 1.04 1.80 2.55 3.31 4.93 6.83
218.00 2.65 1.70 School 1.21 1.75 2.21 2.43 2.65 2.86 3.08 3.54 4.08
75 224.47 1.45 5.98 Student -3.59 -1.69 -0.07 0.70 1.45 2.20 2.96 4.58 6.48
218.98 2.54 1.70 School 1.11 1.65 2.11 2.33 2.54 2.75 2.97 3.43 3.97
80 226.92 1.06 5.98 Student -3.98 -2.08 -0.46 0.31 1.06 1.81 2.57 4.20 6.09
220.06 2.42 1.70 School 0.99 1.53 1.99 2.21 2.42 2.64 2.85 3.32 3.86
85 229.77 0.61 5.98 Student -4.43 -2.53 -0.91 -0.15 0.61 1.36 2.12 3.74 5.64
221.33 2.29 1.70 School 0.85 1.39 1.85 2.07 2.29 2.50 2.72 3.18 3.72
90 233.36 0.04 5.98 Student -5.00 -3.10 -1.48 -0.71 0.04 0.79 1.55 3.17 5.07
222.92 2.11 1.70 School 0.68 1.22 1.68 1.90 2.11 2.33 2.55 3.01 3.55
CGI - Conditional Growth Index CGP - Conditional Growth Percentile
348

Table E.3.33: Language Usage Grade 7 From Fall To N Fall Conditional Growth Percentile
Conditional Growth
Start Status Growth CGP 20 30 40 45 50 55 60 70 80
%ile RIT Mean SD CGI -0.84 -0.52 -0.25 -0.13 0.00 0.13 0.25 0.52 0.84
10 196.31 4.33 6.32 Student -0.98 1.02 2.73 3.54 4.33 5.13 5.93 7.65 9.65
206.53 3.09 1.76 School 1.61 2.17 2.65 2.87 3.09 3.31 3.54 4.01 4.57
20 202.39 3.94 6.32 Student -1.38 0.63 2.34 3.15 3.94 4.73 5.54 7.25 9.26
209.10 3.12 1.76 School 1.65 2.20 2.68 2.90 3.12 3.34 3.57 4.05 4.60
25 204.70 3.79 6.32 Student -1.53 0.48 2.19 3.00 3.79 4.58 5.39 7.10 9.11
210.08 3.14 1.76 School 1.66 2.21 2.69 2.92 3.14 3.36 3.58 4.06 4.61
30 206.77 3.66 6.32 Student -1.66 0.34 2.06 2.86 3.66 4.45 5.26 6.97 8.97
210.95 3.15 1.76 School 1.67 2.23 2.70 2.93 3.15 3.37 3.59 4.07 4.63
35 208.69 3.53 6.32 Student -1.78 0.22 1.93 2.74 3.53 4.32 5.13 6.84 8.85
211.77 3.16 1.76 School 1.68 2.24 2.71 2.94 3.16 3.38 3.60 4.08 4.64
40 210.52 3.41 6.32 Student -1.90 0.10 1.81 2.62 3.41 4.21 5.01 6.72 8.73
212.54 3.17 1.76 School 1.69 2.25 2.72 2.95 3.17 3.39 3.61 4.09 4.65
45 212.28 3.30 6.32 Student -2.02 -0.01 1.70 2.50 3.30 4.09 4.90 6.61 8.61
213.28 3.18 1.76 School 1.70 2.25 2.73 2.96 3.18 3.40 3.62 4.10 4.65
48 213.32 3.23 6.32 Student -2.09 -0.08 1.63 2.44 3.23 4.02 4.83 6.54 8.55
213.72 3.18 1.76 School 1.70 2.26 2.74 2.96 3.18 3.40 3.63 4.10 4.66
50 214.02 3.18 6.32 Student -2.13 -0.13 1.58 2.39 3.18 3.98 4.79 6.50 8.50
214.02 3.18 1.76 School 1.71 2.26 2.74 2.96 3.18 3.41 3.63 4.11 4.66
52 214.71 3.14 6.32 Student -2.18 -0.17 1.54 2.35 3.14 3.93 4.74 6.45 8.46
214.31 3.19 1.76 School 1.71 2.27 2.74 2.97 3.19 3.41 3.63 4.11 4.67
55 215.75 3.07 6.32 Student -2.24 -0.24 1.47 2.28 3.07 3.87 4.67 6.38 8.39
214.75 3.19 1.76 School 1.72 2.27 2.75 2.97 3.19 3.41 3.64 4.12 4.67
60 217.52 2.96 6.32 Student -2.36 -0.35 1.36 2.16 2.96 3.75 4.56 6.27 8.27
215.50 3.20 1.76 School 1.72 2.28 2.76 2.98 3.20 3.42 3.65 4.12 4.68
65 219.34 2.84 6.32 Student -2.48 -0.47 1.24 2.05 2.84 3.63 4.44 6.15 8.15
216.27 3.21 1.76 School 1.73 2.29 2.77 2.99 3.21 3.43 3.66 4.13 4.69
70 221.27 2.71 6.32 Student -2.60 -0.60 1.11 1.92 2.71 3.51 4.31 6.03 8.03
217.08 3.22 1.76 School 1.74 2.30 2.78 3.00 3.22 3.44 3.67 4.14 4.70
75 223.34 2.58 6.32 Student -2.74 -0.73 0.98 1.79 2.58 3.37 4.18 5.89 7.90
217.96 3.23 1.76 School 1.76 2.31 2.79 3.01 3.23 3.45 3.68 4.16 4.71
80 225.65 2.43 6.32 Student -2.89 -0.88 0.83 1.64 2.43 3.22 4.03 5.74 7.75
218.94 3.25 1.76 School 1.77 2.32 2.80 3.03 3.25 3.47 3.69 4.17 4.72
85 228.34 2.26 6.32 Student -3.06 -1.06 0.66 1.46 2.26 3.05 3.86 5.57 7.57
220.08 3.26 1.76 School 1.78 2.34 2.81 3.04 3.26 3.48 3.71 4.18 4.74
90 231.73 2.04 6.32 Student -3.28 -1.28 0.44 1.24 2.04 2.83 3.64 5.35 7.35
221.51 3.28 1.76 School 1.80 2.36 2.83 3.06 3.28 3.50 3.72 4.20 4.76
CGI - Conditional Growth Index CGP - Conditional Growth Percentile
349

Table E.3.34: Language Usage Grade 7 From Fall To Spring Conditional Growth Percentile
Conditional Growth
Start Status Growth CGP 20 30 40 45 50 55 60 70 80
%ile RIT Mean SD CGI -0.84 -0.52 -0.25 -0.13 0.00 0.13 0.25 0.52 0.84
10 196.31 5.78 6.39 Student 0.40 2.43 4.16 4.97 5.78 6.58 7.39 9.13 11.15
206.53 3.72 1.88 School 2.14 2.74 3.25 3.49 3.72 3.96 4.20 4.71 5.30
20 202.39 5.03 6.39 Student -0.35 1.68 3.41 4.22 5.03 5.83 6.64 8.38 10.40
209.10 3.68 1.88 School 2.10 2.69 3.20 3.44 3.68 3.91 4.15 4.66 5.26
25 204.70 4.74 6.39 Student -0.64 1.39 3.12 3.94 4.74 5.54 6.36 8.09 10.12
210.08 3.66 1.88 School 2.08 2.68 3.19 3.43 3.66 3.90 4.14 4.64 5.24
30 206.77 4.49 6.39 Student -0.89 1.13 2.87 3.68 4.49 5.29 6.10 7.84 9.86
210.95 3.65 1.88 School 2.07 2.66 3.17 3.41 3.65 3.88 4.12 4.63 5.22
35 208.69 4.25 6.39 Student -1.13 0.90 2.63 3.45 4.25 5.05 5.87 7.60 9.63
211.77 3.63 1.88 School 2.05 2.65 3.16 3.40 3.63 3.87 4.11 4.62 5.21
40 210.52 4.02 6.39 Student -1.35 0.67 2.40 3.22 4.02 4.83 5.64 7.37 9.40
212.54 3.62 1.88 School 2.04 2.63 3.14 3.38 3.62 3.85 4.09 4.60 5.20
45 212.28 3.81 6.39 Student -1.57 0.46 2.19 3.00 3.81 4.61 5.42 7.16 9.18
213.28 3.60 1.88 School 2.03 2.62 3.13 3.37 3.60 3.84 4.08 4.59 5.18
48 213.32 3.68 6.39 Student -1.70 0.33 2.06 2.87 3.68 4.48 5.30 7.03 9.05
213.72 3.60 1.88 School 2.02 2.61 3.12 3.36 3.60 3.83 4.07 4.58 5.18
50 214.02 3.59 6.39 Student -1.79 0.24 1.97 2.79 3.59 4.39 5.21 6.94 8.97
214.02 3.59 1.88 School 2.01 2.61 3.12 3.36 3.59 3.83 4.07 4.58 5.17
52 214.71 3.51 6.39 Student -1.87 0.16 1.89 2.70 3.51 4.31 5.12 6.86 8.88
214.31 3.59 1.88 School 2.01 2.60 3.11 3.35 3.59 3.82 4.06 4.57 5.17
55 215.75 3.38 6.39 Student -2.00 0.03 1.76 2.57 3.38 4.18 5.00 6.73 8.75
214.75 3.58 1.88 School 2.00 2.59 3.10 3.34 3.58 3.81 4.05 4.56 5.16
60 217.52 3.16 6.39 Student -2.22 -0.19 1.54 2.36 3.16 3.96 4.78 6.51 8.54
215.50 3.57 1.88 School 1.99 2.58 3.09 3.33 3.57 3.80 4.04 4.55 5.14
65 219.34 2.94 6.39 Student -2.44 -0.42 1.32 2.13 2.94 3.74 4.55 6.29 8.31
216.27 3.55 1.88 School 1.97 2.57 3.08 3.32 3.55 3.79 4.03 4.54 5.13
70 221.27 2.70 6.39 Student -2.68 -0.65 1.08 1.90 2.70 3.50 4.32 6.05 8.08
217.08 3.54 1.88 School 1.96 2.55 3.06 3.30 3.54 3.77 4.01 4.52 5.12
75 223.34 2.44 6.39 Student -2.93 -0.91 0.82 1.64 2.44 3.25 4.06 5.79 7.82
217.96 3.52 1.88 School 1.94 2.54 3.05 3.29 3.52 3.76 4.00 4.51 5.10
80 225.65 2.16 6.39 Student -3.22 -1.19 0.54 1.35 2.16 2.96 3.78 5.51 7.53
218.94 3.51 1.88 School 1.93 2.52 3.03 3.27 3.51 3.74 3.98 4.49 5.08
85 228.34 1.83 6.39 Student -3.55 -1.52 0.21 1.02 1.83 2.63 3.44 5.18 7.20
220.08 3.49 1.88 School 1.91 2.50 3.01 3.25 3.49 3.72 3.96 4.47 5.06
90 231.73 1.41 6.39 Student -3.97 -1.94 -0.21 0.60 1.41 2.21 3.03 4.76 6.78
221.51 3.46 1.88 School 1.88 2.48 2.98 3.22 3.46 3.70 3.94 4.44 5.04
CGI - Conditional Growth Index CGP - Conditional Growth Percentile
350
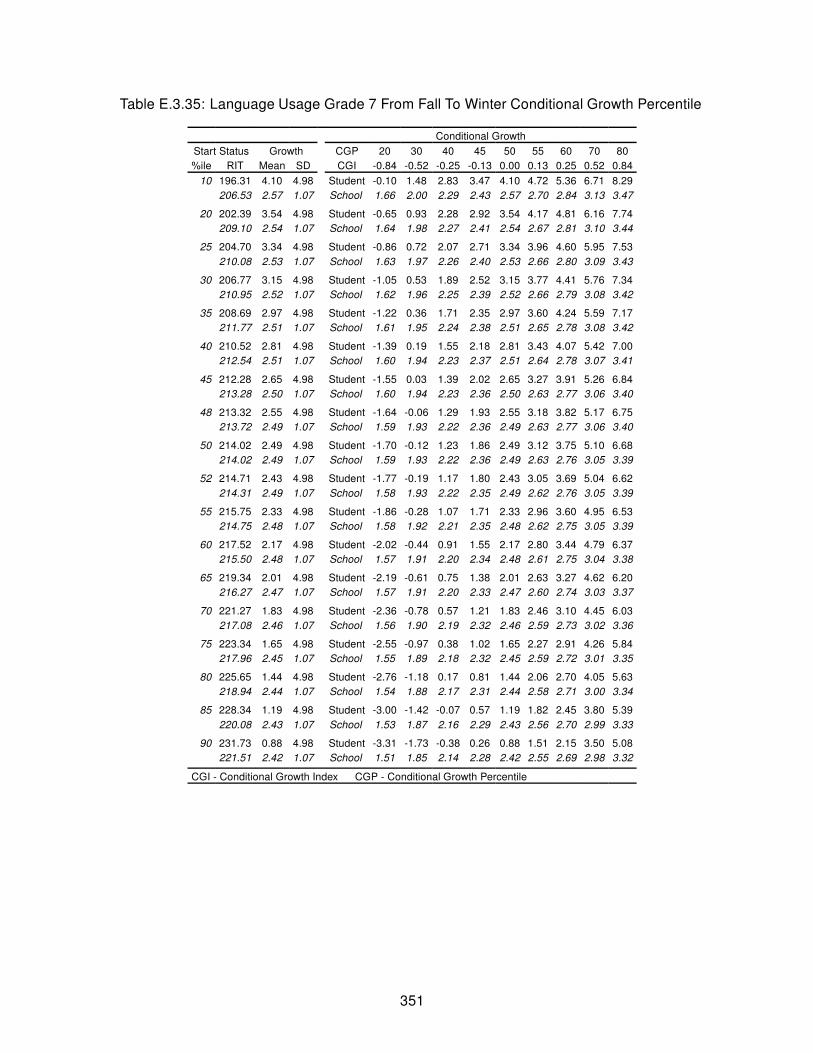
Table E.3.35: Language Usage Grade 7 From Fall To Winter Conditional Growth Percentile
Conditional Growth
Start Status Growth CGP 20 30 40 45 50 55 60 70 80
%ile RIT Mean SD CGI -0.84 -0.52 -0.25 -0.13 0.00 0.13 0.25 0.52 0.84
10 196.31 4.10 4.98 Student -0.10 1.48 2.83 3.47 4.10 4.72 5.36 6.71 8.29
206.53 2.57 1.07 School 1.66 2.00 2.29 2.43 2.57 2.70 2.84 3.13 3.47
20 202.39 3.54 4.98 Student -0.65 0.93 2.28 2.92 3.54 4.17 4.81 6.16 7.74
209.10 2.54 1.07 School 1.64 1.98 2.27 2.41 2.54 2.67 2.81 3.10 3.44
25 204.70 3.34 4.98 Student -0.86 0.72 2.07 2.71 3.34 3.96 4.60 5.95 7.53
210.08 2.53 1.07 School 1.63 1.97 2.26 2.40 2.53 2.66 2.80 3.09 3.43
30 206.77 3.15 4.98 Student -1.05 0.53 1.89 2.52 3.15 3.77 4.41 5.76 7.34
210.95 2.52 1.07 School 1.62 1.96 2.25 2.39 2.52 2.66 2.79 3.08 3.42
35 208.69 2.97 4.98 Student -1.22 0.36 1.71 2.35 2.97 3.60 4.24 5.59 7.17
211.77 2.51 1.07 School 1.61 1.95 2.24 2.38 2.51 2.65 2.78 3.08 3.42
40 210.52 2.81 4.98 Student -1.39 0.19 1.55 2.18 2.81 3.43 4.07 5.42 7.00
212.54 2.51 1.07 School 1.60 1.94 2.23 2.37 2.51 2.64 2.78 3.07 3.41
45 212.28 2.65 4.98 Student -1.55 0.03 1.39 2.02 2.65 3.27 3.91 5.26 6.84
213.28 2.50 1.07 School 1.60 1.94 2.23 2.36 2.50 2.63 2.77 3.06 3.40
48 213.32 2.55 4.98 Student -1.64 -0.06 1.29 1.93 2.55 3.18 3.82 5.17 6.75
213.72 2.49 1.07 School 1.59 1.93 2.22 2.36 2.49 2.63 2.77 3.06 3.40
50 214.02 2.49 4.98 Student -1.70 -0.12 1.23 1.86 2.49 3.12 3.75 5.10 6.68
214.02 2.49 1.07 School 1.59 1.93 2.22 2.36 2.49 2.63 2.76 3.05 3.39
52 214.71 2.43 4.98 Student -1.77 -0.19 1.17 1.80 2.43 3.05 3.69 5.04 6.62
214.31 2.49 1.07 School 1.58 1.93 2.22 2.35 2.49 2.62 2.76 3.05 3.39
55 215.75 2.33 4.98 Student -1.86 -0.28 1.07 1.71 2.33 2.96 3.60 4.95 6.53
214.75 2.48 1.07 School 1.58 1.92 2.21 2.35 2.48 2.62 2.75 3.05 3.39
60 217.52 2.17 4.98 Student -2.02 -0.44 0.91 1.55 2.17 2.80 3.44 4.79 6.37
215.50 2.48 1.07 School 1.57 1.91 2.20 2.34 2.48 2.61 2.75 3.04 3.38
65 219.34 2.01 4.98 Student -2.19 -0.61 0.75 1.38 2.01 2.63 3.27 4.62 6.20
216.27 2.47 1.07 School 1.57 1.91 2.20 2.33 2.47 2.60 2.74 3.03 3.37
70 221.27 1.83 4.98 Student -2.36 -0.78 0.57 1.21 1.83 2.46 3.10 4.45 6.03
217.08 2.46 1.07 School 1.56 1.90 2.19 2.32 2.46 2.59 2.73 3.02 3.36
75 223.34 1.65 4.98 Student -2.55 -0.97 0.38 1.02 1.65 2.27 2.91 4.26 5.84
217.96 2.45 1.07 School 1.55 1.89 2.18 2.32 2.45 2.59 2.72 3.01 3.35
80 225.65 1.44 4.98 Student -2.76 -1.18 0.17 0.81 1.44 2.06 2.70 4.05 5.63
218.94 2.44 1.07 School 1.54 1.88 2.17 2.31 2.44 2.58 2.71 3.00 3.34
85 228.34 1.19 4.98 Student -3.00 -1.42 -0.07 0.57 1.19 1.82 2.45 3.80 5.39
220.08 2.43 1.07 School 1.53 1.87 2.16 2.29 2.43 2.56 2.70 2.99 3.33
90 231.73 0.88 4.98 Student -3.31 -1.73 -0.38 0.26 0.88 1.51 2.15 3.50 5.08
221.51 2.42 1.07 School 1.51 1.85 2.14 2.28 2.42 2.55 2.69 2.98 3.32
CGI - Conditional Growth Index CGP - Conditional Growth Percentile
351

Table E.3.36: Language Usage Grade 7 From Winter To Spring Conditional Growth Percentile
Conditional Growth
Start Status Growth CGP 20 30 40 45 50 55 60 70 80
%ile RIT Mean SD CGI -0.84 -0.52 -0.25 -0.13 0.00 0.13 0.25 0.52 0.84
10 199.18 1.95 4.72 Student -2.02 -0.53 0.75 1.36 1.95 2.54 3.14 4.42 5.92
208.97 0.97 0.80 School 0.30 0.55 0.77 0.87 0.97 1.07 1.17 1.39 1.64
20 205.13 1.66 4.72 Student -2.32 -0.82 0.46 1.06 1.66 2.25 2.85 4.13 5.63
211.56 1.01 0.80 School 0.34 0.60 0.81 0.91 1.01 1.11 1.22 1.43 1.69
25 207.39 1.55 4.72 Student -2.43 -0.93 0.35 0.95 1.55 2.14 2.74 4.02 5.52
212.54 1.03 0.80 School 0.36 0.61 0.83 0.93 1.03 1.13 1.23 1.45 1.70
30 209.42 1.45 4.72 Student -2.53 -1.03 0.25 0.85 1.45 2.04 2.64 3.92 5.42
213.42 1.05 0.80 School 0.37 0.63 0.84 0.95 1.05 1.15 1.25 1.47 1.72
35 211.30 1.36 4.72 Student -2.62 -1.12 0.16 0.76 1.36 1.95 2.55 3.83 5.33
214.24 1.06 0.80 School 0.39 0.64 0.86 0.96 1.06 1.16 1.26 1.48 1.73
40 213.08 1.27 4.72 Student -2.70 -1.21 0.07 0.68 1.27 1.86 2.46 3.74 5.24
215.02 1.08 0.80 School 0.40 0.66 0.87 0.97 1.08 1.18 1.28 1.49 1.75
45 214.81 1.18 4.72 Student -2.79 -1.29 -0.01 0.59 1.18 1.78 2.38 3.66 5.16
215.77 1.09 0.80 School 0.42 0.67 0.89 0.99 1.09 1.19 1.29 1.51 1.76
48 215.83 1.13 4.72 Student -2.84 -1.34 -0.06 0.54 1.13 1.73 2.33 3.61 5.11
216.21 1.10 0.80 School 0.42 0.68 0.89 1.00 1.10 1.20 1.30 1.52 1.77
50 216.51 1.10 4.72 Student -2.87 -1.37 -0.09 0.51 1.10 1.69 2.30 3.58 5.07
216.51 1.10 0.80 School 0.43 0.68 0.90 1.00 1.10 1.20 1.30 1.52 1.77
52 217.19 1.07 4.72 Student -2.91 -1.41 -0.13 0.47 1.07 1.66 2.26 3.54 5.04
216.80 1.11 0.80 School 0.43 0.69 0.90 1.01 1.11 1.21 1.31 1.53 1.78
55 218.21 1.02 4.72 Student -2.96 -1.46 -0.18 0.42 1.02 1.61 2.21 3.49 4.99
217.25 1.11 0.80 School 0.44 0.69 0.91 1.01 1.11 1.21 1.32 1.53 1.79
60 219.93 0.93 4.72 Student -3.04 -1.54 -0.26 0.34 0.93 1.53 2.13 3.41 4.91
218.00 1.13 0.80 School 0.45 0.71 0.92 1.03 1.13 1.23 1.33 1.55 1.80
65 221.72 0.85 4.72 Student -3.13 -1.63 -0.35 0.25 0.85 1.44 2.04 3.32 4.82
218.78 1.14 0.80 School 0.47 0.72 0.94 1.04 1.14 1.24 1.34 1.56 1.81
70 223.60 0.75 4.72 Student -3.22 -1.72 -0.44 0.16 0.75 1.35 1.95 3.23 4.73
219.59 1.16 0.80 School 0.48 0.74 0.95 1.05 1.16 1.26 1.36 1.57 1.83
75 225.63 0.66 4.72 Student -3.32 -1.82 -0.54 0.06 0.66 1.25 1.85 3.13 4.63
220.48 1.17 0.80 School 0.50 0.75 0.97 1.07 1.17 1.27 1.37 1.59 1.84
80 227.89 0.54 4.72 Student -3.43 -1.93 -0.65 -0.05 0.54 1.14 1.74 3.02 4.52
221.46 1.19 0.80 School 0.52 0.77 0.99 1.09 1.19 1.29 1.39 1.61 1.86
85 230.52 0.42 4.72 Student -3.56 -2.06 -0.78 -0.18 0.42 1.01 1.61 2.89 4.39
222.61 1.21 0.80 School 0.54 0.79 1.01 1.11 1.21 1.31 1.41 1.63 1.88
90 233.83 0.25 4.72 Student -3.72 -2.22 -0.94 -0.34 0.25 0.85 1.45 2.73 4.23
224.05 1.23 0.80 School 0.56 0.81 1.03 1.13 1.23 1.33 1.44 1.65 1.91
CGI - Conditional Growth Index CGP - Conditional Growth Percentile
352

Table E.3.37: Language Usage Grade 8 From Last Winter To Winter Conditional Growth Percentile
Conditional Growth
Start Status Growth CGP 20 30 40 45 50 55 60 70 80
%ile RIT Mean SD CGI -0.84 -0.52 -0.25 -0.13 0.00 0.13 0.25 0.52 0.84
10 196.77 5.25 6.07 Student 0.14 2.06 3.71 4.48 5.25 6.01 6.78 8.43 10.35
206.71 3.11 1.67 School 1.70 2.23 2.68 2.90 3.11 3.32 3.53 3.98 4.51
20 203.04 4.49 6.07 Student -0.62 1.30 2.95 3.72 4.49 5.25 6.02 7.67 9.59
209.57 3.08 1.67 School 1.67 2.20 2.66 2.87 3.08 3.29 3.51 3.96 4.49
25 205.43 4.20 6.07 Student -0.91 1.02 2.66 3.44 4.20 4.96 5.74 7.38 9.30
210.66 3.07 1.67 School 1.66 2.19 2.65 2.86 3.07 3.28 3.50 3.95 4.48
30 207.57 3.94 6.07 Student -1.17 0.76 2.40 3.18 3.94 4.70 5.48 7.12 9.05
211.63 3.06 1.67 School 1.66 2.19 2.64 2.85 3.06 3.27 3.49 3.94 4.47
35 209.55 3.70 6.07 Student -1.41 0.52 2.16 2.94 3.70 4.46 5.24 6.88 8.81
212.54 3.05 1.67 School 1.65 2.18 2.63 2.84 3.05 3.27 3.48 3.93 4.46
40 211.43 3.47 6.07 Student -1.64 0.29 1.93 2.71 3.47 4.23 5.01 6.65 8.58
213.40 3.05 1.67 School 1.64 2.17 2.62 2.84 3.05 3.26 3.47 3.92 4.46
45 213.25 3.25 6.07 Student -1.86 0.07 1.71 2.49 3.25 4.01 4.79 6.43 8.36
214.23 3.04 1.67 School 1.63 2.16 2.62 2.83 3.04 3.25 3.46 3.92 4.45
48 214.33 3.12 6.07 Student -1.99 -0.06 1.58 2.36 3.12 3.88 4.66 6.30 8.23
214.72 3.04 1.67 School 1.63 2.16 2.61 2.83 3.04 3.25 3.46 3.91 4.44
50 215.05 3.03 6.07 Student -2.07 -0.15 1.50 2.27 3.03 3.80 4.57 6.21 8.14
215.05 3.03 1.67 School 1.62 2.16 2.61 2.82 3.03 3.24 3.46 3.91 4.44
52 215.76 2.95 6.07 Student -2.16 -0.24 1.41 2.18 2.95 3.71 4.48 6.13 8.05
215.37 3.03 1.67 School 1.62 2.15 2.61 2.82 3.03 3.24 3.45 3.91 4.44
55 216.84 2.82 6.07 Student -2.29 -0.37 1.28 2.05 2.82 3.58 4.35 6.00 7.92
215.86 3.03 1.67 School 1.62 2.15 2.60 2.82 3.03 3.24 3.45 3.90 4.43
60 218.66 2.59 6.07 Student -2.51 -0.59 1.06 1.83 2.59 3.36 4.13 5.78 7.70
216.69 3.02 1.67 School 1.61 2.14 2.59 2.81 3.02 3.23 3.44 3.90 4.43
65 220.54 2.37 6.07 Student -2.74 -0.82 0.83 1.60 2.37 3.13 3.90 5.55 7.47
217.55 3.01 1.67 School 1.60 2.13 2.59 2.80 3.01 3.22 3.43 3.89 4.42
70 222.52 2.13 6.07 Student -2.98 -1.06 0.59 1.36 2.13 2.89 3.66 5.31 7.23
218.46 3.00 1.67 School 1.59 2.13 2.58 2.79 3.00 3.21 3.43 3.88 4.41
75 224.66 1.87 6.07 Student -3.24 -1.31 0.33 1.10 1.87 2.63 3.40 5.05 6.97
219.43 2.99 1.67 School 1.59 2.12 2.57 2.78 2.99 3.20 3.42 3.87 4.40
80 227.05 1.58 6.07 Student -3.53 -1.60 0.04 0.82 1.58 2.34 3.12 4.76 6.69
220.52 2.98 1.67 School 1.58 2.11 2.56 2.77 2.98 3.19 3.41 3.86 4.39
85 229.82 1.24 6.07 Student -3.86 -1.94 -0.30 0.48 1.24 2.00 2.78 4.42 6.35
221.79 2.97 1.67 School 1.56 2.10 2.55 2.76 2.97 3.18 3.40 3.85 4.38
90 233.32 0.82 6.07 Student -4.29 -2.36 -0.72 0.06 0.82 1.58 2.36 4.00 5.93
223.38 2.96 1.67 School 1.55 2.08 2.53 2.75 2.96 3.17 3.38 3.84 4.37
CGI - Conditional Growth Index CGP - Conditional Growth Percentile
353
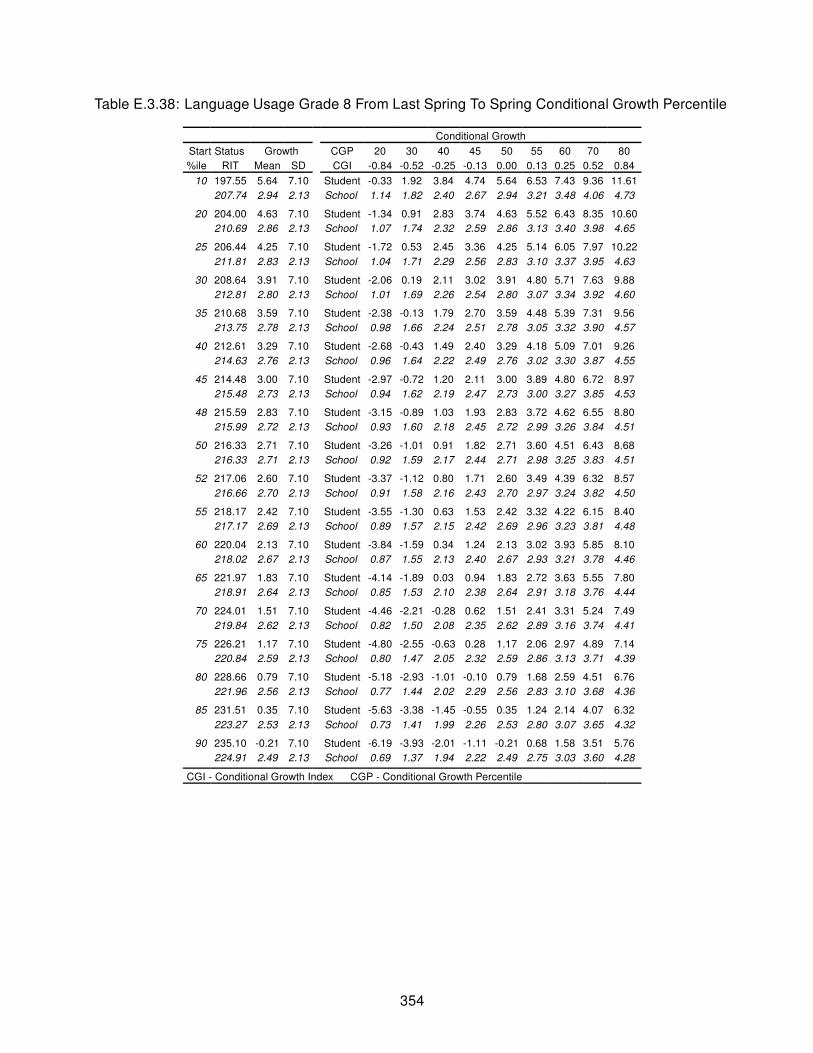
Table E.3.38: Language Usage Grade 8 From Last Spring To Spring Conditional Growth Percentile
Conditional Growth
Start Status Growth CGP 20 30 40 45 50 55 60 70 80
%ile RIT Mean SD CGI -0.84 -0.52 -0.25 -0.13 0.00 0.13 0.25 0.52 0.84
10 197.55 5.64 7.10 Student -0.33 1.92 3.84 4.74 5.64 6.53 7.43 9.36 11.61
207.74 2.94 2.13 School 1.14 1.82 2.40 2.67 2.94 3.21 3.48 4.06 4.73
20 204.00 4.63 7.10 Student -1.34 0.91 2.83 3.74 4.63 5.52 6.43 8.35 10.60
210.69 2.86 2.13 School 1.07 1.74 2.32 2.59 2.86 3.13 3.40 3.98 4.65
25 206.44 4.25 7.10 Student -1.72 0.53 2.45 3.36 4.25 5.14 6.05 7.97 10.22
211.81 2.83 2.13 School 1.04 1.71 2.29 2.56 2.83 3.10 3.37 3.95 4.63
30 208.64 3.91 7.10 Student -2.06 0.19 2.11 3.02 3.91 4.80 5.71 7.63 9.88
212.81 2.80 2.13 School 1.01 1.69 2.26 2.54 2.80 3.07 3.34 3.92 4.60
35 210.68 3.59 7.10 Student -2.38 -0.13 1.79 2.70 3.59 4.48 5.39 7.31 9.56
213.75 2.78 2.13 School 0.98 1.66 2.24 2.51 2.78 3.05 3.32 3.90 4.57
40 212.61 3.29 7.10 Student -2.68 -0.43 1.49 2.40 3.29 4.18 5.09 7.01 9.26
214.63 2.76 2.13 School 0.96 1.64 2.22 2.49 2.76 3.02 3.30 3.87 4.55
45 214.48 3.00 7.10 Student -2.97 -0.72 1.20 2.11 3.00 3.89 4.80 6.72 8.97
215.48 2.73 2.13 School 0.94 1.62 2.19 2.47 2.73 3.00 3.27 3.85 4.53
48 215.59 2.83 7.10 Student -3.15 -0.89 1.03 1.93 2.83 3.72 4.62 6.55 8.80
215.99 2.72 2.13 School 0.93 1.60 2.18 2.45 2.72 2.99 3.26 3.84 4.51
50 216.33 2.71 7.10 Student -3.26 -1.01 0.91 1.82 2.71 3.60 4.51 6.43 8.68
216.33 2.71 2.13 School 0.92 1.59 2.17 2.44 2.71 2.98 3.25 3.83 4.51
52 217.06 2.60 7.10 Student -3.37 -1.12 0.80 1.71 2.60 3.49 4.39 6.32 8.57
216.66 2.70 2.13 School 0.91 1.58 2.16 2.43 2.70 2.97 3.24 3.82 4.50
55 218.17 2.42 7.10 Student -3.55 -1.30 0.63 1.53 2.42 3.32 4.22 6.15 8.40
217.17 2.69 2.13 School 0.89 1.57 2.15 2.42 2.69 2.96 3.23 3.81 4.48
60 220.04 2.13 7.10 Student -3.84 -1.59 0.34 1.24 2.13 3.02 3.93 5.85 8.10
218.02 2.67 2.13 School 0.87 1.55 2.13 2.40 2.67 2.93 3.21 3.78 4.46
65 221.97 1.83 7.10 Student -4.14 -1.89 0.03 0.94 1.83 2.72 3.63 5.55 7.80
218.91 2.64 2.13 School 0.85 1.53 2.10 2.38 2.64 2.91 3.18 3.76 4.44
70 224.01 1.51 7.10 Student -4.46 -2.21 -0.28 0.62 1.51 2.41 3.31 5.24 7.49
219.84 2.62 2.13 School 0.82 1.50 2.08 2.35 2.62 2.89 3.16 3.74 4.41
75 226.21 1.17 7.10 Student -4.80 -2.55 -0.63 0.28 1.17 2.06 2.97 4.89 7.14
220.84 2.59 2.13 School 0.80 1.47 2.05 2.32 2.59 2.86 3.13 3.71 4.39
80 228.66 0.79 7.10 Student -5.18 -2.93 -1.01 -0.10 0.79 1.68 2.59 4.51 6.76
221.96 2.56 2.13 School 0.77 1.44 2.02 2.29 2.56 2.83 3.10 3.68 4.36
85 231.51 0.35 7.10 Student -5.63 -3.38 -1.45 -0.55 0.35 1.24 2.14 4.07 6.32
223.27 2.53 2.13 School 0.73 1.41 1.99 2.26 2.53 2.80 3.07 3.65 4.32
90 235.10 -0.21 7.10 Student -6.19 -3.93 -2.01 -1.11 -0.21 0.68 1.58 3.51 5.76
224.91 2.49 2.13 School 0.69 1.37 1.94 2.22 2.49 2.75 3.03 3.60 4.28
CGI - Conditional Growth Index CGP - Conditional Growth Percentile
354

Table E.3.39: Language Usage Grade 8 From Fall To N Fall Conditional Growth Percentile
Conditional Growth
Start Status Growth CGP 20 30 40 45 50 55 60 70 80
%ile RIT Mean SD CGI -0.84 -0.52 -0.25 -0.13 0.00 0.13 0.25 0.52 0.84
10 198.01 2.32 7.32 Student -3.84 -1.52 0.47 1.40 2.32 3.24 4.18 6.16 8.48
207.79 1.80 1.81 School 0.27 0.85 1.34 1.57 1.80 2.03 2.26 2.75 3.32
20 204.25 2.27 7.32 Student -3.89 -1.57 0.42 1.35 2.27 3.19 4.13 6.11 8.43
210.66 1.93 1.81 School 0.40 0.98 1.47 1.70 1.93 2.15 2.39 2.88 3.45
25 206.61 2.25 7.32 Student -3.91 -1.58 0.40 1.33 2.25 3.17 4.11 6.09 8.41
211.76 1.98 1.81 School 0.45 1.03 1.52 1.75 1.98 2.20 2.44 2.93 3.50
30 208.74 2.24 7.32 Student -3.92 -1.60 0.38 1.32 2.24 3.16 4.09 6.07 8.40
212.74 2.02 1.81 School 0.50 1.07 1.56 1.79 2.02 2.25 2.48 2.97 3.54
35 210.71 2.22 7.32 Student -3.94 -1.62 0.37 1.30 2.22 3.14 4.07 6.06 8.38
213.65 2.06 1.81 School 0.54 1.11 1.60 1.83 2.06 2.29 2.52 3.01 3.59
40 212.58 2.20 7.32 Student -3.95 -1.63 0.35 1.29 2.20 3.12 4.06 6.04 8.36
214.51 2.10 1.81 School 0.58 1.15 1.64 1.87 2.10 2.33 2.56 3.05 3.62
45 214.39 2.19 7.32 Student -3.97 -1.65 0.34 1.27 2.19 3.11 4.04 6.03 8.35
215.35 2.14 1.81 School 0.61 1.19 1.68 1.91 2.14 2.37 2.60 3.09 3.66
48 215.46 2.18 7.32 Student -3.98 -1.66 0.33 1.26 2.18 3.10 4.04 6.02 8.34
215.84 2.16 1.81 School 0.64 1.21 1.70 1.93 2.16 2.39 2.62 3.11 3.68
50 216.17 2.18 7.32 Student -3.98 -1.66 0.32 1.26 2.18 3.10 4.03 6.01 8.34
216.17 2.18 1.81 School 0.65 1.23 1.72 1.95 2.18 2.40 2.63 3.13 3.70
52 216.88 2.17 7.32 Student -3.99 -1.67 0.32 1.25 2.17 3.09 4.02 6.01 8.33
216.50 2.19 1.81 School 0.67 1.24 1.73 1.96 2.19 2.42 2.65 3.14 3.71
55 217.95 2.16 7.32 Student -4.00 -1.68 0.31 1.24 2.16 3.08 4.02 6.00 8.32
216.99 2.21 1.81 School 0.69 1.26 1.75 1.99 2.21 2.44 2.67 3.16 3.74
60 219.76 2.15 7.32 Student -4.01 -1.69 0.29 1.23 2.15 3.07 4.00 5.98 8.31
217.83 2.25 1.81 School 0.73 1.30 1.79 2.02 2.25 2.48 2.71 3.20 3.77
65 221.63 2.13 7.32 Student -4.03 -1.71 0.28 1.21 2.13 3.05 3.99 5.97 8.29
218.69 2.29 1.81 School 0.77 1.34 1.83 2.06 2.29 2.52 2.75 3.24 3.81
70 223.60 2.12 7.32 Student -4.04 -1.72 0.26 1.20 2.12 3.04 3.97 5.95 8.28
219.60 2.33 1.81 School 0.81 1.38 1.87 2.10 2.33 2.56 2.79 3.28 3.85
75 225.73 2.10 7.32 Student -4.06 -1.74 0.24 1.18 2.10 3.02 3.95 5.94 8.26
220.59 2.37 1.81 School 0.85 1.43 1.92 2.15 2.37 2.60 2.83 3.32 3.90
80 228.10 2.08 7.32 Student -4.08 -1.76 0.22 1.16 2.08 3.00 3.93 5.92 8.24
221.68 2.42 1.81 School 0.90 1.47 1.97 2.20 2.42 2.65 2.88 3.37 3.95
85 230.86 2.06 7.32 Student -4.10 -1.78 0.20 1.14 2.06 2.98 3.91 5.89 8.22
222.96 2.48 1.81 School 0.96 1.53 2.02 2.25 2.48 2.71 2.94 3.43 4.01
90 234.33 2.03 7.32 Student -4.13 -1.81 0.17 1.11 2.03 2.95 3.88 5.87 8.19
224.56 2.55 1.81 School 1.03 1.60 2.10 2.33 2.55 2.78 3.01 3.50 4.08
CGI - Conditional Growth Index CGP - Conditional Growth Percentile
355
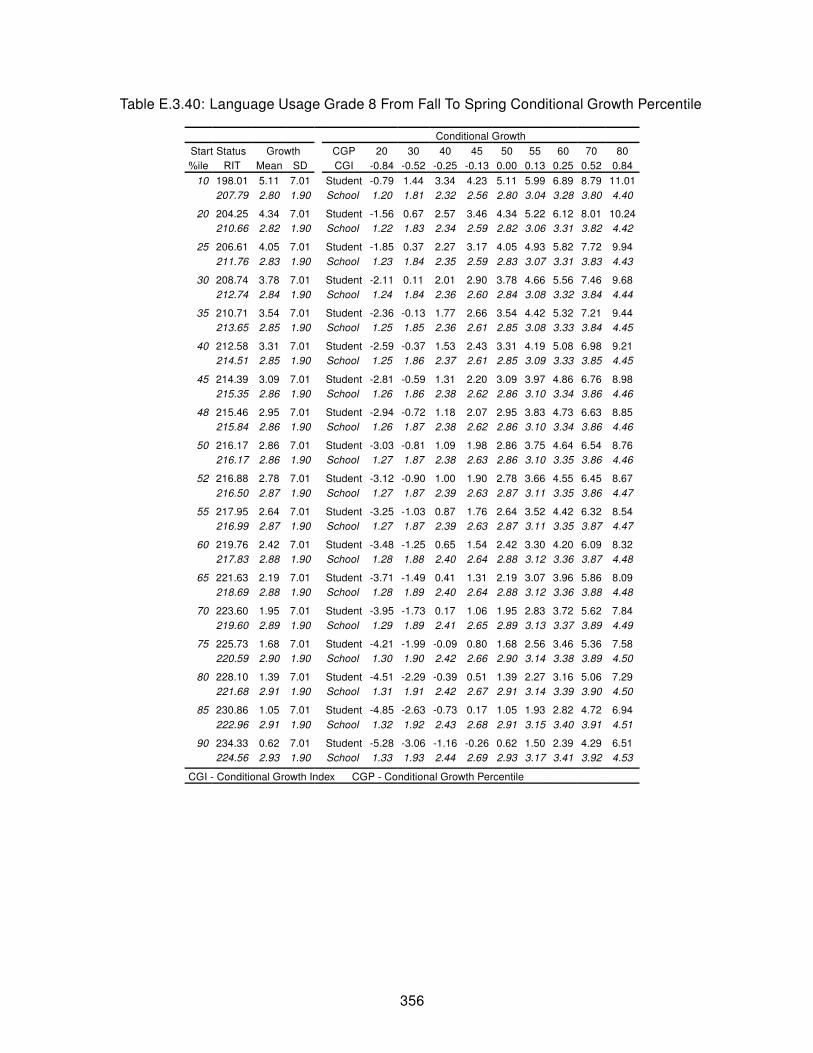
Table E.3.40: Language Usage Grade 8 From Fall To Spring Conditional Growth Percentile
Conditional Growth
Start Status Growth CGP 20 30 40 45 50 55 60 70 80
%ile RIT Mean SD CGI -0.84 -0.52 -0.25 -0.13 0.00 0.13 0.25 0.52 0.84
10 198.01 5.11 7.01 Student -0.79 1.44 3.34 4.23 5.11 5.99 6.89 8.79 11.01
207.79 2.80 1.90 School 1.20 1.81 2.32 2.56 2.80 3.04 3.28 3.80 4.40
20 204.25 4.34 7.01 Student -1.56 0.67 2.57 3.46 4.34 5.22 6.12 8.01 10.24
210.66 2.82 1.90 School 1.22 1.83 2.34 2.59 2.82 3.06 3.31 3.82 4.42
25 206.61 4.05 7.01 Student -1.85 0.37 2.27 3.17 4.05 4.93 5.82 7.72 9.94
211.76 2.83 1.90 School 1.23 1.84 2.35 2.59 2.83 3.07 3.31 3.83 4.43
30 208.74 3.78 7.01 Student -2.11 0.11 2.01 2.90 3.78 4.66 5.56 7.46 9.68
212.74 2.84 1.90 School 1.24 1.84 2.36 2.60 2.84 3.08 3.32 3.84 4.44
35 210.71 3.54 7.01 Student -2.36 -0.13 1.77 2.66 3.54 4.42 5.32 7.21 9.44
213.65 2.85 1.90 School 1.25 1.85 2.36 2.61 2.85 3.08 3.33 3.84 4.45
40 212.58 3.31 7.01 Student -2.59 -0.37 1.53 2.43 3.31 4.19 5.08 6.98 9.21
214.51 2.85 1.90 School 1.25 1.86 2.37 2.61 2.85 3.09 3.33 3.85 4.45
45 214.39 3.09 7.01 Student -2.81 -0.59 1.31 2.20 3.09 3.97 4.86 6.76 8.98
215.35 2.86 1.90 School 1.26 1.86 2.38 2.62 2.86 3.10 3.34 3.86 4.46
48 215.46 2.95 7.01 Student -2.94 -0.72 1.18 2.07 2.95 3.83 4.73 6.63 8.85
215.84 2.86 1.90 School 1.26 1.87 2.38 2.62 2.86 3.10 3.34 3.86 4.46
50 216.17 2.86 7.01 Student -3.03 -0.81 1.09 1.98 2.86 3.75 4.64 6.54 8.76
216.17 2.86 1.90 School 1.27 1.87 2.38 2.63 2.86 3.10 3.35 3.86 4.46
52 216.88 2.78 7.01 Student -3.12 -0.90 1.00 1.90 2.78 3.66 4.55 6.45 8.67
216.50 2.87 1.90 School 1.27 1.87 2.39 2.63 2.87 3.11 3.35 3.86 4.47
55 217.95 2.64 7.01 Student -3.25 -1.03 0.87 1.76 2.64 3.52 4.42 6.32 8.54
216.99 2.87 1.90 School 1.27 1.87 2.39 2.63 2.87 3.11 3.35 3.87 4.47
60 219.76 2.42 7.01 Student -3.48 -1.25 0.65 1.54 2.42 3.30 4.20 6.09 8.32
217.83 2.88 1.90 School 1.28 1.88 2.40 2.64 2.88 3.12 3.36 3.87 4.48
65 221.63 2.19 7.01 Student -3.71 -1.49 0.41 1.31 2.19 3.07 3.96 5.86 8.09
218.69 2.88 1.90 School 1.28 1.89 2.40 2.64 2.88 3.12 3.36 3.88 4.48
70 223.60 1.95 7.01 Student -3.95 -1.73 0.17 1.06 1.95 2.83 3.72 5.62 7.84
219.60 2.89 1.90 School 1.29 1.89 2.41 2.65 2.89 3.13 3.37 3.89 4.49
75 225.73 1.68 7.01 Student -4.21 -1.99 -0.09 0.80 1.68 2.56 3.46 5.36 7.58
220.59 2.90 1.90 School 1.30 1.90 2.42 2.66 2.90 3.14 3.38 3.89 4.50
80 228.10 1.39 7.01 Student -4.51 -2.29 -0.39 0.51 1.39 2.27 3.16 5.06 7.29
221.68 2.91 1.90 School 1.31 1.91 2.42 2.67 2.91 3.14 3.39 3.90 4.50
85 230.86 1.05 7.01 Student -4.85 -2.63 -0.73 0.17 1.05 1.93 2.82 4.72 6.94
222.96 2.91 1.90 School 1.32 1.92 2.43 2.68 2.91 3.15 3.40 3.91 4.51
90 234.33 0.62 7.01 Student -5.28 -3.06 -1.16 -0.26 0.62 1.50 2.39 4.29 6.51
224.56 2.93 1.90 School 1.33 1.93 2.44 2.69 2.93 3.17 3.41 3.92 4.53
CGI - Conditional Growth Index CGP - Conditional Growth Percentile
356

Table E.3.41: Language Usage Grade 8 From Fall To Winter Conditional Growth Percentile
Conditional Growth
Start Status Growth CGP 20 30 40 45 50 55 60 70 80
%ile RIT Mean SD CGI -0.84 -0.52 -0.25 -0.13 0.00 0.13 0.25 0.52 0.84
10 198.01 3.54 5.25 Student -0.88 0.79 2.21 2.88 3.54 4.20 4.87 6.29 7.95
207.79 1.87 1.09 School 0.96 1.30 1.60 1.73 1.87 2.01 2.15 2.44 2.78
20 204.25 2.98 5.25 Student -1.44 0.23 1.65 2.32 2.98 3.64 4.31 5.73 7.39
210.66 1.88 1.09 School 0.97 1.31 1.61 1.75 1.88 2.02 2.16 2.45 2.80
25 206.61 2.76 5.25 Student -1.65 0.01 1.44 2.11 2.76 3.42 4.09 5.52 7.18
211.76 1.89 1.09 School 0.97 1.32 1.61 1.75 1.89 2.02 2.16 2.46 2.80
30 208.74 2.57 5.25 Student -1.84 -0.18 1.24 1.91 2.57 3.23 3.90 5.33 6.99
212.74 1.89 1.09 School 0.98 1.32 1.62 1.75 1.89 2.03 2.17 2.46 2.81
35 210.71 2.40 5.25 Student -2.02 -0.36 1.07 1.74 2.40 3.06 3.73 5.15 6.81
213.65 1.89 1.09 School 0.98 1.33 1.62 1.76 1.89 2.03 2.17 2.46 2.81
40 212.58 2.23 5.25 Student -2.19 -0.52 0.90 1.57 2.23 2.89 3.56 4.98 6.64
214.51 1.90 1.09 School 0.98 1.33 1.62 1.76 1.90 2.04 2.17 2.47 2.81
45 214.39 2.07 5.25 Student -2.35 -0.69 0.74 1.41 2.07 2.73 3.40 4.82 6.48
215.35 1.90 1.09 School 0.99 1.33 1.63 1.77 1.90 2.04 2.18 2.47 2.82
48 215.46 1.97 5.25 Student -2.45 -0.78 0.64 1.31 1.97 2.63 3.30 4.72 6.39
215.84 1.90 1.09 School 0.99 1.33 1.63 1.77 1.90 2.04 2.18 2.47 2.82
50 216.17 1.91 5.25 Student -2.51 -0.85 0.58 1.25 1.91 2.56 3.23 4.66 6.32
216.17 1.91 1.09 School 0.99 1.34 1.63 1.77 1.91 2.04 2.18 2.48 2.82
52 216.88 1.84 5.25 Student -2.57 -0.91 0.51 1.18 1.84 2.50 3.17 4.59 6.26
216.50 1.91 1.09 School 0.99 1.34 1.63 1.77 1.91 2.04 2.18 2.48 2.82
55 217.95 1.75 5.25 Student -2.67 -1.01 0.42 1.09 1.75 2.40 3.07 4.50 6.16
216.99 1.91 1.09 School 0.99 1.34 1.63 1.77 1.91 2.05 2.18 2.48 2.82
60 219.76 1.58 5.25 Student -2.83 -1.17 0.25 0.92 1.58 2.24 2.91 4.33 6.00
217.83 1.91 1.09 School 1.00 1.34 1.64 1.78 1.91 2.05 2.19 2.48 2.83
65 221.63 1.41 5.25 Student -3.00 -1.34 0.09 0.76 1.41 2.07 2.74 4.17 5.83
218.69 1.92 1.09 School 1.00 1.35 1.64 1.78 1.92 2.05 2.19 2.49 2.83
70 223.60 1.24 5.25 Student -3.18 -1.51 -0.09 0.58 1.24 1.90 2.57 3.99 5.65
219.60 1.92 1.09 School 1.01 1.35 1.64 1.78 1.92 2.06 2.20 2.49 2.83
75 225.73 1.05 5.25 Student -3.37 -1.71 -0.28 0.39 1.05 1.71 2.38 3.80 5.46
220.59 1.92 1.09 School 1.01 1.35 1.65 1.79 1.92 2.06 2.20 2.49 2.84
80 228.10 0.83 5.25 Student -3.58 -1.92 -0.50 0.17 0.83 1.49 2.16 3.58 5.25
221.68 1.93 1.09 School 1.01 1.36 1.65 1.79 1.93 2.07 2.20 2.50 2.84
85 230.86 0.59 5.25 Student -3.83 -2.17 -0.74 -0.07 0.59 1.24 1.91 3.34 5.00
222.96 1.93 1.09 School 1.02 1.36 1.66 1.80 1.93 2.07 2.21 2.50 2.85
90 234.33 0.27 5.25 Student -4.14 -2.48 -1.06 -0.39 0.27 0.93 1.60 3.02 4.69
224.56 1.94 1.09 School 1.03 1.37 1.67 1.80 1.94 2.08 2.22 2.51 2.86
CGI - Conditional Growth Index CGP - Conditional Growth Percentile
357

Table E.3.42: Language Usage Grade 8 From Winter To Spring Conditional Growth Percentile
Conditional Growth
Start Status Growth CGP 20 30 40 45 50 55 60 70 80
%ile RIT Mean SD CGI -0.84 -0.52 -0.25 -0.13 0.00 0.13 0.25 0.52 0.84
10 200.23 1.64 4.90 Student -2.48 -0.93 0.40 1.03 1.64 2.26 2.88 4.21 5.77
209.54 0.76 0.80 School 0.09 0.34 0.56 0.66 0.76 0.86 0.97 1.18 1.44
20 206.36 1.41 4.90 Student -2.71 -1.16 0.17 0.79 1.41 2.02 2.65 3.98 5.53
212.47 0.83 0.80 School 0.16 0.41 0.63 0.73 0.83 0.93 1.03 1.25 1.51
25 208.69 1.32 4.90 Student -2.80 -1.25 0.08 0.70 1.32 1.93 2.56 3.89 5.44
213.59 0.86 0.80 School 0.18 0.44 0.65 0.76 0.86 0.96 1.06 1.28 1.53
30 210.78 1.24 4.90 Student -2.88 -1.33 -0.00 0.62 1.24 1.85 2.48 3.81 5.36
214.58 0.88 0.80 School 0.20 0.46 0.68 0.78 0.88 0.98 1.08 1.30 1.55
35 212.71 1.16 4.90 Student -2.96 -1.40 -0.08 0.55 1.16 1.78 2.41 3.73 5.29
215.51 0.90 0.80 School 0.23 0.48 0.70 0.80 0.90 1.00 1.10 1.32 1.58
40 214.55 1.09 4.90 Student -3.03 -1.47 -0.15 0.48 1.09 1.71 2.34 3.66 5.22
216.39 0.92 0.80 School 0.25 0.50 0.72 0.82 0.92 1.02 1.12 1.34 1.60
45 216.33 1.03 4.90 Student -3.10 -1.54 -0.21 0.41 1.03 1.64 2.27 3.59 5.15
217.24 0.94 0.80 School 0.27 0.52 0.74 0.84 0.94 1.04 1.14 1.36 1.61
48 217.38 0.99 4.90 Student -3.14 -1.58 -0.26 0.37 0.99 1.60 2.23 3.55 5.11
217.74 0.95 0.80 School 0.28 0.53 0.75 0.85 0.95 1.05 1.15 1.37 1.63
50 218.08 0.96 4.90 Student -3.16 -1.61 -0.28 0.34 0.96 1.57 2.20 3.53 5.08
218.08 0.96 0.80 School 0.28 0.54 0.76 0.86 0.96 1.06 1.16 1.38 1.63
52 218.78 0.93 4.90 Student -3.19 -1.64 -0.31 0.32 0.93 1.55 2.17 3.50 5.05
218.41 0.97 0.80 School 0.29 0.55 0.76 0.87 0.97 1.07 1.17 1.39 1.64
55 219.83 0.89 4.90 Student -3.23 -1.68 -0.35 0.28 0.89 1.51 2.13 3.46 5.01
218.92 0.98 0.80 School 0.30 0.56 0.78 0.88 0.98 1.08 1.18 1.40 1.65
60 221.61 0.82 4.90 Student -3.30 -1.74 -0.42 0.21 0.82 1.44 2.06 3.39 4.95
219.77 1.00 0.80 School 0.32 0.58 0.79 0.90 1.00 1.10 1.20 1.42 1.67
65 223.44 0.75 4.90 Student -3.37 -1.82 -0.49 0.14 0.75 1.37 1.99 3.32 4.88
220.64 1.02 0.80 School 0.34 0.60 0.81 0.92 1.02 1.12 1.22 1.44 1.69
70 225.38 0.68 4.90 Student -3.44 -1.89 -0.56 0.06 0.68 1.29 1.92 3.25 4.80
221.57 1.04 0.80 School 0.36 0.62 0.84 0.94 1.04 1.14 1.24 1.46 1.71
75 227.47 0.60 4.90 Student -3.52 -1.97 -0.64 -0.02 0.60 1.21 1.84 3.17 4.72
222.57 1.06 0.80 School 0.39 0.64 0.86 0.96 1.06 1.16 1.27 1.48 1.74
80 229.80 0.51 4.90 Student -3.61 -2.06 -0.73 -0.11 0.51 1.13 1.75 3.08 4.63
223.68 1.09 0.80 School 0.41 0.67 0.88 0.99 1.09 1.19 1.29 1.51 1.76
85 232.51 0.41 4.90 Student -3.72 -2.16 -0.83 -0.21 0.41 1.02 1.65 2.97 4.53
224.98 1.12 0.80 School 0.44 0.70 0.91 1.02 1.12 1.22 1.32 1.54 1.79
90 235.92 0.28 4.90 Student -3.85 -2.29 -0.97 -0.34 0.28 0.89 1.52 2.84 4.40
226.61 1.15 0.80 School 0.48 0.73 0.95 1.05 1.15 1.26 1.36 1.58 1.83
CGI - Conditional Growth Index CGP - Conditional Growth Percentile
358

Table E.3.43: Language Usage Grade 9 From Last Winter To Winter Conditional Growth Percentile
Conditional Growth
Start Status Growth CGP 20 30 40 45 50 55 60 70 80
%ile RIT Mean SD CGI -0.84 -0.52 -0.25 -0.13 0.00 0.13 0.25 0.52 0.84
10 199.93 3.88 6.42 Student -1.52 0.52 2.26 3.08 3.88 4.69 5.51 7.25 9.29
209.68 1.68 1.90 School 0.08 0.69 1.20 1.44 1.68 1.92 2.16 2.68 3.28
20 206.29 2.99 6.42 Student -2.42 -0.38 1.36 2.18 2.99 3.80 4.62 6.36 8.39
212.69 1.54 1.90 School -0.05 0.55 1.06 1.30 1.54 1.78 2.02 2.54 3.14
25 208.70 2.65 6.42 Student -2.76 -0.72 1.02 1.84 2.65 3.46 4.28 6.02 8.05
213.84 1.49 1.90 School -0.11 0.50 1.01 1.25 1.49 1.73 1.97 2.49 3.09
30 210.87 2.34 6.42 Student -3.06 -1.02 0.72 1.54 2.34 3.15 3.97 5.71 7.75
214.86 1.44 1.90 School -0.15 0.45 0.96 1.20 1.44 1.68 1.92 2.44 3.04
35 212.88 2.06 6.42 Student -3.34 -1.31 0.44 1.26 2.06 2.87 3.69 5.43 7.47
215.81 1.40 1.90 School -0.20 0.40 0.92 1.16 1.40 1.64 1.88 2.39 3.00
40 214.79 1.79 6.42 Student -3.61 -1.57 0.17 0.99 1.79 2.60 3.42 5.16 7.20
216.72 1.36 1.90 School -0.24 0.36 0.88 1.12 1.36 1.60 1.84 2.35 2.96
45 216.63 1.53 6.42 Student -3.87 -1.83 -0.09 0.73 1.53 2.34 3.16 4.90 6.94
217.59 1.32 1.90 School -0.28 0.32 0.84 1.08 1.32 1.56 1.80 2.31 2.91
48 217.72 1.38 6.42 Student -4.02 -1.99 -0.25 0.57 1.38 2.19 3.01 4.75 6.79
218.11 1.29 1.90 School -0.30 0.30 0.81 1.06 1.29 1.53 1.78 2.29 2.89
50 218.45 1.28 6.42 Student -4.13 -2.09 -0.35 0.47 1.28 2.09 2.91 4.65 6.68
218.45 1.28 1.90 School -0.32 0.28 0.80 1.04 1.28 1.52 1.76 2.27 2.88
52 219.17 1.18 6.42 Student -4.23 -2.19 -0.45 0.37 1.18 1.98 2.80 4.54 6.58
218.79 1.26 1.90 School -0.33 0.27 0.78 1.02 1.26 1.50 1.74 2.26 2.86
55 220.26 1.02 6.42 Student -4.38 -2.34 -0.60 0.22 1.02 1.83 2.65 4.39 6.43
219.31 1.24 1.90 School -0.36 0.24 0.76 1.00 1.24 1.48 1.72 2.23 2.84
60 222.11 0.76 6.42 Student -4.64 -2.60 -0.86 -0.04 0.76 1.57 2.39 4.13 6.17
220.18 1.20 1.90 School -0.40 0.20 0.72 0.96 1.20 1.44 1.68 2.19 2.80
65 224.02 0.50 6.42 Student -4.91 -2.87 -1.13 -0.31 0.50 1.30 2.12 3.86 5.90
221.08 1.16 1.90 School -0.44 0.16 0.68 0.92 1.16 1.40 1.64 2.15 2.75
70 226.03 0.21 6.42 Student -5.19 -3.15 -1.41 -0.59 0.21 1.02 1.84 3.58 5.62
222.03 1.11 1.90 School -0.48 0.12 0.63 0.88 1.11 1.35 1.59 2.11 2.71
75 228.20 -0.09 6.42 Student -5.50 -3.46 -1.72 -0.90 -0.09 0.71 1.53 3.28 5.31
223.06 1.07 1.90 School -0.53 0.07 0.59 0.83 1.07 1.31 1.55 2.06 2.66
80 230.61 -0.43 6.42 Student -5.84 -3.80 -2.06 -1.24 -0.43 0.38 1.20 2.94 4.97
224.20 1.01 1.90 School -0.58 0.02 0.53 0.78 1.01 1.25 1.50 2.01 2.61
85 233.43 -0.83 6.42 Student -6.23 -4.20 -2.45 -1.63 -0.83 -0.02 0.80 2.54 4.58
225.54 0.95 1.90 School -0.64 -0.04 0.47 0.72 0.95 1.19 1.43 1.95 2.55
90 236.97 -1.33 6.42 Student -6.73 -4.69 -2.95 -2.13 -1.33 -0.52 0.30 2.04 4.08
227.21 0.88 1.90 School -0.72 -0.12 0.40 0.64 0.88 1.12 1.36 1.87 2.47
CGI - Conditional Growth Index CGP - Conditional Growth Percentile
359

Table E.3.44: Language Usage Grade 9 From Last Spring To Spring Conditional Growth Percentile
Conditional Growth
Start Status Growth CGP 20 30 40 45 50 55 60 70 80
%ile RIT Mean SD CGI -0.84 -0.52 -0.25 -0.13 0.00 0.13 0.25 0.52 0.84
10 199.96 4.29 7.21 Student -1.77 0.51 2.47 3.39 4.29 5.20 6.12 8.07 10.36
210.10 1.78 2.20 School -0.08 0.62 1.22 1.50 1.78 2.06 2.34 2.93 3.63
20 206.63 3.16 7.21 Student -2.91 -0.62 1.34 2.26 3.16 4.07 4.99 6.94 9.23
213.28 1.51 2.20 School -0.35 0.35 0.95 1.23 1.51 1.79 2.07 2.67 3.37
25 209.16 2.73 7.21 Student -3.34 -1.05 0.91 1.83 2.73 3.64 4.56 6.51 8.80
214.49 1.41 2.20 School -0.45 0.25 0.85 1.13 1.41 1.69 1.97 2.56 3.26
30 211.43 2.35 7.21 Student -3.72 -1.43 0.52 1.44 2.35 3.25 4.17 6.13 8.41
215.58 1.32 2.20 School -0.54 0.16 0.76 1.04 1.32 1.59 1.88 2.47 3.17
35 213.54 1.99 7.21 Student -4.08 -1.79 0.16 1.08 1.99 2.89 3.81 5.77 8.06
216.59 1.23 2.20 School -0.62 0.08 0.67 0.96 1.23 1.51 1.79 2.39 3.09
40 215.54 1.65 7.21 Student -4.42 -2.13 -0.18 0.74 1.65 2.55 3.48 5.43 7.72
217.54 1.15 2.20 School -0.70 -0.00 0.59 0.87 1.15 1.43 1.71 2.31 3.01
45 217.47 1.32 7.21 Student -4.75 -2.46 -0.51 0.41 1.32 2.23 3.15 5.10 7.39
218.47 1.07 2.20 School -0.78 -0.08 0.52 0.80 1.07 1.35 1.63 2.23 2.93
48 218.62 1.13 7.21 Student -4.94 -2.65 -0.70 0.22 1.13 2.03 2.95 4.91 7.19
219.02 1.03 2.20 School -0.83 -0.13 0.47 0.75 1.03 1.31 1.59 2.18 2.88
50 219.38 1.00 7.21 Student -5.07 -2.78 -0.83 0.09 1.00 1.90 2.82 4.78 7.07
219.38 1.00 2.20 School -0.86 -0.16 0.44 0.72 1.00 1.27 1.56 2.15 2.85
52 220.14 0.87 7.21 Student -5.20 -2.91 -0.96 -0.04 0.87 1.77 2.70 4.65 6.94
219.74 0.97 2.20 School -0.89 -0.19 0.41 0.69 0.97 1.24 1.53 2.12 2.82
55 221.28 0.67 7.21 Student -5.39 -3.11 -1.15 -0.23 0.67 1.58 2.50 4.46 6.74
220.29 0.92 2.20 School -0.93 -0.24 0.36 0.64 0.92 1.20 1.48 2.08 2.78
60 223.22 0.35 7.21 Student -5.72 -3.43 -1.48 -0.56 0.35 1.25 2.17 4.13 6.41
221.21 0.84 2.20 School -1.01 -0.31 0.28 0.57 0.84 1.12 1.40 2.00 2.70
65 225.22 0.01 7.21 Student -6.06 -3.77 -1.82 -0.90 0.01 0.91 1.83 3.79 6.07
222.17 0.76 2.20 School -1.09 -0.39 0.20 0.49 0.76 1.04 1.32 1.92 2.62
70 227.33 -0.35 7.21 Student -6.42 -4.13 -2.18 -1.26 -0.35 0.56 1.48 3.43 5.72
223.18 0.68 2.20 School -1.18 -0.48 0.12 0.40 0.68 0.96 1.24 1.83 2.53
75 229.60 -0.74 7.21 Student -6.80 -4.52 -2.56 -1.64 -0.74 0.17 1.09 3.04 5.33
224.26 0.59 2.20 School -1.27 -0.57 0.03 0.31 0.59 0.86 1.15 1.74 2.44
80 232.13 -1.17 7.21 Student -7.23 -4.95 -2.99 -2.07 -1.17 -0.26 0.66 2.61 4.90
225.48 0.48 2.20 School -1.37 -0.67 -0.07 0.21 0.48 0.76 1.04 1.64 2.34
85 235.09 -1.67 7.21 Student -7.74 -5.45 -3.49 -2.57 -1.67 -0.76 0.16 2.11 4.40
226.89 0.37 2.20 School -1.49 -0.79 -0.19 0.09 0.37 0.64 0.92 1.52 2.22
90 238.80 -2.30 7.21 Student -8.37 -6.08 -4.12 -3.20 -2.30 -1.39 -0.47 1.48 3.77
228.66 0.22 2.20 School -1.64 -0.94 -0.34 -0.06 0.22 0.49 0.78 1.37 2.07
CGI - Conditional Growth Index CGP - Conditional Growth Percentile
360

Table E.3.45: Language Usage Grade 9 From Fall To N Fall Conditional Growth Percentile
Conditional Growth
Start Status Growth CGP 20 30 40 45 50 55 60 70 80
%ile RIT Mean SD CGI -0.84 -0.52 -0.25 -0.13 0.00 0.13 0.25 0.52 0.84
10 200.25 1.56 7.15 Student -4.46 -2.19 -0.25 0.66 1.56 2.46 3.37 5.31 7.58
209.75 0.80 2.02 School -0.90 -0.26 0.29 0.54 0.80 1.05 1.31 1.86 2.50
20 206.47 1.43 7.15 Student -4.59 -2.32 -0.38 0.53 1.43 2.33 3.24 5.18 7.45
212.71 0.93 2.02 School -0.77 -0.13 0.42 0.68 0.93 1.18 1.44 1.99 2.63
25 208.83 1.38 7.15 Student -4.64 -2.37 -0.43 0.48 1.38 2.28 3.19 5.13 7.40
213.83 0.98 2.02 School -0.72 -0.08 0.47 0.72 0.98 1.23 1.49 2.04 2.68
30 210.96 1.33 7.15 Student -4.68 -2.42 -0.48 0.44 1.33 2.23 3.15 5.08 7.35
214.84 1.02 2.02 School -0.68 -0.04 0.51 0.77 1.02 1.28 1.54 2.08 2.72
35 212.92 1.29 7.15 Student -4.72 -2.46 -0.52 0.39 1.29 2.19 3.10 5.04 7.31
215.78 1.06 2.02 School -0.64 0.01 0.55 0.81 1.06 1.32 1.58 2.12 2.76
40 214.79 1.25 7.15 Student -4.76 -2.50 -0.56 0.36 1.25 2.15 3.07 5.00 7.27
216.67 1.10 2.02 School -0.60 0.04 0.59 0.85 1.10 1.36 1.62 2.16 2.80
45 216.60 1.22 7.15 Student -4.80 -2.53 -0.59 0.32 1.22 2.12 3.03 4.97 7.23
217.53 1.14 2.02 School -0.56 0.08 0.63 0.89 1.14 1.40 1.65 2.20 2.84
48 217.66 1.19 7.15 Student -4.82 -2.56 -0.62 0.30 1.19 2.09 3.01 4.94 7.21
218.04 1.16 2.02 School -0.54 0.11 0.65 0.91 1.16 1.42 1.68 2.22 2.86
50 218.37 1.18 7.15 Student -4.84 -2.57 -0.63 0.28 1.18 2.08 2.99 4.93 7.20
218.37 1.18 2.02 School -0.52 0.12 0.67 0.93 1.18 1.43 1.69 2.24 2.88
52 219.08 1.16 7.15 Student -4.85 -2.58 -0.65 0.27 1.16 2.06 2.98 4.91 7.18
218.71 1.19 2.02 School -0.51 0.13 0.68 0.94 1.19 1.45 1.71 2.25 2.89
55 220.15 1.14 7.15 Student -4.88 -2.61 -0.67 0.24 1.14 2.04 2.95 4.89 7.16
219.22 1.22 2.02 School -0.48 0.16 0.71 0.96 1.22 1.47 1.73 2.28 2.92
60 221.96 1.10 7.15 Student -4.91 -2.64 -0.71 0.21 1.10 2.00 2.92 4.85 7.12
220.08 1.25 2.02 School -0.45 0.20 0.74 1.00 1.25 1.51 1.77 2.31 2.96
65 223.82 1.07 7.15 Student -4.95 -2.68 -0.75 0.17 1.07 1.96 2.88 4.82 7.08
220.97 1.29 2.02 School -0.41 0.23 0.78 1.04 1.29 1.55 1.81 2.35 2.99
70 225.79 1.02 7.15 Student -4.99 -2.73 -0.79 0.13 1.02 1.92 2.84 4.77 7.04
221.90 1.34 2.02 School -0.36 0.28 0.82 1.08 1.34 1.59 1.85 2.39 3.04
75 227.91 0.98 7.15 Student -5.04 -2.77 -0.83 0.08 0.98 1.88 2.79 4.73 7.00
222.91 1.38 2.02 School -0.32 0.32 0.87 1.13 1.38 1.63 1.89 2.44 3.08
80 230.28 0.93 7.15 Student -5.09 -2.82 -0.88 0.03 0.93 1.83 2.74 4.68 6.95
224.04 1.43 2.02 School -0.27 0.37 0.92 1.18 1.43 1.68 1.94 2.49 3.13
85 233.03 0.87 7.15 Student -5.14 -2.88 -0.94 -0.03 0.87 1.77 2.68 4.62 6.89
225.35 1.49 2.02 School -0.21 0.43 0.98 1.23 1.49 1.74 2.00 2.55 3.19
90 236.50 0.80 7.15 Student -5.22 -2.95 -1.01 -0.10 0.80 1.70 2.61 4.55 6.82
227.00 1.56 2.02 School -0.14 0.50 1.05 1.31 1.56 1.81 2.07 2.62 3.26
CGI - Conditional Growth Index CGP - Conditional Growth Percentile
361

Table E.3.46: Language Usage Grade 9 From Fall To Spring Conditional Growth Percentile
Conditional Growth
Start Status Growth CGP 20 30 40 45 50 55 60 70 80
%ile RIT Mean SD CGI -0.84 -0.52 -0.25 -0.13 0.00 0.13 0.25 0.52 0.84
10 200.25 4.29 7.58 Student -2.09 0.31 2.37 3.33 4.29 5.24 6.21 8.26 10.67
209.75 2.11 2.18 School 0.28 0.97 1.56 1.84 2.11 2.39 2.66 3.25 3.94
20 206.47 3.50 7.58 Student -2.88 -0.47 1.58 2.55 3.50 4.46 5.42 7.48 9.88
212.71 2.08 2.18 School 0.24 0.93 1.52 1.80 2.08 2.35 2.63 3.22 3.91
25 208.83 3.20 7.58 Student -3.17 -0.77 1.28 2.25 3.20 4.16 5.13 7.18 9.58
213.83 2.06 2.18 School 0.23 0.92 1.51 1.79 2.06 2.33 2.61 3.20 3.89
30 210.96 2.94 7.58 Student -3.44 -1.04 1.02 1.98 2.94 3.89 4.86 6.91 9.32
214.84 2.05 2.18 School 0.22 0.91 1.50 1.77 2.05 2.32 2.60 3.19 3.88
35 212.92 2.69 7.58 Student -3.69 -1.28 0.77 1.74 2.69 3.64 4.61 6.66 9.07
215.78 2.04 2.18 School 0.20 0.89 1.48 1.76 2.04 2.31 2.59 3.18 3.87
40 214.79 2.45 7.58 Student -3.92 -1.52 0.53 1.50 2.45 3.41 4.37 6.43 8.83
216.67 2.02 2.18 School 0.19 0.88 1.47 1.75 2.02 2.30 2.58 3.17 3.86
45 216.60 2.23 7.58 Student -4.15 -1.75 0.31 1.27 2.23 3.18 4.15 6.20 8.61
217.53 2.01 2.18 School 0.18 0.87 1.46 1.74 2.01 2.29 2.57 3.16 3.85
48 217.66 2.09 7.58 Student -4.29 -1.88 0.17 1.14 2.09 3.04 4.01 6.07 8.47
218.04 2.01 2.18 School 0.18 0.87 1.46 1.73 2.01 2.28 2.56 3.15 3.84
50 218.37 2.00 7.58 Student -4.38 -1.97 0.08 1.05 2.00 2.96 3.92 5.98 8.38
218.37 2.00 2.18 School 0.17 0.86 1.45 1.73 2.00 2.28 2.55 3.14 3.83
52 219.08 1.91 7.58 Student -4.47 -2.06 -0.01 0.96 1.91 2.87 3.83 5.89 8.29
218.71 2.00 2.18 School 0.17 0.86 1.45 1.73 2.00 2.27 2.55 3.14 3.83
55 220.15 1.78 7.58 Student -4.60 -2.20 -0.14 0.83 1.78 2.73 3.70 5.75 8.16
219.22 1.99 2.18 School 0.16 0.85 1.44 1.72 1.99 2.27 2.54 3.13 3.82
60 221.96 1.55 7.58 Student -4.83 -2.42 -0.37 0.60 1.55 2.50 3.47 5.53 7.93
220.08 1.98 2.18 School 0.15 0.84 1.43 1.71 1.98 2.25 2.53 3.12 3.81
65 223.82 1.32 7.58 Student -5.06 -2.66 -0.60 0.36 1.32 2.27 3.24 5.29 7.70
220.97 1.97 2.18 School 0.14 0.83 1.42 1.70 1.97 2.24 2.52 3.11 3.80
70 225.79 1.07 7.58 Student -5.31 -2.91 -0.85 0.12 1.07 2.02 2.99 5.04 7.45
221.90 1.96 2.18 School 0.13 0.82 1.41 1.68 1.96 2.23 2.51 3.10 3.79
75 227.91 0.80 7.58 Student -5.58 -3.17 -1.12 -0.15 0.80 1.75 2.72 4.78 7.18
222.91 1.95 2.18 School 0.11 0.80 1.39 1.67 1.95 2.22 2.50 3.09 3.78
80 230.28 0.50 7.58 Student -5.88 -3.47 -1.42 -0.45 0.50 1.46 2.42 4.48 6.88
224.04 1.93 2.18 School 0.10 0.79 1.38 1.66 1.93 2.20 2.48 3.07 3.76
85 233.03 0.16 7.58 Student -6.22 -3.82 -1.76 -0.80 0.16 1.11 2.08 4.13 6.54
225.35 1.91 2.18 School 0.08 0.77 1.36 1.64 1.91 2.19 2.47 3.06 3.75
90 236.50 -0.28 7.58 Student -6.66 -4.25 -2.20 -1.23 -0.28 0.67 1.64 3.69 6.10
227.00 1.89 2.18 School 0.06 0.75 1.34 1.62 1.89 2.17 2.44 3.03 3.73
CGI - Conditional Growth Index CGP - Conditional Growth Percentile
362

Table E.3.47: Language Usage Grade 9 From Fall To Winter Conditional Growth Percentile
Conditional Growth
Start Status Growth CGP 20 30 40 45 50 55 60 70 80
%ile RIT Mean SD CGI -0.84 -0.52 -0.25 -0.13 0.00 0.13 0.25 0.52 0.84
10 200.25 3.01 5.50 Student -1.62 0.12 1.61 2.32 3.01 3.70 4.40 5.89 7.64
209.75 1.42 1.24 School 0.37 0.76 1.10 1.26 1.42 1.57 1.73 2.07 2.46
20 206.47 2.44 5.50 Student -2.19 -0.44 1.05 1.75 2.44 3.13 3.83 5.32 7.07
212.71 1.39 1.24 School 0.35 0.74 1.08 1.24 1.39 1.55 1.71 2.05 2.44
25 208.83 2.22 5.50 Student -2.40 -0.66 0.83 1.53 2.22 2.92 3.62 5.11 6.85
213.83 1.39 1.24 School 0.34 0.73 1.07 1.23 1.39 1.54 1.70 2.04 2.43
30 210.96 2.03 5.50 Student -2.60 -0.85 0.64 1.34 2.03 2.72 3.42 4.91 6.66
214.84 1.38 1.24 School 0.33 0.73 1.06 1.22 1.38 1.54 1.69 2.03 2.43
35 212.92 1.85 5.50 Student -2.78 -1.03 0.46 1.16 1.85 2.54 3.24 4.74 6.48
215.78 1.37 1.24 School 0.33 0.72 1.06 1.22 1.37 1.53 1.69 2.03 2.42
40 214.79 1.68 5.50 Student -2.95 -1.20 0.29 0.99 1.68 2.37 3.07 4.56 6.31
216.67 1.37 1.24 School 0.32 0.71 1.05 1.21 1.37 1.52 1.68 2.02 2.41
45 216.60 1.52 5.50 Student -3.11 -1.37 0.12 0.82 1.52 2.21 2.91 4.40 6.14
217.53 1.36 1.24 School 0.31 0.71 1.04 1.20 1.36 1.52 1.67 2.01 2.41
48 217.66 1.42 5.50 Student -3.21 -1.47 0.02 0.73 1.42 2.11 2.81 4.30 6.05
218.04 1.36 1.24 School 0.31 0.70 1.04 1.20 1.36 1.51 1.67 2.01 2.40
50 218.37 1.35 5.50 Student -3.28 -1.53 -0.04 0.66 1.35 2.04 2.75 4.24 5.98
218.37 1.35 1.24 School 0.31 0.70 1.04 1.20 1.35 1.51 1.67 2.01 2.40
52 219.08 1.29 5.50 Student -3.34 -1.60 -0.10 0.60 1.29 1.98 2.68 4.17 5.92
218.71 1.35 1.24 School 0.30 0.70 1.04 1.19 1.35 1.51 1.67 2.00 2.40
55 220.15 1.19 5.50 Student -3.44 -1.69 -0.20 0.50 1.19 1.88 2.58 4.08 5.82
219.22 1.35 1.24 School 0.30 0.69 1.03 1.19 1.35 1.50 1.66 2.00 2.39
60 221.96 1.03 5.50 Student -3.60 -1.86 -0.37 0.34 1.03 1.72 2.42 3.91 5.66
220.08 1.34 1.24 School 0.29 0.69 1.03 1.18 1.34 1.50 1.66 1.99 2.39
65 223.82 0.86 5.50 Student -3.77 -2.03 -0.54 0.16 0.86 1.55 2.25 3.74 5.49
220.97 1.33 1.24 School 0.29 0.68 1.02 1.18 1.33 1.49 1.65 1.99 2.38
70 225.79 0.68 5.50 Student -3.95 -2.21 -0.72 -0.01 0.68 1.37 2.07 3.56 5.31
221.90 1.33 1.24 School 0.28 0.68 1.01 1.17 1.33 1.48 1.64 1.98 2.38
75 227.91 0.48 5.50 Student -4.15 -2.40 -0.91 -0.21 0.48 1.17 1.88 3.37 5.11
222.91 1.32 1.24 School 0.27 0.67 1.01 1.16 1.32 1.48 1.64 1.97 2.37
80 230.28 0.27 5.50 Student -4.36 -2.62 -1.13 -0.42 0.27 0.96 1.66 3.15 4.90
224.04 1.31 1.24 School 0.26 0.66 1.00 1.16 1.31 1.47 1.63 1.96 2.36
85 233.03 0.02 5.50 Student -4.61 -2.87 -1.38 -0.68 0.02 0.71 1.41 2.90 4.64
225.35 1.30 1.24 School 0.26 0.65 0.99 1.15 1.30 1.46 1.62 1.96 2.35
90 236.50 -0.30 5.50 Student -4.93 -3.19 -1.69 -0.99 -0.30 0.39 1.09 2.58 4.33
227.00 1.29 1.24 School 0.24 0.64 0.98 1.13 1.29 1.45 1.61 1.94 2.34
CGI - Conditional Growth Index CGP - Conditional Growth Percentile
363

Table E.3.48: Language Usage Grade 9 From Winter To Spring Conditional Growth Percentile
Conditional Growth
Start Status Growth CGP 20 30 40 45 50 55 60 70 80
%ile RIT Mean SD CGI -0.84 -0.52 -0.25 -0.13 0.00 0.13 0.25 0.52 0.84
10 201.81 1.15 5.07 Student -3.11 -1.50 -0.13 0.52 1.15 1.79 2.44 3.81 5.42
211.02 0.48 0.93 School -0.30 -0.01 0.24 0.36 0.48 0.59 0.71 0.96 1.26
20 207.96 0.98 5.07 Student -3.28 -1.68 -0.30 0.34 0.98 1.62 2.26 3.64 5.25
214.01 0.54 0.93 School -0.24 0.05 0.30 0.42 0.54 0.65 0.77 1.02 1.32
25 210.30 0.92 5.07 Student -3.35 -1.74 -0.37 0.28 0.92 1.55 2.20 3.57 5.18
215.14 0.56 0.93 School -0.22 0.07 0.32 0.44 0.56 0.68 0.79 1.04 1.34
30 212.40 0.86 5.07 Student -3.41 -1.80 -0.43 0.22 0.86 1.49 2.14 3.51 5.12
216.16 0.58 0.93 School -0.20 0.09 0.34 0.46 0.58 0.70 0.81 1.06 1.36
35 214.34 0.80 5.07 Student -3.46 -1.86 -0.48 0.16 0.80 1.44 2.09 3.46 5.07
217.11 0.60 0.93 School -0.18 0.11 0.36 0.48 0.60 0.71 0.83 1.08 1.38
40 216.19 0.75 5.07 Student -3.52 -1.91 -0.53 0.11 0.75 1.39 2.03 3.41 5.01
218.01 0.62 0.93 School -0.16 0.13 0.38 0.50 0.62 0.73 0.85 1.10 1.39
45 217.97 0.70 5.07 Student -3.57 -1.96 -0.58 0.06 0.70 1.34 1.98 3.36 4.96
218.87 0.63 0.93 School -0.15 0.15 0.40 0.52 0.63 0.75 0.87 1.12 1.41
48 219.03 0.67 5.07 Student -3.60 -1.99 -0.61 0.03 0.67 1.31 1.95 3.33 4.93
219.39 0.64 0.93 School -0.14 0.16 0.41 0.53 0.64 0.76 0.88 1.13 1.42
50 219.73 0.65 5.07 Student -3.62 -2.01 -0.63 0.01 0.65 1.29 1.93 3.31 4.91
219.73 0.65 0.93 School -0.13 0.16 0.41 0.53 0.65 0.77 0.88 1.14 1.43
52 220.43 0.63 5.07 Student -3.63 -2.03 -0.65 -0.01 0.63 1.27 1.91 3.29 4.89
220.07 0.66 0.93 School -0.12 0.17 0.42 0.54 0.66 0.77 0.89 1.14 1.44
55 221.48 0.60 5.07 Student -3.66 -2.06 -0.68 -0.04 0.60 1.24 1.88 3.26 4.86
220.58 0.67 0.93 School -0.11 0.18 0.43 0.55 0.67 0.78 0.90 1.15 1.45
60 223.27 0.55 5.07 Student -3.72 -2.11 -0.73 -0.09 0.55 1.19 1.83 3.21 4.81
221.45 0.68 0.93 School -0.10 0.20 0.45 0.57 0.68 0.80 0.92 1.17 1.46
65 225.11 0.50 5.07 Student -3.77 -2.16 -0.79 -0.14 0.50 1.13 1.78 3.15 4.76
222.35 0.70 0.93 School -0.08 0.22 0.47 0.58 0.70 0.82 0.94 1.19 1.48
70 227.06 0.44 5.07 Student -3.82 -2.21 -0.84 -0.19 0.44 1.08 1.73 3.10 4.71
223.29 0.72 0.93 School -0.06 0.23 0.49 0.60 0.72 0.84 0.95 1.21 1.50
75 229.16 0.38 5.07 Student -3.88 -2.27 -0.90 -0.25 0.38 1.02 1.67 3.04 4.65
224.31 0.74 0.93 School -0.04 0.25 0.51 0.62 0.74 0.86 0.97 1.23 1.52
80 231.49 0.32 5.07 Student -3.95 -2.34 -0.97 -0.32 0.32 0.95 1.60 2.98 4.58
225.45 0.76 0.93 School -0.02 0.28 0.53 0.65 0.76 0.88 1.00 1.25 1.54
85 234.22 0.24 5.07 Student -4.02 -2.42 -1.04 -0.40 0.24 0.88 1.52 2.90 4.51
226.77 0.79 0.93 School 0.01 0.30 0.55 0.67 0.79 0.91 1.02 1.27 1.57
90 237.65 0.14 5.07 Student -4.12 -2.51 -1.14 -0.49 0.14 0.78 1.43 2.80 4.41
228.44 0.82 0.93 School 0.04 0.34 0.59 0.71 0.82 0.94 1.06 1.31 1.60
CGI - Conditional Growth Index CGP - Conditional Growth Percentile
364

Table E.3.49: Language Usage Grade 10 From Last Winter To Winter Conditional Growth Percentile
Conditional Growth
Start Status Growth CGP 20 30 40 45 50 55 60 70 80
%ile RIT Mean SD CGI -0.84 -0.52 -0.25 -0.13 0.00 0.13 0.25 0.52 0.84
10 198.85 3.56 6.49 Student -1.90 0.16 1.91 2.74 3.56 4.37 5.20 6.96 9.02
208.61 2.06 1.90 School 0.46 1.06 1.58 1.82 2.06 2.29 2.54 3.05 3.65
20 205.47 2.88 6.49 Student -2.59 -0.53 1.23 2.06 2.88 3.69 4.52 6.28 8.34
211.89 1.89 1.90 School 0.29 0.89 1.41 1.65 1.89 2.13 2.37 2.88 3.49
25 207.99 2.62 6.49 Student -2.85 -0.79 0.97 1.80 2.62 3.43 4.26 6.02 8.08
213.13 1.83 1.90 School 0.23 0.83 1.34 1.59 1.83 2.06 2.31 2.82 3.42
30 210.25 2.38 6.49 Student -3.08 -1.02 0.74 1.57 2.38 3.20 4.03 5.79 7.85
214.25 1.77 1.90 School 0.17 0.77 1.29 1.53 1.77 2.01 2.25 2.76 3.37
35 212.35 2.17 6.49 Student -3.29 -1.24 0.52 1.35 2.17 2.98 3.81 5.57 7.63
215.28 1.72 1.90 School 0.12 0.72 1.23 1.48 1.72 1.95 2.20 2.71 3.31
40 214.34 1.96 6.49 Student -3.50 -1.44 0.32 1.15 1.96 2.78 3.61 5.37 7.42
216.27 1.67 1.90 School 0.07 0.67 1.18 1.43 1.67 1.90 2.15 2.66 3.26
45 216.26 1.76 6.49 Student -3.70 -1.64 0.12 0.95 1.76 2.58 3.41 5.17 7.23
217.22 1.62 1.90 School 0.02 0.62 1.14 1.38 1.62 1.86 2.10 2.61 3.21
48 217.40 1.65 6.49 Student -3.81 -1.76 0.00 0.83 1.65 2.46 3.29 5.05 7.11
217.78 1.59 1.90 School -0.01 0.59 1.11 1.35 1.59 1.83 2.07 2.58 3.19
50 218.15 1.57 6.49 Student -3.89 -1.83 -0.07 0.75 1.57 2.38 3.21 4.97 7.03
218.15 1.57 1.90 School -0.03 0.57 1.09 1.33 1.57 1.81 2.05 2.56 3.17
52 218.91 1.49 6.49 Student -3.97 -1.91 -0.15 0.68 1.49 2.31 3.14 4.89 6.95
218.53 1.55 1.90 School -0.05 0.56 1.07 1.31 1.55 1.79 2.03 2.55 3.15
55 220.05 1.37 6.49 Student -4.09 -2.03 -0.27 0.56 1.37 2.19 3.02 4.78 6.84
219.09 1.52 1.90 School -0.08 0.53 1.04 1.28 1.52 1.76 2.00 2.52 3.12
60 221.97 1.18 6.49 Student -4.29 -2.23 -0.47 0.36 1.18 1.99 2.82 4.58 6.64
220.04 1.47 1.90 School -0.12 0.48 0.99 1.23 1.47 1.71 1.95 2.47 3.07
65 223.96 0.97 6.49 Student -4.49 -2.43 -0.67 0.16 0.97 1.79 2.62 4.37 6.43
221.02 1.42 1.90 School -0.17 0.43 0.94 1.18 1.42 1.66 1.90 2.42 3.02
70 226.05 0.76 6.49 Student -4.71 -2.65 -0.89 -0.06 0.76 1.57 2.40 4.16 6.22
222.06 1.37 1.90 School -0.23 0.37 0.89 1.13 1.37 1.61 1.85 2.37 2.97
75 228.31 0.52 6.49 Student -4.94 -2.88 -1.12 -0.29 0.52 1.34 2.17 3.93 5.98
223.17 1.31 1.90 School -0.28 0.32 0.83 1.07 1.31 1.55 1.79 2.31 2.91
80 230.83 0.26 6.49 Student -5.20 -3.14 -1.38 -0.55 0.26 1.08 1.91 3.67 5.72
224.42 1.25 1.90 School -0.35 0.25 0.77 1.01 1.25 1.49 1.73 2.24 2.85
85 233.77 -0.04 6.49 Student -5.50 -3.44 -1.68 -0.86 -0.04 0.78 1.60 3.36 5.42
225.87 1.18 1.90 School -0.42 0.18 0.69 0.94 1.18 1.41 1.66 2.17 2.77
90 237.46 -0.42 6.49 Student -5.88 -3.82 -2.06 -1.24 -0.42 0.40 1.22 2.98 5.04
227.69 1.08 1.90 School -0.51 0.09 0.60 0.84 1.08 1.32 1.56 2.08 2.68
CGI - Conditional Growth Index CGP - Conditional Growth Percentile
365

Table E.3.50: Language Usage Grade 10 From Last Spring To Spring Conditional Growth Percentile
Conditional Growth
Start Status Growth CGP 20 30 40 45 50 55 60 70 80
%ile RIT Mean SD CGI -0.84 -0.52 -0.25 -0.13 0.00 0.13 0.25 0.52 0.84
10 198.24 4.66 8.17 Student -2.21 0.38 2.59 3.64 4.66 5.69 6.73 8.94 11.54
208.86 2.18 2.47 School 0.10 0.88 1.55 1.87 2.18 2.49 2.81 3.48 4.26
20 205.28 3.55 8.17 Student -3.33 -0.74 1.48 2.52 3.55 4.57 5.62 7.83 10.42
212.25 1.92 2.47 School -0.16 0.62 1.29 1.61 1.92 2.23 2.54 3.21 4.00
25 207.95 3.12 8.17 Student -3.75 -1.16 1.06 2.10 3.12 4.15 5.19 7.41 10.00
213.54 1.82 2.47 School -0.26 0.52 1.19 1.51 1.82 2.13 2.44 3.12 3.90
30 210.35 2.74 8.17 Student -4.13 -1.54 0.68 1.72 2.74 3.77 4.81 7.03 9.62
214.69 1.73 2.47 School -0.35 0.43 1.10 1.42 1.73 2.04 2.36 3.03 3.81
35 212.57 2.39 8.17 Student -4.48 -1.89 0.32 1.37 2.39 3.42 4.46 6.68 9.27
215.76 1.65 2.47 School -0.44 0.35 1.02 1.34 1.65 1.96 2.27 2.94 3.73
40 214.68 2.06 8.17 Student -4.82 -2.22 -0.01 1.03 2.06 3.08 4.13 6.34 8.93
216.78 1.57 2.47 School -0.51 0.27 0.94 1.26 1.57 1.88 2.19 2.86 3.65
45 216.72 1.74 8.17 Student -5.14 -2.55 -0.33 0.71 1.74 2.76 3.80 6.02 8.61
217.76 1.49 2.47 School -0.59 0.19 0.87 1.18 1.49 1.80 2.12 2.79 3.57
48 217.93 1.54 8.17 Student -5.33 -2.74 -0.53 0.52 1.54 2.57 3.61 5.83 8.42
218.34 1.45 2.47 School -0.63 0.15 0.82 1.14 1.45 1.76 2.07 2.74 3.53
50 218.73 1.42 8.17 Student -5.46 -2.87 -0.65 0.39 1.42 2.44 3.49 5.70 8.29
218.73 1.42 2.47 School -0.66 0.12 0.79 1.11 1.42 1.73 2.04 2.71 3.50
52 219.53 1.29 8.17 Student -5.58 -2.99 -0.78 0.26 1.29 2.32 3.36 5.57 8.16
219.11 1.39 2.47 School -0.69 0.09 0.76 1.08 1.39 1.70 2.01 2.68 3.47
55 220.74 1.10 8.17 Student -5.78 -3.18 -0.97 0.07 1.10 2.13 3.17 5.38 7.97
219.70 1.34 2.47 School -0.74 0.05 0.72 1.03 1.34 1.65 1.97 2.64 3.42
60 222.78 0.78 8.17 Student -6.10 -3.51 -1.29 -0.25 0.78 1.80 2.84 5.06 7.65
220.68 1.27 2.47 School -0.82 -0.03 0.64 0.96 1.27 1.58 1.89 2.56 3.35
65 224.89 0.44 8.17 Student -6.43 -3.84 -1.63 -0.58 0.44 1.47 2.51 4.72 7.32
221.69 1.19 2.47 School -0.89 -0.11 0.56 0.88 1.19 1.50 1.81 2.48 3.27
70 227.11 0.09 8.17 Student -6.78 -4.19 -1.98 -0.94 0.09 1.12 2.16 4.37 6.96
222.76 1.11 2.47 School -0.98 -0.19 0.48 0.79 1.11 1.42 1.73 2.40 3.19
75 229.51 -0.29 8.17 Student -7.16 -4.57 -2.36 -1.32 -0.29 0.74 1.78 3.99 6.58
223.92 1.02 2.47 School -1.07 -0.28 0.39 0.71 1.02 1.33 1.64 2.31 3.10
80 232.18 -0.71 8.17 Student -7.59 -5.00 -2.78 -1.74 -0.71 0.31 1.36 3.57 6.16
225.21 0.92 2.47 School -1.16 -0.38 0.29 0.61 0.92 1.23 1.54 2.21 3.00
85 235.30 -1.21 8.17 Student -8.08 -5.49 -3.28 -2.23 -1.21 -0.18 0.86 3.08 5.67
226.71 0.80 2.47 School -1.28 -0.50 0.17 0.49 0.80 1.11 1.43 2.10 2.88
90 239.21 -1.83 8.17 Student -8.70 -6.11 -3.90 -2.85 -1.83 -0.80 0.24 2.46 5.05
228.59 0.66 2.47 School -1.43 -0.64 0.03 0.34 0.66 0.97 1.28 1.95 2.74
CGI - Conditional Growth Index CGP - Conditional Growth Percentile
366

Table E.3.51: Language Usage Grade 10 From Fall To N Fall Conditional Growth Percentile
Conditional Growth
Start Status Growth CGP 20 30 40 45 50 55 60 70 80
%ile RIT Mean SD CGI -0.84 -0.52 -0.25 -0.13 0.00 0.13 0.25 0.52 0.84
10 199.66 0.75 7.41 Student -5.48 -3.13 -1.13 -0.18 0.75 1.68 2.63 4.63 6.98
209.59 1.02 1.88 School -0.57 0.03 0.54 0.78 1.02 1.25 1.49 2.00 2.60
20 206.27 0.86 7.41 Student -5.37 -3.02 -1.01 -0.07 0.86 1.80 2.74 4.75 7.10
212.80 1.04 1.88 School -0.54 0.05 0.56 0.80 1.04 1.28 1.52 2.03 2.62
25 208.79 0.91 7.41 Student -5.32 -2.97 -0.97 -0.02 0.91 1.84 2.78 4.79 7.14
214.01 1.05 1.88 School -0.53 0.06 0.57 0.81 1.05 1.29 1.53 2.04 2.63
30 211.04 0.95 7.41 Student -5.28 -2.94 -0.93 0.02 0.95 1.88 2.82 4.83 7.18
215.11 1.06 1.88 School -0.53 0.07 0.58 0.82 1.06 1.29 1.53 2.04 2.64
35 213.13 0.98 7.41 Student -5.25 -2.90 -0.89 0.05 0.98 1.91 2.86 4.87 7.22
216.12 1.06 1.88 School -0.52 0.08 0.59 0.83 1.06 1.30 1.54 2.05 2.65
40 215.12 1.02 7.41 Student -5.21 -2.86 -0.86 0.09 1.02 1.95 2.89 4.90 7.25
217.08 1.07 1.88 School -0.51 0.09 0.60 0.84 1.07 1.31 1.55 2.06 2.65
45 217.04 1.05 7.41 Student -5.18 -2.83 -0.82 0.12 1.05 1.98 2.93 4.94 7.28
218.01 1.08 1.88 School -0.50 0.09 0.60 0.84 1.08 1.31 1.55 2.06 2.66
48 218.18 1.07 7.41 Student -5.16 -2.81 -0.80 0.14 1.07 2.00 2.95 4.96 7.30
218.56 1.08 1.88 School -0.50 0.10 0.61 0.85 1.08 1.32 1.56 2.07 2.67
50 218.93 1.09 7.41 Student -5.15 -2.80 -0.79 0.15 1.09 2.02 2.96 4.97 7.32
218.93 1.09 1.88 School -0.50 0.10 0.61 0.85 1.09 1.32 1.56 2.07 2.67
52 219.68 1.10 7.41 Student -5.13 -2.78 -0.78 0.17 1.10 2.03 2.97 4.98 7.33
219.29 1.09 1.88 School -0.49 0.10 0.61 0.85 1.09 1.32 1.56 2.07 2.67
55 220.82 1.12 7.41 Student -5.11 -2.77 -0.76 0.19 1.12 2.05 2.99 5.00 7.35
219.84 1.09 1.88 School -0.49 0.11 0.62 0.86 1.09 1.33 1.57 2.08 2.67
60 222.74 1.15 7.41 Student -5.08 -2.73 -0.72 0.22 1.15 2.08 3.03 5.03 7.38
220.78 1.10 1.88 School -0.48 0.11 0.62 0.86 1.10 1.33 1.58 2.08 2.68
65 224.72 1.19 7.41 Student -5.05 -2.70 -0.69 0.26 1.19 2.12 3.06 5.07 7.42
221.74 1.11 1.88 School -0.48 0.12 0.63 0.87 1.11 1.34 1.58 2.09 2.69
70 226.82 1.22 7.41 Student -5.01 -2.66 -0.65 0.29 1.22 2.15 3.10 5.11 7.45
222.75 1.11 1.88 School -0.47 0.13 0.64 0.88 1.11 1.35 1.59 2.10 2.70
75 229.07 1.26 7.41 Student -4.97 -2.62 -0.61 0.33 1.26 2.19 3.14 5.15 7.49
223.84 1.12 1.88 School -0.46 0.14 0.64 0.88 1.12 1.36 1.60 2.11 2.70
80 231.59 1.31 7.41 Student -4.93 -2.58 -0.57 0.37 1.31 2.24 3.18 5.19 7.54
225.06 1.13 1.88 School -0.45 0.14 0.65 0.89 1.13 1.37 1.61 2.12 2.71
85 234.52 1.36 7.41 Student -4.88 -2.53 -0.52 0.43 1.36 2.29 3.23 5.24 7.59
226.48 1.14 1.88 School -0.44 0.15 0.66 0.90 1.14 1.38 1.62 2.13 2.72
90 238.20 1.42 7.41 Student -4.81 -2.46 -0.46 0.49 1.42 2.35 3.30 5.30 7.65
228.27 1.15 1.88 School -0.43 0.17 0.68 0.92 1.15 1.39 1.63 2.14 2.74
CGI - Conditional Growth Index CGP - Conditional Growth Percentile
367

Table E.3.52: Language Usage Grade 10 From Fall To Spring Conditional Growth Percentile
Conditional Growth
Start Status Growth CGP 20 30 40 45 50 55 60 70 80
%ile RIT Mean SD CGI -0.84 -0.52 -0.25 -0.13 0.00 0.13 0.25 0.52 0.84
10 199.66 3.46 8.43 Student -3.64 -0.96 1.32 2.40 3.46 4.52 5.59 7.88 10.55
209.59 1.47 2.51 School -0.65 0.15 0.83 1.15 1.47 1.78 2.10 2.78 3.58
20 206.27 2.69 8.43 Student -4.41 -1.73 0.55 1.63 2.69 3.75 4.82 7.11 9.78
212.80 1.38 2.51 School -0.73 0.06 0.74 1.06 1.38 1.70 2.02 2.70 3.49
25 208.79 2.40 8.43 Student -4.70 -2.03 0.26 1.34 2.40 3.45 4.53 6.82 9.49
214.01 1.35 2.51 School -0.77 0.03 0.71 1.03 1.35 1.66 1.98 2.66 3.46
30 211.04 2.13 8.43 Student -4.96 -2.29 -0.00 1.07 2.13 3.19 4.27 6.55 9.23
215.11 1.32 2.51 School -0.80 0.00 0.68 1.00 1.32 1.63 1.95 2.64 3.43
35 213.13 1.89 8.43 Student -5.21 -2.53 -0.25 0.83 1.89 2.95 4.03 6.31 8.99
216.12 1.29 2.51 School -0.82 -0.03 0.65 0.98 1.29 1.61 1.93 2.61 3.40
40 215.12 1.66 8.43 Student -5.44 -2.76 -0.48 0.60 1.66 2.72 3.79 6.08 8.75
217.08 1.27 2.51 School -0.85 -0.05 0.63 0.95 1.27 1.58 1.90 2.58 3.38
45 217.04 1.44 8.43 Student -5.66 -2.99 -0.70 0.38 1.44 2.49 3.57 5.86 8.53
218.01 1.24 2.51 School -0.87 -0.08 0.60 0.92 1.24 1.56 1.88 2.56 3.35
48 218.18 1.30 8.43 Student -5.79 -3.12 -0.83 0.24 1.30 2.36 3.44 5.72 8.40
218.56 1.23 2.51 School -0.89 -0.09 0.59 0.91 1.23 1.54 1.86 2.54 3.34
50 218.93 1.22 8.43 Student -5.88 -3.21 -0.92 0.16 1.22 2.28 3.35 5.64 8.31
218.93 1.22 2.51 School -0.90 -0.10 0.58 0.90 1.22 1.53 1.85 2.53 3.33
52 219.68 1.13 8.43 Student -5.97 -3.29 -1.01 0.07 1.13 2.19 3.26 5.55 8.22
219.29 1.21 2.51 School -0.91 -0.11 0.57 0.89 1.21 1.52 1.84 2.52 3.32
55 220.82 1.00 8.43 Student -6.10 -3.43 -1.14 -0.06 1.00 2.06 3.13 5.42 8.09
219.84 1.19 2.51 School -0.92 -0.13 0.55 0.88 1.19 1.51 1.83 2.51 3.30
60 222.74 0.77 8.43 Student -6.32 -3.65 -1.36 -0.29 0.77 1.83 2.91 5.19 7.87
220.78 1.17 2.51 School -0.95 -0.15 0.53 0.85 1.17 1.48 1.80 2.48 3.28
65 224.72 0.54 8.43 Student -6.55 -3.88 -1.59 -0.52 0.54 1.60 2.68 4.96 7.64
221.74 1.14 2.51 School -0.97 -0.18 0.50 0.82 1.14 1.46 1.78 2.46 3.25
70 226.82 0.30 8.43 Student -6.80 -4.12 -1.84 -0.76 0.30 1.36 2.43 4.72 7.39
222.75 1.11 2.51 School -1.00 -0.20 0.48 0.80 1.11 1.43 1.75 2.43 3.23
75 229.07 0.04 8.43 Student -7.06 -4.38 -2.10 -1.02 0.04 1.10 2.17 4.46 7.13
223.84 1.08 2.51 School -1.03 -0.23 0.45 0.77 1.08 1.40 1.72 2.40 3.20
80 231.59 -0.26 8.43 Student -7.35 -4.68 -2.39 -1.32 -0.26 0.80 1.88 4.17 6.84
225.06 1.05 2.51 School -1.06 -0.27 0.41 0.74 1.05 1.37 1.69 2.37 3.16
85 234.52 -0.60 8.43 Student -7.69 -5.02 -2.73 -1.66 -0.60 0.46 1.54 3.82 6.50
226.48 1.01 2.51 School -1.10 -0.30 0.38 0.70 1.01 1.33 1.65 2.33 3.13
90 238.20 -1.03 8.43 Student -8.12 -5.45 -3.16 -2.08 -1.03 0.03 1.11 3.40 6.07
228.27 0.96 2.51 School -1.15 -0.35 0.33 0.65 0.96 1.28 1.60 2.28 3.08
CGI - Conditional Growth Index CGP - Conditional Growth Percentile
368

Table E.3.53: Language Usage Grade 10 From Fall To Winter Conditional Growth Percentile
Conditional Growth
Start Status Growth CGP 20 30 40 45 50 55 60 70 80
%ile RIT Mean SD CGI -0.84 -0.52 -0.25 -0.13 0.00 0.13 0.25 0.52 0.84
10 199.66 2.40 5.90 Student -2.56 -0.69 0.91 1.66 2.40 3.14 3.90 5.49 7.36
209.59 0.94 1.44 School -0.27 0.18 0.57 0.76 0.94 1.12 1.30 1.69 2.14
20 206.27 1.85 5.90 Student -3.11 -1.24 0.36 1.11 1.85 2.59 3.34 4.94 6.81
212.80 0.89 1.44 School -0.32 0.13 0.52 0.71 0.89 1.07 1.25 1.64 2.10
25 208.79 1.64 5.90 Student -3.32 -1.45 0.15 0.90 1.64 2.38 3.13 4.73 6.60
214.01 0.87 1.44 School -0.34 0.11 0.50 0.69 0.87 1.05 1.23 1.62 2.08
30 211.04 1.45 5.90 Student -3.51 -1.64 -0.04 0.71 1.45 2.19 2.94 4.54 6.41
215.11 0.85 1.44 School -0.36 0.10 0.49 0.67 0.85 1.03 1.21 1.60 2.06
35 213.13 1.28 5.90 Student -3.69 -1.82 -0.22 0.54 1.28 2.02 2.77 4.37 6.24
216.12 0.84 1.44 School -0.37 0.08 0.47 0.65 0.84 1.02 1.20 1.59 2.04
40 215.12 1.11 5.90 Student -3.85 -1.98 -0.38 0.37 1.11 1.85 2.60 4.20 6.07
217.08 0.82 1.44 School -0.39 0.07 0.46 0.64 0.82 1.00 1.18 1.57 2.03
45 217.04 0.95 5.90 Student -4.01 -2.14 -0.54 0.21 0.95 1.69 2.44 4.04 5.91
218.01 0.81 1.44 School -0.40 0.05 0.44 0.63 0.81 0.99 1.17 1.56 2.01
48 218.18 0.86 5.90 Student -4.11 -2.24 -0.64 0.11 0.86 1.60 2.35 3.95 5.82
218.56 0.80 1.44 School -0.41 0.04 0.43 0.62 0.80 0.98 1.16 1.55 2.01
50 218.93 0.79 5.90 Student -4.17 -2.30 -0.70 0.05 0.79 1.53 2.29 3.88 5.75
218.93 0.79 1.44 School -0.42 0.04 0.43 0.61 0.79 0.97 1.16 1.55 2.00
52 219.68 0.73 5.90 Student -4.23 -2.36 -0.76 -0.01 0.73 1.47 2.22 3.82 5.69
219.29 0.79 1.44 School -0.42 0.03 0.42 0.61 0.79 0.97 1.15 1.54 2.00
55 220.82 0.63 5.90 Student -4.33 -2.46 -0.86 -0.11 0.63 1.38 2.13 3.73 5.60
219.84 0.78 1.44 School -0.43 0.03 0.41 0.60 0.78 0.96 1.14 1.53 1.99
60 222.74 0.47 5.90 Student -4.49 -2.62 -1.02 -0.27 0.47 1.21 1.97 3.57 5.44
220.78 0.76 1.44 School -0.44 0.01 0.40 0.58 0.76 0.94 1.13 1.52 1.97
65 224.72 0.31 5.90 Student -4.65 -2.78 -1.19 -0.43 0.31 1.05 1.80 3.40 5.27
221.74 0.75 1.44 School -0.46 -0.00 0.39 0.57 0.75 0.93 1.11 1.50 1.96
70 226.82 0.13 5.90 Student -4.83 -2.96 -1.36 -0.61 0.13 0.87 1.63 3.23 5.10
222.75 0.73 1.44 School -0.48 -0.02 0.37 0.55 0.73 0.91 1.10 1.49 1.94
75 229.07 -0.05 5.90 Student -5.02 -3.15 -1.55 -0.80 -0.05 0.69 1.44 3.04 4.91
223.84 0.72 1.44 School -0.49 -0.04 0.35 0.54 0.72 0.90 1.08 1.47 1.93
80 231.59 -0.26 5.90 Student -5.23 -3.36 -1.76 -1.01 -0.26 0.48 1.23 2.83 4.70
225.06 0.70 1.44 School -0.51 -0.06 0.33 0.52 0.70 0.88 1.06 1.45 1.91
85 234.52 -0.51 5.90 Student -5.47 -3.60 -2.00 -1.25 -0.51 0.23 0.98 2.58 4.45
226.48 0.68 1.44 School -0.53 -0.08 0.31 0.50 0.68 0.86 1.04 1.43 1.88
90 238.20 -0.82 5.90 Student -5.78 -3.91 -2.31 -1.56 -0.82 -0.08 0.68 2.27 4.14
228.27 0.65 1.44 School -0.56 -0.10 0.28 0.47 0.65 0.83 1.01 1.40 1.86
CGI - Conditional Growth Index CGP - Conditional Growth Percentile
369

Table E.3.54: Language Usage Grade 10 From Winter To Spring Conditional Growth Percentile
Conditional Growth
Start Status Growth CGP 20 30 40 45 50 55 60 70 80
%ile RIT Mean SD CGI -0.84 -0.52 -0.25 -0.13 0.00 0.13 0.25 0.52 0.84
10 200.51 0.65 5.32 Student -3.82 -2.14 -0.70 -0.02 0.65 1.32 2.00 3.44 5.13
210.35 0.26 1.07 School -0.65 -0.30 -0.01 0.12 0.26 0.39 0.53 0.82 1.16
20 207.11 0.57 5.32 Student -3.90 -2.22 -0.77 -0.10 0.57 1.24 1.92 3.36 5.05
213.56 0.32 1.07 School -0.59 -0.25 0.04 0.18 0.32 0.45 0.59 0.88 1.22
25 209.61 0.54 5.32 Student -3.93 -2.25 -0.80 -0.12 0.54 1.21 1.89 3.33 5.02
214.79 0.34 1.07 School -0.57 -0.23 0.06 0.20 0.34 0.47 0.61 0.90 1.24
30 211.86 0.52 5.32 Student -3.96 -2.27 -0.83 -0.15 0.52 1.19 1.86 3.31 4.99
215.88 0.36 1.07 School -0.55 -0.21 0.08 0.22 0.36 0.49 0.63 0.92 1.26
35 213.95 0.49 5.32 Student -3.98 -2.30 -0.86 -0.18 0.49 1.16 1.84 3.28 4.97
216.90 0.37 1.07 School -0.53 -0.19 0.10 0.24 0.37 0.51 0.65 0.94 1.28
40 215.92 0.47 5.32 Student -4.01 -2.32 -0.88 -0.20 0.47 1.14 1.82 3.26 4.94
217.87 0.39 1.07 School -0.51 -0.17 0.12 0.26 0.39 0.53 0.66 0.95 1.30
45 217.84 0.45 5.32 Student -4.03 -2.34 -0.90 -0.22 0.45 1.11 1.79 3.23 4.92
218.80 0.41 1.07 School -0.50 -0.16 0.14 0.27 0.41 0.54 0.68 0.97 1.31
48 218.97 0.43 5.32 Student -4.04 -2.36 -0.91 -0.24 0.43 1.10 1.78 3.22 4.91
219.35 0.42 1.07 School -0.49 -0.15 0.14 0.28 0.42 0.55 0.69 0.98 1.32
50 219.72 0.42 5.32 Student -4.05 -2.37 -0.92 -0.24 0.42 1.09 1.77 3.21 4.90
219.72 0.42 1.07 School -0.48 -0.14 0.15 0.29 0.42 0.56 0.70 0.99 1.33
52 220.47 0.41 5.32 Student -4.06 -2.37 -0.93 -0.25 0.41 1.08 1.76 3.20 4.89
220.09 0.43 1.07 School -0.47 -0.13 0.16 0.29 0.43 0.56 0.70 0.99 1.33
55 221.61 0.40 5.32 Student -4.07 -2.39 -0.95 -0.27 0.40 1.07 1.75 3.19 4.88
220.64 0.44 1.07 School -0.46 -0.12 0.17 0.30 0.44 0.57 0.71 1.00 1.34
60 223.52 0.38 5.32 Student -4.10 -2.41 -0.97 -0.29 0.38 1.05 1.73 3.17 4.85
221.58 0.46 1.07 School -0.45 -0.11 0.18 0.32 0.46 0.59 0.73 1.02 1.36
65 225.50 0.35 5.32 Student -4.12 -2.43 -0.99 -0.31 0.35 1.02 1.70 3.14 4.83
222.54 0.47 1.07 School -0.43 -0.09 0.20 0.34 0.47 0.61 0.75 1.04 1.38
70 227.58 0.33 5.32 Student -4.15 -2.46 -1.02 -0.34 0.33 1.00 1.68 3.12 4.81
223.56 0.49 1.07 School -0.41 -0.07 0.22 0.36 0.49 0.63 0.76 1.05 1.40
75 229.83 0.30 5.32 Student -4.17 -2.49 -1.04 -0.36 0.30 0.97 1.65 3.09 4.78
224.66 0.51 1.07 School -0.39 -0.05 0.24 0.38 0.51 0.65 0.78 1.07 1.41
80 232.34 0.27 5.32 Student -4.20 -2.52 -1.07 -0.39 0.27 0.94 1.62 3.06 4.75
225.88 0.53 1.07 School -0.37 -0.03 0.26 0.40 0.53 0.67 0.80 1.10 1.44
85 235.26 0.24 5.32 Student -4.24 -2.55 -1.11 -0.43 0.24 0.91 1.59 3.03 4.72
227.30 0.56 1.07 School -0.35 -0.01 0.28 0.42 0.56 0.69 0.83 1.12 1.46
90 238.93 0.20 5.32 Student -4.28 -2.59 -1.15 -0.47 0.20 0.86 1.54 2.98 4.67
229.10 0.59 1.07 School -0.32 0.02 0.32 0.45 0.59 0.72 0.86 1.15 1.49
CGI - Conditional Growth Index CGP - Conditional Growth Percentile
370

Appendix E.4 - General Science
Table E.4.1: General Science Grade 3 From Last Winter To Winter Conditional Growth Percentile
Conditional Growth
Start Status Growth CGP 20 30 40 45 50 55 60 70 80
%ile RIT Mean SD CGI -0.84 -0.52 -0.25 -0.13 0.00 0.13 0.25 0.52 0.84
10 168.56 12.25 5.94 Student 7.25 9.14 10.75 11.50 12.25 13.00 13.76 15.36 17.25
177.27 8.88 1.75 School 7.41 7.96 8.44 8.66 8.88 9.10 9.32 9.80 10.35
20 173.98 10.86 5.94 Student 5.86 7.75 9.36 10.11 10.86 11.61 12.36 13.97 15.86
179.71 8.65 1.75 School 7.17 7.73 8.20 8.43 8.65 8.87 9.09 9.56 10.12
25 176.04 10.33 5.94 Student 5.33 7.22 8.83 9.58 10.33 11.08 11.83 13.44 15.33
180.63 8.56 1.75 School 7.08 7.64 8.11 8.34 8.56 8.78 9.00 9.47 10.03
30 177.89 9.86 5.94 Student 4.86 6.74 8.35 9.11 9.86 10.60 11.36 12.97 14.85
181.46 8.48 1.75 School 7.00 7.56 8.03 8.26 8.48 8.70 8.92 9.40 9.95
35 179.61 9.42 5.94 Student 4.42 6.30 7.91 8.67 9.42 10.16 10.92 12.53 14.41
182.23 8.40 1.75 School 6.93 7.48 7.96 8.18 8.40 8.62 8.85 9.32 9.88
40 181.24 9.00 5.94 Student 4.00 5.88 7.49 8.25 9.00 9.74 10.50 12.11 14.00
182.96 8.33 1.75 School 6.86 7.41 7.89 8.11 8.33 8.55 8.78 9.25 9.81
45 182.81 8.59 5.94 Student 3.60 5.48 7.09 7.85 8.59 9.34 10.10 11.71 13.59
183.66 8.26 1.75 School 6.79 7.35 7.82 8.04 8.26 8.48 8.71 9.18 9.74
48 183.74 8.36 5.94 Student 3.36 5.24 6.85 7.61 8.36 9.10 9.86 11.47 13.35
184.08 8.22 1.75 School 6.75 7.31 7.78 8.00 8.22 8.44 8.67 9.14 9.70
50 184.36 8.20 5.94 Student 3.20 5.08 6.69 7.45 8.20 8.94 9.70 11.31 13.19
184.36 8.20 1.75 School 6.72 7.28 7.75 7.98 8.20 8.42 8.64 9.12 9.67
52 184.98 8.04 5.94 Student 3.04 4.92 6.53 7.29 8.04 8.78 9.54 11.15 13.04
184.64 8.17 1.75 School 6.70 7.25 7.73 7.95 8.17 8.39 8.61 9.09 9.64
55 185.91 7.80 5.94 Student 2.80 4.69 6.30 7.05 7.80 8.55 9.30 10.91 12.80
185.05 8.13 1.75 School 6.66 7.21 7.69 7.91 8.13 8.35 8.57 9.05 9.60
60 187.48 7.40 5.94 Student 2.40 4.28 5.89 6.65 7.40 8.14 8.90 10.51 12.39
185.76 8.06 1.75 School 6.59 7.14 7.62 7.84 8.06 8.28 8.51 8.98 9.54
65 189.11 6.98 5.94 Student 1.98 3.86 5.47 6.23 6.98 7.72 8.48 10.09 11.98
186.49 7.99 1.75 School 6.52 7.07 7.55 7.77 7.99 8.21 8.44 8.91 9.47
70 190.83 6.54 5.94 Student 1.54 3.42 5.03 5.79 6.54 7.28 8.04 9.65 11.54
187.26 7.92 1.75 School 6.44 7.00 7.47 7.70 7.92 8.14 8.36 8.84 9.39
75 192.68 6.06 5.94 Student 1.07 2.95 4.56 5.32 6.06 6.81 7.57 9.18 11.06
188.09 7.84 1.75 School 6.36 6.92 7.39 7.62 7.84 8.06 8.28 8.76 9.31
80 194.74 5.53 5.94 Student 0.54 2.42 4.03 4.79 5.53 6.28 7.04 8.65 10.53
189.01 7.75 1.75 School 6.27 6.83 7.30 7.53 7.75 7.97 8.19 8.67 9.22
85 197.14 4.92 5.94 Student -0.08 1.81 3.41 4.17 4.92 5.66 6.42 8.03 9.92
190.09 7.64 1.75 School 6.17 6.73 7.20 7.42 7.64 7.87 8.09 8.56 9.12
90 200.16 4.14 5.94 Student -0.85 1.03 2.64 3.40 4.14 4.89 5.65 7.26 9.14
191.45 7.51 1.75 School 6.04 6.60 7.07 7.29 7.51 7.73 7.96 8.43 8.99
CGI - Conditional Growth Index CGP - Conditional Growth Percentile
371

Table E.4.2: General Science Grade 3 From Last Spring To Spring Conditional Growth Percentile
Conditional Growth
Start Status Growth CGP 20 30 40 45 50 55 60 70 80
%ile RIT Mean SD CGI -0.84 -0.52 -0.25 -0.13 0.00 0.13 0.25 0.52 0.84
10 171.32 12.56 6.32 Student 7.24 9.24 10.96 11.76 12.56 13.35 14.16 15.87 17.88
180.54 8.58 2.15 School 6.77 7.45 8.03 8.31 8.58 8.85 9.12 9.70 10.38
20 177.06 10.78 6.32 Student 5.46 7.47 9.18 9.99 10.78 11.57 12.38 14.09 16.10
183.12 8.16 2.15 School 6.36 7.04 7.62 7.89 8.16 8.43 8.71 9.29 9.97
25 179.25 10.10 6.32 Student 4.79 6.79 8.50 9.31 10.10 10.90 11.70 13.42 15.42
184.10 8.01 2.15 School 6.20 6.88 7.46 7.74 8.01 8.28 8.55 9.13 9.81
30 181.21 9.50 6.32 Student 4.18 6.18 7.90 8.70 9.50 10.29 11.10 12.81 14.81
184.98 7.87 2.15 School 6.06 6.74 7.32 7.60 7.87 8.14 8.41 8.99 9.67
35 183.02 8.93 6.32 Student 3.62 5.62 7.33 8.14 8.93 9.73 10.54 12.25 14.25
185.80 7.74 2.15 School 5.93 6.61 7.19 7.47 7.74 8.01 8.28 8.86 9.54
40 184.75 8.40 6.32 Student 3.08 5.09 6.80 7.61 8.40 9.19 10.00 11.71 13.72
186.57 7.61 2.15 School 5.81 6.49 7.07 7.34 7.61 7.88 8.16 8.74 9.42
45 186.42 7.88 6.32 Student 2.57 4.57 6.28 7.09 7.88 8.68 9.49 11.20 13.20
187.32 7.49 2.15 School 5.69 6.37 6.95 7.22 7.49 7.76 8.04 8.62 9.30
48 187.40 7.58 6.32 Student 2.26 4.27 5.98 6.78 7.58 8.37 9.18 10.89 12.90
187.76 7.42 2.15 School 5.62 6.30 6.88 7.15 7.42 7.69 7.97 8.55 9.23
50 188.06 7.38 6.32 Student 2.06 4.06 5.78 6.58 7.38 8.17 8.98 10.69 12.69
188.06 7.38 2.15 School 5.57 6.25 6.83 7.11 7.38 7.65 7.92 8.50 9.18
52 188.71 7.17 6.32 Student 1.86 3.86 5.57 6.38 7.17 7.97 8.77 10.49 12.49
188.35 7.33 2.15 School 5.52 6.20 6.79 7.06 7.33 7.60 7.87 8.45 9.13
55 189.70 6.87 6.32 Student 1.55 3.55 5.27 6.07 6.87 7.66 8.47 10.18 12.19
188.79 7.26 2.15 School 5.45 6.13 6.71 6.99 7.26 7.53 7.80 8.38 9.06
60 191.37 6.35 6.32 Student 1.03 3.04 4.75 5.56 6.35 7.15 7.95 9.67 11.67
189.54 7.14 2.15 School 5.33 6.01 6.60 6.87 7.14 7.41 7.68 8.26 8.94
65 193.09 5.82 6.32 Student 0.50 2.50 4.22 5.02 5.82 6.61 7.42 9.13 11.14
190.32 7.02 2.15 School 5.21 5.89 6.47 6.75 7.02 7.28 7.56 8.14 8.82
70 194.91 5.26 6.32 Student -0.06 1.94 3.65 4.46 5.26 6.05 6.86 8.57 10.57
191.13 6.88 2.15 School 5.08 5.76 6.34 6.62 6.88 7.15 7.43 8.01 8.69
75 196.87 4.65 6.32 Student -0.67 1.33 3.05 3.85 4.65 5.44 6.25 7.96 9.97
192.01 6.74 2.15 School 4.94 5.62 6.20 6.47 6.74 7.01 7.29 7.87 8.55
80 199.05 3.97 6.32 Student -1.35 0.66 2.37 3.18 3.97 4.77 5.57 7.29 9.29
192.99 6.59 2.15 School 4.78 5.46 6.04 6.32 6.59 6.86 7.13 7.71 8.39
85 201.60 3.19 6.32 Student -2.13 -0.13 1.58 2.39 3.19 3.98 4.79 6.50 8.50
194.13 6.41 2.15 School 4.60 5.28 5.86 6.14 6.41 6.67 6.95 7.53 8.21
90 204.80 2.19 6.32 Student -3.12 -1.12 0.59 1.40 2.19 2.99 3.79 5.51 7.51
195.57 6.18 2.15 School 4.37 5.05 5.63 5.91 6.18 6.45 6.72 7.30 7.98
CGI - Conditional Growth Index CGP - Conditional Growth Percentile
372

Table E.4.3: General Science Grade 3 From Fall To N Fall Conditional Growth Percentile
Conditional Growth
Start Status Growth CGP 20 30 40 45 50 55 60 70 80
%ile RIT Mean SD CGI -0.84 -0.52 -0.25 -0.13 0.00 0.13 0.25 0.52 0.84
10 172.43 11.89 7.30 Student 5.74 8.06 10.04 10.97 11.89 12.81 13.74 15.72 18.03
180.50 8.45 1.95 School 6.81 7.43 7.96 8.21 8.45 8.70 8.95 9.48 10.10
20 177.60 10.64 7.30 Student 4.49 6.81 8.79 9.72 10.64 11.56 12.49 14.47 16.79
182.90 8.38 1.95 School 6.74 7.36 7.89 8.14 8.38 8.63 8.88 9.41 10.03
25 179.56 10.17 7.30 Student 4.02 6.34 8.32 9.25 10.17 11.08 12.02 13.99 16.31
183.81 8.36 1.95 School 6.71 7.33 7.86 8.11 8.36 8.60 8.85 9.38 10.00
30 181.32 9.74 7.30 Student 3.59 5.91 7.89 8.82 9.74 10.66 11.59 13.57 15.89
184.62 8.33 1.95 School 6.69 7.31 7.84 8.09 8.33 8.58 8.83 9.36 9.98
35 182.95 9.34 7.30 Student 3.20 5.51 7.49 8.43 9.34 10.26 11.19 13.17 15.49
185.38 8.31 1.95 School 6.67 7.29 7.82 8.07 8.31 8.56 8.81 9.34 9.96
40 184.50 8.97 7.30 Student 2.82 5.14 7.12 8.05 8.97 9.89 10.82 12.80 15.12
186.10 8.29 1.95 School 6.65 7.27 7.80 8.05 8.29 8.54 8.79 9.32 9.94
45 186.00 8.61 7.30 Student 2.46 4.78 6.76 7.69 8.61 9.53 10.46 12.44 14.75
186.79 8.27 1.95 School 6.63 7.25 7.78 8.03 8.27 8.52 8.77 9.30 9.92
48 186.89 8.39 7.30 Student 2.25 4.56 6.54 7.48 8.39 9.31 10.24 12.22 14.54
187.20 8.26 1.95 School 6.61 7.23 7.76 8.01 8.26 8.50 8.75 9.28 9.90
50 187.47 8.25 7.30 Student 2.10 4.42 6.40 7.33 8.25 9.17 10.10 12.08 14.40
187.47 8.25 1.95 School 6.61 7.23 7.76 8.01 8.25 8.50 8.75 9.28 9.90
52 188.06 8.11 7.30 Student 1.96 4.28 6.26 7.19 8.11 9.03 9.96 11.94 14.25
187.75 8.24 1.95 School 6.60 7.22 7.75 8.00 8.24 8.49 8.74 9.27 9.89
55 188.95 7.89 7.30 Student 1.75 4.06 6.04 6.98 7.89 8.81 9.74 11.72 14.04
188.16 8.23 1.95 School 6.59 7.21 7.74 7.99 8.23 8.48 8.73 9.26 9.88
60 190.45 7.53 7.30 Student 1.39 3.70 5.68 6.61 7.53 8.45 9.38 11.36 13.68
188.85 8.21 1.95 School 6.57 7.19 7.72 7.97 8.21 8.46 8.71 9.24 9.86
65 192.00 7.16 7.30 Student 1.01 3.33 5.31 6.24 7.16 8.08 9.01 10.99 13.30
189.57 8.19 1.95 School 6.55 7.17 7.70 7.94 8.19 8.44 8.69 9.22 9.84
70 193.63 6.76 7.30 Student 0.62 2.93 4.91 5.85 6.76 7.68 8.61 10.59 12.91
190.33 8.17 1.95 School 6.52 7.14 7.67 7.92 8.17 8.41 8.66 9.19 9.81
75 195.39 6.34 7.30 Student 0.19 2.51 4.49 5.42 6.34 7.25 8.19 10.17 12.48
191.14 8.14 1.95 School 6.50 7.12 7.65 7.90 8.14 8.39 8.64 9.17 9.79
80 197.35 5.86 7.30 Student -0.28 2.03 4.01 4.94 5.86 6.78 7.71 9.69 12.01
192.05 8.12 1.95 School 6.47 7.09 7.62 7.87 8.12 8.36 8.61 9.14 9.76
85 199.64 5.31 7.30 Student -0.84 1.48 3.46 4.39 5.31 6.23 7.16 9.14 11.46
193.11 8.09 1.95 School 6.44 7.06 7.59 7.84 8.09 8.33 8.58 9.11 9.73
90 202.52 4.61 7.30 Student -1.53 0.78 2.76 3.70 4.61 5.53 6.46 8.44 10.76
194.45 8.05 1.95 School 6.40 7.02 7.55 7.80 8.05 8.29 8.54 9.07 9.69
CGI - Conditional Growth Index CGP - Conditional Growth Percentile
373

Table E.4.4: General Science Grade 3 From Fall To Spring Conditional Growth Percentile
Conditional Growth
Start Status Growth CGP 20 30 40 45 50 55 60 70 80
%ile RIT Mean SD CGI -0.84 -0.52 -0.25 -0.13 0.00 0.13 0.25 0.52 0.84
10 172.43 12.37 7.25 Student 6.27 8.57 10.54 11.46 12.37 13.28 14.21 16.17 18.47
180.50 8.59 2.10 School 6.82 7.49 8.06 8.33 8.59 8.86 9.13 9.70 10.36
20 177.60 10.86 7.25 Student 4.76 7.06 9.02 9.95 10.86 11.77 12.69 14.66 16.96
182.90 8.38 2.10 School 6.61 7.27 7.84 8.11 8.38 8.64 8.91 9.48 10.15
25 179.56 10.28 7.25 Student 4.18 6.48 8.45 9.37 10.28 11.19 12.12 14.08 16.38
183.81 8.29 2.10 School 6.52 7.19 7.76 8.03 8.29 8.56 8.83 9.40 10.06
30 181.32 9.77 7.25 Student 3.67 5.96 7.93 8.85 9.77 10.68 11.60 13.57 15.86
184.62 8.22 2.10 School 6.45 7.12 7.69 7.95 8.22 8.48 8.75 9.32 9.99
35 182.95 9.29 7.25 Student 3.19 5.49 7.45 8.38 9.29 10.20 11.12 13.09 15.39
185.38 8.15 2.10 School 6.38 7.05 7.62 7.89 8.15 8.41 8.68 9.25 9.92
40 184.50 8.83 7.25 Student 2.73 5.03 7.00 7.92 8.83 9.74 10.67 12.63 14.93
186.10 8.08 2.10 School 6.31 6.98 7.55 7.82 8.08 8.35 8.62 9.19 9.86
45 186.00 8.39 7.25 Student 2.29 4.59 6.56 7.48 8.39 9.30 10.23 12.19 14.49
186.79 8.02 2.10 School 6.25 6.92 7.49 7.76 8.02 8.29 8.55 9.12 9.79
48 186.89 8.13 7.25 Student 2.03 4.33 6.30 7.22 8.13 9.04 9.97 11.93 14.23
187.20 7.98 2.10 School 6.21 6.88 7.45 7.72 7.98 8.25 8.52 9.09 9.75
50 187.47 7.96 7.25 Student 1.86 4.16 6.12 7.05 7.96 8.87 9.80 11.76 14.06
187.47 7.96 2.10 School 6.19 6.86 7.43 7.69 7.96 8.22 8.49 9.06 9.73
52 188.06 7.79 7.25 Student 1.69 3.99 5.95 6.88 7.79 8.70 9.62 11.59 13.89
187.75 7.93 2.10 School 6.16 6.83 7.40 7.67 7.93 8.20 8.47 9.04 9.70
55 188.95 7.53 7.25 Student 1.43 3.73 5.69 6.62 7.53 8.44 9.36 11.33 13.63
188.16 7.90 2.10 School 6.13 6.79 7.36 7.63 7.90 8.16 8.43 9.00 9.67
60 190.45 7.09 7.25 Student 0.99 3.29 5.25 6.18 7.09 8.00 8.92 10.89 13.19
188.85 7.83 2.10 School 6.06 6.73 7.30 7.57 7.83 8.10 8.37 8.94 9.60
65 192.00 6.63 7.25 Student 0.53 2.83 4.80 5.72 6.63 7.54 8.47 10.43 12.73
189.57 7.77 2.10 School 6.00 6.67 7.24 7.50 7.77 8.03 8.30 8.87 9.54
70 193.63 6.15 7.25 Student 0.05 2.35 4.32 5.24 6.15 7.06 7.99 9.95 12.25
190.33 7.70 2.10 School 5.93 6.60 7.17 7.43 7.70 7.96 8.23 8.80 9.47
75 195.39 5.64 7.25 Student -0.46 1.84 3.80 4.73 5.64 6.55 7.47 9.44 11.74
191.14 7.62 2.10 School 5.85 6.52 7.09 7.36 7.62 7.89 8.16 8.73 9.40
80 197.35 5.06 7.25 Student -1.04 1.26 3.22 4.15 5.06 5.97 6.90 8.86 11.16
192.05 7.54 2.10 School 5.77 6.44 7.01 7.28 7.54 7.81 8.07 8.65 9.31
85 199.64 4.39 7.25 Student -1.71 0.59 2.55 3.48 4.39 5.30 6.23 8.19 10.49
193.11 7.45 2.10 School 5.68 6.34 6.91 7.18 7.45 7.71 7.98 8.55 9.22
90 202.52 3.55 7.25 Student -2.55 -0.25 1.71 2.64 3.55 4.46 5.38 7.35 9.65
194.45 7.32 2.10 School 5.55 6.22 6.79 7.06 7.32 7.59 7.86 8.43 9.09
CGI - Conditional Growth Index CGP - Conditional Growth Percentile
374

Table E.4.5: General Science Grade 3 From Fall To Winter Conditional Growth Percentile
Conditional Growth
Start Status Growth CGP 20 30 40 45 50 55 60 70 80
%ile RIT Mean SD CGI -0.84 -0.52 -0.25 -0.13 0.00 0.13 0.25 0.52 0.84
10 172.43 8.24 5.78 Student 3.38 5.21 6.78 7.52 8.24 8.97 9.71 11.27 13.11
180.50 5.44 1.20 School 4.43 4.81 5.14 5.29 5.44 5.60 5.75 6.08 6.46
20 177.60 7.16 5.78 Student 2.30 4.13 5.69 6.43 7.16 7.88 8.62 10.19 12.02
182.90 5.32 1.20 School 4.31 4.69 5.02 5.17 5.32 5.47 5.62 5.95 6.33
25 179.56 6.75 5.78 Student 1.88 3.72 5.28 6.02 6.75 7.47 8.21 9.78 11.61
183.81 5.27 1.20 School 4.26 4.64 4.97 5.12 5.27 5.42 5.58 5.90 6.29
30 181.32 6.38 5.78 Student 1.51 3.35 4.91 5.65 6.38 7.10 7.84 9.41 11.24
184.62 5.23 1.20 School 4.22 4.60 4.93 5.08 5.23 5.38 5.54 5.86 6.24
35 182.95 6.03 5.78 Student 1.17 3.00 4.57 5.31 6.03 6.76 7.50 9.06 10.89
185.38 5.19 1.20 School 4.18 4.56 4.89 5.04 5.19 5.34 5.50 5.82 6.20
40 184.50 5.71 5.78 Student 0.84 2.68 4.24 4.98 5.71 6.43 7.17 8.74 10.57
186.10 5.15 1.20 School 4.14 4.52 4.85 5.00 5.15 5.30 5.46 5.78 6.17
45 186.00 5.39 5.78 Student 0.53 2.36 3.93 4.67 5.39 6.12 6.86 8.42 10.25
186.79 5.12 1.20 School 4.10 4.49 4.81 4.97 5.12 5.27 5.42 5.75 6.13
48 186.89 5.21 5.78 Student 0.34 2.18 3.74 4.48 5.21 5.93 6.67 8.23 10.07
187.20 5.10 1.20 School 4.08 4.47 4.79 4.94 5.10 5.25 5.40 5.73 6.11
50 187.47 5.08 5.78 Student 0.22 2.05 3.62 4.36 5.08 5.81 6.55 8.11 9.94
187.47 5.08 1.20 School 4.07 4.45 4.78 4.93 5.08 5.23 5.39 5.71 6.09
52 188.06 4.96 5.78 Student 0.10 1.93 3.49 4.23 4.96 5.68 6.42 7.99 9.82
187.75 5.07 1.20 School 4.06 4.44 4.76 4.92 5.07 5.22 5.37 5.70 6.08
55 188.95 4.77 5.78 Student -0.09 1.74 3.31 4.05 4.77 5.50 6.24 7.80 9.63
188.16 5.05 1.20 School 4.03 4.42 4.74 4.89 5.05 5.20 5.35 5.68 6.06
60 190.45 4.46 5.78 Student -0.41 1.43 2.99 3.73 4.46 5.18 5.92 7.49 9.32
188.85 5.01 1.20 School 4.00 4.38 4.71 4.86 5.01 5.16 5.31 5.64 6.02
65 192.00 4.13 5.78 Student -0.73 1.10 2.67 3.40 4.13 4.86 5.59 7.16 8.99
189.57 4.97 1.20 School 3.96 4.34 4.67 4.82 4.97 5.12 5.28 5.60 5.98
70 193.63 3.79 5.78 Student -1.07 0.76 2.32 3.06 3.79 4.51 5.25 6.82 8.65
190.33 4.93 1.20 School 3.92 4.30 4.63 4.78 4.93 5.08 5.24 5.56 5.95
75 195.39 3.42 5.78 Student -1.44 0.39 1.95 2.69 3.42 4.14 4.88 6.45 8.28
191.14 4.89 1.20 School 3.88 4.26 4.59 4.74 4.89 5.04 5.20 5.52 5.90
80 197.35 3.00 5.78 Student -1.86 -0.02 1.54 2.28 3.00 3.73 4.47 6.03 7.87
192.05 4.84 1.20 School 3.83 4.21 4.54 4.69 4.84 4.99 5.15 5.47 5.86
85 199.64 2.52 5.78 Student -2.34 -0.51 1.06 1.80 2.52 3.25 3.99 5.55 7.39
193.11 4.79 1.20 School 3.78 4.16 4.48 4.64 4.79 4.94 5.09 5.42 5.80
90 202.52 1.92 5.78 Student -2.94 -1.11 0.46 1.19 1.92 2.65 3.38 4.95 6.78
194.45 4.72 1.20 School 3.71 4.09 4.41 4.57 4.72 4.87 5.02 5.35 5.73
CGI - Conditional Growth Index CGP - Conditional Growth Percentile
375

Table E.4.6: General Science Grade 3 From Winter To Spring Conditional Growth Percentile
Conditional Growth
Start Status Growth CGP 20 30 40 45 50 55 60 70 80
%ile RIT Mean SD CGI -0.84 -0.52 -0.25 -0.13 0.00 0.13 0.25 0.52 0.84
10 178.56 4.76 5.66 Student 0.00 1.80 3.33 4.05 4.76 5.48 6.20 7.73 9.53
185.77 2.88 0.93 School 2.10 2.39 2.65 2.76 2.88 3.00 3.12 3.37 3.66
20 183.36 4.12 5.66 Student -0.64 1.15 2.68 3.41 4.12 4.83 5.55 7.08 8.88
188.10 2.88 0.93 School 2.10 2.39 2.64 2.76 2.88 3.00 3.11 3.37 3.66
25 185.19 3.87 5.66 Student -0.89 0.90 2.44 3.16 3.87 4.58 5.30 6.84 8.63
188.98 2.88 0.93 School 2.10 2.39 2.64 2.76 2.88 3.00 3.11 3.37 3.66
30 186.83 3.65 5.66 Student -1.11 0.68 2.22 2.94 3.65 4.36 5.08 6.62 8.41
189.78 2.88 0.93 School 2.10 2.39 2.64 2.76 2.88 3.00 3.11 3.37 3.66
35 188.35 3.44 5.66 Student -1.32 0.48 2.01 2.73 3.44 4.16 4.88 6.41 8.21
190.52 2.88 0.93 School 2.10 2.39 2.64 2.76 2.88 3.00 3.11 3.36 3.66
40 189.79 3.25 5.66 Student -1.51 0.28 1.82 2.54 3.25 3.96 4.68 6.22 8.01
191.21 2.88 0.93 School 2.10 2.39 2.64 2.76 2.88 2.99 3.11 3.36 3.66
45 191.18 3.06 5.66 Student -1.70 0.10 1.63 2.35 3.06 3.77 4.50 6.03 7.82
191.89 2.88 0.93 School 2.10 2.39 2.64 2.76 2.88 2.99 3.11 3.36 3.66
48 192.01 2.95 5.66 Student -1.81 -0.02 1.52 2.24 2.95 3.66 4.38 5.92 7.71
192.29 2.88 0.93 School 2.10 2.39 2.64 2.76 2.88 2.99 3.11 3.36 3.66
50 192.56 2.88 5.66 Student -1.88 -0.09 1.44 2.17 2.88 3.59 4.31 5.84 7.64
192.56 2.88 0.93 School 2.10 2.39 2.64 2.76 2.88 2.99 3.11 3.36 3.66
52 193.10 2.80 5.66 Student -1.96 -0.16 1.37 2.09 2.80 3.51 4.24 5.77 7.57
192.82 2.88 0.93 School 2.10 2.39 2.64 2.76 2.88 2.99 3.11 3.36 3.66
55 193.93 2.69 5.66 Student -2.07 -0.27 1.26 1.98 2.69 3.40 4.13 5.66 7.45
193.22 2.88 0.93 School 2.10 2.39 2.64 2.76 2.88 2.99 3.11 3.36 3.66
60 195.32 2.50 5.66 Student -2.26 -0.46 1.07 1.79 2.50 3.22 3.94 5.47 7.27
193.90 2.88 0.93 School 2.10 2.39 2.64 2.76 2.88 2.99 3.11 3.36 3.66
65 196.76 2.31 5.66 Student -2.45 -0.66 0.88 1.60 2.31 3.02 3.74 5.28 7.07
194.60 2.88 0.93 School 2.10 2.39 2.64 2.76 2.88 2.99 3.11 3.36 3.66
70 198.28 2.11 5.66 Student -2.66 -0.86 0.67 1.39 2.11 2.82 3.54 5.07 6.87
195.33 2.88 0.93 School 2.10 2.39 2.64 2.76 2.88 2.99 3.11 3.36 3.66
75 199.92 1.88 5.66 Student -2.88 -1.08 0.45 1.17 1.88 2.60 3.32 4.85 6.65
196.13 2.88 0.93 School 2.10 2.39 2.64 2.76 2.88 2.99 3.11 3.36 3.66
80 201.75 1.64 5.66 Student -3.12 -1.33 0.20 0.93 1.64 2.35 3.07 4.61 6.40
197.01 2.88 0.93 School 2.10 2.39 2.64 2.76 2.88 2.99 3.11 3.36 3.66
85 203.88 1.35 5.66 Student -3.41 -1.62 -0.08 0.64 1.35 2.06 2.78 4.32 6.11
198.04 2.88 0.93 School 2.09 2.39 2.64 2.76 2.88 2.99 3.11 3.36 3.66
90 206.55 0.99 5.66 Student -3.77 -1.98 -0.44 0.28 0.99 1.70 2.42 3.96 5.75
199.34 2.87 0.93 School 2.09 2.39 2.64 2.76 2.87 2.99 3.11 3.36 3.65
CGI - Conditional Growth Index CGP - Conditional Growth Percentile
376

Table E.4.7: General Science Grade 4 From Last Winter To Winter Conditional Growth Percentile
Conditional Growth
Start Status Growth CGP 20 30 40 45 50 55 60 70 80
%ile RIT Mean SD CGI -0.84 -0.52 -0.25 -0.13 0.00 0.13 0.25 0.52 0.84
10 177.92 9.29 5.89 Student 4.33 6.20 7.79 8.55 9.29 10.03 10.78 12.37 14.24
185.78 6.69 1.65 School 5.30 5.82 6.27 6.48 6.69 6.90 7.11 7.55 8.07
20 182.88 8.28 5.89 Student 3.32 5.19 6.79 7.54 8.28 9.02 9.77 11.37 13.23
188.04 6.57 1.65 School 5.19 5.71 6.15 6.36 6.57 6.78 6.99 7.44 7.96
25 184.77 7.89 5.89 Student 2.94 4.81 6.40 7.15 7.89 8.63 9.39 10.98 12.85
188.91 6.53 1.65 School 5.14 5.66 6.11 6.32 6.53 6.73 6.94 7.39 7.91
30 186.46 7.55 5.89 Student 2.59 4.46 6.06 6.81 7.55 8.29 9.04 10.64 12.51
189.68 6.49 1.65 School 5.10 5.62 6.07 6.28 6.49 6.69 6.90 7.35 7.87
35 188.03 7.23 5.89 Student 2.28 4.14 5.74 6.49 7.23 7.97 8.72 10.32 12.19
190.40 6.45 1.65 School 5.06 5.59 6.03 6.24 6.45 6.66 6.87 7.31 7.84
40 189.52 6.93 5.89 Student 1.97 3.84 5.44 6.19 6.93 7.67 8.42 10.02 11.88
191.08 6.42 1.65 School 5.03 5.55 6.00 6.21 6.42 6.62 6.83 7.28 7.80
45 190.96 6.64 5.89 Student 1.68 3.55 5.14 5.90 6.64 7.38 8.13 9.72 11.59
191.73 6.38 1.65 School 5.00 5.52 5.96 6.17 6.38 6.59 6.80 7.25 7.77
48 191.81 6.46 5.89 Student 1.51 3.38 4.97 5.72 6.46 7.20 7.96 9.55 11.42
192.12 6.36 1.65 School 4.98 5.50 5.94 6.15 6.36 6.57 6.78 7.23 7.75
50 192.38 6.35 5.89 Student 1.39 3.26 4.86 5.61 6.35 7.09 7.84 9.44 11.30
192.38 6.35 1.65 School 4.96 5.48 5.93 6.14 6.35 6.56 6.77 7.21 7.73
52 192.95 6.23 5.89 Student 1.28 3.15 4.74 5.49 6.23 6.97 7.73 9.32 11.19
192.64 6.34 1.65 School 4.95 5.47 5.92 6.13 6.34 6.54 6.75 7.20 7.72
55 193.80 6.06 5.89 Student 1.10 2.97 4.57 5.32 6.06 6.80 7.55 9.15 11.02
193.03 6.32 1.65 School 4.93 5.45 5.90 6.11 6.32 6.52 6.73 7.18 7.70
60 195.24 5.77 5.89 Student 0.81 2.68 4.28 5.03 5.77 6.51 7.26 8.86 10.72
193.69 6.28 1.65 School 4.89 5.42 5.86 6.07 6.28 6.49 6.70 7.14 7.67
65 196.73 5.47 5.89 Student 0.51 2.38 3.97 4.73 5.47 6.21 6.96 8.55 10.42
194.37 6.25 1.65 School 4.86 5.38 5.83 6.04 6.25 6.45 6.66 7.11 7.63
70 198.30 5.15 5.89 Student 0.19 2.06 3.65 4.41 5.15 5.89 6.64 8.23 10.10
195.08 6.21 1.65 School 4.82 5.35 5.79 6.00 6.21 6.42 6.63 7.07 7.60
75 199.99 4.80 5.89 Student -0.15 1.71 3.31 4.06 4.80 5.54 6.29 7.89 9.76
195.86 6.17 1.65 School 4.78 5.31 5.75 5.96 6.17 6.38 6.59 7.03 7.56
80 201.88 4.42 5.89 Student -0.54 1.33 2.93 3.68 4.42 5.16 5.91 7.51 9.38
196.72 6.13 1.65 School 4.74 5.26 5.71 5.92 6.13 6.33 6.54 6.99 7.51
85 204.08 3.97 5.89 Student -0.98 0.89 2.48 3.23 3.97 4.71 5.46 7.06 8.93
197.72 6.07 1.65 School 4.69 5.21 5.66 5.87 6.07 6.28 6.49 6.94 7.46
90 206.84 3.41 5.89 Student -1.54 0.32 1.92 2.67 3.41 4.15 4.90 6.50 8.37
198.98 6.01 1.65 School 4.62 5.14 5.59 5.80 6.01 6.22 6.43 6.87 7.39
CGI - Conditional Growth Index CGP - Conditional Growth Percentile
377

Table E.4.8: General Science Grade 4 From Last Spring To Spring Conditional Growth Percentile
Conditional Growth
Start Status Growth CGP 20 30 40 45 50 55 60 70 80
%ile RIT Mean SD CGI -0.84 -0.52 -0.25 -0.13 0.00 0.13 0.25 0.52 0.84
10 180.17 9.36 6.26 Student 4.08 6.07 7.77 8.57 9.36 10.14 10.94 12.64 14.63
188.20 6.53 2.12 School 4.74 5.42 5.99 6.26 6.53 6.79 7.06 7.64 8.31
20 185.30 8.16 6.26 Student 2.89 4.88 6.58 7.38 8.16 8.95 9.75 11.45 13.43
190.57 6.30 2.12 School 4.52 5.19 5.77 6.04 6.30 6.57 6.84 7.41 8.09
25 187.25 7.71 6.26 Student 2.44 4.43 6.12 6.92 7.71 8.50 9.30 10.99 12.98
191.47 6.22 2.12 School 4.44 5.11 5.68 5.96 6.22 6.49 6.76 7.33 8.00
30 189.00 7.30 6.26 Student 2.03 4.02 5.72 6.52 7.30 8.09 8.89 10.59 12.57
192.28 6.15 2.12 School 4.36 5.04 5.61 5.88 6.15 6.41 6.68 7.26 7.93
35 190.62 6.93 6.26 Student 1.66 3.64 5.34 6.14 6.93 7.71 8.51 10.21 12.20
193.03 6.08 2.12 School 4.29 4.97 5.54 5.81 6.08 6.34 6.61 7.19 7.86
40 192.16 6.57 6.26 Student 1.30 3.29 4.98 5.78 6.57 7.36 8.16 9.85 11.84
193.75 6.01 2.12 School 4.23 4.90 5.47 5.74 6.01 6.28 6.55 7.12 7.79
45 193.65 6.22 6.26 Student 0.95 2.94 4.64 5.44 6.22 7.01 7.81 9.51 11.49
194.43 5.95 2.12 School 4.16 4.84 5.41 5.68 5.95 6.21 6.48 7.06 7.73
48 194.53 6.02 6.26 Student 0.75 2.74 4.43 5.23 6.02 6.81 7.61 9.30 11.29
194.84 5.91 2.12 School 4.13 4.80 5.37 5.64 5.91 6.17 6.44 7.02 7.69
50 195.11 5.88 6.26 Student 0.61 2.60 4.30 5.10 5.88 6.67 7.47 9.17 11.15
195.11 5.88 2.12 School 4.10 4.77 5.35 5.62 5.88 6.15 6.42 6.99 7.66
52 195.70 5.75 6.26 Student 0.48 2.46 4.16 4.96 5.75 6.53 7.33 9.03 11.02
195.38 5.86 2.12 School 4.08 4.75 5.32 5.59 5.86 6.12 6.39 6.97 7.64
55 196.58 5.54 6.26 Student 0.27 2.26 3.96 4.76 5.54 6.33 7.13 8.83 10.81
195.79 5.82 2.12 School 4.04 4.71 5.28 5.55 5.82 6.09 6.36 6.93 7.60
60 198.07 5.20 6.26 Student -0.07 1.91 3.61 4.41 5.20 5.98 6.78 8.48 10.47
196.48 5.76 2.12 School 3.98 4.65 5.22 5.49 5.76 6.02 6.29 6.87 7.54
65 199.60 4.84 6.26 Student -0.43 1.56 3.25 4.05 4.84 5.63 6.43 8.12 10.11
197.19 5.69 2.12 School 3.91 4.58 5.15 5.42 5.69 5.96 6.23 6.80 7.47
70 201.23 4.46 6.26 Student -0.81 1.18 2.88 3.68 4.46 5.25 6.05 7.75 9.73
197.94 5.62 2.12 School 3.84 4.51 5.08 5.35 5.62 5.89 6.16 6.73 7.40
75 202.98 4.06 6.26 Student -1.21 0.77 2.47 3.27 4.06 4.84 5.64 7.34 9.33
198.75 5.55 2.12 School 3.76 4.44 5.01 5.28 5.55 5.81 6.08 6.66 7.33
80 204.92 3.60 6.26 Student -1.67 0.32 2.02 2.82 3.60 4.39 5.19 6.89 8.87
199.65 5.46 2.12 School 3.68 4.35 4.93 5.20 5.46 5.73 6.00 6.57 7.24
85 207.19 3.08 6.26 Student -2.19 -0.21 1.49 2.29 3.08 3.86 4.66 6.36 8.35
200.70 5.36 2.12 School 3.58 4.25 4.83 5.10 5.36 5.63 5.90 6.47 7.15
90 210.05 2.41 6.26 Student -2.86 -0.87 0.82 1.62 2.41 3.20 4.00 5.70 7.68
202.03 5.24 2.12 School 3.46 4.13 4.71 4.98 5.24 5.51 5.78 6.35 7.02
CGI - Conditional Growth Index CGP - Conditional Growth Percentile
378
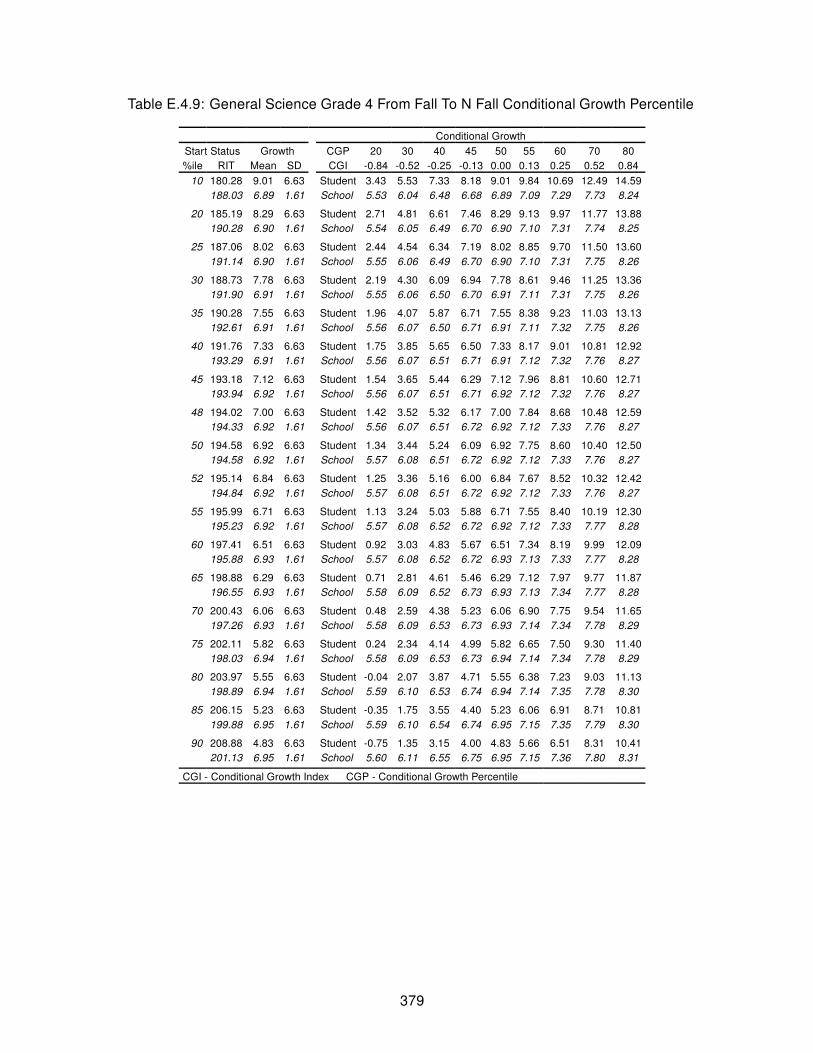
Table E.4.9: General Science Grade 4 From Fall To N Fall Conditional Growth Percentile
Conditional Growth
Start Status Growth CGP 20 30 40 45 50 55 60 70 80
%ile RIT Mean SD CGI -0.84 -0.52 -0.25 -0.13 0.00 0.13 0.25 0.52 0.84
10 180.28 9.01 6.63 Student 3.43 5.53 7.33 8.18 9.01 9.84 10.69 12.49 14.59
188.03 6.89 1.61 School 5.53 6.04 6.48 6.68 6.89 7.09 7.29 7.73 8.24
20 185.19 8.29 6.63 Student 2.71 4.81 6.61 7.46 8.29 9.13 9.97 11.77 13.88
190.28 6.90 1.61 School 5.54 6.05 6.49 6.70 6.90 7.10 7.31 7.74 8.25
25 187.06 8.02 6.63 Student 2.44 4.54 6.34 7.19 8.02 8.85 9.70 11.50 13.60
191.14 6.90 1.61 School 5.55 6.06 6.49 6.70 6.90 7.10 7.31 7.75 8.26
30 188.73 7.78 6.63 Student 2.19 4.30 6.09 6.94 7.78 8.61 9.46 11.25 13.36
191.90 6.91 1.61 School 5.55 6.06 6.50 6.70 6.91 7.11 7.31 7.75 8.26
35 190.28 7.55 6.63 Student 1.96 4.07 5.87 6.71 7.55 8.38 9.23 11.03 13.13
192.61 6.91 1.61 School 5.56 6.07 6.50 6.71 6.91 7.11 7.32 7.75 8.26
40 191.76 7.33 6.63 Student 1.75 3.85 5.65 6.50 7.33 8.17 9.01 10.81 12.92
193.29 6.91 1.61 School 5.56 6.07 6.51 6.71 6.91 7.12 7.32 7.76 8.27
45 193.18 7.12 6.63 Student 1.54 3.65 5.44 6.29 7.12 7.96 8.81 10.60 12.71
193.94 6.92 1.61 School 5.56 6.07 6.51 6.71 6.92 7.12 7.32 7.76 8.27
48 194.02 7.00 6.63 Student 1.42 3.52 5.32 6.17 7.00 7.84 8.68 10.48 12.59
194.33 6.92 1.61 School 5.56 6.07 6.51 6.72 6.92 7.12 7.33 7.76 8.27
50 194.58 6.92 6.63 Student 1.34 3.44 5.24 6.09 6.92 7.75 8.60 10.40 12.50
194.58 6.92 1.61 School 5.57 6.08 6.51 6.72 6.92 7.12 7.33 7.76 8.27
52 195.14 6.84 6.63 Student 1.25 3.36 5.16 6.00 6.84 7.67 8.52 10.32 12.42
194.84 6.92 1.61 School 5.57 6.08 6.51 6.72 6.92 7.12 7.33 7.76 8.27
55 195.99 6.71 6.63 Student 1.13 3.24 5.03 5.88 6.71 7.55 8.40 10.19 12.30
195.23 6.92 1.61 School 5.57 6.08 6.52 6.72 6.92 7.12 7.33 7.77 8.28
60 197.41 6.51 6.63 Student 0.92 3.03 4.83 5.67 6.51 7.34 8.19 9.99 12.09
195.88 6.93 1.61 School 5.57 6.08 6.52 6.72 6.93 7.13 7.33 7.77 8.28
65 198.88 6.29 6.63 Student 0.71 2.81 4.61 5.46 6.29 7.12 7.97 9.77 11.87
196.55 6.93 1.61 School 5.58 6.09 6.52 6.73 6.93 7.13 7.34 7.77 8.28
70 200.43 6.06 6.63 Student 0.48 2.59 4.38 5.23 6.06 6.90 7.75 9.54 11.65
197.26 6.93 1.61 School 5.58 6.09 6.53 6.73 6.93 7.14 7.34 7.78 8.29
75 202.11 5.82 6.63 Student 0.24 2.34 4.14 4.99 5.82 6.65 7.50 9.30 11.40
198.03 6.94 1.61 School 5.58 6.09 6.53 6.73 6.94 7.14 7.34 7.78 8.29
80 203.97 5.55 6.63 Student -0.04 2.07 3.87 4.71 5.55 6.38 7.23 9.03 11.13
198.89 6.94 1.61 School 5.59 6.10 6.53 6.74 6.94 7.14 7.35 7.78 8.30
85 206.15 5.23 6.63 Student -0.35 1.75 3.55 4.40 5.23 6.06 6.91 8.71 10.81
199.88 6.95 1.61 School 5.59 6.10 6.54 6.74 6.95 7.15 7.35 7.79 8.30
90 208.88 4.83 6.63 Student -0.75 1.35 3.15 4.00 4.83 5.66 6.51 8.31 10.41
201.13 6.95 1.61 School 5.60 6.11 6.55 6.75 6.95 7.15 7.36 7.80 8.31
CGI - Conditional Growth Index CGP - Conditional Growth Percentile
379

Table E.4.10: General Science Grade 4 From Fall To Spring Conditional Growth Percentile
Conditional Growth
Start Status Growth CGP 20 30 40 45 50 55 60 70 80
%ile RIT Mean SD CGI -0.84 -0.52 -0.25 -0.13 0.00 0.13 0.25 0.52 0.84
10 180.28 9.68 6.73 Student 4.02 6.16 7.98 8.84 9.68 10.53 11.39 13.21 15.34
188.03 6.56 1.86 School 4.99 5.58 6.09 6.33 6.56 6.79 7.03 7.54 8.13
20 185.19 8.56 6.73 Student 2.90 5.03 6.86 7.72 8.56 9.41 10.26 12.09 14.22
190.28 6.51 1.86 School 4.94 5.53 6.04 6.27 6.51 6.74 6.98 7.49 8.08
25 187.06 8.13 6.73 Student 2.47 4.61 6.43 7.29 8.13 8.98 9.84 11.66 13.79
191.14 6.49 1.86 School 4.92 5.51 6.02 6.26 6.49 6.72 6.96 7.47 8.06
30 188.73 7.75 6.73 Student 2.09 4.22 6.05 6.91 7.75 8.60 9.46 11.28 13.41
191.90 6.47 1.86 School 4.91 5.50 6.00 6.24 6.47 6.71 6.94 7.45 8.04
35 190.28 7.40 6.73 Student 1.74 3.87 5.69 6.55 7.40 8.24 9.10 10.92 13.06
192.61 6.46 1.86 School 4.89 5.48 5.98 6.22 6.46 6.69 6.93 7.43 8.02
40 191.76 7.06 6.73 Student 1.40 3.53 5.36 6.21 7.06 7.90 8.76 10.59 12.72
193.29 6.44 1.86 School 4.87 5.46 5.97 6.21 6.44 6.68 6.91 7.42 8.01
45 193.18 6.73 6.73 Student 1.07 3.21 5.03 5.89 6.73 7.58 8.44 10.26 12.39
193.94 6.43 1.86 School 4.86 5.45 5.96 6.19 6.43 6.66 6.90 7.40 7.99
48 194.02 6.54 6.73 Student 0.88 3.01 4.84 5.70 6.54 7.39 8.24 10.07 12.20
194.33 6.42 1.86 School 4.85 5.44 5.95 6.18 6.42 6.65 6.89 7.39 7.99
50 194.58 6.41 6.73 Student 0.75 2.89 4.71 5.57 6.41 7.26 8.12 9.94 12.07
194.58 6.41 1.86 School 4.85 5.44 5.94 6.18 6.41 6.65 6.88 7.39 7.98
52 195.14 6.28 6.73 Student 0.62 2.76 4.58 5.44 6.28 7.13 7.99 9.81 11.94
194.84 6.41 1.86 School 4.84 5.43 5.93 6.17 6.41 6.64 6.88 7.38 7.97
55 195.99 6.09 6.73 Student 0.43 2.56 4.39 5.25 6.09 6.94 7.80 9.62 11.75
195.23 6.40 1.86 School 4.83 5.42 5.93 6.16 6.40 6.63 6.87 7.37 7.97
60 197.41 5.77 6.73 Student 0.11 2.24 4.06 4.92 5.77 6.61 7.47 9.29 11.43
195.88 6.38 1.86 School 4.82 5.41 5.91 6.15 6.38 6.62 6.86 7.36 7.95
65 198.88 5.43 6.73 Student -0.23 1.90 3.73 4.58 5.43 6.27 7.13 8.96 11.09
196.55 6.37 1.86 School 4.80 5.39 5.90 6.13 6.37 6.60 6.84 7.35 7.94
70 200.43 5.07 6.73 Student -0.59 1.55 3.37 4.23 5.07 5.92 6.78 8.60 10.73
197.26 6.35 1.86 School 4.79 5.38 5.88 6.12 6.35 6.59 6.82 7.33 7.92
75 202.11 4.69 6.73 Student -0.97 1.16 2.99 3.85 4.69 5.54 6.39 8.22 10.35
198.03 6.34 1.86 School 4.77 5.36 5.86 6.10 6.34 6.57 6.81 7.31 7.90
80 203.97 4.26 6.73 Student -1.40 0.74 2.56 3.42 4.26 5.11 5.97 7.79 9.92
198.89 6.32 1.86 School 4.75 5.34 5.84 6.08 6.32 6.55 6.79 7.29 7.88
85 206.15 3.77 6.73 Student -1.89 0.24 2.06 2.92 3.77 4.61 5.47 7.29 9.43
199.88 6.29 1.86 School 4.73 5.32 5.82 6.06 6.29 6.53 6.77 7.27 7.86
90 208.88 3.14 6.73 Student -2.52 -0.39 1.44 2.30 3.14 3.99 4.84 6.67 8.80
201.13 6.27 1.86 School 4.70 5.29 5.79 6.03 6.27 6.50 6.74 7.24 7.83
CGI - Conditional Growth Index CGP - Conditional Growth Percentile
380

Table E.4.11: General Science Grade 4 From Fall To Winter Conditional Growth Percentile
Conditional Growth
Start Status Growth CGP 20 30 40 45 50 55 60 70 80
%ile RIT Mean SD CGI -0.84 -0.52 -0.25 -0.13 0.00 0.13 0.25 0.52 0.84
10 180.28 6.69 5.60 Student 1.97 3.75 5.27 5.98 6.69 7.39 8.11 9.63 11.41
188.03 4.23 1.07 School 3.33 3.67 3.96 4.10 4.23 4.36 4.50 4.79 5.13
20 185.19 5.82 5.60 Student 1.10 2.88 4.40 5.11 5.82 6.52 7.24 8.75 10.53
190.28 4.20 1.07 School 3.30 3.64 3.93 4.07 4.20 4.33 4.47 4.76 5.10
25 187.06 5.48 5.60 Student 0.77 2.55 4.06 4.78 5.48 6.19 6.90 8.42 10.20
191.14 4.19 1.07 School 3.29 3.63 3.92 4.06 4.19 4.32 4.46 4.75 5.09
30 188.73 5.19 5.60 Student 0.47 2.25 3.77 4.48 5.19 5.89 6.61 8.12 9.90
191.90 4.18 1.07 School 3.28 3.62 3.91 4.05 4.18 4.31 4.45 4.74 5.08
35 190.28 4.91 5.60 Student 0.19 1.97 3.49 4.21 4.91 5.61 6.33 7.85 9.63
192.61 4.17 1.07 School 3.27 3.61 3.90 4.04 4.17 4.30 4.44 4.73 5.07
40 191.76 4.65 5.60 Student -0.07 1.71 3.23 3.94 4.65 5.35 6.07 7.59 9.36
193.29 4.16 1.07 School 3.27 3.60 3.89 4.03 4.16 4.30 4.43 4.72 5.06
45 193.18 4.39 5.60 Student -0.32 1.46 2.98 3.69 4.39 5.10 5.81 7.33 9.11
193.94 4.15 1.07 School 3.26 3.60 3.88 4.02 4.15 4.29 4.42 4.71 5.05
48 194.02 4.25 5.60 Student -0.47 1.31 2.83 3.54 4.25 4.95 5.66 7.18 8.96
194.33 4.15 1.07 School 3.25 3.59 3.88 4.01 4.15 4.28 4.42 4.71 5.05
50 194.58 4.15 5.60 Student -0.57 1.21 2.73 3.44 4.15 4.85 5.57 7.08 8.86
194.58 4.15 1.07 School 3.25 3.59 3.88 4.01 4.15 4.28 4.42 4.70 5.04
52 195.14 4.05 5.60 Student -0.67 1.11 2.63 3.34 4.05 4.75 5.47 6.98 8.76
194.84 4.14 1.07 School 3.25 3.58 3.87 4.01 4.14 4.28 4.41 4.70 5.04
55 195.99 3.90 5.60 Student -0.82 0.96 2.48 3.19 3.90 4.60 5.32 6.83 8.61
195.23 4.14 1.07 School 3.24 3.58 3.87 4.00 4.14 4.27 4.41 4.70 5.03
60 197.41 3.64 5.60 Student -1.07 0.70 2.22 2.94 3.64 4.35 5.06 6.58 8.36
195.88 4.13 1.07 School 3.23 3.57 3.86 4.00 4.13 4.26 4.40 4.69 5.03
65 198.88 3.38 5.60 Student -1.34 0.44 1.96 2.68 3.38 4.08 4.80 6.32 8.10
196.55 4.12 1.07 School 3.22 3.56 3.85 3.99 4.12 4.25 4.39 4.68 5.02
70 200.43 3.10 5.60 Student -1.61 0.17 1.69 2.40 3.10 3.81 4.52 6.04 7.82
197.26 4.11 1.07 School 3.21 3.55 3.84 3.98 4.11 4.24 4.38 4.67 5.01
75 202.11 2.81 5.60 Student -1.91 -0.13 1.39 2.10 2.81 3.51 4.23 5.75 7.52
198.03 4.10 1.07 School 3.20 3.54 3.83 3.97 4.10 4.24 4.37 4.66 5.00
80 203.97 2.48 5.60 Student -2.24 -0.46 1.06 1.77 2.48 3.18 3.89 5.41 7.19
198.89 4.09 1.07 School 3.19 3.53 3.82 3.96 4.09 4.22 4.36 4.65 4.99
85 206.15 2.09 5.60 Student -2.63 -0.85 0.67 1.38 2.09 2.79 3.51 5.03 6.80
199.88 4.08 1.07 School 3.18 3.52 3.81 3.94 4.08 4.21 4.35 4.64 4.97
90 208.88 1.60 5.60 Student -3.11 -1.34 0.18 0.90 1.60 2.31 3.02 4.54 6.32
201.13 4.06 1.07 School 3.17 3.50 3.79 3.93 4.06 4.20 4.33 4.62 4.96
CGI - Conditional Growth Index CGP - Conditional Growth Percentile
381

Table E.4.12: General Science Grade 4 From Winter To Spring Conditional Growth Percentile
Conditional Growth
Start Status Growth CGP 20 30 40 45 50 55 60 70 80
%ile RIT Mean SD CGI -0.84 -0.52 -0.25 -0.13 0.00 0.13 0.25 0.52 0.84
10 184.95 3.94 5.49 Student -0.68 1.06 2.55 3.25 3.94 4.63 5.33 6.82 8.56
192.12 2.12 0.79 School 1.45 1.70 1.92 2.02 2.12 2.22 2.32 2.53 2.78
20 189.68 3.37 5.49 Student -1.25 0.49 1.98 2.68 3.37 4.06 4.76 6.25 7.99
194.39 2.17 0.79 School 1.50 1.75 1.97 2.07 2.17 2.27 2.37 2.58 2.84
25 191.48 3.15 5.49 Student -1.47 0.27 1.76 2.46 3.15 3.84 4.54 6.03 7.77
195.25 2.19 0.79 School 1.52 1.77 1.99 2.09 2.19 2.29 2.39 2.60 2.86
30 193.09 2.95 5.49 Student -1.67 0.07 1.56 2.26 2.95 3.64 4.34 5.83 7.57
196.02 2.21 0.79 School 1.54 1.79 2.01 2.11 2.21 2.31 2.41 2.62 2.87
35 194.59 2.77 5.49 Student -1.85 -0.11 1.38 2.08 2.77 3.46 4.16 5.65 7.39
196.74 2.22 0.79 School 1.56 1.81 2.02 2.12 2.22 2.32 2.42 2.64 2.89
40 196.01 2.60 5.49 Student -2.02 -0.28 1.21 1.91 2.60 3.29 3.99 5.48 7.22
197.42 2.24 0.79 School 1.57 1.82 2.04 2.14 2.24 2.34 2.44 2.65 2.90
45 197.38 2.43 5.49 Student -2.19 -0.45 1.04 1.74 2.43 3.12 3.82 5.31 7.05
198.08 2.25 0.79 School 1.59 1.84 2.05 2.15 2.25 2.35 2.45 2.67 2.92
48 198.19 2.33 5.49 Student -2.29 -0.55 0.94 1.64 2.33 3.02 3.72 5.21 6.95
198.47 2.26 0.79 School 1.59 1.85 2.06 2.16 2.26 2.36 2.46 2.68 2.93
50 198.73 2.27 5.49 Student -2.35 -0.61 0.88 1.58 2.27 2.96 3.66 5.15 6.89
198.73 2.27 0.79 School 1.60 1.85 2.07 2.17 2.27 2.37 2.47 2.68 2.93
52 199.27 2.20 5.49 Student -2.42 -0.68 0.81 1.51 2.20 2.89 3.59 5.08 6.82
198.99 2.27 0.79 School 1.61 1.86 2.07 2.17 2.27 2.37 2.47 2.69 2.94
55 200.08 2.10 5.49 Student -2.52 -0.78 0.71 1.41 2.10 2.79 3.49 4.98 6.72
199.38 2.28 0.79 School 1.61 1.87 2.08 2.18 2.28 2.38 2.48 2.70 2.95
60 201.45 1.94 5.49 Student -2.69 -0.94 0.54 1.25 1.94 2.63 3.33 4.81 6.56
200.04 2.30 0.79 School 1.63 1.88 2.10 2.20 2.30 2.40 2.50 2.71 2.96
65 202.87 1.76 5.49 Student -2.86 -1.12 0.37 1.07 1.76 2.45 3.15 4.64 6.38
200.72 2.31 0.79 School 1.65 1.90 2.11 2.21 2.31 2.41 2.51 2.73 2.98
70 204.37 1.58 5.49 Student -3.04 -1.30 0.19 0.89 1.58 2.27 2.97 4.46 6.20
201.43 2.33 0.79 School 1.66 1.91 2.13 2.23 2.33 2.43 2.53 2.74 3.00
75 205.98 1.38 5.49 Student -3.24 -1.49 -0.01 0.69 1.38 2.07 2.78 4.26 6.01
202.21 2.35 0.79 School 1.68 1.93 2.14 2.25 2.35 2.45 2.55 2.76 3.01
80 207.78 1.17 5.49 Student -3.46 -1.71 -0.23 0.48 1.17 1.86 2.56 4.05 5.79
203.07 2.37 0.79 School 1.70 1.95 2.16 2.27 2.37 2.46 2.57 2.78 3.03
85 209.87 0.91 5.49 Student -3.71 -1.97 -0.48 0.22 0.91 1.60 2.30 3.79 5.53
204.07 2.39 0.79 School 1.72 1.97 2.19 2.29 2.39 2.49 2.59 2.80 3.05
90 212.50 0.59 5.49 Student -4.03 -2.29 -0.80 -0.10 0.59 1.28 1.98 3.47 5.21
205.34 2.42 0.79 School 1.75 2.00 2.22 2.32 2.42 2.52 2.62 2.83 3.08
CGI - Conditional Growth Index CGP - Conditional Growth Percentile
382

Table E.4.13: General Science Grade 5 From Last Winter To Winter Conditional Growth Percentile
Conditional Growth
Start Status Growth CGP 20 30 40 45 50 55 60 70 80
%ile RIT Mean SD CGI -0.84 -0.52 -0.25 -0.13 0.00 0.13 0.25 0.52 0.84
10 184.11 8.11 6.06 Student 3.01 4.93 6.57 7.35 8.11 8.87 9.64 11.28 13.21
191.87 5.47 1.39 School 4.30 4.74 5.12 5.30 5.47 5.64 5.82 6.20 6.64
20 189.00 7.16 6.06 Student 2.06 3.98 5.62 6.40 7.16 7.92 8.69 10.34 12.26
194.09 5.43 1.39 School 4.26 4.70 5.08 5.25 5.43 5.60 5.78 6.15 6.59
25 190.85 6.80 6.06 Student 1.70 3.62 5.26 6.04 6.80 7.56 8.33 9.97 11.90
194.94 5.41 1.39 School 4.24 4.68 5.06 5.24 5.41 5.58 5.76 6.14 6.58
30 192.52 6.47 6.06 Student 1.38 3.30 4.94 5.71 6.47 7.24 8.01 9.65 11.57
195.69 5.40 1.39 School 4.23 4.67 5.04 5.22 5.40 5.57 5.75 6.12 6.56
35 194.06 6.17 6.06 Student 1.08 3.00 4.64 5.41 6.17 6.94 7.71 9.35 11.27
196.40 5.38 1.39 School 4.22 4.65 5.03 5.21 5.38 5.56 5.73 6.11 6.55
40 195.53 5.89 6.06 Student 0.79 2.71 4.36 5.13 5.89 6.65 7.42 9.07 10.99
197.06 5.37 1.39 School 4.20 4.64 5.02 5.19 5.37 5.54 5.72 6.10 6.54
45 196.95 5.61 6.06 Student 0.52 2.44 4.08 4.85 5.61 6.38 7.15 8.79 10.71
197.71 5.36 1.39 School 4.19 4.63 5.01 5.18 5.36 5.53 5.71 6.08 6.52
48 197.78 5.45 6.06 Student 0.35 2.28 3.92 4.69 5.45 6.21 6.99 8.63 10.55
198.09 5.35 1.39 School 4.18 4.62 5.00 5.17 5.35 5.52 5.70 6.08 6.52
50 198.34 5.34 6.06 Student 0.25 2.17 3.81 4.58 5.34 6.10 6.88 8.52 10.44
198.34 5.34 1.39 School 4.18 4.62 4.99 5.17 5.34 5.52 5.69 6.07 6.51
52 198.90 5.24 6.06 Student 0.14 2.06 3.70 4.47 5.24 6.00 6.77 8.41 10.33
198.59 5.34 1.39 School 4.17 4.61 4.99 5.16 5.34 5.51 5.69 6.07 6.51
55 199.74 5.07 6.06 Student -0.02 1.90 3.54 4.31 5.07 5.83 6.61 8.25 10.17
198.98 5.33 1.39 School 4.17 4.60 4.98 5.16 5.33 5.51 5.68 6.06 6.50
60 201.15 4.80 6.06 Student -0.30 1.62 3.26 4.04 4.80 5.56 6.33 7.97 9.90
199.62 5.32 1.39 School 4.15 4.59 4.97 5.14 5.32 5.49 5.67 6.05 6.49
65 202.62 4.51 6.06 Student -0.58 1.34 2.98 3.75 4.51 5.27 6.05 7.69 9.61
200.29 5.31 1.39 School 4.14 4.58 4.95 5.13 5.31 5.48 5.66 6.03 6.47
70 204.16 4.21 6.06 Student -0.88 1.04 2.68 3.45 4.21 4.97 5.75 7.39 9.31
200.99 5.29 1.39 School 4.13 4.57 4.94 5.12 5.29 5.47 5.64 6.02 6.46
75 205.83 3.89 6.06 Student -1.21 0.71 2.35 3.13 3.89 4.65 5.42 7.07 8.99
201.75 5.28 1.39 School 4.11 4.55 4.93 5.10 5.28 5.45 5.63 6.00 6.44
80 207.69 3.53 6.06 Student -1.57 0.35 1.99 2.77 3.53 4.29 5.06 6.70 8.63
202.59 5.26 1.39 School 4.09 4.53 4.91 5.09 5.26 5.44 5.61 5.99 6.43
85 209.85 3.11 6.06 Student -1.99 -0.07 1.57 2.35 3.11 3.87 4.64 6.28 8.21
203.57 5.24 1.39 School 4.08 4.52 4.89 5.07 5.24 5.42 5.59 5.97 6.41
90 212.57 2.58 6.06 Student -2.52 -0.60 1.05 1.82 2.58 3.34 4.11 5.76 7.68
204.81 5.22 1.39 School 4.05 4.49 4.87 5.04 5.22 5.39 5.57 5.94 6.38
CGI - Conditional Growth Index CGP - Conditional Growth Percentile
383

Table E.4.14: General Science Grade 5 From Last Spring To Spring Conditional Growth Percentile
Conditional Growth
Start Status Growth CGP 20 30 40 45 50 55 60 70 80
%ile RIT Mean SD CGI -0.84 -0.52 -0.25 -0.13 0.00 0.13 0.25 0.52 0.84
10 186.02 8.16 6.45 Student 2.74 4.78 6.53 7.35 8.16 8.97 9.80 11.54 13.59
194.05 5.30 1.87 School 3.72 4.32 4.82 5.06 5.30 5.53 5.77 6.28 6.88
20 191.12 7.02 6.45 Student 1.60 3.64 5.39 6.21 7.02 7.83 8.66 10.40 12.45
196.39 5.14 1.87 School 3.57 4.16 4.67 4.91 5.14 5.38 5.62 6.13 6.72
25 193.06 6.59 6.45 Student 1.17 3.21 4.96 5.78 6.59 7.40 8.23 9.97 12.02
197.28 5.08 1.87 School 3.51 4.10 4.61 4.85 5.08 5.32 5.56 6.07 6.66
30 194.80 6.20 6.45 Student 0.78 2.82 4.57 5.39 6.20 7.01 7.84 9.58 11.63
198.08 5.03 1.87 School 3.45 4.05 4.56 4.80 5.03 5.27 5.51 6.02 6.61
35 196.41 5.84 6.45 Student 0.42 2.46 4.21 5.03 5.84 6.65 7.48 9.22 11.27
198.82 4.98 1.87 School 3.41 4.00 4.51 4.75 4.98 5.22 5.46 5.97 6.56
40 197.94 5.50 6.45 Student 0.08 2.12 3.87 4.69 5.50 6.31 7.14 8.88 10.93
199.53 4.94 1.87 School 3.36 3.95 4.46 4.70 4.94 5.17 5.41 5.92 6.51
45 199.42 5.17 6.45 Student -0.25 1.79 3.54 4.36 5.17 5.98 6.81 8.55 10.60
200.21 4.89 1.87 School 3.31 3.91 4.42 4.66 4.89 5.13 5.37 5.87 6.47
48 200.29 4.98 6.45 Student -0.45 1.60 3.34 4.17 4.98 5.79 6.61 8.36 10.40
200.61 4.87 1.87 School 3.29 3.88 4.39 4.63 4.87 5.10 5.34 5.85 6.44
50 200.88 4.85 6.45 Student -0.58 1.47 3.21 4.04 4.85 5.66 6.48 8.23 10.27
200.88 4.85 1.87 School 3.27 3.86 4.37 4.61 4.85 5.08 5.32 5.83 6.43
52 201.46 4.72 6.45 Student -0.71 1.34 3.08 3.91 4.72 5.53 6.35 8.10 10.14
201.14 4.83 1.87 School 3.25 3.85 4.35 4.59 4.83 5.07 5.30 5.81 6.41
55 202.33 4.52 6.45 Student -0.90 1.14 2.89 3.71 4.52 5.33 6.16 7.90 9.95
201.55 4.80 1.87 School 3.23 3.82 4.33 4.57 4.80 5.04 5.28 5.79 6.38
60 203.81 4.19 6.45 Student -1.23 0.81 2.56 3.38 4.19 5.00 5.82 7.57 9.62
202.23 4.76 1.87 School 3.18 3.78 4.28 4.52 4.76 4.99 5.23 5.74 6.34
65 205.34 3.85 6.45 Student -1.57 0.47 2.22 3.04 3.85 4.66 5.48 7.23 9.27
202.93 4.71 1.87 School 3.13 3.73 4.24 4.48 4.71 4.95 5.19 5.69 6.29
70 206.95 3.49 6.45 Student -1.93 0.11 1.86 2.68 3.49 4.30 5.12 6.87 8.92
203.67 4.66 1.87 School 3.08 3.68 4.19 4.43 4.66 4.90 5.14 5.65 6.24
75 208.69 3.10 6.45 Student -2.32 -0.28 1.47 2.29 3.10 3.91 4.74 6.48 8.53
204.47 4.61 1.87 School 3.03 3.63 4.13 4.37 4.61 4.85 5.08 5.59 6.19
80 210.63 2.67 6.45 Student -2.75 -0.71 1.04 1.86 2.67 3.48 4.30 6.05 8.09
205.36 4.55 1.87 School 2.97 3.57 4.08 4.32 4.55 4.79 5.03 5.53 6.13
85 212.89 2.17 6.45 Student -3.26 -1.21 0.53 1.36 2.17 2.98 3.80 5.55 7.59
206.40 4.48 1.87 School 2.90 3.50 4.01 4.25 4.48 4.72 4.96 5.47 6.06
90 215.73 1.53 6.45 Student -3.89 -1.85 -0.10 0.72 1.53 2.34 3.16 4.91 6.96
207.71 4.40 1.87 School 2.82 3.41 3.92 4.16 4.40 4.63 4.87 5.38 5.97
CGI - Conditional Growth Index CGP - Conditional Growth Percentile
384

Table E.4.15: General Science Grade 5 From Fall To N Fall Conditional Growth Percentile
Conditional Growth
Start Status Growth CGP 20 30 40 45 50 55 60 70 80
%ile RIT Mean SD CGI -0.84 -0.52 -0.25 -0.13 0.00 0.13 0.25 0.52 0.84
10 186.06 6.68 6.76 Student 0.99 3.13 4.96 5.83 6.68 7.52 8.39 10.22 12.36
193.70 4.96 1.48 School 3.71 4.18 4.58 4.77 4.96 5.14 5.33 5.73 6.20
20 190.93 6.17 6.76 Student 0.49 2.63 4.46 5.32 6.17 7.02 7.88 9.71 11.86
195.94 5.04 1.48 School 3.80 4.27 4.67 4.86 5.04 5.23 5.42 5.82 6.29
25 192.77 5.98 6.76 Student 0.29 2.44 4.27 5.13 5.98 6.83 7.69 9.52 11.67
196.79 5.08 1.48 School 3.83 4.30 4.70 4.89 5.08 5.26 5.45 5.85 6.32
30 194.43 5.81 6.76 Student 0.12 2.27 4.10 4.96 5.81 6.66 7.52 9.35 11.49
197.56 5.10 1.48 School 3.86 4.33 4.73 4.92 5.10 5.29 5.48 5.88 6.35
35 195.97 5.65 6.76 Student -0.04 2.11 3.94 4.80 5.65 6.50 7.36 9.19 11.33
198.27 5.13 1.48 School 3.89 4.36 4.76 4.95 5.13 5.32 5.51 5.91 6.37
40 197.43 5.50 6.76 Student -0.19 1.95 3.79 4.65 5.50 6.35 7.21 9.04 11.18
198.94 5.16 1.48 School 3.92 4.38 4.78 4.97 5.16 5.34 5.53 5.93 6.40
45 198.84 5.35 6.76 Student -0.33 1.81 3.64 4.50 5.35 6.20 7.06 8.89 11.04
199.59 5.18 1.48 School 3.94 4.41 4.81 5.00 5.18 5.37 5.56 5.96 6.43
48 199.68 5.26 6.76 Student -0.42 1.72 3.55 4.42 5.26 6.11 6.98 8.81 10.95
199.98 5.20 1.48 School 3.96 4.42 4.82 5.01 5.20 5.38 5.57 5.97 6.44
50 200.23 5.21 6.76 Student -0.48 1.66 3.50 4.36 5.21 6.06 6.92 8.75 10.89
200.23 5.21 1.48 School 3.96 4.43 4.83 5.02 5.21 5.39 5.58 5.98 6.45
52 200.79 5.15 6.76 Student -0.54 1.61 3.44 4.30 5.15 6.00 6.86 8.69 10.84
200.49 5.22 1.48 School 3.97 4.44 4.84 5.03 5.22 5.40 5.59 5.99 6.46
55 201.62 5.06 6.76 Student -0.62 1.52 3.35 4.21 5.06 5.91 6.78 8.61 10.75
200.87 5.23 1.48 School 3.99 4.46 4.86 5.05 5.23 5.42 5.61 6.01 6.47
60 203.03 4.92 6.76 Student -0.77 1.37 3.21 4.07 4.92 5.77 6.63 8.46 10.60
201.52 5.26 1.48 School 4.01 4.48 4.88 5.07 5.26 5.44 5.63 6.03 6.50
65 204.49 4.77 6.76 Student -0.92 1.22 3.05 3.92 4.77 5.62 6.48 8.31 10.45
202.20 5.28 1.48 School 4.04 4.51 4.91 5.10 5.28 5.47 5.66 6.06 6.53
70 206.03 4.61 6.76 Student -1.08 1.06 2.90 3.76 4.61 5.46 6.32 8.15 10.29
202.90 5.31 1.48 School 4.07 4.54 4.94 5.12 5.31 5.50 5.68 6.08 6.55
75 207.69 4.43 6.76 Student -1.25 0.89 2.72 3.59 4.43 5.28 6.15 7.98 10.12
203.67 5.34 1.48 School 4.10 4.57 4.97 5.15 5.34 5.52 5.71 6.11 6.58
80 209.54 4.24 6.76 Student -1.44 0.70 2.53 3.39 4.24 5.09 5.96 7.79 9.93
204.52 5.37 1.48 School 4.13 4.60 5.00 5.19 5.37 5.56 5.75 6.15 6.61
85 211.69 4.02 6.76 Student -1.67 0.48 2.31 3.17 4.02 4.87 5.73 7.56 9.71
205.51 5.41 1.48 School 4.17 4.64 5.04 5.22 5.41 5.60 5.78 6.18 6.65
90 214.40 3.74 6.76 Student -1.95 0.20 2.03 2.89 3.74 4.59 5.45 7.28 9.43
206.76 5.46 1.48 School 4.22 4.68 5.08 5.27 5.46 5.64 5.83 6.23 6.70
CGI - Conditional Growth Index CGP - Conditional Growth Percentile
385

Table E.4.16: General Science Grade 5 From Fall To Spring Conditional Growth Percentile
Conditional Growth
Start Status Growth CGP 20 30 40 45 50 55 60 70 80
%ile RIT Mean SD CGI -0.84 -0.52 -0.25 -0.13 0.00 0.13 0.25 0.52 0.84
10 186.06 8.42 6.76 Student 2.73 4.88 6.71 7.57 8.42 9.27 10.13 11.96 14.11
193.70 5.64 1.87 School 4.07 4.66 5.17 5.41 5.64 5.88 6.12 6.62 7.22
20 190.93 7.41 6.76 Student 1.73 3.87 5.70 6.57 7.41 8.26 9.13 10.96 13.10
195.94 5.59 1.87 School 4.02 4.61 5.12 5.36 5.59 5.83 6.06 6.57 7.16
25 192.77 7.03 6.76 Student 1.35 3.49 5.32 6.18 7.03 7.88 8.74 10.58 12.72
196.79 5.57 1.87 School 4.00 4.59 5.10 5.34 5.57 5.81 6.04 6.55 7.14
30 194.43 6.69 6.76 Student 1.00 3.15 4.98 5.84 6.69 7.54 8.40 10.23 12.38
197.56 5.55 1.87 School 3.98 4.57 5.08 5.32 5.55 5.79 6.03 6.53 7.13
35 195.97 6.37 6.76 Student 0.69 2.83 4.66 5.52 6.37 7.22 8.08 9.91 12.06
198.27 5.54 1.87 School 3.96 4.56 5.06 5.30 5.54 5.77 6.01 6.52 7.11
40 197.43 6.07 6.76 Student 0.38 2.53 4.36 5.22 6.07 6.92 7.78 9.61 11.76
198.94 5.52 1.87 School 3.95 4.54 5.05 5.29 5.52 5.76 5.99 6.50 7.10
45 198.84 5.78 6.76 Student 0.09 2.24 4.07 4.93 5.78 6.63 7.49 9.32 11.46
199.59 5.51 1.87 School 3.93 4.53 5.03 5.27 5.51 5.74 5.98 6.49 7.08
48 199.68 5.61 6.76 Student -0.08 2.06 3.89 4.76 5.61 6.45 7.32 9.15 11.29
199.98 5.50 1.87 School 3.92 4.52 5.02 5.26 5.50 5.73 5.97 6.48 7.07
50 200.23 5.49 6.76 Student -0.19 1.95 3.78 4.64 5.49 6.34 7.20 9.03 11.18
200.23 5.49 1.87 School 3.92 4.51 5.02 5.26 5.49 5.73 5.96 6.47 7.07
52 200.79 5.38 6.76 Student -0.31 1.83 3.66 4.53 5.38 6.23 7.09 8.92 11.06
200.49 5.49 1.87 School 3.91 4.50 5.01 5.25 5.49 5.72 5.96 6.47 7.06
55 201.62 5.20 6.76 Student -0.48 1.66 3.49 4.35 5.20 6.05 6.92 8.75 10.89
200.87 5.48 1.87 School 3.90 4.50 5.00 5.24 5.48 5.71 5.95 6.46 7.05
60 203.03 4.91 6.76 Student -0.77 1.37 3.20 4.06 4.91 5.76 6.62 8.45 10.60
201.52 5.46 1.87 School 3.89 4.48 4.99 5.23 5.46 5.70 5.94 6.44 7.04
65 204.49 4.61 6.76 Student -1.08 1.07 2.90 3.76 4.61 5.46 6.32 8.15 10.30
202.20 5.45 1.87 School 3.87 4.46 4.97 5.21 5.45 5.68 5.92 6.43 7.02
70 206.03 4.29 6.76 Student -1.39 0.75 2.58 3.44 4.29 5.14 6.00 7.84 9.98
202.90 5.43 1.87 School 3.86 4.45 4.96 5.19 5.43 5.66 5.90 6.41 7.00
75 207.69 3.95 6.76 Student -1.74 0.41 2.24 3.10 3.95 4.80 5.66 7.49 9.64
203.67 5.41 1.87 School 3.84 4.43 4.94 5.18 5.41 5.65 5.89 6.39 6.99
80 209.54 3.57 6.76 Student -2.12 0.02 1.86 2.72 3.57 4.42 5.28 7.11 9.25
204.52 5.39 1.87 School 3.82 4.41 4.92 5.16 5.39 5.63 5.87 6.37 6.97
85 211.69 3.12 6.76 Student -2.56 -0.42 1.41 2.27 3.12 3.97 4.83 6.67 8.81
205.51 5.37 1.87 School 3.79 4.39 4.89 5.13 5.37 5.60 5.84 6.35 6.94
90 214.40 2.56 6.76 Student -3.12 -0.98 0.85 1.71 2.56 3.41 4.27 6.11 8.25
206.76 5.34 1.87 School 3.77 4.36 4.87 5.10 5.34 5.57 5.81 6.32 6.91
CGI - Conditional Growth Index CGP - Conditional Growth Percentile
386

Table E.4.17: General Science Grade 5 From Fall To Winter Conditional Growth Percentile
Conditional Growth
Start Status Growth CGP 20 30 40 45 50 55 60 70 80
%ile RIT Mean SD CGI -0.84 -0.52 -0.25 -0.13 0.00 0.13 0.25 0.52 0.84
10 186.06 5.81 5.63 Student 1.07 2.86 4.38 5.10 5.81 6.51 7.23 8.76 10.54
193.70 3.54 1.07 School 2.64 2.98 3.27 3.41 3.54 3.67 3.81 4.10 4.44
20 190.93 5.00 5.63 Student 0.26 2.05 3.57 4.29 5.00 5.71 6.42 7.95 9.74
195.94 3.51 1.07 School 2.61 2.95 3.24 3.38 3.51 3.64 3.78 4.07 4.41
25 192.77 4.69 5.63 Student -0.05 1.74 3.27 3.98 4.69 5.40 6.12 7.64 9.43
196.79 3.50 1.07 School 2.60 2.94 3.23 3.36 3.50 3.63 3.77 4.06 4.40
30 194.43 4.42 5.63 Student -0.32 1.46 2.99 3.71 4.42 5.12 5.84 7.37 9.15
197.56 3.49 1.07 School 2.59 2.93 3.22 3.35 3.49 3.62 3.76 4.05 4.39
35 195.97 4.16 5.63 Student -0.58 1.21 2.73 3.45 4.16 4.87 5.59 7.11 8.90
198.27 3.48 1.07 School 2.58 2.92 3.21 3.34 3.48 3.61 3.75 4.04 4.38
40 197.43 3.92 5.63 Student -0.82 0.97 2.49 3.21 3.92 4.63 5.34 6.87 8.66
198.94 3.47 1.07 School 2.57 2.91 3.20 3.34 3.47 3.60 3.74 4.03 4.37
45 198.84 3.68 5.63 Student -1.05 0.73 2.26 2.98 3.68 4.39 5.11 6.64 8.42
199.59 3.46 1.07 School 2.56 2.90 3.19 3.33 3.46 3.60 3.73 4.02 4.36
48 199.68 3.55 5.63 Student -1.19 0.59 2.12 2.84 3.55 4.25 4.97 6.50 8.28
199.98 3.46 1.07 School 2.56 2.90 3.19 3.32 3.46 3.59 3.73 4.02 4.36
50 200.23 3.45 5.63 Student -1.28 0.50 2.03 2.75 3.45 4.16 4.88 6.40 8.19
200.23 3.45 1.07 School 2.55 2.89 3.18 3.32 3.45 3.59 3.72 4.01 4.35
52 200.79 3.36 5.63 Student -1.38 0.41 1.93 2.65 3.36 4.07 4.79 6.31 8.10
200.49 3.45 1.07 School 2.55 2.89 3.18 3.32 3.45 3.58 3.72 4.01 4.35
55 201.62 3.22 5.63 Student -1.51 0.27 1.80 2.51 3.22 3.93 4.65 6.17 7.96
200.87 3.44 1.07 School 2.54 2.88 3.17 3.31 3.44 3.58 3.72 4.01 4.34
60 203.03 2.99 5.63 Student -1.75 0.04 1.56 2.28 2.99 3.69 4.41 5.94 7.72
201.52 3.44 1.07 School 2.54 2.87 3.16 3.30 3.44 3.57 3.71 4.00 4.34
65 204.49 2.75 5.63 Student -1.99 -0.21 1.32 2.04 2.75 3.45 4.17 5.70 7.48
202.20 3.43 1.07 School 2.53 2.87 3.16 3.29 3.43 3.56 3.70 3.99 4.33
70 206.03 2.49 5.63 Student -2.25 -0.46 1.06 1.78 2.49 3.20 3.92 5.44 7.23
202.90 3.42 1.07 School 2.52 2.86 3.15 3.28 3.42 3.55 3.69 3.98 4.32
75 207.69 2.21 5.63 Student -2.52 -0.74 0.79 1.51 2.21 2.92 3.64 5.17 6.95
203.67 3.41 1.07 School 2.51 2.85 3.14 3.27 3.41 3.54 3.68 3.97 4.31
80 209.54 1.91 5.63 Student -2.83 -1.04 0.48 1.20 1.91 2.61 3.33 4.86 6.64
204.52 3.40 1.07 School 2.50 2.83 3.12 3.26 3.40 3.53 3.67 3.96 4.30
85 211.69 1.55 5.63 Student -3.19 -1.40 0.12 0.84 1.55 2.26 2.98 4.50 6.29
205.51 3.38 1.07 School 2.48 2.82 3.11 3.25 3.38 3.52 3.65 3.94 4.28
90 214.40 1.10 5.63 Student -3.64 -1.85 -0.33 0.39 1.10 1.81 2.53 4.05 5.84
206.76 3.37 1.07 School 2.47 2.81 3.10 3.23 3.37 3.50 3.64 3.93 4.27
CGI - Conditional Growth Index CGP - Conditional Growth Percentile
387
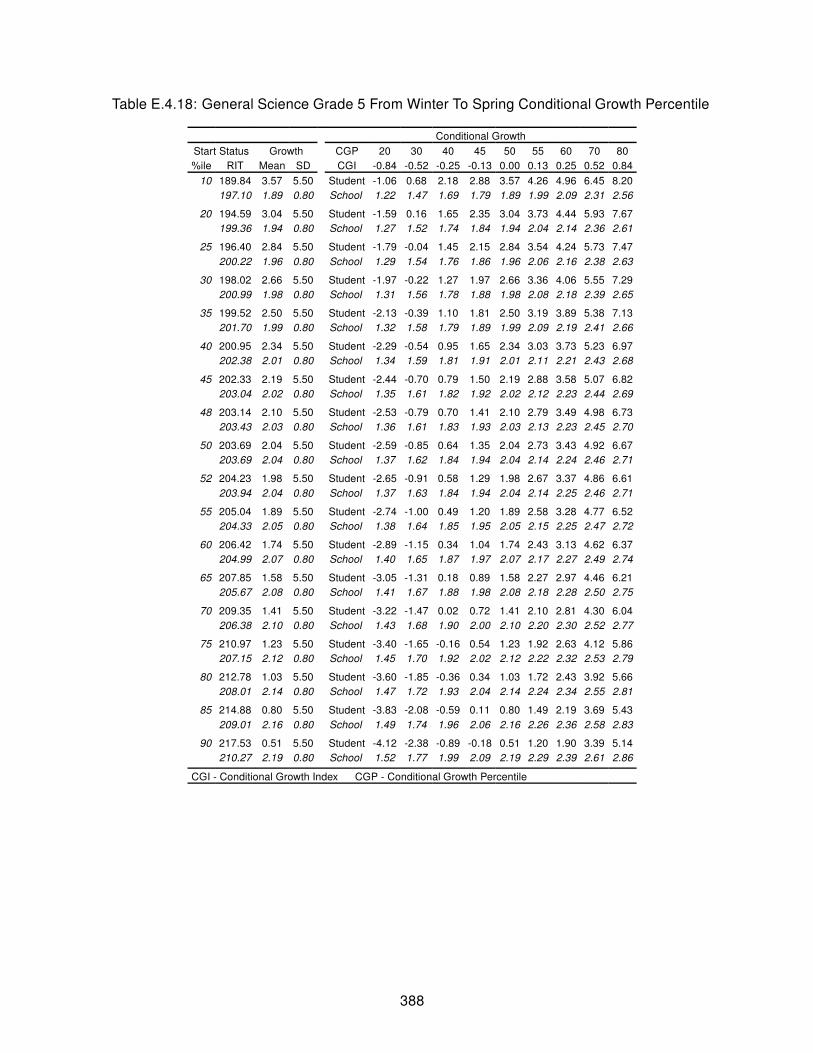
Table E.4.18: General Science Grade 5 From Winter To Spring Conditional Growth Percentile
Conditional Growth
Start Status Growth CGP 20 30 40 45 50 55 60 70 80
%ile RIT Mean SD CGI -0.84 -0.52 -0.25 -0.13 0.00 0.13 0.25 0.52 0.84
10 189.84 3.57 5.50 Student -1.06 0.68 2.18 2.88 3.57 4.26 4.96 6.45 8.20
197.10 1.89 0.80 School 1.22 1.47 1.69 1.79 1.89 1.99 2.09 2.31 2.56
20 194.59 3.04 5.50 Student -1.59 0.16 1.65 2.35 3.04 3.73 4.44 5.93 7.67
199.36 1.94 0.80 School 1.27 1.52 1.74 1.84 1.94 2.04 2.14 2.36 2.61
25 196.40 2.84 5.50 Student -1.79 -0.04 1.45 2.15 2.84 3.54 4.24 5.73 7.47
200.22 1.96 0.80 School 1.29 1.54 1.76 1.86 1.96 2.06 2.16 2.38 2.63
30 198.02 2.66 5.50 Student -1.97 -0.22 1.27 1.97 2.66 3.36 4.06 5.55 7.29
200.99 1.98 0.80 School 1.31 1.56 1.78 1.88 1.98 2.08 2.18 2.39 2.65
35 199.52 2.50 5.50 Student -2.13 -0.39 1.10 1.81 2.50 3.19 3.89 5.38 7.13
201.70 1.99 0.80 School 1.32 1.58 1.79 1.89 1.99 2.09 2.19 2.41 2.66
40 200.95 2.34 5.50 Student -2.29 -0.54 0.95 1.65 2.34 3.03 3.73 5.23 6.97
202.38 2.01 0.80 School 1.34 1.59 1.81 1.91 2.01 2.11 2.21 2.43 2.68
45 202.33 2.19 5.50 Student -2.44 -0.70 0.79 1.50 2.19 2.88 3.58 5.07 6.82
203.04 2.02 0.80 School 1.35 1.61 1.82 1.92 2.02 2.12 2.23 2.44 2.69
48 203.14 2.10 5.50 Student -2.53 -0.79 0.70 1.41 2.10 2.79 3.49 4.98 6.73
203.43 2.03 0.80 School 1.36 1.61 1.83 1.93 2.03 2.13 2.23 2.45 2.70
50 203.69 2.04 5.50 Student -2.59 -0.85 0.64 1.35 2.04 2.73 3.43 4.92 6.67
203.69 2.04 0.80 School 1.37 1.62 1.84 1.94 2.04 2.14 2.24 2.46 2.71
52 204.23 1.98 5.50 Student -2.65 -0.91 0.58 1.29 1.98 2.67 3.37 4.86 6.61
203.94 2.04 0.80 School 1.37 1.63 1.84 1.94 2.04 2.14 2.25 2.46 2.71
55 205.04 1.89 5.50 Student -2.74 -1.00 0.49 1.20 1.89 2.58 3.28 4.77 6.52
204.33 2.05 0.80 School 1.38 1.64 1.85 1.95 2.05 2.15 2.25 2.47 2.72
60 206.42 1.74 5.50 Student -2.89 -1.15 0.34 1.04 1.74 2.43 3.13 4.62 6.37
204.99 2.07 0.80 School 1.40 1.65 1.87 1.97 2.07 2.17 2.27 2.49 2.74
65 207.85 1.58 5.50 Student -3.05 -1.31 0.18 0.89 1.58 2.27 2.97 4.46 6.21
205.67 2.08 0.80 School 1.41 1.67 1.88 1.98 2.08 2.18 2.28 2.50 2.75
70 209.35 1.41 5.50 Student -3.22 -1.47 0.02 0.72 1.41 2.10 2.81 4.30 6.04
206.38 2.10 0.80 School 1.43 1.68 1.90 2.00 2.10 2.20 2.30 2.52 2.77
75 210.97 1.23 5.50 Student -3.40 -1.65 -0.16 0.54 1.23 1.92 2.63 4.12 5.86
207.15 2.12 0.80 School 1.45 1.70 1.92 2.02 2.12 2.22 2.32 2.53 2.79
80 212.78 1.03 5.50 Student -3.60 -1.85 -0.36 0.34 1.03 1.72 2.43 3.92 5.66
208.01 2.14 0.80 School 1.47 1.72 1.93 2.04 2.14 2.24 2.34 2.55 2.81
85 214.88 0.80 5.50 Student -3.83 -2.08 -0.59 0.11 0.80 1.49 2.19 3.69 5.43
209.01 2.16 0.80 School 1.49 1.74 1.96 2.06 2.16 2.26 2.36 2.58 2.83
90 217.53 0.51 5.50 Student -4.12 -2.38 -0.89 -0.18 0.51 1.20 1.90 3.39 5.14
210.27 2.19 0.80 School 1.52 1.77 1.99 2.09 2.19 2.29 2.39 2.61 2.86
CGI - Conditional Growth Index CGP - Conditional Growth Percentile
388
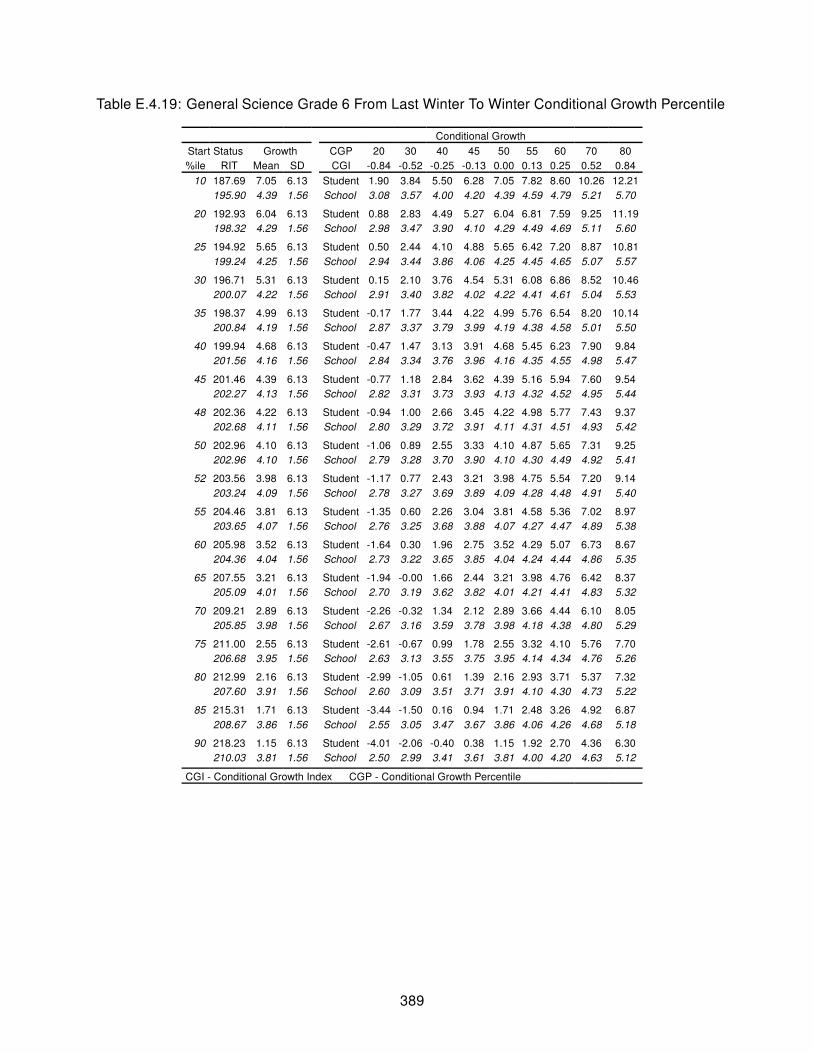
Table E.4.19: General Science Grade 6 From Last Winter To Winter Conditional Growth Percentile
Conditional Growth
Start Status Growth CGP 20 30 40 45 50 55 60 70 80
%ile RIT Mean SD CGI -0.84 -0.52 -0.25 -0.13 0.00 0.13 0.25 0.52 0.84
10 187.69 7.05 6.13 Student 1.90 3.84 5.50 6.28 7.05 7.82 8.60 10.26 12.21
195.90 4.39 1.56 School 3.08 3.57 4.00 4.20 4.39 4.59 4.79 5.21 5.70
20 192.93 6.04 6.13 Student 0.88 2.83 4.49 5.27 6.04 6.81 7.59 9.25 11.19
198.32 4.29 1.56 School 2.98 3.47 3.90 4.10 4.29 4.49 4.69 5.11 5.60
25 194.92 5.65 6.13 Student 0.50 2.44 4.10 4.88 5.65 6.42 7.20 8.87 10.81
199.24 4.25 1.56 School 2.94 3.44 3.86 4.06 4.25 4.45 4.65 5.07 5.57
30 196.71 5.31 6.13 Student 0.15 2.10 3.76 4.54 5.31 6.08 6.86 8.52 10.46
200.07 4.22 1.56 School 2.91 3.40 3.82 4.02 4.22 4.41 4.61 5.04 5.53
35 198.37 4.99 6.13 Student -0.17 1.77 3.44 4.22 4.99 5.76 6.54 8.20 10.14
200.84 4.19 1.56 School 2.87 3.37 3.79 3.99 4.19 4.38 4.58 5.01 5.50
40 199.94 4.68 6.13 Student -0.47 1.47 3.13 3.91 4.68 5.45 6.23 7.90 9.84
201.56 4.16 1.56 School 2.84 3.34 3.76 3.96 4.16 4.35 4.55 4.98 5.47
45 201.46 4.39 6.13 Student -0.77 1.18 2.84 3.62 4.39 5.16 5.94 7.60 9.54
202.27 4.13 1.56 School 2.82 3.31 3.73 3.93 4.13 4.32 4.52 4.95 5.44
48 202.36 4.22 6.13 Student -0.94 1.00 2.66 3.45 4.22 4.98 5.77 7.43 9.37
202.68 4.11 1.56 School 2.80 3.29 3.72 3.91 4.11 4.31 4.51 4.93 5.42
50 202.96 4.10 6.13 Student -1.06 0.89 2.55 3.33 4.10 4.87 5.65 7.31 9.25
202.96 4.10 1.56 School 2.79 3.28 3.70 3.90 4.10 4.30 4.49 4.92 5.41
52 203.56 3.98 6.13 Student -1.17 0.77 2.43 3.21 3.98 4.75 5.54 7.20 9.14
203.24 4.09 1.56 School 2.78 3.27 3.69 3.89 4.09 4.28 4.48 4.91 5.40
55 204.46 3.81 6.13 Student -1.35 0.60 2.26 3.04 3.81 4.58 5.36 7.02 8.97
203.65 4.07 1.56 School 2.76 3.25 3.68 3.88 4.07 4.27 4.47 4.89 5.38
60 205.98 3.52 6.13 Student -1.64 0.30 1.96 2.75 3.52 4.29 5.07 6.73 8.67
204.36 4.04 1.56 School 2.73 3.22 3.65 3.85 4.04 4.24 4.44 4.86 5.35
65 207.55 3.21 6.13 Student -1.94 -0.00 1.66 2.44 3.21 3.98 4.76 6.42 8.37
205.09 4.01 1.56 School 2.70 3.19 3.62 3.82 4.01 4.21 4.41 4.83 5.32
70 209.21 2.89 6.13 Student -2.26 -0.32 1.34 2.12 2.89 3.66 4.44 6.10 8.05
205.85 3.98 1.56 School 2.67 3.16 3.59 3.78 3.98 4.18 4.38 4.80 5.29
75 211.00 2.55 6.13 Student -2.61 -0.67 0.99 1.78 2.55 3.32 4.10 5.76 7.70
206.68 3.95 1.56 School 2.63 3.13 3.55 3.75 3.95 4.14 4.34 4.76 5.26
80 212.99 2.16 6.13 Student -2.99 -1.05 0.61 1.39 2.16 2.93 3.71 5.37 7.32
207.60 3.91 1.56 School 2.60 3.09 3.51 3.71 3.91 4.10 4.30 4.73 5.22
85 215.31 1.71 6.13 Student -3.44 -1.50 0.16 0.94 1.71 2.48 3.26 4.92 6.87
208.67 3.86 1.56 School 2.55 3.05 3.47 3.67 3.86 4.06 4.26 4.68 5.18
90 218.23 1.15 6.13 Student -4.01 -2.06 -0.40 0.38 1.15 1.92 2.70 4.36 6.30
210.03 3.81 1.56 School 2.50 2.99 3.41 3.61 3.81 4.00 4.20 4.63 5.12
CGI - Conditional Growth Index CGP - Conditional Growth Percentile
389

Table E.4.20: General Science Grade 6 From Last Spring To Spring Conditional Growth Percentile
Conditional Growth
Start Status Growth CGP 20 30 40 45 50 55 60 70 80
%ile RIT Mean SD CGI -0.84 -0.52 -0.25 -0.13 0.00 0.13 0.25 0.52 0.84
10 188.87 7.28 6.51 Student 1.80 3.86 5.63 6.46 7.28 8.10 8.93 10.69 12.76
197.57 4.18 1.79 School 2.67 3.24 3.72 3.95 4.18 4.40 4.63 5.11 5.68
20 194.38 6.06 6.51 Student 0.57 2.64 4.41 5.24 6.06 6.87 7.71 9.47 11.54
200.09 4.02 1.79 School 2.51 3.08 3.57 3.80 4.02 4.24 4.47 4.96 5.53
25 196.48 5.59 6.51 Student 0.11 2.18 3.94 4.77 5.59 6.41 7.24 9.01 11.07
201.05 3.96 1.79 School 2.45 3.02 3.51 3.74 3.96 4.19 4.41 4.90 5.47
30 198.36 5.18 6.51 Student -0.31 1.76 3.53 4.36 5.18 5.99 6.83 8.59 10.66
201.91 3.91 1.79 School 2.40 2.97 3.45 3.68 3.91 4.13 4.36 4.85 5.41
35 200.10 4.79 6.51 Student -0.69 1.37 3.14 3.97 4.79 5.61 6.44 8.21 10.27
202.71 3.86 1.79 School 2.35 2.92 3.40 3.63 3.86 4.08 4.31 4.80 5.36
40 201.75 4.42 6.51 Student -1.06 1.01 2.77 3.61 4.42 5.24 6.07 7.84 9.91
203.47 3.81 1.79 School 2.31 2.87 3.36 3.59 3.81 4.04 4.26 4.75 5.32
45 203.35 4.07 6.51 Student -1.41 0.65 2.42 3.25 4.07 4.89 5.72 7.49 9.55
204.20 3.77 1.79 School 2.26 2.83 3.31 3.54 3.77 3.99 4.22 4.70 5.27
48 204.30 3.86 6.51 Student -1.62 0.44 2.21 3.04 3.86 4.68 5.51 7.28 9.34
204.64 3.74 1.79 School 2.23 2.80 3.29 3.51 3.74 3.96 4.19 4.68 5.24
50 204.93 3.72 6.51 Student -1.76 0.31 2.07 2.90 3.72 4.54 5.37 7.14 9.20
204.93 3.72 1.79 School 2.22 2.78 3.27 3.50 3.72 3.95 4.17 4.66 5.23
52 205.56 3.58 6.51 Student -1.90 0.17 1.93 2.76 3.58 4.40 5.23 7.00 9.06
205.21 3.70 1.79 School 2.20 2.77 3.25 3.48 3.70 3.93 4.16 4.64 5.21
55 206.50 3.37 6.51 Student -2.11 -0.04 1.72 2.55 3.37 4.19 5.02 6.79 8.85
205.65 3.68 1.79 School 2.17 2.74 3.22 3.45 3.68 3.90 4.13 4.61 5.18
60 208.10 3.02 6.51 Student -2.46 -0.40 1.37 2.20 3.02 3.84 4.67 6.43 8.50
206.38 3.63 1.79 School 2.13 2.69 3.18 3.41 3.63 3.86 4.08 4.57 5.14
65 209.75 2.65 6.51 Student -2.83 -0.76 1.00 1.83 2.65 3.47 4.30 6.07 8.13
207.14 3.58 1.79 School 2.08 2.65 3.13 3.36 3.58 3.81 4.04 4.52 5.09
70 211.50 2.27 6.51 Student -3.22 -1.15 0.62 1.45 2.27 3.08 3.92 5.68 7.75
207.94 3.53 1.79 School 2.03 2.60 3.08 3.31 3.53 3.76 3.99 4.47 5.04
75 213.38 1.85 6.51 Student -3.63 -1.57 0.20 1.03 1.85 2.67 3.50 5.27 7.33
208.80 3.48 1.79 School 1.98 2.54 3.03 3.26 3.48 3.71 3.93 4.42 4.99
80 215.47 1.39 6.51 Student -4.10 -2.03 -0.26 0.57 1.39 2.20 3.04 4.80 6.87
209.76 3.42 1.79 School 1.92 2.48 2.97 3.20 3.42 3.65 3.88 4.36 4.93
85 217.91 0.85 6.51 Student -4.64 -2.57 -0.80 0.03 0.85 1.66 2.50 4.26 6.33
210.88 3.35 1.79 School 1.85 2.41 2.90 3.13 3.35 3.58 3.81 4.29 4.86
90 220.98 0.17 6.51 Student -5.32 -3.25 -1.48 -0.65 0.17 0.98 1.82 3.58 5.65
212.29 3.27 1.79 School 1.76 2.33 2.81 3.04 3.27 3.49 3.72 4.20 4.77
CGI - Conditional Growth Index CGP - Conditional Growth Percentile
390

Table E.4.21: General Science Grade 6 From Fall To N Fall Conditional Growth Percentile
Conditional Growth
Start Status Growth CGP 20 30 40 45 50 55 60 70 80
%ile RIT Mean SD CGI -0.84 -0.52 -0.25 -0.13 0.00 0.13 0.25 0.52 0.84
10 189.52 6.18 6.98 Student 0.31 2.52 4.41 5.31 6.18 7.06 7.95 9.84 12.06
197.37 4.20 1.77 School 2.71 3.27 3.75 3.98 4.20 4.42 4.65 5.13 5.69
20 194.59 5.58 6.98 Student -0.30 1.92 3.81 4.70 5.58 6.46 7.35 9.24 11.45
199.75 4.28 1.77 School 2.78 3.35 3.83 4.05 4.28 4.50 4.72 5.21 5.77
25 196.52 5.35 6.98 Student -0.53 1.69 3.58 4.47 5.35 6.23 7.12 9.01 11.23
200.66 4.31 1.77 School 2.81 3.38 3.86 4.08 4.31 4.53 4.75 5.24 5.80
30 198.26 5.14 6.98 Student -0.73 1.48 3.38 4.27 5.14 6.02 6.91 8.81 11.02
201.47 4.33 1.77 School 2.84 3.40 3.88 4.11 4.33 4.55 4.78 5.26 5.82
35 199.86 4.95 6.98 Student -0.92 1.29 3.18 4.08 4.95 5.83 6.72 8.61 10.83
202.22 4.36 1.77 School 2.86 3.43 3.91 4.13 4.36 4.58 4.81 5.29 5.85
40 201.38 4.77 6.98 Student -1.10 1.11 3.00 3.90 4.77 5.65 6.54 8.43 10.65
202.94 4.38 1.77 School 2.89 3.45 3.93 4.16 4.38 4.60 4.83 5.31 5.87
45 202.86 4.60 6.98 Student -1.28 0.94 2.83 3.72 4.60 5.47 6.37 8.26 10.47
203.63 4.40 1.77 School 2.91 3.47 3.95 4.18 4.40 4.63 4.85 5.33 5.89
48 203.73 4.49 6.98 Student -1.38 0.83 2.73 3.62 4.49 5.37 6.26 8.15 10.37
204.04 4.42 1.77 School 2.92 3.49 3.97 4.19 4.42 4.64 4.87 5.35 5.91
50 204.31 4.43 6.98 Student -1.45 0.76 2.66 3.55 4.43 5.30 6.19 8.09 10.30
204.31 4.43 1.77 School 2.93 3.50 3.98 4.20 4.43 4.65 4.87 5.35 5.92
52 204.89 4.36 6.98 Student -1.52 0.70 2.59 3.48 4.36 5.23 6.13 8.02 10.23
204.58 4.43 1.77 School 2.94 3.50 3.98 4.21 4.43 4.66 4.88 5.36 5.93
55 205.76 4.25 6.98 Student -1.62 0.59 2.48 3.38 4.25 5.13 6.02 7.91 10.13
204.99 4.45 1.77 School 2.96 3.52 4.00 4.22 4.45 4.67 4.90 5.38 5.94
60 207.23 4.08 6.98 Student -1.80 0.42 2.31 3.20 4.08 4.96 5.85 7.74 9.95
205.68 4.47 1.77 School 2.98 3.54 4.02 4.25 4.47 4.69 4.92 5.40 5.96
65 208.76 3.90 6.98 Student -1.98 0.24 2.13 3.02 3.90 4.77 5.67 7.56 9.77
206.40 4.49 1.77 School 3.00 3.56 4.04 4.27 4.49 4.72 4.94 5.42 5.99
70 210.36 3.71 6.98 Student -2.17 0.05 1.94 2.83 3.71 4.58 5.47 7.37 9.58
207.15 4.52 1.77 School 3.03 3.59 4.07 4.30 4.52 4.74 4.97 5.45 6.01
75 212.09 3.50 6.98 Student -2.37 -0.16 1.73 2.62 3.50 4.38 5.27 7.16 9.38
207.96 4.54 1.77 School 3.05 3.62 4.10 4.32 4.54 4.77 4.99 5.47 6.04
80 214.02 3.27 6.98 Student -2.60 -0.39 1.50 2.39 3.27 4.15 5.04 6.93 9.15
208.87 4.57 1.77 School 3.08 3.64 4.13 4.35 4.57 4.80 5.02 5.50 6.07
85 216.27 3.00 6.98 Student -2.87 -0.66 1.24 2.13 3.00 3.88 4.77 6.66 8.88
209.92 4.61 1.77 School 3.12 3.68 4.16 4.39 4.61 4.83 5.06 5.54 6.10
90 219.10 2.67 6.98 Student -3.21 -0.99 0.90 1.79 2.67 3.55 4.44 6.33 8.54
211.25 4.65 1.77 School 3.16 3.72 4.20 4.43 4.65 4.88 5.10 5.58 6.14
CGI - Conditional Growth Index CGP - Conditional Growth Percentile
391

Table E.4.22: General Science Grade 6 From Fall To Spring Conditional Growth Percentile
Conditional Growth
Start Status Growth CGP 20 30 40 45 50 55 60 70 80
%ile RIT Mean SD CGI -0.84 -0.52 -0.25 -0.13 0.00 0.13 0.25 0.52 0.84
10 189.52 6.92 6.84 Student 1.16 3.33 5.19 6.06 6.92 7.78 8.66 10.51 12.68
197.37 4.29 1.58 School 2.96 3.46 3.89 4.09 4.29 4.49 4.69 5.12 5.62
20 194.59 6.04 6.84 Student 0.28 2.45 4.30 5.18 6.04 6.90 7.77 9.63 11.80
199.75 4.31 1.58 School 2.97 3.48 3.91 4.11 4.31 4.51 4.71 5.14 5.64
25 196.52 5.70 6.84 Student -0.06 2.11 3.97 4.84 5.70 6.56 7.43 9.29 11.46
200.66 4.31 1.58 School 2.98 3.48 3.91 4.11 4.31 4.51 4.71 5.14 5.65
30 198.26 5.40 6.84 Student -0.36 1.81 3.66 4.54 5.40 6.26 7.13 8.99 11.16
201.47 4.32 1.58 School 2.99 3.49 3.92 4.12 4.32 4.52 4.72 5.15 5.65
35 199.86 5.12 6.84 Student -0.64 1.53 3.38 4.26 5.12 5.98 6.85 8.71 10.88
202.22 4.32 1.58 School 2.99 3.49 3.92 4.13 4.32 4.52 4.73 5.15 5.66
40 201.38 4.85 6.84 Student -0.91 1.26 3.12 3.99 4.85 5.71 6.58 8.44 10.61
202.94 4.33 1.58 School 3.00 3.50 3.93 4.13 4.33 4.53 4.73 5.16 5.66
45 202.86 4.59 6.84 Student -1.17 1.00 2.86 3.73 4.59 5.45 6.33 8.18 10.35
203.63 4.33 1.58 School 3.00 3.50 3.93 4.14 4.33 4.53 4.74 5.16 5.67
48 203.73 4.44 6.84 Student -1.32 0.85 2.71 3.58 4.44 5.30 6.17 8.03 10.20
204.04 4.34 1.58 School 3.00 3.51 3.94 4.14 4.34 4.54 4.74 5.17 5.67
50 204.31 4.34 6.84 Student -1.42 0.75 2.60 3.48 4.34 5.20 6.07 7.93 10.10
204.31 4.34 1.58 School 3.01 3.51 3.94 4.14 4.34 4.54 4.74 5.17 5.67
52 204.89 4.24 6.84 Student -1.52 0.65 2.50 3.38 4.24 5.10 5.97 7.83 10.00
204.58 4.34 1.58 School 3.01 3.51 3.94 4.14 4.34 4.54 4.74 5.17 5.67
55 205.76 4.09 6.84 Student -1.68 0.50 2.35 3.23 4.09 4.95 5.82 7.67 9.85
204.99 4.34 1.58 School 3.01 3.51 3.94 4.14 4.34 4.54 4.74 5.17 5.68
60 207.23 3.83 6.84 Student -1.93 0.24 2.09 2.97 3.83 4.69 5.56 7.42 9.59
205.68 4.35 1.58 School 3.02 3.52 3.95 4.15 4.35 4.55 4.75 5.18 5.68
65 208.76 3.56 6.84 Student -2.20 -0.03 1.83 2.70 3.56 4.42 5.30 7.15 9.32
206.40 4.35 1.58 School 3.02 3.52 3.95 4.15 4.35 4.55 4.75 5.18 5.69
70 210.36 3.28 6.84 Student -2.48 -0.31 1.55 2.42 3.28 4.14 5.02 6.87 9.04
207.15 4.36 1.58 School 3.03 3.53 3.96 4.16 4.36 4.56 4.76 5.19 5.69
75 212.09 2.98 6.84 Student -2.78 -0.61 1.24 2.12 2.98 3.84 4.71 6.57 8.74
207.96 4.36 1.58 School 3.03 3.53 3.96 4.17 4.36 4.56 4.77 5.20 5.70
80 214.02 2.64 6.84 Student -3.12 -0.95 0.91 1.78 2.64 3.50 4.38 6.23 8.40
208.87 4.37 1.58 School 3.04 3.54 3.97 4.17 4.37 4.57 4.77 5.20 5.70
85 216.27 2.25 6.84 Student -3.51 -1.34 0.51 1.39 2.25 3.11 3.98 5.84 8.01
209.92 4.38 1.58 School 3.05 3.55 3.98 4.18 4.38 4.58 4.78 5.21 5.71
90 219.10 1.75 6.84 Student -4.01 -1.84 0.02 0.89 1.75 2.61 3.49 5.34 7.51
211.25 4.39 1.58 School 3.06 3.56 3.99 4.19 4.39 4.59 4.79 5.22 5.72
CGI - Conditional Growth Index CGP - Conditional Growth Percentile
392

Table E.4.23: General Science Grade 6 From Fall To Winter Conditional Growth Percentile
Conditional Growth
Start Status Growth CGP 20 30 40 45 50 55 60 70 80
%ile RIT Mean SD CGI -0.84 -0.52 -0.25 -0.13 0.00 0.13 0.25 0.52 0.84
10 189.52 4.88 5.68 Student 0.10 1.90 3.44 4.17 4.88 5.59 6.32 7.86 9.66
197.37 2.72 0.91 School 1.96 2.25 2.49 2.61 2.72 2.84 2.95 3.20 3.49
20 194.59 4.15 5.68 Student -0.63 1.17 2.71 3.44 4.15 4.86 5.59 7.13 8.93
199.75 2.73 0.91 School 1.97 2.26 2.50 2.62 2.73 2.85 2.96 3.21 3.50
25 196.52 3.87 5.68 Student -0.91 0.89 2.43 3.16 3.87 4.59 5.31 6.85 8.66
200.66 2.74 0.91 School 1.97 2.26 2.51 2.62 2.74 2.85 2.97 3.21 3.50
30 198.26 3.62 5.68 Student -1.16 0.64 2.18 2.91 3.62 4.34 5.06 6.60 8.41
201.47 2.74 0.91 School 1.98 2.27 2.51 2.63 2.74 2.85 2.97 3.21 3.50
35 199.86 3.39 5.68 Student -1.39 0.41 1.95 2.68 3.39 4.11 4.83 6.37 8.18
202.22 2.74 0.91 School 1.98 2.27 2.51 2.63 2.74 2.86 2.97 3.22 3.51
40 201.38 3.17 5.68 Student -1.61 0.19 1.73 2.46 3.17 3.89 4.61 6.15 7.96
202.94 2.75 0.91 School 1.98 2.27 2.52 2.63 2.75 2.86 2.98 3.22 3.51
45 202.86 2.96 5.68 Student -1.82 -0.02 1.52 2.25 2.96 3.67 4.40 5.94 7.74
203.63 2.75 0.91 School 1.99 2.27 2.52 2.63 2.75 2.86 2.98 3.22 3.51
48 203.73 2.83 5.68 Student -1.95 -0.15 1.39 2.12 2.83 3.55 4.27 5.82 7.62
204.04 2.75 0.91 School 1.99 2.28 2.52 2.64 2.75 2.86 2.98 3.23 3.51
50 204.31 2.75 5.68 Student -2.03 -0.23 1.31 2.04 2.75 3.47 4.19 5.73 7.54
204.31 2.75 0.91 School 1.99 2.28 2.52 2.64 2.75 2.87 2.98 3.23 3.51
52 204.89 2.67 5.68 Student -2.12 -0.31 1.23 1.95 2.67 3.38 4.11 5.65 7.45
204.58 2.75 0.91 School 1.99 2.28 2.52 2.64 2.75 2.87 2.98 3.23 3.51
55 205.76 2.54 5.68 Student -2.24 -0.44 1.10 1.83 2.54 3.26 3.98 5.52 7.33
204.99 2.75 0.91 School 1.99 2.28 2.52 2.64 2.75 2.87 2.98 3.23 3.52
60 207.23 2.33 5.68 Student -2.45 -0.65 0.89 1.62 2.33 3.04 3.77 5.31 7.11
205.68 2.76 0.91 School 1.99 2.28 2.53 2.64 2.76 2.87 2.99 3.23 3.52
65 208.76 2.11 5.68 Student -2.67 -0.87 0.67 1.40 2.11 2.83 3.55 5.09 6.90
206.40 2.76 0.91 School 2.00 2.28 2.53 2.65 2.76 2.87 2.99 3.23 3.52
70 210.36 1.88 5.68 Student -2.90 -1.10 0.44 1.17 1.88 2.59 3.32 4.86 6.66
207.15 2.76 0.91 School 2.00 2.29 2.53 2.65 2.76 2.88 2.99 3.24 3.53
75 212.09 1.63 5.68 Student -3.15 -1.35 0.19 0.92 1.63 2.35 3.07 4.61 6.42
207.96 2.77 0.91 School 2.00 2.29 2.54 2.65 2.77 2.88 3.00 3.24 3.53
80 214.02 1.35 5.68 Student -3.43 -1.63 -0.09 0.64 1.35 2.07 2.79 4.33 6.14
208.87 2.77 0.91 School 2.01 2.29 2.54 2.66 2.77 2.88 3.00 3.24 3.53
85 216.27 1.03 5.68 Student -3.75 -1.95 -0.41 0.32 1.03 1.74 2.47 4.01 5.81
209.92 2.77 0.91 School 2.01 2.30 2.54 2.66 2.77 2.89 3.00 3.25 3.54
90 219.10 0.62 5.68 Student -4.16 -2.36 -0.82 -0.09 0.62 1.34 2.06 3.60 5.41
211.25 2.78 0.91 School 2.02 2.30 2.55 2.67 2.78 2.89 3.01 3.25 3.54
CGI - Conditional Growth Index CGP - Conditional Growth Percentile
393

Table E.4.24: General Science Grade 6 From Winter To Spring Conditional Growth Percentile
Conditional Growth
Start Status Growth CGP 20 30 40 45 50 55 60 70 80
%ile RIT Mean SD CGI -0.84 -0.52 -0.25 -0.13 0.00 0.13 0.25 0.52 0.84
10 192.45 2.94 5.53 Student -1.71 0.04 1.54 2.25 2.94 3.64 4.34 5.84 7.60
200.00 1.42 0.67 School 0.86 1.07 1.25 1.34 1.42 1.51 1.59 1.77 1.99
20 197.47 2.48 5.53 Student -2.18 -0.42 1.07 1.78 2.48 3.17 3.88 5.38 7.13
202.42 1.48 0.67 School 0.92 1.13 1.31 1.40 1.48 1.56 1.65 1.83 2.04
25 199.37 2.30 5.53 Student -2.36 -0.60 0.90 1.60 2.30 2.99 3.70 5.20 6.95
203.34 1.50 0.67 School 0.94 1.15 1.33 1.42 1.50 1.59 1.67 1.85 2.06
30 201.08 2.14 5.53 Student -2.51 -0.76 0.74 1.45 2.14 2.84 3.54 5.04 6.80
204.17 1.52 0.67 School 0.96 1.17 1.35 1.44 1.52 1.60 1.69 1.87 2.08
35 202.67 1.99 5.53 Student -2.66 -0.91 0.59 1.30 1.99 2.69 3.40 4.89 6.65
204.94 1.54 0.67 School 0.98 1.19 1.37 1.45 1.54 1.62 1.71 1.89 2.10
40 204.17 1.85 5.53 Student -2.80 -1.05 0.45 1.16 1.85 2.55 3.26 4.76 6.51
205.66 1.56 0.67 School 0.99 1.20 1.39 1.47 1.56 1.64 1.72 1.91 2.12
45 205.63 1.72 5.53 Student -2.93 -1.18 0.32 1.03 1.72 2.42 3.12 4.62 6.38
206.37 1.57 0.67 School 1.01 1.22 1.40 1.49 1.57 1.66 1.74 1.92 2.13
48 206.49 1.64 5.53 Student -3.01 -1.26 0.24 0.95 1.64 2.34 3.04 4.54 6.30
206.78 1.58 0.67 School 1.02 1.23 1.41 1.50 1.58 1.67 1.75 1.93 2.14
50 207.06 1.59 5.53 Student -3.07 -1.31 0.19 0.89 1.59 2.28 2.99 4.49 6.24
207.06 1.59 0.67 School 1.03 1.24 1.42 1.50 1.59 1.67 1.76 1.94 2.15
52 207.63 1.53 5.53 Student -3.12 -1.37 0.13 0.84 1.53 2.23 2.94 4.43 6.19
207.34 1.59 0.67 School 1.03 1.24 1.42 1.51 1.59 1.68 1.76 1.94 2.16
55 208.49 1.45 5.53 Student -3.20 -1.45 0.05 0.76 1.45 2.15 2.86 4.36 6.11
207.75 1.60 0.67 School 1.04 1.25 1.43 1.52 1.60 1.69 1.77 1.95 2.17
60 209.95 1.32 5.53 Student -3.34 -1.58 -0.08 0.62 1.32 2.01 2.72 4.22 5.97
208.46 1.62 0.67 School 1.06 1.27 1.45 1.54 1.62 1.70 1.79 1.97 2.18
65 211.45 1.18 5.53 Student -3.47 -1.72 -0.22 0.49 1.18 1.88 2.58 4.08 5.84
209.18 1.64 0.67 School 1.07 1.29 1.47 1.55 1.64 1.72 1.81 1.99 2.20
70 213.04 1.03 5.53 Student -3.62 -1.87 -0.37 0.34 1.03 1.73 2.43 3.93 5.69
209.95 1.65 0.67 School 1.09 1.30 1.48 1.57 1.65 1.74 1.82 2.00 2.22
75 214.75 0.88 5.53 Student -3.78 -2.03 -0.53 0.18 0.88 1.57 2.28 3.78 5.53
210.78 1.67 0.67 School 1.11 1.32 1.50 1.59 1.67 1.76 1.84 2.02 2.24
80 216.65 0.70 5.53 Student -3.96 -2.20 -0.70 0.00 0.70 1.39 2.10 3.60 5.35
211.70 1.69 0.67 School 1.13 1.34 1.53 1.61 1.69 1.78 1.86 2.05 2.26
85 218.88 0.49 5.53 Student -4.16 -2.41 -0.91 -0.20 0.49 1.19 1.89 3.39 5.15
212.77 1.72 0.67 School 1.16 1.37 1.55 1.64 1.72 1.80 1.89 2.07 2.28
90 221.67 0.23 5.53 Student -4.42 -2.67 -1.17 -0.46 0.23 0.93 1.64 3.13 4.89
214.12 1.75 0.67 School 1.19 1.40 1.58 1.67 1.75 1.83 1.92 2.10 2.31
CGI - Conditional Growth Index CGP - Conditional Growth Percentile
394

Table E.4.25: General Science Grade 7 From Last Winter To Winter Conditional Growth Percentile
Conditional Growth
Start Status Growth CGP 20 30 40 45 50 55 60 70 80
%ile RIT Mean SD CGI -0.84 -0.52 -0.25 -0.13 0.00 0.13 0.25 0.52 0.84
10 190.57 5.76 5.97 Student 0.74 2.63 4.25 5.01 5.76 6.51 7.27 8.89 10.78
199.12 3.62 1.38 School 2.46 2.90 3.27 3.45 3.62 3.80 3.97 4.34 4.78
20 195.88 4.96 5.97 Student -0.07 1.83 3.44 4.21 4.96 5.71 6.47 8.09 9.98
201.50 3.55 1.38 School 2.39 2.83 3.20 3.38 3.55 3.73 3.90 4.27 4.71
25 197.90 4.65 5.97 Student -0.37 1.52 3.14 3.90 4.65 5.40 6.16 7.78 9.67
202.40 3.53 1.38 School 2.37 2.80 3.18 3.35 3.53 3.70 3.87 4.25 4.68
30 199.72 4.38 5.97 Student -0.65 1.25 2.87 3.63 4.38 5.13 5.89 7.51 9.40
203.21 3.50 1.38 School 2.34 2.78 3.15 3.33 3.50 3.68 3.85 4.22 4.66
35 201.40 4.12 5.97 Student -0.90 0.99 2.61 3.37 4.12 4.87 5.64 7.25 9.15
203.97 3.48 1.38 School 2.32 2.76 3.13 3.31 3.48 3.65 3.83 4.20 4.64
40 202.99 3.88 5.97 Student -1.14 0.75 2.37 3.13 3.88 4.63 5.39 7.01 8.91
204.68 3.46 1.38 School 2.30 2.74 3.11 3.29 3.46 3.63 3.81 4.18 4.62
45 204.53 3.65 5.97 Student -1.37 0.52 2.14 2.90 3.65 4.40 5.16 6.78 8.67
205.37 3.44 1.38 School 2.28 2.72 3.09 3.27 3.44 3.61 3.79 4.16 4.60
48 205.45 3.51 5.97 Student -1.51 0.38 2.00 2.76 3.51 4.26 5.02 6.64 8.53
205.78 3.43 1.38 School 2.27 2.71 3.08 3.25 3.43 3.60 3.78 4.15 4.58
50 206.05 3.42 5.97 Student -1.60 0.29 1.91 2.67 3.42 4.17 4.93 6.55 8.44
206.05 3.42 1.38 School 2.26 2.70 3.07 3.25 3.42 3.59 3.77 4.14 4.58
52 206.66 3.33 5.97 Student -1.70 0.20 1.82 2.58 3.33 4.08 4.84 6.46 8.35
206.32 3.41 1.38 School 2.25 2.69 3.06 3.24 3.41 3.58 3.76 4.13 4.57
55 207.57 3.19 5.97 Student -1.83 0.06 1.68 2.44 3.19 3.94 4.70 6.32 8.21
206.73 3.40 1.38 School 2.24 2.68 3.05 3.23 3.40 3.57 3.75 4.12 4.56
60 209.11 2.96 5.97 Student -2.07 -0.17 1.44 2.21 2.96 3.71 4.47 6.09 7.98
207.42 3.38 1.38 School 2.22 2.66 3.03 3.21 3.38 3.55 3.73 4.10 4.54
65 210.71 2.71 5.97 Student -2.31 -0.42 1.20 1.96 2.71 3.46 4.23 5.84 7.74
208.14 3.36 1.38 School 2.20 2.64 3.01 3.18 3.36 3.53 3.71 4.08 4.52
70 212.39 2.46 5.97 Student -2.56 -0.67 0.95 1.71 2.46 3.21 3.97 5.59 7.48
208.89 3.34 1.38 School 2.18 2.61 2.99 3.16 3.34 3.51 3.68 4.06 4.49
75 214.20 2.19 5.97 Student -2.84 -0.94 0.67 1.44 2.19 2.94 3.70 5.32 7.21
209.70 3.31 1.38 School 2.15 2.59 2.96 3.14 3.31 3.48 3.66 4.03 4.47
80 216.22 1.88 5.97 Student -3.14 -1.25 0.37 1.13 1.88 2.63 3.39 5.01 6.90
210.61 3.28 1.38 School 2.13 2.56 2.94 3.11 3.28 3.46 3.63 4.01 4.44
85 218.58 1.52 5.97 Student -3.50 -1.61 0.01 0.77 1.52 2.27 3.04 4.65 6.55
211.66 3.25 1.38 School 2.10 2.53 2.91 3.08 3.25 3.43 3.60 3.98 4.41
90 221.54 1.08 5.97 Student -3.95 -2.05 -0.44 0.33 1.08 1.83 2.59 4.21 6.10
212.99 3.21 1.38 School 2.06 2.49 2.87 3.04 3.21 3.39 3.56 3.94 4.37
CGI - Conditional Growth Index CGP - Conditional Growth Percentile
395

Table E.4.26: General Science Grade 7 From Last Spring To Spring Conditional Growth Percentile
Conditional Growth
Start Status Growth CGP 20 30 40 45 50 55 60 70 80
%ile RIT Mean SD CGI -0.84 -0.52 -0.25 -0.13 0.00 0.13 0.25 0.52 0.84
10 191.44 6.09 6.44 Student 0.67 2.72 4.46 5.28 6.09 6.90 7.72 9.47 11.51
200.57 3.44 1.66 School 2.04 2.56 3.01 3.23 3.44 3.64 3.86 4.31 4.83
20 197.01 5.10 6.44 Student -0.32 1.72 3.47 4.29 5.10 5.91 6.73 8.48 10.52
203.01 3.35 1.66 School 1.96 2.48 2.93 3.14 3.35 3.56 3.77 4.22 4.75
25 199.12 4.72 6.44 Student -0.70 1.34 3.09 3.91 4.72 5.53 6.35 8.10 10.14
203.93 3.32 1.66 School 1.93 2.45 2.90 3.11 3.32 3.53 3.74 4.19 4.72
30 201.02 4.38 6.44 Student -1.04 1.00 2.75 3.57 4.38 5.19 6.01 7.76 9.80
204.76 3.29 1.66 School 1.90 2.42 2.87 3.09 3.29 3.50 3.71 4.16 4.69
35 202.78 4.07 6.44 Student -1.35 0.69 2.44 3.26 4.07 4.88 5.70 7.44 9.49
205.53 3.27 1.66 School 1.87 2.40 2.85 3.06 3.27 3.48 3.69 4.14 4.66
40 204.45 3.77 6.44 Student -1.65 0.39 2.14 2.96 3.77 4.58 5.40 7.15 9.19
206.26 3.24 1.66 School 1.85 2.37 2.82 3.04 3.24 3.45 3.66 4.11 4.64
45 206.07 3.48 6.44 Student -1.94 0.10 1.85 2.67 3.48 4.29 5.11 6.86 8.90
206.97 3.22 1.66 School 1.82 2.35 2.80 3.01 3.22 3.43 3.64 4.09 4.62
48 207.03 3.31 6.44 Student -2.11 -0.07 1.68 2.50 3.31 4.12 4.94 6.69 8.73
207.38 3.21 1.66 School 1.81 2.34 2.79 3.00 3.21 3.41 3.63 4.08 4.60
50 207.66 3.20 6.44 Student -2.22 -0.18 1.57 2.39 3.20 4.01 4.83 6.57 8.62
207.66 3.20 1.66 School 1.80 2.33 2.78 2.99 3.20 3.41 3.62 4.07 4.59
52 208.30 3.08 6.44 Student -2.34 -0.29 1.45 2.27 3.08 3.89 4.72 6.46 8.50
207.94 3.19 1.66 School 1.79 2.32 2.77 2.98 3.19 3.40 3.61 4.06 4.58
55 209.25 2.91 6.44 Student -2.51 -0.46 1.28 2.10 2.91 3.72 4.54 6.29 8.33
208.36 3.17 1.66 School 1.78 2.30 2.75 2.97 3.17 3.38 3.59 4.04 4.57
60 210.87 2.62 6.44 Student -2.79 -0.75 0.99 1.82 2.62 3.43 4.26 6.00 8.04
209.06 3.15 1.66 School 1.75 2.28 2.73 2.94 3.15 3.36 3.57 4.02 4.55
65 212.54 2.33 6.44 Student -3.09 -1.05 0.70 1.52 2.33 3.14 3.96 5.70 7.75
209.79 3.13 1.66 School 1.73 2.26 2.70 2.92 3.13 3.33 3.55 4.00 4.52
70 214.30 2.01 6.44 Student -3.41 -1.36 0.38 1.20 2.01 2.82 3.64 5.39 7.43
210.56 3.10 1.66 School 1.70 2.23 2.68 2.89 3.10 3.31 3.52 3.97 4.50
75 216.20 1.67 6.44 Student -3.75 -1.70 0.04 0.86 1.67 2.48 3.30 5.05 7.09
211.39 3.07 1.66 School 1.68 2.20 2.65 2.86 3.07 3.28 3.49 3.94 4.47
80 218.32 1.30 6.44 Student -4.12 -2.08 -0.34 0.49 1.30 2.10 2.93 4.67 6.72
212.32 3.04 1.66 School 1.64 2.17 2.62 2.83 3.04 3.25 3.46 3.91 4.44
85 220.78 0.86 6.44 Student -4.56 -2.52 -0.78 0.05 0.86 1.66 2.49 4.23 6.27
213.39 3.00 1.66 School 1.61 2.13 2.58 2.80 3.00 3.21 3.42 3.87 4.40
90 223.88 0.30 6.44 Student -5.12 -3.08 -1.33 -0.51 0.30 1.11 1.93 3.68 5.72
214.75 2.96 1.66 School 1.56 2.09 2.54 2.75 2.96 3.17 3.38 3.83 4.36
CGI - Conditional Growth Index CGP - Conditional Growth Percentile
396

Table E.4.27: General Science Grade 7 From Fall To N Fall Conditional Growth Percentile
Conditional Growth
Start Status Growth CGP 20 30 40 45 50 55 60 70 80
%ile RIT Mean SD CGI -0.84 -0.52 -0.25 -0.13 0.00 0.13 0.25 0.52 0.84
10 191.90 5.88 6.62 Student 0.31 2.41 4.21 5.05 5.88 6.72 7.56 9.36 11.46
200.39 4.38 1.48 School 3.13 3.60 4.01 4.20 4.38 4.57 4.76 5.16 5.63
20 197.14 5.37 6.62 Student -0.20 1.90 3.69 4.54 5.37 6.20 7.05 8.84 10.94
202.72 4.38 1.48 School 3.13 3.60 4.01 4.20 4.38 4.57 4.76 5.16 5.63
25 199.14 5.17 6.62 Student -0.40 1.70 3.49 4.34 5.17 6.00 6.85 8.64 10.74
203.61 4.38 1.48 School 3.13 3.60 4.01 4.20 4.38 4.57 4.76 5.16 5.63
30 200.93 5.00 6.62 Student -0.58 1.52 3.32 4.16 5.00 5.83 6.67 8.47 10.57
204.40 4.38 1.48 School 3.13 3.60 4.01 4.20 4.38 4.57 4.76 5.16 5.63
35 202.59 4.83 6.62 Student -0.74 1.36 3.16 4.00 4.83 5.66 6.51 8.30 10.41
205.14 4.38 1.48 School 3.13 3.60 4.01 4.19 4.38 4.57 4.76 5.16 5.63
40 204.16 4.68 6.62 Student -0.89 1.21 3.00 3.85 4.68 5.51 6.36 8.15 10.25
205.84 4.38 1.48 School 3.13 3.60 4.01 4.19 4.38 4.57 4.76 5.16 5.63
45 205.68 4.53 6.62 Student -1.04 1.06 2.85 3.70 4.53 5.36 6.21 8.00 10.10
206.51 4.38 1.48 School 3.13 3.60 4.00 4.19 4.38 4.57 4.76 5.16 5.63
48 206.58 4.44 6.62 Student -1.13 0.97 2.76 3.61 4.44 5.27 6.12 7.91 10.01
206.91 4.38 1.48 School 3.13 3.60 4.00 4.19 4.38 4.57 4.76 5.16 5.63
50 207.18 4.38 6.62 Student -1.19 0.91 2.70 3.55 4.38 5.21 6.06 7.85 9.95
207.18 4.38 1.48 School 3.13 3.60 4.00 4.19 4.38 4.57 4.76 5.16 5.63
52 207.78 4.32 6.62 Student -1.25 0.85 2.64 3.49 4.32 5.15 6.00 7.79 9.89
207.45 4.38 1.48 School 3.13 3.60 4.00 4.19 4.38 4.57 4.76 5.16 5.63
55 208.68 4.23 6.62 Student -1.34 0.76 2.56 3.40 4.23 5.07 5.91 7.71 9.81
207.85 4.38 1.48 School 3.13 3.60 4.00 4.19 4.38 4.57 4.76 5.16 5.63
60 210.20 4.08 6.62 Student -1.49 0.61 2.41 3.25 4.08 4.92 5.76 7.56 9.66
208.52 4.38 1.48 School 3.13 3.60 4.00 4.19 4.38 4.57 4.76 5.16 5.63
65 211.78 3.93 6.62 Student -1.64 0.46 2.25 3.10 3.93 4.76 5.61 7.40 9.50
209.22 4.38 1.48 School 3.13 3.60 4.00 4.19 4.38 4.57 4.76 5.16 5.63
70 213.43 3.77 6.62 Student -1.81 0.29 2.09 2.93 3.77 4.60 5.44 7.24 9.34
209.96 4.38 1.48 School 3.13 3.60 4.00 4.19 4.38 4.57 4.76 5.16 5.63
75 215.22 3.59 6.62 Student -1.98 0.12 1.91 2.76 3.59 4.42 5.27 7.06 9.16
210.76 4.38 1.48 School 3.13 3.60 4.00 4.19 4.38 4.57 4.76 5.16 5.63
80 217.22 3.39 6.62 Student -2.18 -0.08 1.72 2.56 3.39 4.22 5.07 6.86 8.96
211.64 4.38 1.48 School 3.13 3.60 4.00 4.19 4.38 4.57 4.75 5.16 5.63
85 219.54 3.16 6.62 Student -2.41 -0.31 1.49 2.33 3.16 4.00 4.84 6.64 8.74
212.67 4.38 1.48 School 3.13 3.60 4.00 4.19 4.38 4.57 4.75 5.16 5.63
90 222.46 2.88 6.62 Student -2.70 -0.60 1.20 2.04 2.88 3.71 4.55 6.35 8.45
213.97 4.38 1.48 School 3.13 3.60 4.00 4.19 4.38 4.56 4.75 5.16 5.63
CGI - Conditional Growth Index CGP - Conditional Growth Percentile
397

Table E.4.28: General Science Grade 7 From Fall To Spring Conditional Growth Percentile
Conditional Growth
Start Status Growth CGP 20 30 40 45 50 55 60 70 80
%ile RIT Mean SD CGI -0.84 -0.52 -0.25 -0.13 0.00 0.13 0.25 0.52 0.84
10 191.90 5.99 6.87 Student 0.21 2.39 4.25 5.12 5.99 6.85 7.73 9.59 11.77
200.39 3.52 1.38 School 2.36 2.80 3.17 3.35 3.52 3.69 3.87 4.24 4.68
20 197.14 5.19 6.87 Student -0.59 1.59 3.45 4.33 5.19 6.06 6.93 8.80 10.97
202.72 3.57 1.38 School 2.41 2.85 3.22 3.40 3.57 3.75 3.92 4.30 4.74
25 199.14 4.89 6.87 Student -0.89 1.29 3.15 4.03 4.89 5.76 6.63 8.49 10.67
203.61 3.59 1.38 School 2.43 2.87 3.24 3.42 3.59 3.77 3.94 4.32 4.76
30 200.93 4.62 6.87 Student -1.16 1.02 2.88 3.76 4.62 5.49 6.36 8.22 10.40
204.40 3.61 1.38 School 2.45 2.89 3.26 3.44 3.61 3.79 3.96 4.34 4.77
35 202.59 4.37 6.87 Student -1.41 0.77 2.63 3.51 4.37 5.23 6.11 7.97 10.15
205.14 3.63 1.38 School 2.47 2.91 3.28 3.46 3.63 3.80 3.98 4.35 4.79
40 204.16 4.13 6.87 Student -1.65 0.53 2.39 3.27 4.13 5.00 5.87 7.74 9.91
205.84 3.65 1.38 School 2.48 2.92 3.30 3.47 3.65 3.82 4.00 4.37 4.81
45 205.68 3.90 6.87 Student -1.88 0.30 2.16 3.04 3.90 4.77 5.64 7.50 9.68
206.51 3.66 1.38 School 2.50 2.94 3.31 3.49 3.66 3.84 4.01 4.39 4.82
48 206.58 3.77 6.87 Student -2.01 0.17 2.03 2.90 3.77 4.63 5.51 7.37 9.55
206.91 3.67 1.38 School 2.51 2.95 3.32 3.50 3.67 3.84 4.02 4.39 4.83
50 207.18 3.68 6.87 Student -2.10 0.08 1.94 2.81 3.68 4.54 5.42 7.28 9.46
207.18 3.68 1.38 School 2.51 2.95 3.33 3.50 3.68 3.85 4.03 4.40 4.84
52 207.78 3.59 6.87 Student -2.19 -0.01 1.85 2.72 3.59 4.45 5.33 7.19 9.37
207.45 3.68 1.38 School 2.52 2.96 3.33 3.51 3.68 3.86 4.03 4.41 4.85
55 208.68 3.45 6.87 Student -2.33 -0.15 1.71 2.59 3.45 4.31 5.19 7.05 9.23
207.85 3.69 1.38 School 2.53 2.97 3.34 3.52 3.69 3.87 4.04 4.42 4.85
60 210.20 3.22 6.87 Student -2.56 -0.38 1.48 2.36 3.22 4.08 4.96 6.82 9.00
208.52 3.71 1.38 School 2.55 2.98 3.36 3.53 3.71 3.88 4.06 4.43 4.87
65 211.78 2.98 6.87 Student -2.80 -0.62 1.24 2.12 2.98 3.85 4.72 6.58 8.76
209.22 3.72 1.38 School 2.56 3.00 3.37 3.55 3.72 3.90 4.07 4.45 4.89
70 213.43 2.73 6.87 Student -3.05 -0.87 0.99 1.87 2.73 3.59 4.47 6.33 8.51
209.96 3.74 1.38 School 2.58 3.02 3.39 3.57 3.74 3.91 4.09 4.47 4.90
75 215.22 2.46 6.87 Student -3.32 -1.14 0.72 1.60 2.46 3.32 4.20 6.06 8.24
210.76 3.76 1.38 School 2.60 3.04 3.41 3.59 3.76 3.93 4.11 4.48 4.92
80 217.22 2.16 6.87 Student -3.62 -1.44 0.42 1.30 2.16 3.02 3.90 5.76 7.94
211.64 3.78 1.38 School 2.62 3.06 3.43 3.61 3.78 3.95 4.13 4.50 4.94
85 219.54 1.81 6.87 Student -3.97 -1.79 0.07 0.95 1.81 2.67 3.55 5.41 7.59
212.67 3.80 1.38 School 2.64 3.08 3.45 3.63 3.80 3.98 4.15 4.53 4.97
90 222.46 1.37 6.87 Student -4.41 -2.23 -0.37 0.50 1.37 2.23 3.11 4.97 7.15
213.97 3.83 1.38 School 2.67 3.11 3.48 3.66 3.83 4.01 4.18 4.56 5.00
CGI - Conditional Growth Index CGP - Conditional Growth Percentile
398
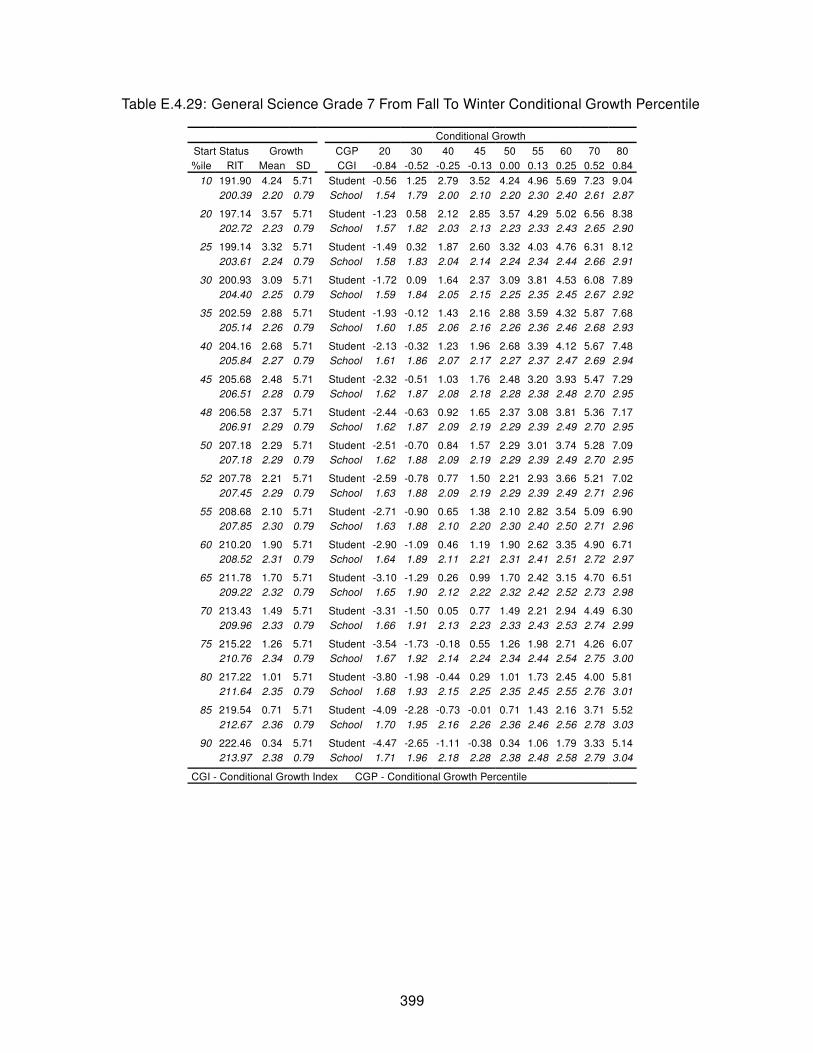
Table E.4.29: General Science Grade 7 From Fall To Winter Conditional Growth Percentile
Conditional Growth
Start Status Growth CGP 20 30 40 45 50 55 60 70 80
%ile RIT Mean SD CGI -0.84 -0.52 -0.25 -0.13 0.00 0.13 0.25 0.52 0.84
10 191.90 4.24 5.71 Student -0.56 1.25 2.79 3.52 4.24 4.96 5.69 7.23 9.04
200.39 2.20 0.79 School 1.54 1.79 2.00 2.10 2.20 2.30 2.40 2.61 2.87
20 197.14 3.57 5.71 Student -1.23 0.58 2.12 2.85 3.57 4.29 5.02 6.56 8.38
202.72 2.23 0.79 School 1.57 1.82 2.03 2.13 2.23 2.33 2.43 2.65 2.90
25 199.14 3.32 5.71 Student -1.49 0.32 1.87 2.60 3.32 4.03 4.76 6.31 8.12
203.61 2.24 0.79 School 1.58 1.83 2.04 2.14 2.24 2.34 2.44 2.66 2.91
30 200.93 3.09 5.71 Student -1.72 0.09 1.64 2.37 3.09 3.81 4.53 6.08 7.89
204.40 2.25 0.79 School 1.59 1.84 2.05 2.15 2.25 2.35 2.45 2.67 2.92
35 202.59 2.88 5.71 Student -1.93 -0.12 1.43 2.16 2.88 3.59 4.32 5.87 7.68
205.14 2.26 0.79 School 1.60 1.85 2.06 2.16 2.26 2.36 2.46 2.68 2.93
40 204.16 2.68 5.71 Student -2.13 -0.32 1.23 1.96 2.68 3.39 4.12 5.67 7.48
205.84 2.27 0.79 School 1.61 1.86 2.07 2.17 2.27 2.37 2.47 2.69 2.94
45 205.68 2.48 5.71 Student -2.32 -0.51 1.03 1.76 2.48 3.20 3.93 5.47 7.29
206.51 2.28 0.79 School 1.62 1.87 2.08 2.18 2.28 2.38 2.48 2.70 2.95
48 206.58 2.37 5.71 Student -2.44 -0.63 0.92 1.65 2.37 3.08 3.81 5.36 7.17
206.91 2.29 0.79 School 1.62 1.87 2.09 2.19 2.29 2.39 2.49 2.70 2.95
50 207.18 2.29 5.71 Student -2.51 -0.70 0.84 1.57 2.29 3.01 3.74 5.28 7.09
207.18 2.29 0.79 School 1.62 1.88 2.09 2.19 2.29 2.39 2.49 2.70 2.95
52 207.78 2.21 5.71 Student -2.59 -0.78 0.77 1.50 2.21 2.93 3.66 5.21 7.02
207.45 2.29 0.79 School 1.63 1.88 2.09 2.19 2.29 2.39 2.49 2.71 2.96
55 208.68 2.10 5.71 Student -2.71 -0.90 0.65 1.38 2.10 2.82 3.54 5.09 6.90
207.85 2.30 0.79 School 1.63 1.88 2.10 2.20 2.30 2.40 2.50 2.71 2.96
60 210.20 1.90 5.71 Student -2.90 -1.09 0.46 1.19 1.90 2.62 3.35 4.90 6.71
208.52 2.31 0.79 School 1.64 1.89 2.11 2.21 2.31 2.41 2.51 2.72 2.97
65 211.78 1.70 5.71 Student -3.10 -1.29 0.26 0.99 1.70 2.42 3.15 4.70 6.51
209.22 2.32 0.79 School 1.65 1.90 2.12 2.22 2.32 2.42 2.52 2.73 2.98
70 213.43 1.49 5.71 Student -3.31 -1.50 0.05 0.77 1.49 2.21 2.94 4.49 6.30
209.96 2.33 0.79 School 1.66 1.91 2.13 2.23 2.33 2.43 2.53 2.74 2.99
75 215.22 1.26 5.71 Student -3.54 -1.73 -0.18 0.55 1.26 1.98 2.71 4.26 6.07
210.76 2.34 0.79 School 1.67 1.92 2.14 2.24 2.34 2.44 2.54 2.75 3.00
80 217.22 1.01 5.71 Student -3.80 -1.98 -0.44 0.29 1.01 1.73 2.45 4.00 5.81
211.64 2.35 0.79 School 1.68 1.93 2.15 2.25 2.35 2.45 2.55 2.76 3.01
85 219.54 0.71 5.71 Student -4.09 -2.28 -0.73 -0.01 0.71 1.43 2.16 3.71 5.52
212.67 2.36 0.79 School 1.70 1.95 2.16 2.26 2.36 2.46 2.56 2.78 3.03
90 222.46 0.34 5.71 Student -4.47 -2.65 -1.11 -0.38 0.34 1.06 1.79 3.33 5.14
213.97 2.38 0.79 School 1.71 1.96 2.18 2.28 2.38 2.48 2.58 2.79 3.04
CGI - Conditional Growth Index CGP - Conditional Growth Percentile
399

Table E.4.30: General Science Grade 7 From Winter To Spring Conditional Growth Percentile
Conditional Growth
Start Status Growth CGP 20 30 40 45 50 55 60 70 80
%ile RIT Mean SD CGI -0.84 -0.52 -0.25 -0.13 0.00 0.13 0.25 0.52 0.84
10 194.26 2.62 5.54 Student -2.04 -0.29 1.21 1.92 2.62 3.31 4.02 5.52 7.28
202.51 1.21 0.58 School 0.72 0.91 1.06 1.14 1.21 1.28 1.36 1.51 1.70
20 199.48 2.20 5.54 Student -2.47 -0.71 0.79 1.50 2.20 2.89 3.60 5.10 6.86
204.90 1.27 0.58 School 0.78 0.97 1.12 1.20 1.27 1.34 1.42 1.58 1.76
25 201.47 2.03 5.54 Student -2.63 -0.87 0.63 1.34 2.03 2.73 3.44 4.94 6.70
205.81 1.29 0.58 School 0.81 0.99 1.15 1.22 1.29 1.37 1.44 1.60 1.78
30 203.25 1.89 5.54 Student -2.77 -1.01 0.49 1.19 1.89 2.59 3.29 4.80 6.55
206.62 1.31 0.58 School 0.83 1.01 1.17 1.24 1.31 1.39 1.46 1.62 1.80
35 204.90 1.76 5.54 Student -2.91 -1.15 0.35 1.06 1.76 2.45 3.16 4.66 6.42
207.38 1.33 0.58 School 0.85 1.03 1.19 1.26 1.33 1.41 1.48 1.64 1.82
40 206.46 1.63 5.54 Student -3.03 -1.27 0.23 0.93 1.63 2.33 3.03 4.54 6.29
208.10 1.35 0.58 School 0.86 1.05 1.21 1.28 1.35 1.43 1.50 1.66 1.84
45 207.98 1.51 5.54 Student -3.15 -1.40 0.10 0.81 1.51 2.20 2.91 4.41 6.17
208.79 1.37 0.58 School 0.88 1.07 1.22 1.30 1.37 1.44 1.52 1.67 1.86
48 208.88 1.44 5.54 Student -3.23 -1.47 0.03 0.74 1.44 2.13 2.84 4.34 6.10
209.20 1.38 0.58 School 0.89 1.08 1.23 1.31 1.38 1.45 1.53 1.68 1.87
50 209.47 1.39 5.54 Student -3.28 -1.52 -0.02 0.69 1.39 2.08 2.79 4.29 6.05
209.47 1.39 0.58 School 0.90 1.08 1.24 1.31 1.39 1.46 1.53 1.69 1.88
52 210.07 1.34 5.54 Student -3.32 -1.57 -0.06 0.64 1.34 2.04 2.74 4.24 6.00
209.74 1.39 0.58 School 0.91 1.09 1.25 1.32 1.39 1.47 1.54 1.70 1.88
55 210.96 1.27 5.54 Student -3.40 -1.64 -0.14 0.57 1.27 1.96 2.67 4.17 5.93
210.15 1.40 0.58 School 0.92 1.10 1.26 1.33 1.40 1.48 1.55 1.71 1.89
60 212.48 1.14 5.54 Student -3.52 -1.76 -0.26 0.45 1.14 1.84 2.55 4.05 5.81
210.85 1.42 0.58 School 0.93 1.12 1.28 1.35 1.42 1.49 1.57 1.73 1.91
65 214.04 1.02 5.54 Student -3.65 -1.89 -0.39 0.32 1.02 1.71 2.42 3.92 5.68
211.56 1.44 0.58 School 0.95 1.14 1.29 1.37 1.44 1.51 1.59 1.74 1.93
70 215.69 0.88 5.54 Student -3.78 -2.02 -0.52 0.19 0.88 1.58 2.29 3.79 5.55
212.32 1.46 0.58 School 0.97 1.16 1.31 1.39 1.46 1.53 1.61 1.76 1.95
75 217.47 0.74 5.54 Student -3.92 -2.17 -0.66 0.04 0.74 1.44 2.14 3.64 5.40
213.13 1.48 0.58 School 0.99 1.18 1.33 1.41 1.48 1.55 1.63 1.78 1.97
80 219.46 0.58 5.54 Student -4.08 -2.33 -0.82 -0.12 0.58 1.28 1.98 3.48 5.24
214.04 1.50 0.58 School 1.02 1.20 1.36 1.43 1.50 1.58 1.65 1.81 1.99
85 221.77 0.39 5.54 Student -4.27 -2.51 -1.01 -0.30 0.39 1.09 1.80 3.30 5.05
215.10 1.53 0.58 School 1.04 1.23 1.38 1.46 1.53 1.60 1.68 1.83 2.02
90 224.68 0.16 5.54 Student -4.51 -2.75 -1.25 -0.54 0.16 0.85 1.56 3.06 4.82
216.43 1.56 0.58 School 1.08 1.26 1.42 1.49 1.56 1.64 1.71 1.87 2.05
CGI - Conditional Growth Index CGP - Conditional Growth Percentile
400

Table E.4.31: General Science Grade 8 From Last Winter To Winter Conditional Growth Percentile
Conditional Growth
Start Status Growth CGP 20 30 40 45 50 55 60 70 80
%ile RIT Mean SD CGI -0.84 -0.52 -0.25 -0.13 0.00 0.13 0.25 0.52 0.84
10 193.30 5.74 6.47 Student 0.30 2.35 4.11 4.93 5.74 6.56 7.38 9.13 11.19
201.69 3.38 1.41 School 2.19 2.64 3.02 3.20 3.38 3.56 3.74 4.12 4.57
20 198.66 4.93 6.47 Student -0.51 1.54 3.30 4.12 4.93 5.75 6.57 8.32 10.38
204.17 3.38 1.41 School 2.20 2.64 3.03 3.21 3.38 3.56 3.74 4.12 4.57
25 200.69 4.63 6.47 Student -0.81 1.24 2.99 3.81 4.63 5.44 6.26 8.02 10.07
205.11 3.38 1.41 School 2.20 2.64 3.03 3.21 3.38 3.56 3.74 4.12 4.57
30 202.52 4.35 6.47 Student -1.09 0.96 2.71 3.54 4.35 5.16 5.99 7.74 9.79
205.95 3.38 1.41 School 2.20 2.64 3.03 3.21 3.38 3.56 3.74 4.12 4.57
35 204.21 4.09 6.47 Student -1.35 0.70 2.46 3.28 4.09 4.91 5.73 7.48 9.54
206.73 3.38 1.41 School 2.20 2.64 3.03 3.21 3.38 3.56 3.74 4.12 4.57
40 205.82 3.85 6.47 Student -1.59 0.46 2.21 3.04 3.85 4.66 5.49 7.24 9.29
207.47 3.38 1.41 School 2.20 2.64 3.03 3.21 3.38 3.56 3.74 4.12 4.57
45 207.37 3.62 6.47 Student -1.82 0.23 1.98 2.80 3.62 4.43 5.25 7.01 9.06
208.19 3.38 1.41 School 2.20 2.64 3.03 3.21 3.38 3.56 3.74 4.12 4.57
48 208.29 3.48 6.47 Student -1.96 0.09 1.84 2.67 3.48 4.29 5.12 6.87 8.92
208.62 3.39 1.41 School 2.20 2.65 3.03 3.21 3.39 3.56 3.74 4.13 4.57
50 208.90 3.39 6.47 Student -2.06 -0.01 1.75 2.57 3.39 4.20 5.02 6.78 8.83
208.90 3.39 1.41 School 2.20 2.65 3.03 3.21 3.39 3.56 3.74 4.13 4.57
52 209.51 3.29 6.47 Student -2.15 -0.10 1.65 2.48 3.29 4.11 4.93 6.68 8.73
209.18 3.39 1.41 School 2.20 2.65 3.03 3.21 3.39 3.56 3.74 4.13 4.57
55 210.43 3.15 6.47 Student -2.29 -0.24 1.52 2.34 3.15 3.97 4.79 6.54 8.60
209.61 3.39 1.41 School 2.20 2.65 3.03 3.21 3.39 3.56 3.74 4.13 4.57
60 211.98 2.92 6.47 Student -2.52 -0.47 1.28 2.11 2.92 3.73 4.56 6.31 8.36
210.32 3.39 1.41 School 2.20 2.65 3.03 3.21 3.39 3.56 3.74 4.13 4.57
65 213.59 2.68 6.47 Student -2.77 -0.71 1.04 1.86 2.68 3.49 4.31 6.07 8.12
211.07 3.39 1.41 School 2.20 2.65 3.03 3.21 3.39 3.56 3.74 4.13 4.57
70 215.28 2.42 6.47 Student -3.02 -0.97 0.78 1.61 2.42 3.23 4.06 5.81 7.86
211.85 3.39 1.41 School 2.20 2.65 3.03 3.21 3.39 3.56 3.74 4.13 4.57
75 217.11 2.14 6.47 Student -3.30 -1.25 0.51 1.33 2.14 2.96 3.78 5.53 7.59
212.69 3.39 1.41 School 2.20 2.65 3.03 3.21 3.39 3.56 3.74 4.13 4.57
80 219.14 1.84 6.47 Student -3.60 -1.55 0.20 1.02 1.84 2.65 3.47 5.23 7.28
213.63 3.39 1.41 School 2.20 2.65 3.03 3.21 3.39 3.57 3.75 4.13 4.58
85 221.51 1.48 6.47 Student -3.96 -1.91 -0.16 0.67 1.48 2.29 3.12 4.87 6.92
214.73 3.39 1.41 School 2.20 2.65 3.03 3.21 3.39 3.57 3.75 4.13 4.58
90 224.49 1.03 6.47 Student -4.41 -2.36 -0.61 0.21 1.03 1.84 2.66 4.42 6.47
216.11 3.39 1.41 School 2.20 2.65 3.03 3.21 3.39 3.57 3.75 4.13 4.58
CGI - Conditional Growth Index CGP - Conditional Growth Percentile
401

Table E.4.32: General Science Grade 8 From Last Spring To Spring Conditional Growth Percentile
Conditional Growth
Start Status Growth CGP 20 30 40 45 50 55 60 70 80
%ile RIT Mean SD CGI -0.84 -0.52 -0.25 -0.13 0.00 0.13 0.25 0.52 0.84
10 194.16 6.02 7.16 Student 0.00 2.27 4.21 5.12 6.02 6.92 7.84 9.78 12.05
203.13 3.18 1.83 School 1.64 2.22 2.71 2.95 3.18 3.41 3.64 4.14 4.72
20 199.73 5.03 7.16 Student -0.99 1.28 3.22 4.13 5.03 5.93 6.85 8.79 11.06
205.62 3.17 1.83 School 1.62 2.20 2.70 2.93 3.17 3.40 3.63 4.13 4.71
25 201.85 4.66 7.16 Student -1.37 0.90 2.84 3.76 4.66 5.56 6.47 8.41 10.68
206.57 3.16 1.83 School 1.62 2.20 2.70 2.93 3.16 3.39 3.62 4.12 4.70
30 203.75 4.32 7.16 Student -1.70 0.57 2.51 3.42 4.32 5.22 6.13 8.07 10.34
207.42 3.16 1.83 School 1.61 2.19 2.69 2.92 3.16 3.39 3.62 4.12 4.70
35 205.51 4.01 7.16 Student -2.02 0.25 2.19 3.11 4.01 4.91 5.82 7.76 10.03
208.21 3.15 1.83 School 1.61 2.19 2.69 2.92 3.15 3.38 3.62 4.11 4.69
40 207.18 3.71 7.16 Student -2.31 -0.04 1.90 2.81 3.71 4.61 5.52 7.46 9.73
208.95 3.15 1.83 School 1.60 2.19 2.68 2.92 3.15 3.38 3.61 4.11 4.69
45 208.80 3.42 7.16 Student -2.60 -0.33 1.61 2.52 3.42 4.32 5.24 7.17 9.45
209.67 3.14 1.83 School 1.60 2.18 2.68 2.91 3.14 3.37 3.61 4.10 4.69
48 209.75 3.25 7.16 Student -2.77 -0.50 1.44 2.35 3.25 4.15 5.07 7.00 9.28
210.10 3.14 1.83 School 1.60 2.18 2.68 2.91 3.14 3.37 3.61 4.10 4.68
50 210.39 3.14 7.16 Student -2.88 -0.61 1.33 2.24 3.14 4.04 4.95 6.89 9.16
210.39 3.14 1.83 School 1.60 2.18 2.67 2.91 3.14 3.37 3.60 4.10 4.68
52 211.02 3.03 7.16 Student -3.00 -0.73 1.21 2.13 3.03 3.93 4.84 6.78 9.05
210.67 3.14 1.83 School 1.59 2.18 2.67 2.91 3.14 3.37 3.60 4.10 4.68
55 211.98 2.86 7.16 Student -3.17 -0.90 1.04 1.96 2.86 3.76 4.67 6.61 8.88
211.10 3.14 1.83 School 1.59 2.17 2.67 2.90 3.14 3.37 3.60 4.10 4.68
60 213.59 2.57 7.16 Student -3.45 -1.18 0.76 1.67 2.57 3.47 4.38 6.32 8.59
211.82 3.13 1.83 School 1.59 2.17 2.67 2.90 3.13 3.36 3.60 4.09 4.67
65 215.26 2.27 7.16 Student -3.75 -1.48 0.46 1.37 2.27 3.17 4.08 6.02 8.29
212.57 3.13 1.83 School 1.58 2.17 2.66 2.90 3.13 3.36 3.59 4.09 4.67
70 217.02 1.96 7.16 Student -4.06 -1.79 0.15 1.06 1.96 2.86 3.77 5.71 7.98
213.35 3.12 1.83 School 1.58 2.16 2.66 2.89 3.12 3.35 3.59 4.08 4.67
75 218.92 1.62 7.16 Student -4.40 -2.13 -0.19 0.72 1.62 2.52 3.43 5.37 7.64
214.20 3.12 1.83 School 1.57 2.16 2.65 2.89 3.12 3.35 3.58 4.08 4.66
80 221.04 1.24 7.16 Student -4.78 -2.51 -0.57 0.34 1.24 2.14 3.06 5.00 7.27
215.15 3.11 1.83 School 1.57 2.15 2.65 2.88 3.11 3.34 3.58 4.07 4.66
85 223.51 0.81 7.16 Student -5.22 -2.95 -1.01 -0.09 0.81 1.70 2.62 4.56 6.83
216.25 3.11 1.83 School 1.56 2.14 2.64 2.88 3.11 3.34 3.57 4.07 4.65
90 226.61 0.25 7.16 Student -5.77 -3.50 -1.56 -0.65 0.25 1.15 2.07 4.01 6.28
217.64 3.10 1.83 School 1.56 2.14 2.63 2.87 3.10 3.33 3.56 4.06 4.64
CGI - Conditional Growth Index CGP - Conditional Growth Percentile
402

Table E.4.33: General Science Grade 8 From Fall To N Fall Conditional Growth Percentile
Conditional Growth
Start Status Growth CGP 20 30 40 45 50 55 60 70 80
%ile RIT Mean SD CGI -0.84 -0.52 -0.25 -0.13 0.00 0.13 0.25 0.52 0.84
10 194.55 3.91 7.36 Student -2.28 0.05 2.04 2.98 3.91 4.83 5.77 7.77 10.10
202.87 3.08 1.49 School 1.82 2.30 2.70 2.89 3.08 3.26 3.45 3.86 4.33
20 199.95 3.72 7.36 Student -2.47 -0.14 1.86 2.80 3.72 4.65 5.59 7.58 9.92
205.42 3.18 1.49 School 1.92 2.40 2.80 2.99 3.18 3.36 3.55 3.96 4.43
25 202.00 3.65 7.36 Student -2.54 -0.21 1.79 2.73 3.65 4.58 5.52 7.51 9.85
206.39 3.22 1.49 School 1.96 2.43 2.84 3.03 3.22 3.40 3.59 4.00 4.47
30 203.85 3.59 7.36 Student -2.60 -0.27 1.73 2.66 3.59 4.51 5.45 7.45 9.78
207.25 3.25 1.49 School 2.00 2.47 2.87 3.06 3.25 3.44 3.63 4.03 4.50
35 205.56 3.53 7.36 Student -2.66 -0.33 1.67 2.61 3.53 4.46 5.40 7.39 9.72
208.06 3.28 1.49 School 2.03 2.50 2.90 3.09 3.28 3.47 3.66 4.06 4.53
40 207.18 3.48 7.36 Student -2.72 -0.38 1.61 2.55 3.48 4.40 5.34 7.33 9.67
208.82 3.31 1.49 School 2.06 2.53 2.93 3.12 3.31 3.50 3.69 4.09 4.56
45 208.74 3.42 7.36 Student -2.77 -0.44 1.56 2.50 3.42 4.35 5.29 7.28 9.61
209.56 3.34 1.49 School 2.09 2.56 2.96 3.15 3.34 3.53 3.72 4.12 4.59
48 209.67 3.39 7.36 Student -2.80 -0.47 1.53 2.47 3.39 4.31 5.25 7.25 9.58
210.00 3.36 1.49 School 2.10 2.58 2.98 3.17 3.36 3.54 3.73 4.14 4.61
50 210.29 3.37 7.36 Student -2.82 -0.49 1.50 2.44 3.37 4.29 5.23 7.23 9.56
210.29 3.37 1.49 School 2.12 2.59 2.99 3.18 3.37 3.56 3.75 4.15 4.62
52 210.90 3.35 7.36 Student -2.85 -0.51 1.48 2.42 3.35 4.27 5.21 7.21 9.54
210.58 3.38 1.49 School 2.13 2.60 3.00 3.19 3.38 3.57 3.76 4.16 4.63
55 211.83 3.32 7.36 Student -2.88 -0.54 1.45 2.39 3.32 4.24 5.18 7.17 9.51
211.01 3.40 1.49 School 2.14 2.62 3.02 3.21 3.40 3.58 3.77 4.18 4.65
60 213.40 3.26 7.36 Student -2.93 -0.60 1.40 2.34 3.26 4.19 5.13 7.12 9.45
211.75 3.43 1.49 School 2.17 2.65 3.05 3.24 3.43 3.61 3.80 4.21 4.68
65 215.02 3.21 7.36 Student -2.99 -0.65 1.34 2.28 3.21 4.13 5.07 7.07 9.40
212.51 3.46 1.49 School 2.20 2.68 3.08 3.27 3.46 3.64 3.83 4.24 4.71
70 216.72 3.15 7.36 Student -3.04 -0.71 1.28 2.22 3.15 4.07 5.01 7.01 9.34
213.32 3.49 1.49 School 2.23 2.71 3.11 3.30 3.49 3.67 3.86 4.27 4.74
75 218.57 3.08 7.36 Student -3.11 -0.77 1.22 2.16 3.08 4.01 4.95 6.94 9.28
214.19 3.52 1.49 School 2.27 2.74 3.14 3.33 3.52 3.71 3.90 4.30 4.77
80 220.62 3.01 7.36 Student -3.18 -0.84 1.15 2.09 3.01 3.94 4.88 6.87 9.21
215.15 3.56 1.49 School 2.31 2.78 3.18 3.37 3.56 3.75 3.94 4.34 4.81
85 223.01 2.93 7.36 Student -3.26 -0.93 1.07 2.01 2.93 3.86 4.80 6.79 9.13
216.28 3.60 1.49 School 2.35 2.82 3.23 3.42 3.60 3.79 3.98 4.38 4.86
90 226.02 2.83 7.36 Student -3.36 -1.03 0.97 1.90 2.83 3.75 4.69 6.69 9.02
217.70 3.66 1.49 School 2.41 2.88 3.28 3.47 3.66 3.85 4.04 4.44 4.91
CGI - Conditional Growth Index CGP - Conditional Growth Percentile
403

Table E.4.34: General Science Grade 8 From Fall To Spring Conditional Growth Percentile
Conditional Growth
Start Status Growth CGP 20 30 40 45 50 55 60 70 80
%ile RIT Mean SD CGI -0.84 -0.52 -0.25 -0.13 0.00 0.13 0.25 0.52 0.84
10 194.55 5.76 7.30 Student -0.38 1.93 3.91 4.84 5.76 6.68 7.61 9.59 11.90
202.87 3.39 1.72 School 1.94 2.49 2.95 3.17 3.39 3.61 3.82 4.29 4.84
20 199.95 4.90 7.30 Student -1.25 1.07 3.05 3.98 4.90 5.81 6.74 8.72 11.04
205.42 3.34 1.72 School 1.89 2.44 2.90 3.12 3.34 3.55 3.77 4.24 4.78
25 202.00 4.57 7.30 Student -1.58 0.74 2.72 3.65 4.57 5.48 6.42 8.39 10.71
206.39 3.32 1.72 School 1.87 2.42 2.88 3.10 3.32 3.53 3.75 4.22 4.76
30 203.85 4.27 7.30 Student -1.87 0.44 2.42 3.35 4.27 5.19 6.12 8.10 10.41
207.25 3.30 1.72 School 1.85 2.40 2.87 3.08 3.30 3.52 3.74 4.20 4.75
35 205.56 4.00 7.30 Student -2.14 0.17 2.15 3.08 4.00 4.91 5.85 7.82 10.14
208.06 3.28 1.72 School 1.84 2.38 2.85 3.07 3.28 3.50 3.72 4.19 4.73
40 207.18 3.74 7.30 Student -2.40 -0.09 1.89 2.82 3.74 4.65 5.59 7.56 9.88
208.82 3.27 1.72 School 1.82 2.37 2.83 3.05 3.27 3.48 3.70 4.17 4.71
45 208.74 3.49 7.30 Student -2.66 -0.34 1.64 2.57 3.49 4.40 5.34 7.31 9.63
209.56 3.25 1.72 School 1.81 2.35 2.82 3.04 3.25 3.47 3.69 4.15 4.70
48 209.67 3.34 7.30 Student -2.80 -0.49 1.49 2.42 3.34 4.25 5.19 7.16 9.48
210.00 3.24 1.72 School 1.80 2.34 2.81 3.03 3.24 3.46 3.68 4.15 4.69
50 210.29 3.24 7.30 Student -2.90 -0.59 1.39 2.32 3.24 4.16 5.09 7.07 9.38
210.29 3.24 1.72 School 1.79 2.34 2.80 3.02 3.24 3.45 3.67 4.14 4.68
52 210.90 3.14 7.30 Student -3.00 -0.69 1.29 2.22 3.14 4.06 4.99 6.97 9.28
210.58 3.23 1.72 School 1.79 2.33 2.80 3.02 3.23 3.45 3.67 4.13 4.68
55 211.83 2.99 7.30 Student -3.15 -0.84 1.14 2.07 2.99 3.91 4.84 6.82 9.13
211.01 3.22 1.72 School 1.78 2.32 2.79 3.01 3.22 3.44 3.66 4.12 4.67
60 213.40 2.74 7.30 Student -3.40 -1.09 0.89 1.82 2.74 3.66 4.59 6.57 8.88
211.75 3.21 1.72 School 1.76 2.31 2.77 2.99 3.21 3.42 3.64 4.11 4.65
65 215.02 2.48 7.30 Student -3.66 -1.35 0.63 1.56 2.48 3.40 4.33 6.31 8.62
212.51 3.19 1.72 School 1.75 2.29 2.76 2.98 3.19 3.41 3.63 4.09 4.64
70 216.72 2.21 7.30 Student -3.94 -1.62 0.36 1.29 2.21 3.12 4.06 6.03 8.35
213.32 3.18 1.72 School 1.73 2.28 2.74 2.96 3.18 3.39 3.61 4.08 4.62
75 218.57 1.91 7.30 Student -4.23 -1.92 0.06 0.99 1.91 2.83 3.76 5.74 8.05
214.19 3.16 1.72 School 1.71 2.26 2.72 2.94 3.16 3.38 3.59 4.06 4.61
80 220.62 1.58 7.30 Student -4.56 -2.25 -0.27 0.66 1.58 2.50 3.43 5.41 7.72
215.15 3.14 1.72 School 1.69 2.24 2.70 2.92 3.14 3.36 3.58 4.04 4.59
85 223.01 1.20 7.30 Student -4.94 -2.63 -0.65 0.28 1.20 2.12 3.05 5.03 7.34
216.28 3.12 1.72 School 1.67 2.22 2.68 2.90 3.12 3.33 3.55 4.02 4.56
90 226.02 0.72 7.30 Student -5.43 -3.11 -1.13 -0.20 0.72 1.63 2.56 4.54 6.86
217.70 3.09 1.72 School 1.64 2.19 2.65 2.87 3.09 3.30 3.52 3.99 4.53
CGI - Conditional Growth Index CGP - Conditional Growth Percentile
404
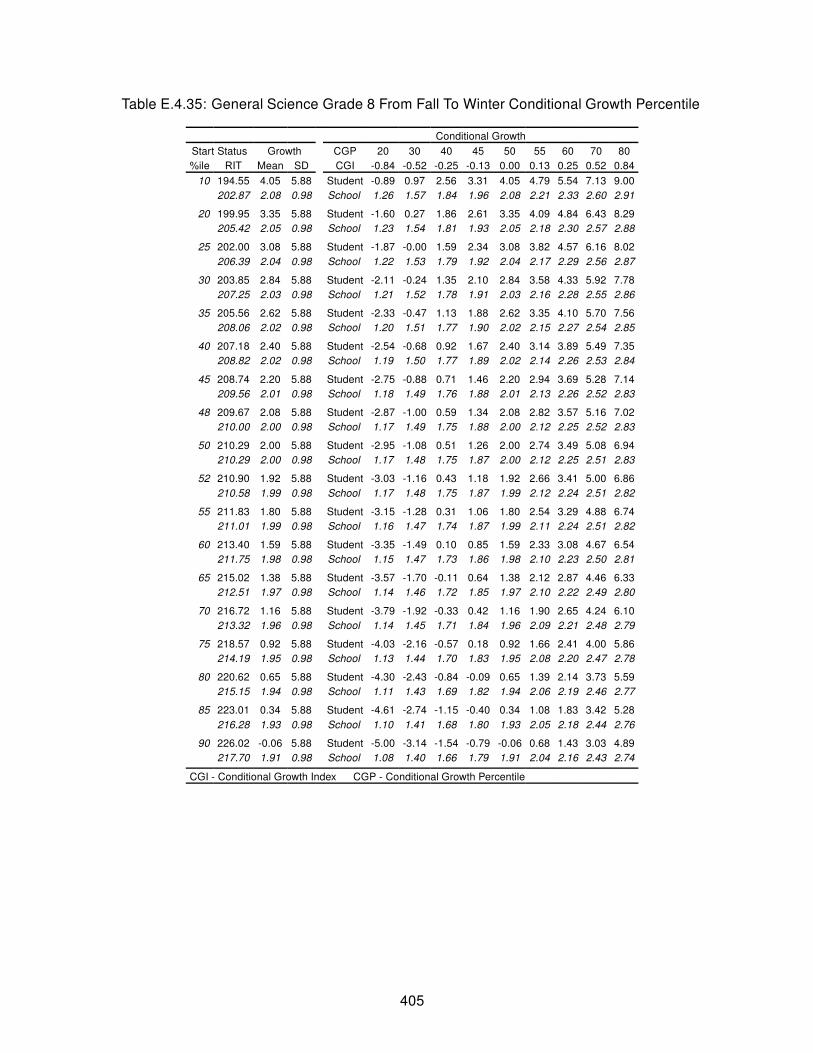
Table E.4.35: General Science Grade 8 From Fall To Winter Conditional Growth Percentile
Conditional Growth
Start Status Growth CGP 20 30 40 45 50 55 60 70 80
%ile RIT Mean SD CGI -0.84 -0.52 -0.25 -0.13 0.00 0.13 0.25 0.52 0.84
10 194.55 4.05 5.88 Student -0.89 0.97 2.56 3.31 4.05 4.79 5.54 7.13 9.00
202.87 2.08 0.98 School 1.26 1.57 1.84 1.96 2.08 2.21 2.33 2.60 2.91
20 199.95 3.35 5.88 Student -1.60 0.27 1.86 2.61 3.35 4.09 4.84 6.43 8.29
205.42 2.05 0.98 School 1.23 1.54 1.81 1.93 2.05 2.18 2.30 2.57 2.88
25 202.00 3.08 5.88 Student -1.87 -0.00 1.59 2.34 3.08 3.82 4.57 6.16 8.02
206.39 2.04 0.98 School 1.22 1.53 1.79 1.92 2.04 2.17 2.29 2.56 2.87
30 203.85 2.84 5.88 Student -2.11 -0.24 1.35 2.10 2.84 3.58 4.33 5.92 7.78
207.25 2.03 0.98 School 1.21 1.52 1.78 1.91 2.03 2.16 2.28 2.55 2.86
35 205.56 2.62 5.88 Student -2.33 -0.47 1.13 1.88 2.62 3.35 4.10 5.70 7.56
208.06 2.02 0.98 School 1.20 1.51 1.77 1.90 2.02 2.15 2.27 2.54 2.85
40 207.18 2.40 5.88 Student -2.54 -0.68 0.92 1.67 2.40 3.14 3.89 5.49 7.35
208.82 2.02 0.98 School 1.19 1.50 1.77 1.89 2.02 2.14 2.26 2.53 2.84
45 208.74 2.20 5.88 Student -2.75 -0.88 0.71 1.46 2.20 2.94 3.69 5.28 7.14
209.56 2.01 0.98 School 1.18 1.49 1.76 1.88 2.01 2.13 2.26 2.52 2.83
48 209.67 2.08 5.88 Student -2.87 -1.00 0.59 1.34 2.08 2.82 3.57 5.16 7.02
210.00 2.00 0.98 School 1.17 1.49 1.75 1.88 2.00 2.12 2.25 2.52 2.83
50 210.29 2.00 5.88 Student -2.95 -1.08 0.51 1.26 2.00 2.74 3.49 5.08 6.94
210.29 2.00 0.98 School 1.17 1.48 1.75 1.87 2.00 2.12 2.25 2.51 2.83
52 210.90 1.92 5.88 Student -3.03 -1.16 0.43 1.18 1.92 2.66 3.41 5.00 6.86
210.58 1.99 0.98 School 1.17 1.48 1.75 1.87 1.99 2.12 2.24 2.51 2.82
55 211.83 1.80 5.88 Student -3.15 -1.28 0.31 1.06 1.80 2.54 3.29 4.88 6.74
211.01 1.99 0.98 School 1.16 1.47 1.74 1.87 1.99 2.11 2.24 2.51 2.82
60 213.40 1.59 5.88 Student -3.35 -1.49 0.10 0.85 1.59 2.33 3.08 4.67 6.54
211.75 1.98 0.98 School 1.15 1.47 1.73 1.86 1.98 2.10 2.23 2.50 2.81
65 215.02 1.38 5.88 Student -3.57 -1.70 -0.11 0.64 1.38 2.12 2.87 4.46 6.33
212.51 1.97 0.98 School 1.14 1.46 1.72 1.85 1.97 2.10 2.22 2.49 2.80
70 216.72 1.16 5.88 Student -3.79 -1.92 -0.33 0.42 1.16 1.90 2.65 4.24 6.10
213.32 1.96 0.98 School 1.14 1.45 1.71 1.84 1.96 2.09 2.21 2.48 2.79
75 218.57 0.92 5.88 Student -4.03 -2.16 -0.57 0.18 0.92 1.66 2.41 4.00 5.86
214.19 1.95 0.98 School 1.13 1.44 1.70 1.83 1.95 2.08 2.20 2.47 2.78
80 220.62 0.65 5.88 Student -4.30 -2.43 -0.84 -0.09 0.65 1.39 2.14 3.73 5.59
215.15 1.94 0.98 School 1.11 1.43 1.69 1.82 1.94 2.06 2.19 2.46 2.77
85 223.01 0.34 5.88 Student -4.61 -2.74 -1.15 -0.40 0.34 1.08 1.83 3.42 5.28
216.28 1.93 0.98 School 1.10 1.41 1.68 1.80 1.93 2.05 2.18 2.44 2.76
90 226.02 -0.06 5.88 Student -5.00 -3.14 -1.54 -0.79 -0.06 0.68 1.43 3.03 4.89
217.70 1.91 0.98 School 1.08 1.40 1.66 1.79 1.91 2.04 2.16 2.43 2.74
CGI - Conditional Growth Index CGP - Conditional Growth Percentile
405

Table E.4.36: General Science Grade 8 From Winter To Spring Conditional Growth Percentile
Conditional Growth
Start Status Growth CGP 20 30 40 45 50 55 60 70 80
%ile RIT Mean SD CGI -0.84 -0.52 -0.25 -0.13 0.00 0.13 0.25 0.52 0.84
10 196.67 2.39 5.66 Student -2.38 -0.58 0.95 1.68 2.39 3.10 3.82 5.36 7.15
204.85 1.15 0.74 School 0.53 0.76 0.96 1.05 1.15 1.24 1.33 1.53 1.77
20 202.03 1.99 5.66 Student -2.77 -0.98 0.56 1.28 1.99 2.70 3.43 4.96 6.76
207.40 1.18 0.74 School 0.56 0.79 0.99 1.09 1.18 1.27 1.36 1.56 1.80
25 204.07 1.84 5.66 Student -2.92 -1.12 0.41 1.13 1.84 2.56 3.28 4.81 6.61
208.37 1.19 0.74 School 0.57 0.80 1.00 1.10 1.19 1.28 1.38 1.58 1.81
30 205.89 1.71 5.66 Student -3.05 -1.26 0.28 1.00 1.71 2.42 3.14 4.68 6.47
209.24 1.20 0.74 School 0.58 0.82 1.02 1.11 1.20 1.29 1.39 1.59 1.82
35 207.59 1.59 5.66 Student -3.18 -1.38 0.15 0.87 1.59 2.30 3.02 4.55 6.35
210.05 1.21 0.74 School 0.59 0.83 1.03 1.12 1.21 1.30 1.40 1.60 1.83
40 209.20 1.47 5.66 Student -3.30 -1.50 0.03 0.76 1.47 2.18 2.90 4.44 6.23
210.81 1.22 0.74 School 0.60 0.84 1.04 1.13 1.22 1.31 1.41 1.61 1.84
45 210.75 1.35 5.66 Student -3.41 -1.62 -0.08 0.64 1.35 2.06 2.79 4.32 6.12
211.56 1.23 0.74 School 0.61 0.85 1.04 1.14 1.23 1.32 1.42 1.62 1.85
48 211.67 1.29 5.66 Student -3.48 -1.68 -0.15 0.57 1.29 2.00 2.72 4.25 6.05
211.99 1.24 0.74 School 0.62 0.85 1.05 1.14 1.24 1.33 1.42 1.62 1.86
50 212.28 1.24 5.66 Student -3.52 -1.73 -0.19 0.53 1.24 1.95 2.68 4.21 6.01
212.28 1.24 0.74 School 0.62 0.85 1.05 1.15 1.24 1.33 1.43 1.63 1.86
52 212.90 1.20 5.66 Student -3.57 -1.77 -0.24 0.48 1.20 1.91 2.63 4.16 5.96
212.58 1.24 0.74 School 0.62 0.86 1.06 1.15 1.24 1.34 1.43 1.63 1.86
55 213.82 1.13 5.66 Student -3.64 -1.84 -0.31 0.42 1.13 1.84 2.56 4.10 5.89
213.01 1.25 0.74 School 0.63 0.86 1.06 1.16 1.25 1.34 1.44 1.64 1.87
60 215.37 1.01 5.66 Student -3.75 -1.95 -0.42 0.30 1.01 1.73 2.45 3.98 5.78
213.75 1.26 0.74 School 0.64 0.87 1.07 1.17 1.26 1.35 1.45 1.65 1.88
65 216.98 0.90 5.66 Student -3.87 -2.07 -0.54 0.18 0.90 1.61 2.33 3.86 5.66
214.52 1.27 0.74 School 0.65 0.88 1.08 1.18 1.27 1.36 1.46 1.66 1.89
70 218.67 0.77 5.66 Student -3.99 -2.20 -0.66 0.06 0.77 1.48 2.21 3.74 5.54
215.33 1.28 0.74 School 0.66 0.89 1.09 1.19 1.28 1.37 1.47 1.67 1.90
75 220.50 0.64 5.66 Student -4.13 -2.33 -0.80 -0.07 0.64 1.35 2.07 3.61 5.40
216.20 1.29 0.74 School 0.67 0.90 1.10 1.20 1.29 1.38 1.48 1.68 1.91
80 222.54 0.49 5.66 Student -4.28 -2.48 -0.95 -0.22 0.49 1.20 1.92 3.46 5.25
217.17 1.30 0.74 School 0.68 0.92 1.12 1.21 1.30 1.40 1.49 1.69 1.92
85 224.91 0.31 5.66 Student -4.45 -2.65 -1.12 -0.40 0.31 1.03 1.75 3.28 5.08
218.30 1.32 0.74 School 0.70 0.93 1.13 1.23 1.32 1.41 1.50 1.70 1.94
90 227.90 0.09 5.66 Student -4.67 -2.87 -1.34 -0.62 0.09 0.81 1.53 3.06 4.86
219.72 1.34 0.74 School 0.72 0.95 1.15 1.24 1.34 1.43 1.52 1.72 1.96
CGI - Conditional Growth Index CGP - Conditional Growth Percentile
406

Appendix F - End-of-course Tests
Table F.1: End-of-Course Tests
Subject Mean SD N
Algebra 1 240.3 17.02 85,132
Geometry 248.9 17.31 33,053
Algebra 2 251.7 16.94 12,825
407
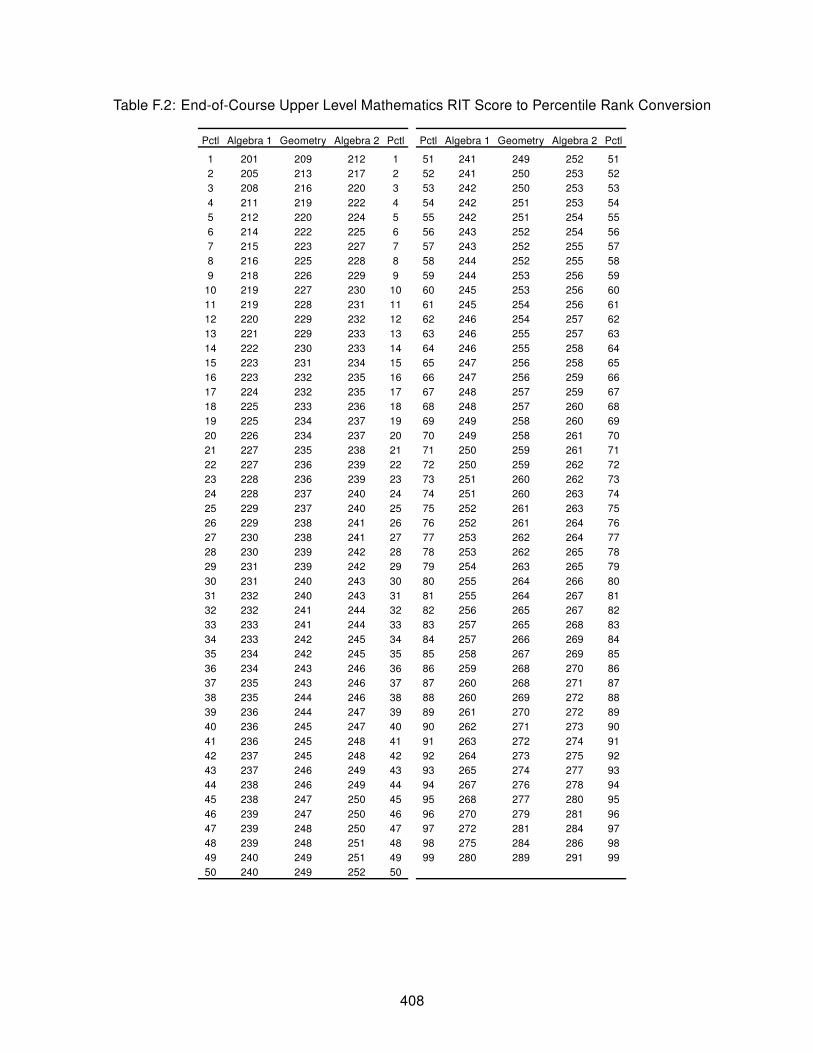
Table F.2: End-of-Course Upper Level Mathematics RIT Score to Percentile Rank Conversion
Pctl Algebra 1 Geometry Algebra 2 Pctl Pctl Algebra 1 Geometry Algebra 2 Pctl
1 201 209 212 1 51 241 249 252 51
2 205 213 217 2 52 241 250 253 52
3 208 216 220 3 53 242 250 253 53
4 211 219 222 4 54 242 251 253 54
5 212 220 224 5 55 242 251 254 55
6 214 222 225 6 56 243 252 254 56
7 215 223 227 7 57 243 252 255 57
8 216 225 228 8 58 244 252 255 58
9 218 226 229 9 59 244 253 256 59
10 219 227 230 10 60 245 253 256 60
11 219 228 231 11 61 245 254 256 61
12 220 229 232 12 62 246 254 257 62
13 221 229 233 13 63 246 255 257 63
14 222 230 233 14 64 246 255 258 64
15 223 231 234 15 65 247 256 258 65
16 223 232 235 16 66 247 256 259 66
17 224 232 235 17 67 248 257 259 67
18 225 233 236 18 68 248 257 260 68
19 225 234 237 19 69 249 258 260 69
20 226 234 237 20 70 249 258 261 70
21 227 235 238 21 71 250 259 261 71
22 227 236 239 22 72 250 259 262 72
23 228 236 239 23 73 251 260 262 73
24 228 237 240 24 74 251 260 263 74
25 229 237 240 25 75 252 261 263 75
26 229 238 241 26 76 252 261 264 76
27 230 238 241 27 77 253 262 264 77
28 230 239 242 28 78 253 262 265 78
29 231 239 242 29 79 254 263 265 79
30 231 240 243 30 80 255 264 266 80
31 232 240 243 31 81 255 264 267 81
32 232 241 244 32 82 256 265 267 82
33 233 241 244 33 83 257 265 268 83
34 233 242 245 34 84 257 266 269 84
35 234 242 245 35 85 258 267 269 85
36 234 243 246 36 86 259 268 270 86
37 235 243 246 37 87 260 268 271 87
38 235 244 246 38 88 260 269 272 88
39 236 244 247 39 89 261 270 272 89
40 236 245 247 40 90 262 271 273 90
41 236 245 248 41 91 263 272 274 91
42 237 245 248 42 92 264 273 275 92
43 237 246 249 43 93 265 274 277 93
44 238 246 249 44 94 267 276 278 94
45 238 247 250 45 95 268 277 280 95
46 239 247 250 46 96 270 279 281 96
47 239 248 250 47 97 272 281 284 97
48 239 248 251 48 98 275 284 286 98
49 240 249 251 49 99 280 289 291 99
50 240 249 252 50
408