Embed Size (px)
Citation preview

NVIVO 9: INTRODUCTION WORKSHOP
1
NVivo 9:
Introduction
NVIVO 9: INTRODUCTION WORKSHOP
2
Software Used
NVivo 9.0
Files Used
LSE Blog 3rd Debate .pdf Debate Speaker Ages.x lsx Fina l Debate fu l l prepar ed .doc Fina l debate im age.jpg F ina l Debate Opening Statem ents .doc F ir st Debate fu l l pr epar ed .doc F ir st Debate Opening Statements .doc P13_Al len_EPOP2010 .pdf PM Debate L ibrar y.en l PM Debate L ibrar y.xm l Second Debate fu l l prepared.doc Second Debate Opening Statem ents .doc
Revision Information
1.1 January 2013 Chris Giacomantonio Minor revisions from original
Acknowledgements
Thanks to Dave Baker at IT Services in Oxford for supporting development of this course. Thanks also to the workshop’s first attendees, whose participation has been essential in shaping the course for the future.
Copyright
This document is made available under a Creative Commons Attribution-NonCommercial-NoDerivs CC BY-NC-ND licence by Chris Giacomantonio who asserts his right to be identified as the author.
Note that some images and documents used in the presentation and exercises are copyright of their owners and may be subject to different copyright conditions. Where possible this has been noted in the text. If an error in attribution/copyright has been made, please contact the author who will be pleased to make the necessary corrections.
For those accessing these materials via the IT Portfolio site, please note that the workshop utilizes video content that cannot be distributed in the course materials files. The video exercises will work generally with any small audio or video clip, however.
Screenshots are copyright of the respective software suppliers.

NVIVO 9: INTRODUCTION WORKSHOP
3
CONTENTS
Preparing for the NVivo 9: Introduction workshop ................................................................................ 5
Workshop Outline ................................................................................................................................... 7
Session 1: Methodological Considerations ............................................................................................. 8
Reading the NVivo Interface ................................................................................................................... 9
Opening a new project ........................................................................................................................ 9
Inside the project ............................................................................................................................ 9
Basic Terminology: Sources and Nodes ........................................................................................ 10
Viewing data in your project ......................................................................................................... 11
Auto-saving ................................................................................................................................... 12
The Nvivo Help system .......................................................................................................................... 13
One more note… ............................................................................................................................... 14
Getting your research into NVivo ......................................................................................................... 15
Preparing and importing external data............................................................................................. 15
Creating documents and editing imported sources ..................................................................... 15
Preparing text for auto-coding.......................................................................................................... 16
Precision is essential! .................................................................................................................... 16
Linking external data ......................................................................................................................... 17
Importing reference libraries ............................................................................................................ 17
Organizing your data ............................................................................................................................. 19
Classifications and Attributes ........................................................................................................... 19
Creating source classifications ...................................................................................................... 19
Creating node classifications ........................................................................................................ 19
Importing Classification Sheets through Excel .............................................................................. 20
Editing Classifications .................................................................................................................... 21
Sets .................................................................................................................................................... 21
Customizing your interface ................................................................................................................... 22
NVIVO 9: INTRODUCTION WORKSHOP
4
Session 2: Doing Analysis ...................................................................................................................... 24
Working with Nodes ............................................................................................................................. 25
A little more about nodes… .......................................................................................................... 25
Coding text .................................................................................................................................... 26
Coding audio and visual media ..................................................................................................... 28
Visual markers of node coding ...................................................................................................... 29
Querying Data ....................................................................................................................................... 31
Word Frequency searches ............................................................................................................ 31
Text Searches ................................................................................................................................ 31
Coding queries .............................................................................................................................. 32
Compound queries ........................................................................................................................ 33
Saving queries ............................................................................................................................... 33
Links: Memos, Annotations, See Also links, and Hyperlinking.............................................................. 35
Memos .......................................................................................................................................... 35
Annotations ................................................................................................................................... 35
See also links ................................................................................................................................. 36
Hyperlinking .................................................................................................................................. 37
Other areas of interest not covered in the workshop .......................................................................... 38
Preparing survey results and other datasets .................................................................................... 38
Relationships ..................................................................................................................................... 38
models ............................................................................................................................................... 38
NVivo reports and methodological transparency ............................................................................. 38
Notes and participant questions ........................................................................................................... 39

NVIVO 9: INTRODUCTION WORKSHOP
5
PREPARING FOR THE NVIVO 9: INTRODUCTION WORKSHOP
Instructor: Chris Giacomantonio, University of Oxford
PLEASE READ BEFORE ATTENDING THE WORKSHOP
Welcome to the NVivo 9: Introduction workshop. Below are a few notes on what we will and will
not do in the workshop, as well as some suggestions for preparation before the workshop.
The great thing about NVivo 9 and (and, subsequently, 10, both of which are available through the
Oxford site license) is that QSR provides free tutorial and an excellent videos online system1 for help
all basic and even some intermediate NVivo capabilities. In this workshop we will cover nothing
more than QSR provides through online videos, so take this as an opportunity to gain hands-on
experience while exploring the software.
In the workshop, we will learn how to do a number of basic tasks that will be useful to most
qualitative researchers working with data such as interview transcripts, video and audio files, and
images. You will have an opportunity to work with sample data prepared specifically for the
workshop, or you can bring your own data and get a head start on your analysis. However, keep in
mind that this is not intended as a workshop on your project, and the instruction is designed with
general skill-building in mind.
In preparation for the workshop, it would be wise to peruse the NVivo 9 video tutorials, and at
minimum you should watch “Get up and running with NVivo ”. Each video is only about 12 minutes 9
in length, so watching three or four of the videos listed specifically as NVivo 9 should be useful
without being too onerous. You would also do well to explore the program either by downloading it
to your home computer through the QSR and getting a license key from the IT services Website
Software page, or by using NVivo on an Oxford computer operating the remote server Registration
version.
You should be aware that the Oxford server version, and the one we will use in the workshop, is
version 9 without the update to version 9.2. The basics of what we cover in the workshops will be
relevant for either, but if you decide to work on some of your own work during the class activities,
you should be aware that you will not be able to open a file created in 9.2 or 10 in the 9.0 software
(e.g., if you bring a project from home created in 9.2 or later). NVivo projects created in versions
before 9.2 can be opened on all later versions.
During the workshop, we will do some hands-on exercises based on the three UK Prime Ministerial
Debates from 2010 (apologies to any participants who don’t like politics!). Transcripts from each of
1 Go for NVivo 10 help here

NVIVO 9: INTRODUCTION WORKSHOP
6
these can be found on the BBC Debates . The videos for these are all available online at these Pages
sites:
Debate 1 (ITV) Debate 2 (Sky News) Debate 3 (BBC)
It is not necessary to watch or read all of these in full, but to review them for general content will
speed up your progress in the subsequent activities.
If you have your own data and would prefer to make this an opportunity to explore it through NVivo,
please feel free to do so. To be able to participate in all activities, you will need at least two
interview transcripts, one audio or video file, and some demographic data on your interviewees.
You are welcome to bring along as large a data set as you like, and will find the workshop more
interesting with at least three or four pieces of data to work between. These can include data such
as transcripts (with one or more participants), audio and video files, field diaries, academic articles,
images, news stories, websites, and more. If you do bring your own data, keep in mind that the
exercises are designed for the provided data set, and so the instructor may not be able to answer all
of your questions or provide support for your analysis.
Lastly, at the end of the workshop we will leave some time to address specific questions from
participants. I cannot guarantee that I can answer every question on NVivo, but if you submit your
question beforehand to me by I will do my best to come prepared with an answer. email
Looking forward to meeting you,
Chris
NVIVO 9: INTRODUCTION WORKSHOP
7
WORKSHOP OUTLINE
The agenda for the workshop is as follows:
Session 1 – Preparing data for use in NVivo
- Methodological considerations (30 min)
- Reading the NVivo interface
- Getting your research into NVivo
- Organizing your data
- Customizing your interface
Session 2 – Analysis
- Doing analysis
- Working with nodes
- Querying data
- Other areas of interest
- Participant-specific questions (30 min)
NVIVO 9: INTRODUCTION WORKSHOP
8
SESSION 1: METHODOLOGICAL CONSIDERATIONS
Is NVivo right for you?
The first question you need to consider before engaging in NVivo-based analysis has to be whether
or not NVivo will add value to your analysis (or possibly make your life easier). You therefore need to
think about what you are trying to achieve as a researcher and analyst. Of course, for novice users it
will be hard to know if NVivo is right, before knowing what it can and can’t do. So, we will begin the
workshop with a discussion of these issues in light of the participants’ research intentions.
NVivo can be quite useful for data sets of various sizes, mixed media and mixed methods data, and
small or large team research projects through its team-work and cloud server functionality. It has
broad capabilities and its interface is user-friendly relative to other similar programs. It is becoming
an industry standard for archiving qualitative data as it is recommended by the UK Data , so Archive
understanding it is worthwhile for researchers who plan on doing Research Council-supported
projects. It is also free to Oxford students and staff on a site license.
However, it has its limitations and, unlike statistical analysis software for quantitative research, it is
more ancillary than fundamental as a component of most qualitative projects. At minimum, it is
worth remembering the following:
- NVivo can do very little analysis for you, and it relies heavily on user input
- Learning NVivo takes work (this workshop won’t be enough!)
- Organizing data into NVivo takes more work
- There may be easier solutions, especially for simple tasks
- Examining data through NVivo can limit your analytic frame
- NVivo is known to run slowly or crash, especially on older computers
- NVivo does not run easily on Mac OS (it requires Boot Camp or emulator software)
With these things in mind, there are still lots of good reasons to learn the software and many ways it
can assist your analysis, help organize your thinking, and keep your data in order.
Before we engage in any data preparation, organization, and analysis, it is worth keeping in mind
that there are many ways to approach a task in NVivo. The program provides multiple paths to
fundamentally similar ends. What is important is that your strategy is suited to what you want to
accomplish with your analysis.
NVIVO 9: INTRODUCTION WORKSHOP
9
READING THE NVIVO INTERFACE
Hopefully you’ve all had a chance to watch the introductory by now, and have opened the video
program once or twice at least. We will just quickly walk through the basics of what you see in your
first moments with the program.
OPENING A NEW PROJECT
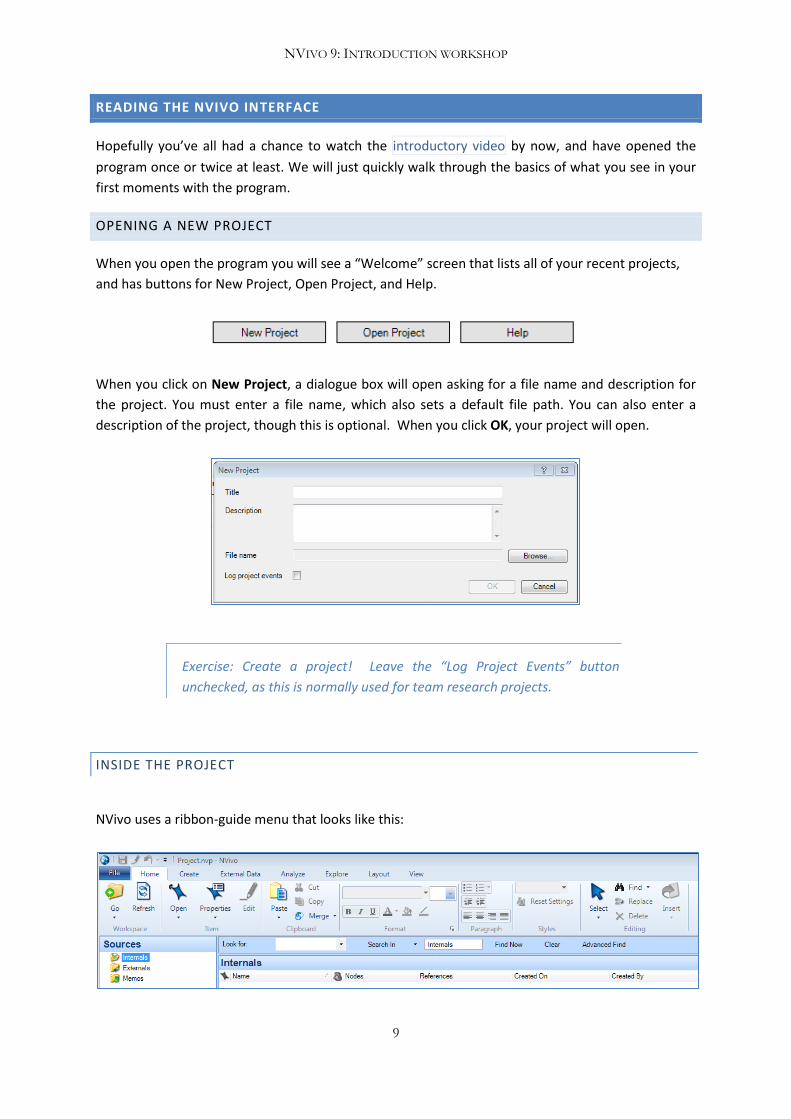
When you open the program you will see a “Welcome” screen that lists all of your recent projects,
and has buttons for New Project, Open Project, and Help.
When you click on New Project, a dialogue box will open asking for a file name and description for
the project. You must enter a file name, which also sets a default file path. You can also enter a
description of the project, though this is optional. When you click OK, your project will open.
Exercise: Create a project! Leave the “Log Project Events” button
unchecked, as this is normally used for team research projects.
INSIDE THE PROJECT
NVivo uses a ribbon-guide menu that looks like this:
NVIVO 9: INTRODUCTION WORKSHOP
10
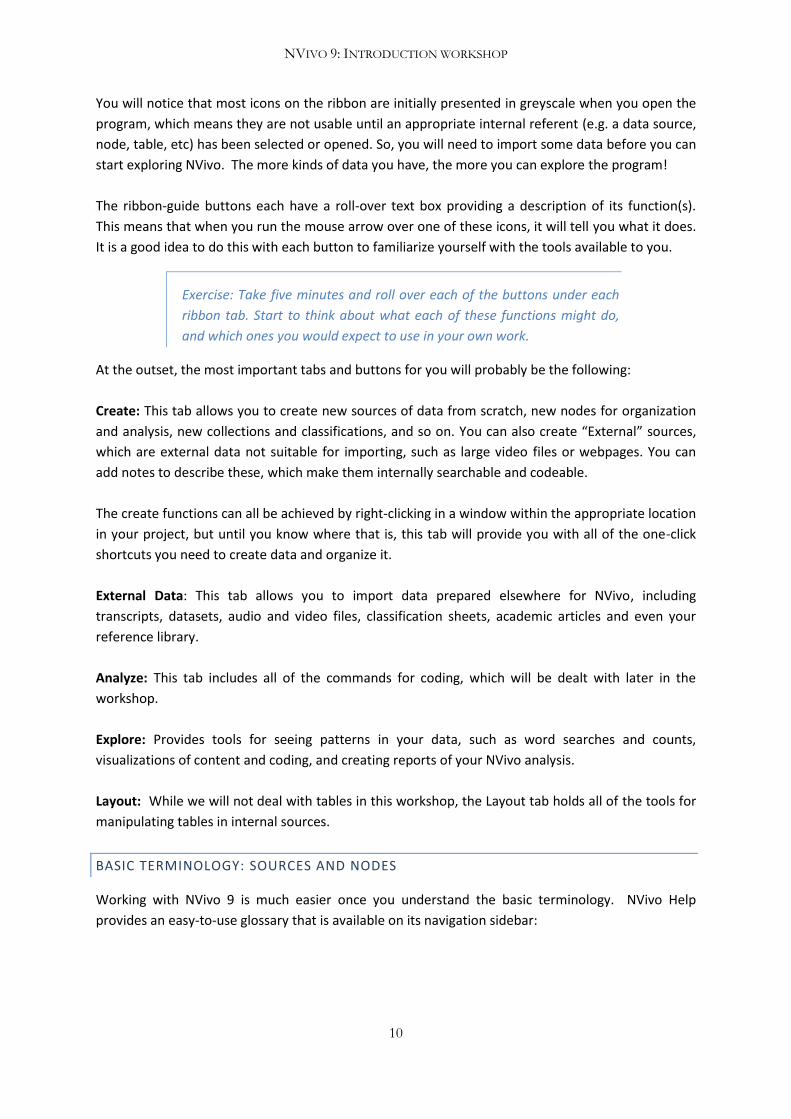
You will notice that most icons on the ribbon are initially presented in greyscale when you open the
program, which means they are not usable until an appropriate internal referent (e.g. a data source,
node, table, etc) has been selected or opened. So, you will need to import some data before you can
start exploring NVivo. The more kinds of data you have, the more you can explore the program!
The ribbon-guide buttons each have a roll-over text box providing a description of its function(s).
This means that when you run the mouse arrow over one of these icons, it will tell you what it does.
It is a good idea to do this with each button to familiarize yourself with the tools available to you.
Exercise: Take five minutes and roll over each of the buttons under each
ribbon tab. Start to think about what each of these functions might do,
and which ones you would expect to use in your own work.
At the outset, the most important tabs and buttons for you will probably be the following:
Create: This tab allows you to create new sources of data from scratch, new nodes for organization
and analysis, new collections and classifications, and so on. You can also create “External” sources,
which are external data not suitable for importing, such as large video files or webpages. You can
add notes to describe these, which make them internally searchable and codeable.
The create functions can all be achieved by right-clicking in a window within the appropriate location
in your project, but until you know where that is, this tab will provide you with all of the one-click
shortcuts you need to create data and organize it.
External Data: This tab allows you to import data prepared elsewhere for NVivo, including
transcripts, datasets, audio and video files, classification sheets, academic articles and even your
reference library.
Analyze: This tab includes all of the commands for coding, which will be dealt with later in the
workshop.
Explore: Provides tools for seeing patterns in your data, such as word searches and counts,
visualizations of content and coding, and creating reports of your NVivo analysis.
Layout: While we will not deal with tables in this workshop, the Layout tab holds all of the tools for
manipulating tables in internal sources.
BASIC TERMINOLOGY: SOURCES AND NODES
Working with NVivo 9 is much easier once you understand the basic terminology. NVivo Help
provides an easy-to-use glossary that is available on its navigation sidebar:

NVIVO 9: INTRODUCTION WORKSHOP
11
Two essential terms for NVivo skills development are sources and nodes.
A source is a term for any research material that you have connected to your NVivo project. This
could be transcripts or field notes, as well as academic articles, research plans, pictures, audio
recordings, videos, notes, and online materials.
A node is best thought of as a “container” in which wholes or parts of sources are kept for analysis.
While NVivo offers users many ways to group and organize their data, nodes offer the richest
avenue for subsequent analysis. This will become clearer as the workshop progresses.
For those who have some familiarity with NVivo 8, do note that NVivo 9 and later versions have
eliminated Tree Nodes (though these are largely the same as parent and child nodes), and also
eliminated Case Nodes (which are essentially replaced by node classifications).
VIEWING DATA IN YOUR PROJECT
List View
Detail View
Navigation
View
Sidebar
Find Bar
NVIVO 9: INTRODUCTION WORKSHOP
12
Once you have sources and nodes in your project, these will be visible in a List View window when
you click the Sources or Nodes buttons on the Navigation View sidebar. If you double-click on a
source, it will open below in what is called Detail View.
To find sources or nodes by name, you can quickly bring them up using the Find bar, located above
the List View window. Simply type in all or part of the name in the Look for box, and a list of
relevant items will appear.
To find content within a source, open the source in Detail View and click the Find button under the
Home tab.
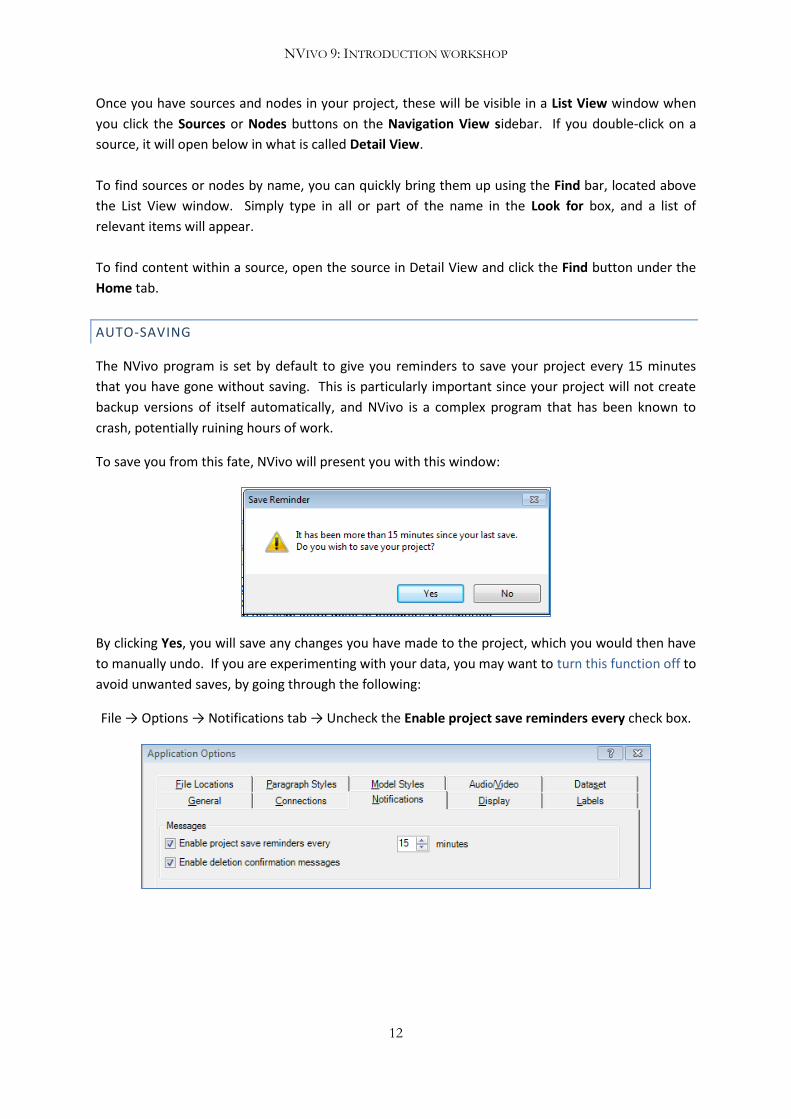
AUTO-SAVING
The NVivo program is set by default to give you reminders to save your project every 15 minutes
that you have gone without saving. This is particularly important since your project will not create
backup versions of itself automatically, and NVivo is a complex program that has been known to
crash, potentially ruining hours of work.
To save you from this fate, NVivo will present you with this window:
By clicking Yes, you will save any changes you have made to the project, which you would then have
to manually undo. If you are experimenting with your data, you may want to turn this function off to
avoid unwanted saves, by going through the following:
File → Options → Notifications tab → Uncheck the Enable project save reminders every check box.

NVIVO 9: INTRODUCTION WORKSHOP
13
THE NVIVO HELP SYSTEM
NVivo’s Help system (the small in the upper right-hand corner) is essential when experimenting
with NVivo’s functionality or when you run into a problem. The program is massive and in some
cases not necessarily intuitive. It is, however, very usable if you learn how to learn about it. As such,
this workshop document has been hyperlinked wherever possible to NVivo’s Help system, to
encourage you to familiarize yourself with that system.
The most up-to-date version will always be the online version, but you can also access NVivo Help
help when you are offline. If you wish, you can set offline help as the default help mode through the
Application Options → General tab (instructions ), to avoid having to open a web browser here
every time you have a question.
NVivo’s terminology can sometimes be confusing. I have therefore created a brief glossary of key
terms linked to the kinds of tasks a qualitative researcher may want to ask NVivo to perform. These
are not exhaustive, but may assist you in conceiving of Help system queries.
I want to… NVivo equivalent Relevant Help Section(s)
Bring documents, transcripts,
datasets, audio or visual material
into my project
Import external data Import documents and PDFs
Import datasets
Import audio or video
Import pictures
Create a document or transcript
within NVivo
Create internal data About sources
Create audio or video transcripts in
NVivo
Include external files or websites
for analysis
Create external data Create externals for sources you cannot
import
Arrange my data items by type
(e.g. transcript, article,
newspaper)
Create source classifications Create source classifications
Arrange my data items into
groups
Create a collection Create and manage sets
Make a general note to myself or
other project members
Create a memo Create or import memos
Make a specific note about
individual or multiple data
sources
Link a memo Add, delete and manage memo links
Sort my data into emerging
themes
Code source data into nodes Basic Coding in Documents, PDFs and
External Memos
Sort text data into pre-defined
categories
Auto-code sources Automatic coding in document sources
Identify demographic information
for people in my study
Create node classifications Create node classifications
Work with attribute values
Classify nodes (set attribute values to
record information)

NVIVO 9: INTRODUCTION WORKSHOP
14
Do content analysis of my text
data or coded materials
Query data About queries
Create, edit and manage queries
Review my analysis activities Create a report Run reports and extracts
Understand views and fields
Understand predefined reports and
extracts
If you come away with nothing else from this workshop, you should come away with an
understanding of the help system and the terms you need to navigate it!
Exercise: Open NVivo 9 Help and take five minutes to look around.
ONE MORE NOTE…
Keep in mind that the following is not an exhaustive list of the approaches to analysis and functions
available to NVivo users. Instead, the workshop will lay out a few essential skills that will be
applicable for a wide range of research projects, and hopefully provide participants with the tools to
self-teach some more intermediate functions.
NVIVO 9: INTRODUCTION WORKSHOP
15
GETTING YOUR RESEARCH INTO NVIVO
Before you can do anything meaningful in NVivo, you need to have some data to work with. There
are two ways to get analysable data in NVivo: import it from external files, or create it inside NVivo.
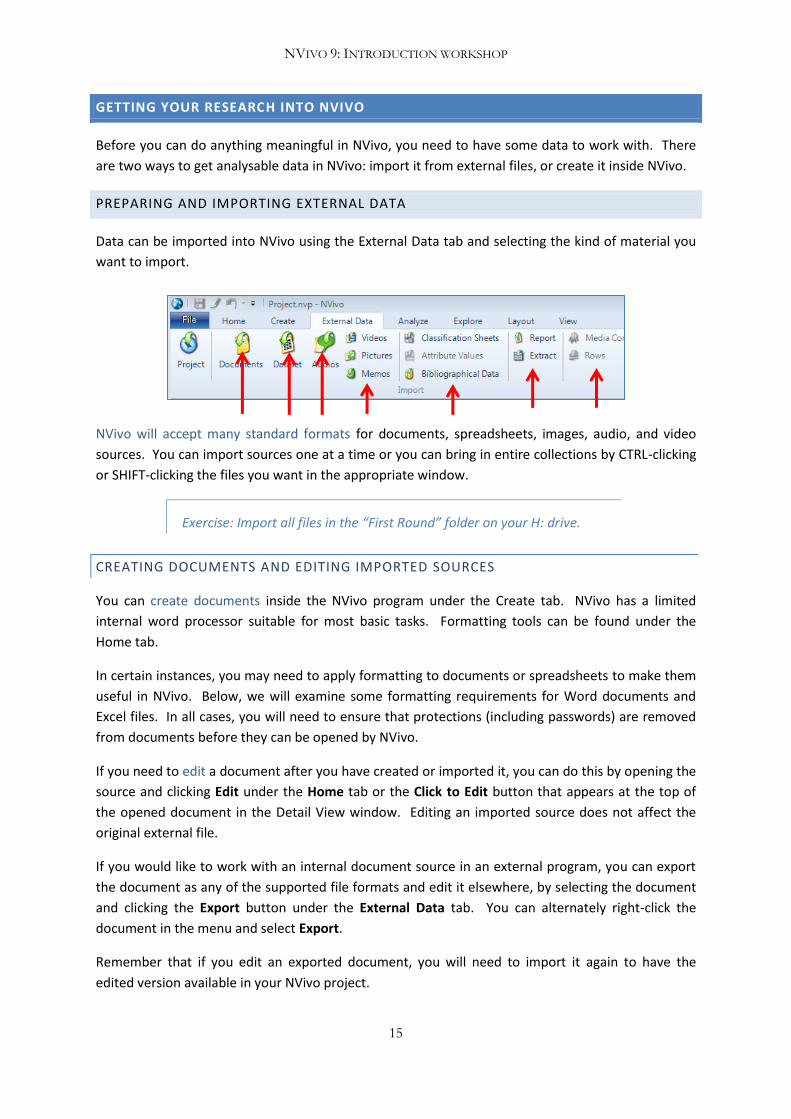
PREPARING AND IMPORTING EXTERNAL DATA
Data can be imported into NVivo using the External Data tab and selecting the kind of material you
want to import.
NVivo will accept many standard formats for documents, spreadsheets, images, audio, and video
sources. You can import sources one at a time or you can bring in entire collections by CTRL-clicking
or SHIFT-clicking the files you want in the appropriate window.
Exercise: Import all files in the “First Round” folder on your H: drive.
CREATING DOCUMENTS AND EDITING IMPORTED SOURCES
You can create documents inside the NVivo program under the Create tab. NVivo has a limited
internal word processor suitable for most basic tasks. Formatting tools can be found under the
Home tab.
In certain instances, you may need to apply formatting to documents or spreadsheets to make them
useful in NVivo. Below, we will examine some formatting requirements for Word documents and
Excel files. In all cases, you will need to ensure that protections (including passwords) are removed
from documents before they can be opened by NVivo.
If you need to edit a document after you have created or imported it, you can do this by opening the
source and clicking Edit under the Home tab or the Click to Edit button that appears at the top of
the opened document in the Detail View window. Editing an imported source does not affect the
original external file.
If you would like to work with an internal document source in an external program, you can export
the document as any of the supported file formats and edit it elsewhere, by selecting the document
and clicking the Export button under the External Data tab. You can alternately right-click the
document in the menu and select Export.
Remember that if you edit an exported document, you will need to import it again to have the
edited version available in your NVivo project.

NVIVO 9: INTRODUCTION WORKSHOP
16
PREPARING TEXT FOR AUTO-CODING
In many cases – especially where you are using NVivo to explore largely unstructured data or to hunt
for good quotes in a pile of interviews, you will not need to do any document preparation. However,
for more structured analysis, there are a few key steps that can open up NVivo’s capabilities.
It is normally going to be easier to prepare data for importing into NVivo than to manipulate it once
it has been imported. For most users, it will be preferable to prepare your documents in Word
format (either .doc or .docx) for subsequent ease of use. In particular, NVivo has been designed to
recognize Word document heading styles for use in its Auto-Coding functions.
Auto-Coding allows the researcher to quickly aggregate text information through previously-
assigned categories. A normal way to use this function would be in instances where a structured
interview or questionnaire has been administered as part of a study, and the researcher wants to
aggregate all answers to a particular question from multiple respondents. Auto-coding can also be
used to separate individual speakers out of group interviews, as well as more creatively to organize
semi- or un-structured pieces of data.
For this to be possible, categories in all sources must be arranged under headings that are exactly
the same, and from these headings, NVivo will be able to separate and collect these responses into
analogous categories as nodes in your project.
Exercise: Using the opening statements from each debate transcript, use
heading styles to separate text by speaker name.
If you have prepared the files outside of NVivo, import your prepared
transcripts.
Finally, select your prepared transcripts in List View. Then click Auto Code
under the Analyze tab and follow the instructions. Code them into new
nodes under the heading “Debate Speakers”.
PRECISION IS ESSENTIAL!
NVivo does not make decisions or corrections for you, and small errors in text or format can
complicate or negate your use of import functions and other automatic processes in NVivo. For
example, if you want to auto-code interview responses, a small typo – including an extra space or
punctuation in the heading line – can result in a response being left out of the appropriate node.
You should therefore design strategies at the front end to minimize the chance for errors, such as
developing templates for transcripts or quality-checking transcripts prepared by yourself and others.
NVIVO 9: INTRODUCTION WORKSHOP
17
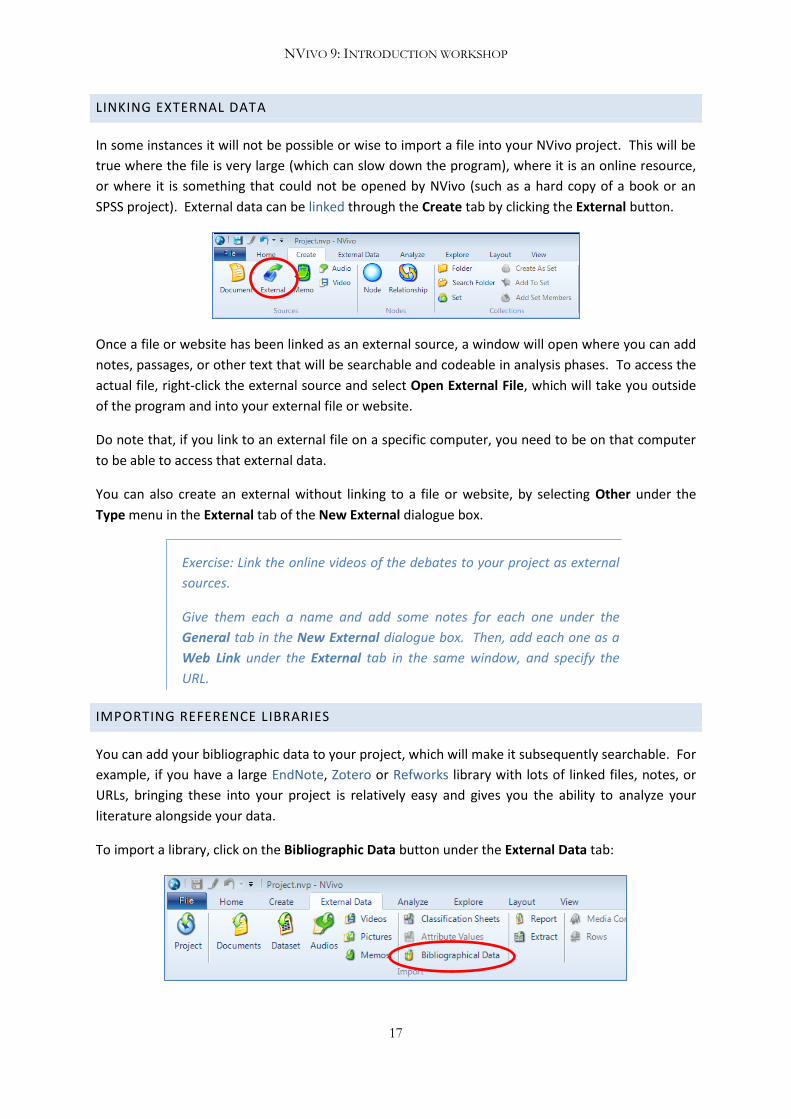
LINKING EXTERNAL DATA
In some instances it will not be possible or wise to import a file into your NVivo project. This will be
true where the file is very large (which can slow down the program), where it is an online resource,
or where it is something that could not be opened by NVivo (such as a hard copy of a book or an
SPSS project). External data can be linked through the Create tab by clicking the External button.
Once a file or website has been linked as an external source, a window will open where you can add
notes, passages, or other text that will be searchable and codeable in analysis phases. To access the
actual file, right-click the external source and select Open External File, which will take you outside
of the program and into your external file or website.
Do note that, if you link to an external file on a specific computer, you need to be on that computer
to be able to access that external data.
You can also create an external without linking to a file or website, by selecting Other under the
Type menu in the External tab of the New External dialogue box.
Exercise: Link the online videos of the debates to your project as external
sources.
Give them each a name and add some notes for each one under the
General tab in the New External dialogue box. Then, add each one as a
Web Link under the External tab in the same window, and specify the
URL.
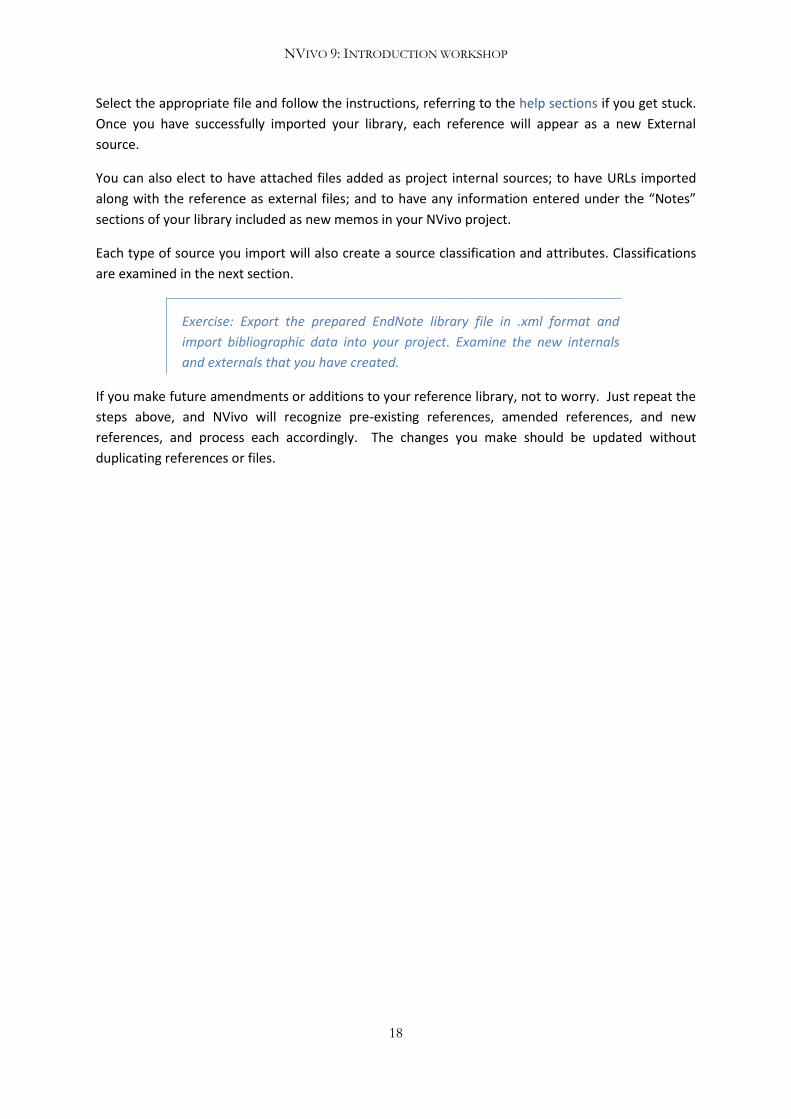
IMPORTING REFERENCE LIBRARIES
You can add your bibliographic data to your project, which will make it subsequently searchable. For
example, if you have a large EndNote, Zotero or Refworks library with lots of linked files, notes, or
URLs, bringing these into your project is relatively easy and gives you the ability to analyze your
literature alongside your data.
To import a library, click on the Bibliographic Data button under the External Data tab:
NVIVO 9: INTRODUCTION WORKSHOP
18
Select the appropriate file and follow the instructions, referring to the help sections if you get stuck.
Once you have successfully imported your library, each reference will appear as a new External
source.
You can also elect to have attached files added as project internal sources; to have URLs imported
along with the reference as external files; and to have any information entered under the “Notes”
sections of your library included as new memos in your NVivo project.
Each type of source you import will also create a source classification and attributes. Classifications
are examined in the next section.
Exercise: Export the prepared EndNote library file in .xml format and
import bibliographic data into your project. Examine the new internals
and externals that you have created.
If you make future amendments or additions to your reference library, not to worry. Just repeat the
steps above, and NVivo will recognize pre-existing references, amended references, and new
references, and process each accordingly. The changes you make should be updated without
duplicating references or files.
NVIVO 9: INTRODUCTION WORKSHOP
19
ORGANIZING YOUR DATA
Once you have imported your data, it is time to organize it for analysis (recognizing that for many
researchers, organization and analysis are sometimes concurrent and sometimes in opposition!). As
noted earlier, your organization choices will be specific to the kinds of analysis you want to perform.
CLASSIFICATIONS AND ATTRIBUTES
Classifications provide a way of arranging and rearranging sources and nodes for analysis. Attributes
provide ways of subdividing and refining classifications by adding numeric or text values to a
classified source or node.
Source classifications allow the researcher to organize their data sources by type. Node
classifications provide a similar function for nodes, and node classification attributes allow more
complex queries in analysis stages. We will explore some of the standard approaches to source and
node classification.
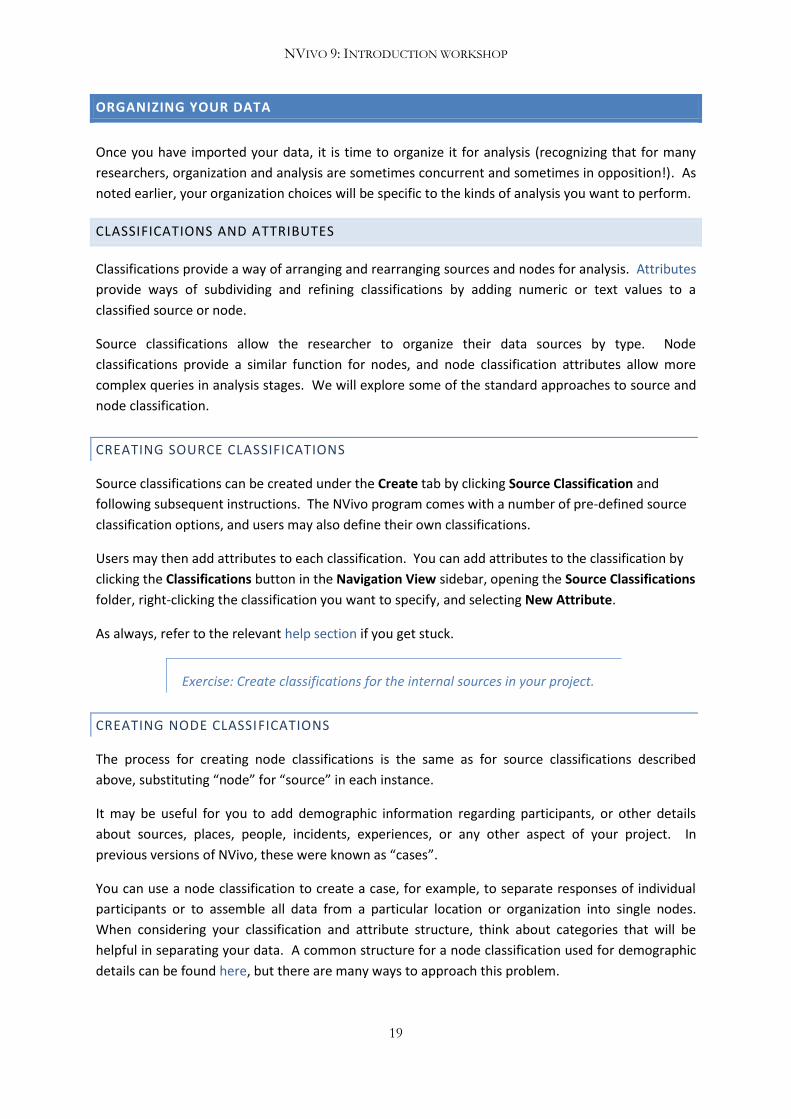
CREATING SOURCE CLASSIFICATIONS
Source classifications can be created under the Create tab by clicking Source Classification and
following subsequent instructions. The NVivo program comes with a number of pre-defined source
classification options, and users may also define their own classifications.
Users may then add attributes to each classification. You can add attributes to the classification by
clicking the Classifications button in the Navigation View sidebar, opening the Source Classifications
folder, right-clicking the classification you want to specify, and selecting New Attribute.
As always, refer to the relevant help section if you get stuck.
Exercise: Create classifications for the internal sources in your project.
CREATING NODE CLASSIFICATIONS
The process for creating node classifications is the same as for source classifications described
above, substituting “node” for “source” in each instance.
It may be useful for you to add demographic information regarding participants, or other details
about sources, places, people, incidents, experiences, or any other aspect of your project. In
previous versions of NVivo, these were known as “cases”.
You can use a node classification to create a case, for example, to separate responses of individual
participants or to assemble all data from a particular location or organization into single nodes.
When considering your classification and attribute structure, think about categories that will be
helpful in separating your data. A common structure for a node classification used for demographic
details can be found here, but there are many ways to approach this problem.

NVIVO 9: INTRODUCTION WORKSHOP
20
Classifying nodes will give you increased analytic abilities. For example, you may want to be able to
know how many people over 40 answered a question in a certain way or how often participants
from a certain geographic area mentioned a specific idea or term. This is best achieved through
using node classifications and attributes. The thought process behind this task is rather complicated
to explain in text, so in the workshop we will do this through an exercise instead. Please feel free to
consult the relevant help section for further clarification.
IMPORTING CLASSIFICATION SHEETS THROUGH EXCEL
You can prepare classification sheets for importation into NVivo. This is particularly handy if you
have already collected your data in another program prior to using NVivo. A classification sheet in
Excel should have the following format before importing:
You can also import tab-separated text files if that is more suitable to your data.
Once you have a properly-formatted classification sheet, you can import it through the External
Data tab by clicking on the Classification Sheets button:
This will open the Import Classification Sheets wizard, which will guide you through the process:
Refer to the help sections if you get stuck, and make sure your source file (the Excel file) is not open
on your computer when you try to import it.
Exercise: We have by now created nodes for each debate speaker. Next,
we will add some demographic variables about them by creating a Node
Classification sheet in Excel.

NVIVO 9: INTRODUCTION WORKSHOP
21
Beginning with the supplied file containing ages of candidates and
moderators, prepare an Excel sheet to classify each speaker in the debate
by party affiliation, age range, and gender.
Then, import it using the Import Classification Sheet wizard. Be sure to
check the “Replace attribute values…” box in step 2. This will allow NVivo
to match your sheet to the Debate Speaker nodes.
Once completed, check out the new node classifications and attributes
under the Classifications section.
If you prefer, you can create the node classifications inside the program.
EDITING CLASSIFICATIONS
All classifications, attributes, and attribute values can be subsequently edited if the categories you
want to use change during analysis. The NVivo program will maintain sources or nodes included
under an old classification or attribute in the re-named version. It will also offer you the opportunity
to re-assign and add values if you change your attribute value structure, so with a bit of care you
should be able to painlessly re-name and re-structure classifications as often as necessary.
Exercise: Add “Female” as an attribute value under the Gender column in
your node classification.
SETS
Sets are another way of organizing sources and nodes into groups for subsequent analysis. Sets are
a kind of Collection, and Collections are handy because they can contain both sources and nodes at
the same time, and can be searched using NVivo’s query functions.
To create a set, go to the Create tab and click Set under the Collections group. Name your set,
describe it if you wish, and then click OK. You can then add any node or source to your set by right-
clicking the item and selecting Add To Set from the menu that appears.
Exercise: Create a set for visual materials in the project, and add all
relevant sources to it.
NVIVO 9: INTRODUCTION WORKSHOP
22
CUSTOMIZING YOUR INTERFACE
If you decide to use NVivo for your project, you will spend many hours in front of it. Customizing can
make this experience more pleasant and productive. There are a number of small changes you can
make to the layout of NVivo to suit your personal working style and preferences. The following are
some of the basic options you may want to know about.
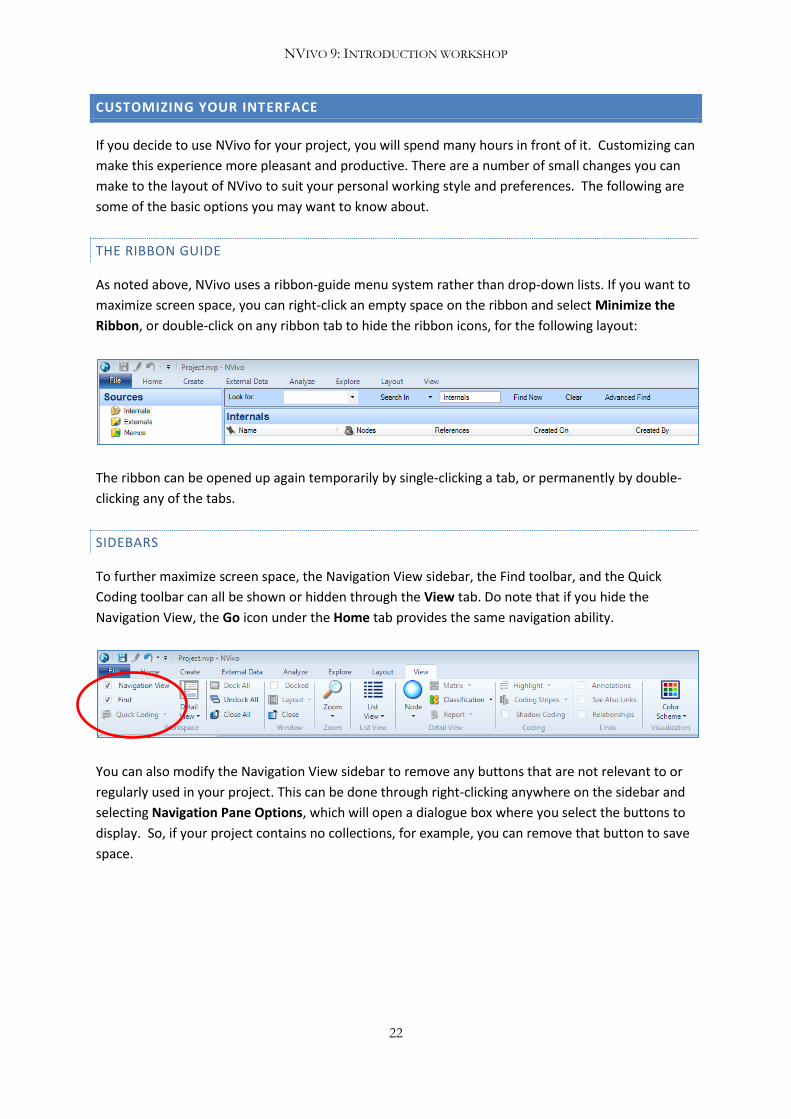
THE RIBBON GUIDE
As noted above, NVivo uses a ribbon-guide menu system rather than drop-down lists. If you want to
maximize screen space, you can right-click an empty space on the ribbon and select Minimize the
Ribbon, or double-click on any ribbon tab to hide the ribbon icons, for the following layout:
The ribbon can be opened up again temporarily by single-clicking a tab, or permanently by double-
clicking any of the tabs.
SIDEBARS
To further maximize screen space, the Navigation View sidebar, the Find toolbar, and the Quick
Coding toolbar can all be shown or hidden through the View tab. Do note that if you hide the
Navigation View, the Go icon under the Home tab provides the same navigation ability.
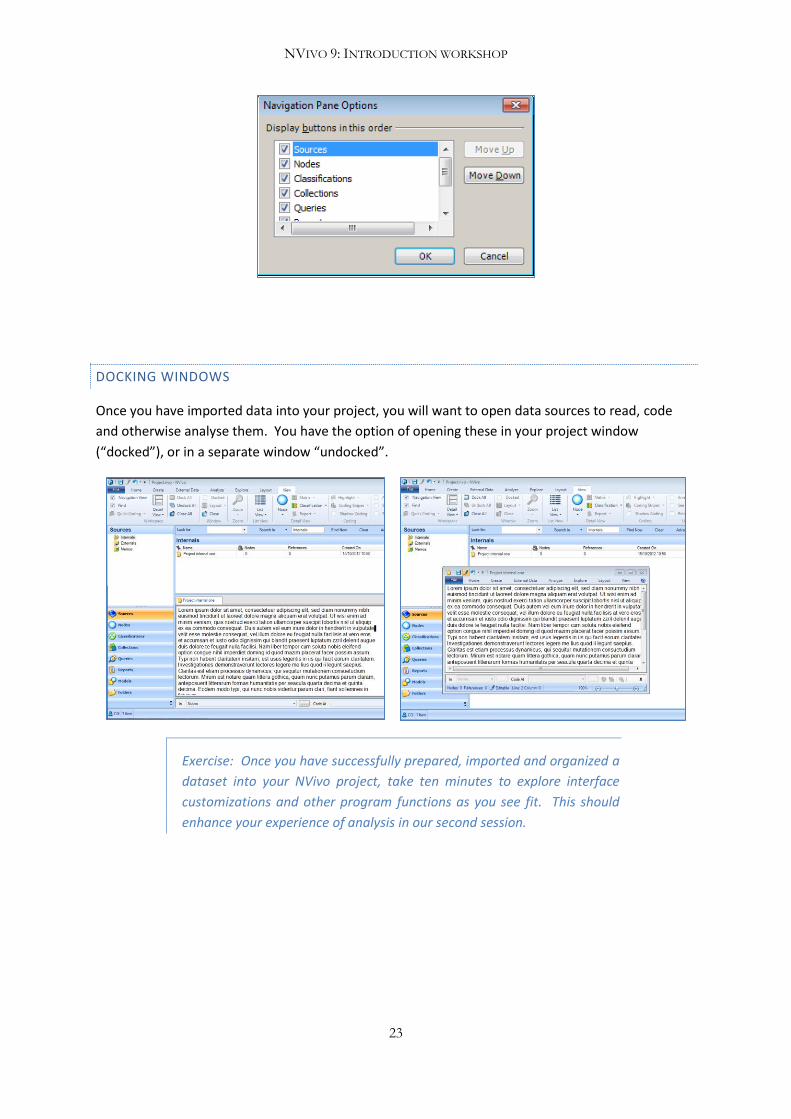
You can also modify the Navigation View sidebar to remove any buttons that are not relevant to or
regularly used in your project. This can be done through right-clicking anywhere on the sidebar and
selecting Navigation Pane Options, which will open a dialogue box where you select the buttons to
display. So, if your project contains no collections, for example, you can remove that button to save
space.
NVIVO 9: INTRODUCTION WORKSHOP
23
DOCKING WINDOWS
Once you have imported data into your project, you will want to open data sources to read, code
and otherwise analyse them. You have the option of opening these in your project window
(“docked”), or in a separate window “undocked”.
Exercise: Once you have successfully prepared, imported and organized a
dataset into your NVivo project, take ten minutes to explore interface
customizations and other program functions as you see fit. This should
enhance your experience of analysis in our second session.
NVIVO 9: INTRODUCTION WORKSHOP
24
SESSION 2: DOING ANALYSIS
Once you have some or all of your data imported or linked to your NVivo project, and hopefully have
it at least somewhat organized, you are in a position to begin analysing it. In the second session, we
will look at some of the tools that can assist you in reading your data, recording insights, linking
pieces of data together, and sorting relevant findings into themes.
This workshop is not a substitute for qualitative research training. Achieving results through NVivo
begins and ends with solid ideas about what qualitative data analysis can do and what you want to
accomplish in your project. NVivo can help keep large data sets organized, structure your thinking
about certain questions, and provide means to creatively explore your data. It cannot tell you what
your data says about your research problem, and in almost all cases you will still have to read (or
watch, or listen to, or otherwise examine) your data carefully before drawing conclusions.
NVIVO 9: INTRODUCTION WORKSHOP
25
WORKING WITH NODES
A LITTLE MORE ABOUT NODES…
In the first session we created nodes through auto-coding. In these cases, each node represented a
pre-defined category for information. However, many forms of qualitative inquiry rely on inductive
approaches, where categories for data analysis emerge after data collection is completed. In this
sense, nodes can also be understood as thematic categories, and can be created during analysis.
Sorting your data into nodes through manual coding can be as structured or unstructured as is
appropriate to your research method.
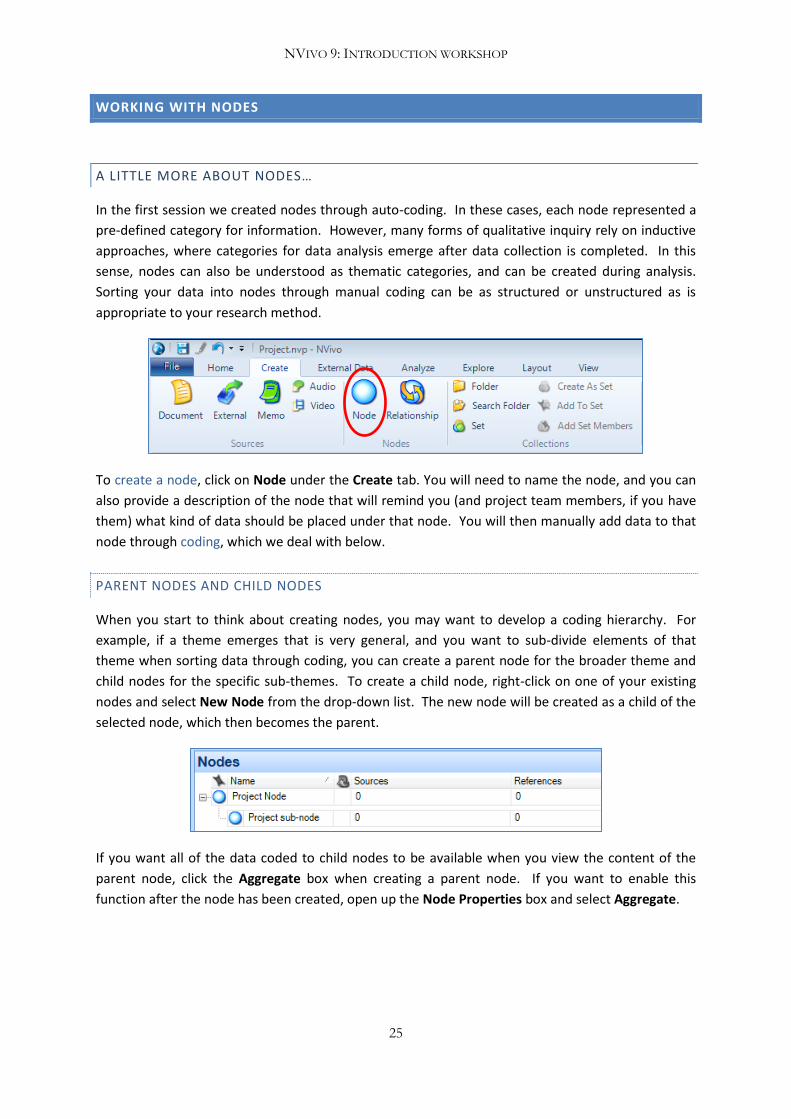
To create a node, click on Node under the Create tab. You will need to name the node, and you can
also provide a description of the node that will remind you (and project team members, if you have
them) what kind of data should be placed under that node. You will then manually add data to that
node through coding, which we deal with below.
PARENT NODES AND CHILD NODES
When you start to think about creating nodes, you may want to develop a coding hierarchy. For
example, if a theme emerges that is very general, and you want to sub-divide elements of that
theme when sorting data through coding, you can create a parent node for the broader theme and
child nodes for the specific sub-themes. To create a child node, right-click on one of your existing
nodes and select New Node from the drop-down list. The new node will be created as a child of the
selected node, which then becomes the parent.
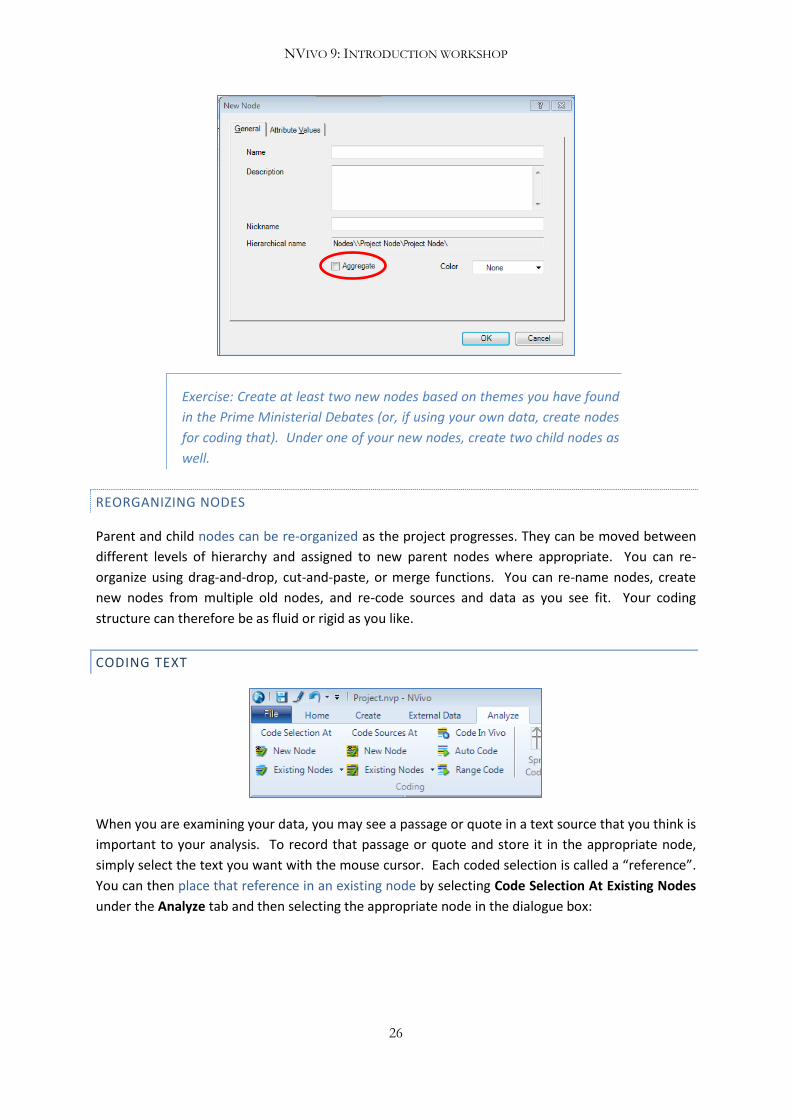
If you want all of the data coded to child nodes to be available when you view the content of the
parent node, click the Aggregate box when creating a parent node. If you want to enable this
function after the node has been created, open up the Node Properties box and select Aggregate.
NVIVO 9: INTRODUCTION WORKSHOP
26
Exercise: Create at least two new nodes based on themes you have found
in the Prime Ministerial Debates (or, if using your own data, create nodes
for coding that). Under one of your new nodes, create two child nodes as
well.
REORGANIZING NODES
Parent and child nodes can be re-organized as the project progresses. They can be moved between
different levels of hierarchy and assigned to new parent nodes where appropriate. You can re-
organize using drag-and-drop, cut-and-paste, or merge functions. You can re-name nodes, create
new nodes from multiple old nodes, and re-code sources and data as you see fit. Your coding
structure can therefore be as fluid or rigid as you like.
CODING TEXT
When you are examining your data, you may see a passage or quote in a text source that you think is
important to your analysis. To record that passage or quote and store it in the appropriate node,
simply select the text you want with the mouse cursor. Each coded selection is called a “reference”.
You can then place that reference in an existing node by selecting Code Selection At Existing Nodes
under the Analyze tab and then selecting the appropriate node in the dialogue box:
NVIVO 9: INTRODUCTION WORKSHOP
27
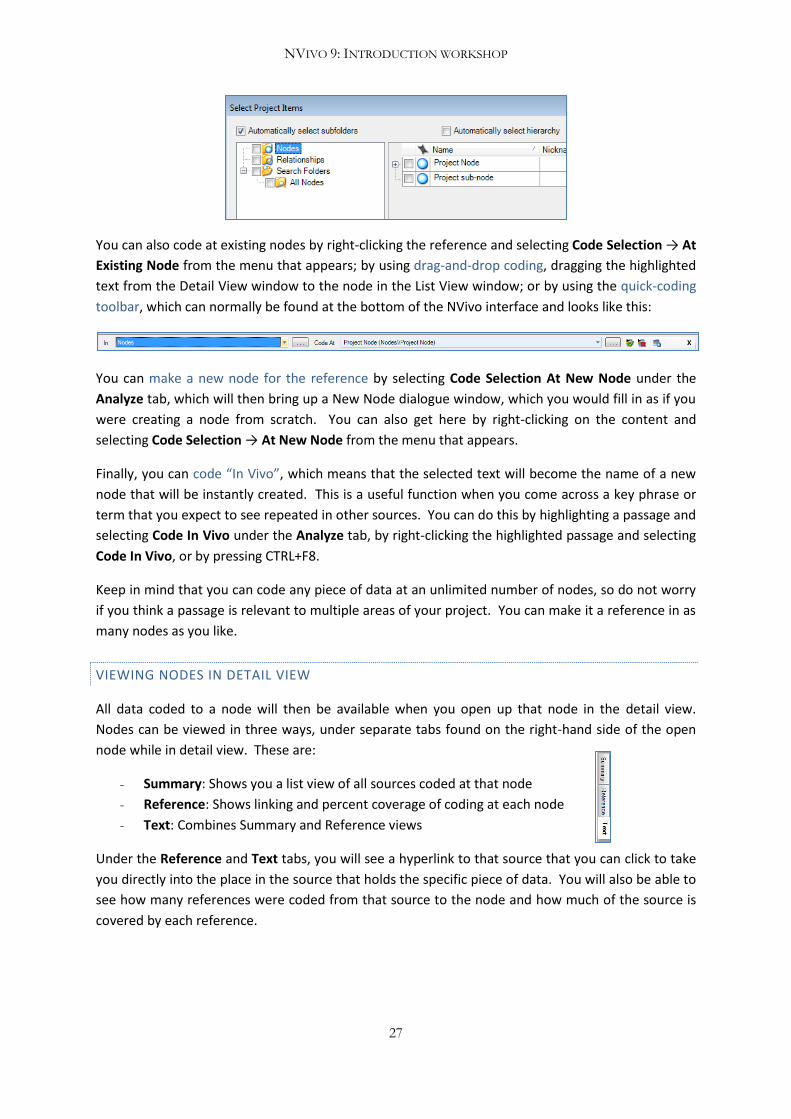
You can also code at existing nodes by right-clicking the reference and selecting Code Selection → At
Existing Node from the menu that appears; by using drag-and-drop coding, dragging the highlighted
text from the Detail View window to the node in the List View window; or by using the quick-coding
toolbar, which can normally be found at the bottom of the NVivo interface and looks like this:
You can make a new node for the reference by selecting Code Selection At New Node under the
Analyze tab, which will then bring up a New Node dialogue window, which you would fill in as if you
were creating a node from scratch. You can also get here by right-clicking on the content and
selecting Code Selection → At New Node from the menu that appears.
Finally, you can code “In Vivo”, which means that the selected text will become the name of a new
node that will be instantly created. This is a useful function when you come across a key phrase or
term that you expect to see repeated in other sources. You can do this by highlighting a passage and
selecting Code In Vivo under the Analyze tab, by right-clicking the highlighted passage and selecting
Code In Vivo, or by pressing CTRL+F8.
Keep in mind that you can code any piece of data at an unlimited number of nodes, so do not worry
if you think a passage is relevant to multiple areas of your project. You can make it a reference in as
many nodes as you like.
VIEWING NODES IN DETAIL VIEW
All data coded to a node will then be available when you open up that node in the detail view.
Nodes can be viewed in three ways, under separate tabs found on the right-hand side of the open
node while in detail view. These are:
- Summary: Shows you a list view of all sources coded at that node
- Reference: Shows linking and percent coverage of coding at each node
- Text: Combines Summary and Reference views
Under the Reference and Text tabs, you will see a hyperlink to that source that you can click to take
you directly into the place in the source that holds the specific piece of data. You will also be able to
see how many references were coded from that source to the node and how much of the source is
covered by each reference.

NVIVO 9: INTRODUCTION WORKSHOP
28
If you want to see your reference in context, you can also use the Spread Coding function under the
Analyze tab to see a text on either side of the selection.
The coding spread can be made for a custom range, and may be particularly useful if you prefer to
code key words rather than whole passages.
CODING WHOLE SOURCES
You can also code whole sources to nodes by selecting a source (or multiple sources) in the Sources
list view and then clicking Code Sources At New Node (or Existing Nodes) under the Analyze tab.
UNCODING
If you change your coding structure or no longer think something is relevant to a certain node, you
can remove coding from references or parts of references coded in a source. You can uncode a
reference through the Analyze tab, or by selecting the passage you want to uncode, right-clicking
and selecting Uncode Selection at the relevant node.
Exercise: Spend 30 minutes coding the material in the debates, pdf
articles, and other text sources. Use your existing nodes or create new
ones. Try using the Quick Coding bar, the Code In Vivo functions, and
uncoding
CODING AUDIO AND VISUAL MEDIA
You can use most of the same coding techniques on audio and video that you use with text. If you
have an audio or video file inside your project, you can open it in NVivo. It will create a waveform
representing the audio file. You can click-and-drag your mouse cursor over sections of the
waveform and code them as if they were text.
As with text sources, when viewing audio or video references in the node in Detail View, you will see
how much of the source is covered by the reference. You will also be given a hyperlink to the

NVIVO 9: INTRODUCTION WORKSHOP
29
selection. Clicking on the link will open up the audio or video source and take you to the beginning
of the reference, which you can then play through the NVivo media player.
You can also code image files. This is done by click-and-dragging your mouse cursor over the area of
a picture that you would like to code, and then coding appropriately. You can add descriptive text to
picture sources, and this can be coded like regular text.
Exercise: Using the supplied video file, code a section of the waveform to
an existing node. Close the file, then open up the node and use the
hyperlink to return to the reference.
AUDIO AND VIDEO TRANSCRIPTS
Using NVivo’s media player, you can create a transcript using the program’s transcription functions.
NVivo has all of the functionality of a basic scribe software package.
You can also import a transcript, and if your transcripts are prepared with appropriate timestamps
you will be able to use NVivo’s transcript synchronization functions. These will allow you to read
through a transcript in sync while its audio or video file is playing. It also lets you code references
from transcript text and have these linked in the node to your audio file as well.
VISUAL MARKERS OF NODE CODING
You may want to be able to see how much of a source has been coded, and where. NVivo thus gives
you the ability to add Highlighting and Coding Stripes to either some or all of your nodes.
Highlighting will highlight the text in the source to show where coding has occurred, while coding
stripes provide a visual representation in a new sidebar. Adding coding stripes will also show you
Coding Density, which reveals you how many times a particular reference has been coded at
separate nodes.

NVIVO 9: INTRODUCTION WORKSHOP
30
To add coding stripes or highlighting, go to the View tab and select Highlight or Coding Stripes. From
the drop-down menu that appears, select the nodes you would like to visualize. These can be turned
on and off as necessary.
When you code audio, video, or image sources, you can create a visual marker of the coding in the
source called Shadow Coding. These are similar to highlighting, and can be switched on or off in the
same place as Highlighting and Coding Stripes in the View tab.
Exercise: Add coding stripes to your nodes.

NVIVO 9: INTRODUCTION WORKSHOP
31
QUERYING DATA
Alongside sorting your data into nodes, you can run a number of processes to learn more about
what is in your data. We have already examined auto-coding, and there are a number of other tools
that may provide insight into text-based and coded sources. You can run queries for all of your
project, or for a selected group of sources, nodes, sets, folders, and/or annotations and memos. All
of the query functions can be found under the Explore tab by clicking on the New Query button.
WORD FREQUENCY SEARCHES
You can find out how many times a specific word or group of related words can be found in all of
your data, or in a selected part of it. To find the most common words in your data, you can run a
Word Frequency Query. This is the most basic query function, and will query selected text sources in
your project for the most frequent words. You can specify how many words you would like to see as
well as a minimum length, to avoid words like “I”, “a” and “the”.
To run a word frequency query, select it under the New Query button on the Explore tab and set
your parameters and click on the bottom left corner of the dialogue box. You will see that
the program creates your results in detail view under four tabs on the right-hand side: Summary, Tag
Cloud, Tree Map, and Cluster Analysis. Each of these provides a different way of visualizing your
query.
Exercise: Run a word frequency query for your project. Examine the Tag
Cloud, Tree Map, and Cluster Analysis. What do these things tell you
about your data?
Re-try your research, but eliminate shorter words or move the Finding
Matches bar from “Exact” to “Similar”. What happens?
TEXT SEARCHES
Text searches provide another way to determine how often certain words appear in your data and
annotations. You can also use a text search to find out how many times a certain word appears in
context with another word or phrase.
To run a text search, select it under the New Query button on the Explore tab and enter the word or
phrase you would like to find in the Search for section of the dialogue box. You can specify your
search further by looking for exact matches or similar phrases, and you can also limit your search to
within selected areas of your project.
NVIVO 9: INTRODUCTION WORKSHOP
32
You can also add special instructions within the text box by clicking the button on the right-
hand side of the box. These allow you to add Boolean modifiers to your query, as well as specify
other words that should be nearby by clicking the Near option. This can help narrow your search
significantly in a large dataset.
Once you have set your parameters, click . Like viewing a Node in detail view, a Text Search
Query creates Summary, Reference, and Text sections. Also like node coding, you can spread your
text search coding so that surrounding text is included in detail view.
Running a text search query will also create a Word Tree, which shows you a visual representation of
words that occur near the text you are seeking.
Exercise: Run a text search query and examine the results. Try using the
Special instructions to narrow your search.
CODING QUERIES
If you want to look in more detail at the coding you have done, you can run a coding query. These
allow you to examine coding within a single node to see what kinds of patterns may emerge. You
can look for content coded at a specific node, cross-referenced with another node or set of nodes,
sources, collections, classifications, and so on. This is a way of looking for overlap between
categories, as well as specifying results within categories.
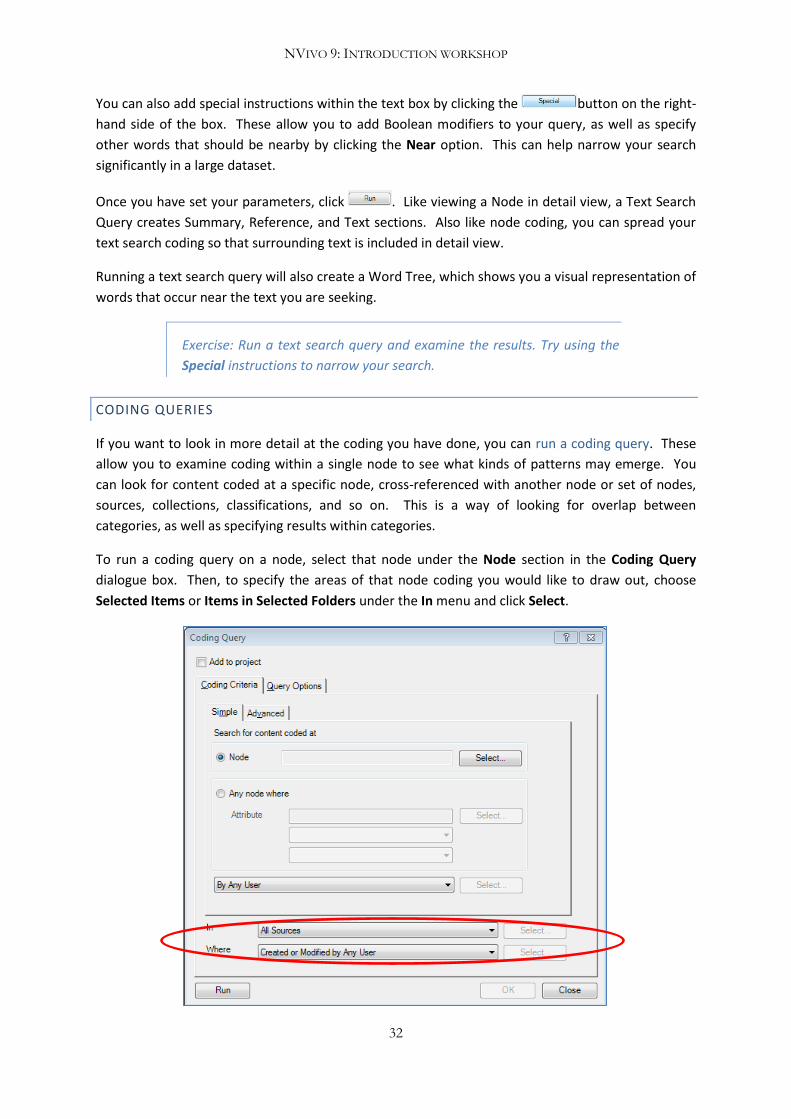
To run a coding query on a node, select that node under the Node section in the Coding Query
dialogue box. Then, to specify the areas of that node coding you would like to draw out, choose
Selected Items or Items in Selected Folders under the In menu and click Select.
NVIVO 9: INTRODUCTION WORKSHOP
33
You can then narrow your query in the Select Project Items dialogue box that appears.
Using coding queries, you can also separate responses by attribute values, such as those
demographic variables you set out in your classification sheet. This is done by selecting the
button and choosing the attributes you want to isolate. You can then define the
subset of sources you want to examine in the same way as described above, by choosing Selected
Items or Items from Selected Folders under the In menu and setting parameters through the
dialogue box that appears.
Exercise: Using a coding query, find all of the text from the debate
opening statements made by people under 50 years old.
COMPOUND QUERIES
Compound queries allow you to combine a text search query with a coding query, or to combine two
text search queries to look for overlap. All of the parameter rules remain fundamentally the same as
with individual text search and coding queries, but in compound queries you get to refine your
search with proximity modifiers, i.e. by looking for only those references that occur near, with, or
not with or near, another set of references.
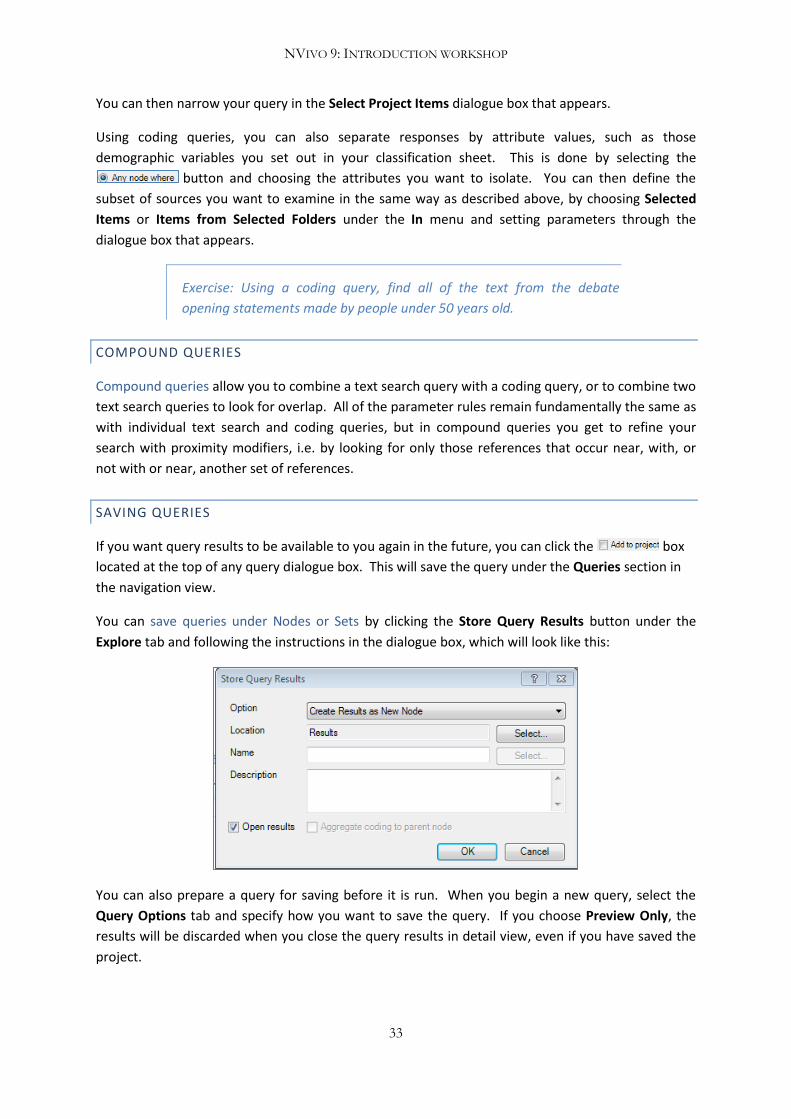
SAVING QUERIES
If you want query results to be available to you again in the future, you can click the box
located at the top of any query dialogue box. This will save the query under the Queries section in
the navigation view.
You can save queries under Nodes or Sets by clicking the Store Query Results button under the
Explore tab and following the instructions in the dialogue box, which will look like this:
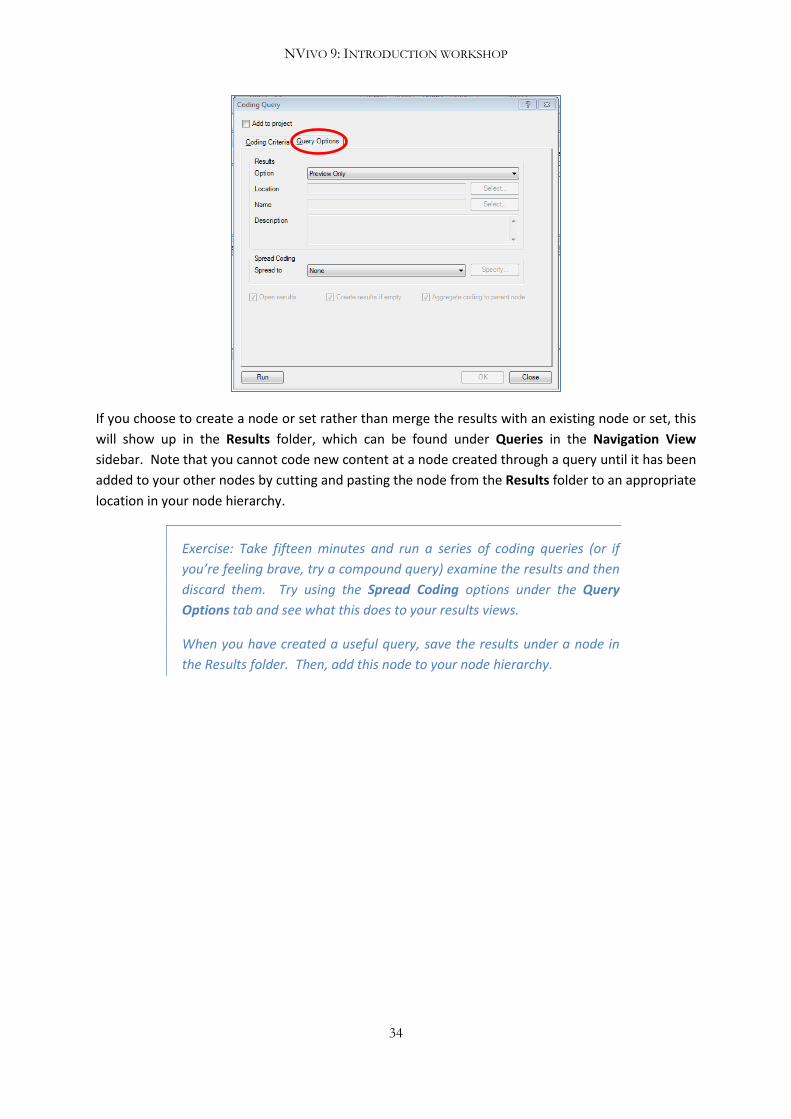
You can also prepare a query for saving before it is run. When you begin a new query, select the
Query Options tab and specify how you want to save the query. If you choose Preview Only, the
results will be discarded when you close the query results in detail view, even if you have saved the
project.
NVIVO 9: INTRODUCTION WORKSHOP
34
If you choose to create a node or set rather than merge the results with an existing node or set, this
will show up in the Results folder, which can be found under Queries in the Navigation View
sidebar. Note that you cannot code new content at a node created through a query until it has been
added to your other nodes by cutting and pasting the node from the Results folder to an appropriate
location in your node hierarchy.
Exercise: Take fifteen minutes and run a series of coding queries (or if
you’re feeling brave, try a compound query) examine the results and then
discard them. Try using the Spread Coding options under the Query
Options tab and see what this does to your results views.
When you have created a useful query, save the results under a node in
the Results folder. Then, add this node to your node hierarchy.

NVIVO 9: INTRODUCTION WORKSHOP
35
LINKS: MEMOS, ANNOTATIONS, SEE ALSO LINKS, AND HYPERLINKING
There are a number of ways to link data in your NVivo project to the ideas and bits of writing that
emerge while doing your analysis. Memos and annotations provide ways to create new, searchable
and codeable text that can contain ideas about how data should be used, analytical insights, notes to
research team members, or reminders about research tasks still to be done. See also links allow you
to connect related sources between one another within the project, and hyperlinking allows you to
connect to web-based information. Linking in some instances may be preferable to coding,
especially where ideas connecting these pieces of data are in formative stages.
All links are stored under Collections in the Navigation View sidebar.
MEMOS
A memo is basically a document source that holds some conceptual thinking rather than data. You
can create a memo under the Create tab or import one from a supported document format. You
can then link the memo to a single source or node, or specific content within these, under the
Analyze tab by selecting Memo Link and selecting Link to Existing Memo. You can only link a memo
to one piece of data at a time.
Selecting Link to New Memo will create a new memo and automatically link it to the selected source
or node. Memo links can later be deleted by selecting Delete Memo Link.
You can also create a memo containing general thoughts and leave it unlinked. Memos are stored
under Sources in the Memos folder, and they can be viewed, searched, coded, and classified just like
any other document source.
Exercise: Create a memo and link it to a source or node. Then, go to that
source or node and open up the memo link.
ANNOTATIONS
Like memos, annotations serve to record some thinking about a piece of data. Annotations are
created within a source by highlighting the relevant section of the source with the mouse arrow and
selecting New Annotation under the Analyze tab. Any piece of data that can be coded can also be
annotated. You can annotate text sources as well as pdfs, images, and audio and video sources. You
can add annotations within a source as many times as you like.
NVIVO 9: INTRODUCTION WORKSHOP
36
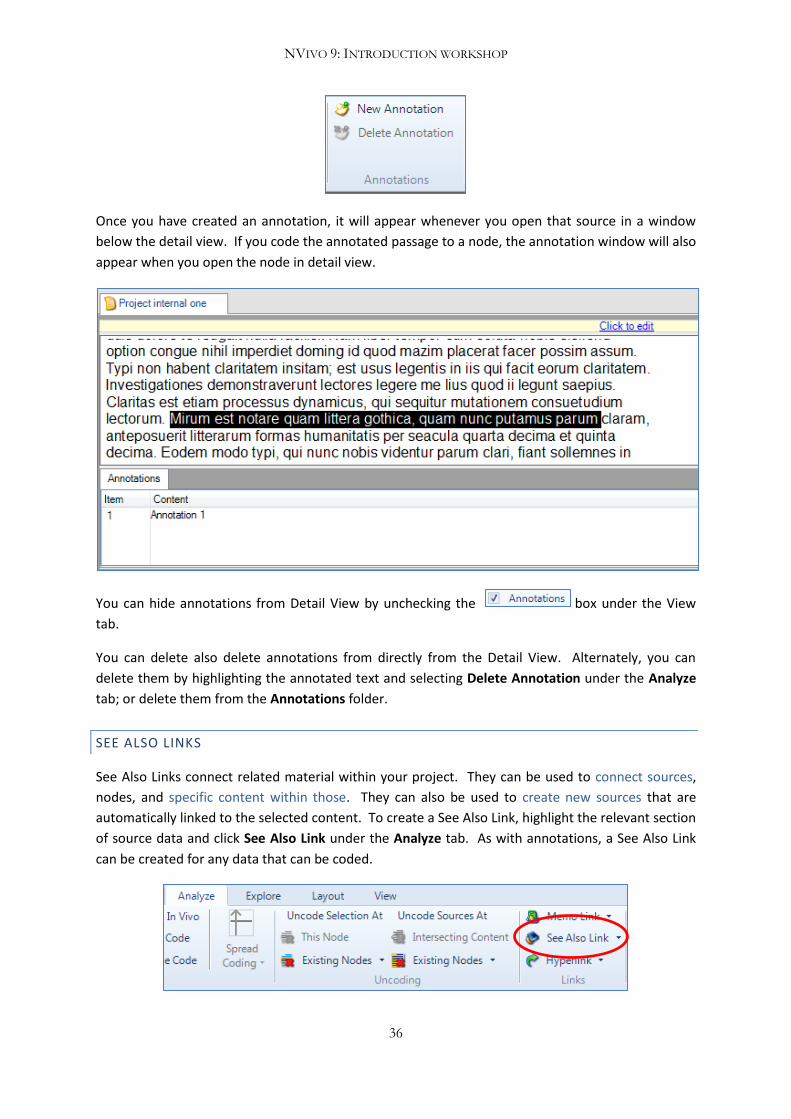
Once you have created an annotation, it will appear whenever you open that source in a window
below the detail view. If you code the annotated passage to a node, the annotation window will also
appear when you open the node in detail view.
You can hide annotations from Detail View by unchecking the box under the View
tab.
You can delete also delete annotations from directly from the Detail View. Alternately, you can
delete them by highlighting the annotated text and selecting Delete Annotation under the Analyze
tab; or delete them from the Annotations folder.
SEE ALSO LINKS
See Also Links connect related material within your project. They can be used to connect sources,
nodes, and specific content within those. They can also be used to create new sources that are
automatically linked to the selected content. To create a See Also Link, highlight the relevant section
of source data and click See Also Link under the Analyze tab. As with annotations, a See Also Link
can be created for any data that can be coded.

NVIVO 9: INTRODUCTION WORKSHOP
37
Exercise: By now you should have some familiarity with the program and
the help system. Using the help system, figure out how to create a See
Also Link between specific content (rather than the entire content) within
two sources in your project.
HYPERLINKING
If you want to connect your data to web-based sources, NVivo provides a hyperlinking function. To
add a hyperlink, you must first be in edit mode. Then, simply highlight the selected text, click
Hyperlink under the Analyze tab, and insert the URL. You can also hyperlink to a file path within
your computer. Note that hyperlinks can only be added to text sources.

NVIVO 9: INTRODUCTION WORKSHOP
38
OTHER AREAS OF INTEREST NOT COVERED IN THE WORKSHOP
As noted at the outset, this has been an introductory workshop to a very large program. Below are
some signposts to intermediate functions that you can explore after the workshop if you wish.
PREPARING SURVEY RESULTS AND OTHER DATASETS
You can import datasets including survey results and demographic information in much the way you
would import classification sheets. NVivo provides a number of avenues for analysing datasets. You
can filter, sort and auto-code dataset content (including analysis by demographic fields), code text
fields to nodes, and link these results to the rest of your project. While the workshop will not deal
directly with dataset creation or importation, it is worth knowing that this function exists if you are
working with datasets in your research.
Keep in mind that NVivo is not designed for sophisticated analysis of dataset results such as
regression testing, and you cannot produce tables or graphs from your dataset. You also cannot edit
your dataset once it has been imported into NVivo.
RELATIONSHIPS
You can define relationships linking different components of your project. This function is found
under Nodes and is a form of node coding. These can remind you and your project team that certain
participants know one another, are related, work together, and so on. They can also chart things like
birthplace, timelines within the research or regarding events discussed in the project, and
organizational relationships as well.
MODELS
You can create visual representations of various aspects of your project. These might include
relationships, coding structures, and many other dynamic aspects of your analysis. You can also
build static models from scratch using the relatively simple and user-friendly modelling tools. Once
you have made a model, you can export it for use in other programs.
While the models generated in NVivo can look like social networks, neither the relationship nodes
nor the modelling features are a substitute for Social Network Analysis (SNA) software.
NVIVO REPORTS AND METHODOLOGICAL TRANSPARENCY
NVivo offers Reports functions, which can create automatic outputs charting your coding activities,
node structure, classifications, and so on. These can be generated at the click of a button, or you
can specify parameters for your reports if you want to look at specific bits of work or the activity of
specific team members. For some (but not all) qualitative social scientists, it will be important to be
able to provide an account of how you did your analysis and arrived at your conclusions. Reports
can be helpful to this end. You can also review this by Bringer et al (2004), which is an early article
examination of the ways in which NVivo-based analysis can be articulated to others for transparency
purposes.

NVIVO 9: INTRODUCTION WORKSHOP
39
NOTES AND PARTICIPANT QUESTIONS