Embed Size (px)
Citation preview

© Research Support P/L November 2012
NVivo 10 Reference Guide
Pat Bazeley, Research Support P/L
www.researchsupport.com.au
These notes are designed as a reference manual to serve as a reminder for continuing work after
a training workshop. More extensive methodological explanation and advice, can be found in
Qualitative Data analysis with NVivo (Bazeley, 2007, London: Sage – note, new edition by
Bazeley & Jackson available from May 2013). Data preparation notes and other resources are
available from my web site.
Instructions (actions) are marked thus. Words in bold are from the screen dialogues.
Instructions are supplemented by: Tips, and ! Warnings.
Table of contents
Creating, naming, and storing projects ................................................................................... 1
Sources ................................................................................................................................... 3
A note on terminology ........................................................................................................ 3
Importing sources (internals) into NVivo .......................................................................... 3
Creating and using folders for internals ............................................................................. 4
Creating a new internal document or memo in NVivo ...................................................... 4
Viewing sources ................................................................................................................. 5
Viewing source properties .............................................................................................. 5
Deleting sources ................................................................................................................. 6
Creating and using sets for sources .................................................................................... 6
Memos, annotations and links ................................................................................................ 6
Annotating text ................................................................................................................... 6
Reflective memos ............................................................................................................... 6
See also links ...................................................................................................................... 7
Hyperlinks .......................................................................................................................... 7
Nodes ...................................................................................................................................... 8
Making nodes ..................................................................................................................... 8 Changing/deleting a node ............................................................................................... 9
Arranging nodes ................................................................................................................. 9 Creating and using sets for nodes ................................................................................. 10
Listing nodes .................................................................................................................... 10
Coding at existing nodes ...................................................................................................... 11
Removing coding ......................................................................................................... 11
Reviewing coding ............................................................................................................. 12
Exporting or printing node contents ................................................................................. 13
Auto coding text sources .................................................................................................. 13
Recording relationships .................................................................................................... 14
Classifications and attributes ................................................................................................ 15
Creating Classification Types and Case Nodes ................................................................ 15
© Research Support P/L November 2012
Creating attributes and attribute values ............................................................................ 16
Creating and entering attribute data by importing a table ................................................ 17
Using attribute data .......................................................................................................... 19
Working with datasets .......................................................................................................... 20
Using NVivo with EndNote ............................................................................................. 22
Downloading, importing and auto coding social media datasets ..................................... 22
Find ....................................................................................................................................... 23
Find toolbar ...................................................................................................................... 23
Advanced Find ................................................................................................................. 23
Queries ................................................................................................................................. 24
Group Query to find ‘items coding’ ................................................................................. 24
e.g., to identify nodes coding another node ...................................................................... 24
Coding queries .................................................................................................................. 24
Scoping a query ................................................................................................................ 25
Matrix coding queries ....................................................................................................... 26
Word frequency query ...................................................................................................... 29
Text search ....................................................................................................................... 30 Use Compound Query to combine text search with other queries ............................... 31
Framework analyses ......................................................................................................... 31
Visualising data .................................................................................................................... 31
Charts ............................................................................................................................... 32
Visual displays ................................................................................................................. 33
Models .............................................................................................................................. 34
Teamwork tools .................................................................................................................... 36
Defining User Profiles ...................................................................................................... 36
Importing a project ........................................................................................................... 36
Comparing coding ............................................................................................................ 36
Reporting .............................................................................................................................. 37
Reporting text – from List View options ......................................................................... 37
Reporting using predefined reports .................................................................................. 37
Viewing the report ........................................................................................................ 38 Customising a report .................................................................................................... 38
© Research Support P/L November, 2012 1
Creating, naming, and storing projects
Creating a new project
Creating a project in NVivo is as simple as clicking on New Project at the base of the Welcome
screen, and typing a Title for the project into the New Project dialogue. Add a Description if you
wish, to help identify this particular project.
If you need to set a password and/or access rights to the project, this is done once the project has
been created, by accessing File > Info > Project Properties. Unless you have a compelling
reason to do so (or a faultless memory), it is generally safer to not set a password for the project.
When you have created a project, it will be added to the My Recent Projects list on the
Welcome screen, and you will be able to reopen it with a single click on its name. If it is not
showing on the Welcome screen, click on Open Project and navigate to where it is stored.
Identifying the user
NVivo will assume that the user is the same as the person identified in Windows. If you need to
allow for multiple users accessing the same computer, then you can have NVivo ask for the user
to be identified each time it is opened:
From File > Options > General tab check/uncheck the box next to Prompt for user on
launch.
To change a user’s name or remove a user: Go to File > Info > Project Properties > Users.
Options sets preferences for the application (i.e., NVivo) as a whole (for application to the
next new and later projects, Project Properties sets preferences for just the current project.
Saving the project
You will be asked every 15 minutes whether you wish to save changes to your project. Click
Yes (or press Enter) to ensure your work is not lost.
This time lapse can be shortened or lengthened via File > Options > Notifications tab, but
be aware that the pop-up reminder does interrupt what you are doing, so more frequent is not
necessarily better, and less frequent carries obvious attendant risks regarding loss of work
should the power go off or the program close for some reason.
Projects are saved by default to your My Documents folder. To change the location, go to
File > Options > File Locations.
If your project is on a network drive, the intermediate saves, until you close the project, will
be into a Windows > Temp folder on your local drive.
! Do not work from a USB/flash drive, especially on a desktop computer – if the power goes
off suddenly, an open project may be corrupted. Always copy to the hard disk and work from
there.
Renaming a project
A project can be renamed by going to File > Info > Project Properties. To avoid confusion, you
should also change the file name (in Windows) to match the project name (you will then need to
use Open Project next time you want to access it). The project name is a registry entry
recognised by the software and which shows in the Welcome window and at the top of the
NVivo workspace; the file name is what you will see in Windows dialogues, as well as in the
Welcome screen.
! Do not change a project’s file name in Windows while the project is open.
© Research Support P/L November, 2012 2
Backing up
Backing up a project is most easily done in two ways:
(1) Using Windows, after the project is closed. Copy the project file, paste it into a specially
designated folder or onto an external drive, and date it.
(2) Within NVivo: Go to File > Manage > Copy Project and provide a new name. NVivo
will close the current project, create the new copy, and then reopen the current project (i.e.,
the one you already had open, not the new copy).
Use international date format for your dates (YYMMDD) because they sort correctly, with
the newest one always at the bottom of the list.
Always keep the last known good copy of a project, i.e., the second last backup, in case the
last one was corrupted. Therefore, do not rely on automatic (system) backups, as they
(usually) overwrite the previous file.
! Do not copy a project in Windows while the project is open in NVivo.
Deleting a project
Just in case you want to start over! Projects are deleted through the regular Windows file system
(Windows Explorer / My Documents / My Computer).
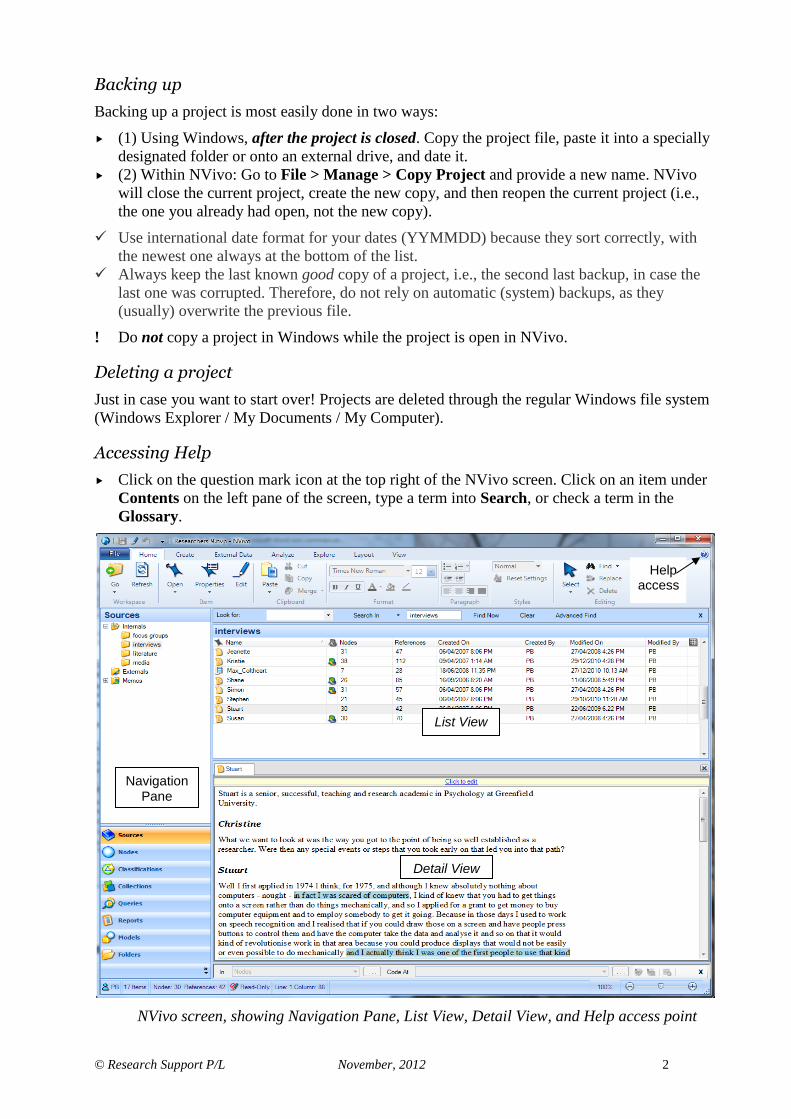
Accessing Help
Click on the question mark icon at the top right of the NVivo screen. Click on an item under
Contents on the left pane of the screen, type a term into Search, or check a term in the
Glossary.
NVivo screen, showing Navigation Pane, List View, Detail View, and Help access point
Navigation Pane
List View
Detail View
Help access

© Research Support P/L November, 2012 3
Sources
A note on terminology
A source is a data item imported or created in NVivo. These can be documents, audio files,
videos, images, datasets, web pages.
Sources can be given a Source Classification. Each classification type embraces attributes
(default or user defined). For sources, these usually relate specifically to the type of source, date
of collection, etc., rather than the particular characteristics of who or what provided the source.
In your project you will create Case nodes to ‘hold together’ all your source data about each unit
of analysis (e.g., participants) you will be using in your NVivo project. Cases can be of more
than one type. Typically these include People, but they might also represent Organisations, Sites,
Families, and so on. Because case data are stored in nodes, single or multiple sources or parts of
sources can be coded to them, either on import, or later (see below and especially under the
heading for Working with Classifications). In NVivo 10, sources can be assigned (coded) to
more than one type of case node, and consequently an interview with an employee might be
coded to a case node for that person (as one of multiple People), and to another case node for
their Workgroup, and also to a node for their Organisation. Each of these would be associated
with a different Node Classification with its own specific set of attributes (variable data). This
allows for analysis at multiple levels, e.g., where your project has embedded cases (e.g.,
school/class/pupil), or for multiple types of cases.
Case nodes can be created and sources can be coded to case nodes at any time after import,
as well as on import. Classifications can be assigned to case nodes (and the classification can
be changed) at any time during the project.
Importing sources (internals) into NVivo
Documents saved as Word files (document format, rich text format, or if you’re really desperate,
plain text format) are easily imported into NVivo. You can also import audio, video and image
files in various formats (see Help, or the options on the import screen, for a list of OK formats),
and you can import pdf files.
In the Navigation Pane for Sources, select the folder into which the source is to be imported.
In the List View, Right-click > Import > Import [source type]. An Import Internals
dialogue will open.
Click on Browse to navigate to locate the files you wish to import. Multiple sources (of the
same type and location) can be imported in one pass: simply use Shift-Click or Ctrl-Click to
select more than one when choosing sources for import.
You can choose to provide some additional information about what is to be done with those files
as they are imported, providing you have already set up a folder for case nodes and a way to
classify them:
Click on More>>
For text documents, you might indicate if the first paragraph of each source should be used to
Create descriptions for those sources.
If each source represents a single case (unit of analysis – represented in NVivo by a classified
case node) of a particular type, then choose to Code sources at new nodes located under >
Select [Folder] to indicate where they are to be located.
Tell NVivo which Classification applies to the new case nodes.

© Research Support P/L November, 2012 4
Additional options on import dialogue
If you are new to NVivo, and working in a new project, don’t worry about case nodes and
Classifications at this stage. (These are covered in detail below). You can sort that out later.
If heading/paragraph styles are important because you are planning to auto code a document,
check them in Word, using Outline View, before you import the document. It is much easier
to make corrections there than after you have auto coded in NVivo.
Check Help > embedding media, re options for storing video and audio files; also File
(menu) > Options to set limits on the size of embedded files.
Creating and using folders for internals
In the Navigation Pane for Sources, right-click on Internals to create and name a New
Folder. Drag documents from the List View to the appropriate folder.
Internals can be imported or created directly into a selected folder, once it has been created.
The most appropriate way to use folders is to sort different types of data.
Creating a new internal document or memo in NVivo
In the Navigation Pane for Sources, select the folder in which the document or memo is to be
created.
Right-click in the List View (in the white space). Select New Document or New Memo (as
appropriate).
A Properties dialogue will open. Type in a Name and Description for the document or
memo.
If you have set up source classifications, go to the Attribute Values tab to assign a source
classification and relevant attribute values (this is not the same as a node classification). The
new document will then open in Detail View, ready for you to edit.

© Research Support P/L November, 2012 5
Viewing sources
Viewing document text
Double-click on a document in List View for the text to be shown in the Detail View, below
or beside the list of documents. More than one document can be open at a time, but the text
of only one will be visible at any one time.
Select which open document is currently in view by clicking on its tab at the top of the Detail
View.
Close a document by clicking the (top right in Detail View).
If you do need to see the text of more than one at one time, undock the Detail View by
clicking on the check mark for View > Docked.
Playing audio/video files
Double click the file to open it in Detail View.
Click on Play/Pause in the Media ribbon that becomes available when you are viewing a
media file. You can also choose to pause, fast forward, rewind, etc. from the Playback
section of the Media ribbon.
Transcribing within NVivo:
Check Help > Search > (and type) Transcribe while playing, and Help > transcribing for
options on combining transcripts with audio/video files. Transcribing within NVivo allows
you to create time-stamped segments of text to match the wave file.
Viewing images
Double click the file to open it in Detail View. Options for working with pictures are mostly
in either the Picture ribbon that opens when you select an image, or the View ribbon, or on
the right-click menus. There is a zoom button at the bottom-right of the main NVivo window.
Adding text to the Picture Log:
Open the picture source. To add text to the Log (at the right of the picture) you will need to
change to Edit mode: click on Click to Edit, located at the top of the Detail View.
Select a region of the picture, Right-click > Insert Row. NVivo will record the reference for
the region, and you can record its content.
Images can be shown as thumbnails in List View (if you want to restrict which pictures are
included, make a set of them and the view thumbnails in the set, see Help > picture gallery):
Click in the List View (to make it active).
From the View ribbon, select the List View group, and then an option for detail (the default
view) or thumbnail (small, medium or large).
Viewing source properties
Right-click on a particular source to view its Properties, OR select and key Ctrl+Shift+P.
You can change the name of a source or add a description for the source in this dialogue.

© Research Support P/L November, 2012 6
Deleting sources
Select the source(s) in List View.
Right-click > Delete.
Deleting a source will delete all coding for that source, but not the nodes that were created to
hold that coding.
Creating and using sets for sources
These give you another way of ‘cutting’ your data; they are used primarily for scoping
(restricting) queries, or for comparisons using queries, later in your analyses.
In a List View for sources, select one or more items (or a folder of items), then Right-click >
Create as > Create as Set. Name the new set.
If the set already exists and you wish to add to it, select one or more items (or a folder of
items) from a List View of sources, then Right-click > Add to Set.
To view the set, choose to show Collections in the Navigation Pane. Expand + Sets in the
Navigation Pane. Members of a selected set will show in List View as aliases for the items.
Modifying a set: deleting an item from a set will not delete the item, just the shortcut to it. If
you open an item from a set and modify it, however, you are modifying the actual item.
Items can be members in more than one set.
Sets can also be created using Find options (see below).
Memos, annotations and links
Annotating text
Select the passage to be annotated (usually short).
Select Analyze ribbon > New Annotation (or right-click your way through the Links
options). A space for typing into will open at the base of the Detail View.
Type your annotation. When you click elsewhere, you will see the text that was selected will
now have a blue highlight behind it to mark the presence of an annotation
You can choose to have annotations in view, or not, by checking Annotations in the
View ribbon. Click anywhere in the blue highlighted text, and double-click the matching
comment.
Annotations are always visible with the text in both source or nodes. They are best used to
explain something that might be unclear or need expansion in the text.
Reflective memos
– for longer, more reflective comments than annotations.
Creating a project journal
In the Navigation Pane for Sources, select the memos folder (or a subfolder).
In the List View (in the white space), Right-click > New Memo.
Name the new memo.
Put an underscore at the beginning of the name for project journal/s, so they always appear at
the top of the list of memos for easy access, or alternatively, create and use a separate folder
for project-wide memos.

© Research Support P/L November, 2012 7
Creating a linked memo for a source (or node)
Select the source or node in List View. Right-click > Memo Link > Link to New Memo.
OR:
From the text of the source, Right-click > Links > Memo Link > Link to New Memo.
Name the new memo (usually using the same name as the source or node).
An icon will show next to the source or node in List View to indicate a memo exists.
To re-open the linked memo:
Select the source or node in List or Detail View, and key Ctrl+Shift+M, or access via the
right-mouse menu.
Adding to the project journal or a memo
Add text, coding, see also links, etc. to the memo when you create it, and at any time later.
To add text to an existing memo, you will need to Click to Edit, at the top of the Detail
View, or on the pencil icon in the quick access toolbar or Home ribbon.
See also links
See Also Link to a selected extract
Highlight and copy the extract to be linked (e.g., video segment, text passage).
Go to where you want the link to be accessed from, select an ‘anchor’ (e.g., a brief text
passage in a memo or another document), right-click and Paste as See Also Link. The
anchoring text will be highlighted in pink to indicate the presence of a linked extract.
See also link to a whole project item
Right-click >Links > See Also Link > New See Also Link from selected text in source or
node; or from the Analyze ribbon > New See Also Link and then select the project item to
be linked. The anchoring text will be highlighted in pink to indicate the presence of a linked
item.
Viewing see also links
Show and access See Also Links from below the text in any source or node by checking next
to View > See Also Links and then double-clicking the desired link. Links to extracts will be
shown in their original context.
Hyperlinks
Links from points within text sources or memos to non-project on-line items or websites.
Right-click > Links > Hyperlink > New Hyperlink from selected text in editable source.
The hyperlink will show as blue underlined text.
Ctrl + click on the hyperlink to access the linked item.

© Research Support P/L November, 2012 8
Nodes
Making nodes Nodes are containers for references (passages) from sources. There are multiple ways of making
nodes, either as you are working through the text or when you are just thinking about the
categories you might need.
Making nodes without coding
In the Navigation Pane, select Nodes.
In the white space below the List View of nodes: Right-click > New Node
Provide a name for the new node (and a description if you want).
If you have an existing node selected when you choose to create a New Node, the new node
will be placed as a subnode (child) of the selected node.
! You then need to code selected text to the new node.
Creating a node and coding selected text at the same time
To create and code at new nodes, select the Nodes tab in the Navigation Pane for your project;
then, with a document or memo open in the Detail View, choose from one of the following
methods:
For creating and coding at nodes at the top level (i.e., directly into Nodes, not in a folder or tree
under Nodes):
Select text, Right-click > Code Selection > At New Node to open a new node dialogue.
Type a name and press Enter. This will code the selected text as well as creating the node.
OR Select text and press Ctrl+F3 on your keyboard, to open a new node dialogue. Type a name
and press Enter. This will code selected text as well as creating the node.
OR Select text, click in the Code At slot in the coding toolbar at the base of the source (or
overtype the highlighted name already there), type a name and click the Code icon.
Creating ‘child’ nodes:
Select text, then Right-click > Code Selection > at New Node (or use Ctrl+F3). In the New
Node dialogue, go to Location > Select, then (in the next dialogue) select the parent for the
new node, type in a name and maybe a description, then OK. This method codes the text as
the node is created.
OR

© Research Support P/L November, 2012 9
Select an existing node and right-click to create a New Node. The new node will be placed as
a subnode (child) of the selected node. You will then have to code selected text to the new
node.
Changing/deleting a node
If you want to change a node title, select the node in List View, Right-click > Node
Properties (or key Ctrl+Shift+P) – or, simply click on its name a second time to change its
name to edit mode.
Selected nodes can be deleted using either Right-click > Delete, or the Delete key on your
keyboard. When you delete a node, all coding for that node is removed.
Arranging nodes
These instructions relate primarily to nodes used for coding thematic type content of sources.
Additional instructions specifically related to case nodes will be found further below.
Creating a structure for nodes
Nodes can be arranged in hierarchical ‘trees’. They are best arranged as in a classification system
(taxonomy), with any one node appearing in one tree only – a tree for all nodes of that kind (e.g.,
making separate trees for actions, events, people, emotions, values, issues, etc.).
If a suitable node doesn’t already exist, create a new top-level (parent) node.
The top level node describes the general category of items to go in that tree, and is very
likely to not have any coding in it.
Parent nodes are not always at the top level, i.e., you might also want to define an
intermediate level.
If you are unsure about how to arrange your nodes, try importing them all into a model, and
push them around the screen to create groups. Label the groups using shapes (make these
labels into parent nodes).
Moving nodes into or across trees
In List View select one node, or more than one using either Shift+Click or Ctrl+Click.
Hover over a selected node, then drag the selected node/s to a parent node.
OR Right-click > Cut the selected nodes; select the appropriate parent node for the nodes you are
moving; and Right-click > Paste. (Generally use Cut rather than Copy if you are moving it
so you don’t end up with two copies.)
Dragging or Paste will place the node under the node you drag to or paste at (so you are
giving it a new parent).
If you are having trouble dragging a node from one tree to another (dragging just seems to
select everything in between), make sure you first select the node, then click on it again to
drag it.
A node can be pasted once only after cutting, or multiple times after copying. If a node needs
to go into more than one tree (e.g., because it involved more than one concept), use Copy
rather than Cut, then return to delete the original. Rename the node appropriately in each new
location (nodes with the same name should not need to be in more than one tree).
To place a node at top level, drag to or paste to Nodes in the Navigation Pane.

© Research Support P/L November, 2012 10
Merging nodes
If you have two nodes which are about the same thing, then Copy the first one (or Cut if you
are sure you want to entirely remove the first node), select the second one, and Merge Into
Selected Node. This will place all the text references from the first (source) node into the
second (target) node. Note the range of options for merging nodes and trees of nodes.
Amend the node’s description to indicate what has been merged.
! When you merge a node with a memo with another node, if you don’t select to merge the
memo then the memo is lost, i.e., if you merge it, it will be added to the target node’s memo.
If you choose to maintain the linked memo as a separate item you need first to delete the link
with the node (Navigation Pane > Collections > Memo Links).
Aggregating nodes
Coding at nodes can be automatically aggregated at (copied to) their immediate parent node.
In the Properties dialogue for the parent node, check against Aggregate.
Aggregation for a particular node can be turned on or off at any time.
Creating and using sets for nodes
In List View for nodes, select one or more items (or a folder of items), hover over a selected
item, then Right-click > Create as > Create as Set. Name the new set.
If the set already exists and you wish to add to it, select one or more items (or a folder of
items) from a List View of nodes, then Right-click > Add to Set.
To view the set, choose to show Collections in the Navigation Pane. Expand + Sets.
Members of a selected set will show in List View as aliases.
Modifying a set: deleting an item from a set will not delete the item, just the shortcut to it. If
you open an item from a set and modify it, however, you are modifying the actual item.
Because sets hold aliases only, if you update nodes in a set, the set will be updated.
Sets can be created also from items gathered using the Find Options – see below.
Listing nodes
The information displayed in the List View can be customised to suit your needs.
Click in the List View (to make it active).
Go to View > List View > Customize. Use the arrows in the dialogue to choose which fields
are shown. Adjust the column markers to suit your needs (I usually maximise the column for
descriptions).
To obtain a simple list of nodes:
From the display of nodes in List View, Right-click > Export > Export List. Select the
format you want for your list (Excel, Word, or pdf) (or Right-click to directly Print List).
To see the full list of tree nodes when you export, you will need to expand all trees in your
list: Right-click > Expand/Collapse > Expand All Nodes or Expand Selected Nodes.
If you want to print/save just a list, or a list with descriptions, first turn off most of the added
detail, such as dates and creators (use View > List View > Customize).
Printing rather than exporting will preserve the appearance of the screen display, but you
may have to ‘fiddle’ with the position of columns to avoid the width being spread across two
pages.

© Research Support P/L November, 2012 11
To obtain a report listing your nodes with a summary of the extent to which each has been used:
In the Navigation Pane select Reports > Node Summary Report and select which nodes
you want to include in the report.
Open the report in Designer to modify its contents, e.g., to add in the Description field.
In the Detail View, Right-click > Export or Print as required.
Coding at existing nodes
Rearrange the screen for drag-and-drop coding: View > Detail View > Right, then move the
pane divider further left.
With nodes expanded and showing in the List View, and the text you are coding (either
document or node) in the Detail View, drag selected text to a node.
OR Highlight a passage (in Detail View), then select a node (or nodes) for coding using Ctrl+F2
or Right-click > Code Selection > at Existing Nodes.
OR Highlight a passage, select a recently used node in the coding toolbar, and press Enter or
click the tick.
If Click to edit is not showing at the top of the Detail View, then go to Home > Edit or click
on the pencil icon in the quick access toolbar at the top of the screen. This will ensure the
document cannot be edited (so text cannot be moved accidentally as you are dragging).
Turn on the coding density bar or recently used nodes (View > Coding Stripes). Hover
over the coding density bar see what coding has been added for the adjacent passage.
Nodes in List View can be reviewed while you are thinking about which to use for coding:
double-click on the node you’re thinking about, review its text, then close it to return to the
source text. Alternatively, open its Properties (right-click or Ctrl+Shift+P) and check (or
add to) its description.
You can code at multiple nodes at once using Ctrl+F2 or the right-click options to make your
selection and code.
The right-click menu and coding toolbar options are available whether or not you have nodes
showing in the List View.
Code the same passage of text to multiple nodes, each to pick up on one particular aspect of
what is going on. (Queries will be used to find the associations between these nodes, e.g.,
between a person and an action, or an event or issue and an emotion or other response, or an
action or strategy and its impact.)
Removing coding
Uncode (remove coding from) a selected passage either by immediately clicking Edit >
Undo or by choosing to Uncode at the current node showing in the Coding toolbar, or
using Right-click > Uncode Selection > at Existing Nodes (then selecting the nodes).
Current node(s) are those currently showing in the Coding toolbar.
If you want to remove coding while viewing in a node, select the text, Right-click > Uncode
Selection > Uncode Selection at This Node
Coding media files
Coding pictures:
Drag to select a region for coding.
Code by dragging to a node or right-click to choose to code to a new or existing nodes.

© Research Support P/L November, 2012 12
The matching row in the Log needs to be separately coded. Coding a row of the log does not
automatically include the corresponding image. Select and drag a whole row (select the
number) or drag selected text to the node.
If it appears that coding stripes are not registering, check whether your display is set to Image
or Log using the tabs at the base of the coding stripes area.
Coding video/audio:
Select for coding by simply dragging over the required section of the voice timeline. or Use
the Media ribbon > Start Selection or Right-click to mark the start of a selection on the
timeline. Use Finish Selection to complete the selection.
Code by dragging to a node or right-click to choose to code to a new or existing nodes.
You can select and code only one section at a time.
The transcript content needs to be separately coded. Coding stripes are shown separately for
voice timeline and transcript content.
Reviewing coding
Select a node in List View and double-click to open it. Text coded from all sources will be
displayed in Detail View.
Check the context of a passage (e.g., the surrounding paragraph) by clicking in it, then Right-
click > Coding Context > Broad
OR View the passage highlighted within the source document: Right-click > Open Referenced
Source.
To spread the coding of a passage to the context for that passage, choose Right-click >
Spread Coding > Broad Context (or to whatever level is wanted), or, select the required
additional text while it is in view and code that.
Narrow and broad context can be defined in File > Options.
View what other coding is on a passage using the Coding Density Bar or coding stripes.
Right-click on the coding density bar to show a particular stripe; there are further options
(including Uncode) from each stripe.
Alternatively, View > Coding stripes > Selected Items and select particular stripes to show
across the display in Detail View, such as nodes in a particular tree or set. (Check
Automatically select hierarchy to choose a whole tree by selecting the parent.) Stripes
shown will be for those nodes that intersect with the text of the node on display.
Access the node properties (Ctrl+Shift+P) to record a description for the node.
Create a linked memo for the node (Ctrl+Shift+K) to record more reflective or analytic
comments. View the linked memo at any time using Ctrl+Shift+M.
Always reference the source for an idea recorded in the node memo and/or use a See also
link to link the actual passage that was coded to what you have written in the memo.
Coding on
Recode or code on from a node as you would from a document.
If you want to change the coding on text, recode first, then Right-click > Uncode Selection
> At This Node. (Current node refers to the node currently showing in the Coding toolbar.)

© Research Support P/L November, 2012 13
Exporting or printing node contents
Highlight the particular node/s you want to export or print in List View.
To export:
Right-click > Export > Export Node, and then check the Export/Print Options. To export or
print text in document format, choose to Export > Reference View. For files that may
contain multimedia segments, choose to Export > Entire Content – this will save as html.
To print:
Right-click > Print > Print Node, and then select your Export Options. To print text, choose
to Print > Reference View.
To print a node (or document) with coding stripes, you need to have the text open in Detail
View with stripes showing, then, in Detail View, Right-click > Print > Reference View, and
select the options you want.
Auto coding text sources
Help topic: Coding > Automatic coding techniques
Sources for auto coding need to be specially prepared using Word’s heading styles to indicate
the passages to be coded. All passages to be coded at the same level should be given the
same Style.
In List View for your Internals (or a sub-folder), select the source or sources you wish to
auto code (if more than one, these should be of the same type). If you are auto coding surveys
or questionnaires, then do the whole set at once. If you are auto coding focus group
transcripts, it might be safer to do them one at a time, and essential if your method of
identifying different people is repeated across groups.
Choose to Analyze > Auto Code, or Right-click > Auto Code. Choose the Paragraph
Style identifying the text you wish to code and click it across to the right box,
Choose where you want the resulting nodes to be located. You will need to nominate a folder
or create a parent node to ‘foster’ the new nodes if you don’t have one already.
For survey questions, you may to want to code for multiple levels of heading at the same
time to produce a node structure which replicates the structure of the survey.

© Research Support P/L November, 2012 14
For focus groups, you are most likely to want to code for particular levels of heading in
separate passes, e.g., to separate topics (at, say, Heading 1 level), from participants (at
Heading 2 level). All headings of the same type should have the same style.
If auto coding produces a node which contains headings only (when there is another heading
immediately under and you have used multiple headings), and you wish to see the text of all
the next level of subsections, then Right-click > Properties > Aggregate.
If the nodes are out of order in the display click on Layout > Sort by custom. They will sort
into the order in which they were created (but so will everything else, so an alternative
solution is to name them consecutively, especially as the display reverts to name order each
time you open the project).
If you mess up, simply Undo, or delete the nodes you have created and start again!
! The downside of NVivo’s use of paragraph rather than heading styles is that you may need a
blank heading for say, H2, before any H1, if you are auto coding for H2 because the last H2
in a section will include any H1 that comes before the next H2 (test this for one or two
documents before setting up for all of them).
Recording relationships
Set up the relationship type
From within the Classifications area in the Navigation Pane, select Relationship Types. In
the List View, Right-click > New Relationship Type or use Create > Relationship.
Provide a Name for the relationship type you are creating (e.g. encourages, works with, talks
to, impacts on). Enter a Description if needed.
Select the Direction for this type of relationship, using the drop-down options. Click OK.
Recording a relationship
Move to the Nodes area, and select Relationships in the Navigation Pane.
Right-click in the List Area to create a New Relationship. Make the necessary selections for
the source (From) and target (To) of the relationship, and the type (Name). The new
relationship node will appear in List View.
To make it easier to see the relationship nodes in List View, click to make List View active,
then View > List View > Customise, and remove as many unnecessary fields as you can
from the display.
It may be advisable to use case nodes rather than documents (where appropriate) to represent
research participants as part of a relationship (benefit of showing groups in models).
You can edit the components of a relationship: Right-click on the relationship >
Relationship Properties.
If you need to include a non-project item in a relationship (e.g. Ange collaborates with
Professor X in the US, where Professor X is not represented in this project by either a
document or case node) then create an external source or a case node to represent the
associated item (Prof. X, in this example).
Viewing and coding to relationship nodes
Select the Relationships folder under Nodes to see the nodes in List View. A relationship
node can be coded and viewed like any other node.
Relationships on a particular source or node can be viewed in the Detail View for that item:
Check View > Relationships to have them listed at the base of the screen.
Code by dragging from text in the Detail View to a node listed in List View or under the
Relationships tab in Detail View (which avoids having to change the List View folder).

© Research Support P/L November, 2012 15
Classifications and attributes
Attributes in NVivo are most commonly attached to case nodes, although they can also be
attached to sources. see Notes on Terminology, above.
Creating Classification Types and Case Nodes
Preparation – creating classification types:
Decide what types of cases you are dealing with, e.g., People, Sites, Organisations, etc. You
will probably create a separate classification for each type.
Create a folder under Nodes for Cases in the Navigation Pane.
If you have more than one case type, in your Cases folder, create top-level nodes in List View
to ‘parent’ each type of case – or create a separate folder (in Navigation View) for each type.
If your case nodes comprise single sources:
Create and code to case nodes as you import the sources (More>> in the Import New Source
dialogue) as shown earlier;
OR, if you didn’t do so:
Select the sources to go into the case nodes in the List View, Right-click > Create As >
Create as Case Nodes, then indicate where they are to go.
Even if you are working with single document cases at a single level (e.g., one interview for
each participant, with participants being cases, all of the same type) you are still advised to
make a node for each source as attributes attached to sources do not have the same
functionality as attributes attached to nodes.
If your cases involve multiple whole documents:
Select all the sources to go into a single case node in the List View, right-click, and choose
Code sources > Code Sources at New [or Existing] Node. Select the location for your
cases, and then name the new node.
If you have Classifications set up, you can assign that at the same time.
If several cases are combined within a source document (e.g., from a focus group):
Prepare the document by using consistently applied heading (paragraph) styles to identify
each case (see data preparation notes on my web site).
Auto code the document (see Auto coding sources, above). You can send the new nodes to a
new or existing folder, or place them under a new or existing ‘foster’ parent in a folder.
When you have multiple case types
There are three alternatives for how to set these up (given in order of preference):
The preferred alternative (because it is easier to select nodes with a similar classification
for queries and for reading results from matrix queries) is to simply make separate groups
(trees or folders) for each type of case node, e.g., separately for companies, departments and
individuals.
OR
Create case nodes for individuals only (the smallest unit of analysis) and use attributes to
record company and department.
OR
If your cases are embedded, e.g., individuals within a department within an organisation (or
pupils in a class within a school), then one way of setting them up is to have parent nodes for

© Research Support P/L November, 2012 16
each level, organised hierarchically, so that the case nodes can be aggregated to ensure
coding at the higher levels, thus:
Company A (aggregate – this will gather the dept nodes immediately below it)
HR dept (aggregate – this will gather all the individual cases within the dept)
Fred
Jim
Mary etc.
Sales dept (aggregate)
Peter
Stephanie
Margaret etc
Company B (aggregate)
HR dept (aggregate)
Stuart
Omar
Jing etc
Sales dept (aggregate)
Pierre
Taylor
Calvin etc
Company C – etc.
! Whichever way you do it, check that NVivo is counting cases in the way you were expecting
when you run a query (e.g., a matrix coding query).
Setting up and assigning Classifications to cases
Go to Classifications in the Navigation Pane.
Select Node Classifications.
In List View, Right-click > New Classification. Choose whether you want to Create a new
classification or Add one or more predefined classifications to the project.
Repeat as often as required, e.g., For the first and third options in the example above, i.e.,
regardless of whether you worked with embedded or parallel cases, you would create a New
(Node) Classification for each of Companies, Departments, and People (or Individuals),
especially given that different attributes will apply at the different levels.
If you add a predefined classification, NVivo automatically assumes you will want to assign
particular attributes for items that are given that classification. (You can delete from it those
attributes and/or values that are not wanted and add others in the Classifications List View.)
Classifications can be set up and attributes assigned ‘automatically’ by importing data from a
spreadsheet (see below).
To assign classifications to sources or case nodes:
Select the source(s) or case node(s) in List View, Right-click > Classification > [select].
Creating attributes and attribute values
Move to the Classifications view, Right-click on the Classification for which you wish to
define attributes > New Attribute. Provide a name for the attribute.
Indicate a Type for the values of the attribute. Most attributes will be String, as that is any
combination of letters and numbers. Date values are in the form of DD/MM/YYYY (or your
local format), so if you are wanting to record years only, then use Number.
Click on the Values tab. Click Add, and enter the first of the values you will be using for
your attribute. Repeat this process for each value to be added. Use Remove if you make an

© Research Support P/L November, 2012 17
error (or later, if you find you don’t need this value). For some attributes you may not know
ahead what kinds of values you will encounter—simply leave these ones without pre-set
values for the time being.
Repeat the process of making a new attribute and entering values for each attribute you want
to record. If you find you want to add another later, that is not a problem—you can come
back to this screen at any time, or you can create new values as you are entering values for
each case node.
While age might be recorded as a number, age expressed in ranges (e.g. 0-4, 5-9, etc.)
becomes a string attribute. The same applies to years of service or any similar variable.
The most common error people make when they are creating attributes is that they use what
should be a value label to name the attribute as a whole, e.g. they call the attribute Male,
instead of Sex or Gender. Then they are limited to using yes/no values, and their use of the
attribute for comparisons becomes very clumsy.
Attributes can take only one value for a particular case node. If a case node fits two
categories (e.g. Fred has two different jobs) then you will have to either: (a) record the most
relevant or important value for that person and ignore the secondary one, (b) created a
combined category—but only do this if there are likely to be others with the same
combination, or (c) create an additional attribute (e.g. Job 2) to record the second value (and
again, only do this if there are sufficient with a second job to warrant it).
Entering values on each attribute for sources or case nodes
Open a source or node classification sheet: Explore > Source/Node Classification Sheet >
[named sheet]. The classification sheet will open in Detail View, with any sources/case
nodes to which you have assigned that classification listed as rows, and the attributes you
have created as columns. Currently the values will all be listed as Unassigned (unless you
changed the default value).
Click in a cell, and select an appropriate value from the drop-down list for that cell, or
double-click on the text in the cell and overtype (NVivo will auto-fill for unique starting
letters).
If you wish to create a new value ‘on the run’, double-click in the cell and then overtype the
current entry with your new value. The new value will be added to the list and made
available for further sources or case nodes.
If you find you need to change or add an attribute, return to Classifications to do this.
If you are entering the data as you work through coding a document, keep the classification
sheet open in the background and, when you are ready to enter a value, simply click across to
it (using the tabs in Detail View), then click back again to your document.
A value can be copied and then pasted to multiple cells (use shift-click or ctrl-click to select
them).
Rows in the classification sheet cannot be deleted. You need to go to the corresponding
source/case node, Right-click > Classification > No Classification (or delete the
source/case node if it is no longer needed).
Creating and entering attribute data by importing a table
Create the table
In a new Excel (or other) spreadsheet:
(a) list your source or case node names in the first column, exactly as they appear in NVivo;
(b) list your attribute names across in the first row of the table,

© Research Support P/L November, 2012 18
(c) put the name of the Classification into the first cell (cell A1, especially if you want to
import directly from the sheet in Excel format).
Hierarchical names are used where the sources or case nodes having the same classification
type are in multiple locations. They include folder names as well as hierarchical node names,
thus Nodes\\Participants\\Group 1\Mary (there is another alternative – see below, importing
the table).
If you are working with Name format only (rather than Hierarchical), make sure all your
sources or case nodes have unique names.
Make sure there is no other stray information on the sheet (or on other sheets in the
workbook), such as coding guides etc.
If you are having difficulty getting the names typed correctly, then create at least one
attribute (no values need be entered), then open the classification sheet in Detail View,
Right-click > Export Classification Sheet; open the file in Excel, and the table will open
ready for you to type in additional attributes and values.
! If your names include commas, apostrophes etc, then they will be exported with quotation
marks around them, and NVivo will not recognize them when you go to re-import. Open the
file in Word or Notepad, and use Replace to remove the quotation marks (replace with
nothing).
If you have existing attributes (and values) for that classification, make sure they and the
labels in the sheet match exactly.
While SPSS and other statistical packages prefer you to use numeric codes for values (e.g. 1
for male), in NVivo it is better to enter non-numeric data as strings, using text labels (male),
as these make more sense when you are reading output from the data.
Leave empty cells blank. These will become ‘unassigned’ in NVivo.
Excel has a habit of converting low number ranges (e.g. 1-3) into dates, so it is safer to write
them as, say, 1 to 3, or to put a word after the range (e.g., years).
Save the table in Excel format (*.xlsx). Close the file.
To export from SPSS, first save your file as an Excel 97 or later spreadsheet, and check
write variable names to the spreadsheet and use value labels where defined. Delete
unnecessary variables by unchecking them in the SPSS Save As dialogue, or by deleting
columns from the Excel table (think about which you will actually find useful in connection
with your qualitative data and avoid ‘cluttering’ with the rest).
If the table ends in empty cells (i.e., at the bottom right of the table) it will fail to import (you
will get a message saying the table cannot be correctly parsed). Rearrange the rows in order
to ensure the last row is complete. (Order doesn’t matter for importing.)
Import the table into NVivo
To open the Import Classifications Wizard, go to External Data > Classification Sheets or
right-click in the Classifications List View, and work your way through the options.
Step 1 – Use Browse to find the Excel file > Open > Next..
Step 2 – Choose the correct Classification type (Node Classification). Normally, you would
tick all three options at this step (Unassigned is considered an existing attribute value, so
needs to be Replaced on any existing classification sheets).
Step 3 – Indicate whether you have used Names or Hierarchical names in the spreadsheet
file. Specify the parent or folder to indicate the location for names (not needed for
hierarchical names).
! Beware of Create new nodes/sources if they do not exist (especially if you are importing
multiple times for nodes or sources in different locations). NVivo will create a new node or
© Research Support P/L November, 2012 19
source for every name listed in the file that does not already exist in the specified location.
As a general rule, I uncheck this option.
Step 4 – Attribute Value Format is relevant primarily for those using non-English
languages (see File > Info > Project properties > Labels). Check Date, Times and Numbers,
if needed.
Finish! The Classification sheet will open (or update, if already open) in Detail View.
If you have nodes or sources in several locations for which you are importing the same type
of classification, you will need to use hierarchical names to import them all at once.
Alternatively, because names are much easier to work with than hierarchical names, it may
be easier to simply re-import the sheet as many times as necessary (being careful to specify
the correct ‘parent’ each time) to catch all the different locations (make sure Create new
nodes if they do not exist, on Step 3, is not checked if you use this method).
NVivo will automatically recognize the best format for imported attributes, e.g. if all the
values in a particular column are numeric, then NVivo will designate that attribute to be a
number.
If your data fails to import: (a) recheck through all the options; and (b) note, from the
classification sheet, whether any of the new attributes were set up on your previous attempt,
and if so, where the import appears to have stopped. This can provide a guide to where a
problem may be in your original table.
If a source or node name is not recognised in the table, the table will import, but will leave
values unassigned for that row. (Watch out for stray spaces in names.)
Node/Source information in the table can be in a different order from the names in NVivo.
NVivo creates attribute values in the order in which it finds them in the table. To sort the
order of attribute values (which impacts on presentation of query results) for a string
attribute: navigate to Classifications > Attributes, double-click an attribute to open its
Properties, and use the Sort button on the Values tab. (Numbers etc will sort automatically.)
Using attribute data
Making a report of attribute data
It is important to know how many sources/case nodes you have with any given value for
evaluating results in Queries, especially for evaluating comparative tables generated with a
matrix query.
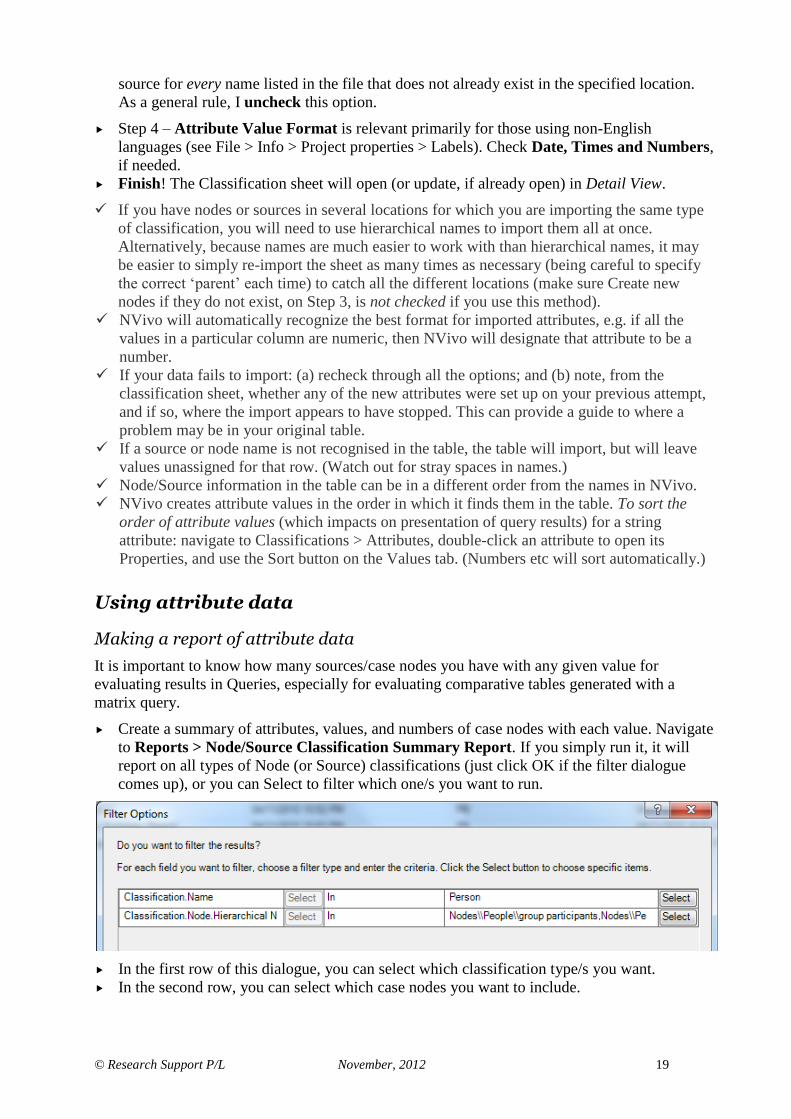
Create a summary of attributes, values, and numbers of case nodes with each value. Navigate
to Reports > Node/Source Classification Summary Report. If you simply run it, it will
report on all types of Node (or Source) classifications (just click OK if the filter dialogue
comes up), or you can Select to filter which one/s you want to run.
In the first row of this dialogue, you can select which classification type/s you want.
In the second row, you can select which case nodes you want to include.

© Research Support P/L November, 2012 20
Using attribute values in queries
Use attribute values in a matrix coding query to compare responses/experiences of sub-
groups across a number of coding categories (see p. 25f).
Create a set of cases with the same attribute value, using Advanced Find, for scoping a query
(see, p. 22f)
Working with datasets
Importing a dataset (e.g., from an Excel spreadsheet)
Right-click in the List View to choose to Import Internals > Import Dataset.
Work your way through the Dataset Wizard, until you reach Step 4.
At Step 4, you will need to check that NVivo has correctly read the type of data for each field
in your dataset. Because NVivo scans only the first 25 rows to determine the type of data in a
column, the type will sometimes need to be corrected. e.g., I had to change ‘ARecognition’
(below) to a decimal with 2 decimal places, and ‘activity’ had been read as a classifying
rather than a codable field, so each of these were amended. In the figure, the tick was
removed from the Import Field checkbox for Aapproachability and approachable.
! You cannot add further data to a dataset after import, but you can add further data to the case
nodes you make from it.
The first column of the dataset (which usually contains your ID information for each row)
should be treated as a classifying field. NVivo adds its own identifier (sequential numbers)
for each row of the dataset, but you will still be able to auto code on the basis of your IDs.

© Research Support P/L November, 2012 21
Viewing and coding dataset entries
Database entries can be viewed in either table or form views.
Double-click the database in List View to open it in Detail View.
Use the tabs at the right side of the Detail View display the information in Table or Form
views.
Data in codable fields can be coded. (Data in classification fields will become attributes.)
You may find coding is easier to manage when the data has been auto coded, by coding from
the Detail View in case nodes or question nodes.
Auto coding dataset rows to case nodes
Right-click on the dataset in List View; choose to Auto Code. This will open the auto code
dataset wizard. Work your way through the wizard. e.g., to code rows into case nodes:
Step 1: Select to Code at nodes for each value in a column (i.e., code rows; the diagram
will help you interpret).
Step 2: Use the drop-down arrow to Choose the column that contains the node names (this
is usually the first column in the dataset). These will be used to name your cases.
Step 3: Make sure your columns with codable text are under Selected columns.
Step 4: Choose to locate the new case nodes under a new or existing parent node or in a new
or existing folder. OR: If your case nodes already exist, and the names match exactly those
that will be created from the survey, then select the existing location (i.e., where the case
nodes currently reside) as the location for coding the new content. The content will be added
to the existing nodes. Finish.
Setting nodes up in a hierarchy through this wizard is generally not advised. (see Help >
Datasets > Approaches to analysing datasets.)
Auto coding dataset columns to nodes
This process uses the same auto code wizard, and so is very similar.
Step 1: Select Code at nodes for selected columns.
Step 2: NVivo (usually) will automatically select all codable fields. Check they are all there.
Step 3: Modify the location for your new nodes, if desired.
Classifying nodes and creating attributes from a dataset
Help topic: Using the Classify Nodes from Dataset Wizard
! The wizard to assign attributes from the dataset will do so only for an existing classification.
If a new one is wanted, it needs to be created before using this wizard.
To create a new classification: Classifications view > Node Classifications > Right-click in
List View > New Classification. You do not need to pre-create the attributes for it.
Select the dataset in the List View for Sources. Go to Analyze > Classify Nodes from
Dataset.
Work your way through the wizard:
Step 2: If you have already created the nodes using the auto coding wizard, remove the tick
from Create nodes if they do not exist in this location. If you have not already created
the nodes, you can do so via this wizard, and assign attribute values to them, but they will not
have data coded to them.
Check Update the classification of existing nodes.
Step 4: From the Available columns, select the ones you want to included (ignoring the one
with case names).

© Research Support P/L November, 2012 22
If you have attributes with integer or decimal values, you may choose to Group the values of
those attributes as they are set up. This will make them more useful for matrix queries.
Using NVivo with EndNote
Very briefly:
Save an EndNote dataset
Select references to import in your EndNote database (use Ctrl-click to select multiple
references). If you want to import the full articles as well, make sure they are attached to the
EndNote records.
Go to File > Export and choose to Export Selected References. Check the Output Style
and also the Save as Type (choose XML). Provide name and location for the file.
Import the EndNote files (including attachments) into NVivo
On the External Data ribbon, select Bibliographical Data. The Import dialogue will open.
Change the default for Name sources by… to Author and Year.
Keep the Assign sources to…A single classification (otherwise you will create an
unworkable set of classification sheets!).
Note where NVivo is going to locate the files. Usually you can go with the default options
for the Import new section.
Help topic: Exchange data between NVivo and reference management tools
NVivo can also import from Zotero and RefWorks (see Help).
If you don’t have either notes or original articles that can be coded, there’s not a lot of point
in importing data for those articles.
Downloading, importing and auto coding social media datasets
These notes assume you have installed NCapture, an add on module that accompanies NVivo.
Using NCapture, you can download web pages and also data from social media sites:
Facebook: wallposts for a User, Page or Group.
LinkedIn: discussions and comments from Groups that you belong to.
Twitter: tweets that are public or from people who have granted you access to their private
tweets.
You first capture the web page or discussion from the internet and save them as a source file in a
folder in your regular Windows filing system. Then can you import the file into NVivo, where
the web page is saved as a pdf file, or the wallpost or discussion becomes a dataset.
Open your browser (Internet Explorer, or Google Chrome). Check that you can see the
NCapture icon in the toolbar, or that NCapture for NVivo is available under Tools.
Any web page can be saved using NCapture.
To save a social media dataset, sign in to Facebook, LinkedIn or Twitter, and locate the
wallpost, discussions, or tweets that you have legitimate access to and want to work with.
Click on the NCapture icon in the toolbar or select NCapture for NVivo from the Tools
menu.1 The download dialogue will open, showing the Source type (e.g., LinkedIn
1 You will be asked to authorise NCapture to gather the data on the first occasion you use it
within each social media site (in recognition of the potential privacy of the data).
© Research Support P/L November, 2012 23
Discussions as Dataset) and Source name for the page you are downloading. Add details as
requested or needed (e.g., description), and save the file to your preferred location
To import the file into NVivo:
In List View for your social media folder, Right-click > Import > Import from NCapture >
locate and select the source(s) you want to import.
By default, NVivo will match imports that are downloads from the same user or group and
merge them. Merging datasets allows you to update an earlier import. Optionally, you can
turn this off by unchecking Merge matching social media datasets at the base of the
dialogue.
Auto code the threads in the dataset using Option 1 in the auto code tool. This will create
nodes for each discussion thread, and also nodes for each contributor.
Create separate source and node folders for social media datasets and auto coded nodes, to
avoid their becoming mixed up with other sources and interactively coded, content-based
(thematic) nodes.
Find
Find toolbar
The Find toolbar is located immediately above any List View. The kinds of things you can look
for are parts or all of names of sources, nodes, sets, models—any item that is in your project. If
you’re not sure which tree a node is in, for example, you can Search in > Nodes, and a shortcut
to any matching items will appear in List View.
Advanced Find
In the Find bar at the top of List View, go to Advanced Find.
e.g., Filtering case nodes with Advanced Find, based on an attribute
If you are filtering on one attribute only:
Go to the Intermediate tab. Choose to Look for: Nodes.
Check against Classified items where (last option), and then use the drop down lists on
each of the three slots to identify which attribute values you wish to filter on, and in what
way. Click on Find Now and case nodes that match the criterion will be shown in List View
as aliases.
To filter on more than one attribute at the same time:
Go to the Advanced tab. Choose to Look for: Nodes. In the slot under Interaction, choose
the attribute to use for setting the first criterion; in the slot under Option choose how you
want to use it; and in the slot under Value choose the value/s you are including in this first
criterion. When you’ve got it right, click Add to List. Repeat this process for each criterion
you wish to apply simultaneously.
Save the results of your Find, listed in List View, as a Set, e.g., to use in a matrix query, or for
scoping a query or to put in a model:

© Research Support P/L November, 2012 24
Queries
For any query:
To save your query setup, check next to Add to Project, at the top-left of the query
dialogue, and provide a name for the query. This will allow you to re-run your query at a
later date with the same or slightly altered specifications.
To save the results of a query (except Group Query), go to Query Options in the query
dialogue and provide a name. Note that results saved in the Results folder cannot be
modified, other than to view context or coding stripes. You can code or uncode from query
results however, and they can be copied and pasted into Nodes, where the actual results can
be modified.
You can choose to Right-click > Save Query Results after seeing them in Preview if you
wish.
Group Query to find ‘items coding’ e.g., to identify nodes coding another node
Help topic > Run a Group query
In the Navigation Pane, go to Queries. In List View, Right-click > New Query > Group
Ask for Items Coding, and select one or more nodes or case nodes as the Scope item/s and
Nodes (or a subset of Nodes) as the Range items.
To save the results of your Find as a Set, e.g., to use in a matrix query (as a single item), or for
scoping a query or to put in a model:
Select all the items found, Right-click > Create as Set.
Coding queries
Help topics: About queries; Create, edit and manage queries; or Search “advanced coding
queries”; “manage query results”
This query is for when you want to find text that is coded by both of two (or more) nodes
(AND), or text coded at multiple nodes (OR), or at one node AND NOT another, or text coded
by a node when it is NEAR another, or text coded at a node for cases with a particular attribute:
Select Queries in the Navigation Pane, then right-click in the List View to create a New
Query > Coding query.
A Simple coding query is used only when you want to find the coding at one node for cases
with a particular attribute or in a specific folder or set of items (e.g., to find what you have
written in Memos about a topic).
From Coding Criteria, select Advanced tab. Don’t be put off by the sound of ‘advanced’—
it just means you’re going to be using more than one node!
For an AND (intersection) query, i.e. to locate text coded at all selected nodes:
Click on Coded at > All Selected Nodes > Select. Expand and check the nodes you want
> OK > Add to List. The node/s will be entered into the query dialogue.
Now check the Query Options tab. You will find the query is set to show a Preview Only,
which is probably all you need for the present.
Click on Run at the base of the dialogue. This will both save the query (if you elected to do
that) and run it. (Clicking OK will close the dialogue.) The results of your query will open in
Detail View.

© Research Support P/L November, 2012 25
Use a Matrix Coding Query (see below) if you want to look at multiple relationships between
nodes at the same time, e.g., to review a range of responses to a set of events.
To find a union (OR), i.e., text coded at any of the selected nodes:
As above, but change the option in the middle of the dialogue to Coded at > Any Selected
Node.
If the nodes you are selecting are all at the same level in the Nodes List View, then you can
simply select them there (use Ctrl-click on their icons), hover over one, and Right-click >
Create as > Create as Node.
To find the difference in text coded at nodes (A less B):
Select the A Node(s): Nodes Coded at – All or Any Selected Node > Select > Add to List.
Use the drop-down to change Coded at to NOT Coded at.
Find text NOT Coded at – All or Any Selected Node > Select > Add to List.
To find coding that is located NEAR coding for another node:
Select only one node, Add to list.
Under Define more criteria, select NEAR Content (or PRECEDING Content if you want to
specify order – A before B).
In Coding Search Operator, next to Proximity, define how you want it to relate to the
second node - how near? Also, check what Finds you want to retrieve.
Overlapping – full extent of passages as long as they intersect somewhere.
In Custom Context – you specify (# words, paragraph etc.)
In Same Scope Item – usually anywhere within whole Sources, but can be changed to
anywhere within whole Nodes or Sets by specifying a scope (see below).
In Same Coding Reference – restrict to finds where both nodes occur within the same
coded passage, for Nodes specified by scoping.
Now Select a second node.
NEAR options are not good options for focus group data (NVivo generally works with whole
sources)!
NEAR options will also find intersections.
Scoping a query
Scoping a query allows you to restrict the range of items considered in a query.
Use Advanced Find or Group Query to identify items to use as sets or search folders.
—with items in folders
In any query dialogue, at the base of the dialogue is an option to run the query In – All
Sources, Selected Items, or Items in Selected Folders. Choose Items in Selected Folders.
The Select button will become active – click on this to be able to choose which folders you
want included for this query (including Search Folders). Selecting a higher level folder will
include sub-folders (e.g., Internals would include all internal sources, but not externals or
memos.)
—with sets or nodes
NVivo queries view sets as a single item, and so the process of choosing a set involves
choosing to run the query In > Selected Item/s, rather than in items in a selected folder.

© Research Support P/L November, 2012 26
—within case analysis
Any query can be set up to run within a single case node (or a group of selected case nodes).
At the base of the query dialogue, choose In > Selected Items. Click on the word Nodes (or
a subfolder within Nodes), and then in the right pane, check against the case node(s) you
plan to use.
Matrix coding queries
Running a matrix coding query is like running multiple coding queries in one go, but with more
flexibility. Used to see patterns across data.
e.g.1: Using attributes in a matrix coding query
Use this to compare responses/experiences of sub-groups across a number of coding categories
(nodes). (See figure next page.)
Open Queries in the Navigation Pane. In List View, Right-click > New Query > Matrix
Coding.
Save your query.
Open the Matrix Coding Criteria tab. For Rows, under Define More Rows > Selected
Items > Select. In the left pane, click on the label (not the check boxes) to choose Nodes,
then choose the nodes you want to include in your query by placing a check mark against
them in the right pane. (You can select an entire subtree by first checking Automatically
select hierarchy at the top of the dialogue.) After clicking OK in the selection dialogue, you
will then need to click on Add to List in the matrix dialogue.
Rearrange their order using the up and down arrows if you wish, and remove any you didn’t
intend to select.
For Columns, under Define More Columns > Selected Items > Select > Node (or Source)
classifications, check against the attribute values you want to include in your query, then OK
and Add to List.
Don’t add values of more than one attribute into a single query – better to understand one at a
time.
The Matrix tab is set (by default) to Search for content of rows AND of columns, which is
what you want in a query involving attributes (and most others). This means that for any
particular cell, text that matches both the node for that row AND the attribute value for that
column will be found.
To optionally save the query for later re-use, check Add to Project and provide a name
for the query. (Saving is useful, as you can then re-run the query with values of a different
attribute)
If you want to save the results of your query as a node, you need to turn to Query Options
and provide a name for the results node.
To both save and run your query, click on Run at the base of the dialogue. Clicking OK will
just save the query (if you added to project), ready for you to run when you wish (double-
click on the saved query, or right-click and choose Run Query) or to re-run with some
specifications changed (right-click and choose Query Properties to open the query).
The matrix table will open in Detail View. Double-click any cell to see its text. Use your
right-mouse menu to change Matrix Cell Content options, to show shading, or for various
other display options. (These are also variously available on the View and Layout ribbons.)
To see a count of case nodes rather than coding references (the default): Select to see Nodes
and from the sub-menu, choose the relevant classification for the cases you wish to examine

© Research Support P/L November, 2012 27
or count. (Do the equivalent for Sources if you want to count for a particular sub-
classification of sources.)
Look at the interactive effect of two attributes by putting attribute values in both rows and
columns, and scoping the query to a particular node (In > Selected Items > Select [Node]).
e.g.2: Pattern searching across nodes
Use this, for example, to look at responses in different contexts, or to different issues, or to
consider impact of various strategies. Typically nodes for each of these different kinds of inputs
would be located together in a tree (i.e., trees for responses, contexts, issues, impacts, strategies).
Open Queries > New Query > Matrix Coding.
Open the Matrix Coding Criteria tab. For Rows, under Define More Rows > Selected
Items > Select. In the left pane, click on the label (not the check boxes) to choose Nodes,
then choose the nodes you want to include in your query by placing a check mark against
them in the right pane. (You can select an entire subtree by first checking Automatically
select hierarchy at the top of the dialogue.) After clicking OK in the selection dialogue, you
will then need to click on Add to List in the matrix dialogue.
Repeat the above step to specify nodes for the Columns in your query.
Complete the setup and review the results as for example 1.
While it is possible to use the OR, NOT, and NEAR search options in matrix queries, it isn’t
generally recommended unless you have a very specific purpose in doing so, and you have a
After selecting the items, OK
and Add to List

© Research Support P/L November, 2012 28
very clear understanding of what you are asking for. (Try it on individual pairs of nodes first,
using a Coding Query.)
e.g.3: Within-case and cross-case analysis
Comparing case nodes is similar to comparing attribute values. This time, however, set up
your Matrix Coding Query, with the required case nodes in the Rows, and coding content
nodes defining the Columns. Again, you will search for content of rows AND of columns.
This will find the text for each specified item separately for each included case node, and
display it in table format, allowing you to compare across case nodes.
If you want to refine your analysis by comparing what has been said or what happens at
different time phases in the life of an organization, or through repeated interviews with the
same participants, then you will need first to create a Node or Set for documents for each
time period or wave of interviewing (usually a Set). Then, you will be able to use the time-
based nodes or sets to identify the columns in a matrix (with case nodes still in the rows), and
by scoping the query to a particular node (In > Selected Items > Select [Node]) you will
have a comparison of how each case progressed over time for that particular issue/topic.
Refine your query by scoping to a particular folder or set of documents, for example, to
compare cases on a range of factors at the beginning (Time 1) of the study or intervention, or,
to examine the patterning of responses at different times. In this instance, you would set up
your query with case nodes (or other nodes) in the rows, nodes in the columns, and scope to
the folder or set of Time 1 documents. If you have added the query to project (i.e., saved the
query setup), then it is a simple matter to re-run it for Time 2, etc.
If each of your case nodes codes just a single whole document, the query will run faster if
you use internal sources instead of case nodes to define the rows.
View your matrix as a chart
Click on the Chart tab at the right of the Detail View. The currently displayed matrix will
open as a chart.
Select from the drop-down list in the Type section of the Chart ribbon to change the type of
chart. Grouped column is often the most helpful display.
You may need to Transpose your data (right-mouse menu) to improve they readability of the
chart.
Reporting your matrix
In table format:
Directly print the matrix table by going to File > Print.
Export the matrix table as an Excel file: Right-click > Export Result (or go to External
Data ribbon > Export > Export Matrix.
OR Click in the top-left cell of the table to select the whole table, Copy, and Paste into a Word
document.
I generally use the copy-and-paste-into-Word method, because it is simple to then add a
summary of the text into each cell (and to format the table in a preferred style if needed).
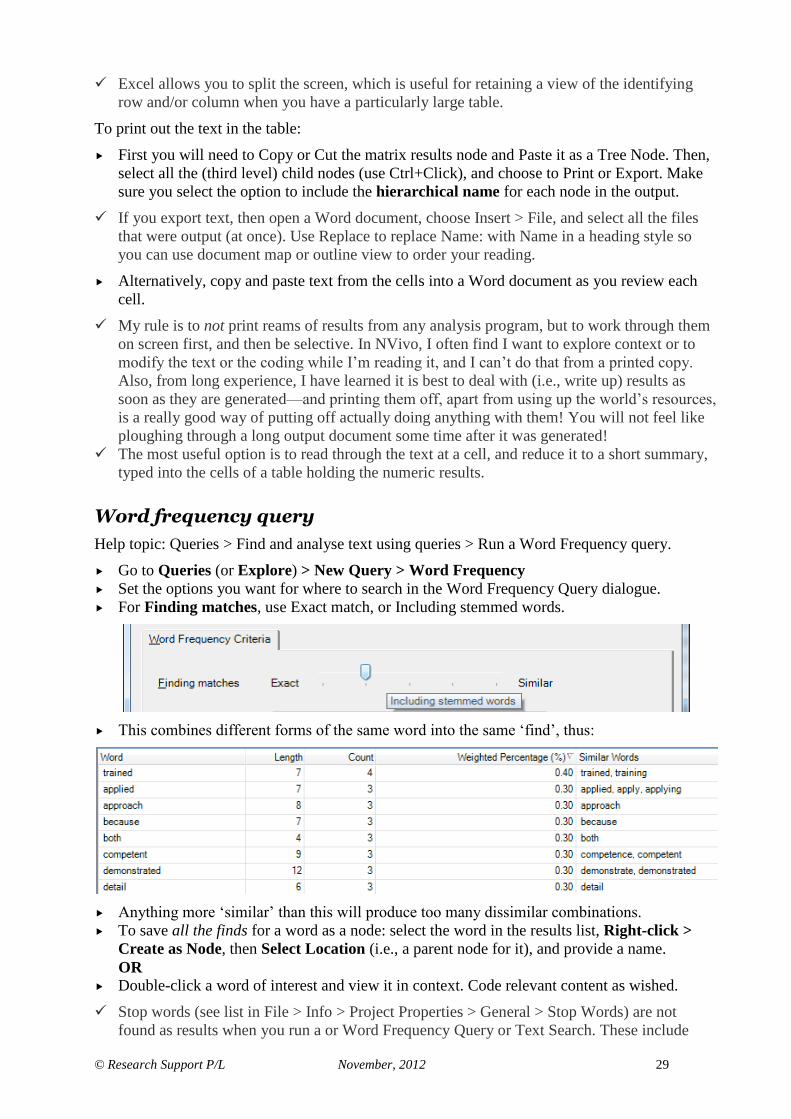
© Research Support P/L November, 2012 29
Excel allows you to split the screen, which is useful for retaining a view of the identifying
row and/or column when you have a particularly large table.
To print out the text in the table:
First you will need to Copy or Cut the matrix results node and Paste it as a Tree Node. Then,
select all the (third level) child nodes (use Ctrl+Click), and choose to Print or Export. Make
sure you select the option to include the hierarchical name for each node in the output.
If you export text, then open a Word document, choose Insert > File, and select all the files
that were output (at once). Use Replace to replace Name: with Name in a heading style so
you can use document map or outline view to order your reading.
Alternatively, copy and paste text from the cells into a Word document as you review each
cell.
My rule is to not print reams of results from any analysis program, but to work through them
on screen first, and then be selective. In NVivo, I often find I want to explore context or to
modify the text or the coding while I’m reading it, and I can’t do that from a printed copy.
Also, from long experience, I have learned it is best to deal with (i.e., write up) results as
soon as they are generated—and printing them off, apart from using up the world’s resources,
is a really good way of putting off actually doing anything with them! You will not feel like
ploughing through a long output document some time after it was generated!
The most useful option is to read through the text at a cell, and reduce it to a short summary,
typed into the cells of a table holding the numeric results.
Word frequency query
Help topic: Queries > Find and analyse text using queries > Run a Word Frequency query.
Go to Queries (or Explore) > New Query > Word Frequency
Set the options you want for where to search in the Word Frequency Query dialogue.
For Finding matches, use Exact match, or Including stemmed words.
This combines different forms of the same word into the same ‘find’, thus:
Anything more ‘similar’ than this will produce too many dissimilar combinations.
To save all the finds for a word as a node: select the word in the results list, Right-click >
Create as Node, then Select Location (i.e., a parent node for it), and provide a name.
OR Double-click a word of interest and view it in context. Code relevant content as wished.
Stop words (see list in File > Info > Project Properties > General > Stop Words) are not
found as results when you run a or Word Frequency Query or Text Search. These include

© Research Support P/L November, 2012 30
such English words as ‘a’ and ‘the’ and common conjunctions. To find ‘because’, or to
compare use, say, of ‘the baby’ with ‘my baby’, remove them from the list. Words can be
added to the stop words list by typing them in, or, in the results of a Word Frequency Query
Right-click > Add to Stop Words List.
Text search
Help topic: Queries > Find and analyse text using queries > Run a Text Search query
Navigate to Queries, and with Queries showing in List View, choose to create a New Query
> Text Search.
Decide whether or not to Add to project so you can either re-run or modify the search.
Type the word or phrase to search for, on the Text Search Criteria tab. If you want an exact
phrase, enclose it in double quotation marks. If you are using just the root of a word rather
than a whole word (so you find variations on it), add an asterisk (*) to the end of what you
type, otherwise it is likely not to find anything at all. To specify alternative words or phrases,
type OR between them.
Select how exact you want the matches to be (anything other than Exact or Stemmed can
bring up a very wide array of possibilities).
Choose to search in Text or in Text and Annotations, and then whether to search All
Sources, or to limit your search to Selected Items (e.g., responses to a single question), or
Items in Selected Folders (e.g., to exclude Memos).
Under the Query Options tab, choose to Preview Only or to Create Results as New Node,
and Name the node.
! Never send the results of a text search into an existing node unless you know exactly what
the search is going to find, and you are sure you want all of it in that node.
Indicate whether and how far to Spread the finds from the search. NVivo will show 5 words
either side as context in any case, and you can choose to see extended context.
Select Run from the base of the dialogue. This will both save the query (if that is what you
selected) and run it. The results will open in Detail View, showing References. You can
change your view of the results by selecting tabs at the right of the Detail View.
To see the found text in paragraph context, Edit > Select All (Ctrl+A), then Right-click >
Coding Context > Broad, or for a particular find, Open Referenced Source.
To save any of the found text (and context), select and code it in the normal way to a new or
existing node in the Nodes area. Once you have coded a passage, the relevant node will
remain selected (recently used) in the Coding toolbar at the base of the screen, for further
coding.
Text search will not find part words, stop words, symbols or punctuation—for these you will
need to use Edit > Find within particular sources or nodes (including a results node).
Always treat the node with the results of a text search as a temporary holding area only; once
you have coded relevant text on to a more permanent location, delete the temporary node.
Refining text searches
In Help, search for "Special characters and operators" to find a detailed explanation of various
wildcards and other ways of making your text searching more (or less) specific with:
wildcards to replace one or more than one character in words;
Boolean terms (AND, OR, NOT) to specify particular combinations of words within each
document (or other scope); or
using fuzzy (vague) or proximity (NEAR) operators (the proximity operator requires that the
two words are enclosed in double quotation marks).

© Research Support P/L November, 2012 31
Use Compound Query to combine text search with other queries
Do this either to make your search more specific, or to ask questions involving the use of
language.
The Compound Query tool provides for the combination of either two separate text searches or a
text search with a coding query (or two coding queries), using an AND, OR, AND NOT or
NEAR operator to link the two separately specified queries.
Use the two Text Search Query subqueries in Compound Query to find words or phrases
which occur NEAR each other (Options: Custom context > Surrounding Paragraph)—
thus using the more natural context of the paragraph rather than the context provided by a
rigid word count.
Use Compound Query to check the thoroughness of your coding by searching for a
keyword or phrase, less what you have already coded. Specify the text search first (Text
Search Query), then AND NOT the node/s (Coding Query – Simple, or Advanced > Any
Selected Node) you have been using for coding. The benefit of doing this is that you can
remove all known (coded) finds from the results before ‘cleaning up’ what the text search
might locate.
Use the results from a text search in another type of search by using the node containing the
results as an item in the search, rather than the text pattern itself.
Compare usage of words in different contexts or by different groups by using one or more
text search results nodes in the Rows of a Matrix Query, with contextual nodes or attribute
values in the Columns.
Framework analyses
Framework matrices provide a table format that is primarily designed to add cases in the rows
and thematic nodes in the columns. You can either generate a table that is empty so you can
summarise the intersecting content, or you can have NVivo generate the table for you with all of
the intersecting content visible in the cell.
Navigation View > Sources > Framework Matrices
List View > Right-click (in empty space) > New Framework Matrix.
Provide a name for the matrix.
For the Rows tab, browse to select the cases (nodes) you want to include in your analysis.
Optional: Choose attributes to sort the cases in the column on the right
In the Columns tab select the content/thematic nodes you want to examine for these cases.
You will then be looking at an empty table with the columns and rows specified. On the right
hand side of the screen, you see ALL of the data for the case selected in a row. To change the
display on the right side of the screen, so it displays only the intersection of the active cell:
View ribbon > Framework Matrix > Cell Coding
Write your own comments/summaries in the empty cells, based on the content to the right:
There are various linking and exporting options available with framework matrices – use your
right-mouse button or the Help files to explore these.
Visualising data
NVivo offers a range of visualisation possibilities – from simple pie charts based on
(demographic) attributes and bar charts showing the top 20 nodes in a document, to more
complex 3D charts based on matrix results or other combinations of nodes and attributes, to
multidimensional clustering or visualisations. All visualisation techniques, particularly the latter,

© Research Support P/L November, 2012 32
should be treated with caution as it is very easy to gain a wrong impression from a simply
generated visualisation that is built on a range of complex knowledge and assumptions.
Charts
I have not listed all charting possibilities, as a number of them appear to me to be of no use, or
completely uninterpretable. Here are some you might find helpful.
All charts can be rotated if that helps you to see the result more clearly. Click on the chart
and move your mouse.
Chart frequencies directly from List View
To chart the top 20 nodes occurring in a source (based on proportion of the document coded
at each node): Select document in List View, Right-click > Visualise > Chart Document
Coding.
To chart the top 20 documents coded by a particular node (based on proportion of each
document coded at the node): Select the node in List View, Right-click > Visualise > Chart
Node Coding.
Chart demographic (or other attribute) information
Go to Explore > Chart > Nodes > Nodes by attribute value for an attribute (or for two
attributes).
Select the attribute/s you want to display.
Indicate which attribute values you want displayed (normally All attribute values except
‘Unassigned’, ‘Not Applicable’).
Choose the type of chart you want from the top left of the Charts ribbon which will now be
showing (use Column or Pie for a single attribute; try Grouped Column for two attributes.)
The only nodes that can be counted are those case nodes that have been given the relevant
attribute/s.
The equivalent for sources (where you have source attributes) could be obtained by
Exploring Chart > Sources > Sources by attribute value for an attribute (or two).
Chart the distribution of coding across sample sub-groups (attribute values)
This kind of chart provides a chart view of a matrix coding query using attribute values.
Go to Explore > Chart
Select Coding by node attribute value for multiple nodes (or a node).
Select the Node(s) you want to include (usually all those within one tree)
In the Chart Wizard, select the node or nodes you want to chart, and the attribute you want
them sorted by.
For which attribute values do you want the coding in those sources counted? Select these for
the X-axis.
Indicate which attribute values you want displayed (normally All attribute values except
‘Unassigned’, ‘Not Applicable’).
Select the information you want displayed for each attribute value (Y-axis), i.e., Percentage
coverage (= proportion of total text from that node in sources with that attribute value),
Number of coding references (= absolute number of passages in those sources with that
attribute value), or Number of nodes coded (= number of case nodes [i.e., cases] with that
attribute that are coded at the selected node/s).
Choose the type of chart display you want to use (bar, column, etc.) from the drop-down
display in the Charts ribbon.

© Research Support P/L November, 2012 33
Two dimensional (2D) charts (e.g., grouped column) are less ‘jazzy’ but can be much easier
to interpret than 3D.
! Charts based on comparisons involving attributes are not adjusted for differing numbers of
cases that have each attribute value and so can give a false impression of the distribution of
responses across groups.
! Be careful about interpreting numbers of coding references in these displays: there will
appear to be more coding for members of larger groups, or particularly, for more talkative
groups.
! Percentage coverage is particularly misleading as it emphasises even more those who are
particularly talkative about a subject. This does not show, as one might expect, the proportion
of text with that attribute that is coded at that node.
Visual displays
Tree Map
Help topic: Visualisations > Tree map > About tree maps
A tree map shows the relative volume of coded material at a set of sources or nodes in
diagrammatic form, as well as providing a summary. It can also be used to show the number of
items (e.g., sources or cases) that have a particular attribute value, or (usefully) a particular
combination of attribute values.
Go to Explore > Tree Map > Tree Map (or if you have already selected what you want to
map: Tree Map of [Items]).
Choose what you want to map (Sources, Nodes, or Attributes)
For Nodes or Sources, indicate the Scope (if not already defined by your starting point).
For Attribute value combinations, indicate first of all which Classification Sheet they are
from, then select the attributes you want to map using the arrows under the list, and then set
the scope (all or selected items with that classification).
Tree maps can be generated for selected items from the right mouse menu.
Cluster
Help topic: Visualisations > Cluster analysis > About cluster analysis
Cluster provides information about the way in which various sources or nodes might ‘hang
together’, based on common patterns of words or coding. The Help files provide a
comprehensive explanation of the options.
Go to Explore > Cluster Analysis > Cluster Analysis > Sources or Nodes.
Select the sources or nodes you want to cluster.
Choose how you want them clustered. NVivo will select an appropriate similarity metric.
To change what is included in the chart, or how it is clustered, click on Cluster Analysis >
Select Data (or Right-click > Select Data).
OR
Cluster analysis based on word similarity can be run on selected items from the right mouse
menu (right-click on the result > Select Data to change to clustering by coding similarity).
Explore different levels of clustering by selecting the number of clusters in the Cluster
Analysis ribbon.
Select the type of display from the Cluster Analysis ribbon. Rotate 3D charts by moving your
mouse over the display.

© Research Support P/L November, 2012 34
Graph
Select the item you wish to graph. Right-click > Graph (or select from Explore > Graph).
NVivo will show the item with its associated nodes (for a source) or sources (for a node).
To modify or save the graph, Right-click > Create Model from Graph.
If you create a model of nodes coding a source (e.g. for a person) from a graph, you might
select the source the nodes code, delete it from the model, and then rearrange and connect the
remaining nodes to create a model of what you have learned about that person.
Copying and exporting visualisations
Charts are not directly saved within NVivo, but they can be copied and pasted into other
applications, or they can be exported as jpeg (picture) files.
Models
Creating a model
(Help topics: Models > About models, etc.)
Click on Models in the Navigation Pane, then right-click in List View to create and name a
new model. An area for working will be created in Detail View.
Build with new items: from the Model ribbon, click a shape to insert it in the model. Double-
click to name it.
If you already have nodes or other project items, Model > Add Project Items. Once you
select items, you will be asked if you want to add associated items, and then if you want all
or some of those (if you don’t want any associated data, simply click OK). See e.g. below.
Items can be resized, or the shape can be extended in one or other direction. Select those you
want to change (drag to select; use Ctrl-A for all; or Ctrl-Click for some), and then adjust
one. The adjustment will apply to all selected items.
Move the shapes to where you want them, by dragging. Multiple selections can be moved at
the same time so that their spatial relationships are preserved.
Add connectors to show links between shapes or nodes. Select the first item for the linked
pair. Use Ctrl-click to select the second item. While hovering over one of the items, go to the
Model ribbon > select a Connector, and choose the type of connector that best fits the
relationship between the two items. If you create a one-way arrow that is pointing the wrong
way, select it, select it and use Model > Reverse Direction to fix it.
To create more working space, select View > Docked (to remove the check mark) and the
Detail View will become a separate window which can be enlarged to fill the screen.
! If you keep undocking additional Detail View windows, you will eventually use the
program’s memory and cause a crash.
Explore the options available on your right-click menu (Detail View, with a model open).
When you’re working in a model, if you don’t need them, go to Model (in either the main
view or the undocked window) and turn off Model Groups. This gives you more room to
work.
Use the zoom bar below the model, or View > Zoom > Zoom Out to see more model in the
space available.
To model from an interview, choose to add the source document you have been coding, and
Add Associated Items > Items coding > Nodes > Selected Associations > Select (select
from the left pane in the dialogue, then delete the document icon from the model so that you
can rearrange and link the items). To model from a case (or other) node, run a Group Query

© Research Support P/L November, 2012 35
to list the nodes coding the case node, create a set from them, and import that with associated
data (members).
Modify the appearance of model items
Makes sure Click to edit is not showing at the top of the model, i.e., that it can be edited
(Home > Edit).
Adjust font type and size, fill and line colours for a selected item (or use Ctrl-Click to select a
number of items to adjust at the same time) using the Format section on the Home ribbon.
Enhance your model’s power to explain and communicate by applying styles to the node
shapes or connectors within it (these work on the same principles as paragraph styles). These
can be set up for the current project through File > Info > Project Properties > Model
Styles, or for the application as a whole (i.e., for all future projects) through File > Options
> Model Styles.
Defined styles can be applied to currently selected items from the drop-down slot (labelled
Default by default) on Model > Styles.
Change the default item style (via File > Info > Project Properties > Model Styles) to 8 point
font size and maybe also to Arial Narrow font (or another small one).
To archive the model
– so you have a stored (non-editable) copy as well as a dynamic one to continue working on.
In List View, select the model you want to preserve. Right-click > Create As Static Model.
Name the new model—this is the one which will be the archive (static) copy, indicated by a
different icon . A static model will lose any live links with project items.
Model Groups
If an item has a classification of some kind, then attributes for those classifications will be shown
in the right panel on Detail View.
To show or hide a group of items in the model, click on the check box under .
Make sure your model can be edited if you want to view particular groups (even though
doing this will not change the model itself).
Creating custom groups in a model
Custom groups are model specific.
At the right of the model window (Detail View), under Custom Groups, Right-click > New
Group. Name the group, and optionally provide a description.
To populate the group, select an item or multiple items in your model, then click in the check
box under . The same item can belong to multiple groups. Remove an item by
selecting it then clicking to remove the check mark.
To show or hide a group of items in the model, click on the check box under .
If you have one or more items selected when you elect to create a custom group, all the
selected items will automatically be placed in that group.
The Help files contain a very full description of the operation of model groups in a project—
search for model groups if you need further assistance.
© Research Support P/L November, 2012 36
Teamwork tools
Help topic: Teamwork and project users > About teamwork (and related topics).
Combine and track the contribution of different team members to a project, and compare coding
as a way of facilitating common approaches across a team.
Defining User Profiles
When NVivo is launched for the first time, the NVivo user dialogue requests a name and initials.
These will become the default user for NVivo projects set up on that computer.
If multiple users are accessing the same copy of NVivo, from File > Options > General,
check the box next to Prompt for user on launch.
To change or add a user while the program is running, in File > Options > General, provide
the requested User details (can be either existing or new).
Any items created or modified will be identified in List View by user initials.
Users can be identified in coding stripes (View > Coding Stripes > Selected Items > Users).
Remove or merge user profiles
Go to Info > Project Properties > Users. Select the User you wish to remove or merge,
click on Remove, and indicate whom the replacement should be.
Importing a project
Make a backup copy of your current project, as the imported one will be added to it.
Go to External Data > Project.
Select how much of the project you want to import, noting what changes it will make to your
current project.
Use Import > Selected (excluding content) to transfer a project structure to a new project
for a second coder to work on.
If you are using this to recover an accidentally deleted item (e.g., coding at a tree of nodes),
make a copy of the backup project you are drawing on and reduce it to just the items you
need to import (remembering that for coding you will need the sources as well as the nodes).
! If sources have been edited in any way in one or other copy of the project, you will not be
able to merge them or the coding on them.
Comparing coding
Two measures of agreement between coders are provided:
Percentage agreement is calculated from the number of units (usually characters) for which
two coders (or groups of coders) are in agreement (including both presence and absence of
coding for the particular node), compared to the total number of available units.
The Kappa coefficient is a statistical measure of the level of agreement between two coders
which takes into account the amount of random (chance) agreement which could be expected
to occur.
Go to Queries. In List View, Right-click > New Query > Coding Comparison
Select the Users (or User groups) to be compared, the Nodes they are to be compared on, and
the Sources to be compared. Options for Display (Display Kappa Coefficient and Display
percentage agreement) are checked already.

© Research Support P/L November, 2012 37
! In NVivo, Kappa is calculated at a very fine level (e.g. characters) based on coded data, and
is therefore likely to produce lower estimates of agreement than might otherwise be
expected.
Results of the coding comparison are presented for each node used in each source, in table
format in Detail View.
Result columns include:
Source size – total number of units in the source being coded (characters for documents,
duration to 1/10th
of a second for media files, pixels for images).
Kappa – 1 indicates perfect agreement (identical coding), 0 or less indicates no better than
chance (or worse than chance).
Agreement (%) – overall level of agreement between coders (a combination of the next two
columns).
A and B (%) – the percent of units coded by both coders.
Not A and Not B (%) – the percent of units coded by neither coder.
Disagreement (%) – overall level of disagreement between coders (a combination of the next
two columns).
A and Not B (%) – percent of units coded by A but not coded by B.
B and Not A (%) – percent of units coded by B but not coded by A.
To view details, e.g. of a problem area:
Double-click any line of the results, to be shown the particular source with coding stripes
detailing coding for that particular node, as assigned by each user.
Use this display as the basis for team discussion about what ‘should’ be coded at this node.
Reporting
Help topic: Reports and extracts > About reports and extracts.
Reporting text – from List View options
Right-click on the item you wish to print or export, and choose the appropriate options.
For text output, select Export > Reference View. This will export to a Word or text file.
OR For output that includes video, audio or image source or coded material, select Export >
Entire Content . This will export as a web page (*.htm).
Annotations and see also links optionally export as end notes to the content (very useful!).
! Check the options for exporting in the dialogue carefully, especially that to do with what is to
be exported.
Reporting using predefined reports
Help topic: Reports and extracts > About reports and extracts; Run predefined reports and
extracts, and other related topics.
Help provides a useful summary of general guidelines and of what each kind of report
provides.

© Research Support P/L November, 2012 38
To generate a report: Navigate to Reports > select [Report type] from List View, and work
through the filter options (if needed). If you are not sure what an option is referring to, click
on Select to get a clue.
When a filter dialogue comes up, if you don’t want to filter, simply click OK.
When selecting nodes, take care with what you include (e.g., usually you do not want text
from case nodes).
Extracts put all the information in a report into spreadsheet format.
Viewing the report
When a report opens in Detail View, it can be cramped and difficult to see what you have,
especially if you have your Detail View on the right side of the NVivo window. Either,
Change your Detail View to the bottom of the window (View > Workspace > Detail View >
Bottom, AND/OR,
If you want just to see the report, without the map or the preview pane, then with the Detail
View active, in the View ribbon, Detail View group > uncheck Report Map and/or
Thumbnails.
Right-click in Detail View to Export or Print the report.
Customising a report
Select and Run the report you think you want to modify, to check what it currently provides.
In List View, select the report you want to modify, Copy it, Paste it (in the same area) and
then edit the name to reflect the changes you plan to make.
! The changes you make to the design of a report become permanent within this project.
In List View, select the copy of the report you want to modify, Right-click > Open Report
in Designer. Adjust your screen so you can see the full width of the report format, and on the
right, the list of fields that can be modified.
Click in the Header Band on a field you want to remove (e.g., Nickname), and Delete.
Select the same field from the body of the report (i.e., Node: Nickname), and Delete.
Repeat for any other fields you want to remove, including unwanted group headers.
From the Field List, drag a selected field on to the Header Band, and also onto the body of
the report. Adjust the amount of space allocated to the field by moving the handles that show
when the field name is selected (see figure).
Add a company logo, etc., if wanted. Experiment (and practice) to create a company style
with headers and footers etc.
Your new report format saves automatically. If you want to export it to another project, or
import from another project, search Help for Manage reports and scroll down to
Export…criteria.
! Back up your file at the end of each day’s work!