Embed Size (px)
Citation preview

Saudi Journal of Biological Sciences (2014) 21, 41–55
King Saud University
Saudi Journal of Biological Sciences
www.ksu.edu.sawww.sciencedirect.com
ORIGINAL ARTICLE
Nutritional and ecological evaluation of dairy
farming systems based on concentrate feeding
regimes in semi-arid environments of Jordan
* Corresponding author at: Institute of Animal Nutrition and
Physiology, Christian-Albrechts-Universitat zu Kiel, Hermann-Rode-
wald-Str. 9, 24118 Kiel, Germany.
E-mail address: [email protected] (O. Alqaisi).
Peer review under responsibility of King Saud University.
Production and hosting by Elsevier
1319-562X ª 2014 Production and hosting by Elsevier B.V. on behalf of King Saud University.
http://dx.doi.org/10.1016/j.sjbs.2013.05.001
Othman Alqaisia,b,*, Torsten Hemme
b, Martin Hagemann
b, Andreas Susenbeth
a
a Institute of Animal Nutrition and Physiology, Christian-Albrechts-Universitat zu Kiel, Hermann-Rodewald-Str. 9,24118 Kiel, Germanyb IFCN Dairy Research Center, Schauenburgerstrasse 116, D-24118 Kiel, Germany
Received 20 March 2013; revised 3 May 2013; accepted 4 May 2013Available online 11 May 2013
KEYWORDS
Dairy;
Feeding systems;
Efficiency;
Greenhouse gas emissions
(GHGs)
Abstract The objective of this study was to evaluate the nutritional and ecological aspects of feed-
ing systems practiced under semi-arid environments in Jordan. Nine dairy farms representing the dif-
ferent dairy farming systems were selected for this study. Feed samples (n= 58), fecal samples
(n= 108), and milk samples (n= 78) were collected from the farms and analysed for chemical com-
position. Feed samples were also analysed for metabolisable energy (ME) contents and in vitro
organic matter digestibility according to Hohenheim-Feed-Test. Furthermore, fecal nitrogen con-
centration was determined to estimate in vivo organic matter digestibility. ME and nutrient intakes
were calculated based on the farmer’s estimate of dry matter intake and the analysed composition of
the feed ingredients. ME and nutrient intakes were compared to recommended standard values for
adequate supply of ME, utilizable crude protein, rumen undegradable crude protein (RUCP), phos-
phorus (P), and calcium (Ca). Technology Impact Policy Impact Calculation model complemented
with a partial life cycle assessment model was used to estimate greenhouse gas emissions of milk pro-
duction at farm gate. The model predicts CH4, N2O and CO2 gases emitted either directly or indi-
rectly. Average daily energy corrected milk yield (ECM) was 19 kg and ranged between 11 and
27 kg. The mean of ME intake of all farms was 184 MJ/d with a range between 115 and 225 MJ/
d. Intake of RUCP was lower than the standard requirements in six farms ranging between 19
and 137 g/d, was higher (32 and 93 g/d) in two farms, and matched the requirements in one farm.
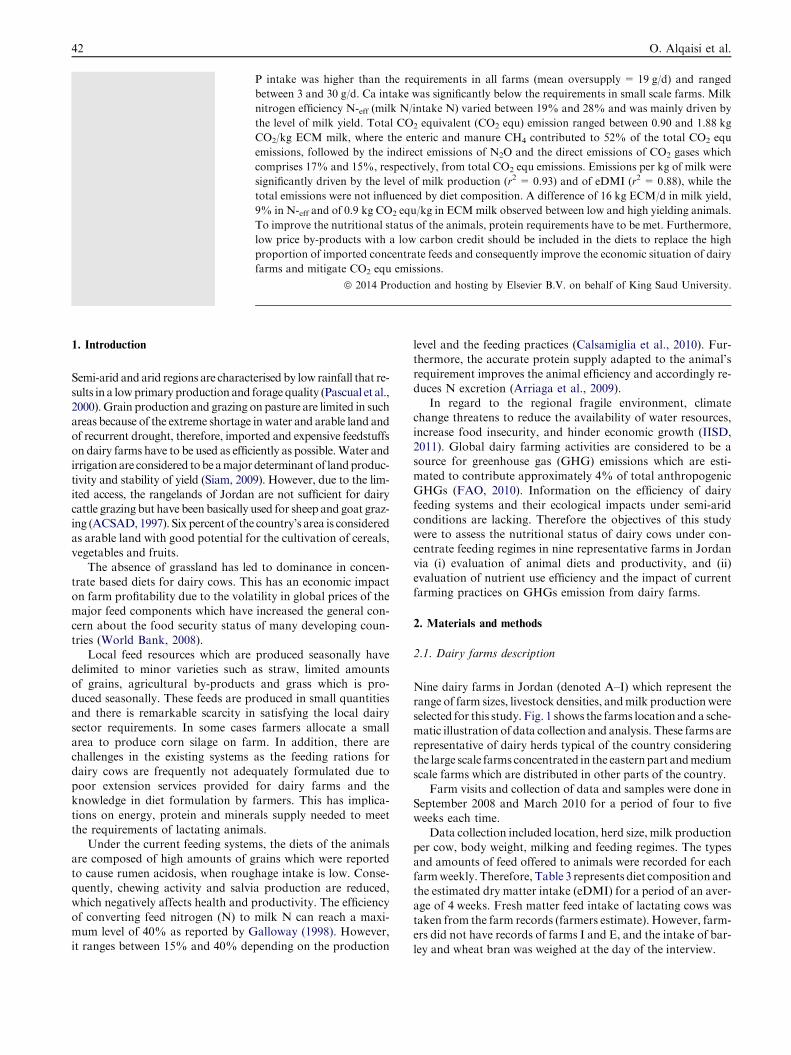
42 O. Alqaisi et al.
P intake was higher than the requirements in all farms (mean oversupply = 19 g/d) and ranged
between 3 and 30 g/d. Ca intake was significantly below the requirements in small scale farms. Milk
nitrogen efficiency N-eff (milk N/intake N) varied between 19% and 28% and was mainly driven by
the level of milk yield. Total CO2 equivalent (CO2 equ) emission ranged between 0.90 and 1.88 kg
CO2/kg ECM milk, where the enteric and manure CH4 contributed to 52% of the total CO2 equ
emissions, followed by the indirect emissions of N2O and the direct emissions of CO2 gases which
comprises 17% and 15%, respectively, from total CO2 equ emissions. Emissions per kg of milk were
significantly driven by the level of milk production (r2 = 0.93) and of eDMI (r2 = 0.88), while the
total emissions were not influenced by diet composition. A difference of 16 kg ECM/d in milk yield,
9% in N-eff and of 0.9 kg CO2 equ/kg in ECMmilk observed between low and high yielding animals.
To improve the nutritional status of the animals, protein requirements have to be met. Furthermore,
low price by-products with a low carbon credit should be included in the diets to replace the high
proportion of imported concentrate feeds and consequently improve the economic situation of dairy
farms and mitigate CO2 equ emissions.
ª 2014 Production and hosting by Elsevier B.V. on behalf of King Saud University.
1. Introduction
Semi-arid and arid regions are characterised by low rainfall that re-
sults in a lowprimary production and foragequality (Pascual et al.,2000).Grain production and grazing on pasture are limited in suchareas because of the extreme shortage inwater and arable land and
of recurrent drought, therefore, imported and expensive feedstuffson dairy farms have to be used as efficiently as possible.Water andirrigationare considered tobe amajordeterminant of landproduc-
tivity and stability of yield (Siam, 2009). However, due to the lim-ited access, the rangelands of Jordan are not sufficient for dairycattle grazing but have been basically used for sheep and goat graz-ing (ACSAD, 1997). Six percent of the country’s area is considered
as arable land with good potential for the cultivation of cereals,vegetables and fruits.
The absence of grassland has led to dominance in concen-
trate based diets for dairy cows. This has an economic impacton farm profitability due to the volatility in global prices of themajor feed components which have increased the general con-
cern about the food security status of many developing coun-tries (World Bank, 2008).
Local feed resources which are produced seasonally havedelimited to minor varieties such as straw, limited amounts
of grains, agricultural by-products and grass which is pro-duced seasonally. These feeds are produced in small quantitiesand there is remarkable scarcity in satisfying the local dairy
sector requirements. In some cases farmers allocate a smallarea to produce corn silage on farm. In addition, there arechallenges in the existing systems as the feeding rations for
dairy cows are frequently not adequately formulated due topoor extension services provided for dairy farms and theknowledge in diet formulation by farmers. This has implica-
tions on energy, protein and minerals supply needed to meetthe requirements of lactating animals.
Under the current feeding systems, the diets of the animalsare composed of high amounts of grains which were reported
to cause rumen acidosis, when roughage intake is low. Conse-quently, chewing activity and salvia production are reduced,which negatively affects health and productivity. The efficiency
of converting feed nitrogen (N) to milk N can reach a maxi-mum level of 40% as reported by Galloway (1998). However,it ranges between 15% and 40% depending on the production
level and the feeding practices (Calsamiglia et al., 2010). Fur-thermore, the accurate protein supply adapted to the animal’s
requirement improves the animal efficiency and accordingly re-duces N excretion (Arriaga et al., 2009).
In regard to the regional fragile environment, climatechange threatens to reduce the availability of water resources,
increase food insecurity, and hinder economic growth (IISD,2011). Global dairy farming activities are considered to be asource for greenhouse gas (GHG) emissions which are esti-
mated to contribute approximately 4% of total anthropogenicGHGs (FAO, 2010). Information on the efficiency of dairyfeeding systems and their ecological impacts under semi-arid
conditions are lacking. Therefore the objectives of this studywere to assess the nutritional status of dairy cows under con-centrate feeding regimes in nine representative farms in Jordan
via (i) evaluation of animal diets and productivity, and (ii)evaluation of nutrient use efficiency and the impact of currentfarming practices on GHGs emission from dairy farms.
2. Materials and methods
2.1. Dairy farms description
Nine dairy farms in Jordan (denoted A–I) which represent therange of farm sizes, livestock densities, andmilk productionwere
selected for this study. Fig. 1 shows the farms location and a sche-matic illustration of data collection and analysis. These farms arerepresentative of dairy herds typical of the country considering
the large scale farms concentrated in the easternpart andmediumscale farms which are distributed in other parts of the country.
Farm visits and collection of data and samples were done in
September 2008 and March 2010 for a period of four to fiveweeks each time.
Data collection included location, herd size, milk productionper cow, body weight, milking and feeding regimes. The types
and amounts of feed offered to animals were recorded for eachfarmweekly. Therefore, Table 3 represents diet composition andthe estimated dry matter intake (eDMI) for a period of an aver-
age of 4 weeks. Fresh matter feed intake of lactating cows wastaken from the farm records (farmers estimate). However, farm-ers did not have records of farms I and E, and the intake of bar-
ley and wheat bran was weighed at the day of the interview.
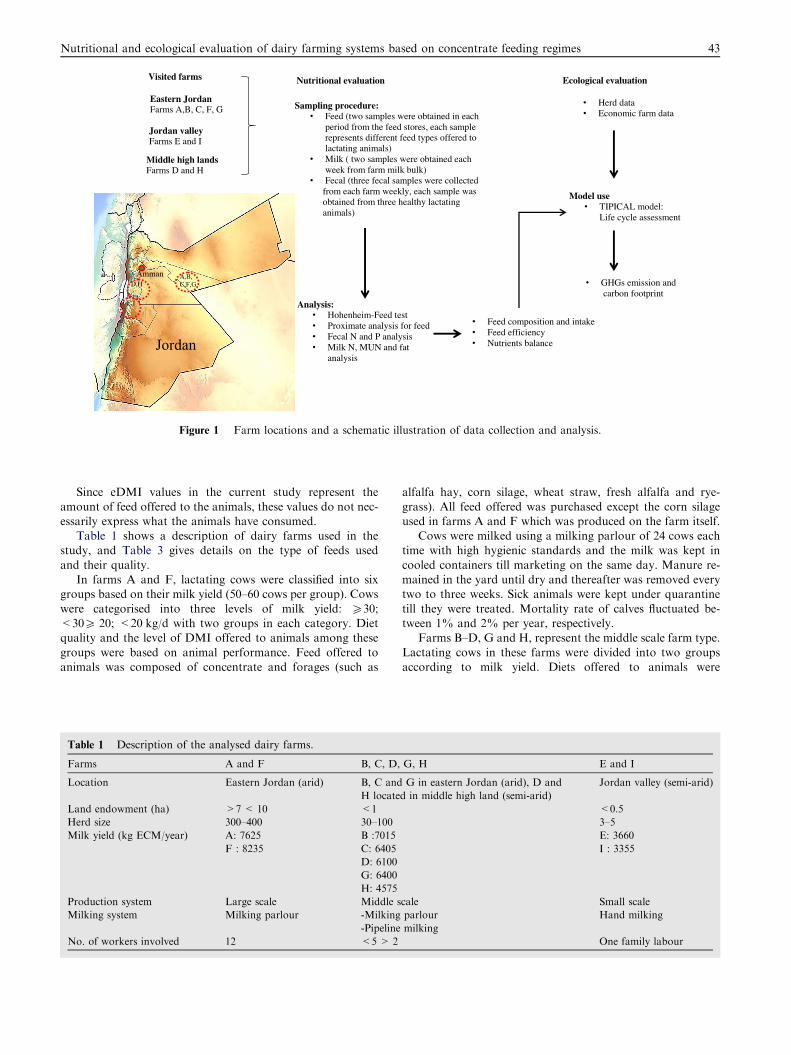
Sampling procedure:• Feed (two samples were obtained in each
period from the feed stores, each sample represents different feed types offered to lactating animals)
• Milk ( two samples were obtained eachweek from farm milk bulk)
• Fecal (three fecal samples were collected from each farm weekly, each sample was obtained from three healthy lactatinganimals)
Eastern Jordan Farms A,B, C, F, G
Jordan valleyFarms E and I
Middle high landsFarms D and H
Visited farms
Analysis:• Hohenheim-Feed test• Proximate analysis for feed• Fecal N and P analysis• Milk N, MUN and fat
analysis
Ecological evaluation Nutritional evaluation
• Herd data • Economic farm data
Model use• TIPICAL model:
Life cycle assessment
• GHGs emission and carbon footprint
• Feed composition and intake• Feed efficiency• Nutrients balance
A,B,C,F,GD,H
E,I
Jordan
Amman
Figure 1 Farm locations and a schematic illustration of data collection and analysis.
Nutritional and ecological evaluation of dairy farming systems based on concentrate feeding regimes 43
Since eDMI values in the current study represent the
amount of feed offered to the animals, these values do not nec-essarily express what the animals have consumed.
Table 1 shows a description of dairy farms used in thestudy, and Table 3 gives details on the type of feeds used
and their quality.In farms A and F, lactating cows were classified into six
groups based on their milk yield (50–60 cows per group). Cows
were categorised into three levels of milk yield: P30;<30P 20; <20 kg/d with two groups in each category. Dietquality and the level of DMI offered to animals among these
groups were based on animal performance. Feed offered toanimals was composed of concentrate and forages (such as
Table 1 Description of the analysed dairy farms.
Farms A and F B, C, D,
Location Eastern Jordan (arid) B, C and
H locate
Land endowment (ha) >7 < 10 <1
Herd size 300–400 30–100
Milk yield (kg ECM/year) A: 7625 B :7015
F : 8235 C: 6405
D: 6100
G: 6400
H: 4575
Production system Large scale Middle s
Milking system Milking parlour -Milking
-Pipeline
No. of workers involved 12 <5 > 2
alfalfa hay, corn silage, wheat straw, fresh alfalfa and rye-
grass). All feed offered was purchased except the corn silageused in farms A and F which was produced on the farm itself.
Cows were milked using a milking parlour of 24 cows eachtime with high hygienic standards and the milk was kept in
cooled containers till marketing on the same day. Manure re-mained in the yard until dry and thereafter was removed everytwo to three weeks. Sick animals were kept under quarantine
till they were treated. Mortality rate of calves fluctuated be-tween 1% and 2% per year, respectively.
Farms B–D, G and H, represent the middle scale farm type.
Lactating cows in these farms were divided into two groupsaccording to milk yield. Diets offered to animals were
G, H E and I
G in eastern Jordan (arid), D and
d in middle high land (semi-arid)
Jordan valley (semi-arid)
<0.5
3–5
E: 3660
I : 3355
cale Small scale
parlour Hand milking
milking
One family labour

44 O. Alqaisi et al.
composed of alfalfa hay, wheat straw, concentrate and rye-grass. Cows were milked using milking parlour of 12 cows eachtime or by using the pipeline milking system. Collected milk
was kept in cooled containers until marketing. Mortality rateof calves was higher than in large scale farms, which reachedup to 3% per year. Manure that remained on the field was re-
moved less often than in large scale farms.Farms E and I belong to small scale family farms which are
dominant in the Jordan valley and in small villages. The farms
are located in the backyard of houses and managed by familymembers. Less management efforts were given to the cows,while raising cows was subsistence oriented. Diet was com-posed of wheat bran and barley. Cows were hand milked or
by using small milking vacuum machines with a low hygienicstandard.
Feeding cows usually took place early in the morning and
in the afternoon after milking times. Barley grains representedthe highest proportion of the concentrate which exceeded 35%.Fig. 2 shows the average higher and lower temperatures in Jor-
dan in the year 2010.
2.2. Chemical analysis of feed, milk and fecal samples
From each farm, milk and fecal samples from lactating cows,as well as feed used on the farm, were collected in two differentperiods. Feed samples (n= 58) which represent the feed of-fered to animals were collected from each farm twice (in
2 weeks interval) during the study periods. Samples were ob-tained at the feed stores, mixed by hand and the representativesub-samples were taken. Three fecal samples were collected
from each farm weekly (in total n = 108) so that an estimateon fecal characteristics and N and P contents can be presented.Furthermore, a representative fecal sample number from each
farm with a different management system was important toobtain in order to evaluate the in vivo organic matter digest-ibility. Each fecal sample was obtained from three healthy lac-
tating cows, mixed within animals, and the sub-samples weretaken.
Since milk from all lactating animals is collected as bulkmilk, only two milk samples per farm were collected each week
0
5
10
15
20
25
30
35
40
J F M A
M J J A S O
N D
Tem
pera
ture
C o
Month
Max Temp Low Temp
Figure 2 Monthly (mean) higher and lower temperatures in
Jordan (2010).
(in total n= 78). Fecal and milk samples were preserved in anice container prior to analysis on the same day.
Feed samples were analysed for dry matter (DM), crude ash
(CA), crude lipid (CL), phosphorus (P) and Calcium (Ca)according to AOAC (1995). The DM in feed and fecal sampleswas determined by oven-drying at 105 �C overnight. CA con-
tent was measured by incinerating samples at 550 �C for 4 h.N content in milk and fecal samples was determined usingthe Kjeldahl procedure using Cu as catalyst (AOAC, 1995).
The concentration of crude protein (CP) content in feed andfecal samples was calculated by multiplying the N concentra-tion by 6.25, while CP in milk was calculated by multiplyingN concentration by 6.38 (Barbano and Clark, 1990). Neutral
detergent fibre (NDF) content in feed samples was determinedaccording to Van Soest et al. (1991). Acid detergent fibre(ADF) content was determined according to Goering and
Van Soest (1970).The in vitro gas production, and the concentration of
metabolizable energy (ME) and digestible organic matter
(DOM) of feed samples were determined in triplicate in vitroincubation with rumen fluid for 24 h (Menke et al., 1979). Milkurea nitrogen (MUN) was analysed using Spotchem Analyser
SP-4420 (Arkry Inc., Japan).
2.3. Calculation of feed intake and determination of energy andnutrient requirements, and of nitrogen and phosphorus excretion
2.3.1. Determination of DM intake and energy corrected milk
eDMI and intake of feed ingredients are shown in Table 3.
To evaluate the intake data provided by farmers, two formu-las were used, first according to NRC (2001) using proteinand energy corrected milk (ECM) and metabolic body weight
as variables, and secondly according to Fox et al. (2003)using the ECM and body weight as variables. ECM with4.0% fat and 3.3% protein was calculated according to the
formula ECM (kg) = (milk production · (0.383 · %fat + 0.242 · % protein + 0.7832)/3.1138) (Østergaardet al., 2003).
2.3.2. Determination and evaluation of DOM and ME intakeand ME requirement
Two methods were used to determine and to evaluate the
digestibility of organic matter (OMD) of the diets. Firstly,the contents of digestible organic matter DOM (g/kg DM)was determined according to the in vitro method of Menke
and Steingass (1988) using the formula: DOM = 14.88 +0.889 · gas yield (ml/200 mg) + 0.045 · CP + 0.065 · CA,where CP and CA concentrations are expressed in g/kg
DM, thereafter the measured mOMD of the diet was calcu-lated as the ratio between measured DOM intake and theeDMI. Secondly, the estimated eOMD (%) was calculated
from the fecal CP concentration (FCP, g/kg OM) accordingto the formula: eOMD = 79.76–107.7e (�0.01515 · FCP) (Lukaset al., 2005).
Daily fecal excretion (kg DM/cow) was calculated as the fe-
cal OM (kg/d) · (100/OM% of DM). Accordingly, the mea-sured ME (mME, MJ/kg DM) was calculated using theformula: mME = 1.242 + 0.146 · gas yield (ml/200 mg) +
0.007 · CP + 0.0224 · CL where CP and CL concentrationsare expressed in g/kg DM (Menke et al., 1979). The estimatedME concentration of each diet (eME, MJ/kg DM) was

Nutritional and ecological evaluation of dairy farming systems based on concentrate feeding regimes 45
calculated according to the formula: eME= (�0.9 + 0.17 ·eOMD%) · eOMI (Aiple et al., 1992) where the eOMI is theestimated organic matter intake in kg. Results of mME and
eME intakes (MJ/d) are presented in Table 4.The ME requirements were calculated as the sum of ME for
lactation (MEl), maintenance (MEm) and pregnancy (MEp) as
follows: MEl (MJ/d) = LE/0.6, where LE is energy in milk(MJ/kg milk) calculated according to the formula:LE = 0.38 · %fat + 0.21 · %protein + 0.95 GfE (2001).
MEm (MJ/d) = 0.49 · LW (kg)0.75 where LW is live weightin kg. It was further assumed that MEp is equivalent to the en-ergy requirement for two kg of milk.
2.3.3. Calculation of CP and uCP supply and requirements
Concentrations of rumen degradable crude protein (RDCP)and rumen undegradable crude protein (RUCP) in feeds weretaken from the feed tables of DLG (1997). The concentration
of utilizable CP at the duodenum was calculated according tothe formula (uCP, g/kg) = (187.7�(115.4 · (RUCP/CP)) ·DOM + 1.03 · RUCP) (GfE, 2001), where the intake of CP
and RUCP is expressed in g/kg DM, and the DOM inpercentage.
2.3.4. Calculation of Ca and P requirement, N and P use
efficiencies
In order to evaluate Ca and P intakes of the cows, the dailyrequirements (g/d) were calculated according to NRC (2001)using formulas as follows: Ca requirement = (0.0154 · LW+
1.22 · ECM)/0.38 and P requirement = (0.0143 · LW+0.99 · ECM)/0.50, while phosphorus efficiency was calculatedas P-eff (%) = 100 · (milk P/intake P) where milk P (g/d) was
calculated as milk yield (kg) · 0.9 (Wu et al., 2000). N use effi-ciency was calculated as N-eff (%) = 100 · (milk N/intake N).Ruminal nitrogen balance (RNB, g/kg DM) was calculatedaccording to the formula RNB = ((CP g/kg DM –uCP
g/kg DM)/6.25) (GfE, 2001).
1 To check the plausibility of the VS value, the daily VS excretion
was calculated according to IPCC (2006) using the formula:
VS = [(GE · (1�DE%/100) + (UE · GE)] · [(1�ASH/18.45)],
where: VS = volatile solid excretion per day on a dry-organic matter
basis, kg VS/d. GE = gross energy intake MJ/d. GE was determined
in the current study using bomb calorimetric method (Parr Inc., USA).
DE%= energy digestibility of the feed. (UE · GE) = urinary energy
expressed as fraction of GE. Typically 0.04 GE can be considered
urinary energy excretion by most ruminants. ASH= the ash content
of manure determined in our study (Table 4). The results showed that
average VS in all farms was 1.92 kg/d, therefore, the IPCC value of the
VS can be accepted.
2.4. Estimation of greenhouse gas emissions (GHGs)
The scope of the partial life cycle assessment (LCA) approachused to quantify GHGs includes the entire production pro-cess of raw milk considering direct and indirect emissions.The direct emissions include all emissions which originate
at the farm level. Indirect emissions include emissions fromthe production of intermediate products such as fertilisersor concentrates as well as emissions from the production of
farm assets (e.g. buildings and machineries). Emissions fromdeforestation and other land use changes are not includedin the calculations. The Greenhouse gas emissions (CH4,
N2O and direct and indirect CO2) from each farm were cal-culated using feed intake and composition, manure nitrogenand data related to the use of fuel, electricity, chemicals (hy-
giene and cleaning materials) and purchased feed used on thefarm. Farm data were introduced to the TIPICAL (Technol-ogy Impact Policy Impact Calculations) model. The modelwas developed by Hemme (2000) and has been refined to suit
its applicability on a global scale. The TIPICAL model is acalculation and accounting model. The model was recentlyfurther developed and includes sub-modules for analysis on
feeding systems, carbon footprints, water consumption,
economic risk exposure and milk quality issues (Hemme,2010).
2.4.1. Methane emissions
The enteric CH4 (MJ/d) emissions were calculated accordingto the formula: CH4 = 3.41 + 0.52 · DMI (kg/d) �0.996 ·ADF (kg/d) + 1.15 · NDF (kg/d) (Ellis et al., 2007). This for-
mula was selected because the level of CH4 emissions causedby fermentation in the rumen depends mainly on the composi-tion and quantity of the diet (IPCC, 1996), which were known
in the present study. Furthermore, it has a low root meansquare prediction error (RMSPE) compared to other equa-tions published in that study. CH4 energy was converted to
mass value using the conversion factor of 0.02 kg/MJ(Brouwer, 1965).
CH4 (g/d) emissions of calves and heifers were calculated
according to the formula: CH4 = 55 + 1.2 · LW (kg)0.75
(Kirchgessner et al., 1991). Live weights of heifers were esti-mated according to age classes (i.e., 0–12, 12–24 and>24 month) Kirchgessner et al. (1991).
CH4 emissions from manure were calculated according tothe formula EF = VS · Bo · 0.67 kg/m3 · MCF · MS%,(IPCC, 1996). Where EF: CH4 emission (g/d); VS1: volatile sol-
ids excreted by animal and assumed to be 1.9 kg/cow/d accord-ing to IPCC (1996). The maximum CH4 production capacitythat can be produced from a given quantity of manure (Bo)
was assumed to be 0.13 m3 CH4/kg VS. CH4 volume was con-verted to mass by using the conversion factor of 0.67 m3/kg.MCF: methane conversion factors for each manure manage-
ment system for the respective climate region. The MCF de-fines the portion of the methane producing potential that isachieved depending on the manure management system andwas assumed here to be 0.33. MS%: manure production sys-
tem in climate region (assumed to be one). The animal manuremanagement system is considered as drylot where animalswere kept on unpaved feedlot and the manure is allowed to
dry until it is periodically removed which is the case in Jorda-nian dairy farms.
2.4.2. Nitrous oxide emissions
Table 2 shows the emission factors used to calculate the direct(on-farm) N2O emission which was caused by fuel use, and bymanure production. Indirect N2O emissions from the produc-
tion of the fertilisers used for purchased feed production werecalculated by multiplying the usage of N nutrients by the N2Oemissions factor of 0.012 kg N2O/kg N (Simon, 1998).
N2O emission losses from manure were calculated from Nexcretion of cows, calves and heifers multiplied by a N2O emis-sion factor of 0.02 kg of N2O/kg N excreted (IPCC, 2001).

Table 2 Factors used to calculate GHGs emission from dairy farms.
Item Emission factor Source
CH4 to CO2 equ 25 IPCC (2007)
N2O to CO2 equ 298 IPCC (2007)aManure N2O (kg/kg N) 0.02 IPCC (2001)
Purchased feed N2O (kg/kg N) 0.012 Simon (1998)bFuel N2O (g/l) 0.007 Audsley et al. (2003)
Diesel (g CO2/l) 2950 Audsley et al. (2003)
Electricity (g CO2/kWh) 202 FAO (2010)
Wheat (g CO2/kg) 231 IPCC (2001)
Soybean meal(g CO2/kg) 224 Nagy (1999)
Mineral and vitamin premix (g CO2/kg) 111 Nagy (1999)cBedding material (g CO2/kg) 0.05
Dairy chemicals (g CO2/kg) 0.1
Vehicles (kg CO2/kg) 5.9 Oko-Institute, downloaded from
Implements (kg CO2/kg) 5.1 Umweltbundesamt (2010)
Buildings (kg CO2/m2) 132.4
Emission from dairy chemicals = the usage in kg/year multiplied by 0.1 g CO2/kg.
Quantities of fuel, dairy chemicals as well as data on vehicles and bedding materials were collected from the farms.
The CO2 emissions from concentrate feed were calculated assuming that the concentrate feed used on a farm contains 67% carbohydrate.
Sources (e.g. wheat), 30% protein sources (e.g. soybean meal) and 3% minerals and vitamins.a The N2O emission losses from manure = nitrogen excretion of cows in kg/year multiplied by an emission factor of 0.02 for drylot waste
management systems dominant in Jordanian dairy farms.b N2O emissions of fuel combustion = diesel fuel usage in kg multiplied by the N2O emission factor of 0.007 g N2O/L.c CO2 Emission from bedding materials = usage of bedding material in kg/year multiplied by 0.05 g CO2/kg.
46 O. Alqaisi et al.
Manure N excretion of cows was obtained from the currentstudy. N excretion of calves and heifers was assumed based on
age clusters and according to Kirchgessner et al. (1991).Animals between the ages of 2 and 12 months were assumedto excrete 22 kg N/ year and those between 12 and 24 months,
47 kg N/year.
2.4.3. Carbon dioxide emissions
The sources used to calculate CO2 emissions in dairy farms
(respiratory CO2 was not included in the calculations) are fuelcombustion, concentrate production, pesticides, machineries,buildings and other assets and input stuff e.g. bedding material
and dairy chemicals. Table 2 shows the emission factors usedfor the calculations as follows: Farm assets were clustered intovehicles, implements, buildings and fences. In order to calcu-late the emissions from vehicles and implements, factors con-
verting their weight into emissions were applied (Table 2).The indirect emissions of assets were divided by the expectedworking life which was assumed to be 10 years for vehicles
and implements and 25 years for buildings. The CO2 emissionsfrom concentrate feed were calculated assuming that the con-centrate feed used on a farm contains 67% carbohydrate
sources (e.g. wheat), 30% protein sources (e.g. soybean meal)and 3% minerals and vitamins which fit to the typical rationdominant in the farms.
2 One livestock unit (LU) = 650 kg live weight (Kirchgessner et al.,
1991).
2.4.4. GHG credit
GHG credit is an allocation of emissions to co-products ofmilk production. These can include meat, manure, animaldraught power and capital functions. In the current study only
beef credits were considered as their method of estimation isgenerally accepted (Cederberg and Stadig, 2003; Sevensterand de Jong, 2008) and others are of minor relevance for the
farms in this study. The method applied in this study is the
so-called cause–effect physical (‘biological’) allocation(Cederberg and Stadig, 2003), whereby emission credits for
the beef of culled cows are allocated based on the proportionof 40–60% according to KTBL (2006) which is based on en-ergy intake allocation between beef and milk. This proportion
seems reasonable since milk yield in the studied farms is lowerthan the typical production level in Europe which indicatesthat a higher proportion of GHG is caused by beef production,
compared to the allocation factors used in Europe. It is furtherassumed that male calves are sold at the age of 2 weeks.
For computation of the beef credit, all animals of a farm(cows, heifers and female calves) are first converted via their
live weight into livestock units (LU)2 and the total numberof animals sold (cows, heifers and bull calves) is given in termsof LU. In a second step, farm’s total emissions are divided by
the total LU per farm in order to obtain an estimate of emis-sions per LU. The emission credits for culled cows are thencomputed by multiplying the number of culled cows (in terms
of LU) by the total emission per LU weighted by 40% (alloca-tion factor). Beef credits for culled heifers and bull calves arecomputed by multiplying the animals sold, in terms of LU,by total farm emissions per LU.
3. Results
3.1. Diet composition, energy and nutrient intake of the cows
Table 3 shows the feeds, their chemical composition and the
eDMI of the used feed in each farm. In the large and middlescale farms, quality of concentrate and roughage feed washigher than those in small scale farms.

Table 3 Intake, chemical composition, in vitro gas production and calculated metabolizable energy (ME), net energy for lactation EL), content of digestible organic matter (DOM) of
feed used on the farms.
Farm code Feedstuff eDMIa DM CP RDCP CA CL NDF ADF P Ca n vitro - gas yield ME NEL DOM
kg/d % g/kg DM % of CP g/kg DM g/kg DM g/kg DM g/kg DM g/kg DM g/kg DM l/200 mg DM MJ/kg DM MJ/kg DM g/kg DM
A Concentrate 13.7 93 182 72 54 17 200 60 5.2 4.5 5.1 12.4 7.4 844
Corn silage 2.5 39 77 75 105 15 370 200 1.9 6.3 6.0 7.4 4.4 572
Wheat straw 1.4 93 50 70 115 7 690 420 0.7 3.0 7.4 7.3 4.4 582
Alfalfa hay 1.8 93 160 70 81 15 430 310 2.7 12.4 2.8 8.9 5.4 654
B Concentrate 13.4 89 160 72 60 22 160 60 6.0 5.5 2.6 12.0 7.2 817
Alfalfa hay 2.7 93 140 70 110 22 490 320 3.5 5.8 0.0 8.6 5.2 643
Wheat straw 2.6 92 45 70 85 7 610 420 0.7 2.8 6.2 5.5 3.3 458
C Concentrate 13.2 88 169 72 75 24 250 50 5.0 7.5 6.7 12.7 7.6 866
Wheat straw 1.7 93 40 70 93 5 620 420 2.2 5.4 7.7 5.7 3.4 475
Whole-plant corn fresh 1.5 29 140 75 83 19 560 280 4.0 2.1 8.5 11.2 6.7 785
Alfalfa hay 1.4 93 139 70 99 21 370 250 2.8 11.2 5.2 9.3 5.6 678
D Concentrate 13.5 90 140 72 72 5 190 100 3.9 7.0 6.0 11.9 7.2 843
Wheat straw 1.4 94 32 70 77 7 770 460 0.5 2.1 8.4 5.8 3.5 466
Alfalfa hay 2.7 89 160 70 132 29 490 310 1.9 11.5 3.6 9.4 5.6 697
E Barley 2.0 89 110 70 43 36 190 50 8.1 2.0 9.7 11.5 6.9 754
Wheat bran 8.0 88 160 75 39 34 350 100 3.3 0.9 6.0 11.5 6.9 743
F Concentrate 13.3 89 207 73 69 48 203 71 5.1 6.8 0.4 12.6 7.5 824
Ryegrass fresh 3.3 11 216 70 161 60 453 243 6.0 7.5 9.8 11.4 6.8 793
Wheat straw 1.4 90 42 70 57 27 832 495 0.8 4.5 7.6 7.6 4.6 539
Alfalfa hay 0.9 87 203 70 141 43 418 270 2.2 15.0 5.6 10.3 6.2 737
G Concentrate 12.4 89 200 72 55 40 236 78 5.2 6.4 0.7 12.4 7.5 817
Ryegrass fresh 1.4 10 251 85 151 88 460 235 6.4 6.3 6.0 11.7 7.0 769
Corn silage 1.1 31 79 75 67 56 503 277 2.5 5.0 6.2 9.8 5.9 639
Wheat straw 2.7 89 35 70 68 36 830 470 0.6 3.5 0.7 6.8 4.1 482
H Concentrate 10.6 89 168 72 41 68 255 81 5.4 5.3 6.8 13.7 8.2 845
Fresh alfalfa 2.0 39 187 75 141 43 418 270 2.9 27.5 2.3 9.7 5.8 701
Wheat straw 1.7 85 36 70 80 38 813 455 0.7 4.5 6.0 7.6 4.6 537
I Wheat bran 7.9 87 163 75 45 46 354 110 3.9 1.2 1.5 11.0 6.6 710
Barley 3.6 89 115 70 44 36 204 70 8.3 2.5 8.0 11.3 6.8 745
DOM= 14.88 + 0.889 · gas yield (ml/200 mg) + 0.045 · CP (g/kg DM) + 0.065 · CA (g/kg DM) (Menke and Steingass (1988)).
ME= 1.242 + 0.146 · gas yield (ml/200 mg) + 0.007 · CP (g/kg DM) + 0.0224 · CL (g/kg DM) (Menke et al. (1979)).
NEL= 0.6 · (1 + 0.004 · (9.57)) · ME.
Proportion of RDCP for each feed was taken from feed tables for ruminants (DLG (1997)).a Data represent the farmers estimated amounts of feed offered to animals.
Nutritio
nalandeco
logica
levaluatio
nofdairy
farm
ingsystem
sbased
onconcen
trate
feedingreg
imes
47
(N
I
m
6
3
3
4
6
4
2
6
2
5
4
6
2
4
5
5
6
4
3
4
6
4
4
3
6
4
3
5
5

Table 4 Energy and nutrient intake and requirement, milk yield and composition, organic matter digestibility, and fecal excretion of
the lactating cows.
Farm A B C D E F G H I Mean
Intake
eDMI (kg/d) 19.3 18.6 17.8 17.6 10.0 18.9 17.6 14.3 11.4 16.2aeOMI (kg/d) 18.0 17.3 16.4 16.1 9.6 17.2 16.5 13.5 10.9 15.0beDOMI (kg/d) 14.9 13.8 14.3 13.9 7.5 15.0 13.2 11.3 8.2 12.5
CP (g/d) 3030 2639 2697 2362 1500 3707 3023 2211 1690 2540
RDCP (g/d) 2180 1890 1943 1691 1114 2785 2224 1601 1247 1852
RUCP (g/d) 849 749 754 671 386 922 799 609 460 688
NDF (g/d) 5433 5012 5706 4992 3180 5699 6357 4920 3505 4978
ADF (g/d) 2420 2656 2186 2849 892 2654 2867 2167 1115 2201
P (g/d) 81 91 89 59 43 91 77 64 60 73
Ca (g/d) 103 96 127 128 12 134 103 118 19 93
MEI (MJ/d)
eME intake 206 200 190 185 109 203 200 147 123 174cmME intake 214 197 207 194 115 225 200 178 126 184dME balance 11 5 23 18 -14 14 19 30 5 12
Milk yield and composition
Milk yield (kg/d) 25 23 22 20 11 25 22 15 10 19
Energy corrected milk (kg/d) 25 23 21 20 12 27 21 15 11 19
Milk protein (%) 3.4 3.4 3.3 3.4 3.4 3.5 3.3 3.2 3.3 3.4
Milk fat (%) 3.2 3.6 3.1 3.3 4.1 3.7 3.1 3.3 3.6 3.4
MUN (mg/dl) 30 28 32 36 34 15 19 18 10 25
OMD (%)
mOMD 77 74 81 79 75 79 75 79 72 77eeOMD 73 73 74 73 72 75 77 69 72 73
Fecal
DM (%) 21 17 15 18 21 17 16 19 17 18
Ash (kg/kg DM) 124 179 141 179 190 130 150 80 81 139
CP, (g/kg OM) 178 186 188 180 176 203 236 155 171 186fFecal DM (kg/d) 3.5 4.3 2.4 2.7 2.5 2.6 3.8 2.4 2.9 3.0
Predicted DMI and energy and nutrient requirementsgDMI1 (kg/d) 19.5 18.7 18.4 17.6 14.0 20.1 18.0 15.8 13.5 17.3
DMI2 (kg/d) 17.5 16.8 16.7 15.9 12.5 18.0 16.1 14.3 12.2 15.6
uCP (g/d) 3192 2905 3006 2844 1575 3333 2903 2386 1752 2655
RDCP (g/d) 2297 2081 2165 2036 1170 2504 2136 1728 1293 1934
RUCP (g/d) 895 824 841 808 405 829 767 658 459 721
ME (MJ/d) 196 187 178 171 123 205 176 142 116 166
P (g/d) 65 62 59 56 37 70 57 45 35 54
Ca (g/d) 102 97 92 87 58 110 90 70 54 84
a eOMI: estimated organic matter intake.b eDOMI: estimated digestible organic matter intake.c For each feed, the mME, MJ/kg DM was calculated according to the formula mME= 1.242 + 0.146 · gas yield (ml/200 mg) + 0.007 · CP
(g/kg DM) + 0.0224 · CL (g/kg DM) (Menke et al., 1979).d Calculated from the mME according to the equation: ME balance = mME intake �MEl –MEm �MEp, assuming requirement equivalent
of 2 kg of milk for pregnancy.e eOMD= 79.76–107.7e(�0.01515 · FCP) (Lukas et al., 2005), FCP = Fecal crude protein expressed in g/kg OM. MEm= 0.49 · LW0.75.
RNB g/kg DM= ((CP g/kg DM � uCP g/kg DM)/6.25) (GfE, 2001).f Based on eDMI and mOMD.g DMI1 calculated according to NRC (2001), DMI2 calculated according to Fox et al. (2003).
48 O. Alqaisi et al.
CP content in concentrate feeds varied between farms indifferent regions and was the highest in farms A and F with
182 and 207 g/kg DM and the ME content ranged between11.9 and 13.7 MJ/kg DM in farm D and C, respectively.Similarly, CP in Alfalfa hay varied between 160 and 203 g/kg
DM with ME contents ranging between 8.6 MJ/kg DM and10.3 MJ/kg DM and its DOM content ranged between 643and 737 g/kg DM. Corn silage was offered on farms A and
G with ME contents of 7.4 and 9.8 MJ/kg DM, respectively.
CP concentration in wheat straw was in the range of 30–50 g/kg DM and ME varied between 5.5 and 7.6 MJ/kg DM.
It was offered in most of the farms and possessed low DOMcontent with a range between 450 and 600 g/kg DM. Feedsin small scale farms E and I possessed lower CP and ME than
concentrate feeds in other farm types. The eDMI was a resultof farmers interview, therefore; to assess the accuracy ofeDMI, two prediction (DMI1 and DMI2) formulas were used
(Table 4) and compared with eDMI.
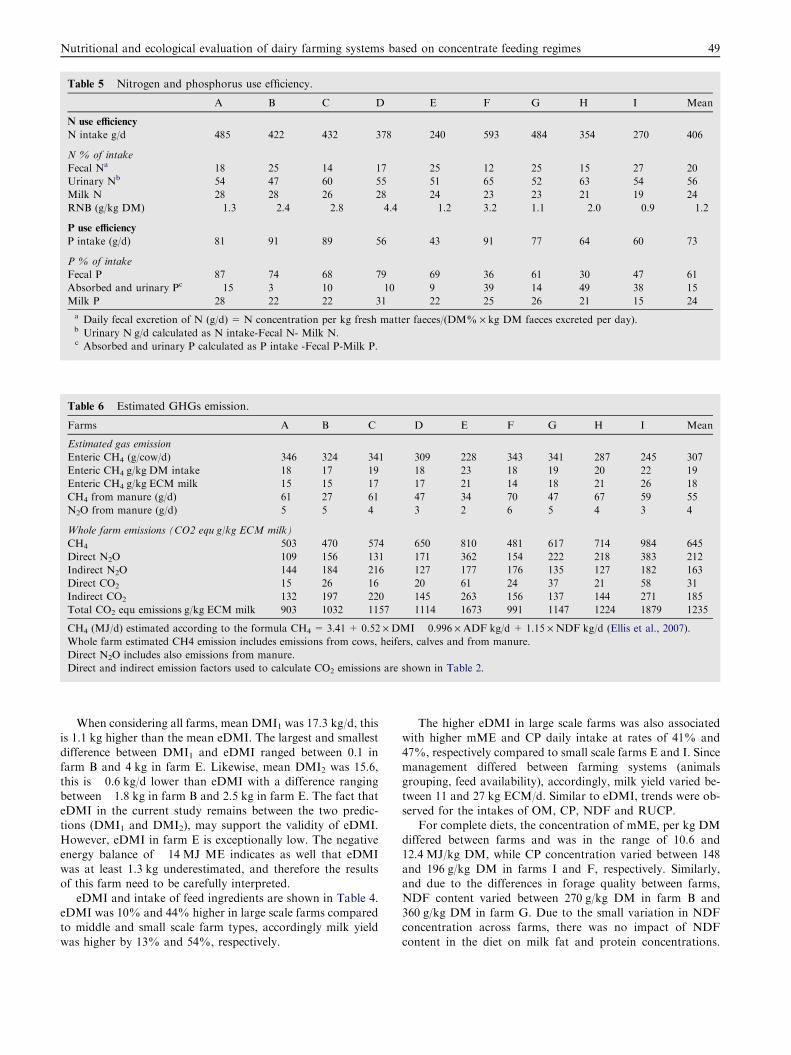
Table 5 Nitrogen and phosphorus use efficiency.
A B C D E F G H I Mean
N use efficiency
N intake g/d 485 422 432 378 240 593 484 354 270 406
N % of intake
Fecal Na 18 25 14 17 25 12 25 15 27 20
Urinary Nb 54 47 60 55 51 65 52 63 54 56
Milk N 28 28 26 28 24 23 23 21 19 24
RNB (g/kg DM) �1.3 �2.4 �2.8 �4.4 �1.2 3.2 1.1 �2.0 �0.9 �1.2
P use efficiency
P intake (g/d) 81 91 89 56 43 91 77 64 60 73
P % of intake
Fecal P 87 74 68 79 69 36 61 30 47 61
Absorbed and urinary Pc �15 3 10 �10 9 39 14 49 38 15
Milk P 28 22 22 31 22 25 26 21 15 24
a Daily fecal excretion of N (g/d) = N concentration per kg fresh matter faeces/(DM% · kg DM faeces excreted per day).b Urinary N g/d calculated as N intake-Fecal N- Milk N.c Absorbed and urinary P calculated as P intake -Fecal P-Milk P.
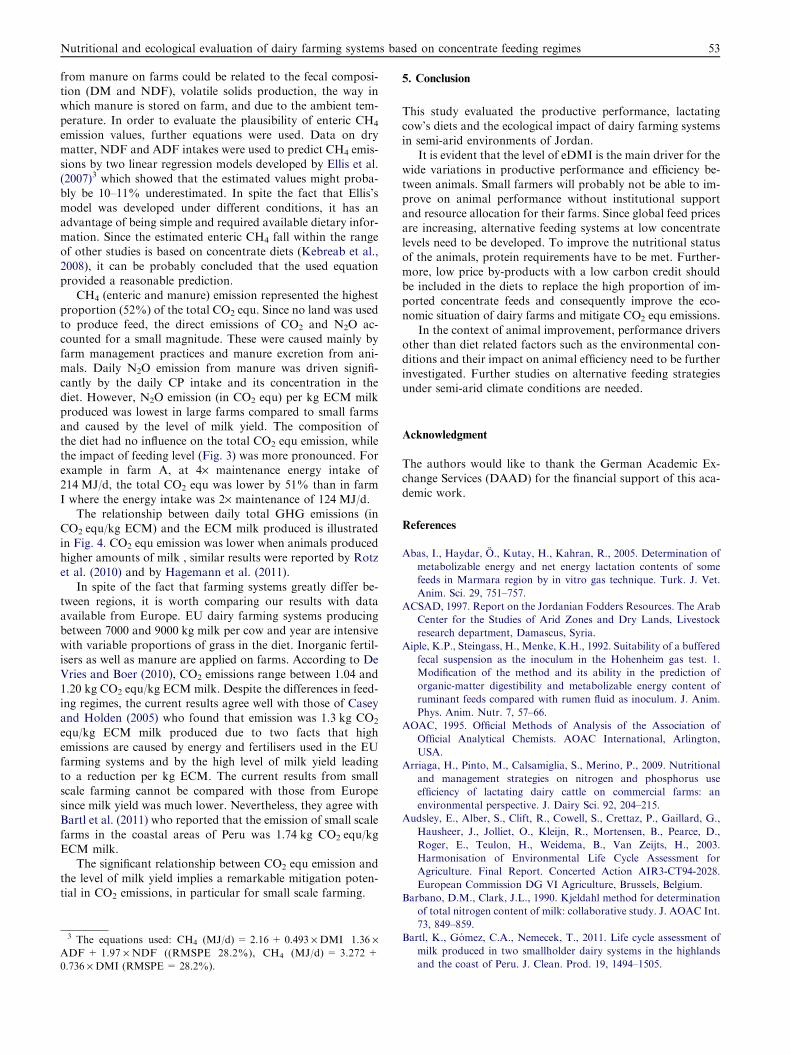
Table 6 Estimated GHGs emission.
Farms A B C D E F G H I Mean
Estimated gas emission
Enteric CH4 (g/cow/d) 346 324 341 309 228 343 341 287 245 307
Enteric CH4 g/kg DM intake 18 17 19 18 23 18 19 20 22 19
Enteric CH4 g/kg ECM milk 15 15 17 17 21 14 18 21 26 18
CH4 from manure (g/d) 61 27 61 47 34 70 47 67 59 55
N2O from manure (g/d) 5 5 4 3 2 6 5 4 3 4
Whole farm emissions (CO2 equ g/kg ECM milk)
CH4 503 470 574 650 810 481 617 714 984 645
Direct N2O 109 156 131 171 362 154 222 218 383 212
Indirect N2O 144 184 216 127 177 176 135 127 182 163
Direct CO2 15 26 16 20 61 24 37 21 58 31
Indirect CO2 132 197 220 145 263 156 137 144 271 185
Total CO2 equ emissions g/kg ECM milk 903 1032 1157 1114 1673 991 1147 1224 1879 1235
CH4 (MJ/d) estimated according to the formula CH4 = 3.41 + 0.52 · DMI � 0.996 · ADF kg/d + 1.15 · NDF kg/d (Ellis et al., 2007).
Whole farm estimated CH4 emission includes emissions from cows, heifers, calves and from manure.
Direct N2O includes also emissions from manure.
Direct and indirect emission factors used to calculate CO2 emissions are shown in Table 2.
Nutritional and ecological evaluation of dairy farming systems based on concentrate feeding regimes 49
When considering all farms, mean DMI1 was 17.3 kg/d, thisis 1.1 kg higher than the mean eDMI. The largest and smallest
difference between DMI1 and eDMI ranged between 0.1 infarm B and 4 kg in farm E. Likewise, mean DMI2 was 15.6,this is �0.6 kg/d lower than eDMI with a difference ranging
between �1.8 kg in farm B and 2.5 kg in farm E. The fact thateDMI in the current study remains between the two predic-tions (DMI1 and DMI2), may support the validity of eDMI.
However, eDMI in farm E is exceptionally low. The negativeenergy balance of �14 MJ ME indicates as well that eDMIwas at least 1.3 kg underestimated, and therefore the resultsof this farm need to be carefully interpreted.
eDMI and intake of feed ingredients are shown in Table 4.eDMI was 10% and 44% higher in large scale farms comparedto middle and small scale farm types, accordingly milk yield
was higher by 13% and 54%, respectively.
The higher eDMI in large scale farms was also associatedwith higher mME and CP daily intake at rates of 41% and
47%, respectively compared to small scale farms E and I. Sincemanagement differed between farming systems (animalsgrouping, feed availability), accordingly, milk yield varied be-
tween 11 and 27 kg ECM/d. Similar to eDMI, trends were ob-served for the intakes of OM, CP, NDF and RUCP.
For complete diets, the concentration of mME, per kg DM
differed between farms and was in the range of 10.6 and12.4 MJ/kg DM, while CP concentration varied between 148and 196 g/kg DM in farms I and F, respectively. Similarly,and due to the differences in forage quality between farms,
NDF content varied between 270 g/kg DM in farm B and360 g/kg DM in farm G. Due to the small variation in NDFconcentration across farms, there was no impact of NDF
content in the diet on milk fat and protein concentrations.

y = -89x + 2673R² = 0.88
0
200
400
600
800
1000
1200
1400
1600
1800
2000
0 5 10 15 20 25
g C
O2/
kg E
CM
milk
eDMI kg/d
Figure 3 Relationship between CO2 equ emission and daily
eDMI intake.
y = 3.51x2 - 180x + 3307R² = 0.93
0
200
400
600
800
1000
1200
1400
1600
1800
2000
0 5 10 15 20 25 30
g C
O2
/kg
EC
M m
ilk
Milk yield kg ECM/d
Figure 4 Relationship between CO2 equ emission and daily
ECM milk yield.
50 O. Alqaisi et al.
Likewise, the concentration of mME and CP of feed had noeffect on milk yield and composition.
CP intake was lower than the requirements in seven farms;three farms (B–D) had a deficiency level of more than 10%,while four farms with slight deficiency level ranged between
4% and 9%. For all farms, mean CP intake was with 115 g(or 4%) lower than the requirements, however varied betweenan oversupply of 11% in farm F and a deficit of 17% in farmD. Likewise, RUCP intake was lower than the requirements in
six farms. Three farms (B–D) had a deficiency level of morethan 10%, while in three farms was between 5% and 8% belowthe requirements. Although CP was in deficit in several farms,
MUN was unexpectedly not depressed and varied between 15and 36 mg/dl.
MUN was higher in summer time (in farms A–E) compared
to the spring time (F–I). The average MUN in the current
study was 25 mg/dl, with an average RNB of �1.2 g/kg DM,while average CP intake was 157 g/kg DM. The daily CP in-take differed between farms and accordingly the RNB ranged
between 3.2 g/kg DM in farm F and �4.4 g/kg DM in farm D.In general, RNB was negative in all farms except in farms Fand G.
mME intakes were similar to the requirements in all farmsexcept in farm E where the intake was 7% lower than therequirements, and consequently ME balance was negative for
this farm.There was wide variation in mOMD between farms; it ran-
ged between 72% in farm I and 81% in farm C, with an aver-age of 77% for all farms. The eOMD results (Table 4) were
lower than the mOMD and ranged between 77% in farm Gand 69% in farm H with a mean of 73% for all farms. A meandifference between mOMD and eOMD of 4% was observed.
The eME intake was the lowest in farm E (109 MJ/d) andthe highest in farm A (206 MJ/d). Considering all farms, themean difference between eME and mME was 10 MJ/d with
higher values observed for the mME.P intake was above the requirements in all farms with a
range of 5% in farm D and 71% in farm I in relation to the
requirements. In average, P intake was 35% above than therequirements. Deficiency in Ca intake was observed in smallscale farms E and I. A deficiency of 79% in farm E and a sur-plus of 69% in farm H were notified in relation to the require-
ments. For all farms, mean Ca intake was 11% above therequirements.
3.2. Nitrogen and phosphorus balance
N and P balances of animals in the studied farms are displayedin Table 5. The intake of N was mainly driven by the level of
eDMI and varied between a low intake of 240 g/d in farm Eand a high intake of 485 g/d in farm A with a mean of406 g/d for all farms. In percentage terms, at higher levels of
eDMI the proportion of fecal N was lower. The N-eff rangedbetween low (19%) in farm I and high efficiency (28%) in farmA, with an average of 24% for all farms. Furthermore, due tothe high eDMI in high yielding cows, a higher proportion of N
was secreted in milk and consequently N-eff was higher. Simi-larly, the P-eff improved at higher eDMI levels, accordingly;P-eff (average 24%) ranged between 15% in farm I and 31%
in farm D. The results show that 61% of P intake was excretedin the faeces with a range between 30% in farm H and 87% infarm A.
3.3. GHG emissions
Table 6 shows the estimated GHGs emission per cow and per
kg ECM produced in different farm types. The daily entericCH4 emission was significantly driven by the level of eDMI,accordingly, emissions per cow were the highest in farm Aand F and were 31% higher than those in farms E and I.
Depending on the level of milk yield, CH4 emission per kgECM produced was the lowest in farm F of 14 g/kg ECM com-pared to 26 g/kg ECM in farm I.
In order to find out the main drivers for emissions per kgECM milk produced, the relationship between both eDMIand ECM milk and the total GHG emissions (in CO2 equ)
were evaluated. Fig. 3 illustrates the relationship between the

Nutritional and ecological evaluation of dairy farming systems based on concentrate feeding regimes 51
total CO2 equ and the eDMI described by the following func-tion (y = �89x + 2673. with R2 = 0.88 and SE = 120),where y represents the CO2 equ (g/kg ECM) and x is the eDMI
(kg/d). The effect of the daily ECMmilk on CO2 equ was morepronounced than that of eDMI. Furthermore, the relationshipbetween CO2 equ and ECM milk yield is illustrated in Fig. 4
which resulted in the following function (y = 3.51x2
�180x + 3307. with R2 = 0.93 and SE = 125) where y repre-sents CO2 equ per kg ECM and x is the milk yield in ECM (kg/
d). For both regression equations all coefficients were highlysignificant (p-value <0.001).
CH4 (enteric and manure) represented 52% of total GHGemissions (in CO2 equ). In general, per kg of milk, high yield-
ing cows in farms A and F emitted lower CO2 equ (20% and88% in relative terms) compared to middle and small scalefarm types.
4. Discussions
4.1. Energy and nutrient supply and requirement of the cows
Mean values for the chemical composition of concentrates, al-
falfa hay, wheat bran, wheat straw feed used on farms (Table 3)were similar to those reported in other studies (Seker, 2002;Iantcheva et al., 1999; NRC, 2001; Abas et al., 2005). Using
similar feed on dairy farms indicates that the opportunity fordairy farmers to choose different feed types was limited. Thisusually depends on farm location, feed availability in the mar-
ket and their prices, for example feeding ryegrass was accessi-ble only in two farms located near a plant productionenterprise.
The eDMI in the current study represents the average
amount of feed offered to the lactating cows during the studyperiod and not precisely what the animals have ingested.Accordingly, there could be a small discrepancy in the daily in-
take of ingredients provided in Tables 3 and 4, particularly infarm E where eDMI obviously seems to be underestimated.Since it was not possible to precisely measure DMI, the dis-
crepancy in the ingredients intake could not be avoided. How-ever, since eDMI on other farms ranged between two DMIpredictions, this might support the plausibility of the estimatedDMI used in this study.
The variations in milk yield across farms were mainlycaused by the differences in eDMI (Table 4). In large and mid-dle scale farm types, dairy farmers improved feed management
by means of inclusion of high quality and quantity of concen-trate and forage feed compared to small scale farms. On smallscale farms, feed availability was limited and farmers could not
afford additional quantities due to economic reasons. Therewas no relationship between milk fat percentage and eitherNDF or ADF concentration in the diet. Average NDF content
in the current study was 30%, which is lower than the standardrequirements (34% NDF) when the diet is based on barleygrains (Beauchemin, 1991). The current results of NDF per-cent and the associated milk fat are similar to those reported
by Mustafa et al. (2000).Furthermore, a large proportion of NDF was provided by
non-forage sources which are less effective in maintaining milk
fat percentage. According to the NRC (2001), 16% NDF inthe diet should originate from forage. This was not attainedin the studied farms. Likewise, the dietary concentration of
physically effective NDF (peNDF) was below the require-ments (20% of the diet) due to the high proportion of concen-trate intake, consequently, one would speculate that ruminal
pH is reduced (Zebeli et al., 2008) and has affected the milkfat percentage. The small proportion of forage in diets is dueto the fact that the transportation costs for forage feeds are
high due to their bulky structure. Dairy farmers prefer to im-port high density concentrate feeds which require less spaceduring transportation from overseas. Furthermore, forages
are not available year round in the neighbouring countrieswhich eliminate the use of fibre in the animal’s diet from im-ported sources.
Since availability of forage is a main constraint for dairy
farmers to improve diet structure, alternatively, they may needto utilize available by-products which are rich in physicallyeffective fibres such as barley and wheat straws.
Milk protein percentage was not influenced by the level ofmME intake across the studied farms. This could be attributedto the dilution of milk protein percentage caused by the in-
crease in milk yield. At higher energy supply, microbial proteinsynthesis increased (Mackle et al., 2000) and consequently hasaffected the total milk protein yield, however not protein per-
centage, since milk yield has increased too as response to high-er energy supply. Furthermore, a large quantity of starch wasavailable in the rumen and in the intestine that has providedmore propionate for glucose synthesis and more glucose for
absorption in the intestine (Yang and Beauchemin, 2007)which caused an increase in milk yield.
Comparing CP intakes with CP requirements, a remarkable
deficiency occurred in three farms which could have affectedthe productive performance of the animals.
When comparing farms at similar eDMI, N-eff of animals
with high ME/CP ratio in farm A was improved and onewould speculate that the presence of more available energyin the rumen captures ruminal ammonia which has provided
microbial growth and outflow from the rumen compared tofarm F with a lower ME/CP ratio.
Average RUCP was only slightly lower (4%) than therequirements which indicate that RUCP supply was not limit-
ing the productive performance of animals in farms B–D andH. Since CP is provided in a great proportion by an expensivesoybean meal rich in RDCP, alternatively; available by-prod-
ucts rich in RUCP (as % of CP) such as: corn gluten meals(63%) and brewer’s grains (54%) should be considered asalternatives when RUCP is greatly deficient in diets where
CP supply was largely below the requirements, higher CP in-take can be realised by feeding feed with highly degradableCP or by supplementing urea to reduce the gap.
MUN concentrations were within the recommended values
(12–18 mg/dl) in farms F–I which were visited in spring time,but were higher in farms A–E which were visited in summertime irrespective from CP intake and concentration in the diet.
The high values of MUN could be caused in part by the intakeof RUCP above the requirements in farms F and G whichmight have also contributed to an increased urea synthesis
(Nousiainen et al., 2004). The lack of a consistent relationshipbetween MUN and RNB in the current study suggests thatother reasons may have caused an increase in MUN values.
Cows were raised under semi-arid environments with highertemperatures (Fig. 2) than those in moderate climates. Thehigher MUN values in summer time compared to spring timeare confirmed by observations of Mishra et al. (1970) who

52 O. Alqaisi et al.
reported an increase in rumen ammonia and lactic acid levelsin cows in heat stress. It seems evident that MUN values weregreatly influenced by the season, therefore, the average recom-
mended values determined in moderate climate regions seem tobe not valid for hot climatic regions. As a conclusion, MUNcan be used to compare diets within a region and in the same
time. Further research is needed to confirm our results whichneed to consider the physiological changes that might occurin animals raised under hot climatic conditions.
The absolute difference between mOMD and eOMD was4% (Table 4). Several authors have reported differences be-tween both values (Fanchone et al., 2009; Schlecht andSusenbeth, 2006; Lukas et al., 2005). Several factors could
have caused this divergence. The fecal N per unit of OM ex-creted is affected by the ingredients of concentrates (Herrera-Saldana et al., 1990), the proportion of concentrate in the diet
(Lukas et al., 2005), and the level of feeding (Schlecht andSusenbeth, 2006). Furthermore, multiple intakes above themaintenance reduce the digestibility which was reflected in
eOMD, however not the mOMD which is related to feedingat maintenance level. Feeding level between two and four timesabove maintenance which is the case in the studied farms, re-
sults in digestibility reduction of 3–4% (Vandehaar, 1998)which is in good agreement with the difference between bothapproaches. Schlecht and Susenbeth (2006) found that theLukas’s equation overestimates the digestibility of their diets
probably due to higher undigested feed N or endogenous Nlosses. Despite the uncertainty due to the small difference be-tween the two methods, eOMD has an advantage of being less
laborious and expensive than the mOMD method. This meth-od seems, therefore, to be feasible for predicting the OMD oflactating cow’s diets under the Jordanian conditions.
The difference between mME intake and ME requirementsfor lactation, maintenance and reproduction was positive inseveral farms. However, when it was re-calculated from the
eME intake values, the difference between intake and therequirements was reduced, except in farm E where the eDMIwas obviously underestimated. This suggests that the eMEmay provide a more realistic estimate of the actual ME con-
sumed by animals than the mME. The higher energy intakecompared to requirements for maintenance and lactationmight be due to the increasing costs for thermoregulation
and physical activity.Ca intake was deficient in farms I and E by more than 10%
while other farms had a surplus between 22% and 69%. How-
ever, the intake of 12 g/d in farm E is unrealistically low duethe underestimated eDMI. Nevertheless, small farmers claimedthat their animals grazed on a low quality pasture (farmers hadno idea about the grass type) during spring time, and animals
ate the residues of the household food (mixture of tea, peels ofpotato, tomato and beans) as well which did not exceed 1 kgDM/d. Therefore, we speculate that these feeds probably pro-
vided some additional minerals which are not taken into ac-count in Table 4. Since the deficiency was found in smallscale farms, additional supplements of Ca source to the diets
are essential. In contrast to Ca, P intakes were above therequirements between 5% and 71%. Furthermore, since man-ure is frequently sold to other enterprises, this also reduces its
environmental impacts. It seems evident that feed costs can belowered by reducing expensive P supplementation in theconcentrates.
4.2. Efficiency of nitrogen and phosphorus utilization
N-eff was significantly driven by the level of milk yield and cor-related with the level of eDMI (r= 0.88). It is evident that theproportion of maintenance requirement is reduced at high lev-
els of eDMI, allowing more protein to be used for milk pro-duction. N-eff was 19% in low yielding to 28% in highyielding cows. Furthermore, in relative terms, CP requirementsincrease at a lower rate as milk yield increases (NRC, 2001),
thereby improving N-eff for milk production. The effect of die-tary CP and energy content on animal’s N-eff was observed be-tween individual farms. For example, at high ME/CP ratio in
farm D, N-eff was higher than in farm C where the ratio waslower. Although, the adequate energy supply associated withoversupply of CP (the case in farms F and G) resulted in posi-
tive RNB has not improved the N-eff compared to an adequateenergy supply and low CP feeding in farm A. These resultsagree with Wu and Satter (2000) and Kebreab et al. (2001).
Therefore, it seems evident that grouping animals in large scalefarms based on their level of milk production may improveN-eff.
The low P-eff is attributed to the high P supply above the
requirements. At an adequate intake, P-eff is about 33%. Thehigh P content in the diets indicates that the rations were notproperly formulated towards the required levels of minerals.
Since the amount of inorganic P which was added to theconcentrates is unknown, the extent of a possible P reductioncould not be quantified. Compared to the requirements; the
current results suggest that in average 35% of the dietary Pcould be reduced.
4.3. GHG emissions
Emission data for arid and semi-arid regions are very scarce.Therefore, the current results were compared with those fromother regions. Predicted mean enteric CH4 emission for all
farms was 307 g/cow/d. These results were lower than those re-ported by Mills et al. (2003) who found that enteric CH4 emis-sion varied between 323 and 414 g/cow/d which could be
attributed to the differences in the used diets, their composi-tion and the level of eDMI between Mills’s study and the cur-rent study. The high proportion of concentrates and the low
roughage intake might be the main factor. However, whichis of greater importance, emissions per unit of eDMI and milkdecreases with increasing eDMI and milk yield, respectively.
In farms A, B where eDMI was high, CH4 emission varied
between 18 and 17 g/kg DM, while at low eDMI in farms Eand I, CH4 emission was 23 and 22 g/kg DM, respectively,and were similar to those reported by Hindrichsen et al.
(2006) and Holter and Young (1992). The reduced CH4 emis-sion per kg eDMI with increasing feed intake is caused by ahigher passage rate (Yan et al., 2000). Furthermore, a large
proportion of propionic acid was observed at high DMI(Benchaar et al., 2001). Since diets in different farms were sim-ilar in their NDF and ADF contents, diet composition might
have had a small impact on CH4 emission.Mean CH4 emission from manure was estimated at 11% of
total CH4 emissions. Hindrichsen et al. (2005) reported similarproportions of slurry-derived CH4 emissions which varied be-
tween 10% and 27%. The variation between CH4 emissions
Nutritional and ecological evaluation of dairy farming systems based on concentrate feeding regimes 53
from manure on farms could be related to the fecal composi-tion (DM and NDF), volatile solids production, the way inwhich manure is stored on farm, and due to the ambient tem-
perature. In order to evaluate the plausibility of enteric CH4
emission values, further equations were used. Data on drymatter, NDF and ADF intakes were used to predict CH4 emis-
sions by two linear regression models developed by Ellis et al.(2007)3 which showed that the estimated values might proba-bly be 10–11% underestimated. In spite the fact that Ellis’s
model was developed under different conditions, it has anadvantage of being simple and required available dietary infor-mation. Since the estimated enteric CH4 fall within the rangeof other studies is based on concentrate diets (Kebreab et al.,
2008), it can be probably concluded that the used equationprovided a reasonable prediction.
CH4 (enteric and manure) emission represented the highest
proportion (52%) of the total CO2 equ. Since no land was usedto produce feed, the direct emissions of CO2 and N2O ac-counted for a small magnitude. These were caused mainly by
farm management practices and manure excretion from ani-mals. Daily N2O emission from manure was driven signifi-cantly by the daily CP intake and its concentration in the
diet. However, N2O emission (in CO2 equ) per kg ECM milkproduced was lowest in large farms compared to small farmsand caused by the level of milk yield. The composition ofthe diet had no influence on the total CO2 equ emission, while
the impact of feeding level (Fig. 3) was more pronounced. Forexample in farm A, at 4· maintenance energy intake of214 MJ/d, the total CO2 equ was lower by 51% than in farm
I where the energy intake was 2· maintenance of 124 MJ/d.The relationship between daily total GHG emissions (in
CO2 equ/kg ECM) and the ECM milk produced is illustrated
in Fig. 4. CO2 equ emission was lower when animals producedhigher amounts of milk , similar results were reported by Rotzet al. (2010) and by Hagemann et al. (2011).
In spite of the fact that farming systems greatly differ be-tween regions, it is worth comparing our results with dataavailable from Europe. EU dairy farming systems producingbetween 7000 and 9000 kg milk per cow and year are intensive
with variable proportions of grass in the diet. Inorganic fertil-isers as well as manure are applied on farms. According to DeVries and Boer (2010), CO2 emissions range between 1.04 and
1.20 kg CO2 equ/kg ECM milk. Despite the differences in feed-ing regimes, the current results agree well with those of Caseyand Holden (2005) who found that emission was 1.3 kg CO2
equ/kg ECM milk produced due to two facts that highemissions are caused by energy and fertilisers used in the EUfarming systems and by the high level of milk yield leadingto a reduction per kg ECM. The current results from small
scale farming cannot be compared with those from Europesince milk yield was much lower. Nevertheless, they agree withBartl et al. (2011) who reported that the emission of small scale
farms in the coastal areas of Peru was 1.74 kg CO2 equ/kgECM milk.
The significant relationship between CO2 equ emission and
the level of milk yield implies a remarkable mitigation poten-tial in CO2 emissions, in particular for small scale farming.
3 The equations used: CH4 (MJ/d) = 2.16 + 0.493 · DMI�1.36 ·ADF + 1.97 · NDF ((RMSPE 28.2%), CH4 (MJ/d) = 3.272 +
0.736 · DMI (RMSPE= 28.2%).
5. Conclusion
This study evaluated the productive performance, lactatingcow’s diets and the ecological impact of dairy farming systems
in semi-arid environments of Jordan.It is evident that the level of eDMI is the main driver for the
wide variations in productive performance and efficiency be-
tween animals. Small farmers will probably not be able to im-prove on animal performance without institutional supportand resource allocation for their farms. Since global feed pricesare increasing, alternative feeding systems at low concentrate
levels need to be developed. To improve the nutritional statusof the animals, protein requirements have to be met. Further-more, low price by-products with a low carbon credit should
be included in the diets to replace the high proportion of im-ported concentrate feeds and consequently improve the eco-nomic situation of dairy farms and mitigate CO2 equ emissions.
In the context of animal improvement, performance driversother than diet related factors such as the environmental con-ditions and their impact on animal efficiency need to be further
investigated. Further studies on alternative feeding strategiesunder semi-arid climate conditions are needed.
Acknowledgment
The authors would like to thank the German Academic Ex-change Services (DAAD) for the financial support of this aca-
demic work.
References
Abas, I., Haydar, O., Kutay, H., Kahran, R., 2005. Determination of
metabolizable energy and net energy lactation contents of some
feeds in Marmara region by in vitro gas technique. Turk. J. Vet.
Anim. Sci. 29, 751–757.
ACSAD, 1997. Report on the Jordanian Fodders Resources. The Arab
Center for the Studies of Arid Zones and Dry Lands, Livestock
research department, Damascus, Syria.
Aiple, K.P., Steingass, H., Menke, K.H., 1992. Suitability of a buffered
fecal suspension as the inoculum in the Hohenheim gas test. 1.
Modification of the method and its ability in the prediction of
organic-matter digestibility and metabolizable energy content of
ruminant feeds compared with rumen fluid as inoculum. J. Anim.
Phys. Anim. Nutr. 7, 57–66.
AOAC, 1995. Official Methods of Analysis of the Association of
Official Analytical Chemists. AOAC International, Arlington,
USA.
Arriaga, H., Pinto, M., Calsamiglia, S., Merino, P., 2009. Nutritional
and management strategies on nitrogen and phosphorus use
efficiency of lactating dairy cattle on commercial farms: an
environmental perspective. J. Dairy Sci. 92, 204–215.
Audsley, E., Alber, S., Clift, R., Cowell, S., Crettaz, P., Gaillard, G.,
Hausheer, J., Jolliet, O., Kleijn, R., Mortensen, B., Pearce, D.,
Roger, E., Teulon, H., Weidema, B., Van Zeijts, H., 2003.
Harmonisation of Environmental Life Cycle Assessment for
Agriculture. Final Report. Concerted Action AIR3-CT94-2028.
European Commission DG VI Agriculture, Brussels, Belgium.
Barbano, D.M., Clark, J.L., 1990. Kjeldahl method for determination
of total nitrogen content of milk: collaborative study. J. AOAC Int.
73, 849–859.
Bartl, K., Gomez, C.A., Nemecek, T., 2011. Life cycle assessment of
milk produced in two smallholder dairy systems in the highlands
and the coast of Peru. J. Clean. Prod. 19, 1494–1505.

54 O. Alqaisi et al.
Beauchemin, K.A., 1991. Effects of dietary neutral detergent fiber
concentration and alfalfa hay quality on chewing, rumen function,
and milk production of dairy cows. J. Dairy Sci. 74, 3140–3151.
Benchaar, C., Pomar, C., Chiquette, J., 2001. Evaluation of dietary
strategies to reduce methane production in ruminants: a modelling
approach. Can. J. Anim. Sci. 81, 563–574.
Brouwer, E., 1965. Report of subcommittee on constants and factors.
In: Proceeding 3rd Symposium on Energy Metabolism, European
association of animal production publication, Pub. no. 11.
Academic press, London, pp. 441.
Calsamiglia, S., Ferret, A., Reynolds, K., Kristensen, B., van Vuurena,
M., 2010. Strategies for optimizing nitrogen use by ruminants.
Animal 7, 1184–1196.
Casey, J.W., Holden, N.M., 2005. The relationship between green-
house emissions and the intensity of milk production in Ireland. J.
Environ. Qual. 34, 429–436.
Cederberg, C., Stadig, M., 2003. System expansion and allocation in
life cycle assessment of milk and beef production. Int. J. Life Cycle
Ass. 8, 350–356.
De Vries, M., Boer, M., 2010. Comparing environmental impacts for
livestock products: a review of lifecycle assessments. Livest. Sci.
128, 1–11.
DLG, 1997. Futterwerttabellen fur Wiederkauer. DLG-Verlag, Frank-
furt/Main.
Ellis, J.L., Kebreab, E., Odongo, N.E., McBride, B.W., Okine, E.K.,
France, J., 2007. Prediction of methane production from dairy and
beef cattle. J. Dairy Sci. 90, 3456–3467.
Fanchone, A., Archimede, H., Boval, M., 2009. Comparison of fecal
crude protein and fecal near-infrared reflectance spectroscopy to
predict digestibility of fresh grass consumed by sheep. J. Anim. Sci.
87, 236–243.
FAO, 2010. Greenhouse gas emissions from the dairy sector, a life
cycle assessment. Food and Agriculture Organization of the United
Nations, Rome, Italy.
Fox, D.G., Tylutki, T.P., Tedeschi, L.O., Van Amburgh, M.E., Chase,
L.E., Pell, A.N., Overton, T.R., Russell, J.B., 2003. The Net
Carbohydrate and Protein System for Evaluating Herd Nutrition
and Nutrient Excretion: Model Documentation. Animal Science
Department, Cornell University, Ithaca, NY, USA.
Galloway, J.N., 1998. The global nitrogen cycle: changes and
consequences. Environ. Pollut. 102, 15–24.
GFE, 2001. Feeding Recommendations on Energy and Nutrient
Supply for Lactating Cows and Heifers. German Society for
Animal Nutrition and Physiology, Frankfurt, Germany (in
German).
Goering, H.K., Van Soest, P.J., 1970. Forage fiber analysis (apparatus,
reagents, procedures and some applications). In: Agricultural
Handbook, vol. 379. USDA, USA.
Hagemann,M.,Hemme,T.,Ndambi,A.,Alqaisi,O., Sultana,M.N., 2011.
Benchmarking of greenhouse gas emissions of bovine milk production
systems for 38 countries. Anim. Feed Sci. Technol. 166, 46–58.
Hemme, T., 2000. A Concept for International Analysis of the Policy
and Technology Impacts in Agriculture, International Farm
Comparison Network. IFCN Dairy Research Center, Kiel,
Germany.
Hemme, T., 2010. In: Dairy Report. International Farm Comparison
Network. IFCN Dairy Research Center, Kiel, Germany.
Herrera-Saldana, R., Gomez-Alarcon, R., Torabi, M., Huber, J.T.,
1990. Influence of synchronizing protein and starch degradation in
the rumen on nutrient utilization and microbial protein synthesis. J.
Dairy Sci. 73, 142–148.
Hindrichsen, K., Wettstein, H.R., Machmuller, A., Jorg, B., Kreuzer,
M., 2005. Effect of the carbohydrate composition of feed concen-
trates on methane emission from dairy cows and their slurry.
Environ. Monit. Assess. 107, 329–350.
Hindrichsen, K., Wettstein, H.-R., Machmuller, A., Kreuzer, M.,
2006. Methane emission, nutrient degradation and nitrogen turn-
over in dairy cows and their slurry at different milk production
scenarios with and without concentrate supplementation. Agr.
Ecosyst. Environ. 113, 150–161.
Holter, J.B., Young, J., 1992. Methane prediction in dry and lactating
Holstein cows. J. Dairy Sci. 75, 2165–2175.
Iantcheva, N., Steingass, H., Todorov, N., Pavlov, D., 1999. A
comparison of in vitro rumen fluid and enzymatic methods to
predict digestibility and energy value of grass and alfalfa hay.
Anim. Feed Sci. Technol. 81, 333–344.
IISD, International institute for sustainable development, rising
temperatures, rising tensions. Climate change and the risk of violent
conflict in the Middle East. Available from: <http://www.iisd.org/
pdf/2009/rising_temps_middle_east.pdf>, Visited on August, 2011.
IPCC, 1996. Intergovernmental panel on climate change, revised IPCC
guidelines for national greenhouse gas inventories: reference
manual. Available from: <www.ipccnggip. iges.or.jp/public/gl/
invs1.html>.
IPCC, 2001. Intergovernmental Panel on Climate Change, Climate
Change, The Scientific Basis. Cambridge University Press, Cam-
bridge, UK.
IPCC, 2006. Intergovernmental panel on climate change, guidelines for
national greenhouse gas inventories: reference manual. Available
from: <http://www.ipcc-nggip.iges.or.jp/public/2006gl/pdf/4_Vol-
ume4/V4_10_Ch10_Livestock.pdf>.
IPCC, 2007. Intergovernmental Panel on Climate Change. Climate
Change: The Physical Science Basis. Group I Contribution to the
Fourth Assessment Report of the IPCC. Cambridge University,
Cambridge, UK, New York, NY (Pr. pp. 996).
Kebreab, E., France, J., Beever, D.E., Castillo, A.R., 2001. Nitrogen
pollution by dairy cows and its mitigation by dietary manipulation.
Nutr. Cycl. Agroecosys. 60, 275–285.
Kebreab, E., Johnson, K.A., Archibeque, S.L., Pape, D., Wirth, T.,
2008. Model for estimating enteric methane emissions from United
States dairy and feedlot cattle. J. Anim. Sci. 86, 2738–2748.
Kirchgessner, M., Windisch, W., Muller, H., Kreuzer, M., 1991.
Release of methane and of carbon dioxide by dairy cattle. Agri.
Bio. Res. 44, 91–102.
Kuratorium fur Technik und Bauwesen in der Landwirtschaft e.V.,
KTBL (Ed.), 2006. Betriebsplanung Landwirtschaft 2006/2007.
Darmstadt, Germany.
Lukas, M., Sudekum, K.-H., Rave, G., Friedel, K., Susenbeth, A.,
2005. Relationship between fecal crude protein concentration and
diet organic matter digestibility in cattle. J. Anim. Sci. 83, 1332–
1344.
Mackle, T.R., Dwyer, A., Ingvartsen, K.L., Chouinard, Y., Ross,
D.A., Bauman, D.E., 2000. Effects of insulin and postruminal
supply of protein on use of amino acids by the mammary gland for
milk protein synthesis. J. Dairy Sci. 83, 93–105.
Menke, K.H., Steingass, H., 1988. Estimation of the energetic feed
value from chemical analysis and in vitro gas production using
rumen fluid. Anim. Res. Dev. 28, 7–55.
Menke, K.H., Raab, L., Salewski, A., Steingass, H., Fritz, D.,
Schneider, W., 1979. The estimation of the digestibility and
metabolizable energy content of ruminant feedstuffs from the gas
production when they are incubated with rumen liquor. J. Agri. Sci.
93, 217–222.
Mills, J.A.N., Kebreab, E., Yates, C.M., Crompton, L.A., Cammell,
S.B., Dhanoa, M.S., Agnew, R.E., France, J., 2003. Alternative
approaches to predicting methane emissions from dairy cows. J.
Anim. Sci. 81, 3141–3150.
Mishra, M., Martz, F.A., Stanley, R.W., Johnson, H.D., Campbell,
J.R., Hilderbrand, E., 1970. Effect of diet and ambient tempera-
ture-humidity on ruminal pH, oxidation reduction potential,
ammonia and lactic acid in lactating cows. J. Anim. Sci. 30, 1023.
Mustafa, A.F., Christensen, D.A., McKinnon, J.J., 2000. Effects of
pea, barley, and alfalfa silage on ruminal nutrient degradability and
performance of dairy cows. J. Dairy Sci. 83, 2859–2865.
Nagy, C.N., 1999. Energy Coefficients for Agriculture Inputs in
Western Canada. Working Paper Series #2. Saskatoon: Centre for
Nutritional and ecological evaluation of dairy farming systems based on concentrate feeding regimes 55
Studies in Agriculture, Law and the Environment. University of
Saskatchewan, Canada.
Nousiainen, J., Shingfield, K.J., Huhtanen, P., 2004. Evaluation of
milk urea nitrogen as a diagnostic of protein feeding. J. Dairy Sci.
87, 386–398.
NRC, 2001. Nutrient Requirements of Dairy Cattle, seventh ed.
National Research Council, National Academy Press, Washington,
DC.
Østergaard, S., Sorensen, J.T., Houe, H., 2003. A stochastic model
simulating milk fever in a dairy herd. Prev. Vet. Med. 58, 125–143.
Pascual, J.J., Fernandez, C., Dıaz, J.R., Garces, C., Rubert-Aleman,
J., 2000. Voluntary intake and in vivo digestibility of different date-
palm fractions by Murciano-Granadina (Capra hircus). J. Arid
Environ. 45, 183–189.
Rotz, C.A., Montes, F., Chianese, D.S., 2010. The carbon footprint of
dairy production systems through partial life cycle assessment. J.
Dairy Sci. 93, 1266–1282.
Schlecht, E., Susenbeth, A., 2006. Estimating the digestibility of
Sahelian roughages from fecal crude protein concentration of cattle
and small ruminants. J. Anim. Phys. Anim. Nutr. 90, 369–379.
Seker, E., 2002. The determination of the energy values of some
ruminant feeds by using digestibility trial and gas test. Revue de
Med. Vet. 153, 323–328.
Sevenster, M., de Jong, F., 2008. A sustainable dairy sector. In: Global
Regional and Life Cycle Facts and Figures on Greenhouse-gas
Emissions, CE Delft, The Netherland.
Siam, G., 2009. Food Supply Crisis and the Role of Agriculture in the
Middle East & North Africa (MENA) Region. Publications of the
European Institute of the Mediterranean, Panorama (pp. 236–239).
Simon, K.-H., 1998. Hinweise zu den in den Beispielszenarien der
Studie ‘‘Klimarelevanz von Landwirtschaft und Ernahrung’’ ver-
wendeten Kenngroßen, Kassel: Wissenschaftszentrum fur
Umweltsystemforschung.
Umweltbundesamt, Process oriented basic data for environmental
management tools. Berlin, Germany. Available from: <http://
probas.umweltbundesamt.de>, accessed in July 2010.
Van Soest, P.J., Roberston, J.B., Lewis, B.A., 1991. Methods for
dietary fibre, and non starch polysaccharides in relation to animal
nutrition. J. Dairy Sci. 74, 3583–3597.
Vandehaar, M.J., 1998. Efficiency of nutrient use and relationship to
profitability on dairy farms. J. Dairy Sci. 81, 272–282.
World Bank, 2008. Commodity markets review, the development
prospects group, The World Bank.
Wu, Z., Satter, L.D., 2000. Milk production during the complete
lactation of dairy cows fed diets containing different amounts of
protein. J. Dairy Sci. 83, 1042–1051.
Wu, Z., Satter, L.D., Sojo, R., 2000. Milk production, reproductive
performance, and fecal excretion of phosphorus by dairy cows fed
three amounts of phosphorus. J. Dairy Sci. 83, 1028–1041.
Yan, T., Agnew, R.E., Gordon, F.J., Porter, M.G., 2000. Prediction of
methane energy output in dairy and beef cattle offered grass silage-
based diets. Livest. Prod. Sci. 64, 253–263.
Yang, Z., Beauchemin, K., 2007. Altering physically effective fiber
intake through forage proportion and particle length: digestion and
milk production. J. Dairy Sci. 90, 3410–3421.
Zebeli, Q., Dijkstra, J., Tafaj, M., Steingass, H., Ametaj, N.,
Drochner, W., 2008. Modelling the adequacy of dietary fiber in
dairy cows based on the responses of ruminal pH and milk
fat production to composition of the diet. J. Dairy Sci. 91, 2046–
2066.