Embed Size (px)
Citation preview
1
Japan Dairy Farming
Japan Dairy Council
2
Table of contents
1. About dairy cows
・Breed of dairy cows
・Lifecycle
・Structure of the body (Anatomy)
・Mechanism of ruminant and lactation
2. History of dairy farming and milk
・Origin of cattle domestication
・Origin of Japanese dairy farming
・Extension of milk and change of diet
3. Current situation of the Japanese dairy farming
・Japanese dairy farming with the advance of intensification and expansion
・Family run business
・Facilities on the farm
・Dairy farmers’ work
・Cost of milk production
・Environmental conservation and dairy farming
・Comparison with the world
4. Government measures
・Subsidy and production cost
・Planned production of raw milk
5. Supply chain
・Dairy processing plants in Japan
・Distribution of drinking milk and other dairy products
6. Current situation of consumption
・Types of milk
・Consumption of drinking milk and other dairy products
・Trends of milk retail prices
7. Educational dairy farms and their activities

3
4
1. About dairy cows
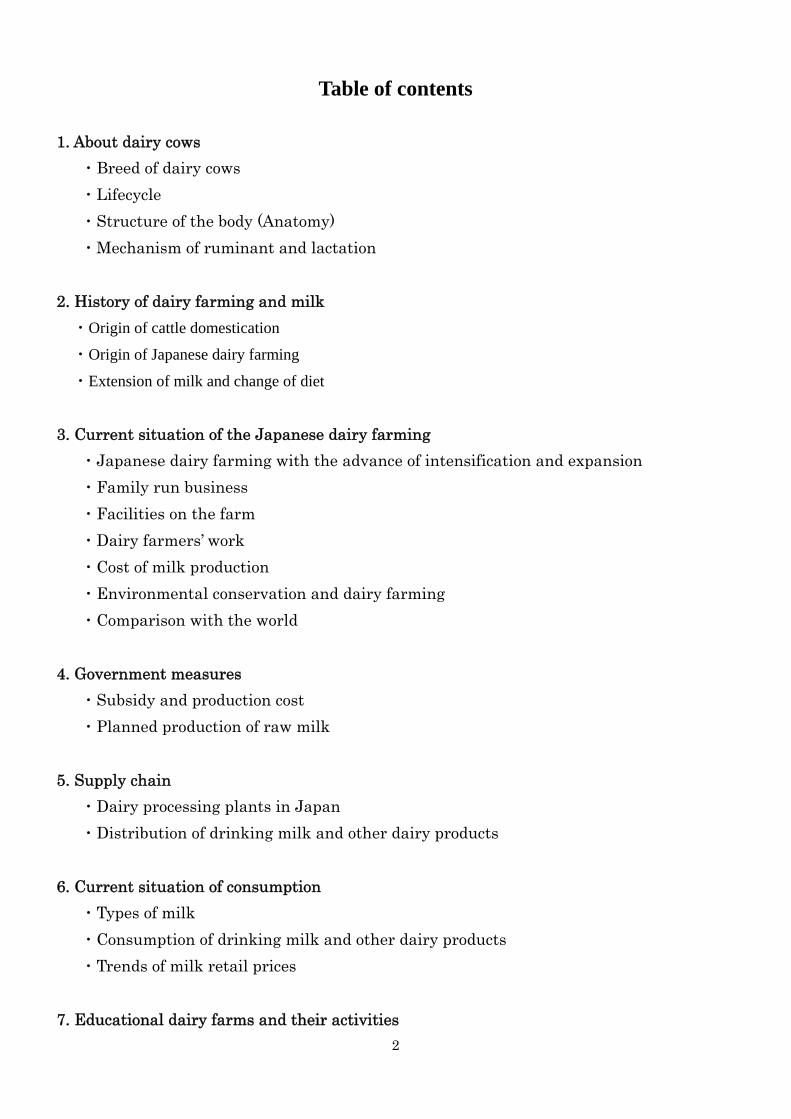
■Breed of dairy cows
Holstein
Holstein is a typical dairy cow, and 99% of dairy cows in Japan are Holsteins.
They are originally from the Netherlands and Holstein region of Germany.
They are big built and have large udder with high production yield of milk.
They are the most common dairy cows in the world. They have mild temper
and good tolerance with cold weather but not good with heat. They are not
only black and white in colour but also brown and white.
Jersey
Jersey is the second popular breed in Japan after Holstein and
originally from Jersey island in the English Channel. They are rather
small and soft brown in colour. Their production yield is not as good as
Holsteins', but milk fat content is higher.
Brown Swiss
Brown Swiss is the third popular breed in Japan and native to
Switzerland. They are famouse Alpine breed with very rich milk
which is suitable for natural cheese. They are large in dark brown to
silvery brown colour and mild in temper.
5
■Lifecycle
From conception to birth (artificial insemination and birth)
Currently, at most Japanese dairy farms artificial insemination (AI) is used for cows’ reproduction.
However, there is no guarantee of conception. Life cannot be created just with human efforts and powers.
After about 10 months in pregnancy, the waters break and delivery starts. More than 90% of calves come
out with their head first. In case of a difficult delivery, a mother receives helps by human’s pulling ropes
tied on calf ’s legs in time with mother’s pushing.
Cow’s birth ends in 30-40 minutes. Mother removes amnion from her calf with her mouth and licks her
calf ’s body with her long tongue. Calf tries to stand up within 30 minutes of being born. How soon they
can get up and start walking, this is an important condition for the animal to determine whether they can
survive or not.
Nursing
Calves are separated from their mothers as soon as they are born, and they are nursed in the barns
dedicated to them. For the first week, they are given mothers’ colostrum. Just like human’s, bovine
colostrum contains plenty of protein and vitamins which are easy to digest as well as components to
prevent them from catching illness (immunity).
Breeding
Calves from the period of weaning (2months old) till the first mating (about 18 months old) are called
breeding cows. Sometimes they are brought up grazing in the designated breeding field in order to gain
healthy and strong body.
Milking
After cows give birth, they start producing milk as mothers do. Cows continue to produce milk for
about 300 days. Milk production yield peaks at around the second and the third month after calving,
and it gradually starts to get reduced.
Dry
After about 280-300 days of lactation, cows stop milk production and have a break for 2-3 months to
prepare for the next calving. They are called dry cows.
12-15 months cycle being repeated 3-4 times
Average life of cows is about 12 years in their natural life, but dairy cows are required to produce a lot of
milk. After repeating 3-4 cycles of 12-15 months period each, they retire from their duty in about 5-6
years and are sold for meat.
6
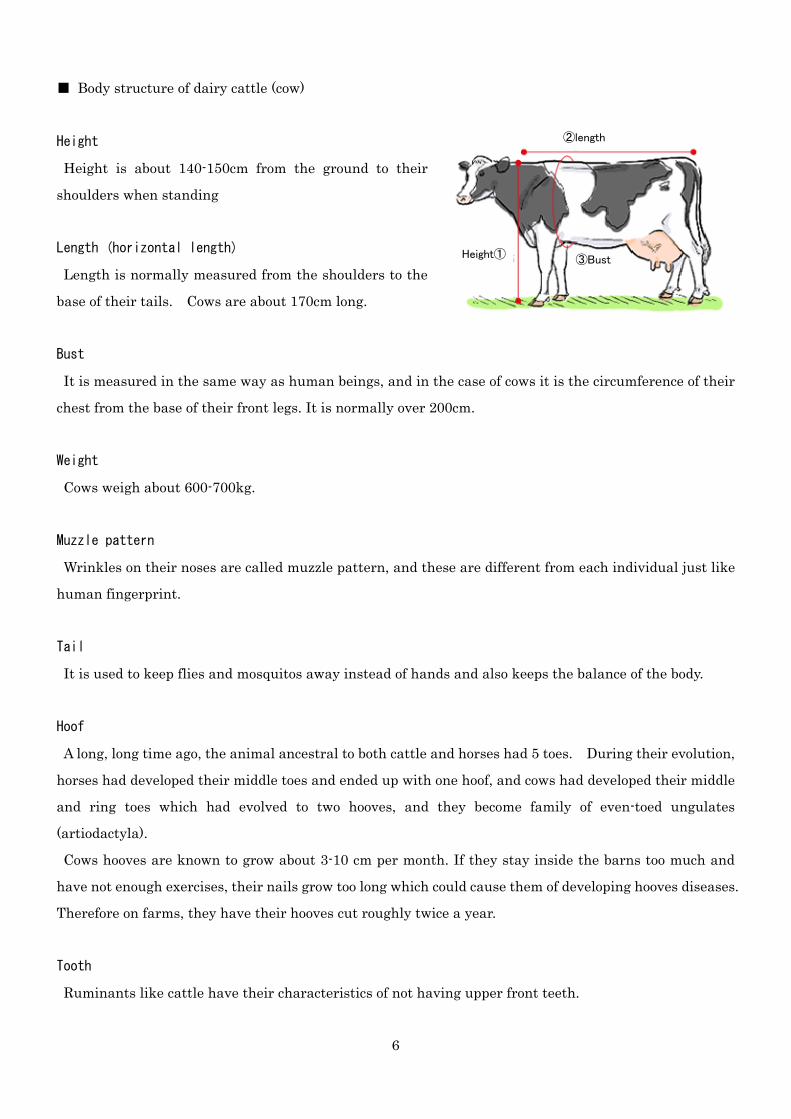
■ Body structure of dairy cattle (cow)
Height
Height is about 140-150cm from the ground to their
shoulders when standing
Length (horizontal length)
Length is normally measured from the shoulders to the
base of their tails. Cows are about 170cm long.
Bust
It is measured in the same way as human beings, and in the case of cows it is the circumference of their
chest from the base of their front legs. It is normally over 200cm.
Weight
Cows weigh about 600-700kg.
Muzzle pattern
Wrinkles on their noses are called muzzle pattern, and these are different from each individual just like
human fingerprint.
Tail
It is used to keep flies and mosquitos away instead of hands and also keeps the balance of the body.
Hoof
A long, long time ago, the animal ancestral to both cattle and horses had 5 toes. During their evolution,
horses had developed their middle toes and ended up with one hoof, and cows had developed their middle
and ring toes which had evolved to two hooves, and they become family of even-toed ungulates
(artiodactyla).
Cows hooves are known to grow about 3-10 cm per month. If they stay inside the barns too much and
have not enough exercises, their nails grow too long which could cause them of developing hooves diseases.
Therefore on farms, they have their hooves cut roughly twice a year.
Tooth
Ruminants like cattle have their characteristics of not having upper front teeth.
②length
Height① ③Bust
7
Spots
Holsteins' spots (patterns on their body) are different on each cow just like human fingerprints and
never change from their birth till their adulthood.
Horns
Their horns are often cut within 3-5 months of their birth in order to prevent them from getting into
fights with other cattle and also to keep their careers’ safety.
Skeleton
Cows’ ribs and bones are projected conveniently to support their big body and firmly developed. Their
hind leg bones (metatarsal) are well developed to support their heavy udder.
Dung and urine
The output of dung is 20-40kg per day, and of urine is 6-12 litres per day.
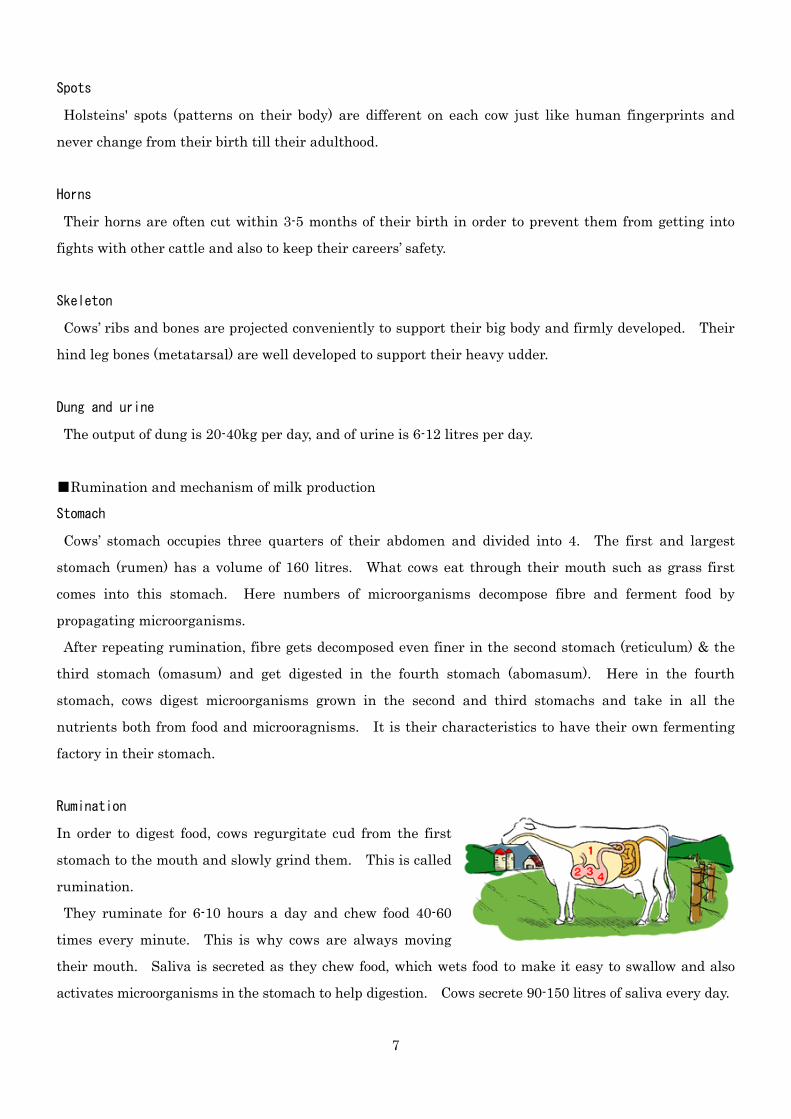
■Rumination and mechanism of milk production
Stomach
Cows’ stomach occupies three quarters of their abdomen and divided into 4. The first and largest
stomach (rumen) has a volume of 160 litres. What cows eat through their mouth such as grass first
comes into this stomach. Here numbers of microorganisms decompose fibre and ferment food by
propagating microorganisms.
After repeating rumination, fibre gets decomposed even finer in the second stomach (reticulum) & the
third stomach (omasum) and get digested in the fourth stomach (abomasum). Here in the fourth
stomach, cows digest microorganisms grown in the second and third stomachs and take in all the
nutrients both from food and microoragnisms. It is their characteristics to have their own fermenting
factory in their stomach.
Rumination
In order to digest food, cows regurgitate cud from the first
stomach to the mouth and slowly grind them. This is called
rumination.
They ruminate for 6-10 hours a day and chew food 40-60
times every minute. This is why cows are always moving
their mouth. Saliva is secreted as they chew food, which wets food to make it easy to swallow and also
activates microorganisms in the stomach to help digestion. Cows secrete 90-150 litres of saliva every day.
8
Udder
Udder is an important organ to produce milk. The actual milk producers are mammary glandular cells
in the udder. Here, various nutrition transported through blood are made into components of milk. To
produce 1 litre of milk, 400-600 litres of blood circulation is required. Cows with high milk production
yield at 45kg a day have 22.5 tonnes of blood circulating their breast.
9
2. History of dairy farming and milk
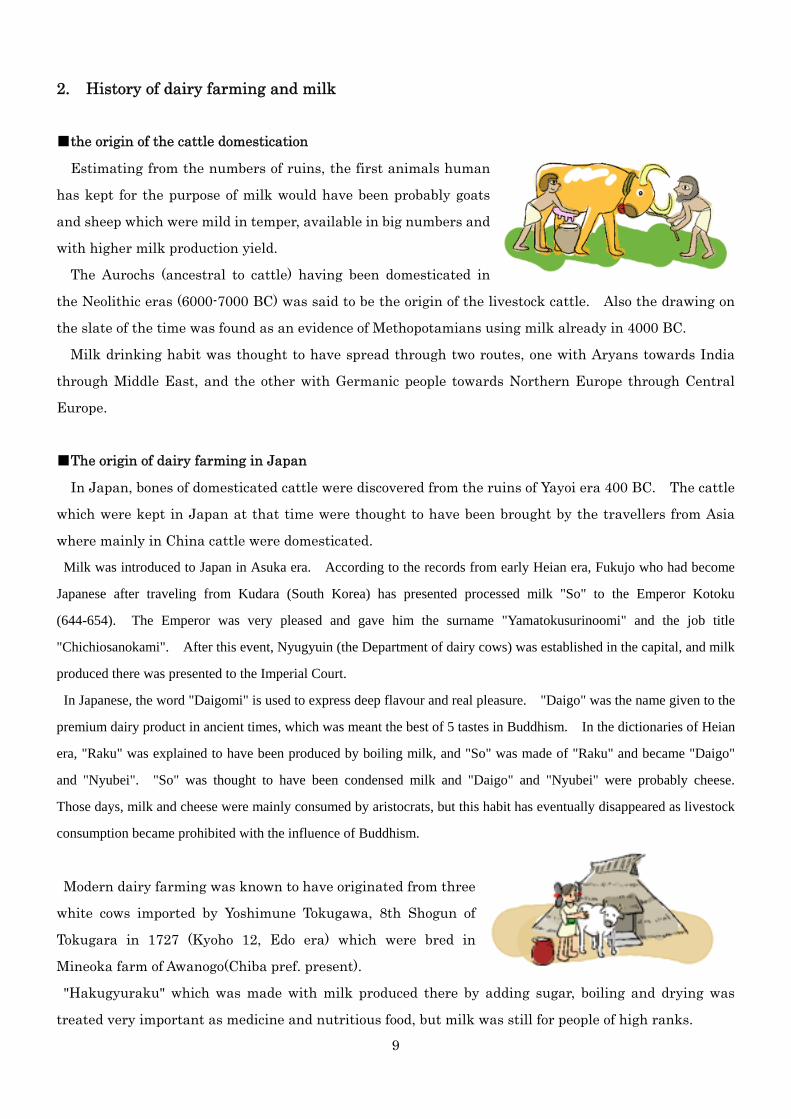
■the origin of the cattle domestication
Estimating from the numbers of ruins, the first animals human
has kept for the purpose of milk would have been probably goats
and sheep which were mild in temper, available in big numbers and
with higher milk production yield.
The Aurochs (ancestral to cattle) having been domesticated in
the Neolithic eras (6000-7000 BC) was said to be the origin of the livestock cattle. Also the drawing on
the slate of the time was found as an evidence of Methopotamians using milk already in 4000 BC.
Milk drinking habit was thought to have spread through two routes, one with Aryans towards India
through Middle East, and the other with Germanic people towards Northern Europe through Central
Europe.
■The origin of dairy farming in Japan
In Japan, bones of domesticated cattle were discovered from the ruins of Yayoi era 400 BC. The cattle
which were kept in Japan at that time were thought to have been brought by the travellers from Asia
where mainly in China cattle were domesticated.
Milk was introduced to Japan in Asuka era. According to the records from early Heian era, Fukujo who had become
Japanese after traveling from Kudara (South Korea) has presented processed milk "So" to the Emperor Kotoku
(644-654). The Emperor was very pleased and gave him the surname "Yamatokusurinoomi" and the job title
"Chichiosanokami". After this event, Nyugyuin (the Department of dairy cows) was established in the capital, and milk
produced there was presented to the Imperial Court.
In Japanese, the word "Daigomi" is used to express deep flavour and real pleasure. "Daigo" was the name given to the
premium dairy product in ancient times, which was meant the best of 5 tastes in Buddhism. In the dictionaries of Heian
era, "Raku" was explained to have been produced by boiling milk, and "So" was made of "Raku" and became "Daigo"
and "Nyubei". "So" was thought to have been condensed milk and "Daigo" and "Nyubei" were probably cheese.
Those days, milk and cheese were mainly consumed by aristocrats, but this habit has eventually disappeared as livestock
consumption became prohibited with the influence of Buddhism.
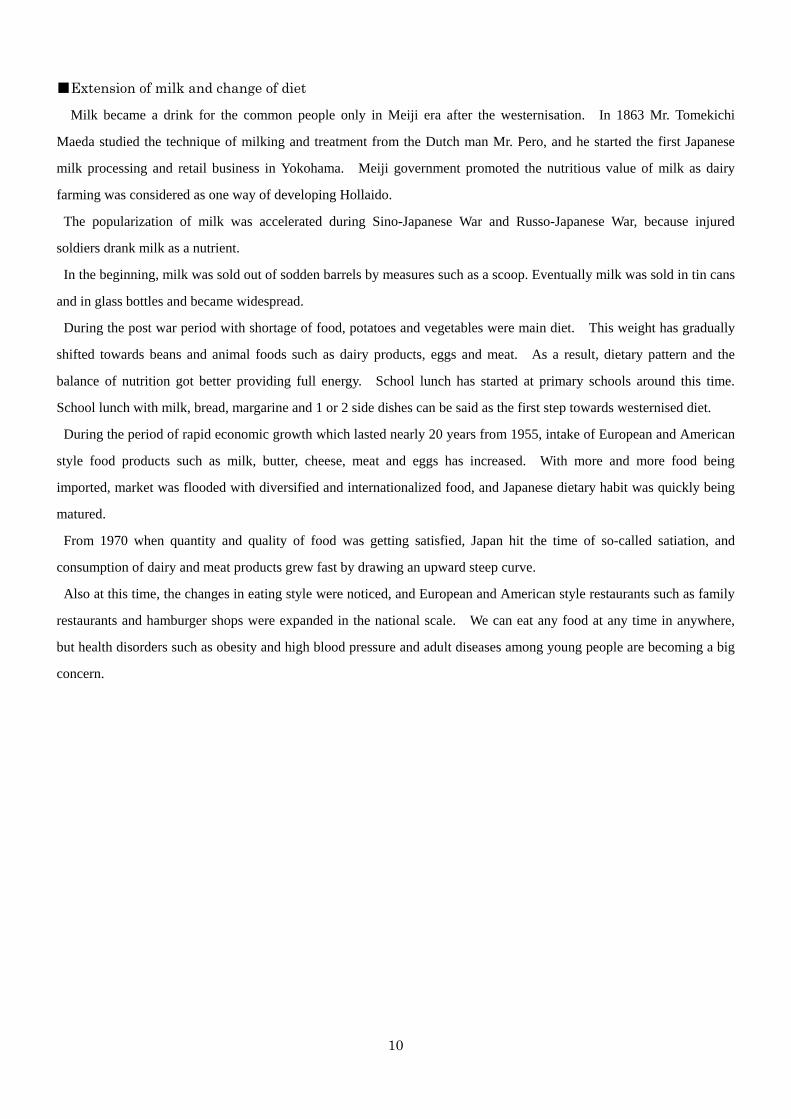
Modern dairy farming was known to have originated from three
white cows imported by Yoshimune Tokugawa, 8th Shogun of
Tokugara in 1727 (Kyoho 12, Edo era) which were bred in
Mineoka farm of Awanogo(Chiba pref. present).
"Hakugyuraku" which was made with milk produced there by adding sugar, boiling and drying was
treated very important as medicine and nutritious food, but milk was still for people of high ranks.
10
■Extension of milk and change of diet
Milk became a drink for the common people only in Meiji era after the westernisation. In 1863 Mr. Tomekichi
Maeda studied the technique of milking and treatment from the Dutch man Mr. Pero, and he started the first Japanese
milk processing and retail business in Yokohama. Meiji government promoted the nutritious value of milk as dairy
farming was considered as one way of developing Hollaido.
The popularization of milk was accelerated during Sino-Japanese War and Russo-Japanese War, because injured
soldiers drank milk as a nutrient.
In the beginning, milk was sold out of sodden barrels by measures such as a scoop. Eventually milk was sold in tin cans
and in glass bottles and became widespread.
During the post war period with shortage of food, potatoes and vegetables were main diet. This weight has gradually
shifted towards beans and animal foods such as dairy products, eggs and meat. As a result, dietary pattern and the
balance of nutrition got better providing full energy. School lunch has started at primary schools around this time.
School lunch with milk, bread, margarine and 1 or 2 side dishes can be said as the first step towards westernised diet.
During the period of rapid economic growth which lasted nearly 20 years from 1955, intake of European and American
style food products such as milk, butter, cheese, meat and eggs has increased. With more and more food being
imported, market was flooded with diversified and internationalized food, and Japanese dietary habit was quickly being
matured.
From 1970 when quantity and quality of food was getting satisfied, Japan hit the time of so-called satiation, and
consumption of dairy and meat products grew fast by drawing an upward steep curve.
Also at this time, the changes in eating style were noticed, and European and American style restaurants such as family
restaurants and hamburger shops were expanded in the national scale. We can eat any food at any time in anywhere,
but health disorders such as obesity and high blood pressure and adult diseases among young people are becoming a big
concern.
11
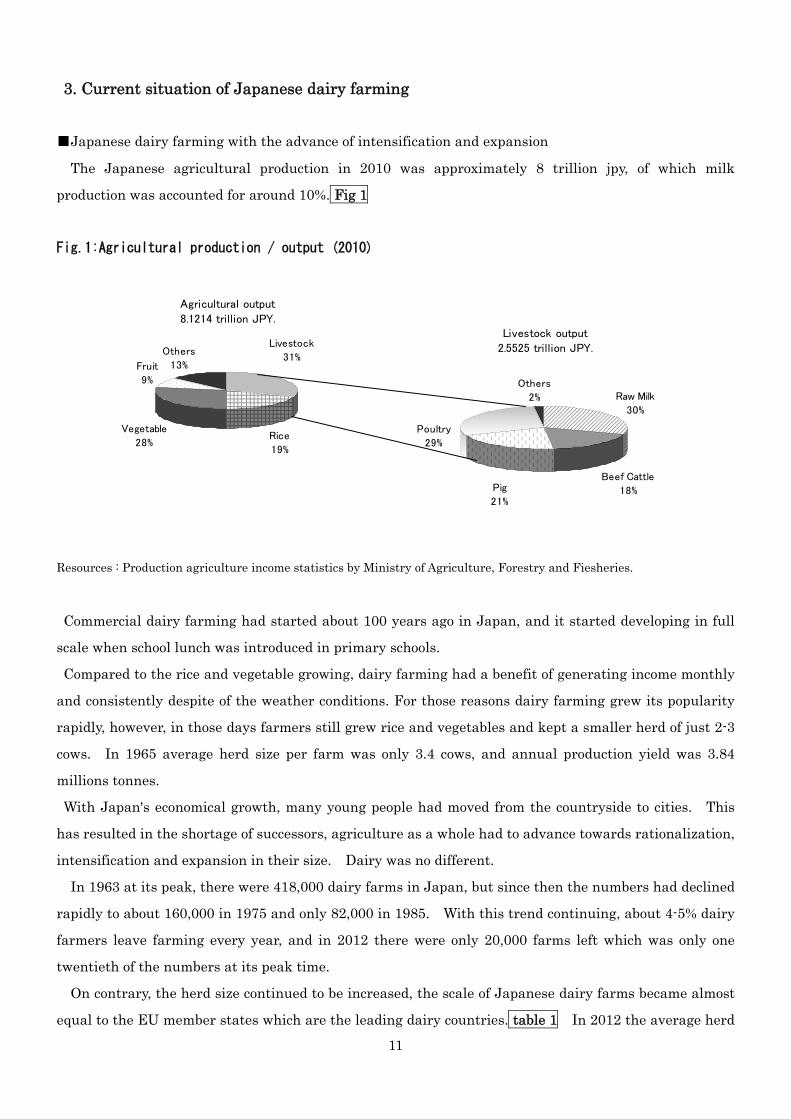
3. Current situation of Japanese dairy farming
■Japanese dairy farming with the advance of intensification and expansion
The Japanese agricultural production in 2010 was approximately 8 trillion jpy, of which milk
production was accounted for around 10%. Fig 1
Fig.1:Agricultural production / output (2010)
Resources : Production agriculture income statistics by Ministry of Agriculture, Forestry and Fiesheries.
Commercial dairy farming had started about 100 years ago in Japan, and it started developing in full
scale when school lunch was introduced in primary schools.
Compared to the rice and vegetable growing, dairy farming had a benefit of generating income monthly
and consistently despite of the weather conditions. For those reasons dairy farming grew its popularity
rapidly, however, in those days farmers still grew rice and vegetables and kept a smaller herd of just 2-3
cows. In 1965 average herd size per farm was only 3.4 cows, and annual production yield was 3.84
millions tonnes.
With Japan's economical growth, many young people had moved from the countryside to cities. This
has resulted in the shortage of successors, agriculture as a whole had to advance towards rationalization,
intensification and expansion in their size. Dairy was no different.
In 1963 at its peak, there were 418,000 dairy farms in Japan, but since then the numbers had declined
rapidly to about 160,000 in 1975 and only 82,000 in 1985. With this trend continuing, about 4-5% dairy
farmers leave farming every year, and in 2012 there were only 20,000 farms left which was only one
twentieth of the numbers at its peak time.
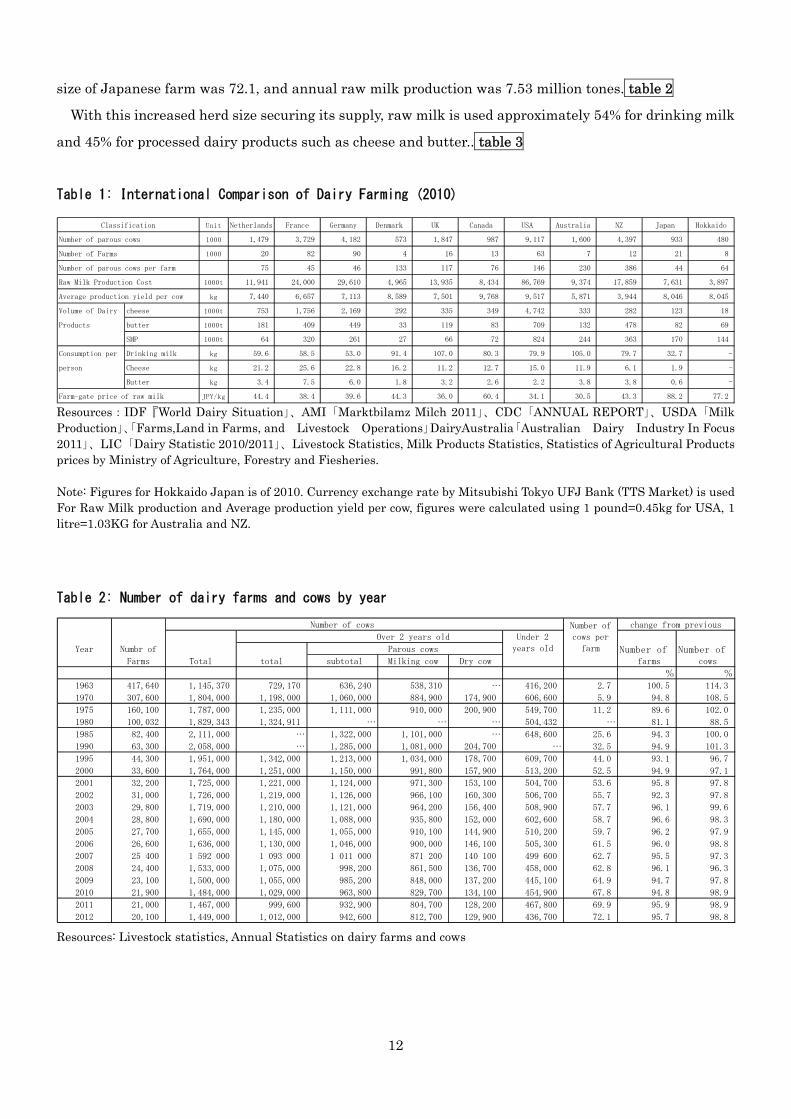
On contrary, the herd size continued to be increased, the scale of Japanese dairy farms became almost
equal to the EU member states which are the leading dairy countries. table 1 In 2012 the average herd
Agricultural output
8.1214 trillion JPY.
Others
13%Fruit
9%
Vegetable
28%Rice
19%
Livestock
31%
Livestock output
2.5525 trillion JPY.
Others
2%
Beef Cattle
18%
Raw Milk
30%
Poultry
29%
Pig
21%
12
size of Japanese farm was 72.1, and annual raw milk production was 7.53 million tones. table 2
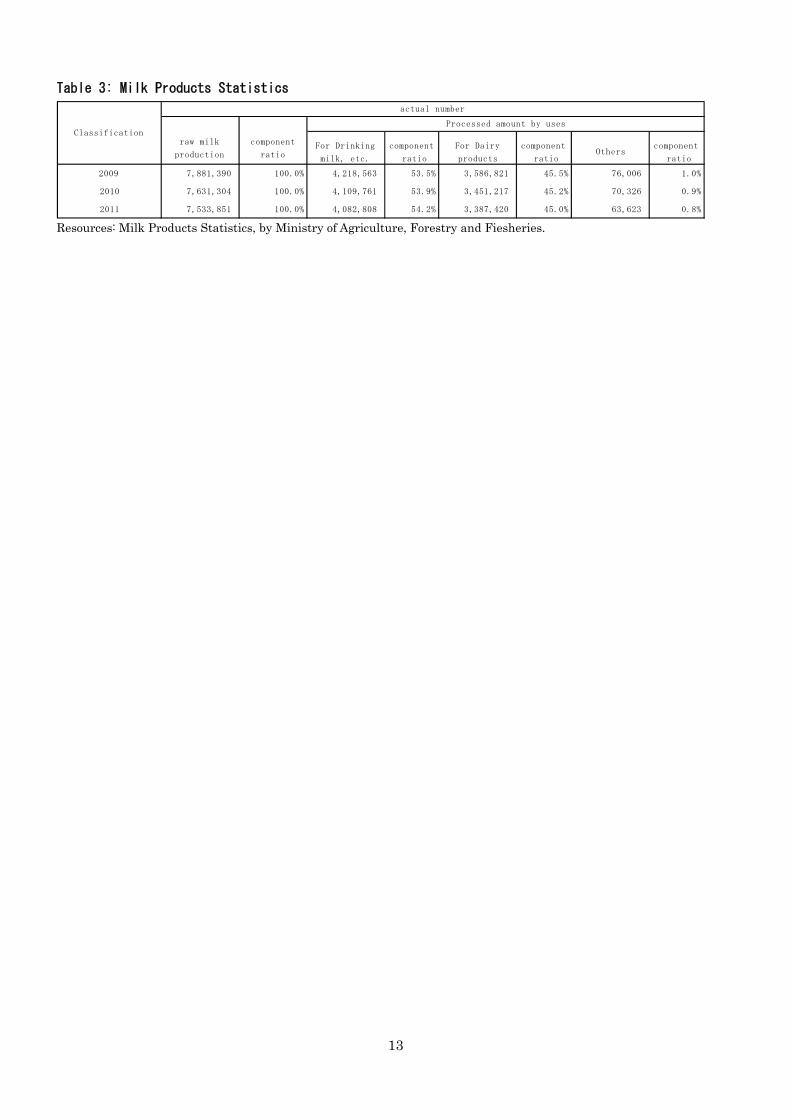
With this increased herd size securing its supply, raw milk is used approximately 54% for drinking milk
and 45% for processed dairy products such as cheese and butter.. table 3
Table 1: International Comparison of Dairy Farming (2010)
Resources:IDF『World Dairy Situation」、AMI「Marktbilamz Milch 2011」、CDC「ANNUAL REPORT」、USDA「Milk Production」、「Farms,Land in Farms, and Livestock Operations」DairyAustralia「Australian Dairy Industry In Focus 2011」、LIC「Dairy Statistic 2010/2011」、Livestock Statistics, Milk Products Statistics, Statistics of Agricultural Products prices by Ministry of Agriculture, Forestry and Fiesheries. Note: Figures for Hokkaido Japan is of 2010. Currency exchange rate by Mitsubishi Tokyo UFJ Bank (TTS Market) is used For Raw Milk production and Average production yield per cow, figures were calculated using 1 pound=0.45kg for USA, 1 litre=1.03KG for Australia and NZ.
Table 2: Number of dairy farms and cows by year
Resources: Livestock statistics, Annual Statistics on dairy farms and cows
Unit Netherlands France Germany Denmark UK Canada USA Australia NZ Japan Hokkaido
Number of parous cows 1000 1,479 3,729 4,182 573 1,847 987 9,117 1,600 4,397 933 480
Number of Farms 1000 20 82 90 4 16 13 63 7 12 21 8
Number of parous cows per farm 75 45 46 133 117 76 146 230 386 44 64
Raw Milk Production Cost 1000t 11,941 24,000 29,610 4,965 13,935 8,434 86,769 9,374 17,859 7,631 3,897
Average production yield per cow kg 7,440 6,657 7,113 8,589 7,501 9,768 9,517 5,871 3,944 8,046 8,045
Volume of Dairy cheese 1000t 753 1,756 2,169 292 335 349 4,742 333 282 123 18
Products butter 1000t 181 409 449 33 119 83 709 132 478 82 69
SMP 1000t 64 320 261 27 66 72 824 244 363 170 144
Consumption per Drinking milk kg 59.6 58.5 53.0 91.4 107.0 80.3 79.9 105.0 79.7 32.7 -
person Cheese kg 21.2 25.6 22.8 16.2 11.2 12.7 15.0 11.9 6.1 1.9 -
Butter kg 3.4 7.5 6.0 1.8 3.2 2.6 2.2 3.8 3.8 0.6 -
Farm-gate price of raw milk JPY/kg 44.4 38.4 39.6 44.3 36.0 60.4 34.1 30.5 43.3 88.2 77.2
Classification
Number of cows
Over 2 years old
Year Numbr of Parous cows Number of Number ofFarms Total total subtotal Milking cow Dry cow farms cows
% %
1963 417,640 1,145,370 729,170 636,240 538,310 … 416,200 2.7 100.5 114.3
1970 307,600 1,804,000 1,198,000 1,060,000 884,900 174,900 606,600 5.9 94.8 108.5
1975 160,100 1,787,000 1,235,000 1,111,000 910,000 200,900 549,700 11.2 89.6 102.0
1980 100,032 1,829,343 1,324,911 … … … 504,432 … 81.1 88.5
1985 82,400 2,111,000 … 1,322,000 1,101,000 … 648,600 25.6 94.3 100.0
1990 63,300 2,058,000 … 1,285,000 1,081,000 204,700 … 32.5 94.9 101.3
1995 44,300 1,951,000 1,342,000 1,213,000 1,034,000 178,700 609,700 44.0 93.1 96.7
2000 33,600 1,764,000 1,251,000 1,150,000 991,800 157,900 513,200 52.5 94.9 97.1
2001 32,200 1,725,000 1,221,000 1,124,000 971,300 153,100 504,700 53.6 95.8 97.8
2002 31,000 1,726,000 1,219,000 1,126,000 966,100 160,300 506,700 55.7 92.3 97.8
2003 29,800 1,719,000 1,210,000 1,121,000 964,200 156,400 508,900 57.7 96.1 99.6
2004 28,800 1,690,000 1,180,000 1,088,000 935,800 152,000 602,600 58.7 96.6 98.3
2005 27,700 1,655,000 1,145,000 1,055,000 910,100 144,900 510,200 59.7 96.2 97.9
2006 26,600 1,636,000 1,130,000 1,046,000 900,000 146,100 505,300 61.5 96.0 98.8
2007 25 400 1 592 000 1 093 000 1 011 000 871 200 140 100 499 600 62.7 95.5 97.3
2008 24,400 1,533,000 1,075,000 998,200 861,500 136,700 458,000 62.8 96.1 96.3
2009 23,100 1,500,000 1,055,000 985,200 848,000 137,200 445,100 64.9 94.7 97.8
2010 21,900 1,484,000 1,029,000 963,800 829,700 134,100 454,900 67.8 94.8 98.9
2011 21,000 1,467,000 999,600 932,900 804,700 128,200 467,800 69.9 95.9 98.9
2012 20,100 1,449,000 1,012,000 942,600 812,700 129,900 436,700 72.1 95.7 98.8
Number of
cows per
farm
change from previous
Under 2
years old
13
Table 3: Milk Products Statistics
Resources: Milk Products Statistics, by Ministry of Agriculture, Forestry and Fiesheries.
For Drinking
milk, etc.
component
ratio
For Dairy
products
component
ratioOthers
component
ratio
7,881,390 100.0% 4,218,563 53.5% 3,586,821 45.5% 76,006 1.0%
7,631,304 100.0% 4,109,761 53.9% 3,451,217 45.2% 70,326 0.9%
7,533,851 100.0% 4,082,808 54.2% 3,387,420 45.0% 63,623 0.8%
2009
2010
2011
Classification
actual number
Processed amount by uses
raw milk
production
component
ratio
14
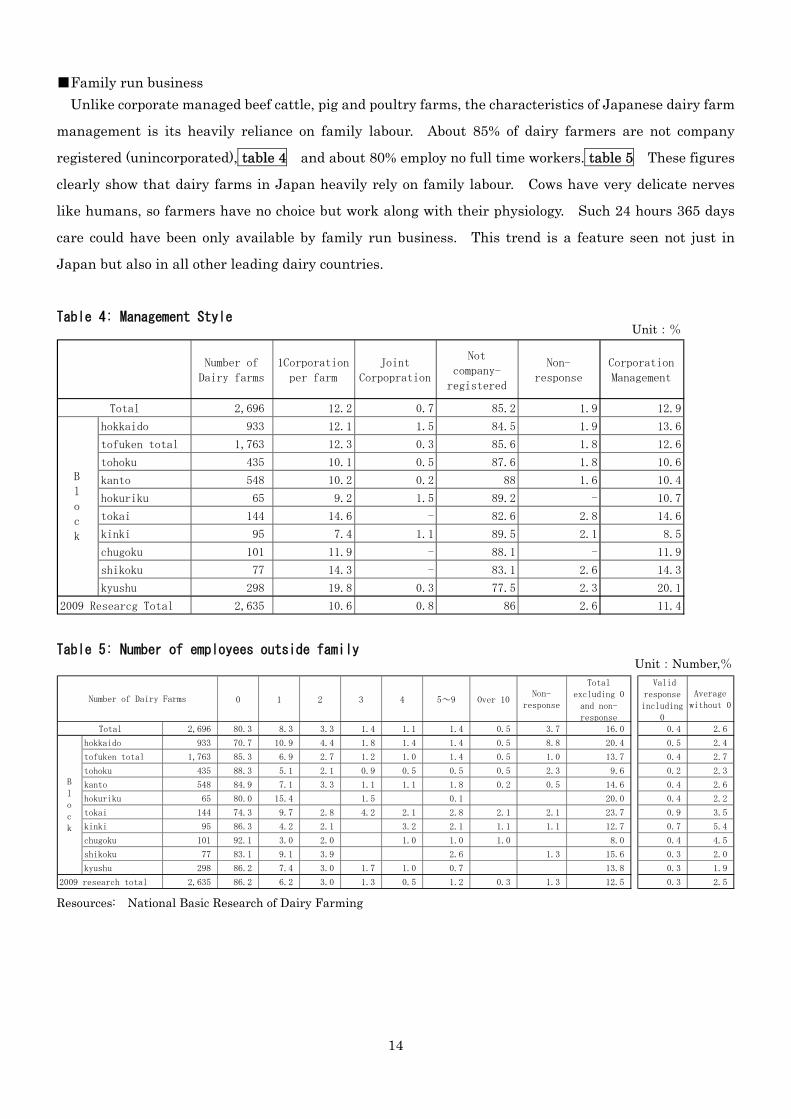
■Family run business
Unlike corporate managed beef cattle, pig and poultry farms, the characteristics of Japanese dairy farm
management is its heavily reliance on family labour. About 85% of dairy farmers are not company
registered (unincorporated), table 4 and about 80% employ no full time workers. table 5 These figures
clearly show that dairy farms in Japan heavily rely on family labour. Cows have very delicate nerves
like humans, so farmers have no choice but work along with their physiology. Such 24 hours 365 days
care could have been only available by family run business. This trend is a feature seen not just in
Japan but also in all other leading dairy countries.
Table 4: Management Style
Table 5: Number of employees outside family
Resources: National Basic Research of Dairy Farming
Number of
Dairy farms
1Corporation
per farm
Joint
Corpopration
Not
company-
registered
Non-
response
Corporation
Management
2,696 12.2 0.7 85.2 1.9 12.9
hokkaido 933 12.1 1.5 84.5 1.9 13.6
tofuken total 1,763 12.3 0.3 85.6 1.8 12.6
tohoku 435 10.1 0.5 87.6 1.8 10.6
kanto 548 10.2 0.2 88 1.6 10.4
hokuriku 65 9.2 1.5 89.2 - 10.7
tokai 144 14.6 - 82.6 2.8 14.6
kinki 95 7.4 1.1 89.5 2.1 8.5
chugoku 101 11.9 - 88.1 - 11.9
shikoku 77 14.3 - 83.1 2.6 14.3
kyushu 298 19.8 0.3 77.5 2.3 20.1
2009 Researcg Total 2,635 10.6 0.8 86 2.6 11.4
B
l
o
c
k
Total
Unit:%
0 1 2 3 4 5~9 Over 10Non-
response
Total
excluding 0
and non-
response
Valid
response
including
0
Average
without 0
2,696 80.3 8.3 3.3 1.4 1.1 1.4 0.5 3.7 16.0 0.4 2.6
hokkaido 933 70.7 10.9 4.4 1.8 1.4 1.4 0.5 8.8 20.4 0.5 2.4
tofuken total 1,763 85.3 6.9 2.7 1.2 1.0 1.4 0.5 1.0 13.7 0.4 2.7
tohoku 435 88.3 5.1 2.1 0.9 0.5 0.5 0.5 2.3 9.6 0.2 2.3
kanto 548 84.9 7.1 3.3 1.1 1.1 1.8 0.2 0.5 14.6 0.4 2.6
hokuriku 65 80.0 15.4 1.5 0.1 20.0 0.4 2.2
tokai 144 74.3 9.7 2.8 4.2 2.1 2.8 2.1 2.1 23.7 0.9 3.5
kinki 95 86.3 4.2 2.1 3.2 2.1 1.1 1.1 12.7 0.7 5.4
chugoku 101 92.1 3.0 2.0 1.0 1.0 1.0 8.0 0.4 4.5
shikoku 77 83.1 9.1 3.9 2.6 1.3 15.6 0.3 2.0
kyushu 298 86.2 7.4 3.0 1.7 1.0 0.7 13.8 0.3 1.9
2009 research total 2,635 86.2 6.2 3.0 1.3 0.5 1.2 0.3 1.3 12.5 0.3 2.5
Total
B
l
o
c
k
Number of Dairy Farms
Unit:Number,%
15
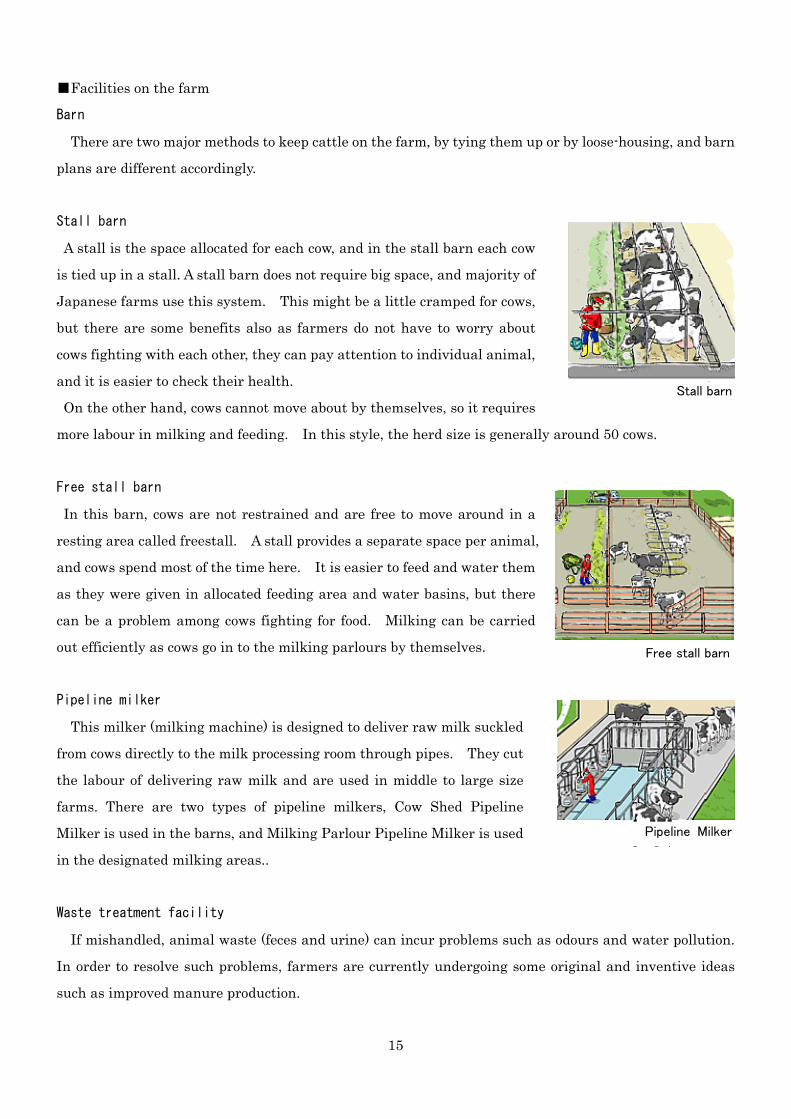
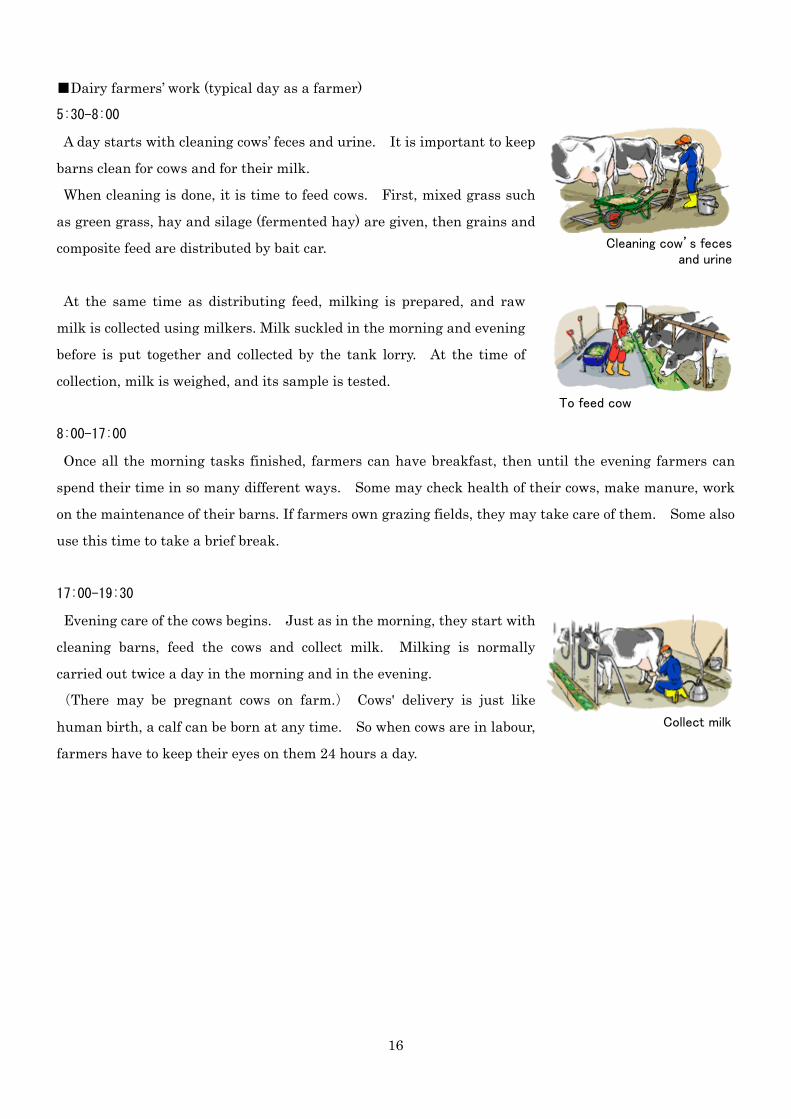
■Facilities on the farm
Barn
There are two major methods to keep cattle on the farm, by tying them up or by loose-housing, and barn
plans are different accordingly.
Stall barn
A stall is the space allocated for each cow, and in the stall barn each cow
is tied up in a stall. A stall barn does not require big space, and majority of
Japanese farms use this system. This might be a little cramped for cows,
but there are some benefits also as farmers do not have to worry about
cows fighting with each other, they can pay attention to individual animal,
and it is easier to check their health.
On the other hand, cows cannot move about by themselves, so it requires
more labour in milking and feeding. In this style, the herd size is generally around 50 cows.
Free stall barn
In this barn, cows are not restrained and are free to move around in a
resting area called freestall. A stall provides a separate space per animal,
and cows spend most of the time here. It is easier to feed and water them
as they were given in allocated feeding area and water basins, but there
can be a problem among cows fighting for food. Milking can be carried
out efficiently as cows go in to the milking parlours by themselves.
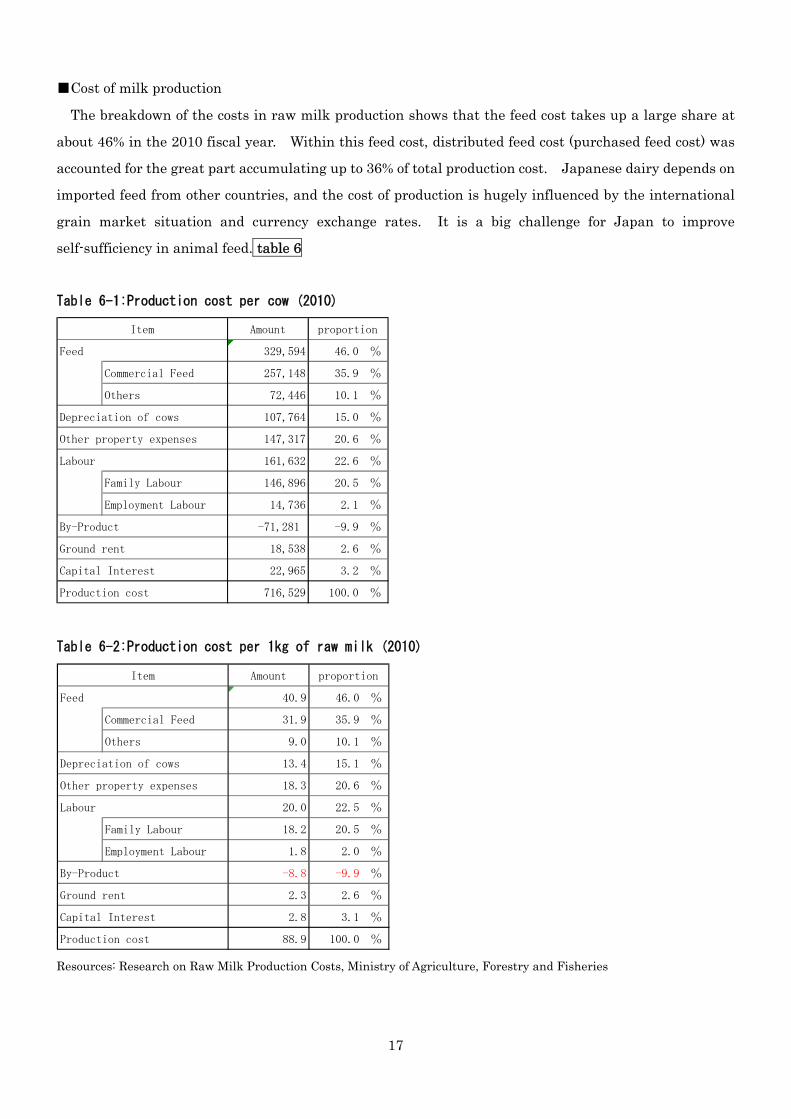
Pipeline milker
This milker (milking machine) is designed to deliver raw milk suckled
from cows directly to the milk processing room through pipes. They cut
the labour of delivering raw milk and are used in middle to large size
farms. There are two types of pipeline milkers, Cow Shed Pipeline
Milker is used in the barns, and Milking Parlour Pipeline Milker is used
in the designated milking areas..
Waste treatment facility
If mishandled, animal waste (feces and urine) can incur problems such as odours and water pollution.
In order to resolve such problems, farmers are currently undergoing some original and inventive ideas
such as improved manure production.
Stall barn
Free stall barn
Pipeline Milker
16
■Dairy farmers’ work (typical day as a farmer)
5:30-8:00
A day starts with cleaning cows’ feces and urine. It is important to keep
barns clean for cows and for their milk.
When cleaning is done, it is time to feed cows. First, mixed grass such
as green grass, hay and silage (fermented hay) are given, then grains and
composite feed are distributed by bait car.
At the same time as distributing feed, milking is prepared, and raw
milk is collected using milkers. Milk suckled in the morning and evening
before is put together and collected by the tank lorry. At the time of
collection, milk is weighed, and its sample is tested.
8:00-17:00
Once all the morning tasks finished, farmers can have breakfast, then until the evening farmers can
spend their time in so many different ways. Some may check health of their cows, make manure, work
on the maintenance of their barns. If farmers own grazing fields, they may take care of them. Some also
use this time to take a brief break.
17:00-19:30
Evening care of the cows begins. Just as in the morning, they start with
cleaning barns, feed the cows and collect milk. Milking is normally
carried out twice a day in the morning and in the evening.
(There may be pregnant cows on farm.) Cows' delivery is just like
human birth, a calf can be born at any time. So when cows are in labour,
farmers have to keep their eyes on them 24 hours a day.
Cleaning cow’s feces and urine
To feed cow
Collect milk
17
■Cost of milk production
The breakdown of the costs in raw milk production shows that the feed cost takes up a large share at
about 46% in the 2010 fiscal year. Within this feed cost, distributed feed cost (purchased feed cost) was
accounted for the great part accumulating up to 36% of total production cost. Japanese dairy depends on
imported feed from other countries, and the cost of production is hugely influenced by the international
grain market situation and currency exchange rates. It is a big challenge for Japan to improve
self-sufficiency in animal feed. table 6
Table 6-1:Production cost per cow (2010)
Amount
Feed 329,594 46.0 %
Commercial Feed 257,148 35.9 %
Others 72,446 10.1 %
Depreciation of cows 107,764 15.0 %
Other property expenses 147,317 20.6 %
Labour 161,632 22.6 %
Family Labour 146,896 20.5 %
Employment Labour 14,736 2.1 %
By-Product -71,281 -9.9 %
Ground rent 18,538 2.6 %
Capital Interest 22,965 3.2 %
716,529 100.0 %
proportion
Production cost
Item
Table 6-2:Production cost per 1kg of raw milk (2010)
Resources: Research on Raw Milk Production Costs, Ministry of Agriculture, Forestry and Fisheries
Amount
Feed 40.9 46.0 %
Commercial Feed 31.9 35.9 %
Others 9.0 10.1 %
Depreciation of cows 13.4 15.1 %
Other property expenses 18.3 20.6 %
Labour 20.0 22.5 %
Family Labour 18.2 20.5 %
Employment Labour 1.8 2.0 %
By-Product -8.8 -9.9 %
Ground rent 2.3 2.6 %
Capital Interest 2.8 3.1 %
88.9 100.0 %
Item proportion
Production cost
18
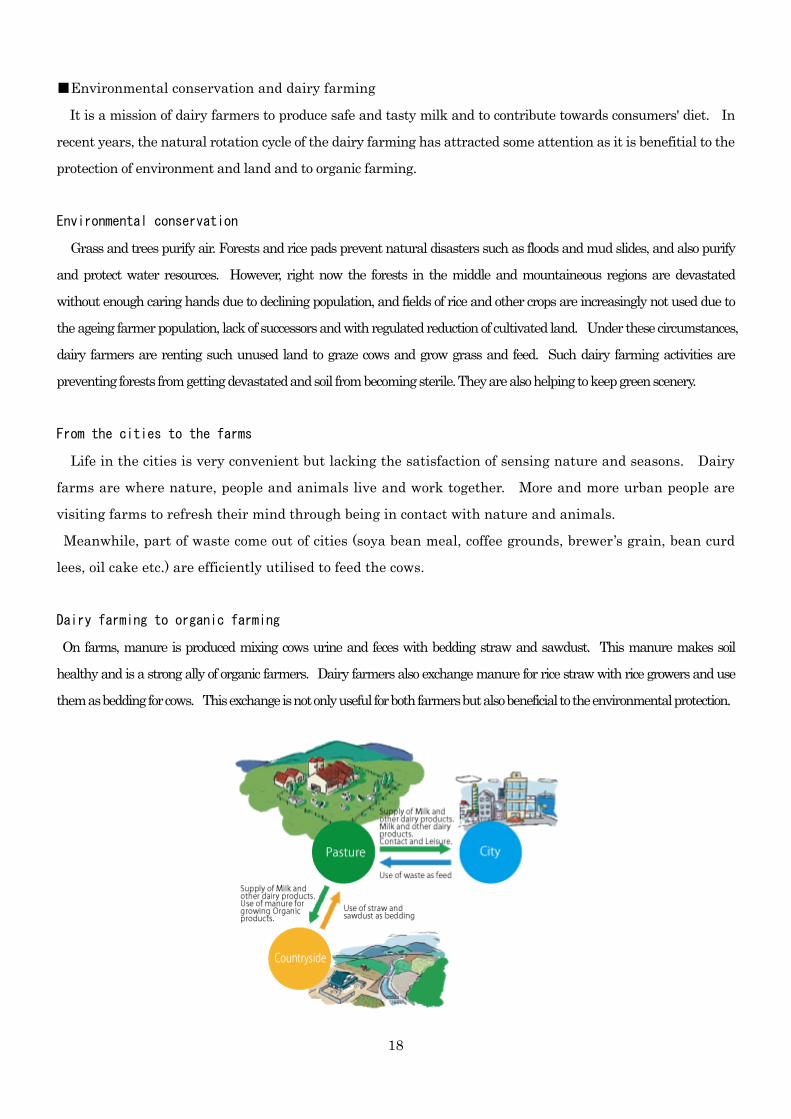
■Environmental conservation and dairy farming
It is a mission of dairy farmers to produce safe and tasty milk and to contribute towards consumers' diet. In
recent years, the natural rotation cycle of the dairy farming has attracted some attention as it is benefitial to the
protection of environment and land and to organic farming.
Environmental conservation
Grass and trees purify air. Forests and rice pads prevent natural disasters such as floods and mud slides, and also purify
and protect water resources. However, right now the forests in the middle and mountaineous regions are devastated
without enough caring hands due to declining population, and fields of rice and other crops are increasingly not used due to
the ageing farmer population, lack of successors and with regulated reduction of cultivated land. Under these circumstances,
dairy farmers are renting such unused land to graze cows and grow grass and feed. Such dairy farming activities are
preventing forests from getting devastated and soil from becoming sterile. They are also helping to keep green scenery.
From the cities to the farms
Life in the cities is very convenient but lacking the satisfaction of sensing nature and seasons. Dairy
farms are where nature, people and animals live and work together. More and more urban people are
visiting farms to refresh their mind through being in contact with nature and animals.
Meanwhile, part of waste come out of cities (soya bean meal, coffee grounds, brewer’s grain, bean curd
lees, oil cake etc.) are efficiently utilised to feed the cows.
Dairy farming to organic farming
On farms, manure is produced mixing cows urine and feces with bedding straw and sawdust. This manure makes soil
healthy and is a strong ally of organic farmers. Dairy farmers also exchange manure for rice straw with rice growers and use
them as bedding for cows. This exchange is not only useful for both farmers but also beneficial to the environmental protection.
19
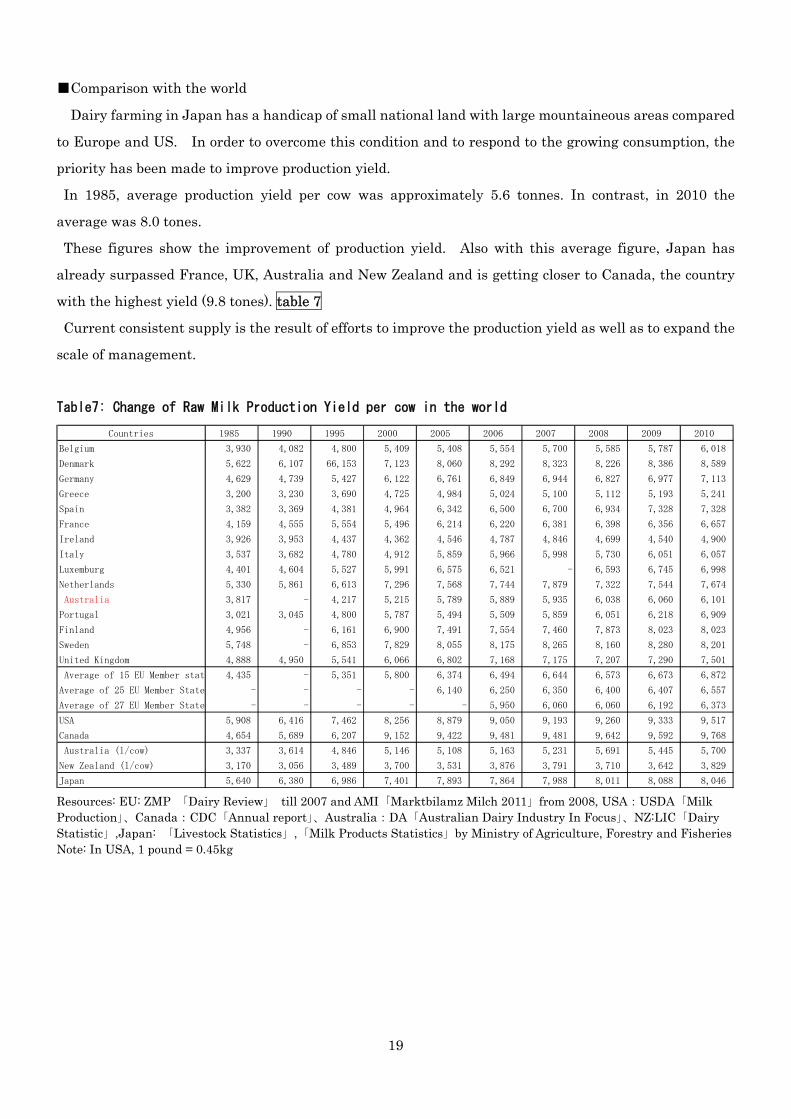
■Comparison with the world
Dairy farming in Japan has a handicap of small national land with large mountaineous areas compared
to Europe and US. In order to overcome this condition and to respond to the growing consumption, the
priority has been made to improve production yield.
In 1985, average production yield per cow was approximately 5.6 tonnes. In contrast, in 2010 the
average was 8.0 tones.
These figures show the improvement of production yield. Also with this average figure, Japan has
already surpassed France, UK, Australia and New Zealand and is getting closer to Canada, the country
with the highest yield (9.8 tones). table 7
Current consistent supply is the result of efforts to improve the production yield as well as to expand the
scale of management.
Table7: Change of Raw Milk Production Yield per cow in the world
Countries 1985 1990 1995 2000 2005 2006 2007 2008 2009 2010
Belgium 3,930 4,082 4,800 5,409 5,408 5,554 5,700 5,585 5,787 6,018
Denmark 5,622 6,107 66,153 7,123 8,060 8,292 8,323 8,226 8,386 8,589
Germany 4,629 4,739 5,427 6,122 6,761 6,849 6,944 6,827 6,977 7,113
Greece 3,200 3,230 3,690 4,725 4,984 5,024 5,100 5,112 5,193 5,241
Spain 3,382 3,369 4,381 4,964 6,342 6,500 6,700 6,934 7,328 7,328
France 4,159 4,555 5,554 5,496 6,214 6,220 6,381 6,398 6,356 6,657
Ireland 3,926 3,953 4,437 4,362 4,546 4,787 4,846 4,699 4,540 4,900
Italy 3,537 3,682 4,780 4,912 5,859 5,966 5,998 5,730 6,051 6,057
Luxemburg 4,401 4,604 5,527 5,991 6,575 6,521 - 6,593 6,745 6,998
Netherlands 5,330 5,861 6,613 7,296 7,568 7,744 7,879 7,322 7,544 7,674
Australia 3,817 - 4,217 5,215 5,789 5,889 5,935 6,038 6,060 6,101
Portugal 3,021 3,045 4,800 5,787 5,494 5,509 5,859 6,051 6,218 6,909
Finland 4,956 - 6,161 6,900 7,491 7,554 7,460 7,873 8,023 8,023
Sweden 5,748 - 6,853 7,829 8,055 8,175 8,265 8,160 8,280 8,201
United Kingdom 4,888 4,950 5,541 6,066 6,802 7,168 7,175 7,207 7,290 7,501
Average of 15 EU Member stat 4,435 - 5,351 5,800 6,374 6,494 6,644 6,573 6,673 6,872
Average of 25 EU Member State - - - - 6,140 6,250 6,350 6,400 6,407 6,557
Average of 27 EU Member State - - - - - 5,950 6,060 6,060 6,192 6,373
USA 5,908 6,416 7,462 8,256 8,879 9,050 9,193 9,260 9,333 9,517
Canada 4,654 5,689 6,207 9,152 9,422 9,481 9,481 9,642 9,592 9,768
Australia (l/cow) 3,337 3,614 4,846 5,146 5,108 5,163 5,231 5,691 5,445 5,700
New Zealand (l/cow) 3,170 3,056 3,489 3,700 3,531 3,876 3,791 3,710 3,642 3,829
Japan 5,640 6,380 6,986 7,401 7,893 7,864 7,988 8,011 8,088 8,046 Resources: EU: ZMP 「Dairy Review」 till 2007 and AMI「Marktbilamz Milch 2011」from 2008, USA:USDA「Milk Production」、Canada:CDC「Annual report」、Australia:DA「Australian Dairy Industry In Focus」、NZ:LIC「Dairy Statistic」,Japan: 「Livestock Statistics」,「Milk Products Statistics」by Ministry of Agriculture, Forestry and Fisheries Note: In USA, 1 pound = 0.45kg
20
4. Government measures
■Subsidy and production cost
In Japan, under the " Temporary Act for Compensation Price for Producers of Milk for Manufacturing Use” (def
iciency payment), for the purpose of securing reproduction of raw milk in the "raw milk for processing use reg
ion" where more than half of milk produced are used for processing, such farmers producing milk for processi
ng use are subsidised. "Raw milk for processing use region" refers to the area where more than half of milk
produced is traded with processing plants (currently only Hokkaido). “Raw milk for processing use” refers to
milk used to produce 1 butter, 2 skimmed milk powder, 3 sweetened condensed whole milk, 4 sweetened cond
ensed skimmed milk, 5 whole milk powder, 6 sweetened milk powder, 7 unsweetened condensed whole milk a
nd 8 skimmed milk powder for animal feed.
1966-2000
From 1966, when Deficiency Payment Act was implemented, till 2000, producers were subsidised by the government for t
he difference between the estimated production cost per 1kg of raw milk in the raw milk for processing use region and actual
market price of raw milk for processing use set by the government (standard market price).
Producers were ensured by the government total of standard market price and subsidy (=guaranteed value) as milkprice rece
ivable.
From 2000 to the present
In May 2000, Deficiency Payment Act was reviewed and re-enforced in 2001, guaranteed value set by the gov
ernment and standard market price were removed, therefore subsidy as a deficiency payment was abolished.
New formula for subsidy calculation is to take average production cost and production yield for the last three y
ears, work out the rate of variability and multiply this rate to the subsidy unit price from the previous year.
Standard market price was abolished, so the raw milk price for processing use is determined by
the negotiations between designated milk producer groups and dairy processors. The unit price fo
r subsidy in 2011 was 11.95 yen/kg, and in 2012 - 12.20 yen / kg.
Maximum amount claimable of raw milk for processing use, which was regulated at the time of subsidy
was introduced, has not been changed before and after the review.
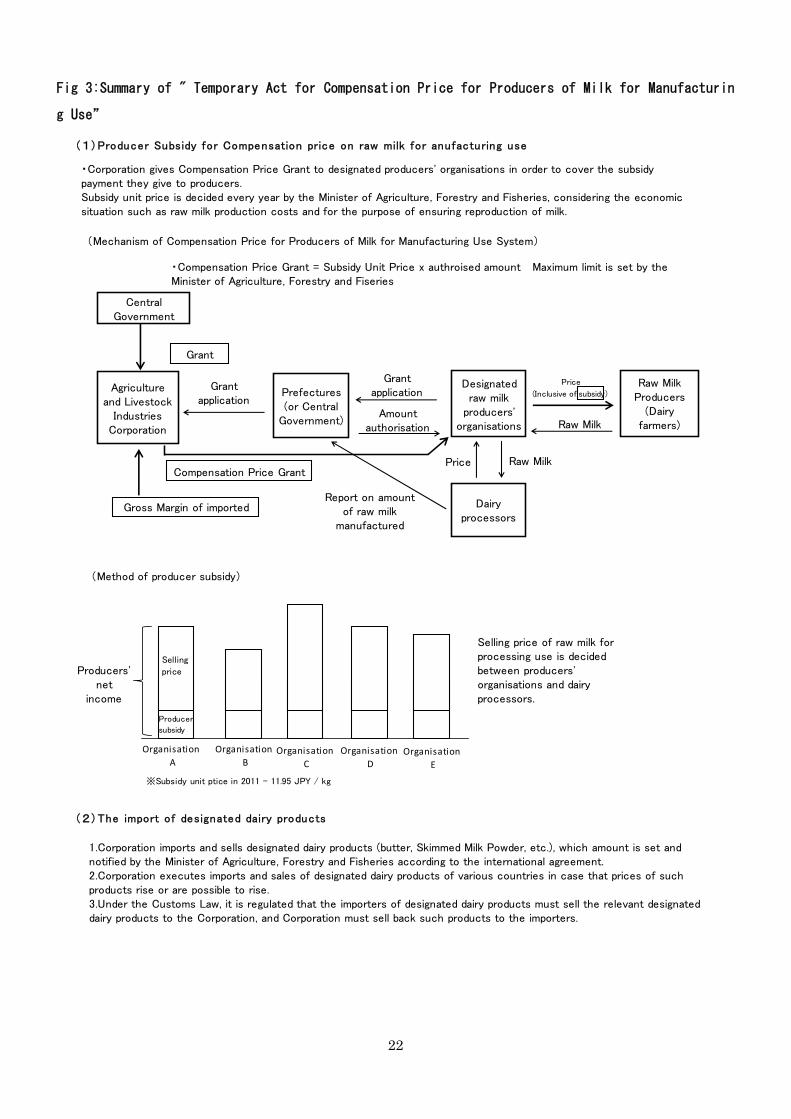
Under the new act, there is a possibility that raw milk price for processing use, which is decided in free trade
between designated milk producers groups and dairy processors, could face a big decline due to the unexpected
change in supply and demand balance. In order to take measures to mitigate such drastic situation, the new fund
was established with its financial resources from producers’ own contribution (0.40 yen per 1kg of raw milk for
processing use) and support from the government (0.20 yen per 1kg of raw milk for processing use), and in the case of
the raw milk price for processing use (exclusive of the government subsidy) falls lower than the standard price for
compensation (=average of the last three years’ average market prices), 80% of the difference is to be supplemented
by the fund. For the reference, the standard price for compensation in 2011 was 69.12/kg. table 8 Fig2, 3, 4
21
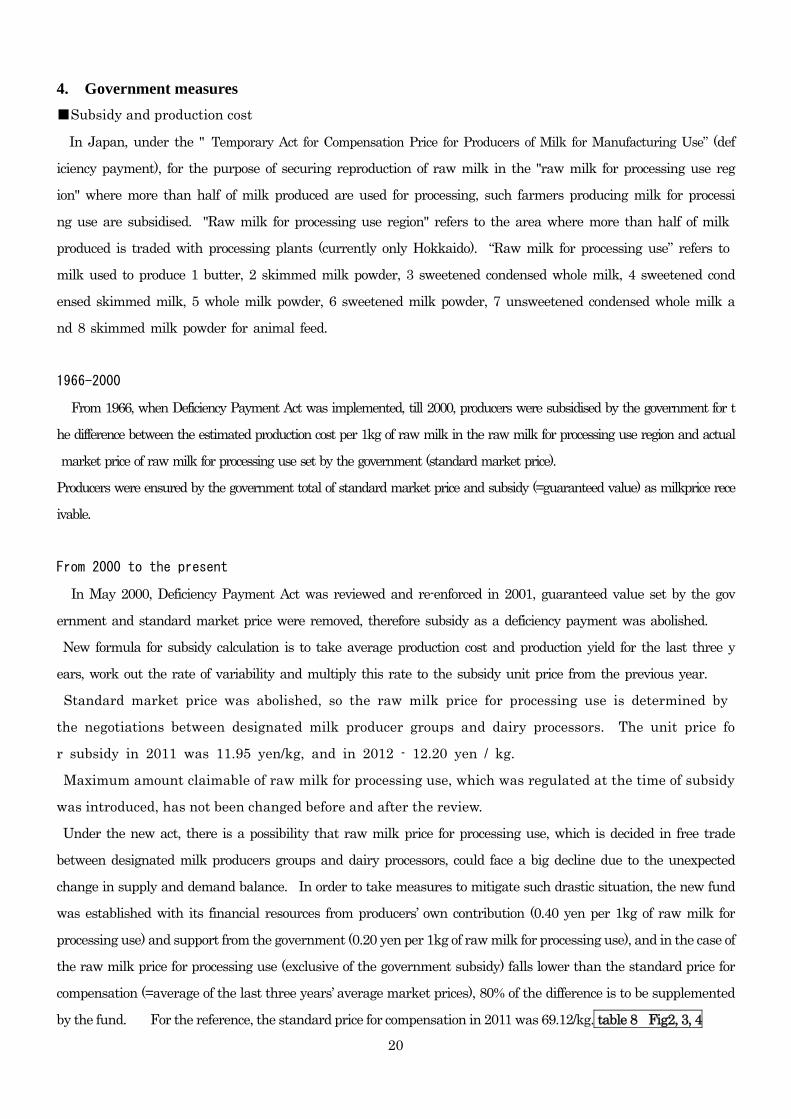
Table 8: Regards to Compensation Price for Producers of Milk for Manufacturing Use
1995 1996 1997 1998 1999 2000 2001 2002 2003 2004 2005 2006 2007 2009 2010 2011 2012
April-
June
July
(afterwards)
JPY JPY JPY JPY JPY JPY JPY JPY JPY JPY JPY JPY JPY JPY JPY JPY JPY JPY JPY
Guaranteed Value 75.75 75.75 74.27 73.86 73.36 72.13
Standard Market Price 64.26 64.26 63.40 63.02 62.56 61.83
Tax excluded 62.39 60.38 60.02 59.58 58.89
standard price for compensation※1 61.83 61.83 61.83 61.88 61.37 60.54 59.51 59.35 61.95 65.94 69.12
Average Market Price※2 61.83 61.83 61.99 60.31 59.33 58.91 59.82 67.12 70.88 69.37
a.Butter as ingredients 993 993 965 955 931 910
Tax excluded (JPY) 964 919 910 887 867
b.SMP 12,841 12,841 13,090 13,090 13,090 13,090
Tax excluded (JPY) 12,467 12,467 12,467 12,467 12,467
c.sweetened condensed whole milk 8,055 8,055 8,211 8,211 8,211 8,211
Tax excluded (JPY) 7,820 7,820 7,820 7,820 7,820
d.sweetened condensed skimmed milk 7,193 7,193 7,333 7,333 7,333 7,333
Tax excluded (JPY) 6,983 6,983 6,983 6,983 6,983
e.(Whole Milk Powder) (18,112) (18,112) (18,464) (18,464) (18,464) (18,464)
Tax excluded (JPY)
f.(Butter for home use) (1,081) (1,081) (1,051) (1,040)
Tax excluded (JPY)
production limit (1,000 tonnes) 2,300 2,300 2,400 2,400 2,400 2,400 227 220 210 210 205 203 198 195 195 185 185 183
Subsidy unit price (JPY) 11.49 11.49 10.87 10.84 10.80 10.30 10.30 11.00 10.74 10.52 104.00 10.40 10.56 11.55 11.85 11.85 11.85 11.95 12.20
Subsidy Total (Actual) 264.27 264.27 260.88 260.16 259.20 247.20 233.81 242.00 225.54 220.92 213.20 211.12 208.89 59.48 170.05 231.08 219.23 221.08 223.26
Unit price for Compensation 1.26 1.63 1.30
S
t
a
b
l
e
I
n
d
e
x
P
r
i
c
e
s
Clacifications 2008
Note: () = unit From 2001, with new system introduced, Guaranteed Value, Standard Market Price and Stable Index Prices were abolished. Note: ※1 and ※2 are average market price and Unit Price for Compensation relevant to Measures for stable management ofproducers of milk for processing use.
Fig 2: Summary of the "Compensation Price for Producers of Milk for Manufacturing Use" System
For the purpose of ensuring re-rpdocution of raw milk in"Raw milk for processing use region(Hokkaido), subsidy isgiven to the producers of raw milk for processing use.
SubsidyUnit price
Purpose
It is calculated by set rules based on the fluctuation ofproduction cost.
Unit price in2010
11.85yen
Increase-decrease ratesof production cost
1.0087
Unit price in2011
11.95yen× =
Subsidy unit price for 2011 was calculated by multiplying thesubsidy unit price of 2010 to the increase-decrease rates ofproduction cost.
Average of three years' production costs is used to calculate increase-decrease rate of production cost, however, the unit prices for each item ofexpense are adjusted to the most recent figures (Basically betweenNovember 2010 and January 2011)
Volume in 2007
×
latest unit price
+ +
Volume in 2008×
latest uni t price
Volume in 2009×
latest uni t price
Productioncost in 2007
Productioncost in 2008
Productioncost in 2009
Productioncost in 2006 +
Productioncost in 2007
Volume in 2006
×
previous year's
unit price
Volume in 2007×
previous year'suni t price
Productioncost in 2008
Volume in 2008×
previous year'suni t price
+
productionlimit
The amount is set depending on the supply-demandsituation of raw milk. In 2011, it was set at 1.85 million
tonnes, the same as the previous year.
Summary of the system Framework of the system
Framework
1 2 3
producers'net income
payment from dairyprocessors
subsidy from thegovernment
Transition of subsidy unit prices and production limit.
Trade price of raw milk forprocessing use is decided
between producers'organisations and dairy
processors.
Organ isat ionA
Organ isat ionB
Organ isat ionC
3
3
Trade price ofraw milk forprocessing
the subsidy
subsidy
unit price
production
limit
10.30 11.00 10.74 10.52 10.40 10.40 10.55 11.55 11.85 11.85 11.85 11.95
2002 2003 2004 2005 2005 2006 2007 2008 2009 2010 2011
2,270 2,200 2,100 2,100 2,050 2,030 1,980 1,950 1,950 1,850 1,850
The amount subjected to the subsidy ( productionlimit) is decided every year.
Unit:yen/kg,1,000t
22
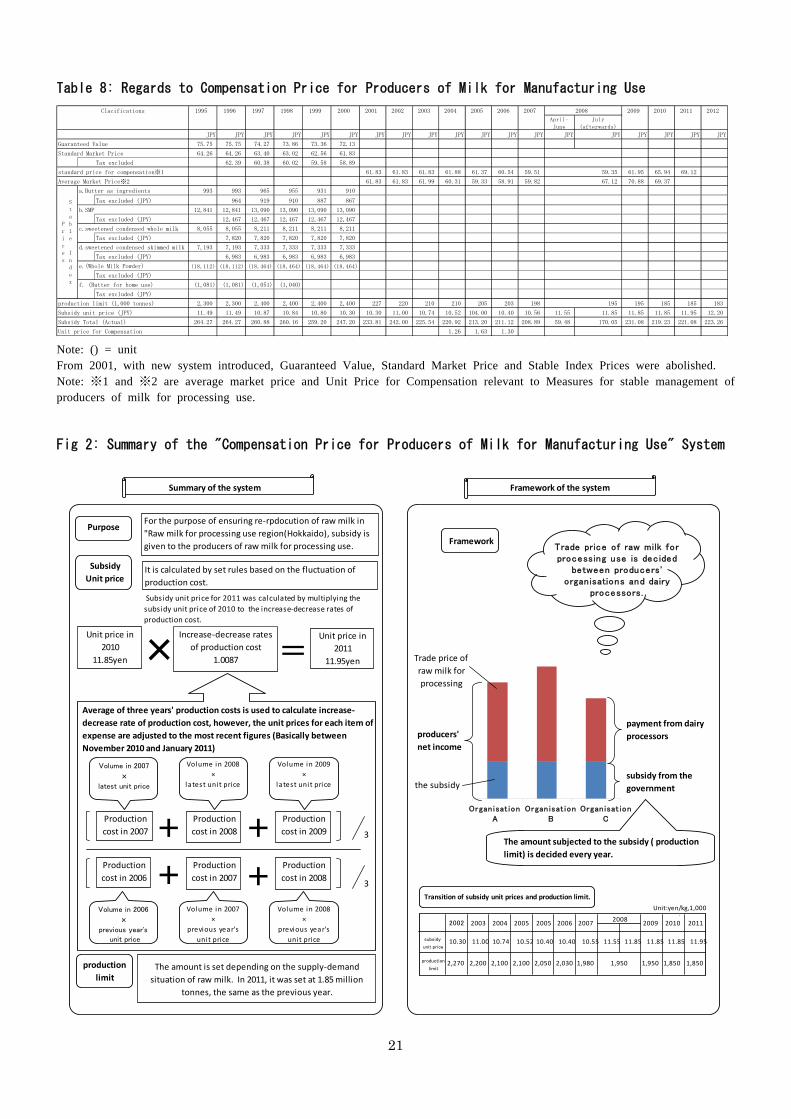
Fig 3:Summary of " Temporary Act for Compensation Price for Producers of Milk for Manufacturin
g Use”
Producer
subsidy
(1)Producer Subsidy for Compensation price on raw milk for anufacturing use
・Corporation gives Compensation Price Grant to designated producers' organisations in order to cover the subsidypayment they give to producers.Subsidy unit price is decided every year by the Minister of Agriculture, Forestry and Fisheries, considering the economicsituation such as raw milk production costs and for the purpose of ensuring reproduction of milk.
(Mechanism of Compensation Price for Producers of Milk for Manufacturing Use System)
・Compensation Price Grant = Subsidy Unit Price x authroised amount Maximum limit is set by theMinister of Agriculture, Forestry and Fiseries
CentralGovernment
Agricultureand Livestock
IndustriesCorporation
Grant
Prefectures(or Central
Government)
Designatedraw milk
producers'organisations
Raw MilkProducers
(Dairyfarmers)
Grantapplication
Grantapplication
Amountauthorisation
Price
(Inclusive of subsidy)
Raw Milk
Dairyprocessors
Compensation Price Grant
Gross Margin of importedReport on amount
of raw milkmanufactured
(Method of producer subsidy)
Selling
priceProducers'net
income
Organisation A
Selling price of raw milk forprocessing use is decidedbetween producers'organisations and dairyprocessors.
※Subsidy unit ptice in 2011 - 11.95 JPY / kg
(2)The import of designated dairy products
1.Corporation imports and sells designated dairy products (butter, Skimmed Milk Powder, etc.), which amount is set andnotified by the Minister of Agriculture, Forestry and Fisheries according to the international agreement.2.Corporation executes imports and sales of designated dairy products of various countries in case that prices of suchproducts rise or are possible to rise.3.Under the Customs Law, it is regulated that the importers of designated dairy products must sell the relevant designateddairy products to the Corporation, and Corporation must sell back such products to the importers.
Raw MilkPrice
Organisation B
Organisation C
Organisation D
Organisation E
23
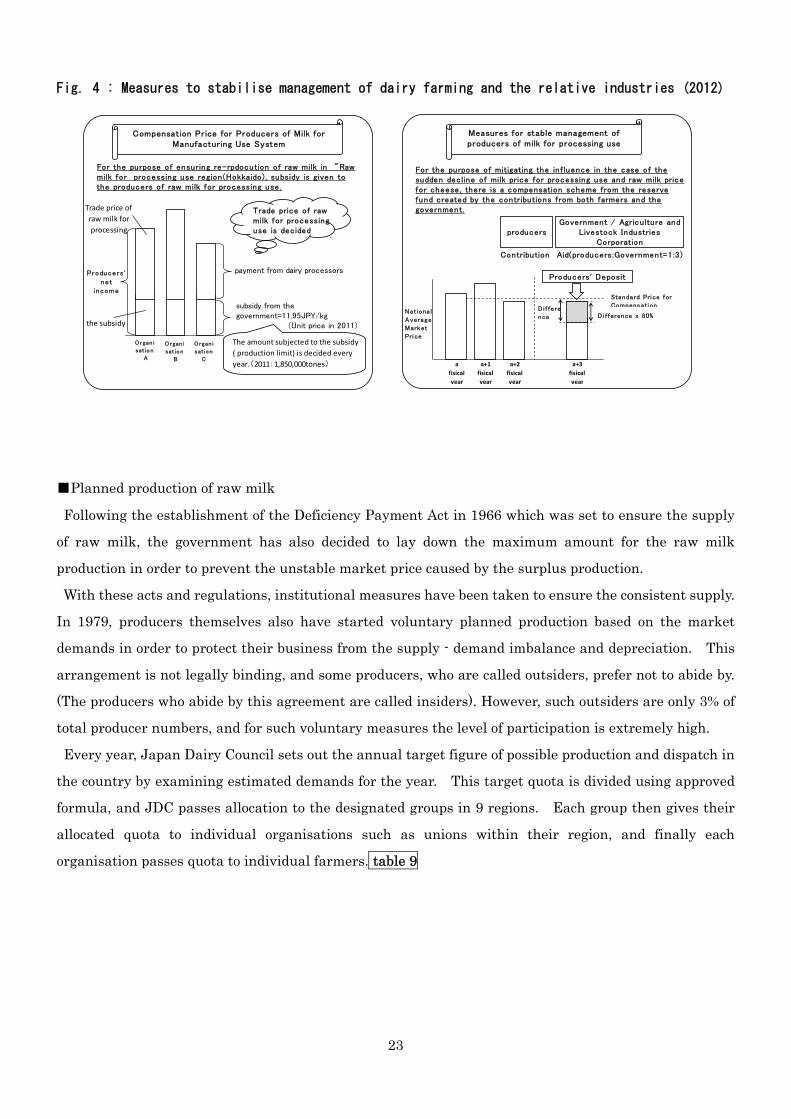
Fig. 4 : Measures to stabilise management of dairy farming and the relative industries (2012)
■Planned production of raw milk
Following the establishment of the Deficiency Payment Act in 1966 which was set to ensure the supply
of raw milk, the government has also decided to lay down the maximum amount for the raw milk
production in order to prevent the unstable market price caused by the surplus production.
With these acts and regulations, institutional measures have been taken to ensure the consistent supply.
In 1979, producers themselves also have started voluntary planned production based on the market
demands in order to protect their business from the supply - demand imbalance and depreciation. This
arrangement is not legally binding, and some producers, who are called outsiders, prefer not to abide by.
(The producers who abide by this agreement are called insiders). However, such outsiders are only 3% of
total producer numbers, and for such voluntary measures the level of participation is extremely high.
Every year, Japan Dairy Council sets out the annual target figure of possible production and dispatch in
the country by examining estimated demands for the year. This target quota is divided using approved
formula, and JDC passes allocation to the designated groups in 9 regions. Each group then gives their
allocated quota to individual organisations such as unions within their region, and finally each
organisation passes quota to individual farmers. table 9
Compensation Price for Producers of Milk forManufactur ing Use System
For the purpose of ensuring re-rpdocution of raw milk in "Rawmilk for processing use region(Hokkaido) , subsidy is given tothe producers of raw milk for processing use.
Producers'ne t
income
payment from dairy processors
subsidy from thegovernment=11.95JPY/kg (Unit price in 2011)
The amount subjected to the subsidy( production limit) is decided everyyear.(2011:1,850,000tones)
Trade price of rawmilk for processinguse is decidedb d '
Measures for stable management ofproducers of milk for processing use
For the purpose of mitigating the inf luence in the case of thesudden decline of milk price for processing use and raw milk pricefor cheese , there is a compensation scheme from the reservefund created by the contributions from both farmers and thegovernment.
afisicalyear
a+1fisicalyear
a+2fisicalyear
a+3fisicalyear
producersGovernment / Agriculture and
Livestock IndustriesCorporation
Contribution Aid(producers:Government=1:3)
Producers' Deposit
Di f fere
nce
Standard Pri ce for
Compensation
Di f ference x 80%
Trade price ofraw milk forprocessing
the subsidy
Organ i
sat ion
A
Organ i
sat ion
B
Organ i
sat ion
C
Nationa l
Average
Market
Pri ce
24
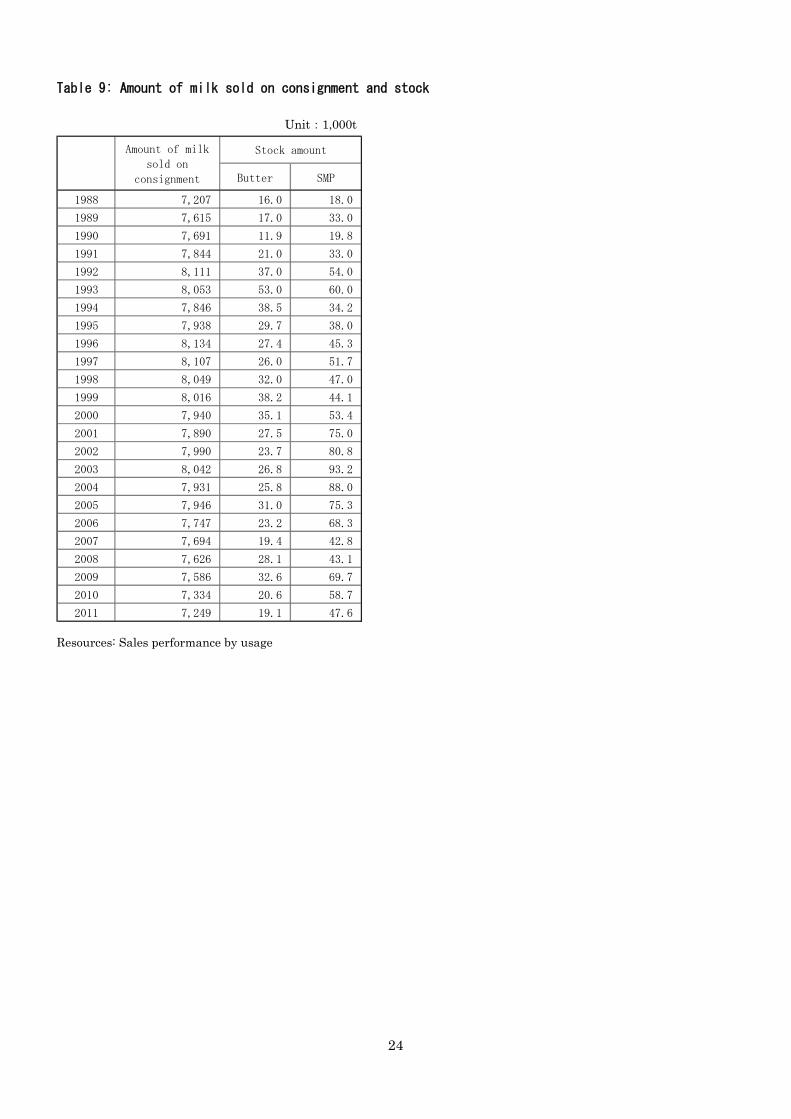
Table 9: Amount of milk sold on consignment and stock
Resources: Sales performance by usage
Butter SMP
1988 7,207 16.0 18.0
1989 7,615 17.0 33.0
1990 7,691 11.9 19.8
1991 7,844 21.0 33.0
1992 8,111 37.0 54.0
1993 8,053 53.0 60.0
1994 7,846 38.5 34.2
1995 7,938 29.7 38.0
1996 8,134 27.4 45.3
1997 8,107 26.0 51.7
1998 8,049 32.0 47.0
1999 8,016 38.2 44.1
2000 7,940 35.1 53.4
2001 7,890 27.5 75.0
2002 7,990 23.7 80.8
2003 8,042 26.8 93.2
2004 7,931 25.8 88.0
2005 7,946 31.0 75.3
2006 7,747 23.2 68.3
2007 7,694 19.4 42.8
2008 7,626 28.1 43.1
2009 7,586 32.6 69.7
2010 7,334 20.6 58.7
2011 7,249 19.1 47.6
Stock amountAmount of milk
sold on
consignment
Unit:1,000t
25
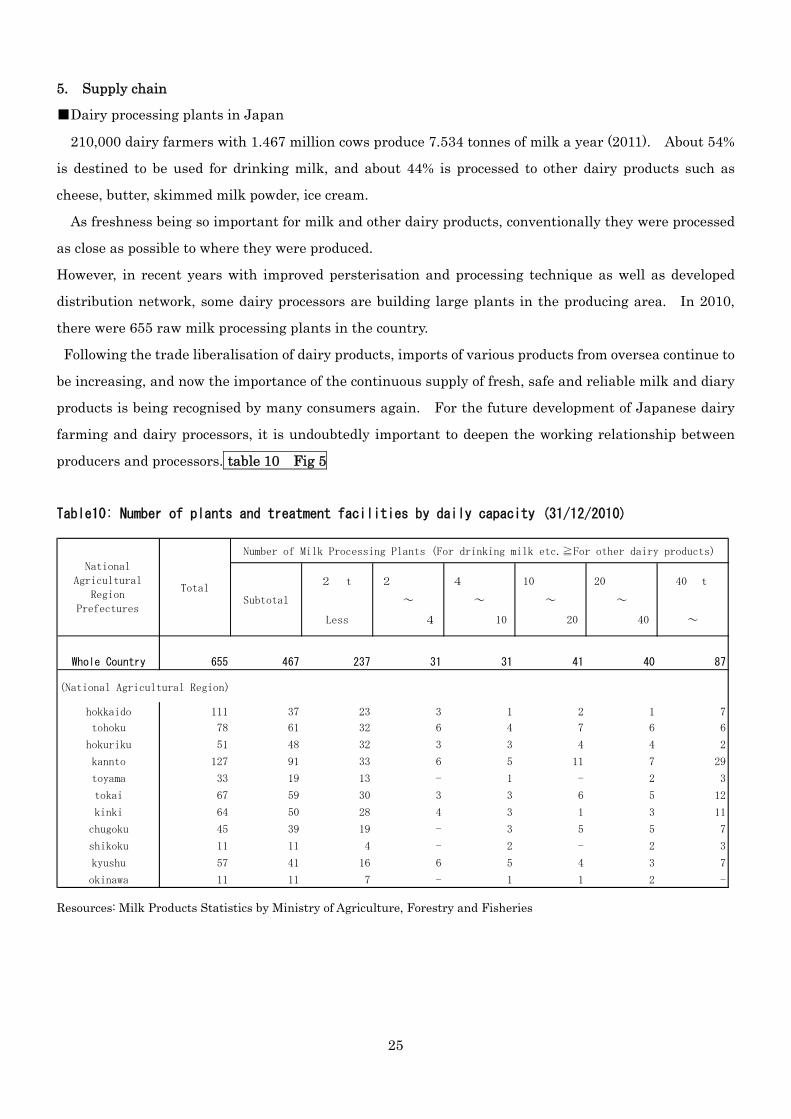
5. Supply chain
■Dairy processing plants in Japan
210,000 dairy farmers with 1.467 million cows produce 7.534 tonnes of milk a year (2011). About 54%
is destined to be used for drinking milk, and about 44% is processed to other dairy products such as
cheese, butter, skimmed milk powder, ice cream.
As freshness being so important for milk and other dairy products, conventionally they were processed
as close as possible to where they were produced.
However, in recent years with improved persterisation and processing technique as well as developed
distribution network, some dairy processors are building large plants in the producing area. In 2010,
there were 655 raw milk processing plants in the country.
Following the trade liberalisation of dairy products, imports of various products from oversea continue to
be increasing, and now the importance of the continuous supply of fresh, safe and reliable milk and diary
products is being recognised by many consumers again. For the future development of Japanese dairy
farming and dairy processors, it is undoubtedly important to deepen the working relationship between
producers and processors. table 10 Fig 5
Table10: Number of plants and treatment facilities by daily capacity (31/12/2010)
2 t 2 4 10 20 40 t
Subtotal ~ ~ ~ ~
Less 4 10 20 40 ~
Whole Country 655 467 237 31 31 41 40 87
(National Agricultural Region)
hokkaido 111 37 23 3 1 2 1 7
tohoku 78 61 32 6 4 7 6 6
hokuriku 51 48 32 3 3 4 4 2
kannto 127 91 33 6 5 11 7 29
toyama 33 19 13 - 1 - 2 3
tokai 67 59 30 3 3 6 5 12
kinki 64 50 28 4 3 1 3 11
chugoku 45 39 19 - 3 5 5 7
shikoku 11 11 4 - 2 - 2 3
kyushu 57 41 16 6 5 4 3 7
okinawa 11 11 7 - 1 1 2 -
National
Agricultural
Region
Prefectures
Number of Milk Processing Plants (For drinking milk etc.≧For other dairy products)
Total
Resources: Milk Products Statistics by Ministry of Agriculture, Forestry and Fisheries
26
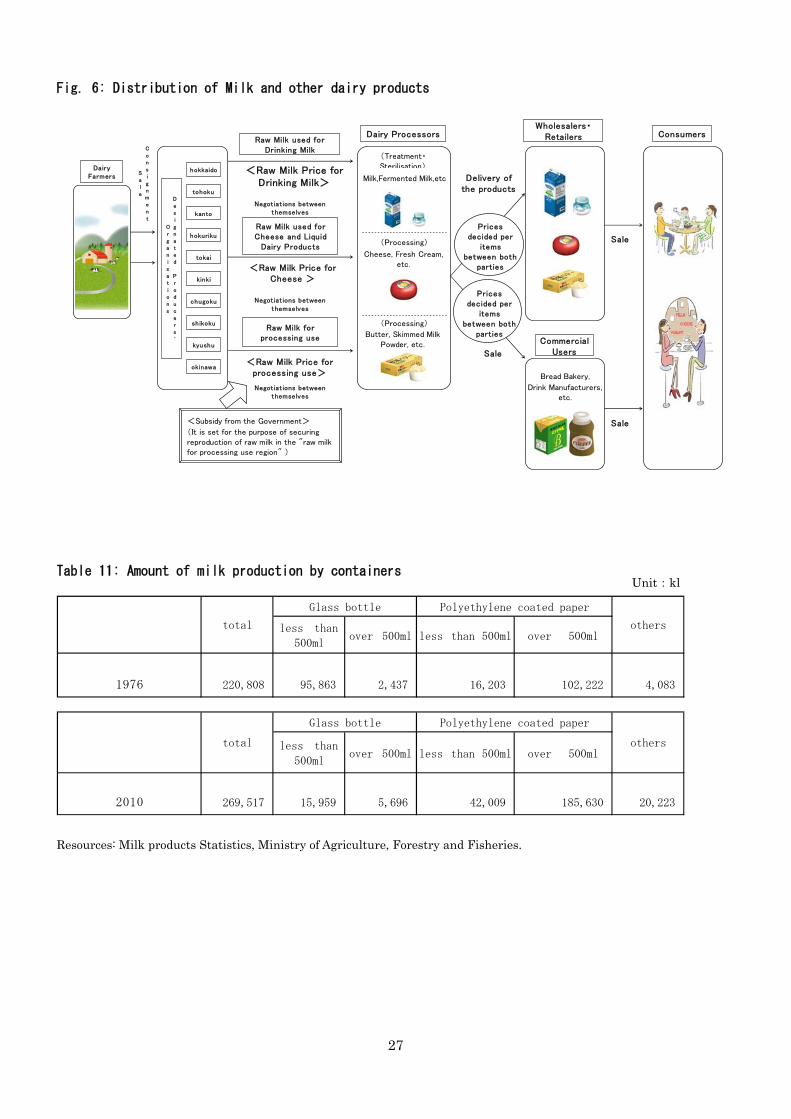
Fig 5: Manufacturing process of milk and other dairy products
■Distribution of milk and other dairy products
About 98% of raw milk produced by dairy farmers is sold to dairy processors through the milk producer
organisations designated by the Minister of Agriculture, Forestry and Fisheries or the governors of
prefectures by law. At the factories, purchased raw milk is processed to drinking milk and other dairy
products, then sold to wholesalers / retailers or to bread baking factories and drink manufacturers.
During post war period, school lunch was introduced at primary schools, and children started drinking
milk. Milk consumption at homes also started to grow, and its main distribution was through door step
delivery by specialist milk retailers.
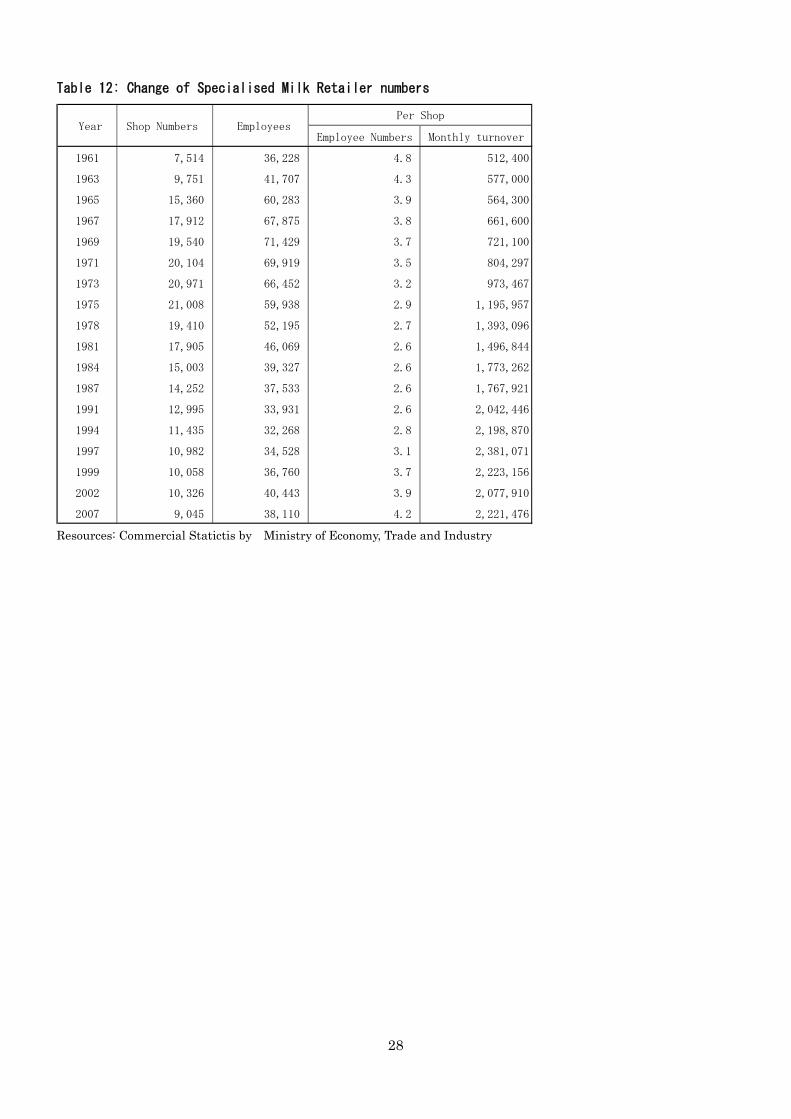
From around 1965, supermarkets were established especially in urban areas, and they started selling
milk. Around 1975, convenience stores, which are open for 24 hours, have also joined in the milk sales
competition, resulting the declining share of specialist milk retailers. table 12
About 50% of milk containers were glass bottles in 1976, but cartons were introduced and spread
rapidly. In 2011 only 8% of containers were glass bottles, instead cartons have increased to 85%.
As these figures show, the increased sales at supermarkets and convenience stores are very much linked
to the increase of cartons usage. Fig 6 table 11
Raw Milk
HeatSterilisation
Separating Milk Fatby Centrifugal
Separation
Separating Solidcurdled by adding
Enzyme
Cream
Skimmed Mi lk
Curd
Whey
Mi lk Fat
Others
Curdl ing
Liqu id
Dr inking Mi lk
Fermented Mi lkProcessed Mi lk
Mi lk Dr ink
Beat as removingair and water
Concentrate andDry
Concentration
Maturing
Drying
Fresh Cream
Butter
Liqu id
So l id
Skimmed Mi lkPowder
Powdery
ConcentratedSkimmed Mi lk
Liqu id
Cheese
Approximately10kg producedfrom 100kg of
raw milk
Bread,Confectioneries,Drink, etc.
Approximately29kg producedfrom 100kg of
raw milk
Approximately9kg producedfrom 100kg of
raw milk
Approximately5kg producedfrom 100kg of
raw milk
Approximately9kg producedfrom 100kg of
raw milk
Whey Powder
27
Fig. 6: Distribution of Milk and other dairy products
Table 11: Amount of milk production by containers
Resources: Milk products Statistics, Ministry of Agriculture, Forestry and Fisheries.
DairyFarmers
Consignment
Sale
hokkaido
tohoku
kanto
hokuriku
tokai
kinki
chugoku
sh ikoku
kyushu
okinawa
Designated Producers'
Organisations
Raw Milk used forDrinking Milk
<Raw Milk Price forDrinking Milk>
Negotiations betweenthemselves
Raw Milk used forCheese and Liquid
Dairy Products
<Raw Milk Price forCheese >
Negotiations betweenthemselves
<Raw Milk Price forprocessing use>
Negotiations betweenthemselves
Raw Milk forprocessing use
Dairy Processors
(Treatment・Sterilisation)
Milk,Fermented Milk,etc
(Processing)
Cheese, Fresh Cream,etc.
(Processing)
Butter, Skimmed MilkPowder, etc.
Wholesalers・Retailers
Pricesdecided per
itemsbetween both
parties
CommercialUsers
Delivery ofthe products
Sale
Bread Bakery,
Drink Manufacturers,etc.
Sale
Sale
Consumers
<Subsidy from the Government>
(It is set for the purpose of securingreproduction of raw milk in the "raw milkfor processing use region" )
Pricesdecided per
itemsbetween both
parties
Unit:kl
less than
500mlover 500ml less than 500ml over 500ml
(1) (2) (3) (4) (5) (6)
220,808 95,863 2,437 16,203 102,222 4,083
less than
500mlover 500ml less than 500ml over 500ml
(1) (2) (3) (4) (5) (6)
269,517 15,959 5,696 42,009 185,630 20,223
Glass bottle Polyethylene coated paper
2010
others
1976
total
Glass bottle Polyethylene coated paper
others
total
28
Table 12: Change of Specialised Milk Retailer numbers
Employee Numbers Monthly turnover
1961 7,514 36,228 4.8 512,400
1963 9,751 41,707 4.3 577,000
1965 15,360 60,283 3.9 564,300
1967 17,912 67,875 3.8 661,600
1969 19,540 71,429 3.7 721,100
1971 20,104 69,919 3.5 804,297
1973 20,971 66,452 3.2 973,467
1975 21,008 59,938 2.9 1,195,957
1978 19,410 52,195 2.7 1,393,096
1981 17,905 46,069 2.6 1,496,844
1984 15,003 39,327 2.6 1,773,262
1987 14,252 37,533 2.6 1,767,921
1991 12,995 33,931 2.6 2,042,446
1994 11,435 32,268 2.8 2,198,870
1997 10,982 34,528 3.1 2,381,071
1999 10,058 36,760 3.7 2,223,156
2002 10,326 40,443 3.9 2,077,910
2007 9,045 38,110 4.2 2,221,476
Per Shop Year Shop Numbers Employees
Resources: Commercial Statictis by Ministry of Economy, Trade and Industry
29
6. Current situation of consumption
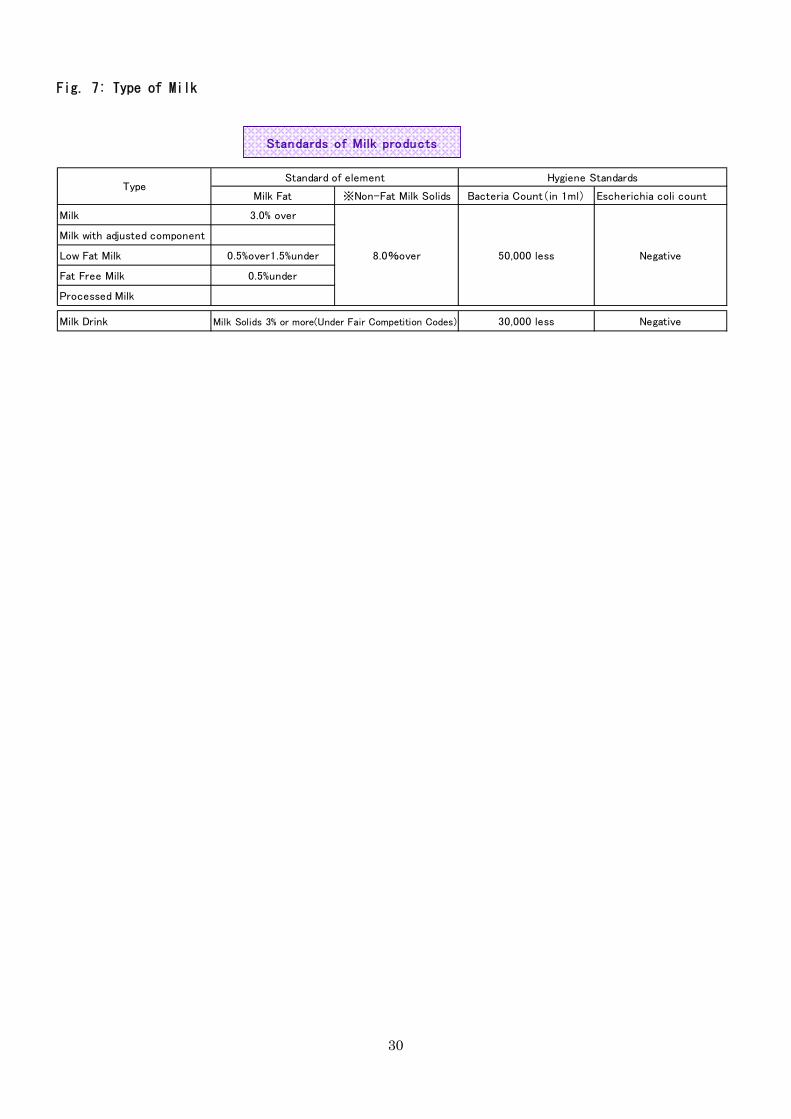
■Types of milk
Currently, there are six types of drinking milk sold in Japan, gyunyu = cow's milk / whole milk
(component not adjusted), low fat milk, fat free milk, milk with adjusted component, processed milk, milk
drink. These labelling and component standards are regulated by " Ministerial Ordinance concerning the
ingredient standards for milk and dairy products " under the Food Hygiene Law, and in regards to the
labeling the detail is set out by the dairy industry's voluntary regulation "Code of Fair Competition
Concerning Labeling of Drinking Milk ".
Whole milk
It is 100% pure cow's milk which is just sterilised with heat. It is prohibited to mix anything but raw
milk, and milk fat to be over 3%, and non-fat milk solids (components excluding milk fat and liquid) to be
over 8%. Half moon shape notch can be found on top of many cartons for visually impaired people to
recognise milk easily.
Low fat milk
It is milk with milk fat excluded. Milk fat is reduced to 0.5-1.5%. Non-fat milk solids level is the same
as whole milk at over 8%. Only raw milk is used with no other ingredients.
Fat free milk
It is milk with milk fat to be reduced under 0.5%. Non-fat milk solids level is the same at over 8%, and
only raw milk is used without any other ingredients.
Components adjusted milk
Specific components only are excluded from raw milk. Again, only raw milk is used without any other
ingredients. For example, milk adusted with milk fat at 1.5-3.0% and non-fat milk solids at over 8% is
classified in this category.
Processed milk
Raw milk mixed with butter, cream and/or skimmed milk powder. Non-fat milk solids is at over 8%.
Milk drink
Dairy products such as raw milk, butter, cream and skimmed milk powder mixed with non-dairy products
normally not found in milk such as coffee extracts, fruit juice, minerals like iron, calcium and vitamins.
Fig 7
30
Fig. 7: Type of Milk
Milk Fat ※Non-Fat Milk Solids Bacteria Count(in 1ml) Escherichia coli count
Milk 3.0% over
Milk with adjusted component
Low Fat Milk 0.5%over1.5%under
Fat Free Milk 0.5%under
Processed Milk
Milk Drink Milk Solids 3% or more(Under Fair Competition Codes) 30,000 less Negative
TypeStandard of element Hygiene Standards
8.0%over 50,000 less Negative
Standards of Milk products
31
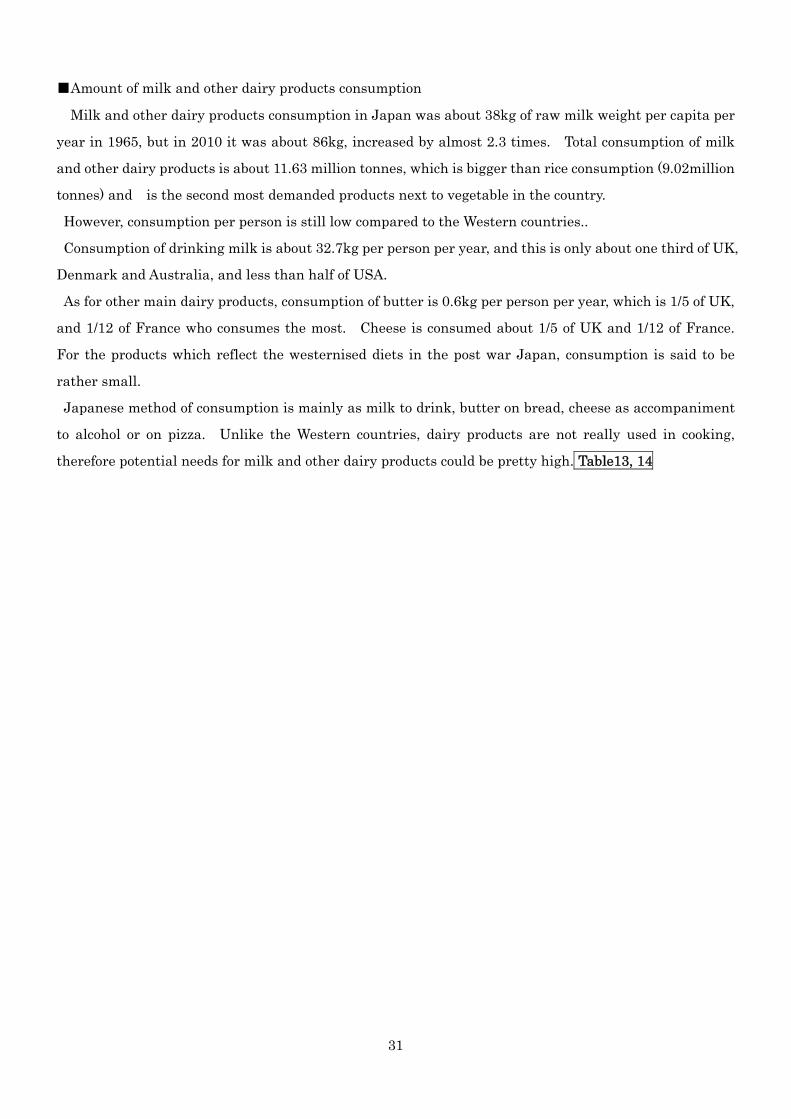
■Amount of milk and other dairy products consumption
Milk and other dairy products consumption in Japan was about 38kg of raw milk weight per capita per
year in 1965, but in 2010 it was about 86kg, increased by almost 2.3 times. Total consumption of milk
and other dairy products is about 11.63 million tonnes, which is bigger than rice consumption (9.02million
tonnes) and is the second most demanded products next to vegetable in the country.
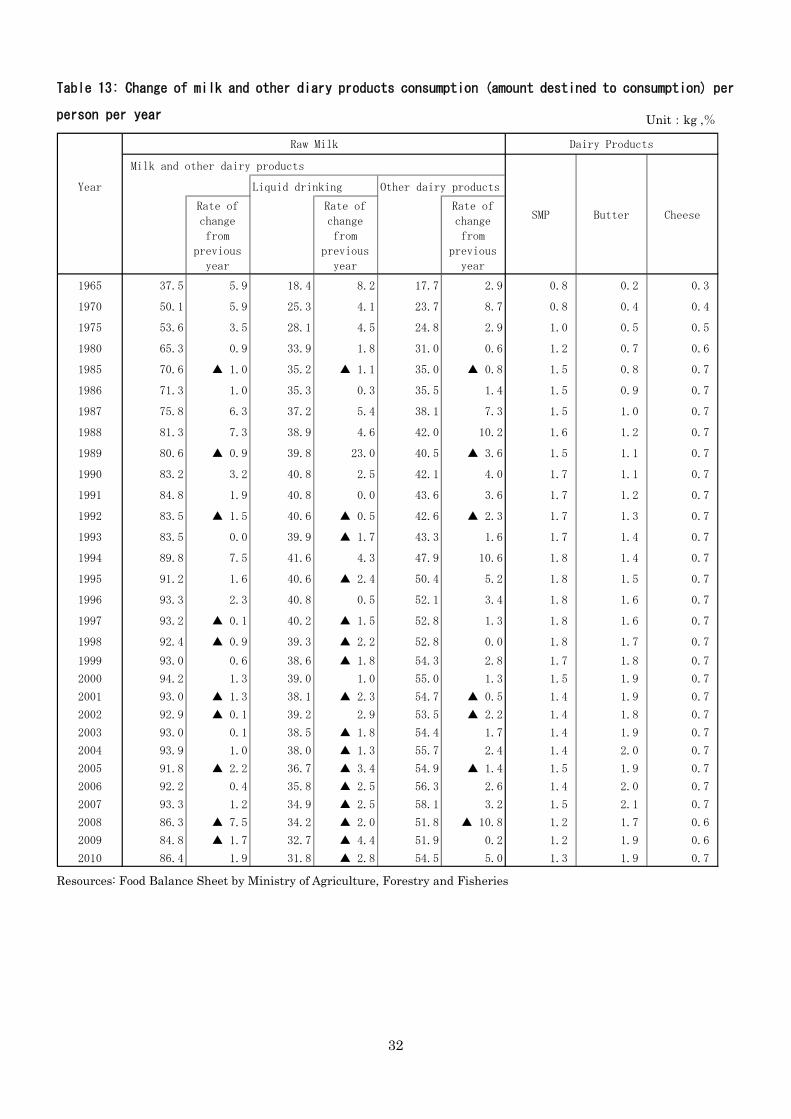
However, consumption per person is still low compared to the Western countries..
Consumption of drinking milk is about 32.7kg per person per year, and this is only about one third of UK,
Denmark and Australia, and less than half of USA.
As for other main dairy products, consumption of butter is 0.6kg per person per year, which is 1/5 of UK,
and 1/12 of France who consumes the most. Cheese is consumed about 1/5 of UK and 1/12 of France.
For the products which reflect the westernised diets in the post war Japan, consumption is said to be
rather small.
Japanese method of consumption is mainly as milk to drink, butter on bread, cheese as accompaniment
to alcohol or on pizza. Unlike the Western countries, dairy products are not really used in cooking,
therefore potential needs for milk and other dairy products could be pretty high. Table13, 14
32
Table 13: Change of milk and other diary products consumption (amount destined to consumption) per
person per year
Resources: Food Balance Sheet by Ministry of Agriculture, Forestry and Fisheries
Unit:kg ,%
Milk and other dairy products
Year Liquid drinking Other dairy products
1965 37.5 5.9 18.4 8.2 17.7 2.9 0.8 0.2 0.3
1970 50.1 5.9 25.3 4.1 23.7 8.7 0.8 0.4 0.4
1975 53.6 3.5 28.1 4.5 24.8 2.9 1.0 0.5 0.5
1980 65.3 0.9 33.9 1.8 31.0 0.6 1.2 0.7 0.6
1985 70.6 ▲ 1.0 35.2 ▲ 1.1 35.0 ▲ 0.8 1.5 0.8 0.7
1986 71.3 1.0 35.3 0.3 35.5 1.4 1.5 0.9 0.7
1987 75.8 6.3 37.2 5.4 38.1 7.3 1.5 1.0 0.7
1988 81.3 7.3 38.9 4.6 42.0 10.2 1.6 1.2 0.7
1989 80.6 ▲ 0.9 39.8 23.0 40.5 ▲ 3.6 1.5 1.1 0.7
1990 83.2 3.2 40.8 2.5 42.1 4.0 1.7 1.1 0.7
1991 84.8 1.9 40.8 0.0 43.6 3.6 1.7 1.2 0.7
1992 83.5 ▲ 1.5 40.6 ▲ 0.5 42.6 ▲ 2.3 1.7 1.3 0.7
1993 83.5 0.0 39.9 ▲ 1.7 43.3 1.6 1.7 1.4 0.7
1994 89.8 7.5 41.6 4.3 47.9 10.6 1.8 1.4 0.7
1995 91.2 1.6 40.6 ▲ 2.4 50.4 5.2 1.8 1.5 0.7
1996 93.3 2.3 40.8 0.5 52.1 3.4 1.8 1.6 0.7
1997 93.2 ▲ 0.1 40.2 ▲ 1.5 52.8 1.3 1.8 1.6 0.7
1998 92.4 ▲ 0.9 39.3 ▲ 2.2 52.8 0.0 1.8 1.7 0.7
1999 93.0 0.6 38.6 ▲ 1.8 54.3 2.8 1.7 1.8 0.7
2000 94.2 1.3 39.0 1.0 55.0 1.3 1.5 1.9 0.7
2001 93.0 ▲ 1.3 38.1 ▲ 2.3 54.7 ▲ 0.5 1.4 1.9 0.7
2002 92.9 ▲ 0.1 39.2 2.9 53.5 ▲ 2.2 1.4 1.8 0.7
2003 93.0 0.1 38.5 ▲ 1.8 54.4 1.7 1.4 1.9 0.7
2004 93.9 1.0 38.0 ▲ 1.3 55.7 2.4 1.4 2.0 0.7
2005 91.8 ▲ 2.2 36.7 ▲ 3.4 54.9 ▲ 1.4 1.5 1.9 0.7
2006 92.2 0.4 35.8 ▲ 2.5 56.3 2.6 1.4 2.0 0.7
2007 93.3 1.2 34.9 ▲ 2.5 58.1 3.2 1.5 2.1 0.7
2008 86.3 ▲ 7.5 34.2 ▲ 2.0 51.8 ▲ 10.8 1.2 1.7 0.6
2009 84.8 ▲ 1.7 32.7 ▲ 4.4 51.9 0.2 1.2 1.9 0.6
2010 86.4 1.9 31.8 ▲ 2.8 54.5 5.0 1.3 1.9 0.7
Raw Milk Dairy Products
SMP Butter CheeseRate of
change
from
previous
year
Rate of
change
from
previous
year
Rate of
change
from
previous
year
33
Table 14: International Comparison of Dairy Farming (2010)
Resources:IDF『World Dairy Situation」、AMI「Marktbilamz Milch 2011」、CDC「ANNUAL REPORT」、USDA「Milk Production」、「Farms,Land in Farms, and Livestock Operations」DairyAustralia「Australian Dairy Industry In Focus 2011」、LIC「Dairy Statistic 2010/2011」、Livestock Statistics, Milk Products Statistics, Statistics of Agricultural Products prices by Ministry of Agriculture, Forestry and Fiesheries. Note: Figures for Hokkaido Japan is of 2010. Currency exchange rate by Mitsubishi Tokyo UFJ Bank (TTS Market) is used For Raw Milk production and Average production yield per cow, figures were calculated using 1 pound=0.45kg for USA, 1 litre=1.03KG for Australia and NZ.
Unit Netherlands France Germany Denmark UK Canada USA Australia NZ Japan Hokkaido
Number of parous cows 1000 1,479 3,729 4,182 573 1,847 987 9,117 1,600 4,397 933 480
Number of Farms 1000 20 82 90 4 16 13 63 7 12 21 8
Number of parous cows per farm 75 45 46 133 117 76 146 230 386 44 64
Raw Milk Production Cost 1000t 11,941 24,000 29,610 4,965 13,935 8,434 86,769 9,374 17,859 7,631 3,897
Average production yield per cow kg 7,440 6,657 7,113 8,589 7,501 9,768 9,517 5,871 3,944 8,046 8,045
Volume of Dairy cheese 1000t 753 1,756 2,169 292 335 349 4,742 333 282 123 18
Products butter 1000t 181 409 449 33 119 83 709 132 478 82 69
SMP 1000t 64 320 261 27 66 72 824 244 363 170 144
Consumption per Drinking milk kg 59.6 58.5 53.0 91.4 107.0 80.3 79.9 105.0 79.7 32.7 -
person Cheese kg 21.2 25.6 22.8 16.2 11.2 12.7 15.0 11.9 6.1 1.9 -
Butter kg 3.4 7.5 6.0 1.8 3.2 2.6 2.2 3.8 3.8 0.6 -
Farm-gate price of raw milk JPY/kg 44.4 38.4 39.6 44.3 36.0 60.4 34.1 30.5 43.3 88.2 77.2
Classification
34
■ Trends of milk retail prices
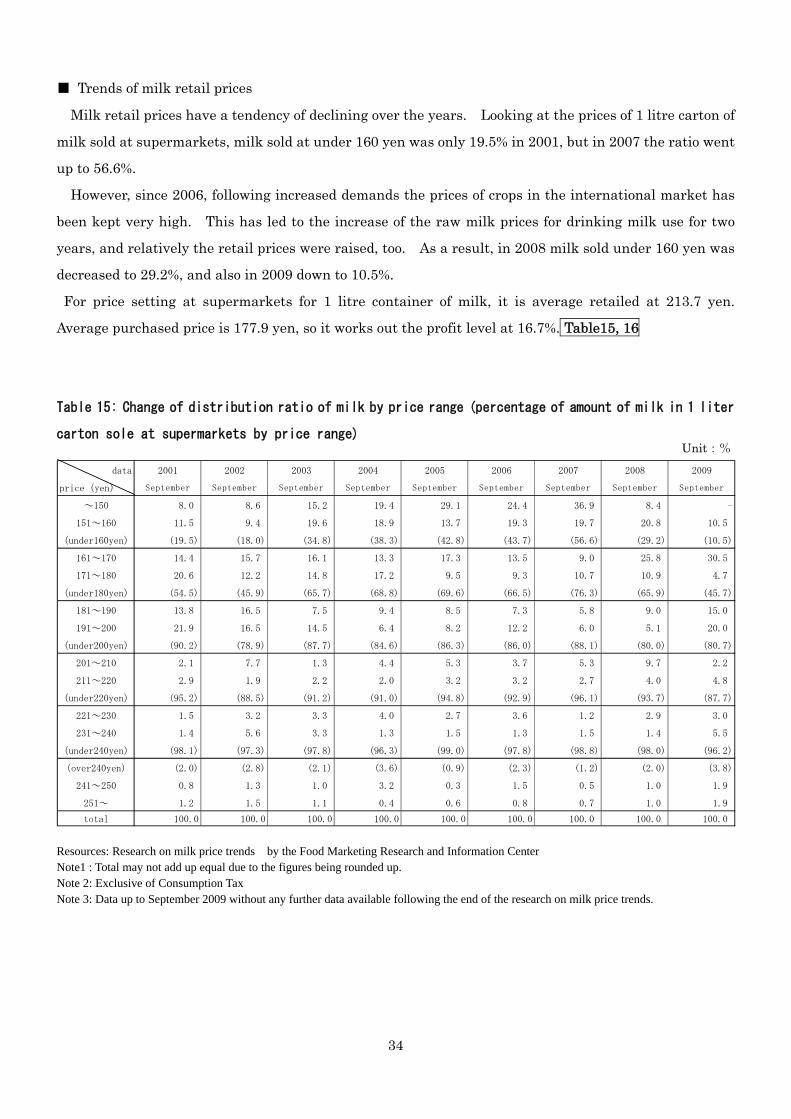
Milk retail prices have a tendency of declining over the years. Looking at the prices of 1 litre carton of
milk sold at supermarkets, milk sold at under 160 yen was only 19.5% in 2001, but in 2007 the ratio went
up to 56.6%.
However, since 2006, following increased demands the prices of crops in the international market has
been kept very high. This has led to the increase of the raw milk prices for drinking milk use for two
years, and relatively the retail prices were raised, too. As a result, in 2008 milk sold under 160 yen was
decreased to 29.2%, and also in 2009 down to 10.5%.
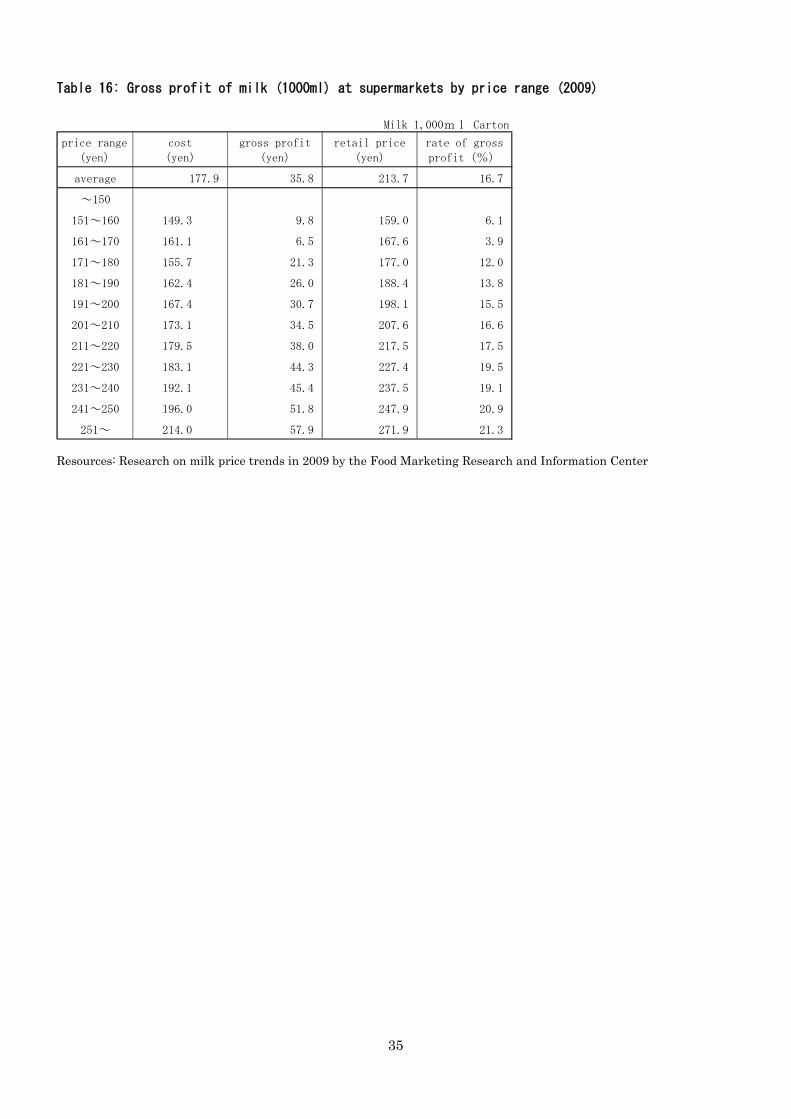
For price setting at supermarkets for 1 litre container of milk, it is average retailed at 213.7 yen.
Average purchased price is 177.9 yen, so it works out the profit level at 16.7%. Table15, 16
Table 15: Change of distribution ratio of milk by price range (percentage of amount of milk in 1 liter
carton sole at supermarkets by price range)
Resources: Research on milk price trends by the Food Marketing Research and Information Center Note1 : Total may not add up equal due to the figures being rounded up. Note 2: Exclusive of Consumption Tax Note 3: Data up to September 2009 without any further data available following the end of the research on milk price trends.
data 2001 2002 2003 2004 2005 2006 2007 2008 2009
price(yen) September September September September September September September September September
~150 8.0 8.6 15.2 19.4 29.1 24.4 36.9 8.4 -
151~160 11.5 9.4 19.6 18.9 13.7 19.3 19.7 20.8 10.5
(under160yen) (19.5) (18.0) (34.8) (38.3) (42.8) (43.7) (56.6) (29.2) (10.5)
161~170 14.4 15.7 16.1 13.3 17.3 13.5 9.0 25.8 30.5
171~180 20.6 12.2 14.8 17.2 9.5 9.3 10.7 10.9 4.7
(under180yen) (54.5) (45.9) (65.7) (68.8) (69.6) (66.5) (76.3) (65.9) (45.7)
181~190 13.8 16.5 7.5 9.4 8.5 7.3 5.8 9.0 15.0
191~200 21.9 16.5 14.5 6.4 8.2 12.2 6.0 5.1 20.0
(under200yen) (90.2) (78.9) (87.7) (84.6) (86.3) (86.0) (88.1) (80.0) (80.7)
201~210 2.1 7.7 1.3 4.4 5.3 3.7 5.3 9.7 2.2
211~220 2.9 1.9 2.2 2.0 3.2 3.2 2.7 4.0 4.8
(under220yen) (95.2) (88.5) (91.2) (91.0) (94.8) (92.9) (96.1) (93.7) (87.7)
221~230 1.5 3.2 3.3 4.0 2.7 3.6 1.2 2.9 3.0
231~240 1.4 5.6 3.3 1.3 1.5 1.3 1.5 1.4 5.5
(under240yen) (98.1) (97.3) (97.8) (96.3) (99.0) (97.8) (98.8) (98.0) (96.2)
(over240yen) (2.0) (2.8) (2.1) (3.6) (0.9) (2.3) (1.2) (2.0) (3.8)
241~250 0.8 1.3 1.0 3.2 0.3 1.5 0.5 1.0 1.9
251~ 1.2 1.5 1.1 0.4 0.6 0.8 0.7 1.0 1.9
total 100.0 100.0 100.0 100.0 100.0 100.0 100.0 100.0 100.0
Unit:%
35
Table 16: Gross profit of milk (1000ml) at supermarkets by price range (2009)
Resources: Research on milk price trends in 2009 by the Food Marketing Research and Information Center
Milk 1,000ml Carton
price range
(yen)
cost
(yen)
gross profit
(yen)
retail price
(yen)
rate of gross
profit(%)
average 177.9 35.8 213.7 16.7
~150
151~160 149.3 9.8 159.0 6.1
161~170 161.1 6.5 167.6 3.9
171~180 155.7 21.3 177.0 12.0
181~190 162.4 26.0 188.4 13.8
191~200 167.4 30.7 198.1 15.5
201~210 173.1 34.5 207.6 16.6
211~220 179.5 38.0 217.5 17.5
221~230 183.1 44.3 227.4 19.5
231~240 192.1 45.4 237.5 19.1
241~250 196.0 51.8 247.9 20.9
251~ 214.0 57.9 271.9 21.3
36
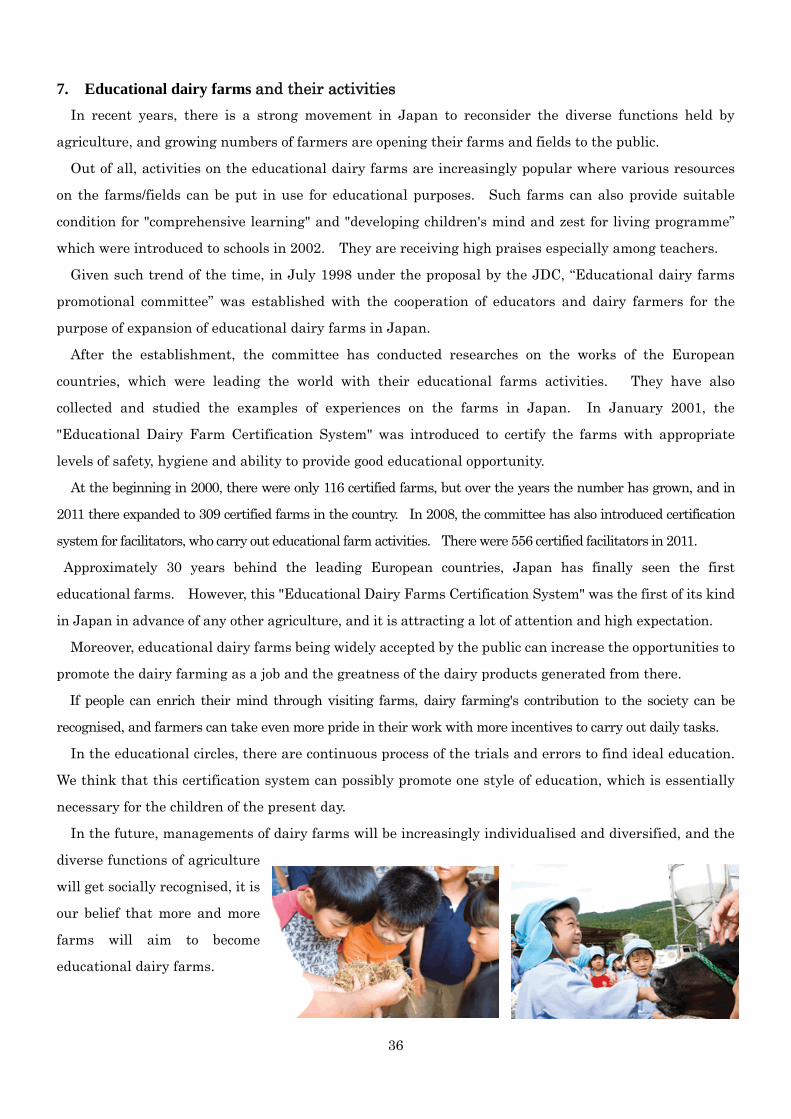
7. Educational dairy farms and their activities
In recent years, there is a strong movement in Japan to reconsider the diverse functions held by
agriculture, and growing numbers of farmers are opening their farms and fields to the public.
Out of all, activities on the educational dairy farms are increasingly popular where various resources
on the farms/fields can be put in use for educational purposes. Such farms can also provide suitable
condition for "comprehensive learning" and "developing children's mind and zest for living programme”
which were introduced to schools in 2002. They are receiving high praises especially among teachers.
Given such trend of the time, in July 1998 under the proposal by the JDC, “Educational dairy farms
promotional committee” was established with the cooperation of educators and dairy farmers for the
purpose of expansion of educational dairy farms in Japan.
After the establishment, the committee has conducted researches on the works of the European
countries, which were leading the world with their educational farms activities. They have also
collected and studied the examples of experiences on the farms in Japan. In January 2001, the
"Educational Dairy Farm Certification System" was introduced to certify the farms with appropriate
levels of safety, hygiene and ability to provide good educational opportunity.
At the beginning in 2000, there were only 116 certified farms, but over the years the number has grown, and in
2011 there expanded to 309 certified farms in the country. In 2008, the committee has also introduced certification
system for facilitators, who carry out educational farm activities. There were 556 certified facilitators in 2011.
Approximately 30 years behind the leading European countries, Japan has finally seen the first
educational farms. However, this "Educational Dairy Farms Certification System" was the first of its kind
in Japan in advance of any other agriculture, and it is attracting a lot of attention and high expectation.
Moreover, educational dairy farms being widely accepted by the public can increase the opportunities to
promote the dairy farming as a job and the greatness of the dairy products generated from there.
If people can enrich their mind through visiting farms, dairy farming's contribution to the society can be
recognised, and farmers can take even more pride in their work with more incentives to carry out daily tasks.
In the educational circles, there are continuous process of the trials and errors to find ideal education.
We think that this certification system can possibly promote one style of education, which is essentially
necessary for the children of the present day.
In the future, managements of dairy farms will be increasingly individualised and diversified, and the
diverse functions of agriculture
will get socially recognised, it is
our belief that more and more
farms will aim to become
educational dairy farms.