Embed Size (px)
Citation preview

Nutrition Smart Agriculture in GuatemalaNutrition Smart Agriculture (NSmartAg) aims to simultaneously improve agriculture incomes and nutrition outcomes through agriculture interventions. NSmartAg practices and technologies contribute to address local nutrition issues and increase farm and/ or agribusiness productivity and income (Figure 1). It is a building block of food systems that promote healthy people, a healthy planet, and healthy economies.
Actions taken in the agricultural sector impact people’s nutrition—it’s where decisions are made on what and how much to produce, as well as the techniques that can be used to boost a food’s nutritional content. Not leveraging the agriculture sector to contribute to nutrition outcomes is a missed opportunity. Agriculture and food production have been shown to be key drivers of nutrition outcomes. Failing to act on nutrition has staggeringly high economic and social costs for countries and the negative effects of poor nutrition can span entire lives and generations. Human capital – the sum total of a population’s health, nutrition, skills, knowledge and experience – is estimated to account for over two-thirds of total global wealth [1], and 10-30% of the cross-country differences in gross domestic product (GDP) per capita can be linked to variations in human capital [2]. Malnutrition is intrinsically connected to human capital as undernutrition contributes to 45% of child mortality, and stunting is known to be associated with lost productivity and earnings in adulthood. Adding all these up, the global economic cost
Government of Japan
Financial support for this work was provided by the Government of Japan through the Japan Trust Fund for Scaling Up Nutrition.
Figure 1: Nutrition Smart Agriculture has two aims
Contribute to improved nutrition
Increase farm and/ or agribusiness productivity and income
Nutrition Smart
Agriculture
• Guatemala has the sixth-highest rate of chronic malnutrition in the world, with almost half of children under five years old affected.
• In Latin America, Guatemala is one of the top three countries with the highest rates of deficiency in iron (32%) and zinc (34.9%) in children under five years.
• In addition to differences between rural and urban populations, large gaps are found between indigenous and non-indigenous populations, mainly in those related to child stunting, i.e., zinc and vitamin B12 deficiencies.
• An analysis of available data allows for the identification of major food sources that contribute to the production and consumption of these key nutrients in Guatemala. An illustration of the contribution of the main food groups produced in Guatemala in providing the optimal nutrient intake to contribute to a healthy diet (as defined by the EAT-Lancet Commission) reveals that the production of all food groups falls short of that intake.
• A set of NSmartAg practices were identified in the northwest, southwest, north, and central regions of Guatemala. Dairy products, vegetables, legumes, starchy vegetables, and fish (in the west) were the target food groups for primary production and processing.
• Investments in food safety regulation applicability and technology transfers are the main complementary investments that might propel NSmartAg practices in Guatemala.
Pub
lic D
iscl
osur
e A
utho
rized
Pub
lic D
iscl
osur
e A
utho
rized
Pub
lic D
iscl
osur
e A
utho
rized
Pub
lic D
iscl
osur
e A
utho
rized
2 | Nutrition Smart Agriculture Country Profile
of undernutrition is estimated to be US$ 3 trillion [3]. The prevalence and costs of overweight/obesity are also rising even in low- and middle-income countries where over 70% of the 2 billion overweight/obese people live today [4]. The total economic impact of obesity is estimated to be US$ 2 trillion a year, or 2.8% of world GDP [5].
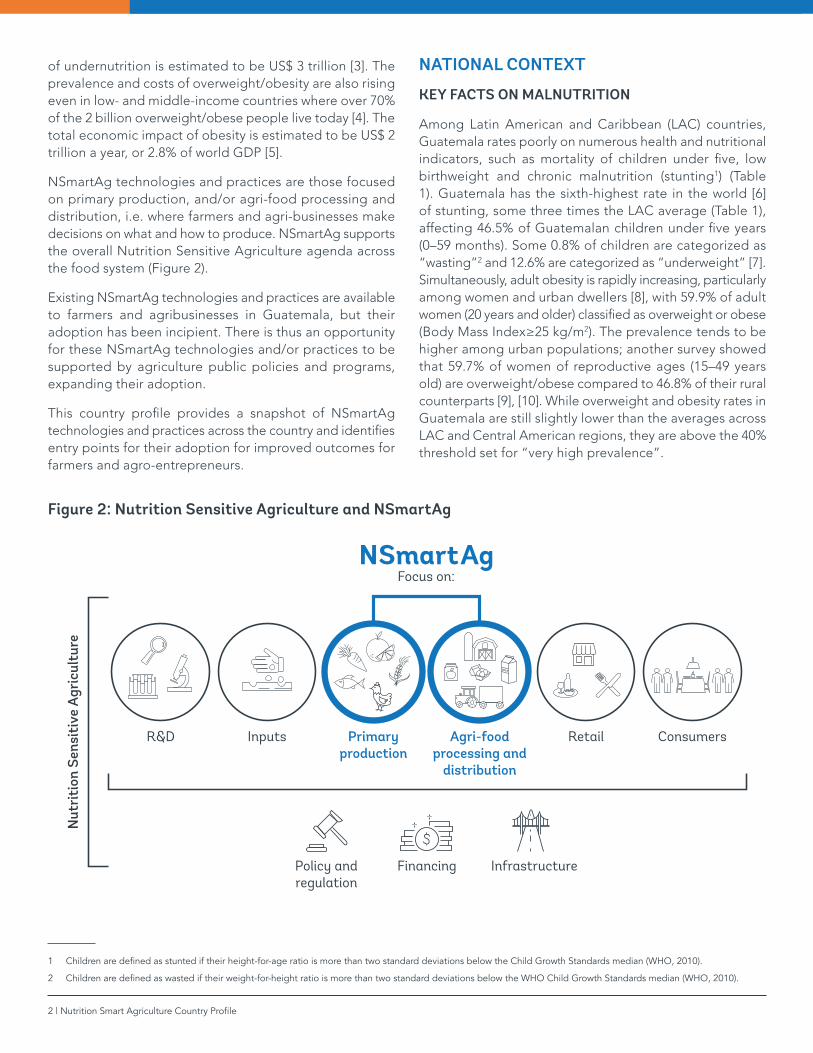
NSmartAg technologies and practices are those focused on primary production, and/or agri-food processing and distribution, i.e. where farmers and agri-businesses make decisions on what and how to produce. NSmartAg supports the overall Nutrition Sensitive Agriculture agenda across the food system (Figure 2).
Existing NSmartAg technologies and practices are available to farmers and agribusinesses in Guatemala, but their adoption has been incipient. There is thus an opportunity for these NSmartAg technologies and/or practices to be supported by agriculture public policies and programs, expanding their adoption.
This country profile provides a snapshot of NSmartAg technologies and practices across the country and identifies entry points for their adoption for improved outcomes for farmers and agro-entrepreneurs.
1 Children are defined as stunted if their height-for-age ratio is more than two standard deviations below the Child Growth Standards median (WHO, 2010).
2 Children are defined as wasted if their weight-for-height ratio is more than two standard deviations below the WHO Child Growth Standards median (WHO, 2010).
NATIONAL CONTEXT
KEY FACTS ON MALNUTRITION
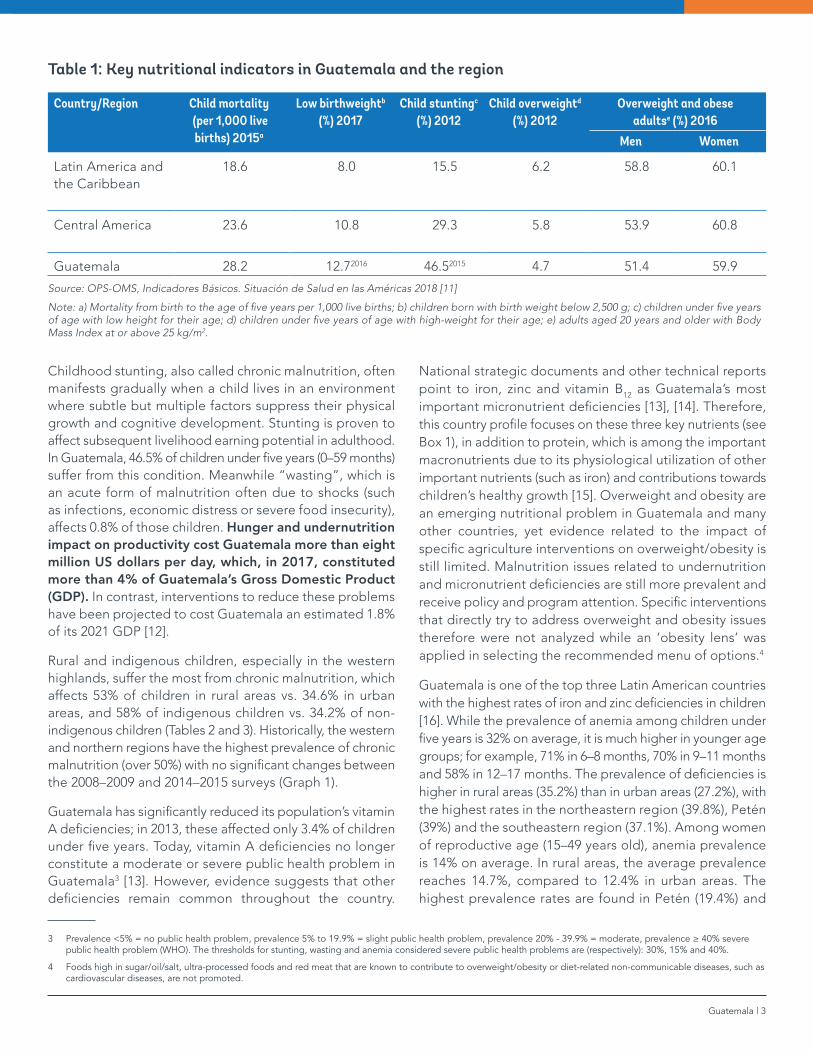
Among Latin American and Caribbean (LAC) countries, Guatemala rates poorly on numerous health and nutritional indicators, such as mortality of children under five, low birthweight and chronic malnutrition (stunting1) (Table 1). Guatemala has the sixth-highest rate in the world [6] of stunting, some three times the LAC average (Table 1), affecting 46.5% of Guatemalan children under five years (0–59 months). Some 0.8% of children are categorized as “wasting”2 and 12.6% are categorized as “underweight” [7]. Simultaneously, adult obesity is rapidly increasing, particularly among women and urban dwellers [8], with 59.9% of adult women (20 years and older) classified as overweight or obese (Body Mass Index≥25 kg/m2). The prevalence tends to be higher among urban populations; another survey showed that 59.7% of women of reproductive ages (15–49 years old) are overweight/obese compared to 46.8% of their rural counterparts [9], [10]. While overweight and obesity rates in Guatemala are still slightly lower than the averages across LAC and Central American regions, they are above the 40% threshold set for “very high prevalence”.
Figure 2: Nutrition Sensitive Agriculture and NSmartAg
NSmartAgFocus on:
R&D
Policy and regulation
Financing Infrastructure
Inputs Primaryproduction
Retail ConsumersAgri-food processing and
distribution
Nut
riti
on S
ensi
tive
Agr
icul
ture
Guatemala | 3
Table 1: Key nutritional indicators in Guatemala and the region
Country/Region Child mortality (per 1,000 live births) 2015a
Low birthweightb
(%) 2017Child stuntingc
(%) 2012Child overweightd
(%) 2012Overweight and obese
adultse (%) 2016Men Women
Latin America and the Caribbean
18.6 8.0 15.5 6.2 58.8 60.1
Central America 23.6 10.8 29.3 5.8 53.9 60.8
Guatemala 28.2 12.72016 46.52015 4.7 51.4 59.9
Source: OPS-OMS, Indicadores Básicos. Situación de Salud en las Américas 2018 [11]
Note: a) Mortality from birth to the age of five years per 1,000 live births; b) children born with birth weight below 2,500 g; c) children under five years of age with low height for their age; d) children under five years of age with high-weight for their age; e) adults aged 20 years and older with Body Mass Index at or above 25 kg/m2.
Childhood stunting, also called chronic malnutrition, often manifests gradually when a child lives in an environment where subtle but multiple factors suppress their physical growth and cognitive development. Stunting is proven to affect subsequent livelihood earning potential in adulthood. In Guatemala, 46.5% of children under five years (0–59 months) suffer from this condition. Meanwhile “wasting”, which is an acute form of malnutrition often due to shocks (such as infections, economic distress or severe food insecurity), affects 0.8% of those children. Hunger and undernutrition impact on productivity cost Guatemala more than eight million US dollars per day, which, in 2017, constituted more than 4% of Guatemala’s Gross Domestic Product (GDP). In contrast, interventions to reduce these problems have been projected to cost Guatemala an estimated 1.8% of its 2021 GDP [12].
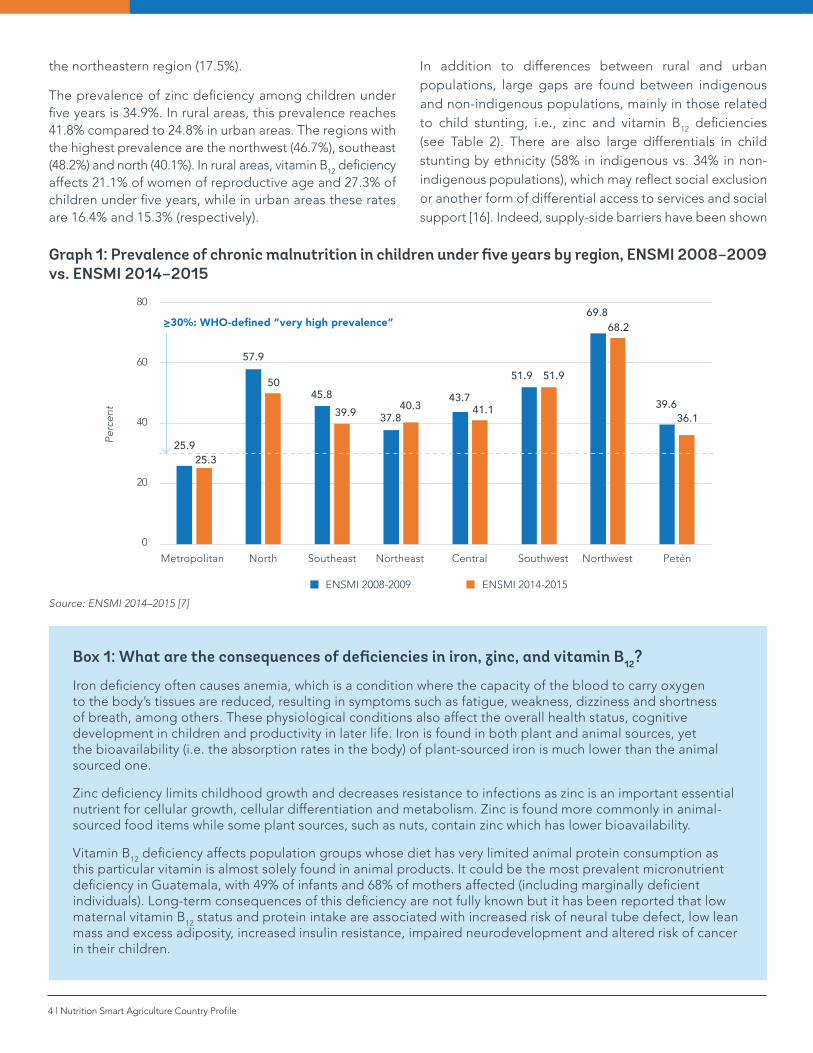
Rural and indigenous children, especially in the western highlands, suffer the most from chronic malnutrition, which affects 53% of children in rural areas vs. 34.6% in urban areas, and 58% of indigenous children vs. 34.2% of non-indigenous children (Tables 2 and 3). Historically, the western and northern regions have the highest prevalence of chronic malnutrition (over 50%) with no significant changes between the 2008–2009 and 2014–2015 surveys (Graph 1).
Guatemala has significantly reduced its population’s vitamin A deficiencies; in 2013, these affected only 3.4% of children under five years. Today, vitamin A deficiencies no longer constitute a moderate or severe public health problem in Guatemala3 [13]. However, evidence suggests that other deficiencies remain common throughout the country.
3 Prevalence <5% = no public health problem, prevalence 5% to 19.9% = slight public health problem, prevalence 20% - 39.9% = moderate, prevalence ≥ 40% severe public health problem (WHO). The thresholds for stunting, wasting and anemia considered severe public health problems are (respectively): 30%, 15% and 40%.
4 Foods high in sugar/oil/salt, ultra-processed foods and red meat that are known to contribute to overweight/obesity or diet-related non-communicable diseases, such as cardiovascular diseases, are not promoted.
National strategic documents and other technical reports point to iron, zinc and vitamin B12 as Guatemala’s most important micronutrient deficiencies [13], [14]. Therefore, this country profile focuses on these three key nutrients (see Box 1), in addition to protein, which is among the important macronutrients due to its physiological utilization of other important nutrients (such as iron) and contributions towards children’s healthy growth [15]. Overweight and obesity are an emerging nutritional problem in Guatemala and many other countries, yet evidence related to the impact of specific agriculture interventions on overweight/obesity is still limited. Malnutrition issues related to undernutrition and micronutrient deficiencies are still more prevalent and receive policy and program attention. Specific interventions that directly try to address overweight and obesity issues therefore were not analyzed while an ‘obesity lens’ was applied in selecting the recommended menu of options.4
Guatemala is one of the top three Latin American countries with the highest rates of iron and zinc deficiencies in children [16]. While the prevalence of anemia among children under five years is 32% on average, it is much higher in younger age groups; for example, 71% in 6–8 months, 70% in 9–11 months and 58% in 12–17 months. The prevalence of deficiencies is higher in rural areas (35.2%) than in urban areas (27.2%), with the highest rates in the northeastern region (39.8%), Petén (39%) and the southeastern region (37.1%). Among women of reproductive age (15–49 years old), anemia prevalence is 14% on average. In rural areas, the average prevalence reaches 14.7%, compared to 12.4% in urban areas. The highest prevalence rates are found in Petén (19.4%) and
4 | Nutrition Smart Agriculture Country Profile
the northeastern region (17.5%).
The prevalence of zinc deficiency among children under five years is 34.9%. In rural areas, this prevalence reaches 41.8% compared to 24.8% in urban areas. The regions with the highest prevalence are the northwest (46.7%), southeast (48.2%) and north (40.1%). In rural areas, vitamin B12 deficiency affects 21.1% of women of reproductive age and 27.3% of children under five years, while in urban areas these rates are 16.4% and 15.3% (respectively).
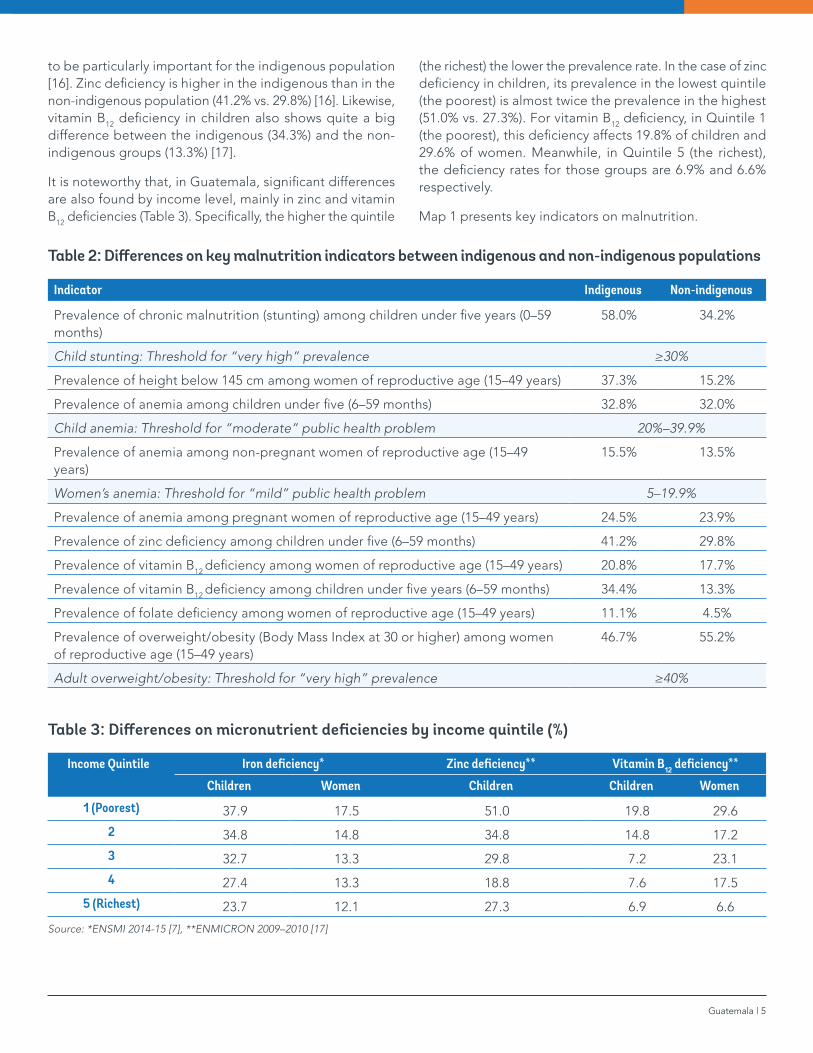
In addition to differences between rural and urban populations, large gaps are found between indigenous and non-indigenous populations, mainly in those related to child stunting, i.e., zinc and vitamin B12 deficiencies (see Table 2). There are also large differentials in child stunting by ethnicity (58% in indigenous vs. 34% in non-indigenous populations), which may reflect social exclusion or another form of differential access to services and social support [16]. Indeed, supply-side barriers have been shown
Graph 1: Prevalence of chronic malnutrition in children under five years by region, ENSMI 2008–2009 vs. ENSMI 2014–2015
Perc
ent
80
60
40
20
0
ENSMI 2008-2009 ENSMI 2014-2015
25.9
57.9
45.8
25.3
50
39.9 37.840.3
43.741.1
51.9 51.9
69.8
39.636.1
68.2
Metropolitan North Southeast Northeast Central Southwest Northwest Petén
>30%: WHO-defined “very high prevalence”
Source: ENSMI 2014–2015 [7]
Box 1: What are the consequences of deficiencies in iron, zinc, and vitamin B12?
Iron deficiency often causes anemia, which is a condition where the capacity of the blood to carry oxygen to the body’s tissues are reduced, resulting in symptoms such as fatigue, weakness, dizziness and shortness of breath, among others. These physiological conditions also affect the overall health status, cognitive development in children and productivity in later life. Iron is found in both plant and animal sources, yet the bioavailability (i.e. the absorption rates in the body) of plant-sourced iron is much lower than the animal sourced one.
Zinc deficiency limits childhood growth and decreases resistance to infections as zinc is an important essential nutrient for cellular growth, cellular differentiation and metabolism. Zinc is found more commonly in animal-sourced food items while some plant sources, such as nuts, contain zinc which has lower bioavailability.
Vitamin B12 deficiency affects population groups whose diet has very limited animal protein consumption as this particular vitamin is almost solely found in animal products. It could be the most prevalent micronutrient deficiency in Guatemala, with 49% of infants and 68% of mothers affected (including marginally deficient individuals). Long-term consequences of this deficiency are not fully known but it has been reported that low maternal vitamin B12 status and protein intake are associated with increased risk of neural tube defect, low lean mass and excess adiposity, increased insulin resistance, impaired neurodevelopment and altered risk of cancer in their children.
Guatemala | 5
to be particularly important for the indigenous population [16]. Zinc deficiency is higher in the indigenous than in the non-indigenous population (41.2% vs. 29.8%) [16]. Likewise, vitamin B12 deficiency in children also shows quite a big difference between the indigenous (34.3%) and the non-indigenous groups (13.3%) [17].
It is noteworthy that, in Guatemala, significant differences are also found by income level, mainly in zinc and vitamin B12 deficiencies (Table 3). Specifically, the higher the quintile
(the richest) the lower the prevalence rate. In the case of zinc deficiency in children, its prevalence in the lowest quintile (the poorest) is almost twice the prevalence in the highest (51.0% vs. 27.3%). For vitamin B12 deficiency, in Quintile 1 (the poorest), this deficiency affects 19.8% of children and 29.6% of women. Meanwhile, in Quintile 5 (the richest), the deficiency rates for those groups are 6.9% and 6.6% respectively.
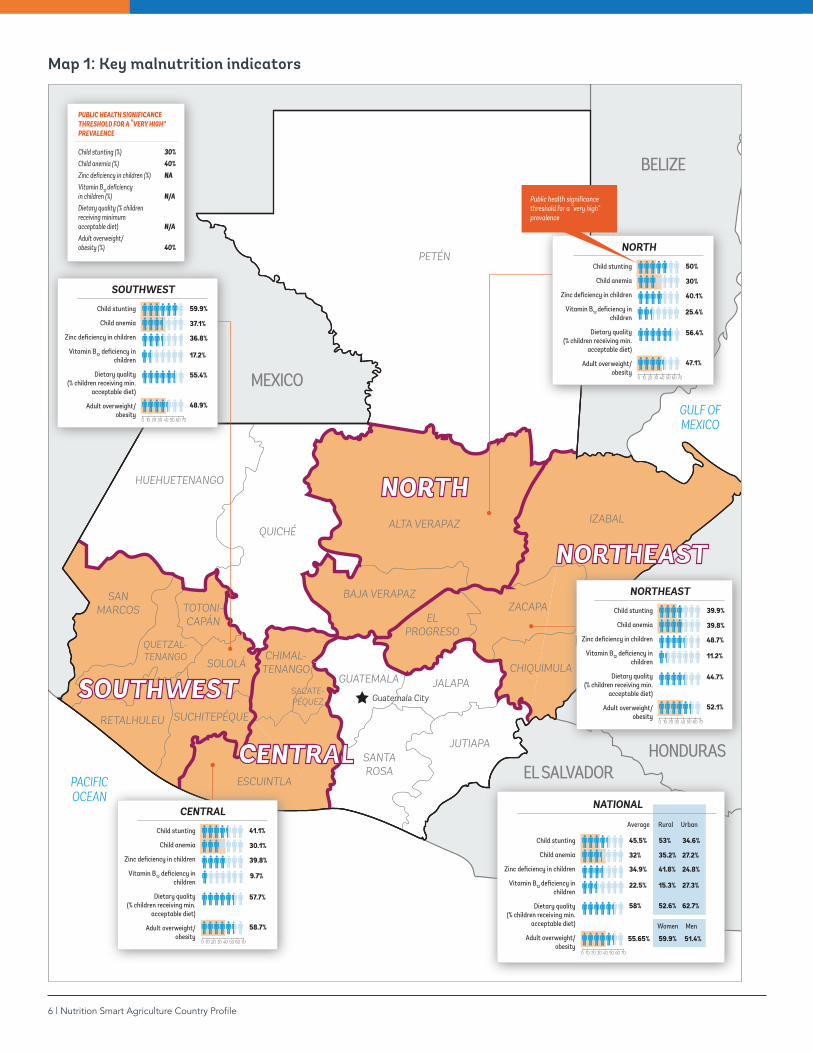
Map 1 presents key indicators on malnutrition.
Table 2: Differences on key malnutrition indicators between indigenous and non-indigenous populations
Indicator Indigenous Non-indigenous
Prevalence of chronic malnutrition (stunting) among children under five years (0–59 months)
58.0% 34.2%
Child stunting: Threshold for “very high” prevalence ≥30%
Prevalence of height below 145 cm among women of reproductive age (15–49 years) 37.3% 15.2%
Prevalence of anemia among children under five (6–59 months) 32.8% 32.0%
Child anemia: Threshold for “moderate” public health problem 20%–39.9%
Prevalence of anemia among non-pregnant women of reproductive age (15–49 years)
15.5% 13.5%
Women’s anemia: Threshold for “mild” public health problem 5–19.9%
Prevalence of anemia among pregnant women of reproductive age (15–49 years) 24.5% 23.9%
Prevalence of zinc deficiency among children under five (6–59 months) 41.2% 29.8%
Prevalence of vitamin B12 deficiency among women of reproductive age (15–49 years) 20.8% 17.7%
Prevalence of vitamin B12 deficiency among children under five years (6–59 months) 34.4% 13.3%
Prevalence of folate deficiency among women of reproductive age (15–49 years) 11.1% 4.5%
Prevalence of overweight/obesity (Body Mass Index at 30 or higher) among women of reproductive age (15–49 years)
46.7% 55.2%
Adult overweight/obesity: Threshold for “very high” prevalence ≥40%
Table 3: Differences on micronutrient deficiencies by income quintile (%)
Income Quintile Iron deficiency* Zinc deficiency** Vitamin B12 deficiency**
Children Women Children Children Women
1 (Poorest) 37.9 17.5 51.0 19.8 29.6
2 34.8 14.8 34.8 14.8 17.2
3 32.7 13.3 29.8 7.2 23.1
4 27.4 13.3 18.8 7.6 17.5
5 (Richest) 23.7 12.1 27.3 6.9 6.6
Source: *ENSMI 2014-15 [7], **ENMICRON 2009–2010 [17]
6 | Nutrition Smart Agriculture Country Profile
Map 1: Key malnutrition indicators
PETÉN
HUEHUETENANGO
SAN MARCOS
SANTA ROSA
JUTIAPA
JALAPA
QUICHÉ
ESCUINTLA
ALTA VERAPAZ
BAJA VERAPAZ
IZABAL
ZACAPAEL
PROGRESO
CHIQUIMULA
QUETZAL-TENANGO
RETALHULEU SUCHITEPÉQUE
CHIMAL-TENANGO
SACATE-PÉQUEZ
TOTONI-CAPÁN
SOLOLÁGUATEMALA
MEXICO
EL SALVADORHONDURAS
BELIZE
Guatemala City
NORTH
NORTHEAST
SOUTHWEST
CENTRAL
GULF OFMEXICO
PACIFIC OCEAN
CENTRAL
Child stunting
Child anemia
Zinc deficiency in children
Vitamin B12 deficiency in children
Dietary quality (% children receiving min.
acceptable diet)
Adult overweight/obesity
41.1%
30.1%
39.8%
57.7%
58.7%
9.7%
100 20 30 40 50 60 70
SOUTHWEST
Child stunting
Child anemia
Zinc deficiency in children
Vitamin B12 deficiency in children
Dietary quality (% children receiving min.
acceptable diet)
Adult overweight/obesity
59.9%
37.1%
36.8%
55.4%
48.9%
17.2%
100 20 30 40 50 60 70
PUBLIC HEALTH SIGNIFICANCE THRESHOLD FOR A “VERY HIGH” PREVALENCE
Child stunting (%) 30%Child anemia (%) 40%Zinc deficiency in children (%) NAVitamin B12 deficiencyin children (%) N/ADietary quality (% children receiving minimum acceptable diet) N/AAdult overweight/obesity (%) 40% NORTH
Child stunting
Child anemia
Zinc deficiency in children
Vitamin B12 deficiency in children
Dietary quality (% children receiving min.
acceptable diet)
Adult overweight/obesity
50%
30%
40.1%
56.4%
47.1%
25.4%
100 20 30 40 50 60 70
Public health significance threshold for a “very high” prevalence
NORTHEAST
Child stunting
Child anemia
Zinc deficiency in children
Vitamin B12 deficiency in children
Dietary quality (% children receiving min.
acceptable diet)
Adult overweight/obesity
39.9%
39.8%
48.7%
44.7%
52.1%
11.2%
100 20 30 40 50 60 70
NATIONAL
Child stunting
Child anemia
Zinc deficiency in children
Vitamin B12 deficiency in children
Dietary quality (% children receiving min.
acceptable diet)
Adult overweight/obesity
Average
45.5%
Rural
53%
Urban
34.6%
32% 35.2% 27.2%
34.9% 41.8% 24.8%
22.5% 15.3% 27.3%
58% 52.6% 62.7%
55.65%
Women
59.9%
Men
51.4%
100 20 30 40 50 60 70
Guatemala | 7
KEY FACTS ON FOOD PRODUCTION
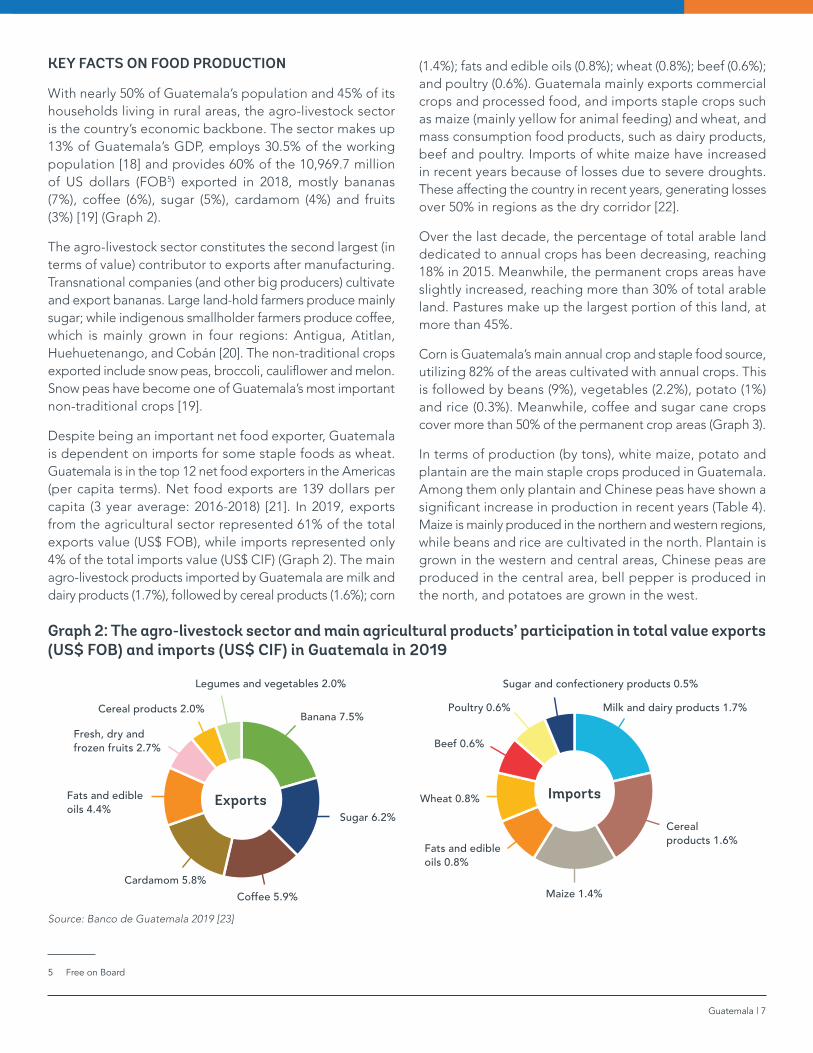
With nearly 50% of Guatemala’s population and 45% of its households living in rural areas, the agro-livestock sector is the country’s economic backbone. The sector makes up 13% of Guatemala’s GDP, employs 30.5% of the working population [18] and provides 60% of the 10,969.7 million of US dollars (FOB5) exported in 2018, mostly bananas (7%), coffee (6%), sugar (5%), cardamom (4%) and fruits (3%) [19] (Graph 2).
The agro-livestock sector constitutes the second largest (in terms of value) contributor to exports after manufacturing. Transnational companies (and other big producers) cultivate and export bananas. Large land-hold farmers produce mainly sugar; while indigenous smallholder farmers produce coffee, which is mainly grown in four regions: Antigua, Atitlan, Huehuetenango, and Cobán [20]. The non-traditional crops exported include snow peas, broccoli, cauliflower and melon. Snow peas have become one of Guatemala’s most important non-traditional crops [19].
Despite being an important net food exporter, Guatemala is dependent on imports for some staple foods as wheat. Guatemala is in the top 12 net food exporters in the Americas (per capita terms). Net food exports are 139 dollars per capita (3 year average: 2016-2018) [21]. In 2019, exports from the agricultural sector represented 61% of the total exports value (US$ FOB), while imports represented only 4% of the total imports value (US$ CIF) (Graph 2). The main agro-livestock products imported by Guatemala are milk and dairy products (1.7%), followed by cereal products (1.6%); corn
5 Free on Board
(1.4%); fats and edible oils (0.8%); wheat (0.8%); beef (0.6%); and poultry (0.6%). Guatemala mainly exports commercial crops and processed food, and imports staple crops such as maize (mainly yellow for animal feeding) and wheat, and mass consumption food products, such as dairy products, beef and poultry. Imports of white maize have increased in recent years because of losses due to severe droughts. These affecting the country in recent years, generating losses over 50% in regions as the dry corridor [22].
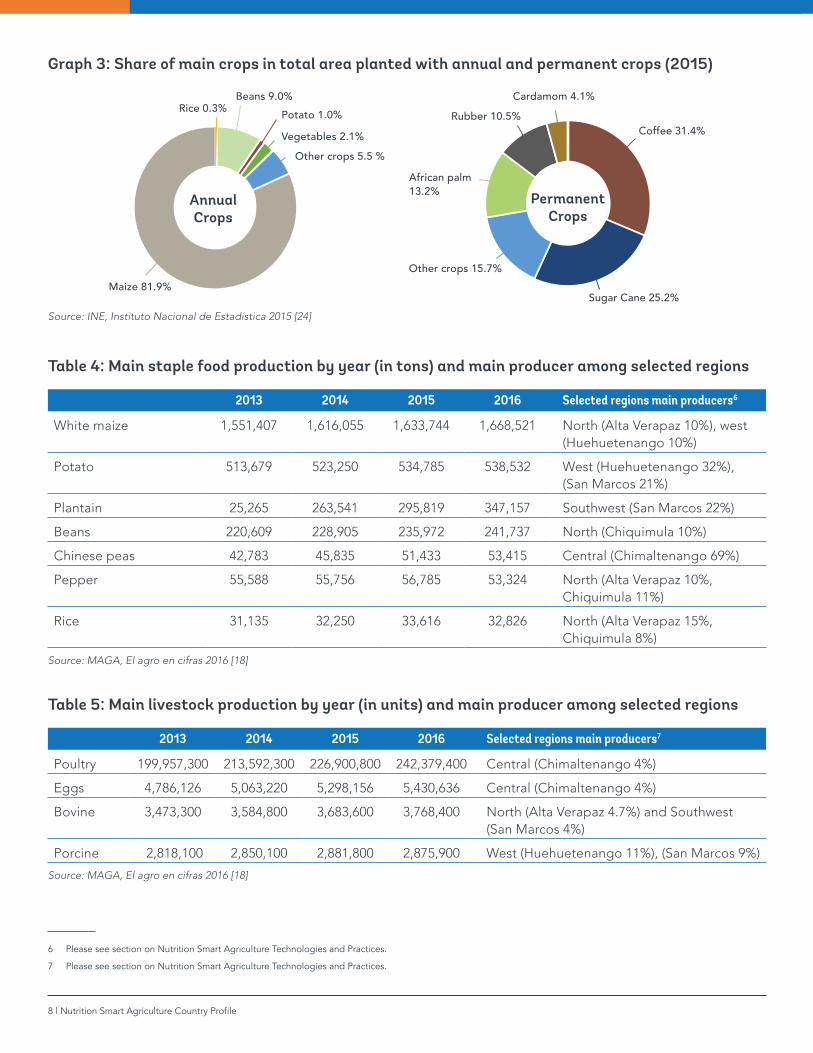
Over the last decade, the percentage of total arable land dedicated to annual crops has been decreasing, reaching 18% in 2015. Meanwhile, the permanent crops areas have slightly increased, reaching more than 30% of total arable land. Pastures make up the largest portion of this land, at more than 45%.
Corn is Guatemala’s main annual crop and staple food source, utilizing 82% of the areas cultivated with annual crops. This is followed by beans (9%), vegetables (2.2%), potato (1%) and rice (0.3%). Meanwhile, coffee and sugar cane crops cover more than 50% of the permanent crop areas (Graph 3).
In terms of production (by tons), white maize, potato and plantain are the main staple crops produced in Guatemala. Among them only plantain and Chinese peas have shown a significant increase in production in recent years (Table 4). Maize is mainly produced in the northern and western regions, while beans and rice are cultivated in the north. Plantain is grown in the western and central areas, Chinese peas are produced in the central area, bell pepper is produced in the north, and potatoes are grown in the west.
Graph 2: The agro-livestock sector and main agricultural products’ participation in total value exports (US$ FOB) and imports (US$ CIF) in Guatemala in 2019
Banana 7.5%
Coffee 5.9%Cardamom 5.8%
Fats and edible oils 4.4%
Fresh, dry and frozen fruits 2.7%
Cereal products 2.0%
Legumes and vegetables 2.0%
Sugar 6.2%
Sugar and confectionery products 0.5%
Milk and dairy products 1.7%
Cereal products 1.6%
Maize 1.4%
Wheat 0.8%
Beef 0.6%
Poultry 0.6%
Fats and edible oils 0.8%
Source: Banco de Guatemala 2019 [23]
Exports Imports
8 | Nutrition Smart Agriculture Country Profile
Graph 3: Share of main crops in total area planted with annual and permanent crops (2015)
Coffee 31.4%
Sugar Cane 25.2%
Cardamom 4.1%
Other crops 15.7%
Rubber 10.5%
African palm 13.2%
Beans 9.0%Potato 1.0%
Maize 81.9%
Vegetables 2.1%
Other crops 5.5 %
Rice 0.3%
Source: INE, Instituto Nacional de Estadística 2015 [24]
Annual Crops
Permanent Crops
Table 4: Main staple food production by year (in tons) and main producer among selected regions
2013 2014 2015 2016 Selected regions main producers6
White maize 1,551,407 1,616,055 1,633,744 1,668,521 North (Alta Verapaz 10%), west (Huehuetenango 10%)
Potato 513,679 523,250 534,785 538,532 West (Huehuetenango 32%), (San Marcos 21%)
Plantain 25,265 263,541 295,819 347,157 Southwest (San Marcos 22%)
Beans 220,609 228,905 235,972 241,737 North (Chiquimula 10%)
Chinese peas 42,783 45,835 51,433 53,415 Central (Chimaltenango 69%)
Pepper 55,588 55,756 56,785 53,324 North (Alta Verapaz 10%, Chiquimula 11%)
Rice 31,135 32,250 33,616 32,826 North (Alta Verapaz 15%, Chiquimula 8%)
Source: MAGA, El agro en cifras 2016 [18]
Table 5: Main livestock production by year (in units) and main producer among selected regions
2013 2014 2015 2016 Selected regions main producers7
Poultry 199,957,300 213,592,300 226,900,800 242,379,400 Central (Chimaltenango 4%)
Eggs 4,786,126 5,063,220 5,298,156 5,430,636 Central (Chimaltenango 4%)
Bovine 3,473,300 3,584,800 3,683,600 3,768,400 North (Alta Verapaz 4.7%) and Southwest (San Marcos 4%)
Porcine 2,818,100 2,850,100 2,881,800 2,875,900 West (Huehuetenango 11%), (San Marcos 9%)
Source: MAGA, El agro en cifras 2016 [18]
6 Please see section on Nutrition Smart Agriculture Technologies and Practices.
7 Please see section on Nutrition Smart Agriculture Technologies and Practices.

Guatemala | 9
Beans represented 9% of the area planted with annual crops, but the presence of biofortified beans is low, less than 10%. Despite their production increase in recent years, their dissemination has been limited by seed availability and the budget constraints of the Ministry of Agriculture, Livestock and Food (MAGA) and of the Agricultural Sciences and Technology Institute (ICTA).
Livestock population has remained approximately constant, except for poultry, which has significantly increased in numbers since 2013. Poultry and cattle are the most numerous livestock species. Poultry is mainly produced in the central region and cattle in the north (Table 5).
8 The dotted line represents the production level of the entire country, if all that is produced by the households is consumed locally (no exports or imports). This gives an idea of how far the production of some key food groups is from “self-sufficiency” by the link representing the average healthy eating plate of the given population. This does not mean that self-sufficiency is being promoted, but rather, this indicates an opportunity to increase the production of certain foods that clearly show a deficit in terms of nutrient deficiencies of the local population.
Fish production is low compared to its potential demand. Although its consumption is increasing, it is still not available in some regions and not affordable for some segments of the (low-income) population.
An illustration of the contribution of the main food groups produced in Guatemala to a healthy diet, as defined by the EAT-Lancet Commission, is presented in Graph 4.8
None of the food groups reaches the “planetary health boundary”, as set by the EAT-Lancet Commission. Only grains (mainly corn) nearly reach the boundary, followed, to a much lesser extent, by legumes.
Graph 4: Main food groups produced and contributing to optimal nutrient intake
Planetary Health Boundary
100%
36%
71%
Key:
Red meat Starchy vegetables Eggs Poultry
Dairy foods Fish Vegetables Fruits Legumes Grains Nuts Oils Insects Other
10 | Nutrition Smart Agriculture Country Profile
KEY FACTS ON FOOD CONSUMPTION
According to the Global Food Security Index [25], only 40% of Guatemalan families are classified as enjoying food security, meaning that they can meet essential food and non-food subsistence needs. Meanwhile, some 9% are classified as having slight food insecurity, 31% have moderate food insecurity and 20% are in situations of severe food insecurity (indicating extreme shortages of consumable foods9 or extreme loss of productive assets) [26].
9 At least one household member experienced hunger and at least one day without any food.
In Guatemala, 77% of families have a poor or inadequate diet (primarily among the most vulnerable groups) because of the limited access and seasonal availability of some foods, cultural beliefs and gender biases. These are typically characterized by a high-level consumption of cereals (maize), and a low consumption of foods of animal origin. A large proportion of the population does not have access to food with high content of iron, zinc and vitamin B12, and especially protein of animal origin [13], due to their costs. Box 2 gives an overview of some of the main reasons for this situation.
Box 2: Food environment: Climate change, land distribution and nutritious food availability
Food availability in Guatemala is poor, mainly due to vulnerability to environmental factors, such as: drought and flooding; deforestation and soil erosion; inadequate agricultural and economic policies [27]; and land distribution and usage. Guatemala is consistently among the ten “most vulnerable countries” to the effects of climate change worldwide and is the fourth “most exposed” country to natural disasters in Central America [28]. Over the past five years, extended periods of drought have aggravated food insecurity and economic instability in Guatemala. The results are reduced harvests or complete destruction of vital crops, which have had detrimental impacts on farmers’ food and nutrition security [29].
In Guatemala, malnutrition and hunger are closely linked to land distribution and usage. Nearly 44% of the land suitable for staple crops production is planted with coffee, sugar cane, palm oil and used as pasture for livestock. Meanwhile, almost 70% of food supply comes from small farmers, 8.1% of whom are infra-subsistence farmers and 39.5% [30] subsistence farmers. Most of these farmers barely produce enough food even for subsistence. The typical Guatemalan farmer is the smallest among Central American farmers, with an average farm size of 0.5 hectares, 92% of all holding are 7 hectares or less in size, and their yields are among the lowest, with subsistence farmers producing below 2 mt/ha in the case of maize and 800 kg/ha in the case of beans [31].
In Guatemala’s western highlands, average farm production only covers 4–6 months of families’ home consumption, resulting in high food insecurity and dependence on grains purchased commercially. In recent years, deficit periods have become longer because of land fragmentation, lack of good agricultural practices, climate change and the incidence of pests and diseases that have contributed to increasing food insecurity and the prevalence of malnutrition*.
Over the past five years, extended periods of drought have aggravated food insecurity and economic instability in Guatemala. These have reduced harvests or even (in some instances) completed destroyed vital crops, with extremely detrimental impacts on farmers’ food and nutrition security [29]. Some parts of the central and northern regions are becoming part of the “dry corridor”, an area where seasonal hunger and droughts are increasingly common due to reduced yields (and hence food availability). This especially affects infra- and subsistence farmers who are more vulnerable to climate change effects, increasing food shortages and resultant hunger.
Such impacts on farmers, who produce a significant proportion of Guatemala’s food production, explain the erratic trends of Per Capita Dietary Energy Supplies (DES) [32] over the last few years. DES ratings trace energy needs that, when unmet or unevenly distributed, represent food insecurity risks. To meet such needs, imports (mostly illegal – smuggling) have increased, mainly for cereals and other crops that sustain the population in terms of DES [27].
* Estimate of the per capita amount of energy (kcal) in food available for human consumption, during the reference period (three-year average period). Per capita Dietary Energy Supply (DES) is expressed in kcal per capita a day. Per capita supplies represent only the average supply available for each individual in the population as a whole and do not indicate what is actually consumed by individuals.
Guatemala | 11
Among children (6–23 months), 52.1% received the minimum acceptable diet that meets the minimum level of diversity (4+ food groups) as well as the minimum number of meals in a day according to their age10. This proportion is 52.6% and 51.5% in non-indigenous and indigenous children respectively. The highest proportions among selected regions were found in the central region (55.3%), followed by north (52.4%), southwest (52.0%) and northwest (51.9%). The most significant differences were found between rural and urban settings, with 48.5% rural children and 58.9% urban children (receiving the minimum acceptable diet, respectively [7].
10 The minimum levels for dietary diversity and meal frequency were established by the international expert group led by WHO and UNICEF for children aged 6-23 months which is a critical window of opportunity to support their healthy growth (https://www.who.int/nutrition/publications/infantfeeding/9789241599290/en/).
11 The EAT-Lancet graphical representation, a boundary marked by 100% represents the recommended consumption levels from the planetary health perspective, and the estimated consumption levels for each food group are mapped in terms of distance to the line. The EAT-Lancet’s boundary is not intended to be used as a dietary reference/benchmark for any particular population group, it is used here only for illustrative purposes, rather than to quantify deficiencies/excess against the 100% line.
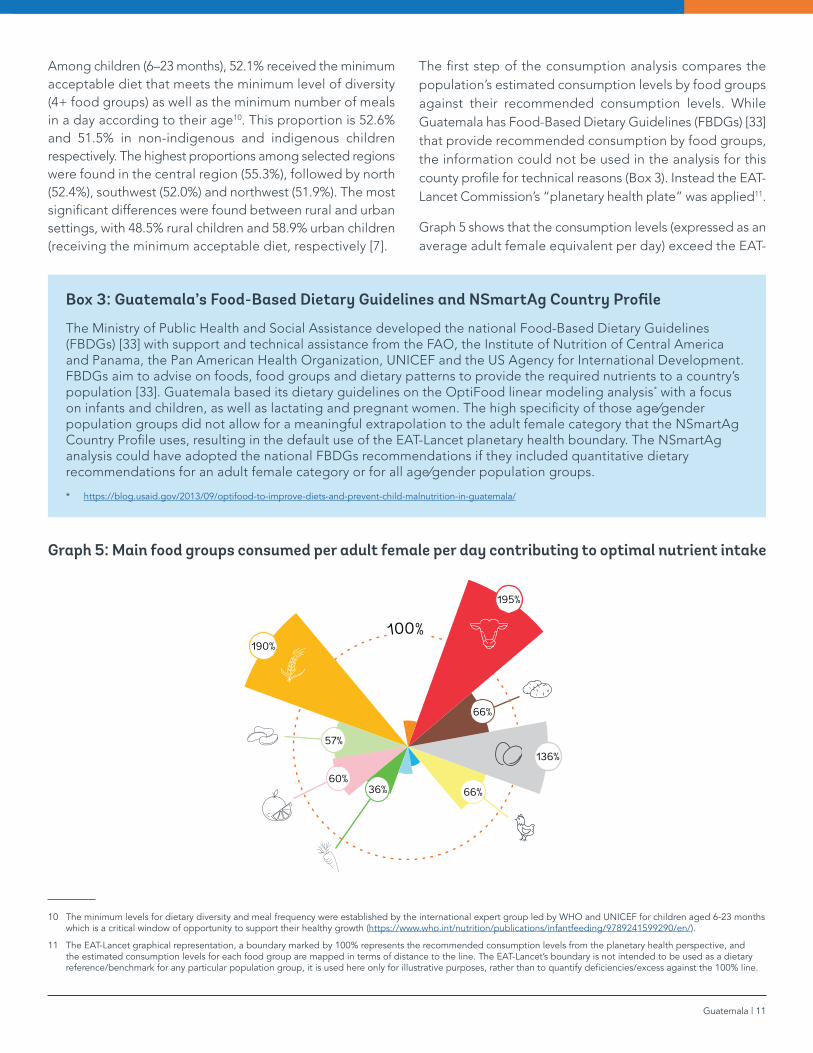
The first step of the consumption analysis compares the population’s estimated consumption levels by food groups against their recommended consumption levels. While Guatemala has Food-Based Dietary Guidelines (FBDGs) [33] that provide recommended consumption by food groups, the information could not be used in the analysis for this county profile for technical reasons (Box 3). Instead the EAT-Lancet Commission’s “planetary health plate” was applied11.
Graph 5 shows that the consumption levels (expressed as an average adult female equivalent per day) exceed the EAT-
Box 3: Guatemala’s Food-Based Dietary Guidelines and NSmartAg Country Profile
The Ministry of Public Health and Social Assistance developed the national Food-Based Dietary Guidelines (FBDGs) [33] with support and technical assistance from the FAO, the Institute of Nutrition of Central America and Panama, the Pan American Health Organization, UNICEF and the US Agency for International Development. FBDGs aim to advise on foods, food groups and dietary patterns to provide the required nutrients to a country’s population [33]. Guatemala based its dietary guidelines on the OptiFood linear modeling analysis* with a focus on infants and children, as well as lactating and pregnant women. The high specificity of those age∕gender population groups did not allow for a meaningful extrapolation to the adult female category that the NSmartAg Country Profile uses, resulting in the default use of the EAT-Lancet planetary health boundary. The NSmartAg analysis could have adopted the national FBDGs recommendations if they included quantitative dietary recommendations for an adult female category or for all age∕gender population groups.
* https://blog.usaid.gov/2013/09/optifood-to-improve-diets-and-prevent-child-malnutrition-in-guatemala/
Graph 5: Main food groups consumed per adult female per day contributing to optimal nutrient intake
100%190%
195%
136%
66%
66%36%60%
57%
12 | Nutrition Smart Agriculture Country Profile
Lancet’s planetary health boundaries in three food groups: red meat, grains and eggs.
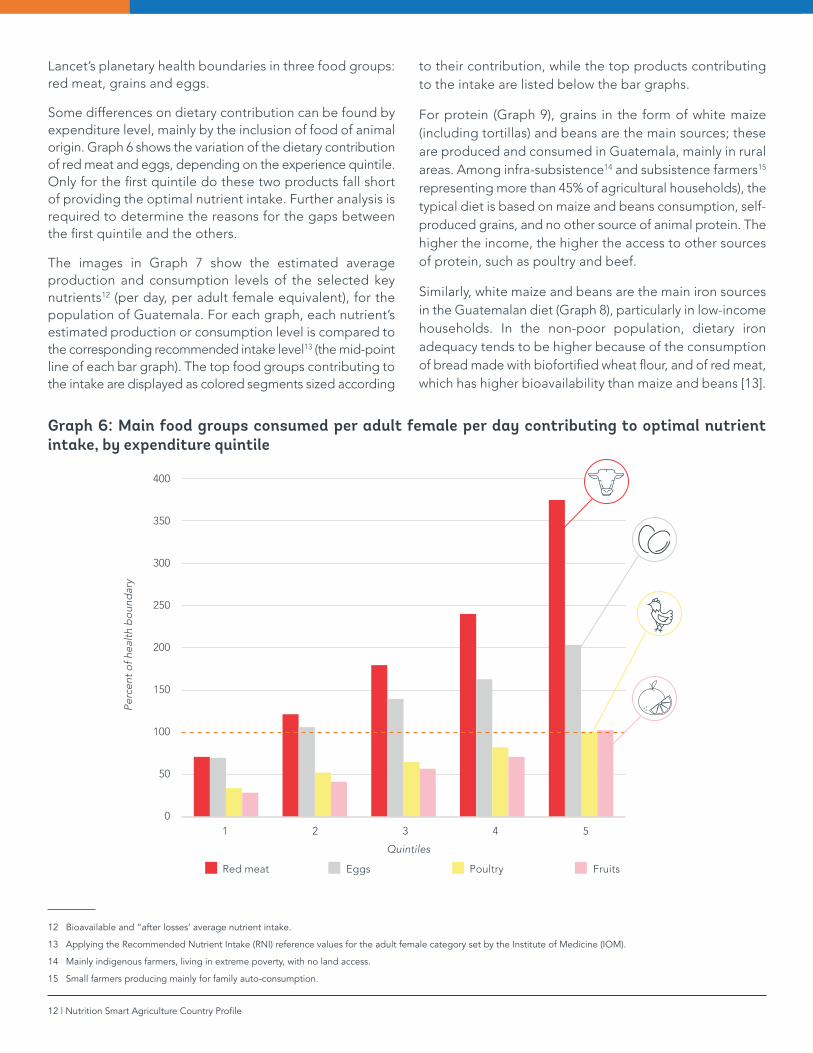
Some differences on dietary contribution can be found by expenditure level, mainly by the inclusion of food of animal origin. Graph 6 shows the variation of the dietary contribution of red meat and eggs, depending on the experience quintile. Only for the first quintile do these two products fall short of providing the optimal nutrient intake. Further analysis is required to determine the reasons for the gaps between the first quintile and the others.
The images in Graph 7 show the estimated average production and consumption levels of the selected key nutrients12 (per day, per adult female equivalent), for the population of Guatemala. For each graph, each nutrient’s estimated production or consumption level is compared to the corresponding recommended intake level13 (the mid-point line of each bar graph). The top food groups contributing to the intake are displayed as colored segments sized according
12 Bioavailable and “after losses’ average nutrient intake.
13 Applying the Recommended Nutrient Intake (RNI) reference values for the adult female category set by the Institute of Medicine (IOM).
14 Mainly indigenous farmers, living in extreme poverty, with no land access.
15 Small farmers producing mainly for family auto-consumption.
to their contribution, while the top products contributing to the intake are listed below the bar graphs.
For protein (Graph 9), grains in the form of white maize (including tortillas) and beans are the main sources; these are produced and consumed in Guatemala, mainly in rural areas. Among infra-subsistence14 and subsistence farmers15 representing more than 45% of agricultural households), the typical diet is based on maize and beans consumption, self-produced grains, and no other source of animal protein. The higher the income, the higher the access to other sources of protein, such as poultry and beef.
Similarly, white maize and beans are the main iron sources in the Guatemalan diet (Graph 8), particularly in low-income households. In the non-poor population, dietary iron adequacy tends to be higher because of the consumption of bread made with biofortified wheat flour, and of red meat, which has higher bioavailability than maize and beans [13].
Graph 6: Main food groups consumed per adult female per day contributing to optimal nutrient intake, by expenditure quintile
400
350
300
250
200
150
100
50
0
Perc
ent
of h
ealt
h b
oun
dar
y
Red meat Eggs Poultry Fruits
1 2 3 4 5
Quintiles

Guatemala | 13
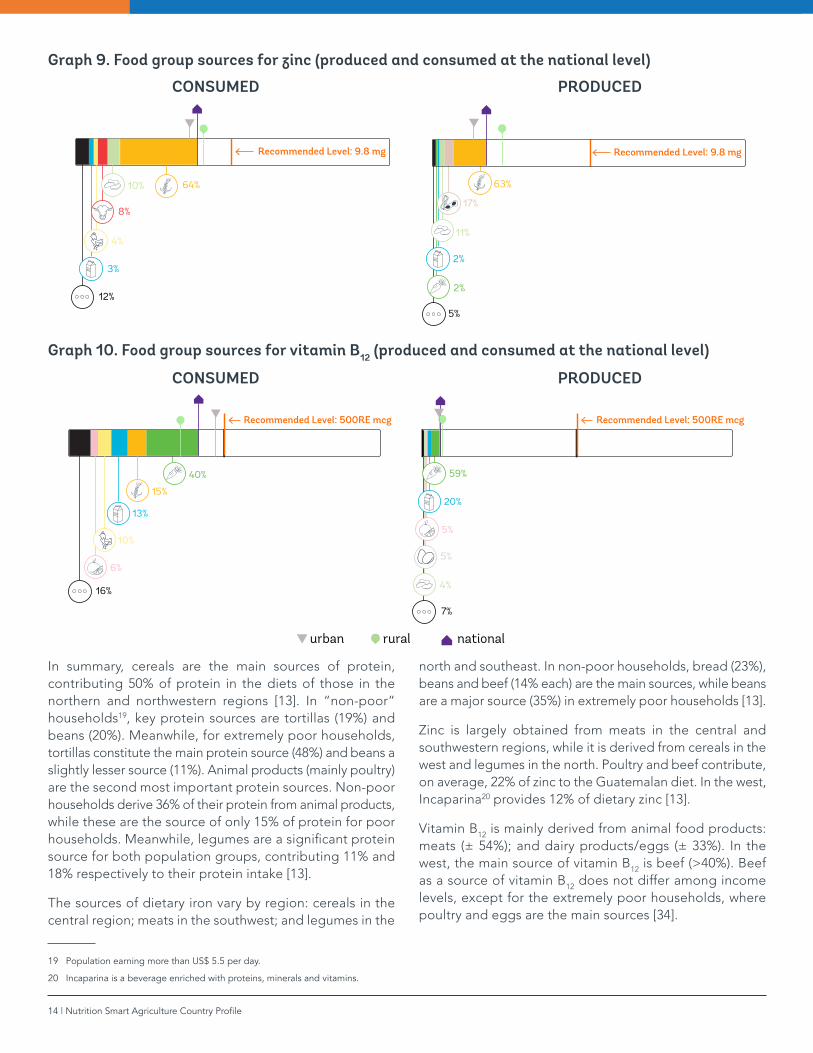
Most Guatemalans’ diets are poor in zinc. Corn and beans are the main sources, followed by red meat (Graph 9), which is neither accessible nor affordable for low-income families [13]. The high availability of anti-nutrients16 (such as phytic acid) in vegetables, cereals and legumes could further lower zinc absorption, if not processed properly (i.e., soaking/sprouting of beans). Cardamom is a good source of zinc, but Guatemalan-produced cardamom is mainly exported.
Vitamin B12 (Graph 10) is mainly sourced from food of animal origin (such as meat, chicken, eggs and milk products). From the bar chart below, the average consumption level of vitamin B12 seems adequate. It is important to note, however, that the national level analysis found a large difference in the
16 Antinutrients are the components found in foods (such as phytate, polyphenols, lectins, and inhibitors of protease and α-amylase) that reduce mineral bioavailability and interfere with digestion of specific compounds (De Pee and Bloem 2009). Phytic acid, one of the most studied, is mainly found in seeds, grains and legumes, and reduces the absorption of minerals from a meal, including iron, zinc, magnesium and calcium.
17 Population earning less than US$ 1.90 per day.
18 Population earning less than US$ 5.5 per day.
consumption level between high-income and low-income households, which seems to be canceled out when only the average is considered. This is presumably associated with the fact that most of the food sources of vitamin B12
(e.g., red meat) are neither produced by, nor affordable for extremely poor17 and poor families18 [13] (such as landless producers and infra- and subsistence farmers). Fortified breakfast cereals with vitamin B12 reach only high-income households (10% of total households) and are concentrated in the metropolitan region of Guatemala City [13]. This analysis highlights the need for potential interventions to increase the accessibility and affordability of vitamin B12 sources for low-income populations and/or in locations where vitamin B12 deficiency is more prevalent [13].
Graph 8. Food group sources for iron (produced and consumed at the national level)
9%
13%
Recommended Level: 58.8 mg
62%
6%
6%
4%
7%
15%
43%
16%
Recommended Level: 58.8 mg
10%
9%
urban rural national
Graph 7: Food group sources for protein (produced and consumed at the national level)
58%12%
7%
14%
Recommended Level: 51 g
5%
8%
4%
Recommended Level: 51 g
7%
18%
52%
6%
13%
CONSUMED
CONSUMED
PRODUCED
PRODUCED
14 | Nutrition Smart Agriculture Country Profile
In summary, cereals are the main sources of protein, contributing 50% of protein in the diets of those in the northern and northwestern regions [13]. In “non-poor” households19, key protein sources are tortillas (19%) and beans (20%). Meanwhile, for extremely poor households, tortillas constitute the main protein source (48%) and beans a slightly lesser source (11%). Animal products (mainly poultry) are the second most important protein sources. Non-poor households derive 36% of their protein from animal products, while these are the source of only 15% of protein for poor households. Meanwhile, legumes are a significant protein source for both population groups, contributing 11% and 18% respectively to their protein intake [13].
The sources of dietary iron vary by region: cereals in the central region; meats in the southwest; and legumes in the
19 Population earning more than US$ 5.5 per day.
20 Incaparina is a beverage enriched with proteins, minerals and vitamins.
north and southeast. In non-poor households, bread (23%), beans and beef (14% each) are the main sources, while beans are a major source (35%) in extremely poor households [13].
Zinc is largely obtained from meats in the central and southwestern regions, while it is derived from cereals in the west and legumes in the north. Poultry and beef contribute, on average, 22% of zinc to the Guatemalan diet. In the west, Incaparina20 provides 12% of dietary zinc [13].
Vitamin B12 is mainly derived from animal food products: meats (± 54%); and dairy products/eggs (± 33%). In the west, the main source of vitamin B12 is beef (>40%). Beef as a source of vitamin B12 does not differ among income levels, except for the extremely poor households, where poultry and eggs are the main sources [34].
Graph 9. Food group sources for zinc (produced and consumed at the national level)
4%
64%
3%
10%
12%
Recommended Level: 9.8 mg
8%
63%
5%
Recommended Level: 9.8 mg
17%
11%
2%
2%
Graph 10. Food group sources for vitamin B12 (produced and consumed at the national level)
Recommended Level: 500RE mcg
15%
40%
6%
10%
13%
16%
7%
4%
5%
5%
Recommended Level: 500RE mcg
59%
20%
urban rural national
CONSUMED
CONSUMED
PRODUCED
PRODUCED
Guatemala | 15
NUTRITION SMART AGRICULTURE TECHNOLOGIES AND PRACTICES
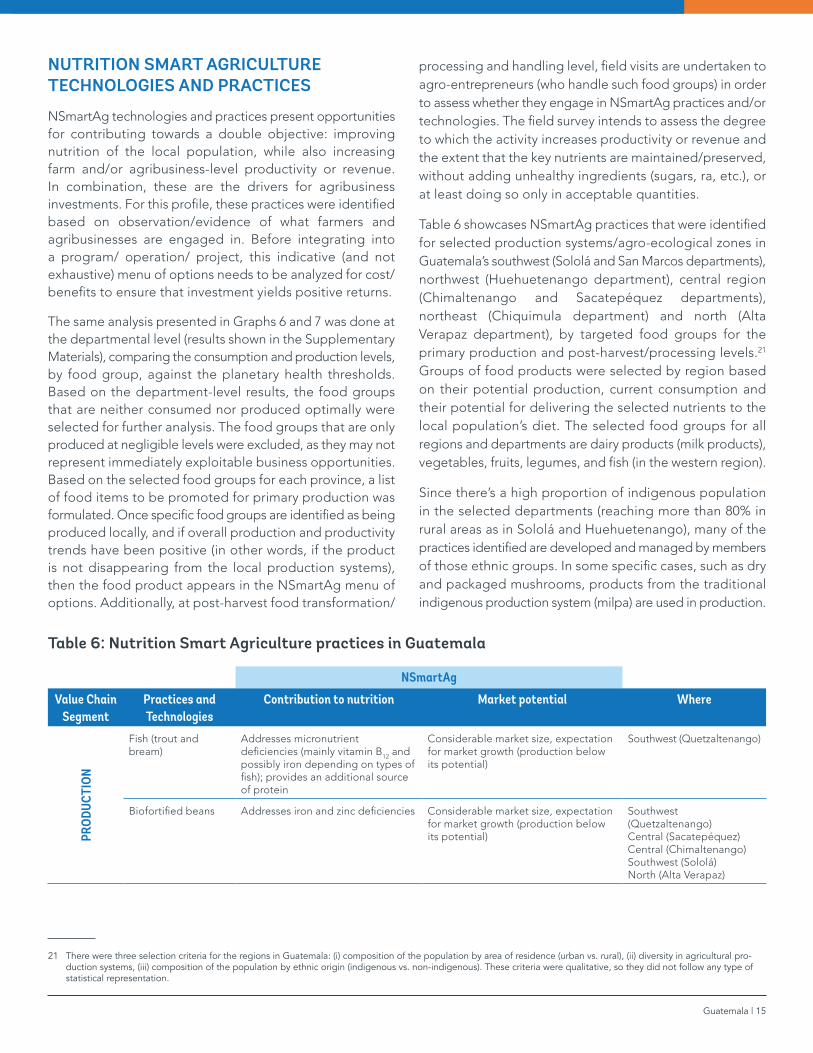
NSmartAg technologies and practices present opportunities for contributing towards a double objective: improving nutrition of the local population, while also increasing farm and/or agribusiness-level productivity or revenue. In combination, these are the drivers for agribusiness investments. For this profile, these practices were identified based on observation/evidence of what farmers and agribusinesses are engaged in. Before integrating into a program/ operation/ project, this indicative (and not exhaustive) menu of options needs to be analyzed for cost/ benefits to ensure that investment yields positive returns.
The same analysis presented in Graphs 6 and 7 was done at the departmental level (results shown in the Supplementary Materials), comparing the consumption and production levels, by food group, against the planetary health thresholds. Based on the department-level results, the food groups that are neither consumed nor produced optimally were selected for further analysis. The food groups that are only produced at negligible levels were excluded, as they may not represent immediately exploitable business opportunities. Based on the selected food groups for each province, a list of food items to be promoted for primary production was formulated. Once specific food groups are identified as being produced locally, and if overall production and productivity trends have been positive (in other words, if the product is not disappearing from the local production systems), then the food product appears in the NSmartAg menu of options. Additionally, at post-harvest food transformation/
21 There were three selection criteria for the regions in Guatemala: (i) composition of the population by area of residence (urban vs. rural), (ii) diversity in agricultural pro-duction systems, (iii) composition of the population by ethnic origin (indigenous vs. non-indigenous). These criteria were qualitative, so they did not follow any type of statistical representation.
processing and handling level, field visits are undertaken to agro-entrepreneurs (who handle such food groups) in order to assess whether they engage in NSmartAg practices and/or technologies. The field survey intends to assess the degree to which the activity increases productivity or revenue and the extent that the key nutrients are maintained/preserved, without adding unhealthy ingredients (sugars, ra, etc.), or at least doing so only in acceptable quantities.
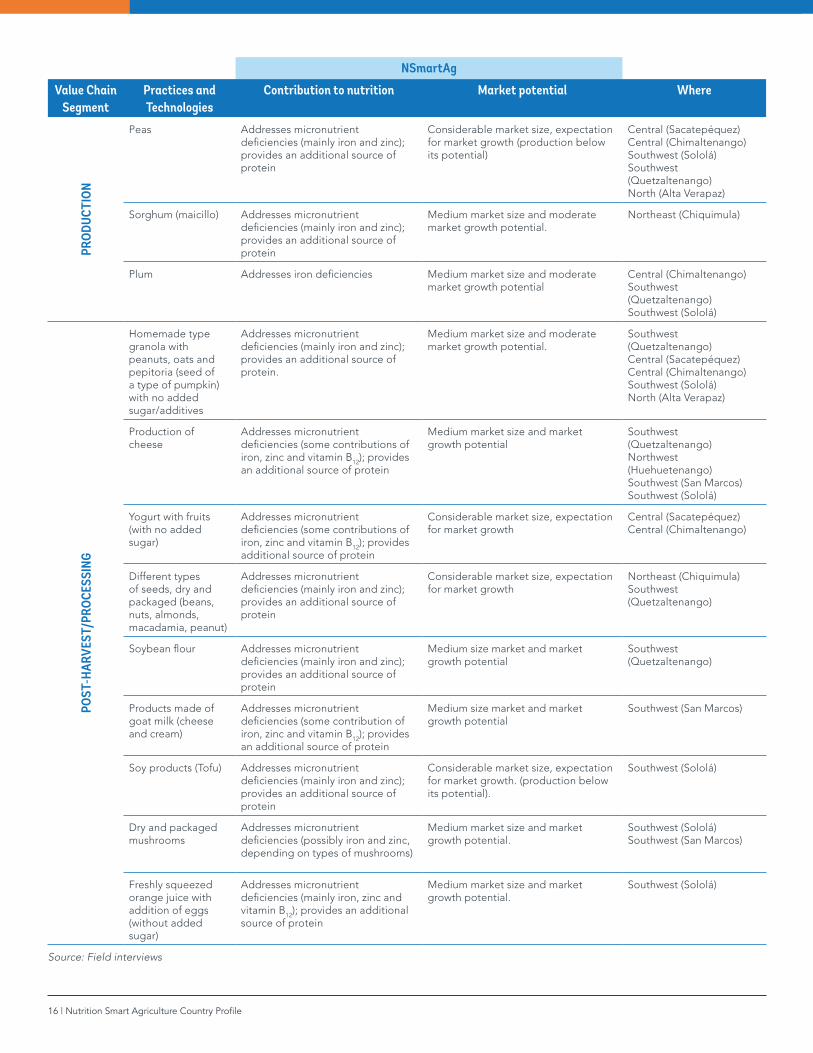
Table 6 showcases NSmartAg practices that were identified for selected production systems/agro-ecological zones in Guatemala’s southwest (Sololá and San Marcos departments), northwest (Huehuetenango department), central region (Chimaltenango and Sacatepéquez departments), northeast (Chiquimula department) and north (Alta Verapaz department), by targeted food groups for the primary production and post-harvest/processing levels.21 Groups of food products were selected by region based on their potential production, current consumption and their potential for delivering the selected nutrients to the local population’s diet. The selected food groups for all regions and departments are dairy products (milk products), vegetables, fruits, legumes, and fish (in the western region).
Since there’s a high proportion of indigenous population in the selected departments (reaching more than 80% in rural areas as in Sololá and Huehuetenango), many of the practices identified are developed and managed by members of those ethnic groups. In some specific cases, such as dry and packaged mushrooms, products from the traditional indigenous production system (milpa) are used in production.
Table 6: Nutrition Smart Agriculture practices in Guatemala
NSmartAg
Value Chain Segment
Practices and Technologies
Contribution to nutrition Market potential Where
PROD
UCTI
ON
Fish (trout and bream)
Addresses micronutrient deficiencies (mainly vitamin B12 and possibly iron depending on types of fish); provides an additional source of protein
Considerable market size, expectation for market growth (production below its potential)
Southwest (Quetzaltenango)
Biofortified beans Addresses iron and zinc deficiencies Considerable market size, expectation for market growth (production below its potential)
Southwest (Quetzaltenango)Central (Sacatepéquez)Central (Chimaltenango)Southwest (Sololá)North (Alta Verapaz)
16 | Nutrition Smart Agriculture Country Profile
NSmartAg
Value Chain Segment
Practices and Technologies
Contribution to nutrition Market potential WherePR
ODUC
TION
Peas Addresses micronutrient deficiencies (mainly iron and zinc); provides an additional source of protein
Considerable market size, expectation for market growth (production below its potential)
Central (Sacatepéquez)Central (Chimaltenango)Southwest (Sololá)Southwest (Quetzaltenango)North (Alta Verapaz)
Sorghum (maicillo) Addresses micronutrient deficiencies (mainly iron and zinc); provides an additional source of protein
Medium market size and moderate market growth potential.
Northeast (Chiquimula)
Plum Addresses iron deficiencies Medium market size and moderate market growth potential
Central (Chimaltenango)Southwest (Quetzaltenango)Southwest (Sololá)
POST
-HAR
VEST
/PRO
CESS
ING
Homemade type granola with peanuts, oats and pepitoria (seed of a type of pumpkin) with no added sugar/additives
Addresses micronutrient deficiencies (mainly iron and zinc); provides an additional source of protein.
Medium market size and moderate market growth potential.
Southwest (Quetzaltenango)Central (Sacatepéquez)Central (Chimaltenango)Southwest (Sololá)North (Alta Verapaz)
Production of cheese
Addresses micronutrient deficiencies (some contributions of iron, zinc and vitamin B12); provides an additional source of protein
Medium market size and market growth potential
Southwest (Quetzaltenango)Northwest (Huehuetenango)Southwest (San Marcos)Southwest (Sololá)
Yogurt with fruits (with no added sugar)
Addresses micronutrient deficiencies (some contributions of iron, zinc and vitamin B12); provides additional source of protein
Considerable market size, expectation for market growth
Central (Sacatepéquez)Central (Chimaltenango)
Different types of seeds, dry and packaged (beans, nuts, almonds, macadamia, peanut)
Addresses micronutrient deficiencies (mainly iron and zinc); provides an additional source of protein
Considerable market size, expectation for market growth
Northeast (Chiquimula)Southwest (Quetzaltenango)
Soybean flour Addresses micronutrient deficiencies (mainly iron and zinc); provides an additional source of protein
Medium size market and market growth potential
Southwest (Quetzaltenango)
Products made of goat milk (cheese and cream)
Addresses micronutrient deficiencies (some contribution of iron, zinc and vitamin B12); provides an additional source of protein
Medium size market and market growth potential
Southwest (San Marcos)
Soy products (Tofu) Addresses micronutrient deficiencies (mainly iron and zinc); provides an additional source of protein
Considerable market size, expectation for market growth. (production below its potential).
Southwest (Sololá)
Dry and packaged mushrooms
Addresses micronutrient deficiencies (possibly iron and zinc, depending on types of mushrooms)
Medium market size and market growth potential.
Southwest (Sololá)Southwest (San Marcos)
Freshly squeezed orange juice with addition of eggs (without added sugar)
Addresses micronutrient deficiencies (mainly iron, zinc and vitamin B12); provides an additional source of protein
Medium market size and market growth potential.
Southwest (Sololá)
Source: Field interviews

Guatemala | 17
The indicative NSmartAg practices and techniques in Table 6 were mostly implemented by micro, small- or medium-sized agri-entreprises, a bit more than half of which were owned by men. All sell their products directly to consumers, but also to wholesalers, distributors and retailers. Most of them are located in cities or urban areas. Around two thirds of
them confirmed knowing the country’s current food safety regulations but just half of them follow Good Hygiene Practices (BPH) or Good Manufacturing Practices (BPF).
Highlights 1 and 2 present two Nutrition Smart Agriculture practices identified during the field visits in Guatemala.
Highlight 1: Freezing bream in Izabal
Name of agribusiness: Aguaritas
Aguaritas is an artisan fishermen’s member of the association of Cuchumatanes producers’ organizations (ASOCUCH), located in Huehuetenango. Aguaritas produces frozen fish (the whole bream gutted head-on) fished on Izabal lake, ready to sell to retail customers in rural and urban areas under the Aguaritas brand. The product contributes to key micronutrients (such as iron and vitamin B12).
The association has a business plan, and is a profitable business in a stable market with some competitors in the area.
Key considerations for further support:
Sanitary and/or food safety certifications are lacking. Those certifications are required to ensure safe, quality fish to consumers and to promote this small business’ aspirations to produce dried fish with sea salt.
Highlight 2: Granola (containing oats, sesame, coconut, raisins, pepitoria, chia, almonds and peanuts) in Chimaltenango
Name of agribusiness: Dalma Dulces y Más
It is a women-owned company that produces pre-packaged homemade granola containing dried and cooked oats, sesame, coconut, raisins, pepitoria, chia, almonds and peanuts. This product has no added sugar and is an additional source of iron, zinc and protein.
The company is a profitable business operating in a growing market with other competitors in the area.
Key considerations for further support:
A business plan and sanitary and/or food safety certifications are lacking. Support for business plan development and certification management is required.
The company aspires to improve its baking ovens and packing structure to increase production and improve final product quality. Financial support is required for this next step.
18 | Nutrition Smart Agriculture Country Profile
INSTITUTIONS AND POLICIES THAT SUPPORT AGRICULTURE SOLUTIONS FOR NUTRITION
In 2002, the National Food and Nutrition Security (FNS) Council (Consejo Nacional de Seguridad Alimentaría y Nutricional, CONASAN) was created under the Presidency of the Republic of Guatemala, to promote and support political actions aimed at reducing food insecurity and extreme poverty. The CONASAN was dissolved and replaced by the Vice-Minister of FNS (VISAN) under the Ministry of Agriculture, Livestock and Food (MAGA).
Since 2005, successive governments have prioritized food security policy and the reduction of malnutrition. This year, the national government established the National System for Food Security and Nutrition (Sistema Nacional de Seguridad Alimentaria y Nutricional, SINASAN) and approved its regulation, as well as the National Policy of Food security. SINASAN’s main objective is to bring an institutional framework to prioritize, harmonize, design, and execute actions of FNS under the National Policy of FNS (Política de Seguridad Alimentaría y Nutricional, PSAN). In this policy, the Ministry of Agriculture, Livestock and Food (MAGA) played a role in ensuring food production (in quantity and quality), as required by Guatemala’s population.
The current strategies operating under the SINASAN include the 2016–2020 Food Security and Nutrition Strategic Plan
(Plan Estratégico de Seguridad Alimentaría y Nutricional, PESAN). The main goal of this strategy was to reduce by 10 percentage points (from 41.7% to 31.7%) the prevalence of chronic malnutrition in children under two years, prioritizing indigenous and rural populations. The National Strategy to Prevent Chronic Malnutrition 2016–2020 (Estrategia Nacional para la Prevención de la Desnutrición Crónica, ENPDC) provides a national strategic framework and implementation plan for improving food security and nutrition. The Zero Hunger Pact (Pacto Hambre Cero) 2012–2016 was also supported by two successive administrations and its main goal was to eliminate hunger, including seasonal hunger.
Guatemala’s current policy framework enables the development and promotion of agricultural activities under the framework of SINASAN, led by Guatemala’s Vice-President, with the relevant participation of MAGA and ICTA, as the direct implementing institutions of the policies and programs.
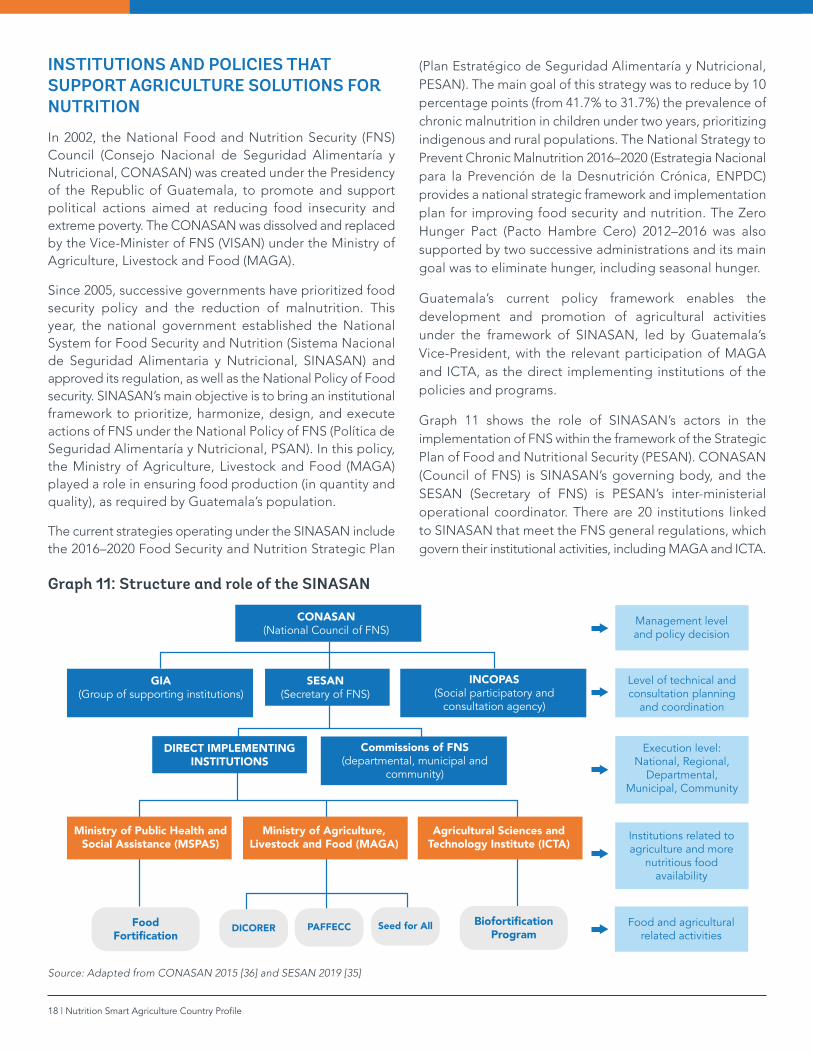
Graph 11 shows the role of SINASAN’s actors in the implementation of FNS within the framework of the Strategic Plan of Food and Nutritional Security (PESAN). CONASAN (Council of FNS) is SINASAN’s governing body, and the SESAN (Secretary of FNS) is PESAN’s inter-ministerial operational coordinator. There are 20 institutions linked to SINASAN that meet the FNS general regulations, which govern their institutional activities, including MAGA and ICTA.
Graph 11: Structure and role of the SINASAN
CONASAN(National Council of FNS)
DIRECT IMPLEMENTING INSTITUTIONS
Ministry of Public Health and Social Assistance (MSPAS)
Ministry of Agriculture, Livestock and Food (MAGA)
Agricultural Sciences and Technology Institute (ICTA)
GIA(Group of supporting institutions)
INCOPAS(Social participatory and
consultation agency)
Commissions of FNS(departmental, municipal and
community)
SESAN(Secretary of FNS)
Food Fortification
Biofortification Program
Management level and policy decision
Food and agricultural related activities
Level of technical and consultation planning
and coordination
Institutions related to agriculture and more
nutritious food availability
Execution level: National, Regional,
Departmental, Municipal, Community
DICORER PAFFECC Seed for All
Source: Adapted from CONASAN 2015 [36] and SESAN 2019 [35]

Guatemala | 19
In Guatemala, malnutrition is a health problem mainly addressed by the Ministry of Public Health and Social Assistance (MSPAS) and MAGA, including ICTA, through agricultural technology generation and diffusion. Under SINASAN’s framework, food availability and food access are MAGA’s main responsibility, while MSPAS is responsible for food consumption and biological food use policies and programs. Those institutions are supported by a range of public institutions, including the Ministry of Education and the Ministry of the Economy. MAGA, and MSPAS are the direct implementing institutions of SESAN’s policy through the System of Agricultural Extension (Dirección de Coordinación Regional y Extensión Rural, DICORER) and the Family Farming Program for the Strengthening of Peasant Economics (PAFFEC), “Seeds for All” and the Biofortification Program (Graph 11). The National Commission for Food Fortification (Comisión Nacional para la Fortificación, Enriquecimiento y/o Equiparación de Alimentos, CONAFOR) and the MSPAS implemented “Food Fortification”. Meanwhile, MAGA and ICTA oversee the fourth PESAN’s programmatic axis—”Food availability and family economy”. The main goal of the latter is to increase the availability of sufficient and varied food that provides adequate energy and nutritional intakes (including animal protein and micronutrient-rich foods), through the development and diffusion of new technologies and better production and processing practices.
Donor coordination is done formally at the CONASAN level, assisted by the Group of Supporters (GIA) and the Group of Donors and Cooperating Agencies on Food Security, Nutrition, and Rural Development (Grupo de Cooperantes en
22 Education, Economy, Labor and Social Security, Environment and Natural Resources, Social Development and Finance.
Seguridad Alimentaria, Nutrición y Desarrollo Rural, G-SAN-DR). Through the GIA and the G-SAN-DR, multilateral and bilateral organizations act in a coordinated manner.
In January 2020, Guatemala’s government launched the Great National Crusade for Nutrition aiming to reduce malnutrition and promote food access and availability. Box 4 gives a short overview of this plan.
Table 7 lists the Guatemalan government’s and bilateral key agricultural sector actors’ interventions to address malnutrition within the PESAN framework.
The implementation of those key actions to improve food security and nutritional status among Guatemala’s population has gained momentum in the last two decades, mainly after the 1996 signing of the Peace Treaty. The national budget for FNS activities alone amounted to more than US$ 735 million, representing almost 6.25% of the Guatemala government’s 2019 budget. This is encouraging yet remains insufficient. Eight ministries22 received 87.4% of this budget. MSPS and MAGA received 18.6% and 10% respectively. Different secretaries (including the SEAN), received 2.4%, and the other 10.1% was received by decentralized institutions, such as ICTA with 0.4% [37].
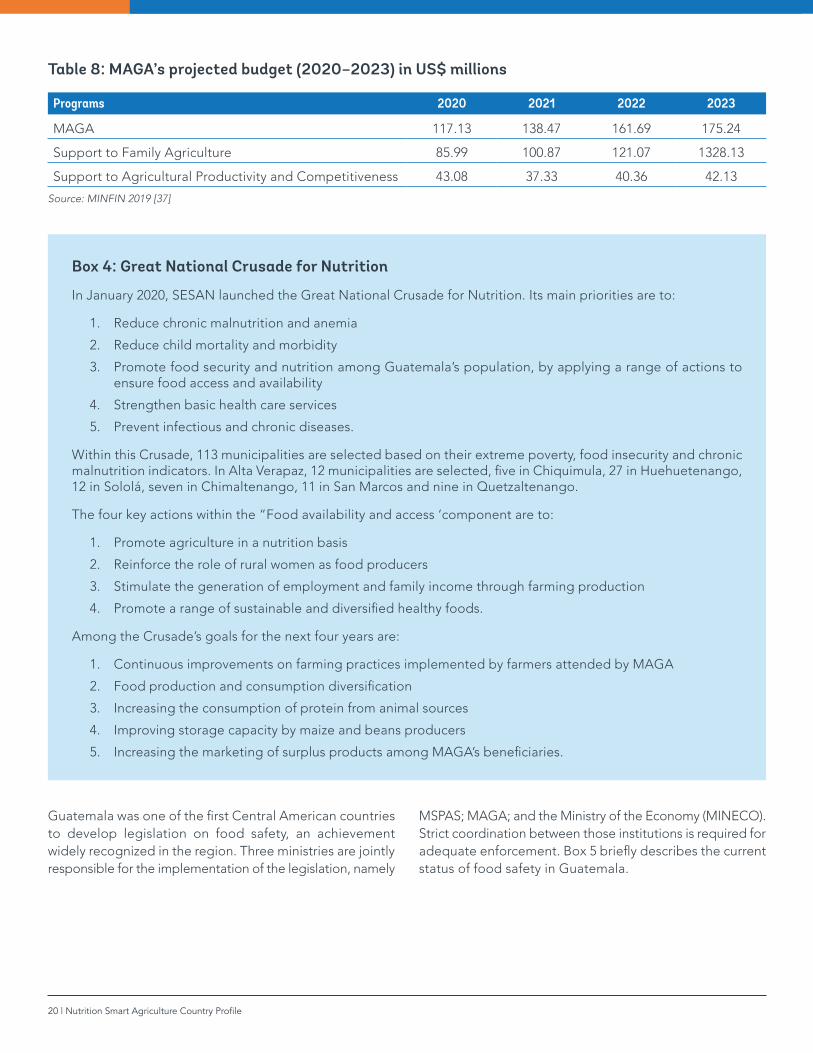
Table 8 shows the projected budget for MAGA from 2020 to 2033 in US$ millions. A significant growth in MAGA’s budget is expected, mainly in the “support to family agriculture” program.
Table 7: Key actions
Food and Nutritional Security Policy (Política de Seguridad Alimentaria y Nutricional, PSAN)
• This calls for the Ministry of Agriculture, Livestock and Food (MAGA) to play a key role as the institution to ensure food production (in quantity and quality), as required by Guatemala’s population to overcome food and nutrition insecurity.
Great National Crusade for Nutrition (Gran Cruzada Nacional por la Nutrición)
• A new government plan (2020–2024) to reduce chronic malnutrition and promote food access and availability, via promoting agriculture’s nutritional contributions and generating employment and family income through increased farming production.
Vice Ministry of Food and Nutritional Security
• Created in 2003, its aim is to improve food and nutritional security in the country by promoting local production through the provision of inputs, equipment, tools and technical assistance.
The National School Feeding Policy • This law was passed in October 2018 to support the availability and access of healthy diets to children, and to improve the economic situation of family farmers who produce and sell their production to the local school feeding program.
National Plan for Fortification (1992) • Its aim is to reduce micronutrient deficiencies by adding vitamin and minerals, such as vitamin A, iron and iodine to processed food (sugar, maize flour and salt).
20 | Nutrition Smart Agriculture Country Profile
Table 8: MAGA’s projected budget (2020–2023) in US$ millions
Programs 2020 2021 2022 2023
MAGA 117.13 138.47 161.69 175.24
Support to Family Agriculture 85.99 100.87 121.07 1328.13
Support to Agricultural Productivity and Competitiveness 43.08 37.33 40.36 42.13
Source: MINFIN 2019 [37]
Box 4: Great National Crusade for Nutrition
In January 2020, SESAN launched the Great National Crusade for Nutrition. Its main priorities are to:
1. Reduce chronic malnutrition and anemia
2. Reduce child mortality and morbidity
3. Promote food security and nutrition among Guatemala’s population, by applying a range of actions to ensure food access and availability
4. Strengthen basic health care services
5. Prevent infectious and chronic diseases.
Within this Crusade, 113 municipalities are selected based on their extreme poverty, food insecurity and chronic malnutrition indicators. In Alta Verapaz, 12 municipalities are selected, five in Chiquimula, 27 in Huehuetenango, 12 in Sololá, seven in Chimaltenango, 11 in San Marcos and nine in Quetzaltenango.
The four key actions within the “Food availability and access ‘component are to:
1. Promote agriculture in a nutrition basis
2. Reinforce the role of rural women as food producers
3. Stimulate the generation of employment and family income through farming production
4. Promote a range of sustainable and diversified healthy foods.
Among the Crusade’s goals for the next four years are:
1. Continuous improvements on farming practices implemented by farmers attended by MAGA
2. Food production and consumption diversification
3. Increasing the consumption of protein from animal sources
4. Improving storage capacity by maize and beans producers
5. Increasing the marketing of surplus products among MAGA’s beneficiaries.
Guatemala was one of the first Central American countries to develop legislation on food safety, an achievement widely recognized in the region. Three ministries are jointly responsible for the implementation of the legislation, namely
MSPAS; MAGA; and the Ministry of the Economy (MINECO). Strict coordination between those institutions is required for adequate enforcement. Box 5 briefly describes the current status of food safety in Guatemala.
Guatemala | 21
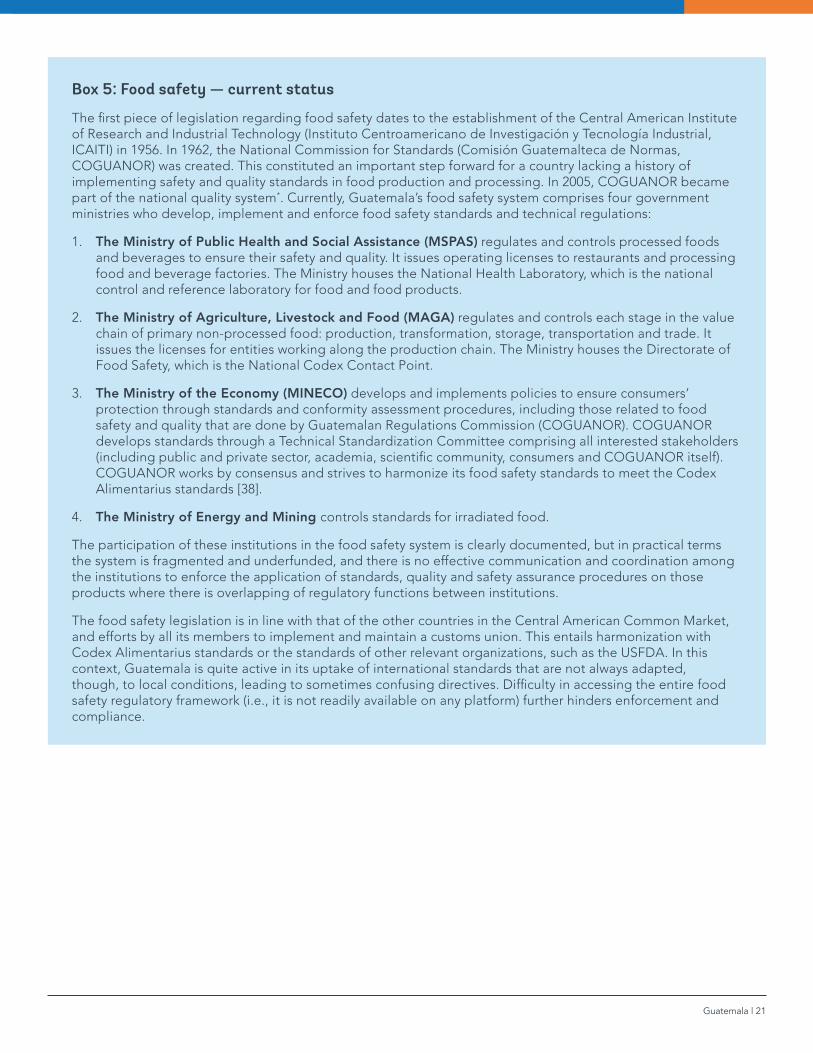
Box 5: Food safety — current status
The first piece of legislation regarding food safety dates to the establishment of the Central American Institute of Research and Industrial Technology (Instituto Centroamericano de Investigación y Tecnología Industrial, ICAITI) in 1956. In 1962, the National Commission for Standards (Comisión Guatemalteca de Normas, COGUANOR) was created. This constituted an important step forward for a country lacking a history of implementing safety and quality standards in food production and processing. In 2005, COGUANOR became part of the national quality system*. Currently, Guatemala’s food safety system comprises four government ministries who develop, implement and enforce food safety standards and technical regulations:
1. The Ministry of Public Health and Social Assistance (MSPAS) regulates and controls processed foods and beverages to ensure their safety and quality. It issues operating licenses to restaurants and processing food and beverage factories. The Ministry houses the National Health Laboratory, which is the national control and reference laboratory for food and food products.
2. The Ministry of Agriculture, Livestock and Food (MAGA) regulates and controls each stage in the value chain of primary non-processed food: production, transformation, storage, transportation and trade. It issues the licenses for entities working along the production chain. The Ministry houses the Directorate of Food Safety, which is the National Codex Contact Point.
3. The Ministry of the Economy (MINECO) develops and implements policies to ensure consumers’ protection through standards and conformity assessment procedures, including those related to food safety and quality that are done by Guatemalan Regulations Commission (COGUANOR). COGUANOR develops standards through a Technical Standardization Committee comprising all interested stakeholders (including public and private sector, academia, scientific community, consumers and COGUANOR itself). COGUANOR works by consensus and strives to harmonize its food safety standards to meet the Codex Alimentarius standards [38].
4. The Ministry of Energy and Mining controls standards for irradiated food.
The participation of these institutions in the food safety system is clearly documented, but in practical terms the system is fragmented and underfunded, and there is no effective communication and coordination among the institutions to enforce the application of standards, quality and safety assurance procedures on those products where there is overlapping of regulatory functions between institutions.
The food safety legislation is in line with that of the other countries in the Central American Common Market, and efforts by all its members to implement and maintain a customs union. This entails harmonization with Codex Alimentarius standards or the standards of other relevant organizations, such as the USFDA. In this context, Guatemala is quite active in its uptake of international standards that are not always adapted, though, to local conditions, leading to sometimes confusing directives. Difficulty in accessing the entire food safety regulatory framework (i.e., it is not readily available on any platform) further hinders enforcement and compliance.

22 | Nutrition Smart Agriculture Country Profile
ONGOING AND PLANNED INTERVENTIONS LINKING AGRICULTURE AND NUTRITION
The purpose of this section is to succinctly present which
NSmartAg practices and technologies are supported (where and by whom), so that synergies, opportunities and gaps can be easily identified. Table 9 lists the main ones currently in the country.
Table 9: Relevant interventions
NSmartAg activity
Program name (duration)
Development partner
Target areas Brief description as related to NSmartAg
Primary production
Regional Coordination and Rural Extension Office (DICORER)
Ministry of Agriculture (MAGA)
Countrywide Its main objective is to strengthen local food production, through technology transfer and diffusion using the CADERS (Learning Centers).
Primary production
Seed for All Ministry of Agriculture (MAGA)
Countrywide Seed for All is a program of MAGA’s Basic Grains Unit (Unidad de Granos Básicos). Its main objective is to increase subsistence farmers’ production of staple crops, through the dissemination of high-quality seeds.
Primary production, post-harvest
PAFFECC Family farming program for the strengthening of peasant revenues
Ministry of Agriculture (MAGA)
Countrywide Family gardens for vegetables and legumes production across the country.
Biofortifi-cation
Biofortification Program
ICTA, HarvestPlus, Seed for All program (MAGA)
Countrywide Development and diffusion of biofortified crops (corn and beans)
Primary production, post-harvest
PROCAGICA(Central American Program of Coffee Rust Integrated Management)
ANACAFE—IICA
San Marcos, Huehuetenango, Quezaltenango and Chiqui-mula
Product diversification among coffee producers, encouraging the cultivation of crops such as tomato, avocado and melon.
Research and promotion on primary production, post-harvest
CRIA—Regional Consortias on Agricultural Research
IICA Alta Verapaz y Quiche, Zaca-pa, Chiquimula, Quetzaltenan-go, San Marcos and Huehuet-enango
Research and training to strengthen 18 value chains in the north (cardamom, peppers) and west (corn, beans, potato, tomato).
Primary production, post-harvest
Feed the Future — Global Food Security Strategy for Guatemala 2018–2022
USAID, the Government of Guatemala, civil society stakeholders and international donors.
Huehuetenango, Quiche, Alta Verapaz and San Marcos
This program is focused on increasing rural incomes by improving the productivity of key value chains and crops (including vegetables and legumes), expanding value-added agricultural production, and diversifying crop and livestock systems to access higher value markets.
Primary production, post-harvest
Project of Innovative Solutions to Agricultural Value Chains (PROINNOVA)
Agropecuaria Popoyán S.A.
Huehuetenango, Quetzaltenango and San Marcos
This project’s interventions are based on a behavioral change strategy that contributes to: the adoption of good agricultural practices; and responsiveness to market demands for 22 crops (including onion, garlic, tomato, French beans, amaranth, bell pepper, Brussels sprouts and potato).
Guatemala | 23
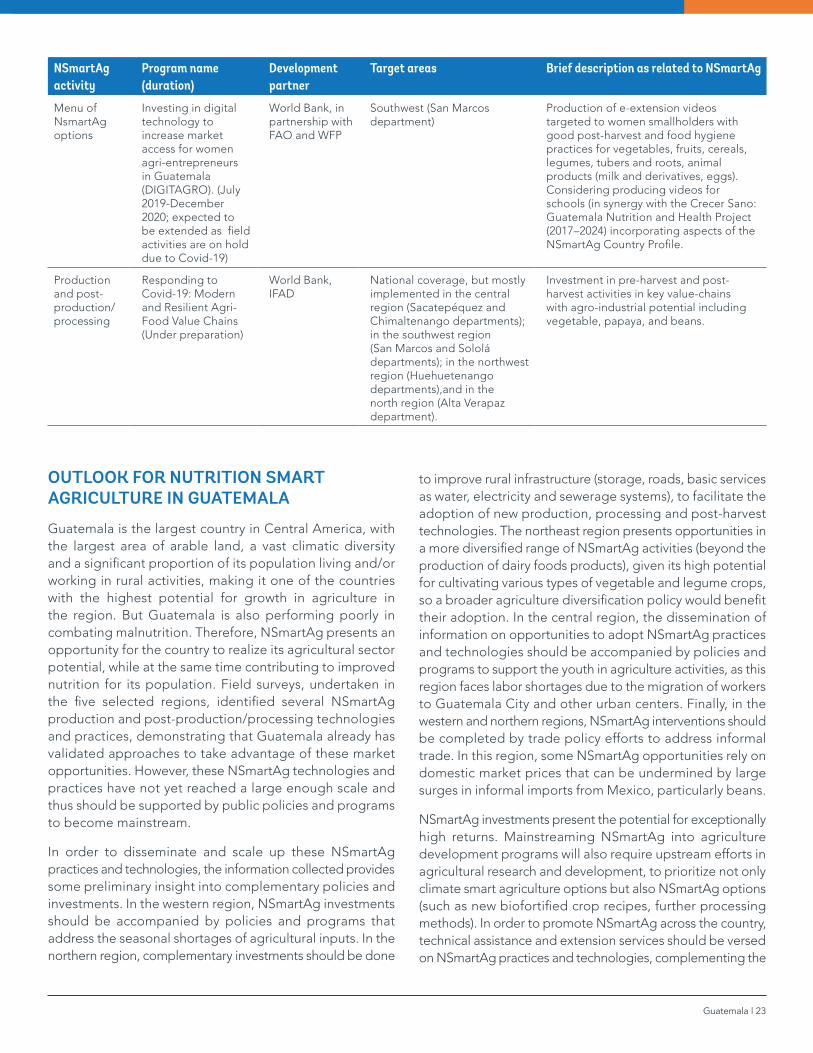
OUTLOOK FOR NUTRITION SMART AGRICULTURE IN GUATEMALA
Guatemala is the largest country in Central America, with the largest area of arable land, a vast climatic diversity and a significant proportion of its population living and/or working in rural activities, making it one of the countries with the highest potential for growth in agriculture in the region. But Guatemala is also performing poorly in combating malnutrition. Therefore, NSmartAg presents an opportunity for the country to realize its agricultural sector potential, while at the same time contributing to improved nutrition for its population. Field surveys, undertaken in the five selected regions, identified several NSmartAg production and post-production/processing technologies and practices, demonstrating that Guatemala already has validated approaches to take advantage of these market opportunities. However, these NSmartAg technologies and practices have not yet reached a large enough scale and thus should be supported by public policies and programs to become mainstream.
In order to disseminate and scale up these NSmartAg practices and technologies, the information collected provides some preliminary insight into complementary policies and investments. In the western region, NSmartAg investments should be accompanied by policies and programs that address the seasonal shortages of agricultural inputs. In the northern region, complementary investments should be done
to improve rural infrastructure (storage, roads, basic services as water, electricity and sewerage systems), to facilitate the adoption of new production, processing and post-harvest technologies. The northeast region presents opportunities in a more diversified range of NSmartAg activities (beyond the production of dairy foods products), given its high potential for cultivating various types of vegetable and legume crops, so a broader agriculture diversification policy would benefit their adoption. In the central region, the dissemination of information on opportunities to adopt NSmartAg practices and technologies should be accompanied by policies and programs to support the youth in agriculture activities, as this region faces labor shortages due to the migration of workers to Guatemala City and other urban centers. Finally, in the western and northern regions, NSmartAg interventions should be completed by trade policy efforts to address informal trade. In this region, some NSmartAg opportunities rely on domestic market prices that can be undermined by large surges in informal imports from Mexico, particularly beans.
NSmartAg investments present the potential for exceptionally high returns. Mainstreaming NSmartAg into agriculture development programs will also require upstream efforts in agricultural research and development, to prioritize not only climate smart agriculture options but also NSmartAg options (such as new biofortified crop recipes, further processing methods). In order to promote NSmartAg across the country, technical assistance and extension services should be versed on NSmartAg practices and technologies, complementing the
NSmartAg activity
Program name (duration)
Development partner
Target areas Brief description as related to NSmartAg
Menu of NsmartAg options
Investing in digital technology to increase market access for women agri-entrepreneurs in Guatemala (DIGITAGRO). (July 2019-December 2020; expected to be extended as field activities are on hold due to Covid-19)
World Bank, in partnership with FAO and WFP
Southwest (San Marcos department)
Production of e-extension videos targeted to women smallholders with good post-harvest and food hygiene practices for vegetables, fruits, cereals, legumes, tubers and roots, animal products (milk and derivatives, eggs). Considering producing videos for schools (in synergy with the Crecer Sano: Guatemala Nutrition and Health Project (2017–2024) incorporating aspects of the NSmartAg Country Profile.
Production and post-production/ processing
Responding to Covid-19: Modern and Resilient Agri-Food Value Chains (Under preparation)
World Bank, IFAD
National coverage, but mostly implemented in the central region (Sacatepéquez and Chimaltenango departments); in the southwest region (San Marcos and Sololá departments); in the northwest region (Huehuetenango departments),and in the north region (Alta Verapaz department).
Investment in pre-harvest and post-harvest activities in key value-chains with agro-industrial potential including vegetable, papaya, and beans.
24 | Nutrition Smart Agriculture Country Profile
existing best farming and post-harvest practices. There are numerous opportunities for linking NSmartAg with existing technical assistance and extension efforts, including the dissemination efforts for ICTA-developed technologies and crops, and the recent hiring of more than 300 extension workers by MAGA in 2019. Furthermore, there is a series of financial instruments embedded in development operations for agri-MSMEs as microcredits, associations and/or business partnerships that could easily integrate NSmartAg in the type of priority investments to be funded. In addition, NSmartAg interventions could be reinforced by providing access to technical advice on issues of food safety (Box 6); helping to identify options for entrepreneurs to meet the financial costs associated with complying with food safety regulations; and disseminating information and knowledge about nutritious food options, including biofortified crops.
Great National Crusade for Nutrition [39] led by the new government (2020–2024), opens up new opportunities to promote NSmartAg opportunities and to solve some of the constraints for scaling up these validated technologies and practices. In order to seize these opportunities, better coordination and communication among all the implementing institutions, including at technical and management levels of SINASAN is required. Only with joint and coordinated efforts between all relevant sectors (especially health and agriculture), can the nutritional status of Guatemala’s population improve. Efforts and opportunities to disseminate this Country Profile in agri-business fora and to financial institutions could be pursued to promote the adoption of NSmartAg by agribusinesses.
Box 6: Food safety—recommendations
In 1999, Guatemala introduced a Food Safety National Law that, for its time, was an achievement widely recognized throughout Central American region. However, its enforcement has differed throughout the country. In the most marginal areas (such as the western highlands and the north), it is barely enforced, due to: i) public budget constraints (which limit the presence and coordination activities of the food safety agencies in the whole country); ii) lack of communication, of transparency and of an interdisciplinary approach to the standard-setting process; and iii) the consequent regulatory non-compliance of food producers.
Findings drawn from experts’ interviews and field visits indicate that activities at different levels are required to improve the enforcement of food safety legislation in Guatemala.
At the governance level, increased awareness among high-level policy-makers on the burden of foodborne diseases in Guatemala would help reinforce the need to improve regulatory compliance through investments in enforcement and capacity building for farmers and producers, risk-based monitoring at national and subnational levels, and improved coordination between relevant government bodies on their food safety regulations policies and programs.
The entities in the food safety regulatory framework would benefit from more effective communication in the standard-setting process and risk analysis.
At the regulatory level, a range of measures are required to enhance clarity and understanding of food safety regulations and improve the food safety enforcement record. The process by which the national legislation is integrated within members of the Central American Common Market and harmonized to Codex Alimentarius Standards needs to be based on risk assessment, and better reflect the characteristics of Guatemalan consumers, in terms of consumer behavior and literacy.
Communication and transparency of the food safety regulatory framework need improvement. An analysis of the current state of food safety, its legislations and compliance measures would help increase the understanding of technicians and professionals working in the food sector. This would in turn enable them to communicate more effectively to producers, which is particularly important for illiterate producers and non-Spanish speakers. In parallel, a range of information products, targeted at and disseminated to relevant stakeholders could be developed.
At the field/farmers’ level, small producers and entrepreneurs should be equipped with information about national and international legislation, relevant legal and technical advice, and capacity-building support to comply with food safety requirements. The dissemination of information on foodborne diseases and their consequences should also be boosted.
Guatemala | 25
REFERENCES1 Lange, G. et al., 2018. “The Changing Wealth of Nations 2018: Building a Sustainable Future.” Vol. 9.
2 Kraay, A. 2018. Methodology for a World Bank Human Capital Index. World Bank.
3 FAO. 2013. “The State of Food and Agriculture: Food Systems for Better Nutrition.” Food and Agriculture Organization of the United Nations, Rome.
4 Shekar, M. and Popkin, B. 2020. “Obesity: Health and Economic Consequences of an Impending Global Challenge.” Human Development Perspectives series. World Bank.
5 Dobbs, R., Sawers, C., Thompson, F., Manyika, J., Woetzel, J., Child, P., McKenna, S., Spatharou, A. 2014. “Overcoming obesity: An initial economic analysis.” Discussion Paper. McKinsey Global Institute.
6 UNICEF. 2019. “The State of The World’s Children.” 2019. Available at: https://www.unicef.org/media/63016/file/SOWC-2019.pdf
7 ENSMI (Encuesta Nacional de Salud Materno Infantil). 2015. Available at: https://www.ine.gob.gt/images/2017/encuestas/ ensmi2014_2015.pdf
8 WHO. 2016. Diabetes Country Profiles-Guatemala. Available at: https://www.who.int/diabetes/country-profiles/gtm_en.pdf
9 Guatemala Demographic and Health Survey (DHS) 2014–2015. Available at: https://dhsprogram.com/publications/publication-FR318-DHS-Final-Reports.cfm
10 Ministerio de Salud Pública y Asistencia Social - MSPAS/Guatemala, Instituto Nacional de Estadística - INE/Guatemala, Secretaría de Planificación y Programación del la Presidencia - Segeplán/Guatemala and ICF International. 2017. Encuesta Nacional de Salud Materno Infantil 2014–2015: Informe Final. Rockville, Maryland, USA: MSPAS, INE, Segeplán and ICF International.
11 OPS-OMS (Organización Panamericana de la Salud- Organización Mundial de la salud). 2018. Indicadores Básicos. Situación de Salud en las Américas. Available at: http://iris.paho.org/xmlui/bitstream/handle/123456789/49511/IndicadoresBasicos2018_spa. pdf?sequence=2&isAllowed=y&ua=1
The Covid-19 crisis
The Covid-19 crisis is disrupting livelihoods and communities around the world. The pandemic poses a serious threat to food security and nutrition in developing countries. A majority of households are net food buyers and the poor spend most of their income on food. Experience from past pandemics and the 2007/08 world food price crisis highlight food security and nutrition as major concerns.
At the time of publication, the government of Guatemala had implemented measures to mitigate the spread of the virus, including curfew, and international and local border closures. Although movement of food and other essential goods was still permitted, and most markets were functioning normally [40], significant increases in basic foodstuffs prices as beans, eggs, and rice have been reported since the quarantine began due to hoarding, low supply, and increasing demand.
Increases in the price of food, coupled with a decrease in the purchasing power of households – due to several economic activities closing because of the pandemic, as already evidenced in Guatemala [40] and due to the reduction of remittances– reduce the consumption of food, in particular higher cost micronutrient-dense foods. This compromises the quality of diets and leads to malnutrition.
In turn, malnutrition weakens the immune system, increasing the susceptibility to infections such as Covid-19. There are several specific micronutrients being produced in Guatemala (and part of the NSmartAg opportunities presented in this country profile) that help strengthen the immune system, such as vitamin B12, zinc and iron. Deficiencies in these micronutrients are already causing problems in many low- and middle-income countries. Protein, one of the main macronutrients and represented in the food groups selected by this profile, plays a vital role in building and repairing body tissues and supports physiological utilization of other important nutrients, such as iron. An optimal consumption of protein in diet helps maintain the immune system. An optimal consumption of protein in diet helps maintain the immune system. Promoting NSmartAg technologies and practices, as well as broader nutrition-sensitive support is of great importance in the response to Covid-19 to contribute to the resilience of the most vulnerable populations.
26 | Nutrition Smart Agriculture Country Profile
12 ICEF (Instituto Centroamericano de Estudios fiscales)—UNICEF. 2011. “Protegiendo la nueva cosecha: un análisis del costo de erradicar el hambre en Guatemala, 2012–2021.” Available at: http://biblioteca.clacso.edu.ar/Guatemala/icefi/20140911015139/Contamos__No.4_.pdf
13 Food and Nutrition Technical Assistance (FANTA). 2016. “Análisis de la situación y tendencias de los micronutrientes claves en Guatemala, con un llamado a la acción desde las políticas públicas.”
14 World Bank. 2010. “Guatemala: Nutrition at a Glance.” Available at: http://siteresources.worldbank.org/INTLACREGTOPNUT/ Resources/Guatemala4-20-10.pdf
15 Arsenault, J. and Brown, K. 2017. “Effects of protein or amino-acid supplementation on the physical growth of young children in low-income countries.” Nutr Rev. Sep 2017; 75(9): 699–717. Available at: https://www.ncbi.nlm.nih.gov/pmc/articles/PMC5914345/
16 López, D. 2016. “Situación actual de los micronutrientes en Latinoamérica.” Available at: http://es.wfp.org/sites/default/files/es/ file/1_situacion_actual_de_los_micronutrientes_en_latinoamerica.pdf
17 ENMICRON (Encuesta Nacional de Micronutrientes). 2009–2010. Available at: http://www.siinsan.gob.gt/siinsan/wp-content/ uploads/Informe-Final-ENMICRON-2009-2010-optimi.pdf
18 MAGA. 2016. “El agro en cifras.” Available at https://www.maga.gob.gt/sitios/diplan/download/El-Agro-En-Cifras-2016.pdf
19 Banco de Guatemala. 2020. “Guatemala: Valor (CIF) de las importaciones y valor (FOB) de las exportaciones por producto de la industria agropecuaria, extractiva y manufacturera.” Available at: http://www.banguat.gob.gt/ inc/ver.asp?id=/estaeco/comercio/por_producto/prod_mensDB001.HTM&e=117267; and CEPAL, FAO, IICA. 2019. “Perspectivas de la Agricultura y del Desarrollo Rural en las Américas: Una Mirada Hacia América Latina y el Caribe 2019-2020.” Available at: https://agrirural.org/es
20 SIB. (Súper Intendencia de Bancos). 2011. “Análisis de Sectores Económicos. Sector Cafetalero.”
21 WTO (World Trade Organization). 2020. International Trade statistics. Available at: https://timeseries.wto.org/
22 Reliefweb. 2018. “GIEWS Update: Central America - Drought causes crop losses in “Dry Corridor” in Central America” (27 August 2018). Available at: https://reliefweb.int/report/guatemala/giews-update-central-america-drought-causes-crop-losses-dry-corridor-central
23 Banco de Guatemala. 2019. “Guatemala en cifras.” Available at: http://www.banguat.gob.gt/Publica/guatemala_en_cifras_2019.pdf
24 INE (Instituto Nacional de Estadística). 2015. República de Guatemala: Encuesta Nacional Agropecuaria 2014. Available at: https:// www.ine.gob.gt/sistema/uploads/2015/10/16/iQH6CPCSZUC1uOPe8fRZPen2qvS5DWsO.pdf
25 Global Food Security Index. Available at: https://foodsecurityindex.eiu.com/
26 PNUD (Programa de las Naciones Unidas para el Desarrollo-PNUD). 2016. “Informe Nacional de Desarrollo Humano.” Available at: http://desarrollohumano.org.gt/wp-content/uploads/2016/04/INDH_Completo_digital-1.pdf
27 FAO. 2015. Nutrition and consumer protection. Available at: http://www.fao.org/ag/agn/nutrition/gtm_en.stm
28 Eckstein, D., Künzel, V., Schäfer, L., Schäfer, P., Flatow, M., & Schwarz, R. 2018. Global Climate Risk Index 2018. “Who suffers most from extreme weather events? Weather-related loss events in 2016 and 1997 to 2016.” Berlin.
29 de Molina, P., & Touchette, M. 2019. Country Programme Guatemala (2015–2019) Standard Project Report 2017.
30 RIMISP (Centro Latinoamericano para el Desarrollo Rural). 2013. La Agricultura Familiar en Guatemala. Informe del Proyecto Análisis de la Pobreza y de la Desigualdad en América Latina Rural. Available at: https://www.rimisp.org/wp-content/files_mf/1438712425148_Agricultura_Familiar_Guatemala_Rome¬ro_editado.pdf
31 Proyecto Fortalecimiento de la Productividad de la Micro, pequeña y Mediana Empresa. Available at: https://www.pronacom.gt/website/biblioteca/biblioteca_5._frijol.pdf
32 FAO. The future of food and agriculture. Available at: http://www.fao.org/3/a-i6583e.pdf
33 Food-Based Dietary Guidelines (FBDGs). Available at: http://www.fao.org/nutrition/education/food-based-dietary-guidelines/ regions/countries/guatemala/es/
34 INCAP (Instituto de Nutrición de Centro América y Panamá). 2013. “Estudio complementario al análisis Secundario de los datos de la Encuesta Nacional de Condiciones de Vida de Guatemala (ENCOVI 2006).” Available at: http://www.incap.int/index.php/es/ publicaciones-incap/119-guatemala-informe-del-estudio-analisis-secundario-de-la-encovi-2006/file
35 SESAN. 2019. “Protocolo de actuación conjunta del sistema nacional de seguridad alimentaria y nutricional. Radiografía al funcionamiento actual del sistema.” Available at: http://www.sesan.gob.gt/wordpress/wp-content/uploads/2019/09/Protocolo-SINASAN.pdf
36 CONASAN. 2015. Plan Estratégico de Seguridad Alimentaria y Nutricional. Available at: http://www.sesan.gob.gt/wordpress/wp-content/uploads/2017/07/PESAN-2016-2020.pdf
37 MINFIN (Ministerio de Finanzas). 2019. General Budget of State Income and Expenditure, FY 2019. Available at: https://www.minfin.gob.gt/images/archivos/presua2019/inicio%201.htm
38 COGUANOR. 2019. Available at: http://www.coguanor.gob.gt/index.php?id=6
39 MSPAS. 2020. Gran Cruzada Nacional por la Nutrición. Available at: https://www.mspas.gob.gt/index.php/noticias/gran-cruzada-nacional-por-la-nutricion
40 Famine Early Warning Systems Network (fews.net April 2020). Available at: https://fews.net/central-america-and-caribbean/key-message-update/april-2020
May 2020