Embed Size (px)
Citation preview
International Journal of
Environmental Research
and Public Health
Article
Nutrition Education Intervention Increases FishConsumption among School Children in Indonesia:Results from Behavioral Based RandomizedControl Trial
Trias Mahmudiono 1,2,* , Triska Susila Nindya 1, Qonita Rachmah 1 , Calista Segalita 1 andLuh Ade Ari Wiradnyani 2
1 Department of Nutrition, Faculty of Public Health, Universitas Airlangga, Jl. Mulyorejo Kampus C,Surabaya 60115, Indonesia; [email protected] (T.S.N.); [email protected] (Q.R.);[email protected] (C.S.)
2 Southeast Asian Ministers of Education Organization Regional Centre for Food andNutrition (SEAMEO RECFON) Pusat Kajian Gizi Regional (PKGR), Universitas Indonesia,Jl. Salemba Raya No.6, Jakarta Pusat 10430, Indonesia; [email protected]
* Correspondence: [email protected]; Tel.: +62-31-5964808
Received: 22 August 2020; Accepted: 21 September 2020; Published: 23 September 2020�����������������
Abstract: This study aimed to analyze the effectiveness of behavioral-based nutrition education toincrease fish consumption among school children using a raised bed pool. This was a randomizedcontrol trial study with a 3-months nutrition education intervention using a raised bed pool, as amedium to improve their internalization to increase fish consumption behavior. A paired t-test wasused to calculate the difference in the increase of fish consumption, knowledge, attitude, perceivedbehavioral control, subjective norm, and intention. This study took place in a majority of low tomedium urban households in Surabaya in Sidotopo Wetan I and Sidotopo Wetan II elementaryschool. Elementary school children at 4th and 5th grade and mother of elementary school childrenwith 104 children were eligible and willing to participate. After the completion of interventions,significant improvement in delta-mean and effectiveness observed in attitude, subjective norm,perceived behavioral control, intention, knowledge, and fish consumption (p < 0.001). The 3 monthsof nutrition education intervention based on the theory of planned behavior significantly increasefish consumption among elementary school children. The increased consumption was believed to berelated to the increase in children’s knowledge and attitude towards consuming fish.
Keywords: nutrition education; fish consumption; school children; raised bed pool; Indonesia
1. Introduction
Hidden hunger, a micronutrient deficiency such as iron, iodine, vitamin A, or calcium, is one ofthe nutrition problems that still exist in a developing country, including Indonesia. The prevalence ofanemia in schoolchildren globally reached 37% in which was found to be higher in Asian children thanAfrican [1]. Based on the Indonesia Family Life Survey (IFLS), the prevalence of anemia in childrenaged 5–12 years declined from 36.4% in 2000 to 20.6% in 2008 [2]. The latest report shows that theprevalence of anemia in children aged 5–14 years is 26.4% and count as a public health problem [3].A study in one primary school in Surabaya found that the anemia prevalence in the schoolchild reached13.2% [4].
In the short term, anemia in schoolchildren affects the level of learning concentration due toreduced oxygen supply to the brain causes a lack of hemoglobin [5]. In the long term, the condition
Int. J. Environ. Res. Public Health 2020, 17, 6970; doi:10.3390/ijerph17196970 www.mdpi.com/journal/ijerph
Int. J. Environ. Res. Public Health 2020, 17, 6970 2 of 14
of anemia in children causes several health consequences, especially during childhood development.Anemia was more at risk for developing neurologic delays [6].
A study in Makassar found that schoolchildren who only occasionally (2–3 times/week) consumeheme protein sources are more at risk of anemia than those who frequently (4–7 times/week) consume [7].Protein sources affect the type of iron that can be absorbed by the body and could lead to anemia ifabsorption is low.
Fish is one source of heme protein that has a good iron absorption rate. Protein content in fishreaches 18% and consists of essential amino acids. According to the Indonesian Food ExchangeList, one serving of fresh fish (50 g) contains 10 g of protein and 2 mg of iron. The Total Diet Studyin 2014 reported the average consumption of fish and processed fish meat. The children group(aged 5–12 years) was 70.7 g per person per day [8]. East Java is one of the provinces with thehighest growth of fish consumption per kg/capita/year since 2010–2014. Fish consumption in 2010was only 19.01 kg/capita/ year up to 27.89 kg/capita/year with a 46% growth level in the last 4 years.Fish consumption in East Java is predicted to continue to rise [9]. In 2019, fish consumption is targetedto reach 54.49 kg/capita/year [10].
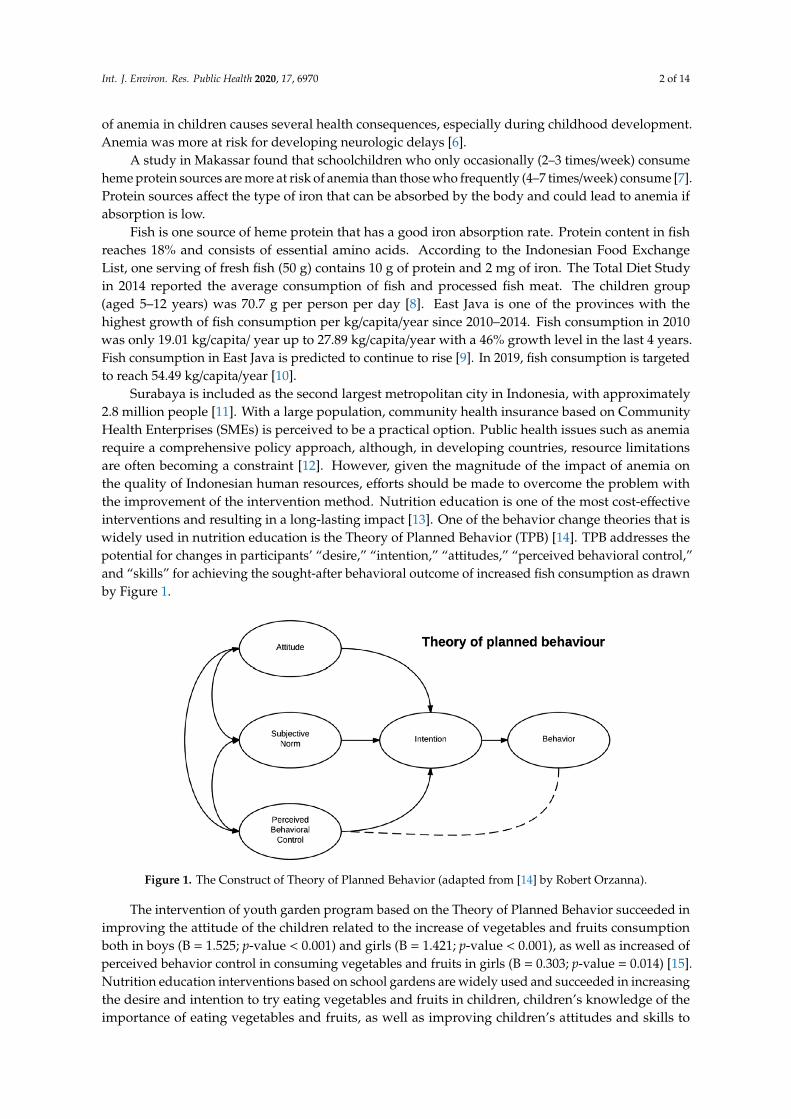
Surabaya is included as the second largest metropolitan city in Indonesia, with approximately2.8 million people [11]. With a large population, community health insurance based on CommunityHealth Enterprises (SMEs) is perceived to be a practical option. Public health issues such as anemiarequire a comprehensive policy approach, although, in developing countries, resource limitationsare often becoming a constraint [12]. However, given the magnitude of the impact of anemia onthe quality of Indonesian human resources, efforts should be made to overcome the problem withthe improvement of the intervention method. Nutrition education is one of the most cost-effectiveinterventions and resulting in a long-lasting impact [13]. One of the behavior change theories that iswidely used in nutrition education is the Theory of Planned Behavior (TPB) [14]. TPB addresses thepotential for changes in participants’ “desire,” “intention,” “attitudes,” “perceived behavioral control,”and “skills” for achieving the sought-after behavioral outcome of increased fish consumption as drawnby Figure 1.
Int. J. Environ. Res. Public Health 2020, 17, x 2 of 14
of anemia in children causes several health consequences, especially during childhood development. Anemia was more at risk for developing neurologic delays [6].
A study in Makassar found that schoolchildren who only occasionally (2–3 times/week) consume heme protein sources are more at risk of anemia than those who frequently (4–7 times/week) consume [7]. Protein sources affect the type of iron that can be absorbed by the body and could lead to anemia if absorption is low.
Fish is one source of heme protein that has a good iron absorption rate. Protein content in fish reaches 18% and consists of essential amino acids. According to the Indonesian Food Exchange List, one serving of fresh fish (50 g) contains 10 g of protein and 2 mg of iron. The Total Diet Study in 2014 reported the average consumption of fish and processed fish meat. The children group (aged 5–12 years) was 70.7 g per person per day [8]. East Java is one of the provinces with the highest growth of fish consumption per kg/capita/year since 2010–2014. Fish consumption in 2010 was only 19.01 kg/capita/ year up to 27.89 kg/capita/year with a 46% growth level in the last 4 years. Fish consumption in East Java is predicted to continue to rise [9]. In 2019, fish consumption is targeted to reach 54.49 kg/capita/year [10].
Surabaya is included as the second largest metropolitan city in Indonesia, with approximately 2.8 million people [11]. With a large population, community health insurance based on Community Health Enterprises (SMEs) is perceived to be a practical option. Public health issues such as anemia require a comprehensive policy approach, although, in developing countries, resource limitations are often becoming a constraint [12]. However, given the magnitude of the impact of anemia on the quality of Indonesian human resources, efforts should be made to overcome the problem with the improvement of the intervention method. Nutrition education is one of the most cost-effective interventions and resulting in a long-lasting impact [13]. One of the behavior change theories that is widely used in nutrition education is the Theory of Planned Behavior (TPB) [14]. TPB addresses the potential for changes in participants’ “desire,” “intention,” “attitudes,” “perceived behavioral control,” and “skills” for achieving the sought-after behavioral outcome of increased fish consumption as drawn by Figure 1.
Figure 1. The Construct of Theory of Planned Behavior (adapted from [14] by Robert Orzanna).
The intervention of youth garden program based on the Theory of Planned Behavior succeeded in improving the attitude of the children related to the increase of vegetables and fruits consumption both in boys (B = 1.525; p-value < 0.001) and girls (B = 1.421; p-value < 0.001), as well as increased of perceived behavior control in consuming vegetables and fruits in girls (B = 0.303; p-value = 0.014) [15]. Nutrition education interventions based on school gardens are widely used and succeeded in increasing the desire and intention to try eating vegetables and fruits in children, children’s knowledge of the importance of eating vegetables and fruits, as well as improving children’s attitudes and skills to increase vegetable and fruit consumption [16,17]. Another study also mentioned that
Figure 1. The Construct of Theory of Planned Behavior (adapted from [14] by Robert Orzanna).
The intervention of youth garden program based on the Theory of Planned Behavior succeeded inimproving the attitude of the children related to the increase of vegetables and fruits consumptionboth in boys (B = 1.525; p-value < 0.001) and girls (B = 1.421; p-value < 0.001), as well as increased ofperceived behavior control in consuming vegetables and fruits in girls (B = 0.303; p-value = 0.014) [15].Nutrition education interventions based on school gardens are widely used and succeeded in increasingthe desire and intention to try eating vegetables and fruits in children, children’s knowledge of theimportance of eating vegetables and fruits, as well as improving children’s attitudes and skills to
Int. J. Environ. Res. Public Health 2020, 17, 6970 3 of 14
increase vegetable and fruit consumption [16,17]. Another study also mentioned that school-basedgardens are useful because of their experiential and direct learning in schoolchildren [18].
Analogous to involving children in school garden activities to increase consumption of fruitsand vegetables, increased consumption of fish may be triggered by involving children in fish farmingactivities in the school pool (raised bed pool). Raised Bed Pool (RBP) can be made using simplematerials such as tarpaulins and wood/bamboo buffers that are filled with water for aquaculture, so theydo not have to dig the soil. During this time, RBP has been implemented in several regions in Indonesiathrough the NICE program in six provinces in Indonesia namely North Sumatra, South Sumatera,West Nusa Tenggara, East Nusa Tenggara, West Kalimantan, and South Sulawesi. However, the use ofRBP is limited only as a source of animal protein and the potential to be used as nutrition educationmedia is still not widely recognized. By using RBP media in nutrition education as an instant reminderfor schoolchildren is expected to increase school children’s intention to eat fish. The RBP Project alsotargets variables to increase school children’s perceived behavior control to eat fish with a weeklyfishmeal program, fish-game cards, and catfish-based food menu making. Besides, RBP will alsoconduct a “Catfish Hours” program where school children are asked to help provide food for catfishraised in the RBP program.
Likely, a nutritional education intervention program with RBP to improve the achievement of thecentral government program “Love Eating Fish” and the prevention of anemia in school children canfollow the success of the school gardening program. School gardening and raised bed pool equallyprioritize the concept of mastery experience for children to be actively involved in the management ofgardening programs or cultivating freshwater fish. Compared to the raised bed garden, the raised bedpool program produces an animal food source of heme-iron protein that is relatively easily absorbedby the body than non-heme iron. School children’s characteristics are more interested in interactingwith moving objects rather than stationary objects. Together with RBP, providing nutrition educationto improve school children’s knowledge of the importance of eating fish for growth and prevention ofanemia, then school children involved in the RBP program will be able to associate new knowledgeinformation with their activities while taking care the RBP. Based on the description above, this researchwould like to evaluate the effectiveness of RBP as a medium of nutrition education intervention toincrease fish consumption as part of anemia prevention efforts in school children. Our hypothesis thatbehavioral-based nutrition education using a “raised bed pool” could improve fish consumption ofschool children.
2. Materials and Methods
2.1. Study Setting and Sample
The study was conducted at Sidotopo Wetan I and Sidotopo Wetan II elementary school, SidotopoSub-district, Surabaya, Indonesia. Sidotopo is a region in Surabaya, with the majority of the people,are having low to medium monthly income. This district is included as one of the slum districtsin North Surabaya. According to Surabaya Regional Statistical Survey [11], Sidotopo had a highermigration rate compared to other subdistricts. Hence, with a narrow space to live and overloadedwith migrants, the slum environment could not be hindered. Inclusion criteria for the study wereschool children aged 10–12 years, not allergic to fish, and not on a special diet due to health problems(i.e., type 1 diabetes diet, low protein diet, weight loss diet).
Meanwhile, the withdrawn criteria were for the subjects missing >50%, or more than 3, interventionsessions. The school was chosen purposively by considering the location of the Sidotopo Subdistricthas the majority of residence categorized in the low and middle income where protein (including fish)availability and consumption tends to be low. The selection of Sidotopo Wetan I and II elementary schoolwas based on easy accessibility, there was no raised bed pool, and there was no similar research before.Research subjects were elementary school children at 4th and 5th grade and mother of elementaryschool children. Based on a preliminary survey conducted in both elementary schools, the total
Int. J. Environ. Res. Public Health 2020, 17, 6970 4 of 14
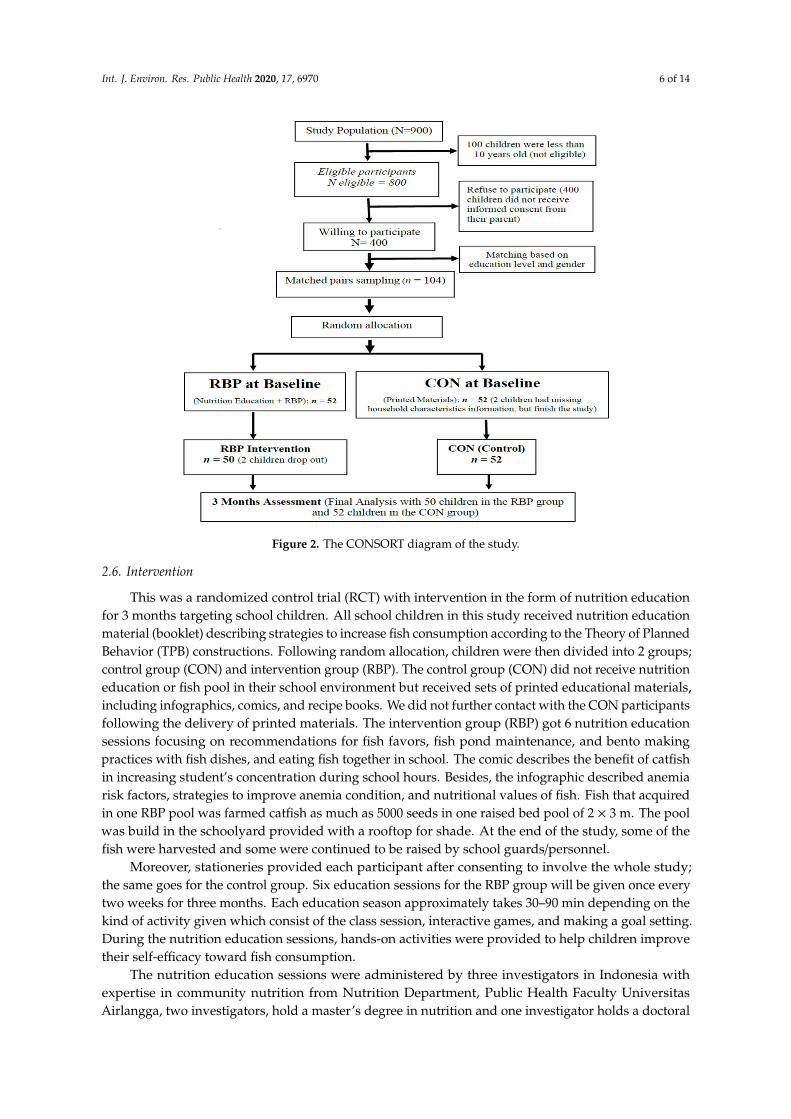
number of grade 4 and 5 students recorded were 900 children (research population). A screening thenperformed based on the inclusion criteria and 800 eligible subjects were retrieved. The sample sizein this study was determined using a formula of sample size for comparing the mean of continuousmeasurement in two samples. Using a z-statistic to approximate the t-statistic with the effect sizecalculated from the results of McAleese et al. [19] on increased consumption of vegetables per servingin nutritional education interventions based on school gardening (n = 45, SD = 1.7, ES = 1.2) comparedwith the control group. By using 80% power and alpha of 0.05, the minimum samples obtained withoutcluster correction were 32 subjects for each group. Then, taking into account the design effect 1 + (%(m + 1) using cluster size 30 and Inter-cluster Correlation Coefficient (ICC) = 0.043 based on manualdiabetic research [20]. The design effect formula accounted for m number of observations in eachcluster and % (rho) is the intra-cluster correlation. The minimum sample required was 46 primaryschool children in each group with the consideration of 10% drop out, the sample in this study was 52school children in each group. The total sample in this study was 104 school-age children aged between10–12 years taken from eligible and willing participants. Matching was done to reduce the influence ofbias due to education level and gender. Randomization of the sample study was performed usingcomputer software to generate random numbers. The adapted CONSORT diagram in Figure 2 showedthe sampling procedure of the study.
The independent variables in the study were the nutrition education intervention (utilizing RBP)and the control condition where children and mothers were given printed materials. The nutritioneducation intervention would be expected to influence the key outcome (dependent variable) of fishconsumption by altering mediating variables (from the TPB), resulting in actual behavior change in theform of consumption of fish. The moderating variables in this study including characteristics of schoolchildren, socio-economic status (SES) of the schoolchild’s family, knowledge; mediating variablesinclude attitudes, intentions, subjective norms, and perceived behavior control of school children to eatfish, while the behavioral outcome was fish consumption. Nutrition education would hypotheticallyresult in more reported fish consumption than the use of printed materials alone. Fish consumptionwas measured using a food diary record in which students were trained to fill the record form beforethe baseline data were taken. A total of three-days food diary records on all food consumed werecollected in a week based on the previous study mentioned that 3-day food records made the bestagreement compared to another dietary assessment [19]. Before administered food, research assistantswere trained to filling the food record form. After data collection, they also do the data recheck andinput to the software. Dietary data were analyzed using food processor software Nutrisurvey; drawingfrom a database of Indonesian Food updated yearly by the Department of Nutrition, UniversitasAirlangga, Indonesia.
2.2. Ethics
Ethics approval for this study was received from the Institutional Review Board (IRB) at theFaculty of Public Health Universitas Airlangga approved the trial (reference number: 159-KEPK) dated26 April 2017. The ethics obtained were aligned with the Helsinki protocol ensuring animal welfarethroughout the study. Align with the beneficence principle, the use of catfish in the study was beneficialtowards acquiring new knowledge and evidence. Furthermore, the fish was commonly eaten in thesite of the study hence benefitting the nutrient intake of the children. The Universal Trial Number(UTN) for this study is U1111-1199-992. This trial was registered in the Thai Clinical Trials Registry(TCTR) and was allocated trial registration number TCTR20171207002. This research project had beenapproved for registration at TCTR since 2017-12-04 12:01:33. Before the study began, the mother’s orchild guardian was first called by the teachers to the parent’s gathering at school. The research leaderthen explaining the study details to the prospective subjects about the child’s enrollment. Duringrecruitment, potential participants and their mothers were given verbal and written information aboutthe study, and at least one week to think about participating. Verbal and written informed consent was
Int. J. Environ. Res. Public Health 2020, 17, 6970 5 of 14
obtained during the monthly community health post-meeting. Participants are free to withdraw fromthe study at any time without negative consequences.
2.3. Anthropometric Measurement
The child’s weight was measured using the Omron HBP-317 digital scale with a 0.01 kg correctionand measured in light clothing without shoes. Height was measured to the nearest 0.1 cm usinga stadiometer (SECA 213). Both weight and height were measured twice to ensure the result’svalidity. The third measurement will be taken if the difference between two prior two measurementsdiffers by more than 1%. Another measurement to assess the nutritional status of the children wasbody composition, including body fat and body muscle percentage, as well as the resting metabolicrate. These indicators were measured using Omron HBF-317 that validated with the SECA digitalweight scale. Bodyweight and composition data were collected to understand the distribution ofschool children’s nutritional status, but it is not in terms of the impact of fish consumption. Rather,the assessment is to describe the school children by their nutritional status which is indicated by theirgrowth indicators.
2.4. Characteristics and Nutrition Knowledge
A general questionnaire was developed to obtained parent’s social-economic status (SES) datathat includes parent’s educational background, employment, and the number of a family member,literacy level, family income, and food expenses. A child’s nutritional knowledge was measured usinga questionnaire that was previously validated [16]. The questionnaire consists of three parts; the firstpart focus on the nutrition and health knowledge with a total of six questions and the second partfocuses on household serving size to measure how well children know about the portion, and the lastpart consists of questions related to MyPlate Indonesia. The household serving size questionnaireconsists of six questions, while MyPlate Indonesia consists of an essay question in which children wereasked to categorize several food items to their group.
2.5. Theory of Planned Behavior
Outcome related psychological data obtained in this study, including children’s attitude, subjectivenorm, perceived behavioral control, behavior, and intention toward fish consumption. All of thepsychological data questionnaires were developed as Likert scale answers based on Bandura’s guidefor constructing attitude, subjective norm, perceived behavioral control, behavior, and intentionscales [20]. Children’s attitude to consuming fish as the source of animal protein was measuredusing a three-item questionnaire (e.g., attitude toward increasing food consumption, attitude towardsconsuming fish at least twice a week, and attitude toward consuming fish every day). Similar toattitude measurement, three other indices including perceived behavioral control (e.g., consumingfood is easy, willingness to consume fish, and willingness to consume fish if they know the possibledanger of not consuming fish). Intention to consume fish was also measured using three questions(e.g., intention to consume fish, trying to consume fish, and planning to consume fish). Additionally,subjective norms towards fish consumption measured using 6 indicators in eight questions, includingbehavioral belief strength, outcome evaluation, injunctive normative belief strength, motivation tocompliance, descriptive normative belief.
Int. J. Environ. Res. Public Health 2020, 17, 6970 6 of 14Int. J. Environ. Res. Public Health 2020, 17, x 6 of 14
Figure 2. The CONSORT diagram of the study.
2.6. Intervention
This was a randomized control trial (RCT) with intervention in the form of nutrition education for 3 months targeting school children. All school children in this study received nutrition education material (booklet) describing strategies to increase fish consumption according to the Theory of Planned Behavior (TPB) constructions. Following random allocation, children were then divided into 2 groups; control group (CON) and intervention group (RBP). The control group (CON) did not receive nutrition education or fish pool in their school environment but received sets of printed educational materials, including infographics, comics, and recipe books. We did not further contact with the CON participants following the delivery of printed materials. The intervention group (RBP) got 6 nutrition education sessions focusing on recommendations for fish favors, fish pond maintenance, and bento making practices with fish dishes, and eating fish together in school. The comic describes the benefit of catfish in increasing student’s concentration during school hours. Besides, the infographic described anemia risk factors, strategies to improve anemia condition, and nutritional values of fish. Fish that acquired in one RBP pool was farmed catfish as much as 5000 seeds in one raised bed pool of 2 × 3 m. The pool was build in the schoolyard provided with a rooftop for shade. At the end of the study, some of the fish were harvested and some were continued to be raised by school guards/personnel.
Moreover, stationeries provided each participant after consenting to involve the whole study; the same goes for the control group. Six education sessions for the RBP group will be given once every two weeks for three months. Each education season approximately takes 30–90 min depending on the kind of activity given which consist of the class session, interactive games, and making a goal setting. During the nutrition education sessions, hands-on activities were provided to help children improve their self-efficacy toward fish consumption.
Figure 2. The CONSORT diagram of the study.
2.6. Intervention
This was a randomized control trial (RCT) with intervention in the form of nutrition educationfor 3 months targeting school children. All school children in this study received nutrition educationmaterial (booklet) describing strategies to increase fish consumption according to the Theory of PlannedBehavior (TPB) constructions. Following random allocation, children were then divided into 2 groups;control group (CON) and intervention group (RBP). The control group (CON) did not receive nutritioneducation or fish pool in their school environment but received sets of printed educational materials,including infographics, comics, and recipe books. We did not further contact with the CON participantsfollowing the delivery of printed materials. The intervention group (RBP) got 6 nutrition educationsessions focusing on recommendations for fish favors, fish pond maintenance, and bento makingpractices with fish dishes, and eating fish together in school. The comic describes the benefit of catfishin increasing student’s concentration during school hours. Besides, the infographic described anemiarisk factors, strategies to improve anemia condition, and nutritional values of fish. Fish that acquiredin one RBP pool was farmed catfish as much as 5000 seeds in one raised bed pool of 2 × 3 m. The poolwas build in the schoolyard provided with a rooftop for shade. At the end of the study, some of thefish were harvested and some were continued to be raised by school guards/personnel.
Moreover, stationeries provided each participant after consenting to involve the whole study;the same goes for the control group. Six education sessions for the RBP group will be given once everytwo weeks for three months. Each education season approximately takes 30–90 min depending on thekind of activity given which consist of the class session, interactive games, and making a goal setting.During the nutrition education sessions, hands-on activities were provided to help children improvetheir self-efficacy toward fish consumption.
The nutrition education sessions were administered by three investigators in Indonesia withexpertise in community nutrition from Nutrition Department, Public Health Faculty UniversitasAirlangga, two investigators, hold a master’s degree in nutrition and one investigator holds a doctoral
Int. J. Environ. Res. Public Health 2020, 17, 6970 7 of 14
degree in nutrition. Six trained research assistants who each hold a bachelor’s degree in public healthnutrition delivered a hands-on activity session.
2.7. Statistical Analyses
A paired t-test was used to analyze the difference in outcomes of control and interventiongroups. This statistical analysis has been adjusted for possible confounders such as school childrencharacteristics, SES, and household characteristics. All data analyses were performed at IBM SPSSStatistics 22.
3. Results
At the beginning of the study, the total number of participants was 104 consisting of 52 childrenaged 9–12 years in each intervention and comparison group. However, two children in the interventiongroup were dropped as a result of not completing all of the six educational sessions. The drop-out ratefrom the intervention group was 3.8%. Thus, the analyzed result of the rest of the 102 samples was ableto illustrate the effectiveness of nutrition education intervention using a raised bed pool. According tothe data in Table 1, the average primary school children age in this study was 11.5 and their averageheight was around 145 cm. The average weight of the control group was slightly higher (43.76 kg)compared to the intervention group (39.6 kg). However, based on the t-test independent analytical test,it was found that between the control and intervention group there was no significant difference inchildren’s characteristics in terms of age, height, total fat, and resting metabolic.
Table 1. Children characteristics.
Children CharacteristicsControl Group (n = 52) Intervention Group (n = 50) p-Value
Mean SD Mean SD
Age, years 11.56 0.61 11.76 0.66 0.109Height, cm 145.04 7.16 144.43 7.07 0.665Weight, kg 43.76 13.88 39.60 12.07 0.111BMI, kg/m2 20.48 5.14 18.99 4.29 0.118Total Fat, g 26.52 22.96 23.26 5.99 0.333
Resting Metabolic Rate, Cal/day a 1111.09 309.50 1001.48 260.20 0.056Fish consumption at Baseline 0.37 0.66 1.30 1.02 <0.001 *
* Statistically significant at alpha = 0.05 based on the independent t-test; a RMR was retrieved through BIA bodycomposition tools.
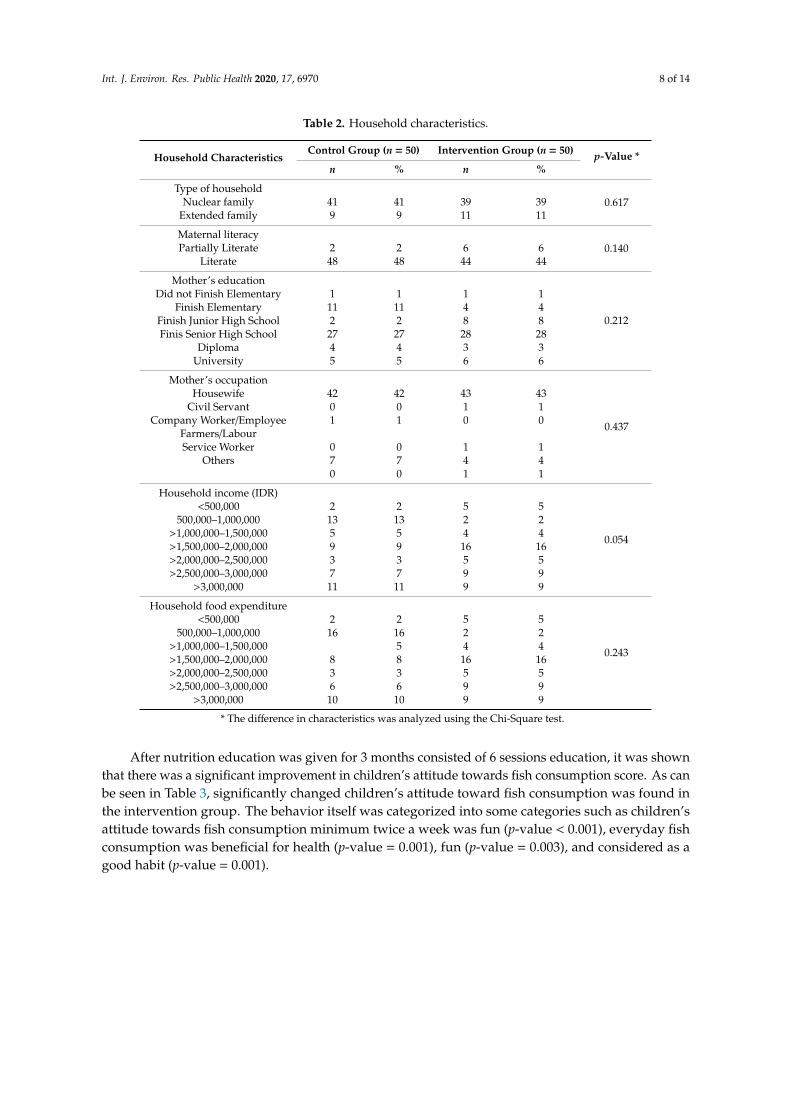
Unfortunately, 2 children in the control group were not completing the household characteristicsbut they were able to complete the study hence considered missing data. Hence we included in the finalanalysis of the study, even though as seen in Table 2, only 50 children in each group were presentedfor their household characteristics. As can be seen in Table 2, most of the respondent families werethe nuclear family (80%), literate mother (92%), and senior high school graduates (46%). Most of therespondent mothers were housewives (85%) and also most of the respondent fathers were senior highschool graduates (85%). Most of the family income was between IDR 500,000.00 to IDR 2,000,000.00.The average family income and outcome in the intervention group were slightly higher comparedto the control group. However, there was no meaningful difference based on the Chi-Square result(p-value = 0.054). Compared to the minimum wage for the Surabaya district (IDR 3,296,212.50), most ofthe family income in our study was much lower [11].
Int. J. Environ. Res. Public Health 2020, 17, 6970 8 of 14
Table 2. Household characteristics.
Household CharacteristicsControl Group (n = 50) Intervention Group (n = 50) p-Value *
n % n %
Type of household0.617Nuclear family 41 41 39 39
Extended family 9 9 11 11
Maternal literacy0.140Partially Literate 2 2 6 6
Literate 48 48 44 44
Mother’s education
0.212
Did not Finish Elementary 1 1 1 1Finish Elementary 11 11 4 4
Finish Junior High School 2 2 8 8Finis Senior High School 27 27 28 28
Diploma 4 4 3 3University 5 5 6 6
Mother’s occupation
0.437
Housewife 42 42 43 43Civil Servant 0 0 1 1
Company Worker/Employee 1 1 0 0Farmers/LabourService Worker 0 0 1 1
Others 7 7 4 40 0 1 1
Household income (IDR)
0.054
<500,000 2 2 5 5500,000–1,000,000 13 13 2 2
>1,000,000–1,500,000 5 5 4 4>1,500,000–2,000,000 9 9 16 16>2,000,000–2,500,000 3 3 5 5>2,500,000–3,000,000 7 7 9 9
>3,000,000 11 11 9 9
Household food expenditure
0.243
<500,000 2 2 5 5500,000–1,000,000 16 16 2 2
>1,000,000–1,500,000 5 4 4>1,500,000–2,000,000 8 8 16 16>2,000,000–2,500,000 3 3 5 5>2,500,000–3,000,000 6 6 9 9
>3,000,000 10 10 9 9
* The difference in characteristics was analyzed using the Chi-Square test.
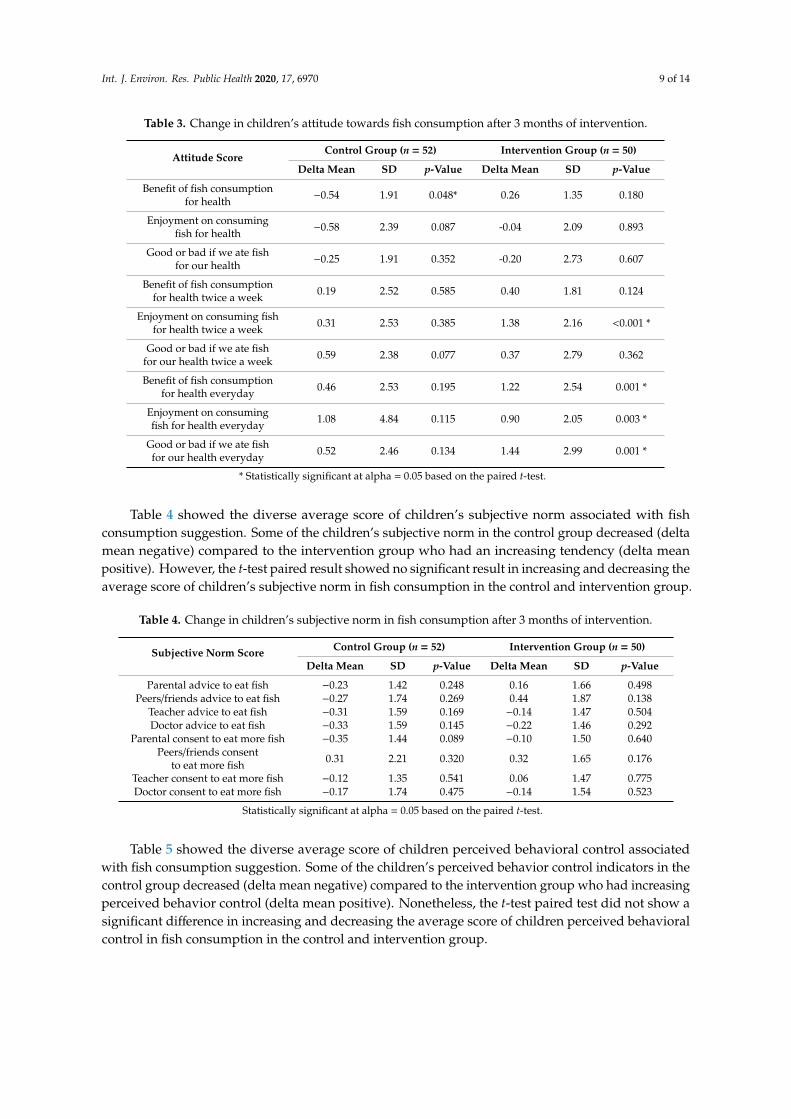
After nutrition education was given for 3 months consisted of 6 sessions education, it was shownthat there was a significant improvement in children’s attitude towards fish consumption score. As canbe seen in Table 3, significantly changed children’s attitude toward fish consumption was found inthe intervention group. The behavior itself was categorized into some categories such as children’sattitude towards fish consumption minimum twice a week was fun (p-value < 0.001), everyday fishconsumption was beneficial for health (p-value = 0.001), fun (p-value = 0.003), and considered as agood habit (p-value = 0.001).
Int. J. Environ. Res. Public Health 2020, 17, 6970 9 of 14
Table 3. Change in children’s attitude towards fish consumption after 3 months of intervention.
Attitude ScoreControl Group (n = 52) Intervention Group (n = 50)
Delta Mean SD p-Value Delta Mean SD p-Value
Benefit of fish consumptionfor health −0.54 1.91 0.048* 0.26 1.35 0.180
Enjoyment on consumingfish for health −0.58 2.39 0.087 -0.04 2.09 0.893
Good or bad if we ate fishfor our health −0.25 1.91 0.352 -0.20 2.73 0.607
Benefit of fish consumptionfor health twice a week 0.19 2.52 0.585 0.40 1.81 0.124
Enjoyment on consuming fishfor health twice a week 0.31 2.53 0.385 1.38 2.16 <0.001 *
Good or bad if we ate fishfor our health twice a week 0.59 2.38 0.077 0.37 2.79 0.362
Benefit of fish consumptionfor health everyday 0.46 2.53 0.195 1.22 2.54 0.001 *
Enjoyment on consumingfish for health everyday 1.08 4.84 0.115 0.90 2.05 0.003 *
Good or bad if we ate fishfor our health everyday 0.52 2.46 0.134 1.44 2.99 0.001 *
* Statistically significant at alpha = 0.05 based on the paired t-test.
Table 4 showed the diverse average score of children’s subjective norm associated with fishconsumption suggestion. Some of the children’s subjective norm in the control group decreased (deltamean negative) compared to the intervention group who had an increasing tendency (delta meanpositive). However, the t-test paired result showed no significant result in increasing and decreasing theaverage score of children’s subjective norm in fish consumption in the control and intervention group.
Table 4. Change in children’s subjective norm in fish consumption after 3 months of intervention.
Subjective Norm Score Control Group (n = 52) Intervention Group (n = 50)
Delta Mean SD p-Value Delta Mean SD p-Value
Parental advice to eat fish −0.23 1.42 0.248 0.16 1.66 0.498Peers/friends advice to eat fish −0.27 1.74 0.269 0.44 1.87 0.138
Teacher advice to eat fish −0.31 1.59 0.169 −0.14 1.47 0.504Doctor advice to eat fish −0.33 1.59 0.145 −0.22 1.46 0.292
Parental consent to eat more fish −0.35 1.44 0.089 −0.10 1.50 0.640Peers/friends consent
to eat more fish 0.31 2.21 0.320 0.32 1.65 0.176
Teacher consent to eat more fish −0.12 1.35 0.541 0.06 1.47 0.775Doctor consent to eat more fish −0.17 1.74 0.475 −0.14 1.54 0.523
Statistically significant at alpha = 0.05 based on the paired t-test.
Table 5 showed the diverse average score of children perceived behavioral control associatedwith fish consumption suggestion. Some of the children’s perceived behavior control indicators in thecontrol group decreased (delta mean negative) compared to the intervention group who had increasingperceived behavior control (delta mean positive). Nonetheless, the t-test paired test did not show asignificant difference in increasing and decreasing the average score of children perceived behavioralcontrol in fish consumption in the control and intervention group.
Int. J. Environ. Res. Public Health 2020, 17, 6970 10 of 14
Table 5. Change in children’s perceived behavioral control towards fish consumption after 3 monthsof intervention.
Perceived Behavioural Control ScoreControl Group (n = 52) Intervention Group (n = 50)
Delta Mean SD p-Value Delta Mean SD p-Value
Perception that increasing fishconsumption in one month is easy −0.12 1.75 0.636 −0.36 2.14 0.239
I can increase my fish consumption if Iwanted to −0.02 2.65 0.958 0.32 1.96 0.255
I can increase my fish consumption if Iknow the benefit for it −0.52 1.85 0.049 * 0.18 1.54 0.411
* Statistically significant at alpha = 0.05 based on the paired t-test.
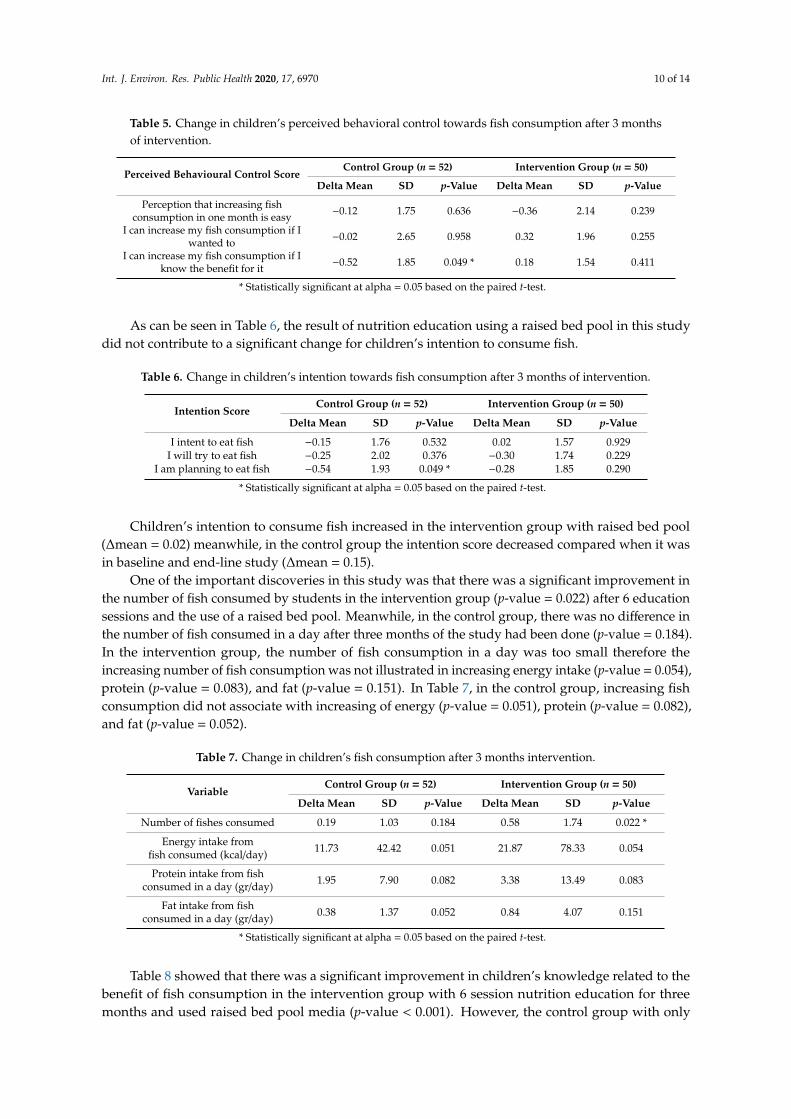
As can be seen in Table 6, the result of nutrition education using a raised bed pool in this studydid not contribute to a significant change for children’s intention to consume fish.
Table 6. Change in children’s intention towards fish consumption after 3 months of intervention.
Intention ScoreControl Group (n = 52) Intervention Group (n = 50)
Delta Mean SD p-Value Delta Mean SD p-Value
I intent to eat fish −0.15 1.76 0.532 0.02 1.57 0.929I will try to eat fish −0.25 2.02 0.376 −0.30 1.74 0.229
I am planning to eat fish −0.54 1.93 0.049 * −0.28 1.85 0.290
* Statistically significant at alpha = 0.05 based on the paired t-test.
Children’s intention to consume fish increased in the intervention group with raised bed pool(∆mean = 0.02) meanwhile, in the control group the intention score decreased compared when it wasin baseline and end-line study (∆mean = 0.15).
One of the important discoveries in this study was that there was a significant improvement inthe number of fish consumed by students in the intervention group (p-value = 0.022) after 6 educationsessions and the use of a raised bed pool. Meanwhile, in the control group, there was no difference inthe number of fish consumed in a day after three months of the study had been done (p-value = 0.184).In the intervention group, the number of fish consumption in a day was too small therefore theincreasing number of fish consumption was not illustrated in increasing energy intake (p-value = 0.054),protein (p-value = 0.083), and fat (p-value = 0.151). In Table 7, in the control group, increasing fishconsumption did not associate with increasing of energy (p-value = 0.051), protein (p-value = 0.082),and fat (p-value = 0.052).
Table 7. Change in children’s fish consumption after 3 months intervention.
VariableControl Group (n = 52) Intervention Group (n = 50)
Delta Mean SD p-Value Delta Mean SD p-Value
Number of fishes consumed 0.19 1.03 0.184 0.58 1.74 0.022 *
Energy intake fromfish consumed (kcal/day) 11.73 42.42 0.051 21.87 78.33 0.054
Protein intake from fishconsumed in a day (gr/day) 1.95 7.90 0.082 3.38 13.49 0.083
Fat intake from fishconsumed in a day (gr/day) 0.38 1.37 0.052 0.84 4.07 0.151
* Statistically significant at alpha = 0.05 based on the paired t-test.
Table 8 showed that there was a significant improvement in children’s knowledge related to thebenefit of fish consumption in the intervention group with 6 session nutrition education for threemonths and used raised bed pool media (p-value < 0.001). However, the control group with only
Int. J. Environ. Res. Public Health 2020, 17, 6970 11 of 14
printed educational material also showed a significant increase in knowledge related to the importanceof fish consumption (p-value = 0.001).
Table 8. Change in children’s knowledge of the importance of fish consumption after 3 monthsof intervention.
VariableControl Group (n = 52) Intervention Group (n = 50)
Delta Mean SD p-Value Delta Mean SD p-Value
Knowledge Score 1.29 2.65 0.001 * 1.70 2.54 <0.001 *
* Statistically significant at alpha = 0.05 based on the paired t-test.
4. Discussion
In this study, respondents were specifically learned more about fish consumption, including theirbenefits, how to prepare them, and how they taste, which may help to facilitate and increase their fishconsumption. It is known that schoolchildren need a good diet to develop and grow well. Theory ofPlanned Behavior (TPB) based intervention using Raised Bed Pool (RBP) in this study revealed thatnutrition education within 3-months had given significant effect on students’ behavior which consistof attitude, subjective norm, perceived behavioral control, knowledge, and the amount towards fishconsumption. This approach was proven in the previous study that after intensive 3-months nutritioneducation through the workshop, utilization video, and photovoice has significantly increased fishconsumption by more than 5 g per day [21].
Ajzen posited that the change in healthy eating behavior would be easier to be adopted if it is doneat the earliest stage of life [22]. Childhood has been identified as a critical period for the developmentof eating patterns that track to adulthood [23–25]. Considering the importance of good nutritionin childhood to achieve healthy growth and development. It will be essential to give children theopportunities to be exposed to healthy food as early as possible [26,27]. A systematic review of relatedfactors influencing children’s eating behavior explained that children’s eating pattern was influencedby the food environment provided by parents and children’s experience [25]. Furthermore, the healthyeating behavior of the children was mirrored by the parent’s eating behavior. One of the healthy eatingpattern practices that still needs to be improved in children is fish consumption habits. The latest datafrom the national survey in 2014 showed that consumption of fish and its product in children was only70.7 g, lower compared to adult and elderly groups [8], while the availability of fish in Indonesia isquite high. Fish is one of the recommended types of protein consumed by children because of the goodfat content that is beneficial for brain development and also high iron content that can reduce the riskof anemia in children.
Our study revealed that the usage of a raised bed pool as a medium for nutrition educationintervention successfully improves students’ fish consumption. This highlighted that TPB-nutritioneducation added by the raised bed pool as an effective nutrition media enhances behavioral change(knowledge, attitude, perceived behavioral control, and intention) related to fish consumption.TPB nutrition education is still necessary as the main effort to convey messages on the importance ofconsuming fish to school children. Meanwhile, access to RBP adds to hands-on or experiential learningfor students. This study added to the growing evidence that school-based nutrition education (NE)programs could lead to moderate increases in fish consumption among children [19,28,29]. Based on theTheory of Planned Behavior construct, the behavior is strongly influenced by intention, which togetheris influenced by attitudes, subjective norms, and perceived behavioral control [15]. All of the nutritioneducation activity carried out in this study directed at modifying determinants of behavior (attitudes,subjective norms, perceived behavioral control, and intention of consumption), and consumption offish. Our study was aligned with a randomized control trial based on TBP construct in 86 children byusing 14 sessions of 60 min nutrition education was successfully increase children’s fruit and vegetableintake by first increasing their attitudes, subjective norms, and perceived behavioral control [30].
Int. J. Environ. Res. Public Health 2020, 17, 6970 12 of 14
Furthermore, Kim and Park [29] also explained in their study that garden-based integrated with socialcognitive theory elements as one of the behavioral change strategies successfully improved children’seating behavior for vegetables; which strengthen our results that both TPB and RBP intervention wereneeded to improve children’s behavior towards fish consumption.
The raised bed pool is adapted from a raised bed garden (RBG). While RBG is the utilization of thegarden, RBP is the utilization of the pool. Studies have shown that RBG can significantly increase freshfruit and vegetable consumption; therefore, RBP is expected to be able to increase fish consumption [28].In addition, RBP can be a powerful learning medium that is beneficial and worthwhile for both teachersand students. RBP is unique media as it provides potential protein sources from the fish in the poolthat is lacking from RBG. Similar to RBG, RBP provides an atmosphere that incorporates hands-onactivities and strengthens academic, personal, and social skills. Moreover, it allows children to developand strengthen their life skills in areas such as nutrition, leadership, and decision making [19].
RBP is a medium that provides authentic and hands-on experience to nature, which is effectiveat increasing cognitive abilities and higher-order thinking skills. The term “hands-on” gives a moreconcrete definition of hands-on instruction as well as its influences which young students especiallylearn through actions, more so than older students, and therefore experience greater benefits fromhands-on and action-oriented learning [31]. This helps more students experience more success in theirlearning because multiple senses reinforce it at once. A meta-analysis study in students in Australiashowed that experimental nutritional learning at school was associated with higher effects in healthyconsumption in students [30]. It is also supported by the previous study that school garden-enhancednutrition education could increase students’ willingness to taste vegetables and their vegetable tasteratings [32]. It is further explained that the school garden may increase vegetable intake, but otherdeterminants might take part.
Based on Piaget and other scientists’ theories, they stated that a child’s understanding is developedthrough his actions on the environment not merely through language [33]. As stated before, experientialeducation techniques (e.g., raised bed pool) helps children to develop cognitive skills. It will increasechildren’s’ intrinsic motivation to learn. It can be said that using RBP is an effective learning techniquedue to their hands-on experience, not to mention with the 3 months. The raised bed pool will be servedas a visual reminder to the children that actual learning will magnify the effect of the 6 sessions ofbehaviorally oriented nutrition education.
One of the strengths of the study is that evidence on the effectiveness of nutrition educationintervention using a raised bed pool was scarce relative to the abundance body of knowledge relatedto the raised bed garden. However, little work has been carried out to address the effectivity of raisedbed pool as a nutrition education media and previous work have not comprehensively considered.A limitation in this study is the fact that variation and inequalities between elementary schoolswhether it was a private or public school. Both elementary schools involved in this study weredrawn from public schools located in the low to middle-income population. Generalization of theresults of the intervention could be limited due to the current setting of the sample. To limit potentialbias, all measurements were performed through a standardized protocol, and all enumerators weretrained before data collection. As the study did not measure the actual amount of fish served to thechildren by their parents, richer parents within the intervention group could induce a bias. Richerparents (intervention group) could afford to buy fish more often, while poorer parents (control group)would be limited. Another limitation was the absence of iron level or anemia status and total energyintake measurement due to budget limitation. Thus, future research might mention this as otherdependent variables.
For further studies, another innovative form of nutrition education is needed. Given the complexityof dietary behavior change, a comprehensive study to understand several factors that might affectchildren’s behavior in consuming fish need to be explored. The education material should be consistingof the number of fishes that should be consumed based on children’s (9–11 years) RecommendedDietary Intake (RDI).
Int. J. Environ. Res. Public Health 2020, 17, 6970 13 of 14
5. Conclusions
In conclusion, the 3 months nutrition education intervention based on the theory of plannedbehavior significantly increase fish consumption among elementary school children. The increasedconsumption was believed to be related to the increase in children’s knowledge and attitude towardsconsuming fish. It is suggested to the school setting to continue the nutrition education effort byintegrating raised bed pool media with the existing school health program.
Author Contributions: Conceptualization, T.M.; methodology, T.M., Q.R. and L.A.A.W.; software, L.A.A.W.;validation, T.M.; formal analysis, T.M., T.S.N. and C.S.; investigation, T.M., C.S. and T.S.N.; resources, T.M.; datacuration, T.M., Q.R. and C.S.; writing—original draft preparation, T.M.; writing—review and editing, T.M., T.S.N.,Q.R., C.S. and L.A.A.W.; visualization, C.S.; supervision, T.M., T.S.N. and L.A.A.W.; project administration, Q.R.;funding acquisition, T.M. All authors have read and agreed to the published version of the manuscript.
Funding: This research was funded by The Ministry of Education and Culture of the Republic of Indonesiathrough contractual research between Universitas Airlangga and the South East Asian Ministers of EducationOrganization Regional Centre for Food and Nutrition (SEAMEO RECFON) Pusat Kajian Gizi Regional (PKGR),Universitas Indonesia. SEAMEO RECFON funded the open access publication of this article and UniversitasAirlangga supported for proofreading and similarity check of this article. Furthermore, the funders had no role inthe design of the study; collection, analyses, or interpretation of data; in the writing of the manuscript, or in thedecision to publish the results.
Acknowledgments: The authors would like to acknowledge the participants especially students, teachers,and parents on the study site in Sidotopo Wetan I and II elementary schools, Surabaya, East Java, Indonesia fortheir time and commitment to the study.
Conflicts of Interest: The authors declare no conflict of interest.
References
1. McLean, E.; Cogswell, M.; Egli, I.; Wojdyla, D.; De Benoist, B. Worldwide Prevalence of Anaemia, WHOVitamin and Mineral Nutrition Information System, 1993–2005. Public Health Nutr. 2009, 12, 444–454.[CrossRef] [PubMed]
2. Barkley, J.S.; Kendrick, K.L.; Codling, K.; Muslimatun, S.; Pachón, H. Anaemia Prevalence over Time inIndonesia: Estimates from the 1997, 2000, and 2008 Indonesia Family Life Surveys. Asia Pac. J. Clin. Nutr.2015, 24, 452–455. [CrossRef] [PubMed]
3. Riskesdas. Riset Kesehatan Dasar 2013; Riskesdas: Jakarta, Indonesia, 2013.4. Hermawati, M.U. Hubungan Tingkat Konsumsi Energi Dan Protein Dengan Status Anemia Pada Anak
Usia Sekolah Dasar (Studi Pada Anak Usia Sekolah Dasar Di SDN Pegirian II, Surabaya). Skripsi Thesis,Universitas Airlangga, Surabaya, Indonesia, 2007.
5. Resti. Penggunaan Smartphone Dikalangan Mahasiswa Fakultas Ilmu Sosial Dan Ilmu Politik. Jom Fisip;Riau University: Riau, Indonesia, 2015.
6. Masloman, N.; Gunawan, S. Hubungan Antara Anemia Dengan Perkembangan Neurologi Anak Usia12-24 Bulan. Sari Pediatr. 2016, 7, 178. [CrossRef]
7. Sirajuddin, S.; Masni, M. Kejadian Anemia Pada Siswa Sekolah Dasar. Kesmas Natl. Public Heal. J. 2015,9, 264. [CrossRef]
8. Puspitasari, D.S.; Julianti, E.D.; Safitri, A.; Permanasari, Y. Buku Survei Konsumsi Makanan Individu DalamStudi Diet Total Provinsi DKI Jakarta 2014; Badan Penelitian Dan Pengembangan Kesehatan: Jakarta, Indonesia,2014; Available online: https://www.pusat2.litbang.kemkes.go.id/wp-content/uploads/2018/03/Buku-Studi-Diet-Total-Survei-Konsumsi-Makanan-Individu-DKI-Jakarta-2014.pdf (accessed on 21 June 2019).
9. Ditjen PDSPKP. Direktorat Jendral Penguatan Daya Saing Produk Kelautan Dan Perikanan; Ditjen PDSPKP:Jakarta, Indonesia, 2018.
10. Depkes, R.I. Ikan Untuk Ketahanan Pangan Dan Gizi. Available online: http://gizi.depkes.go.id/wp-content/uploads/2015/02/IKAN-UNTUK-KETAHANAN-PANGAN-DAN-GIZI-NASIONAL-Bag-II.pdf (accessedon 21 June 2019).
11. BPS. Surabaya Dalam Angka; BPS: Surabaya, Indonesia, 2018.12. Popkin, B.M. The Nutrition Transition in Low-Income Countries: An Emerging Crisis. Nutr. Rev. 1994,
52, 285–298. [CrossRef]
Int. J. Environ. Res. Public Health 2020, 17, 6970 14 of 14
13. Contento, I.R. Nutrition Education: Linking Research, Theory, and Practice. Asia Pac. J. Clin. Nutr. 2008,17 (Suppl. S1), 176–179.
14. Ajzen, I.; Fishbein, M. The Influence of Attitudes on Behavior. Handb. Attitudes 2005, 173–222. [CrossRef]15. Lautenschlager, L.; Smith, C. Understanding Gardening and Dietary Habits among Youth Garden Program
Participants Using the Theory of Planned Behavior. Appetite 2007, 49, 122–130. [CrossRef]16. Hutchinson, J.; Christian, M.S.; Evans, C.E.L.; Nykjaer, C.; Hancock, N.; Cade, J.E. Evaluation of the Impact
of School Gardening Interventions on Children’s Knowledge of and Attitudes towards Fruit and Vegetables.A Cluster Randomised Controlled Trial. Appetite 2015, 91, 405–414. [CrossRef]
17. Morris, J.L.; Zidenberg-Cherr, S. Garden-Enhanced Nutrition Curriculum Improves Fourth-Grade SchoolChildren’s Knowledge of Nutrition and Preferences for Some Vegetables. J. Am. Diet. Assoc. 2002, 102, 91–93.[CrossRef]
18. Heim, S.; Stang, J. A Garden Pilot Project Enhances Fruit and Vegetable Consumption among Children.YJADA 2009, 109, 1220–1226. [CrossRef] [PubMed]
19. McAleese, J.D.; Rankin, L.L. Garden-Based Nutrition Education Affects Fruit and Vegetable Consumption inSixth-Grade Adolescents. J. Am. Diet. Assoc. 2007, 107, 662–665. [CrossRef] [PubMed]
20. Sturt, J.A.; Whitlock, S.; Fox, C.; Hearnshaw, H.; Farmer, A.J.; Wakelin, M.; Eldridge, S.; Griffiths, F.; Dale, J.Effects of the Diabetes Manual 1:1 structured education in primary care. Diabet Med. 2008, 25, 722–731.[CrossRef] [PubMed]
21. Fretes, G.; Salinas, J.; Vio, F. Effect of a Nutrition Education Intervention on Consumption of Fruits, Vegetablesand Fish in Families of Prescholers and Scholers. Arch. Latinoam. Nutr. 2013, 63, 37–45. [PubMed]
22. Ajzen, I. Attitudes, Personality and Behavior; McGraw-Hill Education: London, UK, 2005; p. 117.23. Dietz, W.H. Critical Periods in Childhood for the Development of Obesity. Am. J. Clin. Nutr. 1994, 59, 955–959.
[CrossRef]24. De Cosmi, V.; Scaglioni, S.; Agostoni, C. Early Taste Experiences and Later Food Choices. Nutrients 2017,
9, 107. [CrossRef]25. Scaglioni, S.; De Cosmi, V.; Ciappolino, V.; Parazzini, F.; Brambilla, P.; Agostoni, C. Factors Influencing
Children’s Eating Behaviours. Nutrients 2018, 10. [CrossRef]26. Nekitsing, C.; Hetherington, M.M.; Blundell-Birtill, P. Developing Healthy Food Preferences in Preschool
Children Through Taste Exposure, Sensory Learning, and Nutrition Education. Curr. Obes. Rep. 2018,7, 60–67. [CrossRef]
27. Birch, L.; Savage, J.S.; Ventura, A. Influences on the Development of Children’s Eating Behaviours: FromInfancy to Adolescence. Can. J. Diet. Pract. Res. 2007, 68, s1–s56.
28. Robinson-O’Brien, R.; Story, M.; Heim, S. Impact of Garden-Based Youth Nutrition Intervention Programs:A Review. J. Am. Diet. Assoc. 2009, 109, 273–280. [CrossRef]
29. Kim, S.O.; Park, S. Garden-Based Integrated Intervention for Improving Children’s Eating Behavior forVegetables. Int. J. Environ. Res. Public Health 2020, 17, 1257. [CrossRef] [PubMed]
30. Dudley, D.A.; Cotton, W.G.; Peralta, L.R. Teaching Approaches and Strategies That Promote Healthy Eatingin Primary School Children: A Systematic Review and Meta-Analysis. Int. J. Behav. Nutr. Phys. Act. 2015,12, 28. [CrossRef] [PubMed]
31. Flick, L.B. The Meanings of Hands-on Science. J. Sci. Teach. Educ. 1993, 4, 1–8. [CrossRef]32. McGuire, S.; Ervin, R.B.; Kit, B.K.; Carroll, M.D.; Ogden, C.L. Consumption of Added Sugar among U.S.
Children and Adolescents, 2005–2008. NCHS Data Brief No 87. Hyattsville, MD: National Center for HealthStatistics. 2012. Adv. Nutr. 2012, 3, 534. [CrossRef] [PubMed]
33. Wadsworth, B.J. Piaget’s Theory of Cognitive and Affective Development: Foundations of Constructivism, 5th ed.;Longman Publishing: White Plains, NY, USA, 1996; p. 195.
© 2020 by the authors. Licensee MDPI, Basel, Switzerland. This article is an open accessarticle distributed under the terms and conditions of the Creative Commons Attribution(CC BY) license (http://creativecommons.org/licenses/by/4.0/).


![One fish [Режим совместимости] fish.pdf · Dr. Seuss One fish two fish red fish blue fish. One fish Two fish . Blue fish Red fish. Blue fish Black fish. Old fish](https://img.pdfslide.us/doc/110x75/5fce8df40415697f677cef57/one-fish-fishpdf-dr-seuss-one-fish-two.jpg)