Embed Size (px)
Citation preview

Nutrients in Agricultural Production: A Water
Quality Overview
Updated February 29, 2016
Congressional Research Service
https://crsreports.congress.gov
R43919

Nutrients in Agricultural Production: A Water Quality Overview
Congressional Research Service
Summary Nutrients are elements essential to plant and animal growth. In agricultural production, the focus
generally rests on the three primary macronutrients––nitrogen (N), phosphorus (P), and potassium
(K)—because of their relative abundance in plants. As crops grow and are harvested, they
gradually remove the existing nutrients from the soil and over time will require additional
nutrients to maintain or increase crop yield. When nutrients are added in excess of the plants’
ability to utilize them, there is an increased risk that the nutrients will enter the surrounding
environment (water or air) and create environmental problems. The nutrients of primary
environmental concern in agriculture are nitrogen and phosphorus.
One of the better-known environmental responses to high levels of nutrients is eutrophication––
the enrichment of water bodies, which can promote the growth of algae. Under certain conditions,
algal blooms can occur that can deplete the oxygen content of water, block sunlight to other
organisms, and potentially produce toxins. These harmful algal blooms can contaminate surface
and drinking water supplies, potentially harming animal and human health.
Over time, through research and technological advancements, an understanding of how crops
utilize nutrients and how nutrients move in the environment have led to the development of a
number of best management practices (BMPs) for nutrient management. Primarily, nutrient
BMPs focus on preventing or reducing the ways in which excess nutrients can enter the
environment. Crop production BMPs for nutrient management generally focus on applying the
right amount of nutrients, from the right source, in the right place, at the right time. BMPs for
livestock operations are typically prescribed for concentrated animal feeding operations
(CAFOs), where animals are raised or bred in close quarters, thus creating a concentrated source
of nutrients.
Currently, few federal regulations govern the environmental impacts from agriculture. Some
environmental laws specifically exempt agriculture from regulatory requirements, and others are
structured so that agriculture is not addressed by most, if not all, of the regulatory impact. The
primary regulatory authority protecting water resources is the Clean Water Act (CWA).
Regulatory requirements for agricultural nutrients under the CWA are limited to permitting
requirements for large CAFOs and the establishment of total maximum daily loads, which are
pollution limits for state-identified impaired waters.
The major federal response to nutrient pollution from agriculture continues to be through
research, education, outreach, and voluntary technical and financial incentives. A number of U.S.
Department of Agriculture agencies provide support through education, outreach, and research,
while federal funds are provided through conservation programs to help agricultural producers
adopt BMPs for nutrient reduction.
As the 114th Congress reviews nutrient pollution in U.S. waterways, among the issues being
discussed is how to address nutrients from agricultural sources. Whether the current balance
between regulatory action and voluntary response is enough to meet environmental goals, who
should bear the cost of preventing and correcting nutrient loading, and whether the tools for
correction are adequate are among the issues being discussed. How these issues are resolved will
have important implications for agriculture, which has taken a keen interest in water quality
policy and legislation.

Nutrients in Agricultural Production: A Water Quality Overview
Congressional Research Service
Contents
Introduction ..................................................................................................................................... 1
Caveats ...................................................................................................................................... 1
Nutrients: A Primer .......................................................................................................................... 2
Adding Nutrients—Fertilizers ................................................................................................... 3 Organic Fertilizers .............................................................................................................. 4 Inorganic Fertilizers ............................................................................................................ 7
Effects of Nutrient Excess on Water Quality ................................................................................... 9
Nitrogen .................................................................................................................................. 10 Phosphorus .............................................................................................................................. 10 Environmental Effects .............................................................................................................. 11
Cyanobacteria .................................................................................................................... 11 Red Tide ............................................................................................................................ 12 Ciguatera ........................................................................................................................... 12
Human Health Effects ............................................................................................................. 12
Best Management Practices ........................................................................................................... 13
Crop Production ...................................................................................................................... 14 Animal Agriculture .................................................................................................................. 16
Federal Response to Agricultural Nutrients .................................................................................. 18
Regulation––Clean Water Act ................................................................................................. 18 Concentrated Animal Feeding Operation (CAFO) Permits .............................................. 18 Total Maximum Daily Load (TMDL) ............................................................................... 19
Production Support.................................................................................................................. 19 Technical Assistance, Education, and Outreach ................................................................ 20 Financial Assistance .......................................................................................................... 20 Research and Monitoring .................................................................................................. 21
Policy Questions ............................................................................................................................ 22
Conclusion ..................................................................................................................................... 23
Figures
Figure 1. Essential Elements for Plant Growth ............................................................................... 3
Figure 2. Relationship Between Nutrient Mobility and Plant Extraction ........................................ 4
Figure 3. Capacity of Cropland to Assimilate Nitrogen .................................................................. 6
Figure 4. Capacity of Cropland to Assimilate Phosphorus .............................................................. 6
Figure 5. Manure Nitrogen in Excess of Need ................................................................................ 6
Figure 6. Manure Phosphorus in Excess of Need ............................................................................ 6
Figure 7. Fertilizer Use in U.S. Agriculture .................................................................................... 7
Figure 8. Nitrogen-Containing Fertilizers ....................................................................................... 8
Figure 9. Soil Sample .................................................................................................................... 14
Figure 10. No-Till System and Crop Rotation ............................................................................... 14
Figure 11. Stripcropping ................................................................................................................ 15
Figure 12. Denitrifying Bioreactor with Drainage Water Management Illustration ...................... 15
Nutrients in Agricultural Production: A Water Quality Overview
Congressional Research Service
Figure 13. Select Examples of Nutrient Application Methods ...................................................... 16
Figure 14. Terraces and Grassed Waterways ................................................................................. 17
Figure 15. Constructed Wetland .................................................................................................... 17
Tables
Table 1. Acres Receiving Manure from Various Animal Types ....................................................... 4
Table A-1. Select NRCS Practice Standards Related to Nutrient Reduction and Water
Quality ........................................................................................................................................ 24
Appendixes
Appendix. NRCS Practice Standards ............................................................................................ 24
Contacts
Author Information ........................................................................................................................ 25

Nutrients in Agricultural Production: A Water Quality Overview
Congressional Research Service R43919 · VERSION 8 · UPDATED 1
Introduction United States agriculture has been touted as a model for production and a leader of innovation.
The nation’s intense agricultural production, however, can lead to adverse impacts to the
surrounding environment. In some cases, it is the excess of basic nutrients required for plant and
animal growth that can cause this degradation. Ongoing research aims to improve understanding
of nutrients used and released in agricultural production, including how they interact in the
environment, the damages they can cause, and ways to prevent or correct the damage.
Federal policies concerning agricultural nutrients have changed over time. Currently, few federal
regulations govern the environmental impacts of nutrients from agriculture. Some environmental
laws specifically exempt agriculture from regulatory requirements, and others are structured so
that agriculture is not addressed by most, if not all, of the regulations. The major federal response
continues to be through research, education, outreach, and voluntary technical and financial
incentives to producers.
Recent events involving degraded water quality have raised questions as to whether the current
federal response to agricultural nutrients is adequate or should be altered. This has prompted both
administrative and congressional action.1 This report discusses the types and sources of nutrient
pollution from agricultural production; possible environmental effects of nutrient pollution;
examples of current control measures; the federal response to excess nutrients, including
regulatory and incentive-based programs; and future considerations for nutrient management
policy at the federal level.2
Caveats
Agriculture is one of a number of industries that produce, use, or release nutrients that may
adversely affect the environment. The lack of discussion in this report of other industries that
might release excess nutrients does not imply that one industry is more or less to blame for
environmental harms. The science and methods of pinpointing the exact source of excess
nutrients causing environmental harm are still evolving. Regardless, whether released by
agriculture, lawn care companies, or sewage treatment plants, the environmental harms of excess
nutrients are much the same.
A large body of research, including numerous technical publications, explores the relationship
between agriculture and nutrients. This report gives an overview of current knowledge, while
further complexities of individual issues are discussed in many of the sources cited throughout the
report.
Similarly, the examples used to describe best management practices and federal response should
not be considered exhaustive lists. In many cases, the success or failure of a particular nutrient
management practice will vary greatly by location. This report highlights examples of these
practices but is not meant to imply or suggest that they can be universally applied. In addition to
the federal response, the private sector, nonprofit groups, and state and local governments play
active roles in the management of nutrients from agriculture, either through regulation or
technical support. These nonfederal efforts are outside the scope of this report.
1 U.S. Congress, Senate Committee on Agriculture, Nutrition, and Forestry, Farmers and Fresh Water: Voluntary
Conservation to Protect Our Land and Waters, 113th Cong., 2nd sess., December 3, 2014.
2 While distinctly related, air quality issues are not discussed in detail but may be mentioned where applicable.

Nutrients in Agricultural Production: A Water Quality Overview
Congressional Research Service R43919 · VERSION 8 · UPDATED 2
Nutrients: A Primer Nutrients are elements essential to plant growth.3 Plant roots absorb nutrients––including water,
oxygen, and others––from the soil.4 As crops grow and are harvested, they gradually remove the
existing nutrients from the soil. Over time, most soils will require additional nutrients to maintain
or increase crop yield. When nutrients are added in excess of the plants’ ability to utilize them,
there is an increased risk that the nutrients will enter the surrounding environment (water or air)
and create problems such as algal blooms (discussed below).
Plants utilize nutrients in different ways, and each plant has a different set of nutrient
requirements. How, where, and when plants utilize nutrients can greatly affect the overall yield
and plant production. For a farmer seeking to maximize crop yields and lower input costs, it can
be critical to understand a crop’s nutrient requirements.
Basic nutrients––carbon, hydrogen, and oxygen––are the most abundant elements in plants. In
addition, plants utilize other nutrients commonly referred to as macronutrients and micronutrients
(see Figure 1). In agricultural production, the focus generally rests on the three primary
macronutrients––nitrogen (N), phosphorus (P), and potassium (K)—because of their relative
abundance in plants. Micronutrients, while not commonly discussed, may have just as much of an
effect on plant growth as macronutrients when levels are too high (toxic) or too low (deficient).
This report focuses on two of the three primary macronutrients (nitrogen and phosphorus),
because of the volume used in agricultural production and the relative potential for environmental
harm if they are overused.5 This is not meant to indicate that other nutrients do not also pose an
environmental harm if overapplied.
Plants use nutrients in an ionic form rather than as raw elements (see Figure 2). Nutrients are
taken up by plants in three forms:
interception—by direct contact with the nutrient;
mass flow—when nutrients move with water as the plant transpires;6 and
diffusion—when nutrients move from high to low concentration.
Interception accounts for a very low percentage of nutrients taken up by plants. Mass flow, on the
other hand, is the most substantial method of nutrient movement toward a plant’s roots. This is
particularly important for more “mobile” nutrients (e.g., nitrogen) and less important for
relatively “immobile” nutrients (e.g., phosphorus). Diffusion is most important for nutrients that
are relatively immobile, have low solution concentrations, and are needed in large amounts (e.g.,
phosphorus and potassium).
3 Nutrients are also essential to animal health; however, they are discussed in this report in the context of nutrients as a
by-product of livestock production (e.g., manure, bedding, etc.) rather than an input.
4 Some soils are naturally fertile because they contain minerals high in key elements, while others include high levels of
organic matter and thus high levels of key nutrients. There are a number of physical, chemical, and biological soil
properties that affect the nutrient availability for plants.
5 Potassium is a mineral naturally found in soils. It is essential for plant growth and is frequently found in amounts that
exceed the amount used by crops in a given season. Unlike other minerals, however, potassium does not act as a
pollutant in the environment and therefore is not discussed in depth in this report.
6 Transpiration is the process by which moisture is carried through plants from roots to small pores on the underside of
leaves, where it changes to vapor and is released to the atmosphere. Transpiration is essentially evaporation of water
from plant leaves. For more information, see U.S. Geological Survey, The Water Cycle, “Transpiration – The Water
Cycle,” http://water.usgs.gov/edu/watercycletranspiration.html.

Nutrients in Agricultural Production: A Water Quality Overview
Congressional Research Service R43919 · VERSION 8 · UPDATED 3
Figure 1. Essential Elements for Plant Growth
Source: U.S. Department of Agriculture (USDA), Natural Resources Conservation Service (NRCS)—4 Nutrient
Stewardship, Overview of Soil Fertility, Plant Nutrition, and Nutrition Management, Education and Training Module,
http://www.nutrientstewardship.com/nrcs/overview/multiscreen.html.
Notes: This figure does not represent a definitive list. Some research publications include more or fewer
elements or use different categories than those presented here. Other elements, such as sodium (Na), cobalt
(Co), vanadium (V), and silicon (Si), are known to be beneficial in some plants, but generally are not considered
essential to most plants and therefore not included.
Plants use nutrients at different times and at different rates throughout the growing cycle. For
example, for corn, phosphorus is important early in the growing season, but not necessarily later
in the season. Nitrogen is important in both the beginning and later in the growing season, before
the plant begins the stem-extension phase. Various nutrients are also applied differently by
farmers, based on knowledge about nutrient mobility in soils. For example, nitrogen can be
applied using a broadcast method (discussed further under “Best Management Practices”)
because of its mobility in the soil. Phosphorus, on the other hand, is most effective when placed
below the soil surface near the root system because it is generally immobile.
Adding Nutrients—Fertilizers
Fertilizers are either organic or inorganic materials applied to the soil to promote plant growth.
They may either contain a specific nutrient or may be used to increase the availability of other
plant nutrients. Organic fertilizers are those derived from living matter (e.g., manure) whereas
inorganic fertilizers are synthetic or mined (e.g., urea as a nitrogen source or potash as a
potassium source).7
7 Craig C. Sheaffer and Kristine M. Moncada, Introduction to Agronomy: Food, Crops, and Environment, 2nd ed.
(Clifton Park, NY: Delmar, 2012).

Nutrients in Agricultural Production: A Water Quality Overview
Congressional Research Service R43919 · VERSION 8 · UPDATED 4
Organic Fertilizers
The primary organic fertilizer is animal
manure. Manure can be a good source of
plant-available nutrients (including but not
limited to nitrogen and phosphorus), as well
as providing increased soil organic matter,
increased water and nutrient retention in soil,
and decreased soil density. The nutrient
content of manure can vary greatly depending
on animal type, diet, bedding, moisture
content, and storage method.8
Prior to the development of inorganic
fertilizers, organic “wastes” were a major
source of nutrients for crop production.
According to the U.S. Department of
Agriculture (USDA), 15.8 million acres, or
about 5% of all U.S. cropland, use manure as
fertilizer (Table 1).9 A number of factors
prevent a wider use of manure fertilization.
Primarily, the cost of transporting manure can
be prohibitive.10 The nutrient content of the
manure, the type of crop grown and nutrients
required (i.e., the nutrient needs of plants
being grown may not match nutrients in
readily available manure), compaction from
manure application equipment, and the
relative cost and availability of inorganic
fertilizers, among other factors, also affect the
use of organic wastes as fertilizers.
Table 1. Acres Receiving Manure from
Various Animal Types
(by crop and species, 2006)
Crop
Acres applied (thousand), by source of manure
Dairy Beef Cattle Swine Poultry Othera All
Barley 54 36 4 4 2 100
8 Determining the nutrient levels of manure can be done through sampling and testing prior to application. Because the
nutrient content of manure is usually the largest unknown and first step to preventing overapplication, sampling and
testing is strongly encouraged as a best management practice (discussed further in “Best Management Practices”
below).
9 James M. MacDonald, Marc O. Ribaudo, and Michael J. Livingston, et al., Manure Use for Fertilizer and for Energy:
Report to Congress, USDA, Economic Research Service (ERS), AP037, Washington, DC, June 2009,
http://www.ers.usda.gov/media/156155/ap037_1_.pdf.
10 One exception to this is for poultry litter, which is dry (and typically less costly to transport) and produced on farms
that typically have no crop production. Thus, crops such as peanuts and cotton, which are grown in areas near poultry
production (e.g., the Southeast), tend to rely on poultry litter transported from off the farm.
Figure 2. Relationship Between Nutrient
Mobility and Plant Extraction
Source: CRS, modified from W. R. Raun, G. V.
Johnson, and R. W. Mullen, et al., “Bray Nutrient
Mobility Concept,” in Soil-Plant Nutrient Cycling and
Environmental Quality (Stillwater, OK: Oklahoma State
University), http://soil5813.okstate.edu/BOOK.htm.

Nutrients in Agricultural Production: A Water Quality Overview
Congressional Research Service R43919 · VERSION 8 · UPDATED 5
Crop
Acres applied (thousand), by source of manure
Dairy Beef Cattle Swine Poultry Othera All
Corn 5,612 1,617 1,161 472 224 9,086
Cotton 67 101 0 228 1 397
Oats 218 139 8 3 7 375
Peanuts 0 8 0 44 0 52
Sorghum 1 37 7 1 0 46
Soybeans 354 327 139 132 30 982
Wheat 107 250 26 12 6 401
All 6,413 2,515 1,345 896 270 11,439b
Source: James M. MacDonald, Marc O. Ribaudo, and Michael J. Livingston, et al., Manure Use for Fertilizer and for
Energy: Report to Congress, USDA, ERS, AP037, Washington, DC, June 2009, http://www.ers.usda.gov/media/
156155/ap037_1_.pdf.
a. Other includes equine, sheep, and biosolids.
b. Other crops, such as hay and grasses, account for approximately 4.3 million acres receiving manure. These
are not reflected in this table, but are in the earlier stated total of 15.8 million acres receiving manure in the
United States.
From a livestock perspective, animal waste is
a by-product of production that must be
managed to avoid environmental harms and
for the health of the animals themselves if
raised in captivity. For a confined production
system, manure must be utilized—typically by
being collected, stored, and distributed
elsewhere, likely on available crop- or
pastureland. In the case of grazing livestock,
the animals deposit manure directly onto
pastureland, thus fertilizing the associated
grassland. High stocking rates, however, may
lead to an imbalance, which in turn could
create an excess supply of nutrients. If not
properly managed, manure can adversely
impact water quality through surface runoff
and erosion, direct discharges to surface
waters, spills and other dry-weather
discharges, and leaching into soil and
groundwater. It can also result in emission to
the air of particles and gases such as ammonia,
hydrogen sulfide, and volatile organic chemicals.
Theoretically, of the total manure produced, more could be utilized on additional cropland than
what is currently utilized in order to potentially reduce the risk of environmental harms from
excessive concentrations. Regions with a higher capacity for manure are largely due to the type of
11 USDA, NRCS, National Soil Survey Center, Soil Quality Indicators: Organic Matter, Soil Quality Information
Sheet, Lincoln, NE, April 1996.
Soil Organic Matter
Soil organic matter (SOM) is created by the cycling of
organic compounds in plant, animals, and
microorganisms into the soil. Essentially, SOM is soil
composed of anything that once lived, including plant
and animal remains, cell and tissues of soil organisms,
and plant roots and soil microbes. Well-decomposed
matter can form “humus,” a dark brown, porous,
spongy material that is essential for maintaining
optimum soil physical conditions important for plant
growth, water-holding capacity, and nutrient
availability.11 In most soils, SOM accounts for less than
5% of the total volume but can considerably impact the
nutrients available for plants.
The amount of SOM is controlled by a balance
between plant and animal materials and losses from
decomposition. There are a number of benefits to
increasing SOM, including reduced erosion and the
storing of nutrients (nitrogen, phosphorus, and sulfur).
These are primarily achieved through the use of cover
crops and reduced or no-till tillage systems (see the
“Best Management Practices” section).

Nutrients in Agricultural Production: A Water Quality Overview
Congressional Research Service R43919 · VERSION 8 · UPDATED 6
soils and crops grown in the area. For example, the soils (mollisols) and crops (corn) grown in the
Midwest are able to utilize additional nitrogen from manure (Figure 3), whereas the soils
(ultisols) and crops (cotton and rice) in the Southeast are able to handle more phosphorus from
manure (Figure 4). In some cases the ability to utilize additional manure application corresponds
to areas with large livestock populations. In other cases, livestock production occurs in areas with
Figure 3. Capacity of Cropland to
Assimilate Nitrogen
Figure 4. Capacity of Cropland to
Assimilate Phosphorus
Figure 5. Manure Nitrogen in Excess of
Need
Figure 6. Manure Phosphorus in Excess
of Need
Source: Robert L. Kellogg, Charles H. Lander, and David C. Moffitt, et al., Manure Nutrients Relative to the
Capacity of Cropland and Pastureland to Assimilate Nutrients: Spatial and Temporal Trends for the United
States, USDA, NRCS, ERS, nps00-0579, Washington, DC, December, 2000, http://www.nrcs.usda.gov/
Internet/FSE_DOCUMENTS/nrcs143_012133.pdf.
Notes: Figures 5 and 6 assume no export from the farm.
low or modest capacity to assimilate additional manure, thereby increasing the risk of excessive
concentrations. When the amount of manure produced by an operation is more than the
assimilative capacity of the land,12 an excess of manure is created (Figure 5 and Figure 6).13 This
can create a greater risk for potential runoff and leaching of manure nutrients and subsequent
12 The assimilative capacity refers to the estimated amount of nutrients taken up and removed at harvest for cropland
and the amount that could generally be applied to pastureland without accumulating nutrients in the soil.
13 Robert L. Kellogg, Charles H. Lander, and David C. Moffitt, et al., “Manure Nutrients Relative to the Capacity of
Cropland and Pastureland to Assimilate Nutrients: Spatial and Temporal Trends for the United States,” USDA, NRCS,
ERS, nps00-0579, Washington, DC, December, 2000, http://www.nrcs.usda.gov/Internet/FSE_DOCUMENTS/
nrcs143_012133.pdf.

Nutrients in Agricultural Production: A Water Quality Overview
Congressional Research Service R43919 · VERSION 8 · UPDATED 7
water quality issues. Geographically, areas with excess farm-level nutrients correspond to areas
with increasing numbers of confined animals.14
Inorganic Fertilizers
Inorganic fertilizers consist of nutrients that are mined or created synthetically. In most cases,
compared to organic fertilizers, inorganic fertilizers are more concentrated, their nutrient content
is easily identifiable, and in some cases, they are more cost effective to use. This does not,
however, make inorganic fertilizers any less damaging when found in excess in the environment.
Similar to organic fertilizers, when applied in excess, inorganic fertilizers can be lost to the
environment through volatilization into the air, leaching into groundwater, emission from soil to
air, and runoff into surface water.
The use of inorganic fertilizers has changed over time and continues to outpace the use of organic
fertilizers in the United States. The introduction of seed varieties that respond more favorably to
specific nutrients, the use of more precise application technology, and the overall price of
commercial fertilizers have driven much of this change.15 The three primary inorganic fertilizers
produced commercially are nitrogen-, phosphorus-, and potassium-based products. In general,
commercial nitrogen fertilizer use has increased more than phosphorus and potassium (Figure 7).
Figure 7. Fertilizer Use in U.S. Agriculture
1960-2011
Source: Richard Nehring, Fertilizer Use and Markets, USDA, ERS, July 12, 2013, http://www.ers.usda.gov/topics/
farm-practices-management/chemical-inputs/fertilizer-use-markets.aspx.
14 Ibid.
15 Richard Nehring, Fertilizer Use and Markets, USDA, ERS, July 12, 2013, http://www.ers.usda.gov/topics/farm-
practices-management/chemical-inputs/fertilizer-use-markets.aspx.

Nutrients in Agricultural Production: A Water Quality Overview
Congressional Research Service R43919 · VERSION 8 · UPDATED 8
Corn, which uses intensive fertilizer applications, accounts for almost 40% of the total U.S.
commercial fertilizer consumption, principally due to the high number of planted acres and crop
requirements.16
Nitrogen
Nitrogen (N) is an abundant element, with gaseous nitrogen (N2) accounting for 78% of the
earth’s atmosphere. Despite this abundance, N2 cannot be used as a nutrient by living organisms
unless converted to a useable form. This conversion occurs synthetically through the Haber-
Bosch process, developed in the early 20th century, which converts “unreactive” N2 to a more
usable “reactive” form.17 The process uses heat and pressure to combine N2 with hydrogen from
natural gas. The result is NH3 (anhydrous ammonia), which can be used as a fertilizer directly or
reacted with other compounds to form other products (Figure 8).18 Approximately 74% of the
NH3 produced worldwide is for nitrogen fertilizer. Domestically, NH3, urea (NH3 with carbon
dioxide, CO(NH2)2), and dissolved N (with water) account for 90% of total N fertilizer use.19
Figure 8. Nitrogen-Containing Fertilizers
Source: Adapted from Craig C. Sheaffer and Kristine M. Moncada, Introduction to Agronomy: Food, Crops, and
Environment, 2nd ed. (Clifton Park, NY: Delmar, 2012).
16 Ibid.
17 Marc Ribaudo, Jorge Delgado, and LeRoy Hansen, et al., Nitrogen in Agricultural Systems: Implications for
Conservation Policy, USDA, ERS, ERR-127, Washington, DC, September 2011.
18 Craig C. Sheaffer and Kristine M. Moncada, Introduction to Agronomy: Food, Crops, and Environment, 2nd ed.
(Clifton Park, NY: Delmar, 2012).
19 John L. Havlin, Samuel L. Tisdale, and Werner L. Nelson, et al., Soil Fertility and Fertilizers: An Introduction to
Nutrient Management, 8th ed. (Boston: Pearson, 2014).

Nutrients in Agricultural Production: A Water Quality Overview
Congressional Research Service R43919 · VERSION 8 · UPDATED 9
Phosphorus
Phosphate rock is the primary raw material used to manufacture soluble phosphorus (P)
fertilizers. The sedimentary deposit is found in a number of countries, with the largest deposits in
northern Africa, China, the Middle East, and the United States. Annual world phosphate rock
production is projected to increase from 223 million tons in 2015 to 255 million tons in 2019.20 In
the United States, mines in Florida and North Carolina account for over 85% of domestic output.
Other domestic mining operations are located in Idaho and Utah. In 2015, more than 95% of U.S.
mined phosphate rock was used to manufacture phosphate fertilizers and animal feed
supplements.21
Potassium
Similar to phosphorus, potassium fertilizer is primarily a mined material. Mined and
manufactured salts containing soluble potassium (K) are referred to as potash.22 The largest high-
grade potash deposit in the world is in the Saskatchewan province of Canada. Domestic
production occurs in Michigan, New Mexico, and Utah. In 2015, approximately 85% of potash
sales in the United States were by the fertilizer industry.
Effects of Nutrient Excess on Water Quality As nutrients cycle through the soil-plant-atmosphere continuum, some are recovered by plant
uptake, some incorporated into the soil organic matter (SOM), and some precipitated as solid
minerals.23 The remainder can be transported to surface water, groundwater, and the atmosphere.
The increased use of nutrients in agricultural production has increased the potential for nutrient
excess and associated environmental and health impairments. Recent water and air quality
concerns have brought attention to excessive nutrients in the environment and the damage they
can create.24 The nutrients of primary environmental concern in agriculture are nitrogen and
phosphorus.
Water quality concerns are present across the United States for a number of reasons, including
pollution from excess nutrients, heavy metals, and toxic substances, to name a few.25 Overall, data
reported by the U.S. Environmental Protection Agency (EPA) and states indicate that 44% of
river and stream miles assessed by states and 64% of assessed lake acres do not meet applicable
water quality standards and are impaired for one or more desired uses.26 In 2006, EPA issued an
assessment of streams and small rivers and reported that 67% of U.S. stream miles are in poor or
fair condition and that nutrients and streambed sediments have the largest adverse impact on the
20 Stephen M. Jasinski, Phosphate Rock, USGS (U.S. Geological Survey), Mineral Commodity Summaries, January
2016, http://minerals.usgs.gov/minerals/pubs/commodity/phosphate_rock/mcs-2016-phosp.pdf.
21 Ibid.
22 Stephen M. Jasinski, Potash, USGS (U.S. Geological Survey), Mineral Commodity Summaries, January 2015,
http://minerals.usgs.gov/minerals/pubs/commodity/potash/mcs-2016-potas.pdf.
23 John L. Havlin, Samuel L. Tisdale, and Werner L. Nelson, et al., Soil Fertility and Fertilizers: An Introduction to
Nutrient Management, 8th ed. (Boston: Pearson, 2014).
24 While distinctly related, air quality issues are not discussed in detail in this report.
25 For additional information, see CRS Report R43867, Water Quality Issues in the 114th Congress: An Overview.
26 U.S. Environmental Protection Agency, National Water Quality Inventory: Report to Congress, 2004 Reporting
Cycle, EPA 841-R-08-001, January 2009, http://water.epa.gov/lawsregs/guidance/cwa/305b/2004report_index.cfm.

Nutrients in Agricultural Production: A Water Quality Overview
Congressional Research Service R43919 · VERSION 8 · UPDATED 10
aquatic species in these waters.27 Agricultural production can contribute both nutrient and
sediment loading28 to waterways if not properly managed.
Nitrogen
As stated previously, nitrogen is a mobile nutrient that can occur in a variety of forms. Nitrogen is
affected by chemical and biological processes that can change its form and transfer it to or from
water, soil, biological organisms, and the atmosphere. The increasing use of reactive nitrogen in
agriculture also increases the potential for nitrogen to be lost to the environment as ammonia
(NH3), ammonium (NH4), nitrate (NO3), nitrogen oxides (NOx), and nitrous oxide (N2O).29
Excess nitrogen can be transferred to water sources in a number of ways, including:
soil erosion––either by wind or water, erosion can move soil particles containing
nitrogen into surrounding waterways;
runoff––dissolved nitrogen, either as inorganic (e.g., nitrate) or organic (e.g.,
manure) fertilizer, applied directly to the soil surface can “run off” the field with
moving water (e.g., rain, snowmelt, or irrigation) if not incorporated into the soil;
and
leaching––water moving through the soil profile can transport dissolved nitrogen
to underground water sources or through tile drains30 to surface water.
Phosphorus
Phosphorus is an immobile nutrient and therefore is generally transferred to water through
sediment-based runoff or erosion. More than 80% of phosphorus transported from cultivated
lands is associated with soil particle and organic material erosion during flow events (e.g., rain or
irrigation).31 To a lesser extent, phosphorus leaching can occur through subsurface flow, primarily
transported in drainage waters (e.g., through tile drains). While some soils can absorb applied
phosphorus, they are not infinite sinks. Once the capacity of the soils to absorb phosphorus is
exceeded, the excess will dissolve and move more freely with water.32 Continued application of
phosphorus beyond plant requirements can be a major cause of soil phosphorus saturation; both
surface runoff and subsurface flow are linked to soil phosphorus concentration.
27 U.S. Environmental Protection Agency, Wadeable Streams Assessment: A Collaborative Survey of the Nation’s
Streams, EPA 841-B-06-002, December 2006, http://www.epa.gov/sites/production/files/2014-10/documents/
2007_5_16_streamsurvey_wsa_assessment_may2007.pdf.
28 Erosion caused by water is the detachment and transport of soil particles by rainfall or irrigation. These soil particles
flow through channels to associated waterways and are referred to as a sediment load. This is a naturally occurring
process, but it can be accelerated with heavy water events and an unstable soil surface.
29 Marc Ribaudo, Jorge Delgado, and LeRoy Hansen, et al., Nitrogen in Agricultural Systems: Implications for
Conservation Policy, USDA, ERS, ERR-127, Washington, DC, September 2011, http://www.ers.usda.gov/
publications/err-economic-research-report/err127.aspx.
30 Tile drains are a subsurface drainage system that removes excess water from the soil profile through a series of
perforated tubes.
31 A. N. Sharpley, T. Daniel, and T. Sims, Agricultural Phosphorus and Eutrophication, Second Edition, USDA,
Agricultural Research Service, ARS-149, September 2003, http://www.ars.usda.gov/is/np/Phos&Eutro2/
agphoseutro2ed.pdf.
32 Joseph L. Domagalski and Henry Johnson, Phosphorus and Groundwater: Establishing Links Between Agricultural
Use and Transport to Streams, U.S. Geological Survey, Fact Sheet 2012-3004, January 27, 2012, http://pubs.usgs.gov/
fs/2012/3004/.

Nutrients in Agricultural Production: A Water Quality Overview
Congressional Research Service R43919 · VERSION 8 · UPDATED 11
Environmental Effects
One of the better-known environmental responses to high levels of nutrients is eutrophication––
the enrichment of water bodies, which can promote the growth of algae. When nutrients (e.g.,
nitrogen and phosphorus) and sunlight stimulate algal growth (e.g., algae, seaweed, and
phytoplankton), this increases the amount of organic matter in an aquatic ecosystem over time.
Algae are a natural part of the ecosystem, and most species of algae are not harmful. However,
high levels of nutrients and ideal growing conditions can overfeed algae, creating algal blooms
that deplete the oxygen content of water, block sunlight to other organisms, and potentially
produce toxins. These harmful algal blooms (HABs) can contaminate surface and drinking water
supplies, potentially harming animal and human health. Cyanobacteria (blue-green algae) and red
tides are examples of HABs that produce toxins harmful to humans and animals.33
Algal blooms, whether toxic or not, can cause significant environmental and economic problems
when the algae die. As organisms die and sink to the bottom, they are consumed (decomposed) by
oxygen-dependent bacteria, depleting the water of oxygen. When this eutrophication is extensive
and persistent, bottom waters may become hypoxic (depressed concentration of dissolved
oxygen), or even anoxic (no dissolved oxygen). Hypoxic conditions in lakes and coastal waters
can cause die-offs of fish and other aquatic life. If these conditions persist, a “dead zone” may
develop in which little life exists.
Cyanobacteria
Cyanobacteria live in terrestrial, fresh, brackish, or marine water. Cyanobacterial harmful algal
blooms (CyanoHABs) occur when organisms that are normally present grow exuberantly.34
CyanoHABs are caused by a combination of conditions, including warm water temperatures, high
levels of light, and abundant nutrients (primarily phosphorus and nitrogen). Nutrients play a key
role, and major sources include agricultural runoff (organic and inorganic); discharges from
sewage treatment plants; and storm-water runoff from lawns, streets, and elsewhere. CyanoHABs
can contain various toxins that can affect the liver, skin, or nervous system. Exposure to
cyanotoxins can cause a range of health effects, from mild rashes to severe illness (and rarely
death) in humans. Deaths of exposed wildlife, livestock, birds, and pets have been documented
worldwide. Most human exposures are thought to occur during recreational activities, such as
swimming and boating; through accidental ingestion or inhalation of water; or when skin comes
into contact with toxins. Exposures also can result from drinking or showering in contaminated
water or eating contaminated shellfish.35
33 For more information, see CRS Insight IN10131, Harmful Algal Blooms and Drinking Water.
34 Centers for Disease Control and Prevention, Harmful Algal Blooms (HABs), http://www.cdc.gov/nceh/hsb/hab/
default.htm.
35 U.S. Environmental Protection Agency, Cyanobacteria/Cyanotoxins, http://www2.epa.gov/nutrient-policy-data/
cyanobacteriacyanotoxins.

Nutrients in Agricultural Production: A Water Quality Overview
Congressional Research Service R43919 · VERSION 8 · UPDATED 12
Red Tide
In the case of red tides, microscopic marine
alga called Karenia brevis (K. brevis) grows
quickly and creates blooms that look red or
brown (hence “red tide”). K. brevis produces
toxins called brevetoxins, which are deadly to
fish and other marine organisms. Brevetoxins
can become concentrated in the tissues of
shellfish that feed on K. brevis and make those
who eat these shellfish sick with neurotoxic
shellfish poisoning (NSP). NSP can produce
neurologic symptoms (e.g., tingling in fingers
and toes) and gastrointestinal symptoms in
humans. The effects of environmental
exposure to brevetoxins are less well known. However, evidence suggests that air and skin
exposure near red tides can result in irritation of the eyes, nose, and throat, as well as coughing,
wheezing, and shortness of breath.38
Ciguatera
Ciguatera is another illness caused by eating fish that contain toxins produced by HABs.
Ciguatera is caused by Gambierdiscus toxicus, a marine microalga. The toxin accumulates and
can move up the food chain, for example, through large carnivorous reef fish (barracuda, black
grouper, blackfin snapper, amberjack, and yellowfin grouper). Symptoms are similar to NSP and
can go away in days or last for years.39
Human Health Effects
In addition to HABs, excess nutrients in water have other known health effects, depending on the
type and condition of exposure. Conjectural evidence suggests that an excess of both nitrogen and
phosphorus may contribute to infections and noninfectious pathogens, potentially causing
36 When salinity increases, as in estuaries, nitrogen generally becomes the element controlling aquatic productivity.
David K. Mueller and Dennis R. Helsel, Nutrients in the Nation’s Waters—Too Much of a Good Thing? U.S.
Geological Survey, Circular 1136, January 11, 2013, http://pubs.usgs.gov/circ/circ1136/.
37 Studies indicate that increased nitrogen and phosphorus together stimulate the most growth. David W. Litke, Review
of the Phosphorus Control Measures in the United States and Their Effects on Water Quality, U.S. Geological Survey,
Water-Resources Investigations Report 99-4007, Denver, CO, 1999, http://pubs.usgs.gov/wri/wri994007/pdf/wri99-
4007.pdf. One example of a recent control strategy focusing on phosphorus is the International Joint Commission, A
Balanced Diet for Lake Erie: Reducing Phosphorus Loadings and Harmful Algal Blooms, Report of the Lake Erie
Ecosystem Priority, February 2014, http://www.ijc.org/files/publications/2014%20IJC%20LEEP%20REPORT.pdf.
38 Centers for Disease Control and Prevention, Harmful Algal Blooms (HABs), http://www.cdc.gov/nceh/hsb/hab/
default.htm.
39 Centers for Disease Control and Prevention, Harmful Algal Blooms (HABs), http://www.cdc.gov/nceh/hsb/hab/
default.htm.
Why Phosphorus?
Question: If both nitrogen and phosphorus are required for a harmful algal bloom (HAB), why is
phosphorus generally described as “causing” a HAB?
Answer: Nitrogen is an abundant element that is
essential to the growth of aquatic life. Its abundance
makes it difficult to control the atmospheric exchange
of nitrogen and carbon in the water, and the fixation of
atmospheric nitrogen by some blue-green algae.36 This
makes phosphorus the limiting factor for a HAB. This is
why control efforts typically focus on phosphorus
reduction to reduce the potential for accelerated
eutrophication of fresh waters.37
Nutrients in Agricultural Production: A Water Quality Overview
Congressional Research Service R43919 · VERSION 8 · UPDATED 13
epidemic conditions.40 This, however, is a difficult relationship to make given the interrelated
nature of humans and wildlife disease emergence.41
The primary route of human exposure to nitrogen is through ingestion of contaminated drinking
water. The most well-known effect is methemoglobinemia, a blood disorder in which an abnormal
amount of methemoglobin (a form of hemoglobin) interferes with the body’s ability to release
oxygen to body tissue.42 Infants are especially susceptible to this condition, which is why it is
sometimes referred to as “blue baby syndrome.”43 Other known health effects include various
cancers, adverse reproductive outcomes (neural tube defects), diabetes, and thyroid conditions.44
No comprehensive research has examined the health effects of nitrate ingestion, or whether the
current regulatory limits on nitrogen in drinking water are adequately protective.45
Because of phosphorus’s role in eutrophication and associated HABs, the environmental and
health concerns are much the same as those for nitrogen. The direct health effects of excess
phosphorus fertilizers are less well known than the effects of nitrogen fertilizers.
Best Management Practices Nutrient management is a practice whereby nutrient cycles are kept in balance with the
surrounding ecosystem. As most crop production is not considered to be a naturally occurring part
of an ecosystem, how production is managed is increasingly important for the overall health of
the surrounding environment and sustainability of production. Over time, through research and
technological advancements, nutrient management has become increasingly sophisticated. An
advanced understanding of how crops utilize nutrients and how nutrients move in the
environment has led to the development of a number of best management practices (BMPs) for
nutrient use. Primarily, nutrient BMPs focus on preventing or reducing the ways in which excess
nutrients can enter the environment––erosion, runoff, leaching, volatilization, denitrification, and
nitrification.
In many cases, the success of a BMP depends on how and where it is applied. Not all BMPs will
work in every location, and more than one BMP may be required to correct a nutrient imbalance.
For example, a BMP may help reduce one nutrient but do little to reduce another. Additionally,
not all BMPs are fail-safe, and they can require a significant amount of time and investment to
achieve a successful balance.
This section discusses select examples of nutrient BMPs that can lessen the potential harm to
water quality. These examples should not be considered a comprehensive list. USDA’s Natural
Resources Conservation Service (NRCS) maintains national practice standards for many of these
BMPs (Table A-1); however, state and local regulations may affect how the standards apply
locally.
40 Pieter T. J. Johnson, Alan R. Townsend, and Cory C. Cleveland, et al., Linking Environmental Nutrient Enrichment
and Disease Emergence in Humans and Wildlife, National Institutes of Health, public access author manuscript, April
2010.
41 Ibid.
42 Ward, 2008.
43 Ibid.
44 Ibid.
45 Ibid. For additional information on U.S. drinking water regulations, see CRS Report RL31243, Safe Drinking Water
Act (SDWA): A Summary of the Act and Its Major Requirements.

Nutrients in Agricultural Production: A Water Quality Overview
Congressional Research Service R43919 · VERSION 8 · UPDATED 14
Crop Production
Crop production BMPs for nutrient
management generally focus on the “4Rs”––
applying the right amount of nutrients, from
the right source, in the right place, at the
right time. Other associated BMPs try to
prevent nutrients and sediment from leaving
the field and entering waterways. Select
examples of crop production BMPs for water
quality improvement include:
Nutrient Diagnosis and Testing. Fertilizer
recommendations are often based on nutrient
diagnostic methods, such as soil testing
(Figure 9), plant analysis, and canopy
sensing. These activities measure the amount
of nutrients present and help determine
additional need. The results, combined with
data on expected yields and field conditions,
help producers minimize excessive nutrient
release into the environment.
Planning. Nutrient management planning
calculates the amount of nutrients required for
maximum yield, while minimizing the overall
environmental impacts of nutrient use. NRCS
defines nutrient management as the management
of the “4Rs.”46
Tillage Systems. The use of no-till (Figure 10)
or reduced till systems can increase soil organic
matter, reduce nutrient use, reduce sediment
loss, enhance ground-water retention, and
reduce runoff and leaching of nutrients. No-till47
systems maintain most of the crop residue on
the soil surface by not using traditional full-
width tilling methods throughout the year.
Reduced till, also referred to as mulch till,
disturbs the majority of the soil’s surface with
noninversion tillage methods48 and uniformly
spreads residue on the soil surface.
46 USDA, NRCS, Conservation Practice Standard - Nutrient Management, Code 590, January 2012,
http://www.nrcs.usda.gov/Internet/FSE_DOCUMENTS/stelprdb1046433.pdf.
47 Also referred to as zero-till, direct (seed) drilling, slot plant, row till, strip till, or generically as conservation tillage.
48 Noninversion tillage can include chisel plowing, field cultivating, tandem disking, or vertical tillage.
Figure 9. Soil Sample
Source: Tim McCabe, USDA, NRCS.
Note: A soil sample is drawn early in the crop year
to test for N availability in the soil and again later in
the spring to determine additional need.
Figure 10. No-Till System and Crop
Rotation
Source: CRS.
Note: An example of soybeans in corn residue using
a no-till system. Also an example of a crop rotation
between corn, soybeans, and wheat.

Nutrients in Agricultural Production: A Water Quality Overview
Congressional Research Service R43919 · VERSION 8 · UPDATED 15
Cover Crops. Legume crops and cover crops
can provide nitrogen through biological
fixation and nutrient recycling. The use of
cover crops helps to sequester nutrients,
primarily nitrogen; reduce soil run-off; and
improve nutrient use efficiency.
Crop Rotation. Crop rotations are planned
sequences of two or more crops grown on the
same ground over a period of time. Whether
rotating with other commodity crops or
perennials, the use of crop rotations has been
known to improve nutrient cycling and reduce
energy needs (Figure 10).
Stripcropping. The use of grass or close-
growing crops alternated with row crop
production can slow runoff, reduce erosion,
and increase filtration. This can reduce the
loss of nitrates and soluble phosphorus (see
Figure 11).
Inhibitors. Nitrification inhibitors maintain
ammonium longer by eliminating a bacterium
where the ammonium is present, thereby
delaying denitrification and reducing leaching potential. Urease inhibitors allow urea to be
retained in the soil longer, thereby reducing nitrogen volatilization.49
Denitrifying Bioreactor. A structure that uses a
carbon source (e.g., wood chips) to reduce the
concentration of nitrate nitrogen in subsurface
agricultural drainage (e.g., tile drainage) flow
via enhanced denitrification (see Figure 12).
Application Timing. How a plant uses nutrients
will determine when nutrients should be
applied for most efficient uptake. In some
cases, this might mean more than one
application at different times (often referred to
as split application).
Application Amount. The amount of nutrient
application should be based on the results of
nutrient diagnosis and testing; realistic
expected yields and yield history; and residual
nutrients from manure, legumes, and irrigation
water applied to reduce overapplication.
49 Robert Mullen and Ed Lentz, Nitrogen Inhibitors, What Is What and Should You Consider Their Use? Ohio State
University Extension, C.O.R.N. Newsletter 2011-08, Columbus, OH, 2011, http://agcrops.osu.edu/newsletters/2011/
08#2.
Figure 11. Stripcropping
Source: Tim McCabe, USDA, NRCS.
Note: Alternating strips of alfalfa with corn on the
contour.
Figure 12. Denitrifying Bioreactor with
Drainage Water Management Illustration
Source: Kari Cohen, USDA, NRCS.

Nutrients in Agricultural Production: A Water Quality Overview
Congressional Research Service R43919 · VERSION 8 · UPDATED 16
Application Method. How a plant uses
nutrients will determine where nutrients
should be placed for most efficient uptake. The
application method is determined based on
crop type, nutrient diagnosis and testing, and
planning. Different application methods are
available based on the time of application (see
Figure 13).
Filter and Buffer Strips. A strip of vegetation
located near the edge of the field along
streams, lakes, wetlands, and other adjacent
waters in order to trap sediment and denitrify
residual nitrates in subsurface flow.
Constructed Wetlands. Surface or subsurface
drainage tile water may be channeled through
artificially created wetlands to provide nutrient
filtration.
Irrigation Management. Coordinating the use
of irrigation water and nutrient application can
impact nutrient uptake, runoff, and leaching.
Other irrigation system practices, such as
tailwater recovery, can also assist in capturing
residual nutrient loss.
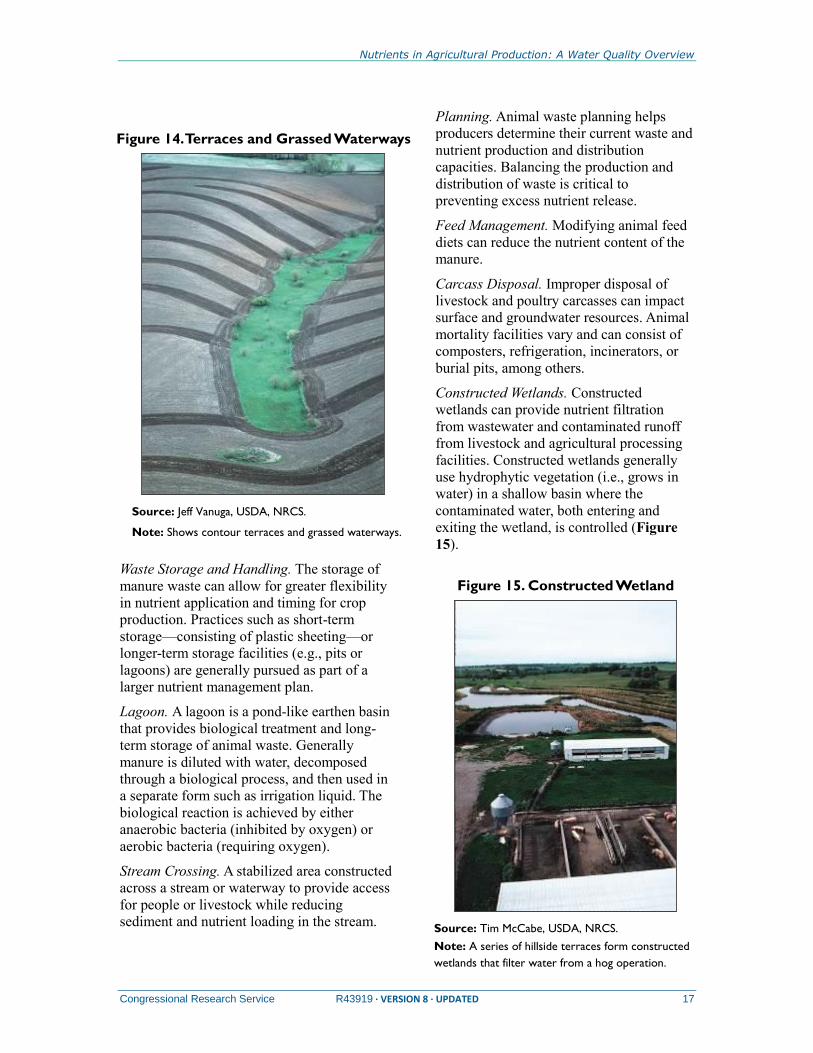
Terraces and Grassed Waterways. Terraces are
a series of ridges and channels constructed
across a slope to intercept sediment and
nutrient runoff. Grassed waterways are
channels with established vegetation that
reduces runoff (see Figure 14).
Animal Agriculture
Best management practices for livestock
operations are typically prescribed for
concentrated animal feeding operations where
animals are raised or bred in close quarters,
thus creating a concentrated source of
nutrients. Other BMPs for grazing operations
can reduce the potential for nutrient and
sediment contamination by controlling
animals’ movements within grazing sites.
Nutrient Testing. The nutrient content of
manure can vary greatly. Nutrient testing of
manure can inform feed and fertilizer
application recommendations. Testing results can help minimize nutrient release into the
surrounding environment.
Figure 13. Select Examples of Nutrient
Application Methods
Source: CRS adapted from John L. Havlin, Samuel L.
Tisdale, and Werner L. Nelson, et al., Soil Fertility and
Fertilizers: An Introduction to Nutrient Management, 8th ed.
(Pearson, 2014), Figs. 10-15. Photos A-E from USDA,
NRCS. Photo F from the University of Arizona, College of
Agriculture and Life Sciences/College of Engineering.
Note: Not all application methods represent a BMP.
Nutrients in Agricultural Production: A Water Quality Overview
Congressional Research Service R43919 · VERSION 8 · UPDATED 17
Planning. Animal waste planning helps
producers determine their current waste and
nutrient production and distribution
capacities. Balancing the production and
distribution of waste is critical to
preventing excess nutrient release.
Feed Management. Modifying animal feed
diets can reduce the nutrient content of the
manure.
Carcass Disposal. Improper disposal of
livestock and poultry carcasses can impact
surface and groundwater resources. Animal
mortality facilities vary and can consist of
composters, refrigeration, incinerators, or
burial pits, among others.
Constructed Wetlands. Constructed
wetlands can provide nutrient filtration
from wastewater and contaminated runoff
from livestock and agricultural processing
facilities. Constructed wetlands generally
use hydrophytic vegetation (i.e., grows in
water) in a shallow basin where the
contaminated water, both entering and
exiting the wetland, is controlled (Figure
15).
Waste Storage and Handling. The storage of
manure waste can allow for greater flexibility
in nutrient application and timing for crop
production. Practices such as short-term
storage––consisting of plastic sheeting––or
longer-term storage facilities (e.g., pits or
lagoons) are generally pursued as part of a
larger nutrient management plan.
Lagoon. A lagoon is a pond-like earthen basin
that provides biological treatment and long-
term storage of animal waste. Generally
manure is diluted with water, decomposed
through a biological process, and then used in
a separate form such as irrigation liquid. The
biological reaction is achieved by either
anaerobic bacteria (inhibited by oxygen) or
aerobic bacteria (requiring oxygen).
Stream Crossing. A stabilized area constructed
across a stream or waterway to provide access
for people or livestock while reducing
sediment and nutrient loading in the stream.
Figure 14. Terraces and Grassed Waterways
Source: Jeff Vanuga, USDA, NRCS.
Note: Shows contour terraces and grassed waterways.
Figure 15. Constructed Wetland
Source: Tim McCabe, USDA, NRCS.
Note: A series of hillside terraces form constructed
wetlands that filter water from a hog operation.

Nutrients in Agricultural Production: A Water Quality Overview
Congressional Research Service R43919 · VERSION 8 · UPDATED 18
Federal Response to Agricultural Nutrients Currently, few federal regulations govern the environmental impacts from agriculture. Some
environmental laws specifically exempt agriculture from regulatory requirements, and others are
structured so that agriculture is not addressed by most, if not all, of the regulatory impact. The
major federal response continues to be through research, education, outreach, and voluntary
technical and financial incentives.
Regulation––Clean Water Act50
Federal environmental law does not regulate all agricultural activities. In terms of environmental
impacts, the primary regulatory focus has been on protecting water resources and is governed by
the Clean Water Act (CWA). As with many environmental regulations affecting industries,
regulations affecting agriculture have been and continue to be controversial and draw
congressional attention.
The CWA provides one exception to policies that generally exempt agricultural activities—and
specifically the livestock industry—from environmental rules. The law protects water quality
through a combination of ambient water quality standards established by states, limits on effluent
discharges, and permits. The regulatory structure of the CWA distinguishes between “point
sources” (e.g., manufacturing and other industrial facilities that are regulated by discharge
permits) and “nonpoint sources” (pollution that occurs in conjunction with surface erosion of soil
by water and surface runoff of rainfall or snowmelt from diffuse areas, such as farm and ranch
land). Most agricultural activities are considered to be nonpoint sources, since they do not
discharge wastes from pipes, outfalls, or similar conveyances. Pollution from nonpoint sources is
generally governed by state water quality planning provisions of the act.
Concentrated Animal Feeding Operation (CAFO) Permits51
The CWA prohibits the discharge of pollutants from any point source to waters of the United
States unless authorized under a permit that is issued by EPA or a qualified state, and the act
expressly defines concentrated animal feeding operations (CAFOs) as point sources.52 Permits
limiting the type and quantity of pollutants that can be discharged are derived from effluent
limitation guidelines promulgated by EPA under the National Pollutant Discharge Elimination
System (NPDES) program. In 2003, EPA revised regulations that were first promulgated in the
1970s defining the term CAFO for purposes of permit requirements and specifying effluent
limitations on pollutant discharges from regulated feedlots. The 2003 rules were challenged in
50 While not discussed in this report, chemical fertilizers used in agriculture production are also regulated. For more
information, see CRS Report R43070, Regulation of Fertilizers: Ammonium Nitrate and Anhydrous Ammonia. Also,
facilities that emit large quantities of air pollutants may be regulated under the Clean Air Act. Some livestock
operations also may be subject to requirements of the Comprehensive Environmental Response, Compensation, and
Liability Act (CERCLA, or Superfund) and the Emergency Planning and Community Right-to-Know Act (EPCRA).
For additional information, see CRS Report RL33691, Animal Waste and Hazardous Substances: Current Laws and
Legislative Issues.
51 For additional information, see CRS Report RL33656, Animal Waste and Water Quality: EPA’s Response to the
Waterkeeper Alliance Court Decision on Regulation of CAFOs.
52 CAFOs are large animal feeding operations. The regulatory threshold of animal feeding operations that are covered
by CWA regulations varies by animal type (e.g., facilities housing 700 or more mature dairy cattle; 30,000 or more
laying hens or broilers), as detailed in EPA rules, which also specify CAFO pollution control requirements (40 C.F.R.
Part 122 and 40 C.F.R. Part 412).

Nutrients in Agricultural Production: A Water Quality Overview
Congressional Research Service R43919 · VERSION 8 · UPDATED 19
federal court (Waterkeeper Alliance et al. v. EPA, 399 F.3d 486 (2nd Cir. 2005)), and parts of the
regulations were remanded to EPA for revision and clarification. As a result, EPA issued revised
regulations in 2008.53
The 2008 CAFO rule applies to approximately 15,300 of the largest animal feeding operations
that confine cattle, dairy cows, swine, sheep, chickens, laying hens, and turkeys, or less than 10%
of all animal confinement facilities in the United States. The rule details requirements for permits,
annual reports, and development of plans for handling manure and wastewater. The rule contains
a performance standard that prohibits discharges from regulated CAFOs except in the event of
wastewater or manure overflows or runoff from an exceptional 25-year, 24-hour rainfall event.
Parts of the rule are intended to control land application of animal manure and wastewater.
Total Maximum Daily Load (TMDL)54
Section 303(d) of the CWA requires states to identify waters that are impaired by pollution, even
after application of pollution controls. For those waters, states must establish a total maximum
daily load (TMDL) to ensure that water quality standards can be attained. A TMDL is essentially
a pollution budget, a quantitative estimate of what it takes to achieve standards, setting the
maximum amount of pollution that a waterbody can receive without violating standards. If a state
fails to do this, EPA is required by the CWA to make its own TMDL determination for the state.
Throughout the United States, more than 20,000 waterways are known to be violating applicable
water quality standards and require a TMDL. Lawsuits have been brought with the intention of
pressuring EPA and states to develop TMDLs because the waters have been identified as being
impaired (that is, not meeting applicable water quality standards). The Chesapeake Bay TMDL is
the largest single TMDL developed to date.
Since 1995, EPA and states have developed a total of 69,205 TMDLs, addressing 72,653 causes
of water quality impairment in U.S. waters. Of the 69,205 total TMDLs, 6,161 (8.9%) addressed
nutrient impairments, and 3,942 (5.7%) addressed sediment impairments.55 According to EPA,
42,368 waterbodies remain impaired in the United States, due to 71,602 causes of impairment
(i.e., a waterbody may be impaired by more than one pollutant). TMDLs are to be established for
these waterbodies. Of the total known causes of current impairment, 7,166 (10%) are known to be
caused by nutrients, and 5,993 (8.4%) are known to be caused by sediment.56 Generally it is not
possible to determine how many of the nutrient impairments for which TMDLs are to be
developed are caused by agriculture or other possible sources until the TMDL is developed by a
state. The identification and listing of impaired waters are done by states.
Production Support
In large part, the federal response to nutrient pollution from agriculture is through voluntarily
adopted technical and financial assistance. A number of USDA agencies provide support through
53 U.S. Environmental Protection Agency, “Revised National Pollutant Discharge Elimination System Permit
Regulation and Effluent Limitations Guidelines for Concentrated Animal Feeding Operations in Response to the
Waterkeeper Decision, Final Rule,” 73 Federal Register 225, November 20, 2008, pp. 70417-70486.
54 For additional information, see CRS Report R42752, Clean Water Act and Pollutant Total Maximum Daily Loads
(TMDLs).
55 U.S. Environmental Protection Agency, National Summary of Impaired Waters and TMDL Information,
http://iaspub.epa.gov/waters10/attains_nation_cy.control?p_report_type=T.
56 Ibid.

Nutrients in Agricultural Production: A Water Quality Overview
Congressional Research Service R43919 · VERSION 8 · UPDATED 20
education, outreach, and research, while federal funds are provided through conservation
programs to adopt BMPs for nutrient reduction.
Technical Assistance, Education, and Outreach
USDA offers technical support to producers through direct assistance and research. Nutrient
management planning assistance is available at no cost through NRCS. Agency resources and
planning techniques draw on publicly reviewed and scientifically based principles. Various
conservation practices (the BMPs described above) may be prescribed, based on needs and
resource goals. Unless the nutrient management plan was created for a CAFO to meet the
regulatory requirements under the CWA NPDES program, implementation of a nutrient
management plan and associated BMPs are voluntary. Other state- and local-level programs (e.g.,
tax credits, pollution violation compliance, cost-share agreement, or local ordinance) may require
implementation of a nutrient management plan, but this varies greatly by state.
Nutrient management education and outreach is primarily handled through the land-grant
university system and the extension programs of the National Institute of Food and Agriculture
(NIFA).57
Financial Assistance
In addition to technical assistance, NRCS also administers a number of conservation programs
that offer financial assistance for nutrient management. According to NRCS, 8.2% of all acres
receiving NRCS conservation assistance for water quality between FY2005 and FY2014 were for
practices that support nutrient management.58
Many of the programs that fund nutrient
management BMPs are authorized in omnibus
farm bills, the most recent of which is the
Agricultural Act of 2014 (P.L. 113-79). The
Environmental Quality Incentives Program
(EQIP) is the largest farm bill program that
funds nutrient management practices,
including conservation activity plans for
nutrient management as well as financial
assistance to implement other nutrient
management practices recommended in the
nutrient management plan (e.g., cover crops,
buffer strips, and waste lagoons). Other farm
bill programs, such as the Conservation
Stewardship Program (CSP), provide
incentives encouraging producers to adopt
additional nutrient-reducing practices. Land retirement and easement programs, such as the
57 For additional information, see CRS Report R40819, Agricultural Research: Background and Issues.
58 USDA, NRCS, Soil and Water Resources Conservation Act (RCA) Report, National Conservation Programs Profile,
http://www.nrcs.usda.gov/wps/portal/nrcs/detail/national/technical/nra/rca/ida/?cid=stelprdb1187041. Nutrient
management is also considered under the soil quality category of the report.
59 Food, Conservation, and Energy Act of 2008 (P.L. 110-246). These provisions were unchanged when reauthorized in
the Agricultural Act of 2014 (P.L. 113-79).
Conservation Activity Plans
Amendments in the 2008 farm bill59 allow NRCS to use
financial assistance to pay for conservation plan
development. The plans are referred to as
Conservation Activity Plans (CAPs), of which two are
for nutrient management––#102 comprehensive
nutrient management plan (CNMP, for CAFOs and
AFOs) and #104 nutrient management plan (non-
livestock, crop production). EQIP can also pay for plan
implementation, but this is handled separately from the
CAPs. The main practice standard for nutrient
management implementation is the 590 practice
standard (see Table A-1). CAP #102 or #104
describes which nutrients need to be managed and how
they could be managed, whereas the 590 nutrient
management practice will fund the activities required to
manage them (e.g., soil testing, design, and labor).

Nutrients in Agricultural Production: A Water Quality Overview
Congressional Research Service R43919 · VERSION 8 · UPDATED 21
Conservation Reserve Program (CRP) and the Agricultural Conservation Easement Program
(ACEP), remove land from production and establish resource-conserving vegetation for wildlife
and water quality benefits.60
The Clean Water Act Section 319 Program authorizes grants to states, territories, and tribes to
help address national water quality challenges posed by nonpoint sources of pollution, such as
runoff from farmland, forests, and city streets.61 State Section 319 programs generally address
nonpoint source pollution from a variety of sectors, not just agriculture. According to EPA, states
use their Section 319 funding, along with a state match (40% match is required), to implement
statewide, non-regulatory programs that promote implementation on a widespread basis (e.g.,
promote broad use of nutrient management in agriculture).62
Research and Monitoring
USDA conducts nutrient management research both through its in-house research agencies––
Agricultural Research Service (ARS) and the Economic Research Service (ERS)––and through
funds provided to states and localities by NIFA. The ARS conducts numerous research projects
within 17 national programs, five of which support nutrient management-related research.63 The
ERS, which conducts economic research on policy issues, has produced a number of publications
that analyze the societal and economic impacts of nutrient use in the United States from the
standpoint of both production and environmental quality.
USDA also participates in a multi-agency effort led by NRCS, called the Conservation Effects
Assessment Project (CEAP). The purpose of CEAP is to quantify the environmental effects of
conservation practices and programs and develop the science base for managing the agricultural
landscape for environmental quality. Project findings are used to guide USDA conservation
policy and program development and potentially to assist producers with making more informed
conservation decisions. To date, a number of CEAP publications focus on nutrient management.64
The U.S. Geological Survey (USGS), as part of its National Water Quality Assessment Program,
continues to conduct studies on the transport and fate of agricultural nutrients in agricultural
settings across the country. Early study results highlight how environmental processes and
agricultural practices interact to affect the movement and transformation of agricultural chemicals
in the environment. The study covers surface water, groundwater, the unsaturated zone, the
streambed, and the atmosphere, as well as the pathways that interconnect these compartments. In
an attempt to make the findings nationally relevant, the study areas represent major agricultural
settings, such as diverse irrigated crop systems in Western states and corn and soybean row crop
60 For additional information on private land conservation programs, see CRS Report R40763, Agricultural
Conservation: A Guide to Programs.
61 For more information on the CWA 319 program, see http://water.epa.gov/polwaste/nps/cwact.cfm.
62 EPA, Office of Wetlands, Oceans, and Watersheds, A National Evaluation of the Clean Water Act Section 319
Program, November 2011, http://water.epa.gov/polwaste/nps/upload/319evaluation.pdf.
63 ARS national programs supporting nutrient related research include NP #211––Water Availability and Watershed
Management, NP #212––Climate Change, Soils, and Emissions, NP #214––Agricultural and Industrial Byproducts, NP
#215––Pasture, Forage and Rangeland Systems, and NP #216––Agricultural System Competitiveness and
Sustainability. Other national programs, such as NP #305 (Plant Genetic Resources, Genomics and Genetic
Improvement) and NP #305 (Crop Production), may also include research that impacts nutrient management through
the development of plant varieties and production practices that require less nutrients. Research project information
may be found at http://www.ars.usda.gov/research/programs.htm.
64 Additional information and publication links may be found here: http://www.nrcs.usda.gov/wps/portal/nrcs/detail/
national/technical/nra/ceap/?cid=nrcs143_014153.
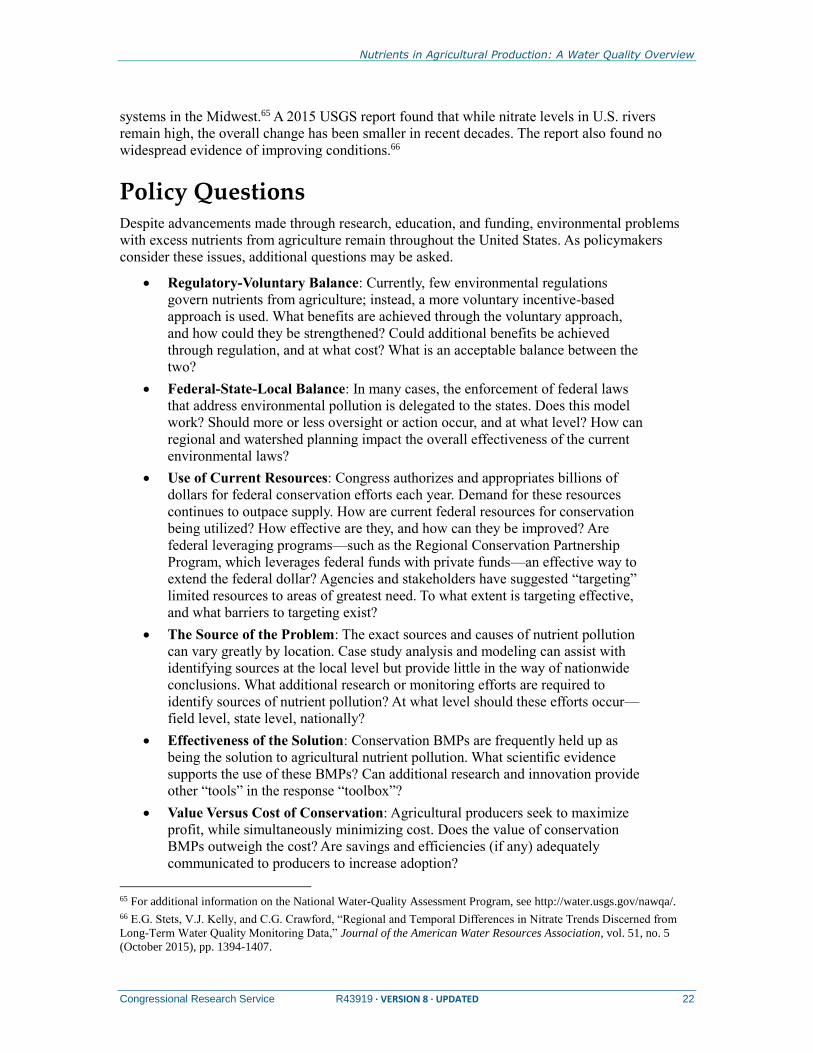
Nutrients in Agricultural Production: A Water Quality Overview
Congressional Research Service R43919 · VERSION 8 · UPDATED 22
systems in the Midwest.65 A 2015 USGS report found that while nitrate levels in U.S. rivers
remain high, the overall change has been smaller in recent decades. The report also found no
widespread evidence of improving conditions.66
Policy Questions Despite advancements made through research, education, and funding, environmental problems
with excess nutrients from agriculture remain throughout the United States. As policymakers
consider these issues, additional questions may be asked.
Regulatory-Voluntary Balance: Currently, few environmental regulations
govern nutrients from agriculture; instead, a more voluntary incentive-based
approach is used. What benefits are achieved through the voluntary approach,
and how could they be strengthened? Could additional benefits be achieved
through regulation, and at what cost? What is an acceptable balance between the
two?
Federal-State-Local Balance: In many cases, the enforcement of federal laws
that address environmental pollution is delegated to the states. Does this model
work? Should more or less oversight or action occur, and at what level? How can
regional and watershed planning impact the overall effectiveness of the current
environmental laws?
Use of Current Resources: Congress authorizes and appropriates billions of
dollars for federal conservation efforts each year. Demand for these resources
continues to outpace supply. How are current federal resources for conservation
being utilized? How effective are they, and how can they be improved? Are
federal leveraging programs—such as the Regional Conservation Partnership
Program, which leverages federal funds with private funds—an effective way to
extend the federal dollar? Agencies and stakeholders have suggested “targeting”
limited resources to areas of greatest need. To what extent is targeting effective,
and what barriers to targeting exist?
The Source of the Problem: The exact sources and causes of nutrient pollution
can vary greatly by location. Case study analysis and modeling can assist with
identifying sources at the local level but provide little in the way of nationwide
conclusions. What additional research or monitoring efforts are required to
identify sources of nutrient pollution? At what level should these efforts occur––
field level, state level, nationally?
Effectiveness of the Solution: Conservation BMPs are frequently held up as
being the solution to agricultural nutrient pollution. What scientific evidence
supports the use of these BMPs? Can additional research and innovation provide
other “tools” in the response “toolbox”?
Value Versus Cost of Conservation: Agricultural producers seek to maximize
profit, while simultaneously minimizing cost. Does the value of conservation
BMPs outweigh the cost? Are savings and efficiencies (if any) adequately
communicated to producers to increase adoption?
65 For additional information on the National Water-Quality Assessment Program, see http://water.usgs.gov/nawqa/.
66 E.G. Stets, V.J. Kelly, and C.G. Crawford, “Regional and Temporal Differences in Nitrate Trends Discerned from
Long-Term Water Quality Monitoring Data,” Journal of the American Water Resources Association, vol. 51, no. 5
(October 2015), pp. 1394-1407.

Nutrients in Agricultural Production: A Water Quality Overview
Congressional Research Service R43919 · VERSION 8 · UPDATED 23
Consequences of Actions: Nutrient pollution may or may not directly impact the
polluters themselves. According to ERS, the cost of removing nitrates from U.S.
drinking water supplies is over $4.8 billion per year. The bulk of this cost is
borne by large water utilities and then passed on to consumers. It is estimated that
if the agricultural industry were required to pay based on its contribution to
nitrate loading, agriculture’s share would be about $1.7 billion per year.67 Who
should bear the cost of nutrient loading? Can education and outreach connect on-
farm actions to potential off-farm results?
Conclusion Increased demand to feed a growing population is frequently cited as the reason for additional
agricultural output. Applying additional nutrients for increased yields and managing nutrients
from animal production will likely continue if these demands are realized. This will only elevate
the importance of managing these additional nutrients correctly or potentially repeating and
exacerbating the environmental degradation that has occurred in the past.
Agriculture is one of a number of industries that produces, uses, or releases nutrients that may
adversely affect the environment. The exact source of water impairments is frequently not
identified until major ecological events prompt additional research. Even then, the nature of how
nutrients move through the environment can make their origin difficult to track. It is agriculture’s
use of nutrients and large land-use presence across the United States that have brought attention
to how the industry utilizes and manages nutrients. And while best management practices exist to
eliminate or reduce nutrients from entering waterways, they are not required, they may not be
effective or affordable in all locations, and the success will depend on how and where they are
applied.
Some advocate for the additional regulation of agricultural nutrient activities, while others seek to
expand incentive-based resources. The track record of success and failure for both options varies,
making the likely solution a balance of the two. It is this exact balance that Congress continues
debate through the oversight of current federal activities and consideration of new or modified
initiatives. Research, data, and monitoring continue to impact the debate, but perhaps not as much
as larger water impairments that affect public health and safety.
67 Marc Ribaudo, Jorge Delgado, and LeRoy Hansen, et al., Nitrogen in Agricultural Systems: Implications for
Conservation Policy, USDA, ERS, ERR-127, Washington, DC, September 2011, p. 4.

Nutrients in Agricultural Production: A Water Quality Overview
Congressional Research Service R43919 · VERSION 8 · UPDATED 24
Appendix. NRCS Practice Standards
Table A-1. Select NRCS Practice Standards Related to Nutrient Reduction and
Water Quality
Name Practic
e Codea Link
Animal mortality facility 316 http://www.nrcs.usda.gov/Internet/FSE_DOCUMENTS/
nrcs143_026388.pdf
Agrichemical handling facility 309
http://www.nrcs.usda.gov/Internet/FSE_DOCUMENTS/
stelprdb1263506.pdf
Composting facility 317 http://www.nrcs.usda.gov/Internet/FSE_DOCUMENTS/
nrcs143_026122.pdf
Conservation crop rotation 328 http://www.nrcs.usda.gov/Internet/FSE_DOCUMENTS/
stelprdb1263170.pdf
Constructed wetland 656 http://www.nrcs.usda.gov/Internet/FSE_DOCUMENTS/
nrcs143_025770.pdf
Contour buffer strips 332 http://www.nrcs.usda.gov/wps/PA_NRCSConsumption/download?cid=
nrcs143_026249&ext=pdf
Contour farming 330 http://www.nrcs.usda.gov/Internet/FSE_DOCUMENTS/
stelprdb1241315.pdf
Cover crop 340 http://www.nrcs.usda.gov/Internet/FSE_DOCUMENTS/
stelprdb1263176.pdf
Denitrifying Bioreactor 605 http://www.nrcs.usda.gov/wps/PA_NRCSConsumption/download?cid=
nrcseprd340747&ext=pdf
Drainage water management 554 http://www.nrcs.usda.gov/Internet/FSE_DOCUMENTS/
nrcs143_026409.pdf
Feed management 592 http://www.nrcs.usda.gov/Internet/FSE_DOCUMENTS/
stelprdb1046856.pdf
Filter strip 393 http://www.nrcs.usda.gov/Internet/FSE_DOCUMENTS/
stelprdb1241319.pdf
Grassed waterway 412 http://www.nrcs.usda.gov/Internet/FSE_DOCUMENTS/
stelprdb1263177.pdf
Irrigation water
management
449 http://www.nrcs.usda.gov/Internet/FSE_DOCUMENTS/
stelprdb1263179.pdf
Nutrient management 590 http://www.nrcs.usda.gov/Internet/FSE_DOCUMENTS/
stelprdb1046433.pdf
Residue and tillage
management, no till
329 http://www.nrcs.usda.gov/Internet/FSE_DOCUMENTS/
stelprdb1249901.pdf
Residue and tillage
management, reduced till
345 http://www.nrcs.usda.gov/Internet/FSE_DOCUMENTS/
stelprdb1251402.pdf
Short-term storage of
animal waste and byproduct
318 http://www.nrcs.usda.gov/Internet/FSE_DOCUMENTS/
stelprdb1263507.pdf
Stream crossing 578 http://www.nrcs.usda.gov/Internet/FSE_DOCUMENTS/
stelprdb1046932.pdf
Stripcropping 585 http://www.nrcs.usda.gov/Internet/FSE_DOCUMENTS/
nrcs143_026280.pdf

Nutrients in Agricultural Production: A Water Quality Overview
Congressional Research Service R43919 · VERSION 8 · UPDATED 25
Name Practic
e Codea Link
Terrace 600 http://www.nrcs.usda.gov/Internet/FSE_DOCUMENTS/
stelprdb1263187.pdf
Waste storage facility 313 http://www.nrcs.usda.gov/Internet/FSE_DOCUMENTS/
nrcs143_026465.pdf
Waste treatment 629 http://www.nrcs.usda.gov/Internet/FSE_DOCUMENTS/
stelprdb1144479.pdf
Waste treatment lagoon 359 http://www.nrcs.usda.gov/Internet/FSE_DOCUMENTS/
nrcs143_026002.pdf
Source: CRS from USDA, NRCS, “National Conservation Practice Standards,” http://www.nrcs.usda.gov/wps/
portal/nrcs/main/national/technical/cp/ncps/.
Notes: This is not intended to be a comprehensive list. In some cases, additional practices are required to
complete a conservation system. For example, a manure management system may consist of a number of
practices (e.g., waste storage facility [313] and nutrient management [590]), including some not on this list (e.g.,
waste transfers [634], irrigation water conveyance [428], and irrigation system sprinkler [422]).
a. Practice codes refer to an NRCS numbering system and are included for reference purposes.
Author Information
Megan Stubbs
Specialist in Agricultural Conservation and Natural
Resources Policy
Disclaimer
This document was prepared by the Congressional Research Service (CRS). CRS serves as nonpartisan
shared staff to congressional committees and Members of Congress. It operates solely at the behest of and
under the direction of Congress. Information in a CRS Report should not be relied upon for purposes other
than public understanding of information that has been provided by CRS to Members of Congress in
connection with CRS’s institutional role. CRS Reports, as a work of the United States Government, are not
subject to copyright protection in the United States. Any CRS Report may be reproduced and distributed in
its entirety without permission from CRS. However, as a CRS Report may include copyrighted images or
material from a third party, you may need to obtain the permission of the copyright holder if you wish to
copy or otherwise use copyrighted material.