Embed Size (px)
Citation preview

Louisiana State UniversityLSU Digital Commons
LSU Historical Dissertations and Theses Graduate School
1977
Utilizing Whey Nutrients for Yeast Production andPollution Control.Mahmood Ead Al-omarLouisiana State University and Agricultural & Mechanical College
Follow this and additional works at: https://digitalcommons.lsu.edu/gradschool_disstheses
This Dissertation is brought to you for free and open access by the Graduate School at LSU Digital Commons. It has been accepted for inclusion inLSU Historical Dissertations and Theses by an authorized administrator of LSU Digital Commons. For more information, please [email protected].
Recommended CitationAl-omar, Mahmood Ead, "Utilizing Whey Nutrients for Yeast Production and Pollution Control." (1977). LSU Historical Dissertationsand Theses. 3091.https://digitalcommons.lsu.edu/gradschool_disstheses/3091
INFORMATION TO USERS
This material Mm produced from a microfilm copy of tha original documant. While tha most advanced tachnologieal maans to photopaph and raproduoa this documant hava baan usad, tha quality Is heavily dapandant upon tha quality of tha original submitted.
Tha following explanation of techniques is provided to help you understand markings or patterns which may appear on this reproduction.
1. Tha sign or "target" for pages apparently lacking from the documant photographed Is "Missing Pap(s)". If it was possible to obtain tha missing paga(s) or section, they are spliced into the film along with adjacent pages. This may hava necessitated cutting thru an imags and duplicating adjaoant pages to insure you complete continuity.
2. Whan an im ep on tha film is obliterated with a large round black mark, it is an Indication that the photographer suspected that tha copy may hava moved during exposure and thus causa a blurred image. You will find a good image of the paga in the adjaoant frame.
3. Whan a map, drawing or chart, etc., was part of tha material being photographed the photographer followed a definite method in "sectioning" tha material. It is customary to begin photoing at the upper left hand comer of a large dwet and to continue photoing from left to right in equal sections with a small overlap. If necessary, sectioning is continued again — beginning below the first row and continuing on until complete.
4. The majority of users indicate that tha textual content is of greatest value, however, a somewhat higher quality reproduction could be made from "photographs" if essential to tha understanding of tha dissertation. Silver prints of "photographs" may ba ordered at additional charge by writing tha Order Department, giving tha catalog number, title, author and snadfic naaas vou a id reproduced-v rsr s ^ e w ^ v v w r w s w r v ^ e w i w w n f ^ e s i
5. PLEASE NOTE: Soma pages may have Indistinct print. Filmed as rsoslved.
University Microfilms International300 North Zaob RoodAnn Arbor. Michigan 4S106 USASi. John's Hoed. Tylor's QroonHigh Wycombo, Bucks. England HP10 9HR
I77-28,656
AL-OMAR, Mahmood Ead, 1946-UTILIZING WHEY NUTRIENTS FOR YEAST PRODUCTION AND POLLUTION CONTROL.The Louisiana State University and Agricultural and Mechanical College, Ph.D., 1977 Food Technology
Xerox University Microfilms , Ann Arbor, Michigan 48106
UTILIZING WHEY NUTRIENTS FOR YEAST
PRODUCTION AND POLLUTION CONTROL
A Dissertation
Submitted to the Graduate Faculty of the Louisiana State University and
Agriculture and Mechanical College in partia l fulfillment of the requirements for the degree of
Doctor of Philosophy
in
The Department of Dairy Science
by
Mahmood Ead A1-Omar B.S., Baghdad University - Iraq, 1968 M.S., Louisiana State University, 1973
August, 1977
EXAMINATION AND THESIS REPORT
Candidate: Metaood Sad AI-Om t
Major Field: D.lry Scl«n c.
Title of Theau: Ut i l l ring Vhay Nutrlanta for T au t Production and P ollu tion Control
Approved:
Major Professor and Chairman
~mi o r r ?Yi *~nrwh*\ ^ ___/ Dean of the Graduate School
EXAMINING COMMITTEE:
U /j(djL adm t
4nAi
^ I r v j * ^
v
Date of Examination:
J u ly 7 , 137?

ACKNOWLEDGMENTS
In the name of Allah, most beneficient, most merci
ful. Praised be to Allah, Lord of the universe; the nost
knowing and wise.
The author wishes to express appreciation to his
major professor, Dr. J . H. Gholson, for his guidance during
the progress of th is research and his assistance in the pre
paration of th is dissertation; to Dr. P. H. Hoskins and
Dr. W. F. McKnight, his minor professors, for their sincere
in terest and counsel; and to Dr. J . B. Frye, J r . , Depart
ment Head, for providing an opportunity and assistance for
study in the Department of Dairy Science.
The author is grateful to other members of his Advi
sory Committee; Dr. R. H. Gough, Department of Dairy Science
and Dr. J . G. Lee, Department of Biochemistry, for their
guidance and editing of th is manuscript.
Thanks are given to Dr. B. R. Farthing, Department
Head of Experimental S ta tis tics , Dr. E. A. Epps, J r „ Chief
Chemist of Feed and F ertilizer, Mr. L. R. Kuss, Chief Chem
is t of the Division of Water Pollution Control/ and his
sta ff, and to a ll employees in the Creamery of the LSU
i i
Dairy Science Department for th e ir assistance throughout
th is study.
The author is thankful to h is brother, Mr. Adnan
Omar for his encouragement, guidance, and assistance. A
special thanks is extended to my wife for her encourage
ment and understanding throughout the study and to the
people of The Republic of Iraq for th e ir financial assist
ance, and above a ll to Allah, the knower of a l l things.
i i i
TABLE OF CONTENTS
P age
ACKNOWLEDGMENTS . . . . . . . . . . . . . ..................................... i i
LIST OF TABLES.................................................................................................... vii
LIST OF FIGURES............................................................. ix
ABSTRACT..................................................................................................................... x
INTRODUCTION........................................................................................................... 1
REVIEW OF LITERATURE..................................................................................... 5
I . World Whey Production..••••••••• .•* .••••••• 5
I I . Disposal of Whey.......................• • •••••• ........................ 9
I I I . Industrial Uses of Whey. ................. 17
A. Therapeutic and Pharmaceutical value.•• 17
B. Concentration treatments.• ........................ 18
1. Freeze Concentration. ......................... 182. Condensing................• •••••• .......................... 193. Drying........................• ••••••• ................................ 194. Lactose Production.•••• ........................ 225. Ultrafiltration/Reverse Osmosis.. . . 246. Demineralization.. . . ...........................•••• 25
IV. Whey as Food or Feed.••••••••••••« ..••••••• 26
A. Human Use................ 26
B. Animal U s e . • 29
V. Fermentation of Whey. . . . . . . . . . . . . . . . . . . . . . . 31
A. Bacterial Fermentation...••• .•••••* •••• 31
i v
Pa9^
B. Mold F e r m e n t a t i o n * • 32
C* Yeast Fermentation*••••••* .* .••••••••• 33
1* General..*.• • • • • • • • .• • • • • •* • • • • • .. 332* Saccharomyces f raqi l i s* ■ 353. Torulopsis sphaerica. . . . . . . . . . . . . . 434. Candida u t i l i s ............................................... 455. Other Yeast Species . . . . . ................ 476. Production of Fodder Yeast, and
E n r i c h m e n t 47
MATERIALS AND METHODS.................................................................................. 49
Experimental Fermentation Tanks.•••••••••••■ •• 50
Whey P r e p a r a t i o n . ......................• • •• • • •• • . 50
Inoculum Preparation ••••••••••••••••••••• 53
Chemical T e s t s . . . . . . . . . . . . . . . . . .• • • • • • • • 54
Lactose. ................................. 54Total Solids.• • . • • • • • • • • • • • • • • • • • . • • . . . . . • 55Protein....................................... 55pH Determination. ••••••••••••••••••■ 56Titratable A cidity. 56Chemical Oxygen D e m a n d . ............ 56Biochemical Oxygen Demand.• • • • • • .• • • • • .• • • 56Total Oxygen Demand..••••••••••••••••••••■ 57S ta tis tica l Analysis. ............. 57
RESULTS AND DISCUSSION............................................................................... 59
I . Preliminary Studies of Torulopsissphaerica ................................................................. 59
1. Effect of pH Level • 612. Effect of Incubation Tem perature...... 623. Effect of Air Flow.. . . . . . . . . . . . . . . . . . . 634. Effect of Inoculum Level..................... 665. Effect of Incubation Time.• • • • • • • • • . . . 68
v

P a g e
I I . Detailed Studies of Torulopsis sphaerica. . . 71
1. Effect of Incubation Temperature.. . . . . . 712. Effect of Air Plow •••••••••••••••••••• 743. Effect of Inoculum Level . . . . • • • • ................ 754. Correlations of Selected Variables 77
I I I . Detailed Studies of Kluwromvces f ra g ilis . . 79
1. Effect of Incubation Temperature • 802. Effect of Air Flow • • • • • • • .............. .• • • • • • 823. Effect of Inoculum L e v e l . . . . . . ......................... 844. Correlation of Selected Variables.. . . . • 86
IV. Candida u t i l i s ....................... 88
V. Lactose as Lactic Acid. • • • • . . . ............... 90
VI. Oxidation Demands on Whey and FermentedWhey Effluent............................................................................ 91
VII. Combinations of Yeast Cultures. ............... 94
VIII. Potential Applications for Plant Use................. 99
SUMMARY........................................................................................................................... 100
SELECTED BIBLIOGRAPHY. . . . . . ................................................................. 105
APPENDICES......................................................................................................................116
Appendix Tables. 117Appendix Figures.• • • • ............. 144
VITA.......................................................................................................................................150
v i
LIST OF TABLES
TABLE P a g e
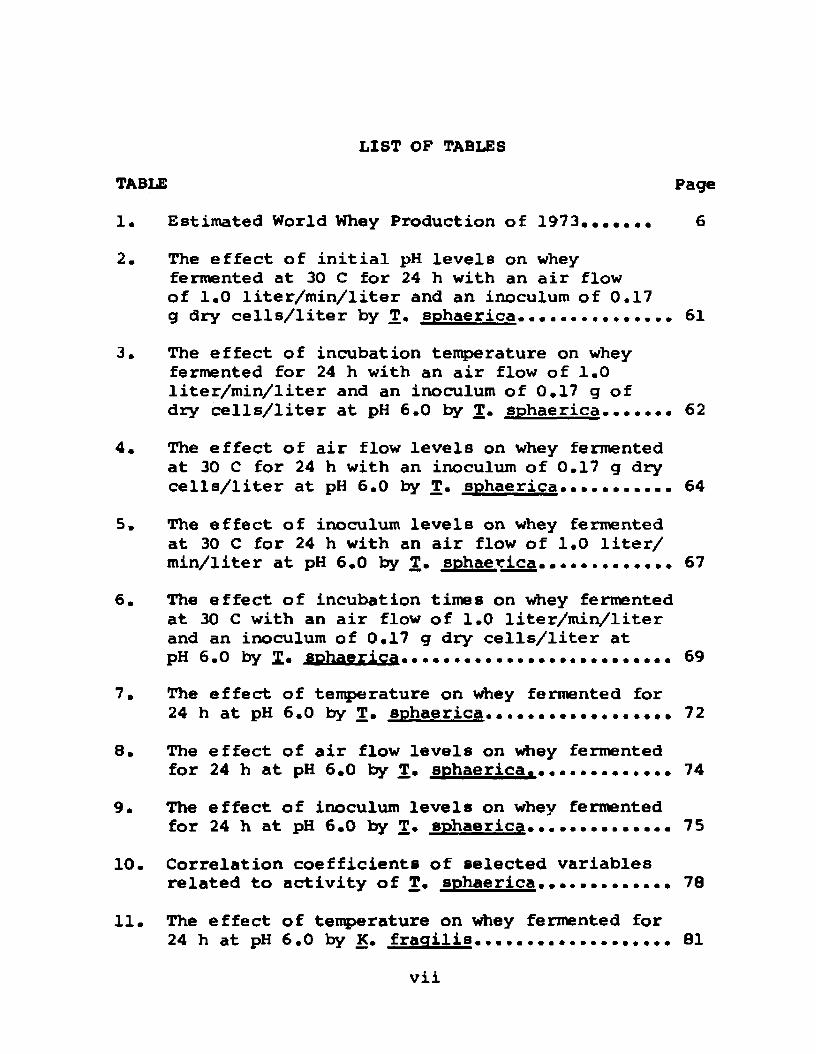
1. Estimated World Whey Production of 1 9 7 3 ...... . 6
2. The effect of in it ia l pH levels on whey fermented at 30 C for 24 h with an a ir flow of 1.0 lite r /m in /lite r and an inoculum of 0.17g dry c e l ls / l i te r by T. sphaerica. . ........................... 61
3. The effect of incubation temperature on whey fermented for 24 h with an a ir flow of 1.0 lite r /m in /lite r and an inoculum of 0.17 g of dry c e l ls / l i te r at pH 6.0 by T. sphaerica 62
4. The effect of a ir flow levels on whey fermented at 30 C for 24 h with an inoculum of 0.17 g dry c e l ls / l i te r at pH 6.0 by T. sphaerica. .................... 64
5. The effect of inoculum levels on whey fermented at 30 C for 24 h with an a ir flow of 1.0 l i t e r / m in/liter at pH 6.0 by T. sphaerica. . . . . . . . . . . . . 67
6. The effect of incubation times on whey fermented at 30 C with an a ir flow of 1.0 lite r /m in /lite r and an inoculum of 0.17 g dry c e l ls / l i te r atpH 6.0 by 1. sphaerica...................................................................... 69
7. The effect of tenperature on whey fermented for24 h at pH 6.0 by T. sphaerica. . . . . . . . . . . . . . . . . . 72
8. The effect of a ir flow levels on whey fermentedfor 24 h at pH 6.0 by T. sphaerica.. . . . . . . . . . . . . 74
9. The effect of inoculum levels on whey fermentedfor 24 h at pH 6.0 by T. sphaerica. . . . . . . . . . . . . . 75
10. Correlation coefficients of selected variablesrelated to activity of T. sphaerica. ................ 78
11. The effect of temperature on whey fermented for24 h at pH 6.0 by K. f ra g ilis ................ 81
v i i

TABLE P a g e
12. The effect of a ir flow levels on whey fermented for 24 h at pH 6.0 by K. fra q ilis . . . . . . 63
13* The effect of inoculum levels on whey fermented for 24 h at pH 6.0 by K. fra q ilis . . . . . . 65
14. Correlation coefficients of selected variablesrelated to activity of K. f ra q ilis 87
15. The average composition of non fermented whey. 91
16. Correlation coefficients of selected variablesrelated to non fermented whey ................ 92
17. The average composition of whey effluent afterferm entation ...... ................ 93
18. Correlation coefficients of selected variablesrelated to fermented whey e fflu en t.. . • • • ............ 94
19. The effect of mixed yeast cultures on whey fermented at 30 C for 24 h with an a ir flow of 1.5 lite r/m in /lite r and an inoculum of0.27 g dry c e l ls / l i te r at pH 6 .0 . ............. 97
v i i i

FIGURE
1.
LIST OF FIGURES
Air d istributor hose for p ilo t equipment.•
i x
P a g e
. 51

ABSTRACT
This study was undertaken to determine the optimum
conditions for growth in a whey medium of Kluvveromvces
fra q ilis . Torulopsis sphaerica and Candida u ti l is in pure
culture and in a ll possible combinations. The u tiliza tion
of yeast cultures to reduce nutrient levels of whey offers
the p ossib ilities of a protein for food and feed as well as
the reduction of pollution load in waste disposal systems.
A p ilo t laboratory model included a controlled temper
ature water bath with six stainless steel beakers with 3
l i te rs capacity each. Each beaker was equipped with a speed
controlled agitator and a flow meter to control the flow of
filte red a ir .
Sweet rennet whey from pasteurized skim milk, treated
with 0.03% h 2°2 for 30 m n at 45 C' cooled to 25 C and
treated with s te rile catalase u n til negative for H202# w®8
used for the fermentation medium. The parameters studied
were: fermentation temperature of 25, 30, 35 C; inoculum
levels of 0.17 and 0.27 g dry c e l ls / l i te r and a ir flows of
1.0 and 1.5 lite r /m in /lite r of whey. Incubation time was
held at 24 h and in it ia l pH at 6.0 to simulate plant
x
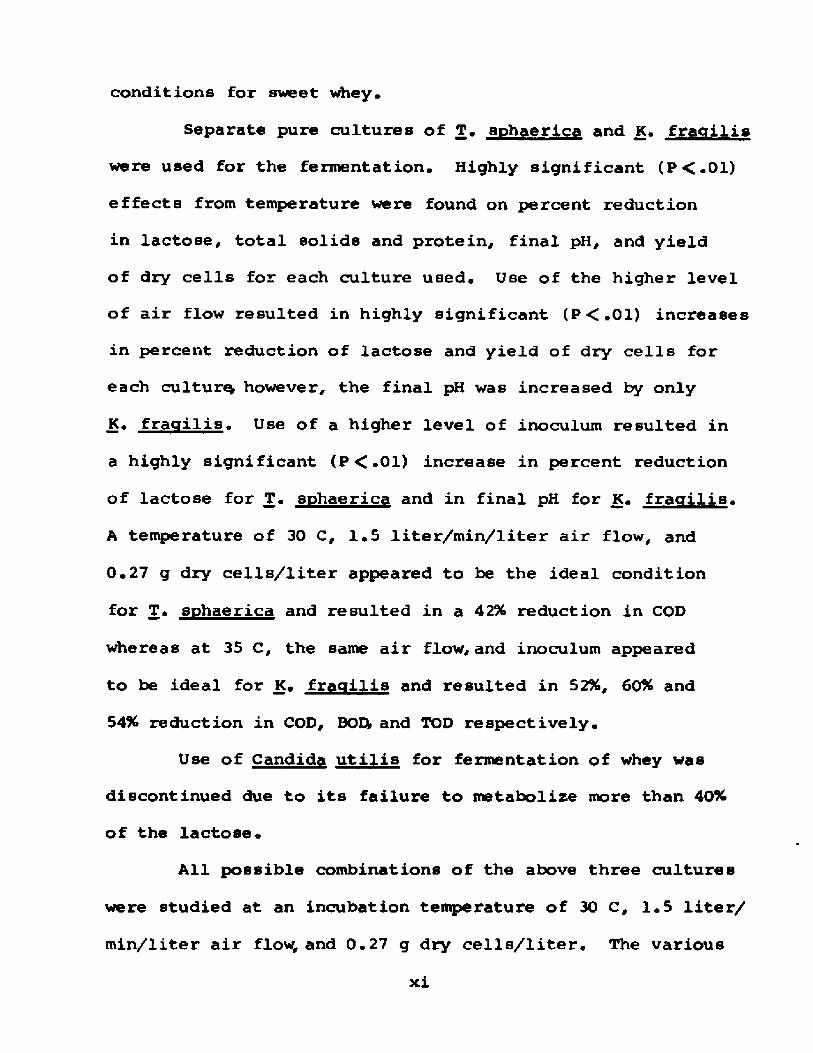
conditions for sweet whey.
Separate pure cultures of T. sphaerica and K . fraq ilis
were used for the fermentation. Highly significant (P<,01)
effects from temperature were found on percent reduction
in lactose, to ta l solids and protein, final pH, and yield
of dry cells for each culture used. Use of the higher level
of a ir flow resulted in highly significant (P<,01) increases
in percent reduction of lactose and yield of dry cells for
each culture however, the final pH was increased by only
K. fra q ilis . Use of a higher level of inoculum resulted in
a highly significant (P<.01) increase in percent reduction
of lactose for T, sphaerica and in final pH for K. f ra q ilis .
A temperature of 30 C, 1,5 lite r /m in /lite r a ir flow, and
0,27 g dry c e l ls / l i te r appeared to be the ideal condition
for T. sphaerica and resulted in a 42% reduction in COD
whereas at 35 C, the same a ir flow, and inoculum appeared
to be ideal for K, fraq ilis and resulted in 52%, 60% and
54% reduction in COD, BOEV and TOD respectively.
Use of Candida u t i l i s for fermentation of whey was
discontinued due to i ts failure to metabolize more than 40%
of the lactose.
All possible combinations of the above three cultures
were studied at an incubation temperature of 30 C, 1,5 l i t e r /
m in/liter a ir flow, and 0.27 g dry c e l ls / l i te r . The various
x i

combinations resulted in a significant (P<.05) effect on
percent reduction of protein, COD and BOD, and a highly
significant (P <.01) effect on percent reduction of lactose,
to ta l solids and yield of dry ce lls . K* fraq ilis plus T.
sphaerica appeared to be the best combination while C.
u t i l i s appeared to have no positive effect.
x i i
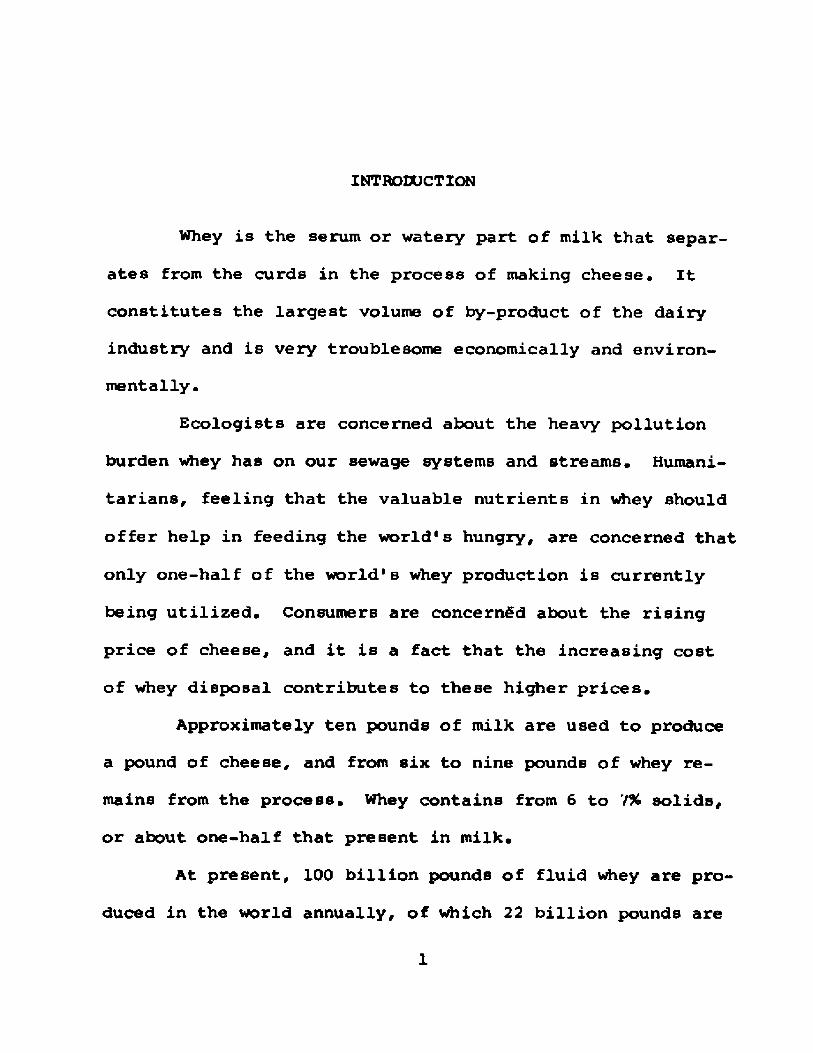
INTRODUCTION
Whey is the serum or watery part of milk that separ
ates from the curds in the process of making cheese. I t
constitutes the largest volume of by-product of the dairy
industry and is very troublesome economically and environ
mentally.
Ecologists are concerned about the heavy pollution
burden whey has on our sewage systems and streams. Humani
tarians, feeling that the valuable nutrients in whey should
offer help in feeding the world's hungry, are concerned that
only one-half of the world's whey production is currently
being u tilized . Consumers are concerned about the rising
price of cheese, and i t is a fact that the increasing cost
of whey disposal contributes to these higher prices.
Approximately ten pounds of milk are used to produce
a pound of cheese, and from six to nine pounds of whey re
mains from the process. Whey contains from 6 to '!% solids,
or about one-half that present in milk.
At present, 100 b illion pounds of fluid whey are pro
duced in the world annually, of which 22 b illion pounds are
1
2
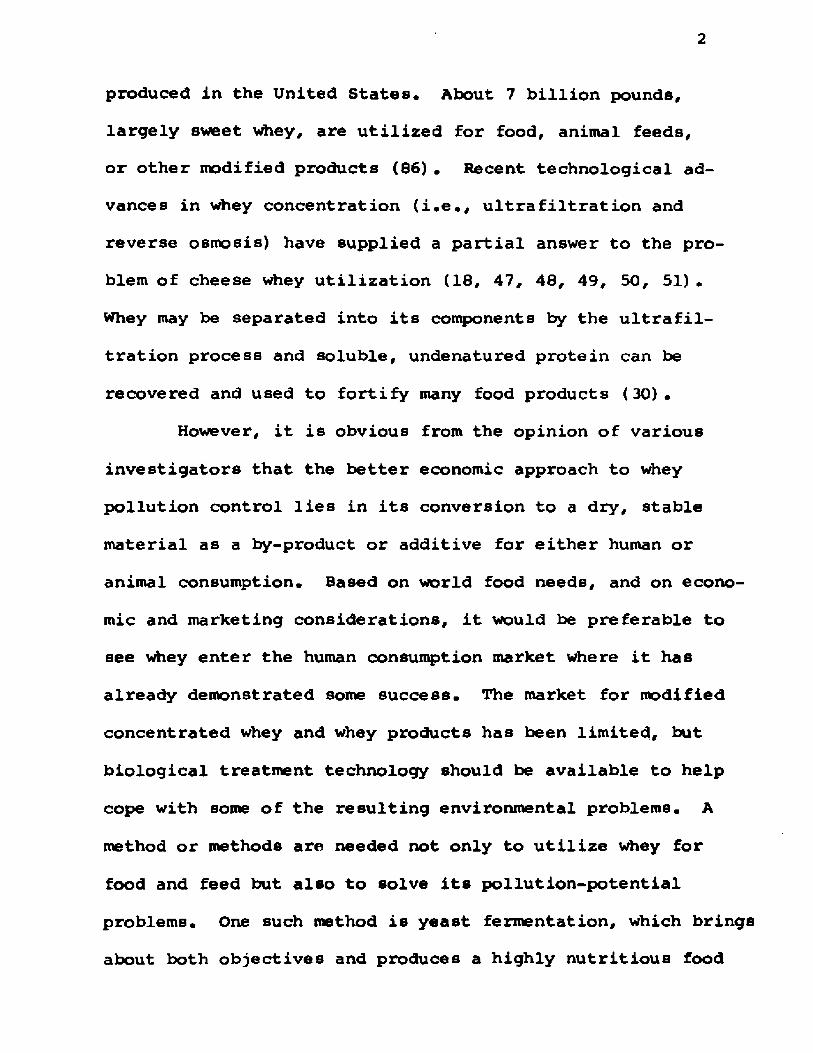
produced in the United States. About 7 b illion pounds,
largely sweet whey, are u tilized for food, animal feeds,
or other modified products (86). Recent technological ad
vances in whey concentration ( i .e ., u ltra f iltra tio n and
reverse osmosis) have supplied a partia l answer to the pro
blem of cheese whey u tiliza tion (18, 47, 46, 49, 50, 51).
Whey may be separated into i ts components by the u l t r a f i l
tration process and soluble, undenatured protein can be
recovered and used to fortify many food products (30).
However, i t is obvious from the opinion of various
investigators that the better economic approach to whey
pollution control lie s in i ts conversion to a dry, stable
material as a by-product or additive for either human or
animal consumption. Based on world food needs, and on econo
mic and marketing considerations, i t would be preferable to
see whey enter the human consumption market where i t has
already demonstrated some success. The market for modified
concentrated whey and whey products has been limited, but
biological treatment technology should be available to help
cope with some of the resulting environmental problems. A
method or methods are needed not only to u tilize whey for
food and feed but also to solve i t s pollution-potential
problems. One such method is yeast fermentation, which brings
about both objectives and produces a highly nutritious food

3
and/or feed and reduces the pollution-potential to a reason
able level at which an oxidation pond could complete the
final oxidation to a safe effluent. The high protein and
vitamin products that are produced by th is method could be
used increasingly in human food to alleviate the wovld wide
shortage of protein.
The selection of the type of yeast to be used depends
upon its ab ility to u tilize lactose and/or lac tic acid. The
common types of yeasts which were capable of u tiliza tion of
lactose and/or lac tic acid were included in th is study:
Kluvveromvces fra q ilis . Torulopsis sphaerica and Candida
u t i l i s .
Many workers (1, 3, 12, 64, 90, 93, 94, 96, 97, 99)
have investigated the use of K. fraq ilis in the fermentation
of whey either to solve the pollution problem and/or to pro
duce more nutritious products than whey i ts e lf . This yeast
used lactose as an energy source and gave satisfactory yields
of protein in the form of yeast cells and high COD reduc
tions from original values. Other species of yeast such as
sphaerica and C. u t i l is have only received limited atten
tion as a means of u tiliz ing whey nutrients.
Whey fermentation has been considered to be an excel
lent method in some European countries for u tiliz ing surplus
whey. I t was concluded by Reesen and Arnold (68) that

4
fermentation of whey offers the best solution to the whey
problem because of the production of a protein-rich product.
Kaminske (36) stated that fodder yeast (animal feed) pro
duction on a whey medium was recommended as the most sa tis
factory means of whey u tiliz a tio n in Poland.
REVIEW OF LITERATURE
I* World Whey Production
The extent of the world whey problem is d iff icu lt to
determine accurately. In 1973 the Food and Agriculture
Organization of the United Nations (42) published data as
reported in Table 1 on the estimated production of whey in
selected areas.
Whey, the liquid residual of cheese and casein manu
facture, is one of the largest reservoirs of food protein
s t i l l remaining outside human consumption channels as reported
by Krostitz and Zegarra (42) on the work of Mathis. World
whey output, approximately 74 million tons in 197 3, contains
some 0.7 million tons of re la tively high value protein,
which is equal to the protein content of almost 2 million
tons of soy beans. Yet, despite the chronic protein shortage
in large areas of the world, a considerable proportion of
to ta l whey production is s t i l l wasted. In recent years there
have been e ffo rts to make greater use of th is protein source
as the economic developments in 1973, which led to s ig n ifi
cantly higher prices for major protein commodities on world
markets, have resulted in an in tensification of the effo rts
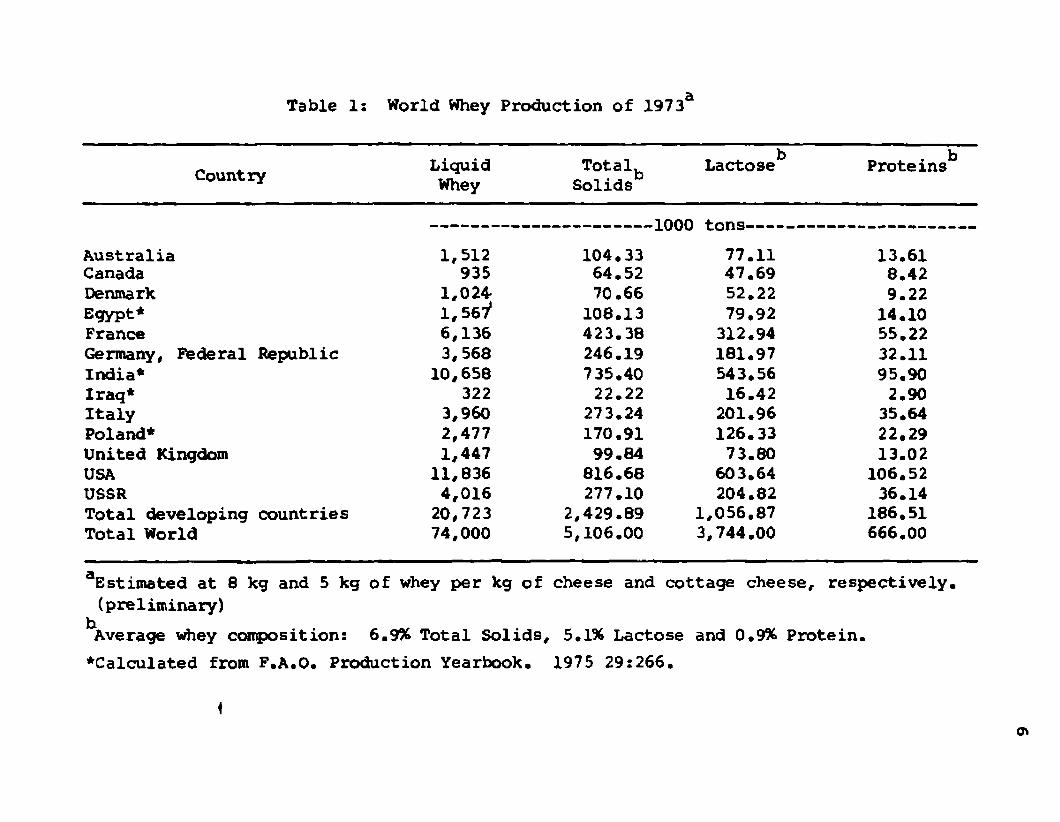
Table 1: World Whey Production of 1973a
CountryLiquidWhey
TotalbSolids
LactosebV
Proteins
Australia 1,512 104.33
-1000 tons---------------
77.11 13.61Canada 935 64.52 47.69 8.42Denmark 1,024 70.66 52.22 9.22Egypt* 1,567 108.13 79.92 14.10France 6,136 423.38 312.94 55.22Germany, Federal Republic 3,568 246.19 181.97 32.11India* 10,658 735.40 543.56 95.90Iraq* 322 22.22 16.42 2.90Italy 3,960 273.24 201.96 35.64Poland* 2,477 170.91 126.33 22.29United Kingdom 1,447 99.84 73.80 13.02USA 11,836 816.68 603.64 106.52USSR 4,016 277.10 204.82 36.14Total developing countries 20,723 2,429.89 1,056.87 186.51Total World 74,000 5,106.00 3,744.00 666.00
aEstimated at 8 kg and 5 kg of whey per kg of cheese and cottage cheese, respectively, (preliminary)
Average Whey composition: 6.9% Total Solids, 5.1% Lactose and 0.9% Protein.
^Calculated from F.A.O. Production Yearbook. 1975 29:266.
o\
to recover the nutrients of whey.
Krostitz and Zegarra (42) reported that in the United
States almost half of the to ta l whey supply was fed to liv e
stock, used for fe r t i l iz e r , or discarded as waste. The
Federation of United Kingdom Milk Marketing Boards e s t i
mated that stockfeeding accounted for about a th ird of the
to ta l whey output in Great Britain and Northern Ireland,
while in the Federal Republic of Germany approximately one-
fourth of the to ta l whey produced was sim ilarly used. In
Denmark, the proportion of whey returned to farmers for ani
mal feeding was reported to be over 90%, probably the highest
among developed countries. However, available information
suggests that the proportion of whey used in liquid form is
declining in most developed countries.
In the United States, approximately one-half of the
to ta l whey output is now processed, compared to only a th ird
in I960. Drying accounts for most of the to ta l processing
in the United States although production of condensed whey
and lactose has also increased in recent years. The present
proportion of to ta l whey production that is dried is about
40% in the United States, 37% in Canada, 30% in the European
community, 35% in Austria, and 65% in Finland. Whey powder
has been commonly used as a feed supplement for calves,
poultry, and other farm animals and as an ingredient for a

8
large number of food items such as pastries, ice cream, and
melted cheese. Because of the strengthening of antipollution
measures and the expansion of markets for dry Whey, output
is likely to increase further even though market prices are
currently depressed. The manufacture of dry whey however,
requires large in it ia l capital investments and operation
costs, particularly fuel, which puts a limit on i ts product
ion at the present time (42) •
Krostitz and Zegarra (42) also stated that the scar
city of s ta tis tic a l information on feed and food use of
liquid whey precludes a proper calculation of the amount of
whey not utilized* I t is estimated that in many developed
countries at least 50% of the to ta l supply of whey has been
dumped in recent years* More precise indication on u n -u tili-
zed whey has been available only for Austria and the United
Kingdom* In Austria, 63% of the to ta l whey supply was dumped
in waterways in 1971, and in the United Kingdom the propor
tion of wastage was roughly 50% in 1972-73, The proportion
not u tilized seems to be the lowest in North America, Scan
dinavia, and the Netherlands, whereas in large cheese pro
ducing countries such as France, Ita ly , and Germany, waste
probably accounts for well over half of the to ta l supplies*
The non-utilized half of whey production is a waste
and is a problem in the dairy industry, because of its
9
polluting effects on the environment.
I I . Disposal of Whey
The discharge of any industrial waste material, p a rti
cularly organic wastes, inevitably creates a disposal problem
and often causes nuisances such as odors or septic conditions
far from i ts point of origin. The litera tu re review reported
by Wix and Woodbine (10 5) specifically indicated that dairy
wastes including whey from cheese factories constitute such
problems•
The most likely places of whey disposal are the sewer
or a stream. The k illing of fish and the loss of aesthetic
value of many rivers have recently drawn attention to indus
t r ia l negligence in the disposal of many waste materials.
Acid milk products such as whey have been reported to be
toxic to fish in as great a dilution as 1 volume of whey
to 25 volumes of water (105)•
All organic materials have what is termed a biochemi
cal oxidation demand (BOD) which is expressed as "the quan
t i ty of oxygen u tilized by the biochemical oxidation of
organic matter in a specific time at a specified tempera
ture" (American Public Health Association 1971) (2). I t is
not necessarily the same as the oxygen requirements in chemi
cal combustion, because of the selectiv ity of the organisms
involved. I t is determined by the availability of organic

10
matter and by the amount of oxygen u tilized by the micro
organisms during the oxidation of the organic matter. For
exanqple, the complete oxidation of lactose to C02 and H O
requires 12 molecules of oxygen and 1 molecule of water:
C12 H22 ° 1 1 + 21 ° 2 + H2 ° * 1 2 C 0 2 + 1 2 H2 °
342 12(32) 1
The theoretical BOD of lactose not normally attained
by microorganisms can be calculated as 12 molecules of oxygen
and the oxygen from 1 molecule of water or 400 g of oxygen
per 342 g of lactose. This is equivalent to 1,140,000 ppm.
Since undiluted whey contained from 4 to 6% lactose, the
theoretical BOD of th is solution would be about 40,000 to
60,000 ppm. This is at least 100 times stronger in polluting
character than an equal volume of crude domestic sewage. In
addition, whey contains some protein and fat which in turn
increases the oxygen needed for to ta l oxidation (105).
Investigations by the Water Pollution Research Labor
atory in Great Britain as reviewed by Wix and Woodbine (105)
indicated that the BOD of th irteen samples of whey varied
between 38,000 to 46,000 ppm. Whey washings from factories
containing 1% whey were reported to have a BOD of 420 ppm,
but on many occasions concentration of whey in washings from
factories in Great Britain have been found to exceed IX. In
the United States the Gurriham study reported by Wix and
11
Woodbine (105) indicated that over 10,000 ppm of BOD were
commonly found in the water from chemical industries, dairies,
canneries, refineries, and breweries, while 200 ppm has been
regarded as average for municipal sewage. They also reported
on the work by Southgate in Great Britain, who noted that the
estimated population equivalent, based on the domestic sewage
of a factory handling 10,000 gallons of milk per day, would
be about 2,800 persons. This closely compares with United
States data of Ruf and Warrick (71) which indicated a popu
lation equivalent of 1,420 to 3,500 persons from dairy plants
of about the same daily volume.
From the above information i t is evident that the
discharge of whey into a sewage system w ill create a disposal
problem unless dilution with other materials reduces the BOD
to a more comparable level. To counteract the loss of oxygen
from the addition of whey, the level of oxygen must be main
tained from atmospheric absorption or plant photosynthesis.
The effect of large discharge volumes of high BOD material
in streams can therefore influence water quality over a
distance of many miles from the point of entry.
Wix and Woodbine (105) have reported on practical
methods involved in disposal of whey and dairy wastes in both
Great Britain and the United States. They indicated whey
washings were more d ifficu lt to handle than whole milk

12
washings because of the high lactose level in relation to
other components. While whey supports a high level of
microbial growth, development of acidity from lactose would
be detrimental to any biological method of treatment in sew
age plants as the acids tend to preserve and prevent to ta l
oxidations. One method of pretreatment used in both the
United States and Great Britain has been the addition of
lime as an acid neutralizing agent. When lime was added
before whey waste was discharged to municipal sewers, develop
ment of acidity and accompanying odor nuisance were retarded.
Aeration of dairy wastes has become a common practice
in both countries. In the activated sludge process the micro
organism rich sludge from the milk c la rif ie r was pumped to
the aeration tank to increase bacterial numbers and help
the aerobic oxidation process.
Experiments carried out in Great Britain by the Water
Pollution Research Laboratory (105) indicated that aeration
of liquids containing a mixture of 1% whey and 0,2% milk
for 22 h with activated sludge reduced the BOD from 500 ppm
to less than 10 ppm. The optimum temperature was found to
be 30 C, and as washing solutions were often above th is
temperature, the 30C during waste treatment was easily
maintained during most of the year.
From February to May, Wix and Woodbine (105) noted
13
that the effluent quality of whey washings was low due to
the low atmospheric temperature as the BOD was reduced from
550 to only 34 ppm. As the atmospheric temperature increased,
the effluent quality improved. The samples tested during
the high ambient temperatures of the summer (after aeration
for 36 h) gave a BOD reduction from 830 to 6 ppm, Backmayer
(7) suggested that i f whey was used to replace "sluicing"
water for mixing with ground garbage prior to sludge diges
tion, the need for raw sewage could be eliminated.
Jackson and Watrous (33) stated that milk solids have
a ratio of 51 parts lactose to 37 parts protein and, although
th is was capable of supporting microbial growth, any serious
deviation would interfere with metabolic activity and cell
reproduction. Whey solids which contain 71 parts lactose
to only 13 parts protein were reported to be insufficient
in protein for cell formation. They suggested the addition
of 22 lb of ammonium sulphate per 1000 lb of whey prior to
aerobic treatment for best resu lts,
Wix and Woodbine (105) reported that when whey and
milk washings have been treated in percolation f il te rs , a
single f iltra tio n resulted in a clogged f i l te r due to the
accumulation of fungal hyphae and fat globules. Effluent
standards were exceeded and odor problems were created i f
prior fermentation was used. The most satisfactory method
1 4
known in Great Britain is the alternating double f iltra tio n
method. In th is method, part of the final effluent was
mixed with the incoming raw liquid. The wastes were allowed
to percolate slowly through beds of coarse rock or other
inert materials, and breakdown occurred by metabolizing
microorganisms in films on the rock surface. F iltration was
accomplished through two percolating f i l te rs in a series. A
periodic reversal in the series, approximately every two
weeks, was needed to control clogging of the f i l te r s . Fur
ther reports from these reviewers (105) showed that whey
washings with a BOD range of 560 to 830 ppm yielded effluents
with BOD ranges of 13 to 29 ppm afte r the f ir s t f i l te r and
6 or 7 ppm after the second f i l te r . Treatment by th is method
was most effective in the 20-30 C range. The microbial films
formed on the surface of the f i l te rs by whey washing were
more tenacious than those formed in the milk washings.
These films were not easily removed when the order of the
f i l te rs in series was changed.
The above method corresponds to the two stage tr ic k l
ing f i l te r method which has been satisfacto rily used in the
United States.
Wastes from cheese factories and dairies contain very
l i t t l e suspended matter; most of the organic constituents
present are sugar, protein, and fats in true or colloidal

15
solution. Screening and settling operations do not cause
any d ifficu lty and are often omitted en tirely . Occasionally
a simple strainer of cheese cloth or line wire gauze has
been used. Prior storage of wastes must be avoided i f
trickling f i l te rs are to be used because acidic wastes can
not be treated as effic ien tly .
Wix and Woodbine (105) reported that the Guggenheim
activated sludge process as previously used in the United
States resulted in a BOD reduction of 90% in dairy waste
containing 400 ppm. In the United States process, approxi
mately 100 ppm of lime and 40 ppm of ferric chloride were
added together with the return sludge. Aeration of 2 to 4 h
was provided using 2*j cubic ft of a ir per gallon of waste.
The settling time was reduced to 1 to 2 h which was suffi
cient because of the heavy iron floe.
Anaerobic fermentation can be carried out in septic
and Imhoff tanks. Wix and Woodbine (105) indicated that
systems in both Great Britain and the United States which
u tilized these methods provided for sedimentation and anaero
bic digestion in the same tank, but since whey is low in
solids which se ttle , the f ir s t step was nu llified as very
l i t t l e sludge was produced. In addition, the tanks generally
needed to be seeded with sludge containing aerobic microor
ganisms. They (105) also indicated that in the United States
1 6
BOD reductions of 30 to 50% we re obtained by the combined
action of settling and anaerobic digestion* Results by a
British worker reviewed by Wix and Woodbine (105) noted that
a mixture of 3% whey in water did not change appreciably
during two days holding time, but that the concentration of
acid (as acetic acid) increased from 90 to 500 ppm. Alka
lie s , often present in dairy wastes as a result of cleaning
operations, tended to help the process by preventing the
development of a low pH. Low pH as a result of lac tic acid
can inhibit the growth of microorganisms, a common cause of
septic tank failures in the dairy industry.
The irrigation method of disposal was suggested for
factories in country d is tr ic ts with adjacent cultivated
fields as whey does have a limited fe r tiliz e r value (105)•
Results obtained by McDowell as reviewed by Wix and Woodbine
(105) indicated that seven acres could tolerate 20,000 gal/
day* Work by Schropp in the same review (105) noted that the
greatest response occurred with grasses, clover, and lucerne
on sandy rather than loam type so ils . In work by Tewes and
Gaud also reviewed by (105) i t was noted that the effect of
whey in the soil persisted for several weeks due to the stinu
la t ion of the bacteria in the top 10-15 cm. They were of the
opinion that the rate of water loss on sandy soils was re
tarded due to the binding effect of the polyuronic acids*

1 7
The success of Irrigation as a method of disposal depends
upon the so il type and winter temperatures. Areas subject
to flooding and water retention are worthless for th is
purpose.
In summary, treatment of dairy wastes in municipal
sewage plants has created additional problems in these sys
tems. Use of trick ling f i l te r s and activated sludge systems
have proven workable, but anaerobic systems have not been
successful. Other considerations for reducing the pollution
load must include industrial recovery of some of these wastes
as usable products.
I I I . Industrial Uses of Whey
A. Therapeutic and Pharmaceutical Value.
Wix and Woodbine (105) have reviewed th is aspect and
reported that whey and lactose were extensively used in
medieval practice. In th is review (105) Funck noted the
lack of appreciation of the merits of whey was peculiar to
the la s t decades of the 19th century. A case of blood poison
ing in which treatment included use of a whey extract in the
dressing was reported by Dietz in the same review (105). The
extract was considered to have remarkable therapeutic effects
followed by complete recovery. In the above review (105)
the Kraft Phoenix Cheese Company was reported to have patented

1 8
a process to produce a nu tritive and therapeutic product
from whey. Protein was removed by heat and f i l tra tio n . The
hot f i l t r a te was then treated with sodium carbonate u n til
the end point of phenolphthalein was reached. The resulting
precip itate was washed, dried, and ground.
In Arends work as reviewed by Wix and Woodbine (105)
whey was considered useful as a pharmaceutical due to i ts
content of la c tic acid, lactalbumin, and calcium phosphate.
A suggested method of use was as a substitute for d is tille d
water in tonics. Preservation of the whey was made possible
by boiling with 3 ml of sodium hydroxide per 1000 ml followed
by addition of 0.15-0.2% sodium benzoate.
In the same review (105) Isoa considered whey as both
a pharmaceutical and nu tritive food, and Springer suggested
the nutritive use of whey yeast with i t s high protein, carbo
hydrate, and vitamin content.
B. Concentration Treatments
1. Freeze Concentration
Anas' (4) method of producing a concentrated whey pro
duct for industry involved the following: A tank, 5 m high
was f ille d with freezing co ils and a refrigeration unit f itte d
at the bottom. During freezing, ice crystals formed and
floated to the top and were removed. There was a 10% loss
19
of solids in the sludge and the final concentrate contained
30% to ta l solids.
2. Condensing
I t was indicated in a review by Wix and Woodbine (105)
that Barnett found there was d ifficu lty in condensing whey
due to frothing, but i t could be controlled by the addition
of cottonseed o il and heating at 80 C under 15 inches Hg
vacuum.
Various condensed products have found an outlet in
stock feed. The main differences between the products are
the final to ta l solids content and the additives. In 1938,
Ramsdell and Webb (57) added a quantity of sugar equel to the
weight of whey solids to pasteurized whey and condensed the
mixture to 76% to ta l solids. Wix and Woodbine (105) reported
that Miller condensed whey to 45-50% to ta l solids. This pro
duct had a shelf l ife of 4 to 5 months. Wix and Woodbine
(105) reported that Tuft also produced a whey condensate with
35-50% to ta l solids for use in poultry rations. Wix and Wood
bine (105) reported that Anderson and Walters patented a pro
duct in which plasmolysed yeast mixed with whey was condensed
to 60% to ta l solids.
3. Drying
Whey which contains approximately one-half the solids
of the whole milk has a typical analysis as follows: to tal
20
solids 6,3%, lactose 70% t protein 12a5%, minerals 8.5%, plus
small amounts of fat, lac tic acid, and water soluble vitamins
(23) .
In a paper ti t le d "Industrial Processing of Whey To
day," Ward (91) of Foremost Foods Company noted that early
methods of concentrating and drying whey used the Simmons,
Buffalo-Vac, Peebles, and also the conventional standard hot
ro lle r milk dryers. The Simmons process concentrated whey to
very high solids and allowed the mass to cool and solidify
un til i t could be extruded on trays and dried in a tunnel.
Buffalo-Vac employed a steam heated, two-staged, double drum
configuration with the upper drums acting as a high concen
tra to r with the final drying accomplished on the lower drums.
Peebles used a combination of spray drying and rotary drum
drying where stab ility was achieved through the addition of
whey concentrate, much in the same manner as the modern p il l
machine functions.
None of these early processes was particularly e f f i
cient, and the infant industry made l i t t l e progress. The
inability to solve the problems of high manufacturing costs,
and the hygroscopicity of the dry product and the general
effects of the great depression of the 1930's seemed to be
insurmountable obstacles. The long tube multiple effect
vacuum evaporator developed by D. D. Peebles (91) was the
f ir s t significant development in whey processing. This type
21
of evaporator was f ir s t used for whey processing in 1933 and
provided a unit having high capacity* I t provided a tool by
which large quantities of whey could be condensed quickly
and efficiently into a manageable form either for immediate
drying or transfer to a centralized drying plant*
Wix and Woodbine (105) indicated in the ir review that
in the drying of whey one problem seemed paramount: the
formation of gummy substances which prevented efficien t
drying. I t was also reported that i t could be overcome by
addition of skim milk or cereal products to help film forma
tion in ro lle r drying. The work of Ward (91) indicated that
the invention of the hydrated spray was the second sign ifi
cant development in whey processing* Spray drying as a pro
cess was relatively new in the 1920's, having been pioneered
by C. E. Gray and Aage Jensen for the drying of skim milk.
Ordinarily spray drying, as practiced at that time, provided
anhydrous powder which, because of i ts hygroscopic nature,
was unstable and caked very rapidly unless carefully pro
tected from the a ir and moisture.
The hydrate dryer, developed by D. D. Peebles and
patented in 1937, was of great importance in the processing
of whey since i t provided a simple and rapid method of pro
ducing a stable non-hygroscopic, non-caking product. In
th is drying process, high solids whey concentrate obtained
2 2
from the conventional concentrating step was spray dried in
a desiccator to a free moisture content of 12 to 14%. At
th is moisture content lactose took on a molecule of water
and crystallized into the alpha-monohydrate form. This
caused whey solids to convert from a sticky, syrupy-like
material into a damp powder with good flow characteristics.
I t was removed from the drying chamber and subjected to fur
ther drying in a rotary drum or vibrating tray dryer to reduce
the free moisture. This produced a stable, non-hygroscopic
free-flowing whey powder with lactose in i ts hydrated form.
In addition to providing a stabilized, free-flowing, and
non-caking whey product, th is type of dryer, operating with
a rotary atomizer, provided high capacity drying and tended
to centralize the drying operation.
Wix and Woodbine (105) reviewed the work by McGlasson,
Petrovicki and Schaffernah who indicated that whey for spray-
drying was usually given some form of pre-treatment. Ion
exchange resins were used to precip itate mineral sa lts which
were then removed. The whey was then superheated to 300 F
and sprayed into a hot a ir cone. The resulting product had
good flavor and appearance.
4. Lactose Production
Lactose constitutes the greater part of the solids in
whey. The amount in whey varies between 4 and 6% and is
23
sufficient to warrant industrial extraction. Lactose is
produced primarily by whey concentration with the removal
of fat, protein, and mineral sa lts .
A great variety of pre-treatments must be given in
order to produce an almost pure lactose solution for concen
tration and purification. Ward (91) reported that there are
two main processes in general use today. The f ir s t is the
so called M & R Process in which the whey protein is chemi
cally solubilized, permitting concentration to higher than
normal levels. The concentrate is cooled to effect the cry
sta lliza tion of lactose which is then separated by centrifu
gation and a ir dried prior to packaging. The process provides
a high yield with a single crystallization step. The product
is of relatively high purity and suitable for infant foods
and related products.
The second process represents the more conventional
method in which whey is concentrated in somewhat lower levels
but without chemical solubilization of the protein. The
concentrate is cooled to affect the crystallization of lac
tose which is then separated in conventional centrifugal
equipment and finally a ir dried as a crude lactose. The
crude lactose is refined by decolorizing and filte rin g pro
cedures similar to those practiced in the sucrose industry.
Products of very high purity, can be produced by th is method,
24
including USP grade.
5. Ultrafiltration/Reverse Osmosis
During recent years two related membrane processes,
reverse osmosis (RO) and u ltra f iltra tio n (UF), have been
developed for whey concentration treatments. Both reverse
osmosis and u ltra f iltra tio n are based on the ab ility of
various polymeric membranes to discriminate between molecules
on the basis of molecular size and ion chemical composition.
While these terms are often used interchangeably, the follow
ing distinction should be made between these processes.
Reverse osmosis is that process in which virtually a ll
species except water are rejected by a membrane. The osmo
t ic pressure of the ion feed stream in such a system will
often be quite high. In order to achieve satisfactory water
flux rates through the membrane, such systems often u tilize
hydrostatic operating pressures of 600 psig or greater. On
the other hand, the term u ltra f iltra tio n refers to that mem
brane separation process in which the membrane is permeable
to relatively low molecular weight solutes and solvents but
is impermeable to higher molecular weight species. The per
meability and selectiv ity characteristics of these membranes
are controlled during the fabrication process so that they
will retain only molecules above a certain molecular weight,
& the “molecular weight cutoff." This cut-off point may be as
25
large as several hundred thousand for membranes designed
for the fractionation of high molecular weight species.
Many researchers (10, 30, 31, 32, 47, 48, 49, 50, 51, 72,
103) have investigated the use of RO and UF to solve the
dairy industry waste problem and the production of concen
trated whey at a low cost in comparison to drying. These
processes can provide a mean of fractionating and concen
trating cheese whey into liquid fractions containing a
variety of protein-lactose ra tio s. Some of the problems
that have been associated with these methods as indicated
by some of the above researchers were the economics, and the
re liab ility and life of the membranes as well as the sanita
tion problems associated with the introduction of these new
unit operations in the dairy and food industries.
Results indicated that concentrations up to 4:1 would
be practical but higher levels w ill be uneconomical due to
clogging from an accumulation of viscous materials and in
soluble solids. McDonough and Mattingly (50) studied the
condition affecting concentration of cheese whey by RO.
Some of the major factors associated with th is process were
pressure, membrane porosity, feed rate temperature, and pH.
6 . Demineralization
Ward (91) stated that a recent major development in
whey processing has been the use of electrodialysis in the
26
demineralization of whey* Early e ffo rts in demineralization
of whey by ion exchange were not commercially feasible due
to the cost of regenerates and th e ir subsequent disposal,
sanitary problems, and the necessity of working at low solids
concentration. With the development of the permselective
membrane by Ionics, Inc., as reported by Ward (91) in the
1950's, i t became possible to develop equipment and pro
cesses which could economically demineralize whey to any
desired level at an acceptable capacity.
The achievement of a commercially feasible demineral
ization process, along with previously developed processes
for the removal of lactose and protein, has made i t possible
to fractionate whey to provide a wide variety of products,
each having specific and specialized functional character
is t ic s .
IV. Whey as Food or Feed
A. Human Use
In spite of the vast amount of lite ra tu re dealing with
the use of whey in human food manufacture, the position is
far from satisfacto ry . There seems to be a decided lack of
in terest in i t as human food, doubtless due to i t s poor
flavor and high sa lt content (101) .
27
Weisberg and Goldsmith (103) indicated that there are
two misconceptions. The f ir s t is that some believe the re
latively high mineral content of whey may adversely affect
food flavor. This is not generally the case because vrfiey
solids usually appear in food products at levels ranging
from 1-20% and usually less than 10%. Thus the mineral con
tent of whey is generally diluted 10 fold or imre.
The second misconception is that edible dried Whey is
an inferior substitute for non-fat milk solids. Actually,
whey contributes a unique set of functional properties in
cluding a flavor profile quite different from that of non
fat milk solids. There is some overlap for certain applica
tions, but each product plays a role of i t s own.
In the review by Wix and Woodbine (105), i t was indi
cated that the 0.2 to 0 .6% fat in raw whey may be centrifuged
off to give a product known as whey cream. The whey cream
can be heat treated and churned into butter. A variety of
whey cheeses have been produced, for example, a product
known as mysost or primost has been made in parts of Scan
dinavia for centuries. Other types of cheeses such as rico tta
and lmpasta are made from whey in different parts of the
world. Whey is also processed as a food ingredient for use
in such products as bread, processed cheese, sherbet, candy,
and infant formulas.
28
Webb and Whittier (102) indicated in the ir review many
uses for whey and whey products in food products. Whey solids
have been used by the confectioner in such products as fudge,
caramel, and toffee. I t has also been recommended that milk
solids containing casein be used to give the confection the
necessary chewy body. Whey has been used in the production
of gravie% soups, fru it juice mixes, and in many other food
products by mixing with wheat meal and potato starch follow
ing hot a ir drying. Whey solids contribute functional pro
perties of value in the formulation of convenience foods.
Work by Webb as reported by Satterlee (73) indicated that
various levels of whey solids in foods and food ingredients
made significant contributions to the final product.
Wix and Woodbine (105) have indicated that various
researchers over the world have been interested in whey
beverages. They stated that the majority of whey beverages
were fermented by an industrial microbiological process. A
typical product, unfermented whey lemonade, includes the
addition of flavoring and sweetening to deproteinated whey
followed by charging with carbon dioxide. Another concept
has included the addition of malt and/or hops to fermented
whey. Many others (17, 20, 43, 59, 61, 79) have suggested
that i t is desirable in a ll brewing processes to remove pro
teins as they are capable of causing cloudy deposits. Many

29
microorganisms have been used as cultures including bacteria,
yeast, and molds. The majority of methods favor the addition
of sweeteners and flavors. The greatest difference between
the products is whether or not malt is added.
B. Animal Use
G illies (23) stated that there are two possib ilities
to consider in feeding whey to livestock. The f ir s t , feed
ing liquid whey to animals, has had only limited success.
I t has become more d ifficu lt to deliver liquid whey to the
fanner, especially as the number of small cheese plants de
clines and the increased production is concentrated in large
operations. Because laws in many states prohibit the use of
milk cans to return whey to the farm, vtfiey tends to accumu
late at the plant prior to pickup by farmers. The second
suggestion is to recover the whey solids by concentration.
Concentration is an expensive operation, and there seems to
be general agreement that the concentrated products are best
used in human food. In the Wix and Woodbine (105) review,
Man has considered i t unprofitable to feed condensed whey
to livestock. Other researchers in the above review noted
that condensed or dried whey can be mixed with other material
such as wheat bran and fed to animals. Feeding these mater
ia ls has produced some satisfactory results; however, others
30
have noted that these feeds tend to cause soft or "watery”
flesh. Excess lactose has been found to be a laxative to
animals and to cause related digestive problems.
U tilization of whey as a silage additive was reported
in the review by Wix and Woodbine (105). They indicated
the process of silage production re lies on acid preservation
of green fodder by the digestion of part of the carbohyd
rates by microorganisms. High-protein green vegetable mater
ia ls are often low in carbohydrates, giving poor or undesir
able fermentations and an inferior preservation. In order
to insure sufficient carbohydrates to give the required pro
duction of acid, molasses has often been added to the crop
during ensiling. Whey has been used in many countries as
an alternative supplement. The lactic acid bacteria present
in the vegetation are able to readily convert the lactose
into lac tic acid. In the above review (105) Pette reported
that the microflora of the silage was not significantly
changed and that whey helped to overcome the carbohydrate
shortage. Other workers have found a greater increase in
acidity than with molasses while the loss of albumin from
the silage was less, and the recovery of dry matter and
the starch equivalent were higher. I t was suggested that
1-5% of whey could be used. Some researchers favored the
use of whey powder or whey paste; however, these products
31
have proven to be very expensive. I t was also expressed
that raw whey could be used even i f soured since the lac tic
acid would be helpful rather than detrimental to the process.
The cost of transport of the raw material back to the farm
presents major problems in i ts u tiliza tio n . The production
of silage is limited and seasonal, which seriously lim its
the volume of whey that could be u tilized .
V. Fermentation of Whey
A. Bacterial Fermentation
Wix and Woodbine (105), stated that the most important
organism used in the bacterial fermentation of whey is Clos
tridium acetobutvlicum. This organism is capable of an
acetone-butanol fermentation from which solvents may be ob
tained and/or the enriched medium used for riboflavin extrac
tion . Other types of bacteria such as Cl. butyricum and the
Propionibacterium species have been used for production of
propyl alcohol, acetone, butyl alcohol, and ethyl alcohol.
Lactic acid may be produced by fermentation with Stre
ptococcus la c tis or Lactobacillus bulqaricus as mentioned in
the Wix and Woodbine review (105). I t was also stated that
single strain cultures are not nearly as effic ien t as the
mixed cultures for fermentation of lac tic acid, although the
methods involved and the manner of extraction of the acid are
32
sim ilar. Boinot, as reported by Wix and Woodbine (105),
produced vinegar from whey by direct fermentation with
Lactobacillus acidophilus. Wix and Woodbine (10 5) in a
review of the work of certain researchers on th is subject
have indicated that the production of lac tic acid from whey
by mixed fermentation with a Lactobacillus, usually L. bul
qaricus and a Mvcoderma yeast was a process of considerable
importance. Webb and W hittier (10 2) found that by using a
mixed culture of Lactobacillus and Mvcoderma (American
Type Culture No. 9223) a 90% conversion of lactose to an
inactive mixture of and L-forms of lac tic acid was possi
b le. Another researcher in the same review reported a mixed
type of fermentation that could be applied to whey was the
production of Kefir grains. These grains were used in the
production of fermented milk and drinks, and may contain
la c t is , L. bulqaricus. Saccharomyces. and Torula yeasts.
B. Mold Fermentation
Three end-products of fermentation are mentioned speci
fica lly in the lite ra tu re : riboflavin, pen ic illin , and fa t.
The work by Sjostrom and Hakansson as reviewed by Wix and
Woodbine (10 5) noted that the production of riboflavin by
the mold Eremothecium ashbvii from whey was made possible
by supplements of sugar and trace elements. In th is review,
33
(10 5) McCallum reported on the production of penicillin from
whey; however, whey does not seem to have received any atten
tion in the field of deep fermentation penicillin production#
I t was also mentioned that the molds Oospora lactic- Endomvces
vernalis, and Penicillin iavanicum were capable of producing
fat when the whey was supplemented with nitrogen in the form
of urea or ammonium sulphate#
C. Yeast Fermentation
1. General
The purpose of growing yeasts in whey has been to pro
duce a product suitable for human food or for stock, or the
yeast may be secondarily used in alcohol or riboflavin pro
duction and pollution reduction. In the Wix and Woodbine
review (105), Browne produced alcohol with a number of yeasts
including Torula cremoris, Torula lactosa, and Torulopsis
sphaerica# Whey at pH 4,5 was supplemented with nitrogen
in the form of 0.013% ammonium sulphate and after a 20 to 46
h fermentation at 30 to 37 C the yield was 66 to 80% of the
theoretical maximum with the highest yield attained by
Torula cremoris.
The most satisfactory method of alcohol production
from whey was developed by Rogosa et al# (69) in which Torula
cremoris was reported to be the best lactose fermenting yeast

34
available. Boiled whey was adjusted to pH 4.7 to 5.0 and
the protein separated by f iltra tio n . After an inoculum of
1 lb of Torula cremoris was added per 120 gal of whey, the
mixture was incubated at a temperature of 33 C to 34 C for
48 to 72 hours. The yeast was separated and the mash dis
ti l le d . Based on the lactose consumed, alcohol yields of
90.73% in the laboratory and 84% in the plant were recorded.
Wix and Woodbine (105) stated in the ir review that
whey fermentation by yeast was not as commonly employed as
were bacteria for the production of vitamins. In th is re
view (105), Christopherson and Holzweissing were reported to
have investigated thiamine, riboflavin, and nicotinic acid
synthesis by Torulopsis kefvr. Torulopsis sphaerica. Sacchro-
mvces species and Zyqosaccharomvces lac tis in whey medium.
Candida krusei. Torulopsis u t i l i s thermophilus and
Torula cremoris were investigated by Graham as reported by
Wix and Woodbine (105), and only the Torula cremoris was con
sidered satisfactory as a lactose fermenter. In the same
review (105) Enobo et a l. investigated Torula lactosa. Toru
lopsis Candida. Torulopsis sphaerica and Saccharomyces fragi-
l i s and noted that Sacch. frag ilis gave the most rapid growth.
Porges et a l. (65) have used Sacch. frag ilis as food yeast.
In general terms, Springer's work as reviewed by Wix and Wood
bine (105) stated that the cell yield obtained from whey
35
compared favorably with that of yeast obtained from molasses.
As early as 1958 Wix and Woodbine (105) concluded that, in
spite of the value of yeast as a food, attempts to popularize
i t have been rather unsuccessful as production has always
been in excess of demand. A British plant built in the West
Indies in 1945 to produce yeast from molasses was forced to
close through lack of an adequate market. There is very l i t t l e
purpose, therefore, in pursuing work on relatively large-
scale nutrient yeast production for the sake of the yeast
production alone.
2. Saccharomyces frag ilis
Sacch. f ra g ilis . found in many dairy products, has
the capability of u tiliz ing both lactose and lac tic acid
under both aerobic and anaerobic conditions. This yeast has
been used by many workers for the production of single cell
protein. Most of the work has been related to the increase
of protein or nutritive value of whey, and production of
fodder yeast which also served to aid in the disposal of
whey and other dairy product waste.
Many workers (1, 3, 12, 20, 38, 39, 54, 64, 81, 93,
94, 96, 97, 99, 100) have involved themselves in studies
related to the optimum condition for growing Sacch. f ra g ilis .
Some of them (1, 3, 10, 13, 20, 64, 70, 81, 92, 97, 98, 99,
100) were interested in the yield of dry yeast cells and have
36
tried to increase these yields by supplementation of the
growth medium. The supplements used were 0.5% (NHJ -SO.,4 2 4
0.5% I<2 HP04, 0.1% yeast extract or beef extract, corn steep
liquor, vitamins* and some trace metals. Wasserman et a l.
(99) indicated that th is yeast gave a high solid recovery
in the presence and/or absence of the whey proteins, but
supplementation with nitrogen, phosphorus, and yeast extract
for growth factors was necessary. Wasserman (94) found that
Sacch. frag ilis u tilized approximately 50% of the ammonia
nitrogen, 25% of the organic nitrogen, and 25% of the to ta l
nitrogen of whey. Surazynski (79) found that the highest
B-D-Galactosidase activ ity of Sacch. frag ilis (NRR LY-1109)
was obtained on a medium consisting of whey with 1% (NH4) 2 ^ 4
and 0.05% MgS04 or 1% (NH4) S04, 0.5% HP04 and 0.05%
MgS04* He also stated that 1% of Difco yeast extract in the
whey medium reduced the B-Galactosidase activ ity . Knight
et a l. (38) reported that Sacch. frag ilis u tilized 20-40%
of protein, probably the non-protein nitrogen in original
cottage cheese whey after the organism exhausted the lactose
from whey.
Reports in the lite ra tu re (3, 13, 20, 38, 39,96, 99,
100) noted that Sacch. frag ilis would grow over a wide pH
range, from 3.0 to 8.0, with the optimum pH values from 3.5
to 5.7. Popova et a l. (65) noted in their studies with the
37
enzyme lactase obtained from Sacch. frag ilis that the enzyme
was active at pH 6-7 but inactive at pH 5.0, however, Wen-
dorff e t a l . (104) found that maximum lactose yields were
obtained a t pH 4.0-4.5* A pH of 4.0 to 4.7 was found by
Surazynski (81) to be very satisfactory for the production
of B-D-Galactosidase from Sacch. f ra g ilis .
Most workers have stated that Sacch. f ra g ilis grows
at temperatures ranging from 5 C through 46 C and have recom
mended an optimum of about 30 C (46). Knight et a l. (38)
indicated that a temperature range of 35-40 C was found to
give an optimum growth temperature for Sacch. fra g ilis in
cottage cheese whey. Many researchers (3, 81, 86 , 94, 96,
97, 99, 100, 104) have used temperatures between 28-32 C for
growing Sacch. fra g ilis in whey medium. Popova e t a l. (65)
found that the optimum temperatures of the enzyme lactase
(B-D-Galactosidase) obtained from Sacch. frag ilis in milk
was 30-40 C but, in concentrated milk at 32-44% to ta l solids
i t was 40-50 C. Fonden and Petterson (20) reported that a
temperature of 38 C was essential in the fermentation of
whey by Sacch. f ra g ilis .
Many workers have discussed the optimum amount of
inoculum that should be used for yeast fermentations. Studies
by Porges e t a l. as reported by Wasserman e t a l. (100) on
dairy waste have shown that the rate or removal of soluble
38
matter from an aerated solution was directly proportional
to the quantity of cells present. Wassermen et a l. (100)
studied levels of inoculum of 300 x 106 to 2,000 x 106 c e lls /
ml and found that by increasing the size of inoculum the time
necessary to reach the maximum yield was decreased. The
highest quantity used, 2,000 x 10 cells/ml, resulted in a
maximum yield of 23.5 mg/ml in 3 h with a final cell count
of 4,560 x 10^/ml. As the size of the inoculum increased,
the time required for removal of lactose from the whey de
creased. Lactose was completely removed in 3-4 h when the
maximum level of inoculum was used. The dry weight of 2,000
x 106/yeast cells/ml was found to be 25 to 30% of the weight
of the lactose present. Wasserman (91) has indicated that
by inoculating with yeast equal in dry weight to approxi
mately 30% of the weight of the lactose in the medium a 4 h
growth cycle was possible. He also stated that with lower
level of inoculum (3.5 g /lite r) the maximum yield was attained
in 8 h but, with an inoculum of 23.6 g /l i te r the maximum was
reached in 3 to 4 hours. Wasserman et a l. (99) indicated
that as the inoculum size increased from 3000 x 106 to 2100
x 10 ce lls per ml, the time required for complete removal
of lactose was reduced from 6 to 3 hours.
Many workers (3, 11, 20, 24, 38, 39, 44, 54, 55, 57,
58, 59, 64, 65, 77, 86, 87, 92, 100) have been interested
39
in controlling the surplus whey problem by growing yeast,
specifically Sacch. frag ilis . in order to u tilize the whey
nutrients and at the same time produce yeast cells for pro
tein production and supplementation. The yield of yeast
cells from whey has been found to vary between workers be
cause of the variations in the medium supplementation and
environmental parameters such as inoculum size, temperature,
a ir flow, time, etc. Variations in yield have been reported
to range from 5 g dry c e l ls / l i te r to 23 g dry c e l ls / l i te r by
Knight et a l. (38) and Wasserman et a l. (99), respectively,
with the variations largely due to different environmental
parameters. Wasserman et a l. (96) and Wasserman (94) used
very large inoculums, (25-30% of the dry weight of lactose),
high agitation rates, 3,000 RPM, and high aeration rates 4
v/v/min with unfractionated cheese whey. With these para
meters, yeast yield was 62% in comparison to 40-45% of the
lactose present as reported in ea rlie r work by Wasserman
e t a l. (99). Amundson (3) however, reported that a yeast
yield of 31.5% of lactose was obtained under batch forma
tion condition.
The amount of oxygen required by K. frag ilis to
u tilize the most whey nutrients and assure maximum growth
was studied by many workers (92, 93, 96, 97, 99, 100). The
value that most workers reported was 100-120 ml oxygen/

4 0
liter/m in. Researchers have found that oxygen may be the
single most limiting factor in determining yeast yield. Air
flow rates ranging from 1/4 to 4 volumes of a ir per minute
per volume of medium have been widely recommended (38, 54,
70, 86, 92, 100).
Use of very high agitation speeds, 3,000 RPM by
Wasserman et al.(92, 93, 96), in their work resulted in
some 02 incorporation; however, Bechtle and Claydon (9)
used an agitation speed of only 300 RPM in their work on
accelerated fermentation of cheese whey with mixed types of
yeast and bacterial cultures.
Vananuvat and Kinsella (85) have reported on the
amino acid composition of both the intact cells of the yeast,
Sacch. f ra a il is . grown batch wise and that grown continuously
on crude lactose and extracted proteins. The compositions
of whole cells of Sacch. frag ilis grown under the different
conditions were quite similar with a relatively high content
of lysine and leucine. The concentration of amino acids in
yeast protein isolates have varied with sample preparation
methods. Yeast protein extracted with water and heat pre
cipitated at 80 C and pH 6.0, contained the greatest amount
of essential amino acids. Methionine and tryptophan were
apparently the most limiting amino acids in a ll protein iso
lates prepared from Sacch. f ra g ilis .
4 1
Wasserman (95) found that, qualitatively, the amino
acid composition of Sacch. frag ilis was similar to that re
ported for other yeasts. The quantity of the individual
amino acids, however, was greater in Sacch. frag ilis grown in
whey medium than in that reported for other yeasts. Lysine
was present at a level of 11.14 g/16 g N, compared to the
range of 3.8 to 6.9 g/16 g N produced by other microorganisms.
An extraction procedure applied to whole, dried Sacch.
frag ilis cells designed to fractionate dry cell protein re
moved 40% of the to ta l weight and 28% of the N of the cell
preparation. The qualitative amino acid composition of the
residual protein fraction was the same as that of the whole
ce lls . However, the amounts of the component amino acids
varied widely with a variation of 35% in the amount of h is t i
dine to 100% of the serine and valine in the whole cell pre
paration.
Thiamine, pyridoxine, riboflavin, niacin, folic acid,
pantothenic acid, p-aminobenzoic acid, choline, inositol and
biotin were present in Sacch. frag ilis cells in concentra
tions within the range reported for other microorganisms.
Many researchers (5, 19, 24, 44, 58, 59, 89, 90, 99)
reported that Sacch. frag ilis along with other types of yeast
and/or bacteria used as mixed cultures may help solve the
problem of the surplus whey and in turn produce protein and

4 2
vitamin-rich by-products that can be used in human food or
animal feeds. The conditions and procedures followed in
these studies were essentially the same as in pure culture
research. Supplements have been used to enrich the whey
for maximum u tiliza tion of lactose and production of yeast
ce lls . Aeration and agitation have normally been used to
insure the assimilation of lactose and provide the necessary
energy for rapid yeast cell production; whereas, a fermen
tation that produces lac tic acid with reduced yeast product
ion will result from reduced agitation and aeration. Temp
eratures and pH have been found to be essentially the same
as for a pure culture but time was dependent on the ino
culum size with a mixed culture requiring greater levels of
inoculum than when a pure culture was used.
The reduction of Chemical Oxygen Demand (COD) of
whey varied according to the differences in the experimental
conditions. Vananuvat and Kinsella (86) grew K. frag ilis
in reconstituted whey composed of 2% lactose plus nitrogen
and other supplements. The highest COD reduction was 75%
which was slightly lower than when K. frag ilis was grown
in diluted milk waste or Ita lian cheese whey (3, 65).
Knight e t a l. (38) used K. frag ilis in cottage cheese whey
and found a COD reduction of 70-80% during 8-12 h of incuba
tion . The reduction of COD varied according to inoculum

4 3
size, added supplement% and time. He also reported that a
reduction of 55% was obtained when the inoculum size was
minimal, 5% or 5 x 10 6 cells/m l. Mickle et a l. (54) reported
that with an in it ia l inoculum of 100 x 10 6 cells/ml in cot
tage cheese whey, the COD was reduced 82 - 2% in 10-11 h and
93 - 2% in 24 h, a greater reduction than reported by most
workers. Fonden and Petterson (20) reported that when K.
frag ilis was used to ferment an u ltra f il tra te supplemented
whey, the lactose content was reduced by 99% and COD by 95%.
Supplements included 1.3-1.6 g nitrogen, preferably urea, 10
mg niacin, 0.01 mg biotin and 1 g maize steep liquor solids,
preferably at pH 3.5 on a per l i t e r basis.
3. Torulopsis sphaerica
T. sphaerica. as described by lodder (46), can assimi
late lactose but not lac tic acid. There has been l i t t l e re
ported activity in respect to th is yeast and, then, only in
combination with other types of yeast and/or bacteria.
Bechtle and Claydon (9) used th is yeast with other yeast
cultures and bacteria for the ir process of accelerated fer
mentation of concentrated cheese whey at a pH of 5.3 and an
incubation temperature of 32 C. The levels of a ir used
varied according to the treatment and were 650, 1,250 and
1,650 ml of a ir per minute per three l i te r s of medium while
the time of fermentation ranged from 30 to 144 hours.
4 4
Nakanishi and Aria (60) reported on the activity of
T. Bphaerica (J 29) when incubated at 30 C for up to 20 days
in recombined skim milk, recombined whey, and a lactose pep
tone yeast extract medium. The recombined whey medium gave
the lowest viable counts and the lowest acidity after 2, 4,
and 7 days. Whey protein patterns of the yeast cells varied
l i t t l e during incubation.
Tomisek and Gregr (84) selected 4 strains of T. u t i l is
for a p ilo t plant study which u tilized a tank of 20,000 l i te r s
capacity and a a ir turbine 50 cm in diameter. The fermenta
tion required 8 h at 30 C and gave a yield of 51-54% yeast
solids per unit of lactose fermented. The final lactose con
tent of the whey was 0.2-0.8 percent. Zalashko et a l. (109)
studied the growth of T. Candida F.K., and accumulation of
yeast biomass in various types of whey. Dried yeast yields
from raw whey were much lower than in sterilized or heat
treated whey at 95-98 C for 1 h because of the competitive
growth of low yielding wild yeast. Yields of dried cells
of T. Candida F. K. grown in rennet and tvorog wheys in coni
cal fermenters at 26-28 C and an aeration rate of 0.8 g 02/
l i te r /h were higher with the sterilized wheys than with heat
treated (95-98 C for 1 h) wheys. The yields were best after
a previous heat treatment of 120 C for 10 min without a pH
change for rennet whey and with pH raised with NH for

4 5
tvorog whey.
Zalashko et a l. (109) studied T. Candida P. K. with
tvorog whey under similar conditions and found the best
yield to be at an approximate aeration rate of 1.44 g 0^/
l i te r /h and a fermentation temperature of 20-22 C. He used
an inoculum level equivalent to 15-25% of the in itia l weight
of lactose in the medium.
Siman and Mergl (76) reported that several strains
of Torulopsis were adapted to lactose u tiliza tion and Bolid
media and then grown in diluted deproteinized whey with
added N and P supplements of NH. NO,- KNO,- NaNo,. NH Cl,4 3 3 3 4
(NH4) 2 S04# (NH4) H2 P04, (NH4) 2 HP04 and Na2HP04. The
media contained 2-2.5% lactose with shaking at a rate of
96 oscillations/m in. Inorganic N was best u tilized when
i t was present in the form of ammonium sa lts . Na2 HP04 had
some favorable effect when present at a concentration of
0.5-1.0 g /l i te r .
4• Candida u t i l i s
Krajovan e t a l. (41) investigated the use of 3 strains
of C. u t i l i s for the production of fodder yeast from whey.
These yeasts, with or without previous adaptations, were
used to ferment raw or heated whey. The highest yield of
3dry yeast material, 15.32 kg/m whey, was obtained when
heated whey was fermented by whey-adapted yeasts rather
than unadapted yeast.

4 6
Costamagagh and Rossi (15) reported on the use of 19
yeast species that were grown for 24 h at 30 C in whey ob
tained by acid coagulation of milk and heat deproteinization
at pH 5.5. I t was supplemented with 0.1% (NH4> P04*
Yields were based on percent ra tio of ce ll dry matter to
weight of organic matter metabolized which was considered
as measure of efficiency of lactose u tiliz a tio n in biomass
production. C. u t i l i s followed by Trichospora pullutans
were considered the most e ffic ien t of the yeast examined,
yields of these were 71 and 58% respectively vs 6.6-32%
for other species.
Davidov et a l. (16) selected Candida trop ica lis for
laboratory and semi-technical t r ia ls for fermentation of
whey. Whey supplemented with N and P was used to give a
high biomass yield of 95-10 5 g / l i te r . The fermented whey
containing the biomass contained approximately 4.8% to ta l
solids, 2.2% protein and increased amounts of some vitamins.
I t was subsequently u tilized without futher treatment or
spray-dried into a product containing 46% protein.
Zalashdo (106) investigated the use of 113 strains
of yeast of various species to determine th e ir a b il i t ie s to
grow in whey resulting from tvorog production. Yields of
18-30 g dry ce ll w t/lite r were obtained from 6 strains of
Candida humicola and 3 strains of c. curvata, without addition
47
of supplementary N and P sources. Optimum pH for growth
was increased with large inocula.
Graham et a l. (27) investigated the use of Candida
krusri for increasing the value of whey as an animal feed.
Use of th is specie resulted in poor u tiliza tion of whey and
a poor yield of ce lls .
5. Other Yeast Species
Graham et a l. (26) studied the use of Torula cremoris
for whey fermenting in a laboratory scale apparatus and found
the highest yield obtained to be 25-30 g y eas t/lite r of whey
with an increase in riboflavin content from 0.17-0.24 mg per
100 ml. Aeration of the medium increased the yield of yeast
and decreased the yield of alcohol. Concentration of the
whey decreased the efficiency of lactose u tiliza tio n .
Graham et a l. (28) also grew T. cremoris on commercial
cheese whey in a p ilo t scale fermenter for 48 hours. The sub
sequent product was ro lle r dried and formed a non-hygroscopic
powder containing 39% protein, 19% fat, 30% ash, and 12% N-
free extract with appreciable quantities of thiamine and
riboflavin.
6. Production of Fodder Yeast and Enrichment
Many workers (12, 15, 16, 22, 26, 27, 28, 34, 36, 37,
41, 45, 52, 56, 63, 74, 75, 83, 88, 106, 107) have reportedt
the use of one or more yeast species either m pure or mixed
cultures. The objectives of these workers were to produce
4 8
a better product nutritionally than whey i ts e l f . The pro
cedures used were to provide the optimum environment for the
growth of yeast. In some t r ia ls , fermented whey was concen
trated and dried for animal feed and, in other t r ia ls the
cells were separated and used as yeast powder. In most
cases, supplements of nitrogen and other important growth
factors were used to produce the maximum mass of ce lls .
The products that were produced by the above workers
and others (10, 20, 53, 80) were used for animal feed for
calves, mink, mice, poultry, and other animals. These pro
ducts were compared with other reference feeds such as skim
milk or whey alone.
Kaminski (36) has suggested that fodder yeast pro
duced in a whey medium was a most satisfactory means of whey
u tiliza tion in Poland, where cheese production is increasing
rapidly and where only 0.2% of the 1970 whey output of daily
co-operatives were industrially processed. Reesen and Arnold
(68) have also concluded that fermentation of whey offers
the best solution to the whey problem because the production
of a protein rich biomass and simultaneously leads to an
acceptable level of BOD reduction.
MATERIALS AND METHODS
An experimental laboratory scale fermenter was de
signed to determine the most favorable conditions of growing
Torulopsis sphaerica. Kluvveromvces frag ilis and Canadida
u t i l i s in a sweet whey medium. Prom previous reports (15,
23, 38, 60, 76, 92, 97, 99) these species appeared to offer
the best p ossib ilities for reduction of whey solids and for
yeast cell production. Parameters of th is study were based
upon daily operations of a cheese plant and, as nearly as
possible, equipment that would normally be found in such
plants. Lactose, to ta l solids, pH, titra ta b le acidity, pro
te in , yield of dry yeast cells, COD, BOD, and TOD were deter
mined on the whey before fermentation and on the supernatant
a fter yeast cells were removed. Individual t r ia ls for each
of the three species of yeast were made to determine the
optimum conditions related to temperature levels of 25 C,
30 C, and 35 C, inoculum levels of 0.17 and 0.27 g/dry yeast
c e l l / l i te r of whey, a ir flow levels of 1.0 and 1.5 l i te r of
a i r / l i t e r of liquid/min. An in it ia l pH of 6.0 and a fermen
tation time of 24 h were u tilized throughout the study. All
combinations of these yeasts were also subjected to optimal
4 9
50
conditions and examined in terms of the best combinations
for reduction in lactose, to ta l solids, protein, COD, BOD,
and TOD as well as the yield of dry yeast ce lls .
Experimental Fermentation Tank
Four stainless steel beakers, each with a capacity of
3.5 l i te r s , were located in a temperature controlled water
bath to serve as fermentation tanks. Air was supplied by a
pressure pump through a glass tube containing sterilized
non-absorbent cotton located after the pump. P lastic tubing
was used to deliver a ir to a circular a ir d istributor located
in the bottom of each beaker. Flow meters were located in
each a ir line along with a flow control in the line before
each beaker. See Fig. 1.
A controlled speed agitator with a 7.5 cm blade was
located in the center of each of the beakers to provide
additional mixing.
Whey Preparation
Non-homogenized, pasteurized skim milk was obtained
from the LSU creamery for a ll t r ia ls . Whey was obtained by
the use of cheese rennet which was added at the rate of about
0.15 ml/lb of milk (5 ounce/1000 lb) a fte r which the curd
was cut and separated from the whey by use of multifold
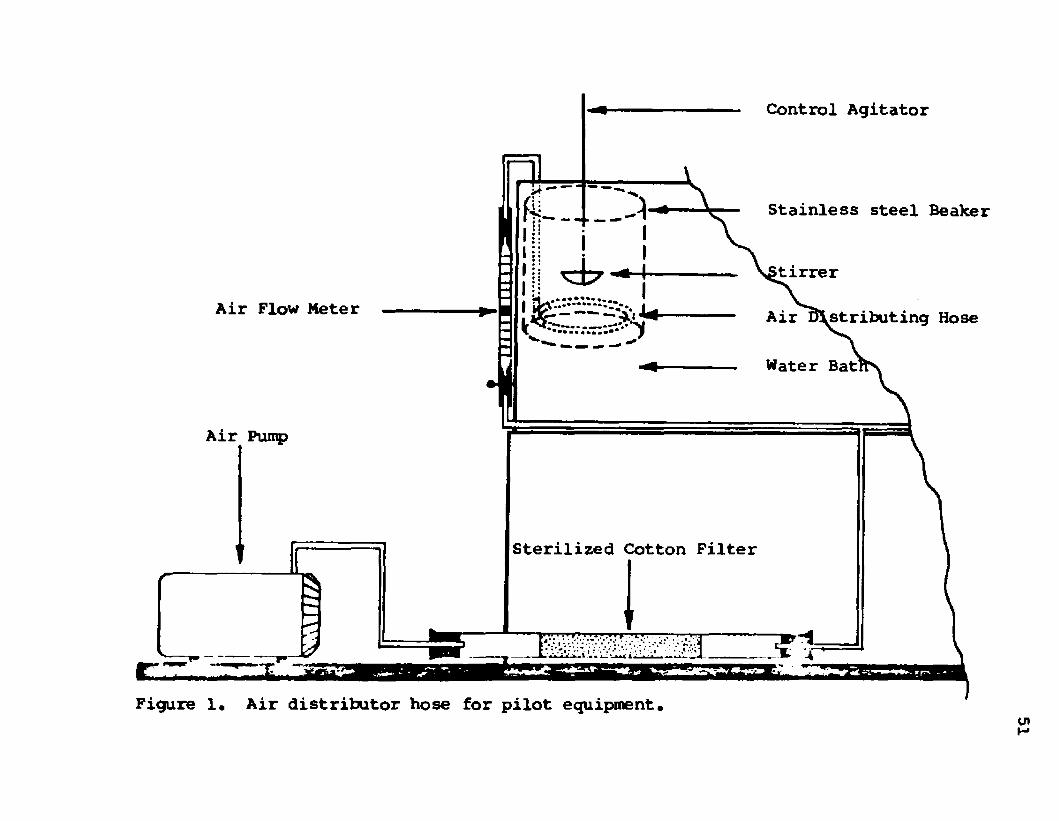
Control Agitator
Air Flow Meter
Air Pump
Stainless steel Beaker
tir re r
Hose
r a )
Water Bat
Sterilized Cotton F ilter
[ j t ; ■ ’ \ - . j • • ^ 5 - '
fa r awn mow.
Figure 1. Air distributor hose for p ilo t equipment.
52
cheese cloth. The whey was heated to 45 C after which H202
was added to a concentration of 0.0 396 H2o2. This mixture
was allowed to react for 30 minutes at 45 C after which i t
was cooled to 25 C. This process has been reported by Chun
et a l. (14) to accomplish a 99.9996 reduction in to ta l bacteria
count. A sterilized liquid form of catalase was added to the
cooled whey and allowed to react with the H202 for 20 minutes
or u n til negative to the KI te s t reaction (40)• To cross
check the accuracy of the above KI te s t the paraphenylene-
diamine dihydrochloride te s t for H2o2 was used. This te s t
w ill detect H202 concentrations as low as 1 part in 20,000
parts of whey.
The whey was adjusted to a pH of 6.0 with lac tic acid
and then divided into 2 l i te r portions in each of the four
stainless steel beakers. Weighed portions of yeast inoculum
were then added to the whey. The beakers plus whey and in-
oculum were then placed in the water bath and a fte r 30 min of
mixing, a sample was taken to prepare a direct microscopic
count smear to determine the cell count per ml of medium.
This was accomplished by mixing 1 ml of pasteurized skim milk
and 1 ml of the inoculated whey, a fte r which 0.01 ml was
2spread on a 1 cm area, a ir dried, heat fixed, and stained
by Newman-Lampert stain followed by a microscopic cell count.
The a ir was then introduced to the beakers and adjusted to
53
the desired flow rate . The fermentation was then allowed
to proceed for 24 h at a selected controlled temperature.
Inoculum Preparation
Original cultures of T. sphaerica. K. frag ilis . and
C. u t i l is were obtained from The American Type Culture
Collection (ATCC) in lyophilyzed tab le ts . Propagation was
accomplished according to the ATCC instructions (82). After
5 transfers in the recommended medium (lactose broth made
from 2% lactose, 1% peptone and 0.1% beef extract) for T*
sphaerica and YM broth for R. frag ilis and C. u t i l i s . the
cultures were transferred to whey followed by 5 consecutive
transfers to condition the cells to the whey medium. A
Potato Dextrose Agar or YM agar slant was prepared and in
oculated to retain the pure cultures during the course of
the research.
After incubation of the la s t transfer, the culture was
centrifuged at 3,000 to 4,000 RPM, (diameter 32 cm) for 10-12
minutes. The wet yeast cells were collected in sterilized
bottles and used the next day for inoculation of the whey UBed
in the various t r ia ls . Cells for inoculum for the subsequent
t r ia ls were obtained in the same manner but from the previous
t r ia l as subsequently indicated. After a fermentation time
54
of 24 h, the whey was placed in sterilized , p lastic , centri
fuge bottles and centrifuged for 10 min at 4,000 RPM. The
supernatant was collected and saved for analyses. The cells
were placed in s te rile bottles and held for use as inoculum
for the subsequent t r i a l . The yield of yeast was determined
by the difference in to ta l solids of the fermented whey
before and afte r the centrifugation process.
Chemical Tests
Lactose
The chloramine-T method devised by Hinton and Macara
(29) was used to determine lactose in whey before fermenta
tion and on the supernatant a fte r yeast cell removal. To
calculate lactose concentration in whey i t was necessary
to correct for the volume of fat and protein removed by
c larifica tion . This was accomplished by using 0.93 as the
density of milk fat and a volume exclusion of 1.11 ml/g for
protein as suggested by Jaynes and Asan (35). Lactose in
the aliquot was calculated by the equation: developed by
Jaynes and Asan (35).
% Lactose *
ml blank titr .-m l sample t i t r . X (N) Na2S2C>2 X
360.31 X 100
2 x m l sa m p le x 1 0 0 0
55
The principle of th is method is based on the reduction
capability of lactose when using an oxidizable material such
as chloramine-T. This method was used because lac tic acid
does not affect the results, whereas results of the polari-
scope method as found in our laboratory were greatly influ
enced by the presence of lac tic acid.
Total Solids
The procedure for determining to ta l solids of whey was
the same as the AOAC method for to ta l solids of milk (6) ex
cept that the size of sample was increased from 3 g to 5 g.
The to ta l solids were determined on whey before fermentation,
after fermentation and, on the supernatant after yeast cells
were removed. Whey samples were placed in aluminum dishes,
evaporated on the steam bath for 15 minutes, and followed
by heating in a hot a ir oven at 98-100 C for 3 hours.
Protein
The procedure for determining protein, Kjeldahl
nitrogen, of whey was the same as for protein of milk (6)
except that the size of sanple was increased from 5 g to
10 g, with percent protein equal to N x 6.38. The protein
of whey before fermentation, a fter fermentation, and on the
supernatant afte r yeast cell removal was determined. Kjeldahl
nitrogen of the wet yeast cells was determined by use of 1 g
sanple s •
5 6
pH Determination
The pH of a ll samples was determined by use of a
Corning Scientific Model 7 pH meter at 20-25 C. Sanqales
were analyzed before fermentation and on the supernatant
a fte r yeast cell removal•
Titratable Acidity
The titra ta b le acidity was determined according to
Goss (25) on whey samples before fermentation and on the
supernatant afte r yeast cell removal. Calculation of per
cent acidity expressed as lac tic acid was as follows:
ml. NaOH x N x 0.09 x 100 % T.A. = __________________________________
gm sample
Chemical Oxygen Demand
The COO was determined by the method outlined in
Standard Methods for the Examination of Water and Waste
Water (2). CODs were determined on whey before fermentation
and on the supernatant a fte r yeast cell removal, within 48 h
after collection from the experimental beaker. Samples were
stored at 4 C or below prior to analysis.
Biochemical Oxygen Demand
The Alsterberg or sodium acid modification of the
Winkler method was used to determine BOD5 values (2) . In
th is method, BOD determinations were made in itia lly and
a fte r 5 days with incubation at 20 C and expressed as BOD .
57
Samples were analyzed before fermentation and on the super
natant afte r yeast cells were removed.
Total Oxygen Demand
The TOD was determined by use of a Total Oxygen Demand
Analyzer (Ionics Model 225). The results of TOD aided in
determining the proper dilution for BOD and COD determina
tions.
S ta tis tica l Analysis
Analysis of variance, correlation coefficient and
orthogonal comparison were computed according to the methods
described by Snedecor (78).
The regression coefficient equation that was used
to calculate the relationship among various levels of whey
nutrients and oxidation demand is as follows:
„ d~x ,r X - bxy Oy xy
where: x - independent variable
y = dependent variable
r - correlation coefficient*y
<Tx = standard deviation of X
<fy =* standard deviation of Y
b ^ =■ regression coefficient
The above calculated relationships are presented in
Appendix Figures 1-5* The predicted values of y(Y) were
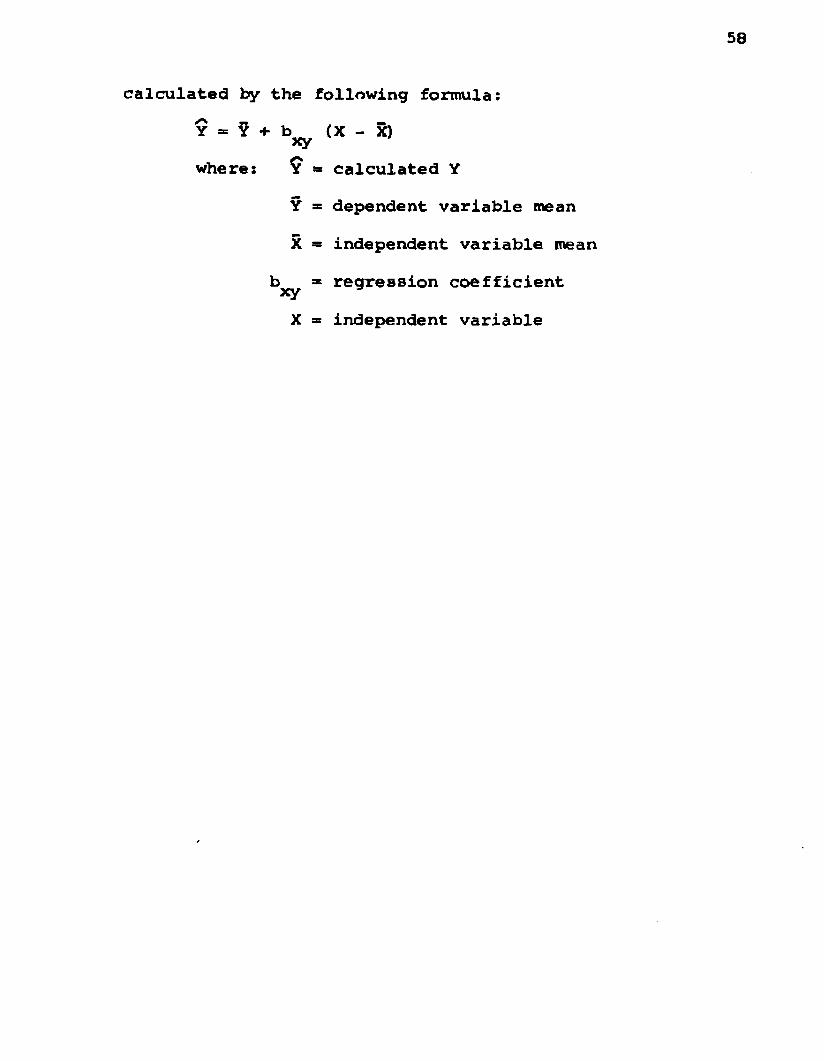
calculated by the following formula:
Y * Y + b (X - X) xy
where: $ * calculated Y
Y = dependent variable mean
X = independent variable mean
b * regression coefficient xy
X = independent variable
RESULTS AND DISCUSSION
I* Preliminary Studies of Torulopsis sphaerica
The in itia l part of th is study was related to an
investigation of the individual effects of in i t ia l pH of
whey, a ir volume, time, temperature, and inoculum on the
ab ility of the yeast T. sphaerica to u tilize whey as a
growth medium. After each t r ia l the individual factor
studied was adjusted to the apparent optimum prior to each
subsequent t r ia l .
A pure culture of T. sphaerica (8549-NRRL-1104)
was obtained from The American Type Culture Collection (ATCC)
(82) as a lyophilized pressed p e lle t• The method used for
subculture was that recommended by the ATCC in which the
liquid medium was composed of 2.0% lactose, 1.0% peptone
and 0.1% beef extract. During the study Potato Dextrose
Agar (P.D.A.) was successfully used as the medium for slant
storage. In the liquid medium the yeast grew rapidly and
many ce lls settled to form a thin white layer. Since the
culture grew well in lactose broth, i t was interpreted to
mean that i t did not require cultivation on or adaptation
59
60
to lactose before transfer to whey. This yeast which easily
assimilates lactose may or may not assimilate lac tic acid
as indicated by Lodder (46). Xnocula of 10, 20, or 30% of
24 h lactose broth cultures were used to inoculate the f ir s t
transfer to a whey medium. The wet cells that came from the
above fermentation were used for the f ir s t t r ia l study of
in it ia l pH level.
The amount of cells produced in the f ir s t t r ia l
of the pH study was nearly double that produced in the fol
lowing transfer. This clearly demonstrated the phenomenon
of "carry-over" of essential nutrients from the optimum
medium to the whey medium. The growth in the in it ia l whey
medium was enhanced by nutrients transferred with the inocu
lum; when these nutrients were depleted, the number of cells
produced was considerably reduced. This indicated that whey
was not the best medium for growth and production of cells
for th is yeast presumably because of the lack of some growth
factors, perhaps nitrogen, that would increase the production
of ce lls .
Wasserman (94) used other yeast species and showed
that only 25% of the nitrogen from whey was available to the
organisms, other factors could be accessory growth sub
stances such as vitamins and/or minerals that were present
in beef extract used in the lactose broth medium but absent
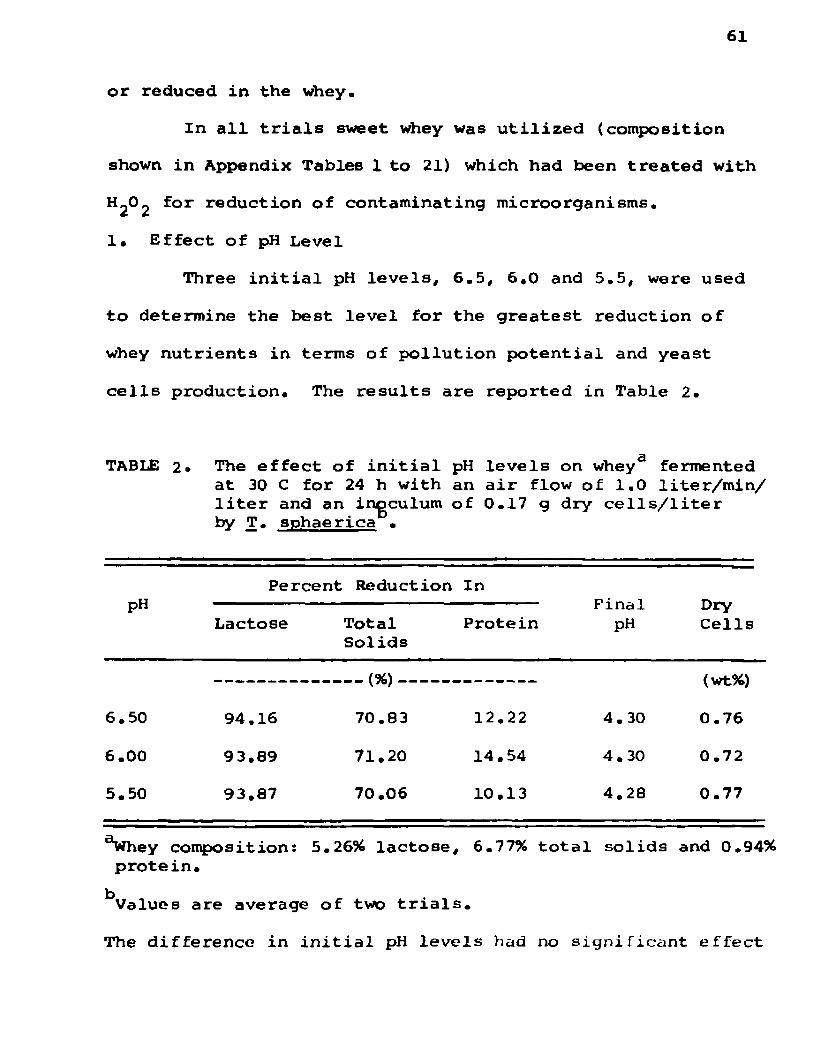
61
or reduced in the whey.
In a l l t r ia l s sweet whey was u tilized (composition
shown in Appendix Tables 1 to 21) which had been treated with
H2®2 or re^uct^on contaminating microorganisms.
1. Effect of pH Level
Three in i t ia l pH levels, 6.5, 6.0 and 5.5, were used
to determine the best level for the greatest reduction of
whey nutrients in terms of pollution potential and yeast
ce lls production. The resu lts are reported in Table 2.
TABUE 2* The effect of in i t ia l pH levels on whey fermented at 30 C for 24 h with an a ir flow of 1.0 lite r/m in / l i t e r and an ingculum of 0.17 g dry c e l ls / l i te r by T. sphaerica •
pHPercent Reduction In
FinalpH
DryCellsLactose Total
SolidsProtein
6.50 94.16
_ _ (%)------------
70.83 12.22 4. 30
<wt%)
0.76
6.00 93.89 71.20 14.54 4.30 0.72
5.50 93.87 70.06 10.13 4.28 0.77
aWhey composition: 5.2696 lactose, 6.77% to ta l solids and 0.94% protein.
^Values are average of two t r i a l s .
The difference in in i t ia l pH levels had no significant effect

62
on the percent reduction of protein levels observed which
was not too important because the maximum amount of the
protein that was u tilized at a pH of 6.0 was only 14.54%.
Variations in in it ia l pH had no apparent relationship to
the final pH after fermentation and the percent dry cell
produced. A pH of 6.0 was selected for subsequent tr ia ls
as th is level would require minimum adjustment should sweet
whey be the product for u tiliza tio n .
2. Effect of Incubation Temperature
As in the pH tr ia ls , three levels of incubation temp
eratures, 25, 30, and 35 C, were studied to determine opti
mum effectiveness levels. The results are presented in
Table 3. There were some increases in percent reduction of
aTABLE 3. The effect of incubation temperatures on whey
fermented for 24 h with an a ir flow of 1.0 l i t e r /m in/liter and an inoculum of 0.17 g dry ce lls /l i te r at pH 6.0 by T. sphaerica. b
Percent Reduction In
Temp. Lactose Total Solids
Protein FinalpH
DryCells
C -----------(%) — (wt%)
25 69.94 67.53 14.23 4.20 0.47
30 91.88 68.65 12.25 4.25 0.46
35 92.01 68.80 9.31 4.48 0.45
aWhey Composition: 5.47% lactose, 6.95% to ta l solids, and0.97% protein.
^Values are average of two tr ia ls .
both lactose and to ta l solids as the temperature increased
from 25 to 30 C, The percent reduction in protein was in
versely related to temperature, but as in the previous t r ia l
the low levels of u tiliza tion were not significant in terms
of pollution reduction or change in cell production. I t
was noteworthy that as less protein was u tilized , the final
pH increased. The higher pH would be more favorable for
subsequent oxidation in the lagoon type oxidation systems.
Several workers have reported incubation temperatures of
25-35 C to be satisfactory for yeast cultures. Our work
supports these findings and, in addition, these temperatures
are easily attained in cheese plants without significant
energy costs,
3, Effect of Air Flow
As stated in the objectives, the second requirement
of to ta l organic oxidation related to oxygen requirements
for the fermentation. On th is basis, the levels of a ir vol
ume investigated were 0.5, 1.0, 1.5, and 2.0 lite r /m in /lite r
The results are presented in Table 4, A slight increase in
percent reduction of lactose was obtained as the a ir volume
was increased. The amount of to ta l solids followed an oppo
site trend which was essentially accounted for by the de
crease in protein reduction. As in the previous tr ia ls , the
lowest amount of protein reduction was generally related to
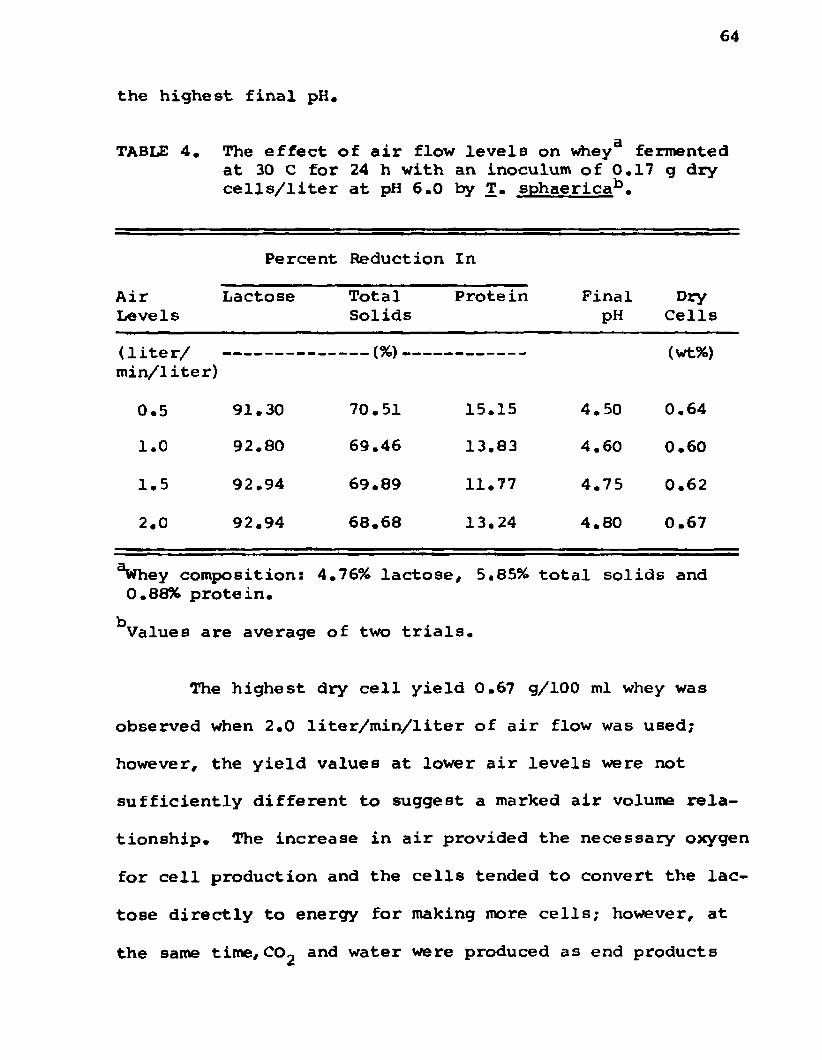
64
the highest final pH*
TABLE 4. The effect of a ir flow levels on whey3 fermented at 30 C for 24 h with an inoculum of 0.17 g dry c e l ls / l i te r at pH 6.0 by T. sphaericab.
Percent Reduction In
AirLevels
Lactose TotalSolids
Protein PinalpH
DryCells
( l i te r /m in/liter)
— (%)--------- (wt%)
0.5 91.30 70.51 15.15 4.50 0.64
1.0 92.80 69.46 13.83 4.60 0.60
1.5 92.94 69.89 11.77 4.75 0.62
2.0 92.94 68.68 13.24 4.80 0.67
^hey composition: 4.76% lactose, 5,85% to ta l solids and 0.88% protein.
Values are average of two t r ia ls .
The highest dry cell yield 0.67 g/100 ml whey was
observed when 2.0 lite r/m in /lite r of a ir flow was used;
however, the yield values at lower a ir levels were not
sufficiently different to suggest a marked a ir volume rela
tionship. The increase in a ir provided the necessary oxygen
for cell production and the cells tended to convert the lac
tose directly to energy for making more cells; however, at
the same time, CO2 and water were produced as end products

65
rather than being used in the fermentation to produce lactic
acid. This action tended to produce a higher final pH and
a greater cell yield. Results also indicated that a nega
tive relationship was present between the percent reduction
in lactose and to ta l solids. This was apparently caused by
the activity of yeast to u tilize more of the whey lactose
under the growth conditions used and at the same time u tilize
less protein. The inverse relationship of lactose and to ta l
solids reduction was influenced mainly by the protein reduc
tion. Since the protein constituted about 40 to 50% of the
effluent to ta l solids, the small amount of protein u tilized
probably caused the increase in reduction in to ta l solids.
The use of 2.0 liter/m ii> /liter a ir flow resulted in
excessive foam; therefore, th is level of a ir flow was elimi
nated from further consideration. The 0.5 liter/m iiV liter
a ir flow level was not subsequently used because of reduced
lactose u tiliza tion and reduced final pH. Only the levels
of 1.0 and 1.5 lite r /m in /lite r of a ir flow were used in the
remainder of th is study. Knight et a l. (38, 39) have re
ported comparable results when K. fraq ilis was used for
testing organisms for fermentation of cottage cheese vtfiey.
Wasserman (92) has shown the peak oxygen requirements for
maximum cell yield of K. frag ilis to be on the order of
100 to 120 ml 02/ l i t e r mediun\/min or 3.5 to 4.0 ml 02/mg dry
6 6
wt yeast/min when 4 l i te r s of a ir was pumped in 500 ml of
whey medium. I f th is were translated in terms of a ir , on
the assumption that 100 ml of a ir contains 20 ml of oxygen,
one l i te r of a ir would contain 20 x 10 or 200 ml of oxygen;
whereas, 0.5 l i te r would contain only 100 ml of oxygen.
Since 100 to 120 ml oxygen/liter mediunv/min was the minimum
as indicated by Wasserman (92), having more than the minimum
will not cause a problem other than foam production. Wasser
man (92) indicated that the amount of oxygen needed for yeast
cell production was not equal per-unit of time in the cell
incubation process. In the f ir s t hours, the need for oxygen
was the highest; whereas, at the end of the process the need
was decreased. Wasserman also added that the yeast u tilized
only about 35% of the to ta l amount of oxygen needed by the
cell in the oxidation of a given quantity of lactose carbon
to C02* The remaining 65% of the lactose carbon was used
for new cell material or non-oxidizable metabolic products.
Bechtle and Claydon (8, 9), in the ir work with mixed yeast
and bacteria cultures, used the levels of 650, 1,250 and
1,650 ml/3 liters/m in a ir flow; however, the medium for
th e ir work was fortified with added nutrients to produce
the highest cell mass.
4. Effect of Inoculum Level
Preliminary tr ia ls have indicated that levels of
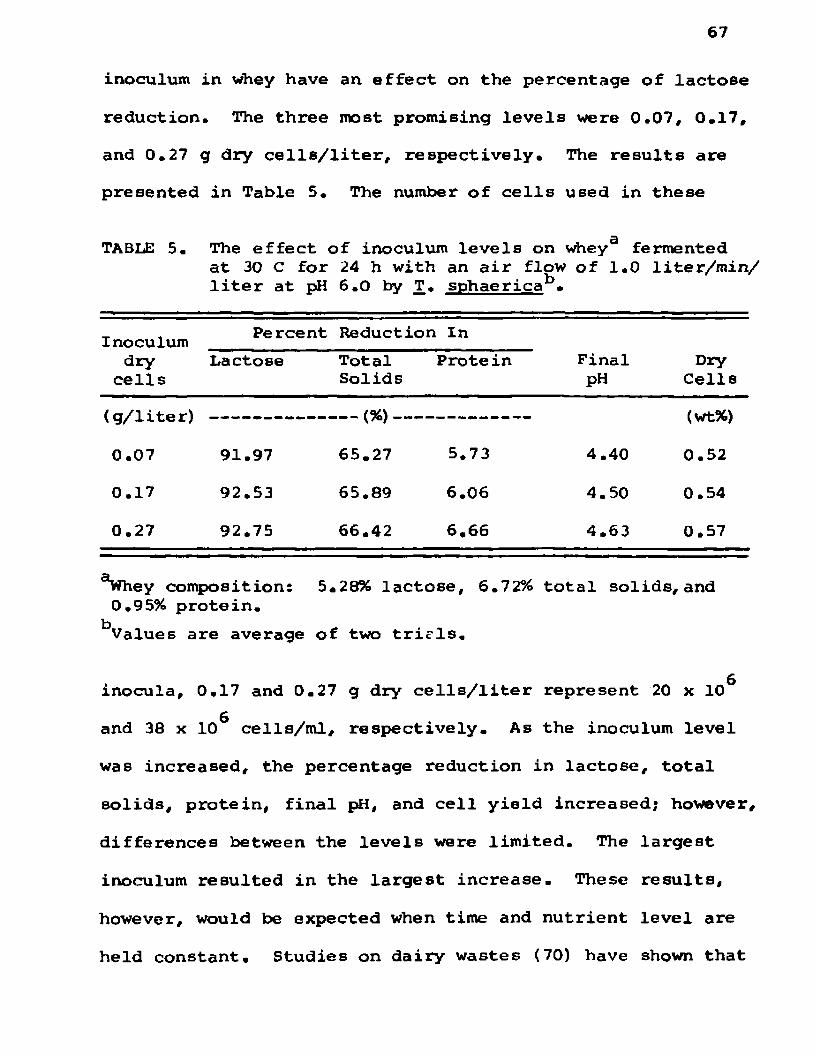
6 7
inoculum in whey have an effect on the percentage of lactose
reduction. The three most promising levels were 0.07, 0.17,
and 0.27 g dry c e l ls / l i te r , respectively. The resu lts are
presented in Table 5. The number of cells used in the se
TABLE 5.3
The effect of inoculum levels on whey fermented at 30 C for 24 h with an a ir flow of 1.0 liter/m in/ l i t e r at pH 6.0 by T. sphaericab.
Inoculum Percent Reduction In
drycells
Lactose TotalSolids
Prote in FinalPH
DryCells
(g /lite r) .__(%)--------- (wt%)
0.07 91.97 65.27 5.73 4.40 0.52
0.17 92.53 65.89 6.06 4.50 0.54
0.27 92.75 66.42 6.66 4.63 0.57
aWhey composition: 5.28% lactose, 6.72% to ta l solids, and0.95% protein.
Values are average of two t r i r l s .
inocula, 0.17 and 0.27 g dry c e l l s / l i te r represent 20 x 10
and 38 x 10** cells/m l, respectively. As the inoculum level
was increased, the percentage reduction in lactose, to ta l
solids, protein, final pH, and cell yield increased; however,
differences between the levels were lim ited. The largest
inoculum resulted in the largest increase. These resu lts ,
however, would be expected when time and nutrient level are
held constant. Studies on dairy wastes (70) have shown that
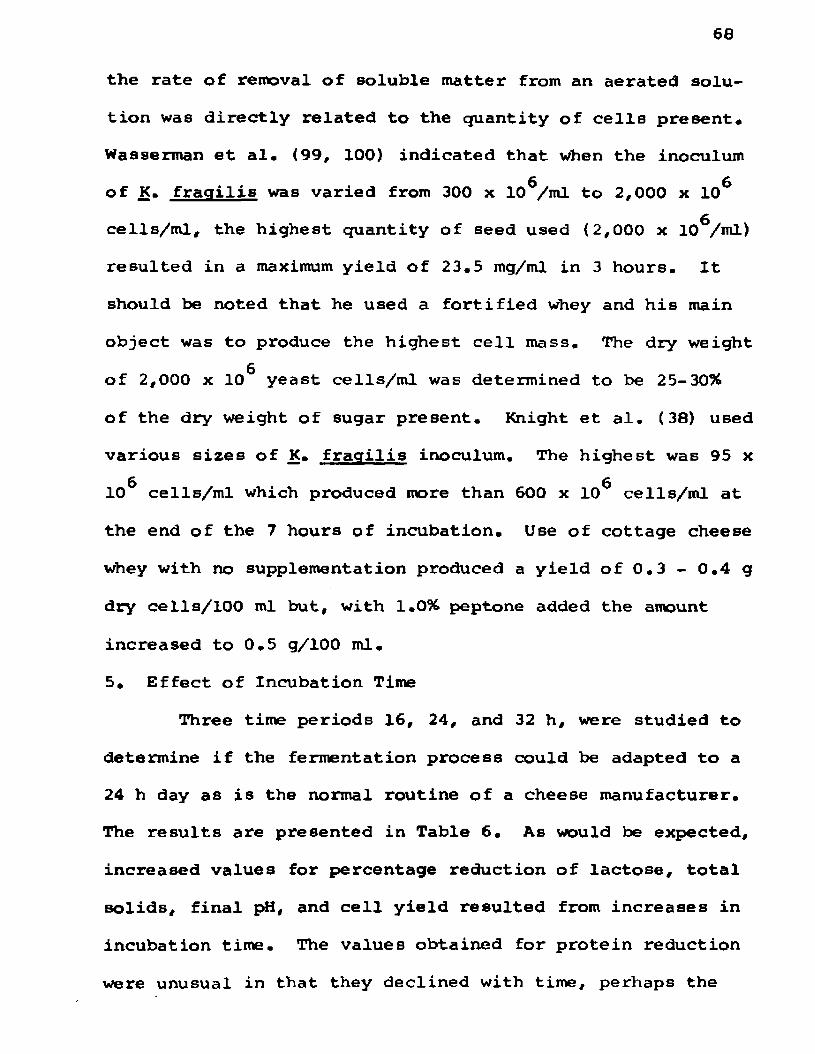
6 6
the rate of removal of soluble matter from an aerated solu
tion was d irectly related to the quantity of ce lls present.
Wasserman e t a l. (99, 100) indicated that when the inoculum
of K. fraq ilis was varied from 300 x 10^/ml to 2,000 x 10^g
cells/m l, the highest quantity of seed used (2,000 x 10 /ml)
resulted in a maximum yield of 23.5 mg/ml in 3 hours. I t
should be noted that he used a fo rtified whey and his main
object was to produce the highest ce ll mass. The dry weight
6of 2,000 x 10 yeast cells/m l was determined to be 25-30%
of the dry weight of sugar present. Knight e t a l. (38) used
various sizes of K. fraq ilis inoculum. The highest was 95 x
6 6 10 cells/m l which produced more than 600 x 10 cells/ml at
the end of the 7 hours of incubation. Use of cottage cheese
whey with no supplementation produced a yield of 0.3 - 0.4 g
dry cells/100 ml but, with 1.0% peptone added the amount
increased to 0.5 g/100 ml.
5. Effect of Incubation Time
Three time periods 16, 24, and 32 h, were studied to
determine i f the fermentation process could be adapted to a
24 h day as is the normal routine of a cheese manufacturer.
The resu lts are presented in Table 6. As would be expected,
increased values for percentage reduction of lactose, to ta l
solids, final pH, and ce ll yield resulted from increases in
incubation time. The values obtained for protein reduction
were unusual in that they declined with time, perhaps the

69
nitrogen from bacterial cells that were not removed by
centrifugation may have been involved.
TABLE 6. The effect of incubation times on whey3 fermented at 30 C with an a ir flow of 1.0 lite r /m in /lite r and inoculum of 0.17 g dry c e l ls / l i te r at pH 6.0 by T. sphaerica .
Percent Reduction In
Time Lactose Total Protein Solids
FinalpH
DryCells
h ------(%)------------------------------- (wt %)
16 78.62 56.95 6.21 4.50 0.10
24 92.46 63.06 1.55 4.40 0.48
32 94.42 62.91 ------- 4.60 0.50
aWhey composition: 5.14% lactose, 6.19% to ta l solids and1.00% protein.
Values are average of two t r ia ls .
The cell yield was almost the same for 24 and 32 h
of incubation, but the final pH was somewhat higher after
32 h than for the shorter incubation periods. The higher
pH may have been due to a greater concentration of protein
or, the possib ility that more of the lac tic acid was u tilized
in the 32 h as compared to 24 h incubation time.
70
In reports by Wasserman et a l. (99, 100) i t was noted
that when Sacch. fraq ilis inoculum in whey was 300 x 10^
yeast cells/ml, the incubation time was reduced to 3 h in
order to obtain maximum cell yield; however, no consideration
was given to the effluent quality. Based upon effluent qua-
l i te , previous results, and the need for a daily operation,
a 24 h incubation period was selected for the process through
out th is study. I t was obvious that should the time period
need to be reduced, a higher level of inoculum could be used
to compensate for the reduced time to yield the same percent
age reduction in the whey components.
Yeast cultures maintained excellent activity during
the previous t r ia ls which covered a period of 8 weeks and
12-16 transfers. The possib ility of contamination was mini
mal since careful sanitary procedures were used and a nearly
constant yield of cells was obtained throughout the work.
These findings indicate that T. sphaerica has good promise
for use in a p ilo t plant operation to establish a continuous
process without the need for a new daily culture.
In summary, the results of preceding tr ia ls indicate
that a pH of 6.0 and an incubation time of 24 h would be
near optimum for the additional studies. Other parameters
were reduced to the followings a ir volume 1.0 and 1*5 l i t e r /
71
m in/liter; inoculum levels 0.17 and 0.27 g dry c e l ls / l i te r
and incubation temperatures 25, 30 and 35 C.
I I . Detailed Studies of Torulopsis sphaerica
In the previous section, general parameters were
established for further studies relative to the use of T.
sphaerica for whey fermentation. All combinations of the
above parameters were tested and the results reported in
Appendix Tables 6-11 and summarized in Appendix Table 12.
Each parameter will be discussed independently. In addition
to the previous analyses, COD analyses were included and the
experimental design was modified for s ta tis tic a l analysis.
1. Effect of Incubation Temperature
The results relating to the effect of temperature are
reported in Table 7.
A highly significant difference (PC.01) in percent
reduction of lactose was shown to be due to the variations
in temperature; however, the differences in reduction of
lactose at the different temperatures were not sufficient
to prevent the use of either 25, 30, or 35 c. A similar
condition was noted for to ta l solids reduction. About 0.30
to 0.40 % lactose was shown to remain in the supernatant
as the lac tic acid that was produced during the fermentation
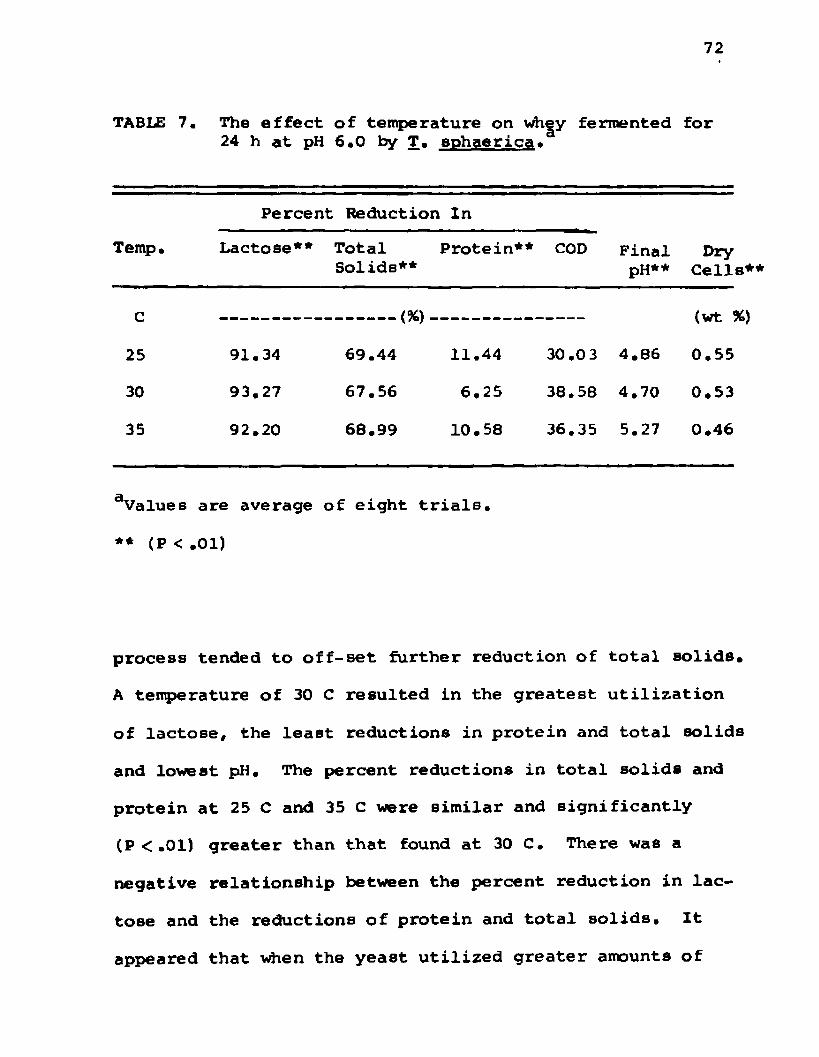
72
TABLE 7. The effect of temperature on wh y fermented 24 h at pH 6.0 by T, sohaerica.
for
Percent Reduction In
Temp. Lactose** Total Protein** COD Pinal Solids** pH**
DryCells**
C ----------------(96) _ (wt %)
25 91.34 69.44 11.44 30.0 3 4.86 0.55
30 93.27 67.56 6.25 38.58 4.70 0.53
35 92.20 68.99 10.58 36.35 5.27 0.46
Values are average of eight t r ia ls .
** <P <.01)
process tended to off-set further reduction of to ta l solids.
A temperature of 30 C resulted in the greatest u tiliza tion
of lactose, the least reductions in protein and to ta l solids
and lowest pH. The percent reductions in to ta l solids and
protein at 25 C and 35 C were similar and significantly
(p <.01) greater than that found at 30 C. There was a
negative relationship between the percent reduction in lac
tose and the reductions of protein and to ta l solids. I t
appeared that when the yeast u tilized greater amounts of
73
lactose, i t used less protein. A highly significant d if
ference (P<«01) was shown for the final pH as temperatures
were increased. This high pH indicated there was less lac
t ic acid present to contribute to an increase in the to ta l
solids. A highly significant effect (Pc.Ol) was found
between temperature and dry cell yield. The greatest cell
yield was 0.55 g dry cell/100 ml at 25 C which was only
slightly greater than that obtained at 30 C. At 35 C the
cell yields were significantly lower (P<.01) than those
obtained at temperatures of 25 C and 30 C. No analysis of
variance was made on COO results because not a ll treatments
were determined. The greatest reductions however, were
obtained at 30 and 35 C, which were markedly greater than
observed at 25 C.
Gach incubation temperature seems to have certain
advantages. I f cells are desired, a temperature of 25 C
and/or 30 C is best, but, i f maximum lactose reduction is
desired then 30 C and/or 35 C should be used. Final pH is
also an important factor to consider and the highest final
pH value was obtained at 35 C.
The amounts of protein that can be u tilized by yeast
appears to be very small with only 10-11% being u tilized at
25 and 35 C. The to ta l solids reduction appeared to be
influenced mainly by protein reduction and final pH, since

74
the values for the reduction in lactose exhibited l i t t l e
variation. The small amount of remaining lactose repre
sented about 20% of the to ta l solids; vfcereas, protein
represented 40-50% of the to ta l solids after fermentation.
These results are in general agreement with the work of
Nakasishi and Arai (60,61) Lodder (44) and Bechtle and
Clyadon (9). The ideal temperature to be selected would,
therefore, depend on which factor is most important to the
processor; lactose, to ta l solids, COD, final pH or cell
yield.
2. Effect of Air Flow
The results relating to the uses of various levels
of a ir flow are presented in Table 8. Highly significant
TABLE 8. The effect of a ir flow on whey fermented for 24 h at pH 6.0 by T, sphaericaa.
Percent Reduction In
Air Lactose** Total Protein COD Final Dry flow Solids pH Cells**
( l i te r / ------------------------------(%)--------------------------------- (wt %)min/liter)
1.0 91.99 68.79 8.78 31.27 4.90 0.49
1.5 92.55 68.54 9.67 36.25 4.99 0.54
a Values are average of twelve t r ia ls .
** (P <.01)

75
differences (P<.01) in percent reduction of lactose and
dry cell yield were obtained when the a ir flow level was
increased from 1.0 to 1.5 lite r /m in /lite r with the higher
level giving the better resu lts . No significant effects
on percent reductions in to ta l solids, protein or final pH
were detected with the a ir flow change. The percent reduc
tion in COD was markedly greater at 1.5 lite r /m in /lite r than
at the lower level. The levels of a ir used were approxi
mately 3 times greater than those used by Bechtal and Claydon
(9). The use of 1.5 lite r /m in /lite r did not result in ex
cessive foam and probably would not increase the cost of
plant operations over that of the lower level.
3. Effect of Inoculum Level
The results relating to the use of various levels of
inoculum are presented in Table 9. Use of 0.27 g dry c e lls /
TAB1£ 9. The effect of inoculum levels on whey fermented for 24 h at pH 6.0 by T. sphaerica5.
Percent Reduct ion In
Inoculum dry cell
Lactose** Total Solid
Protein COD FinalpH
DryCells
(g /liter) ----------------(%). (wt %)
0.17 91.92 68.79 9.37 30.40 5.00 0.51
0.27 92.62 68*54 9.08 36.08 4.89 0.52
aValues are average of twelve t r ia ls . ** (P<.01)

76
l i te r over 0.17 g dry ceU V liter showed a highly significant
(P <.01) increase in percent reduction of lactose and a
marked increase (6%) in the percent reduction in COD. No
significant effect was found on the percent reductions in
to ta l solids, protein, final pH,and percent dry yeast with
different levels of inoculum. Knight et a l. (38) in their
studies with K. f ra q ilis . used an inoculum size which was
equivalent to 15-25% of the in i t ia l lactose content of the
medium and obtained an 80% reduction in COD, in contrast to
a 36% reduction obtained in the above study. The level of
inoculum used by Knight et a l. (38) was 30 to 40 times
greater than that used in th is study.
Results obtained in th is t r ia l in relation to yield
of yeast cells were similar to those reported in Table 4 in
which the higher level of inoculum resulted in the greatest
yield.
The average amount of yeast produced in th is whey
medium afte r 24 h incubation in twenty-four t r ia ls was 0.5 g
dry cells/100 ml or 5 g /l i te r . This was only 10% of the
theoretical yield based on the amount of lactose present
since the amount of lactose present is about 50 g in one
l i te r whereas the cell yield was only 5 g /l i te r . A study
by Knight et a l. (38) with K. fraq ilis grown in cottage
cheese whey without supplements obtained a yield of yeast

77
that was 0.3-0*4 g/ioo ml. He concluded that cell production
levels of 1,5 to 2,7 g/100 ml, as shown by Wasserman et a l,
(92, 99, 100), would have been possible in his study i f
sufficient carbon and nitrogen were in the medium to support
higher levels of growth. The amount of dry cells produced
in th is study was slightly higher than reported by Knight
e t a l, (38) above in which no supplements were used, Knight
et a l, (38) reduced the fermentation time to 12 h by increas
ing the size of inoculum. Since a small inoculum was used
with no whey supplementation in th is study, the dry cells
were much lower than that reported by Wasserman et a l. (92,
99, 100). This suggest that the above conclusion by Knight
et a l. (38) was correct.
4. Correlation of Selected Variables
Correlation coefficients of selected variables related
to activity of T, sphaerica are reported in Table 10. A cor
relation coefficient of -0,6151 was found between the percent
lactose reduction and percent to ta l solids reduction. This
was probably due to the small amount of remaining lactose
which made up only 20-25% of the to ta l solids le f t after fer
mentation. In most treatments, the lactose reductions were
not greatly different; therefore, differences in to ta l solids
were due to other factors. The other solids which make up
to 40-50% of the to ta l solids after fermentation were proteins
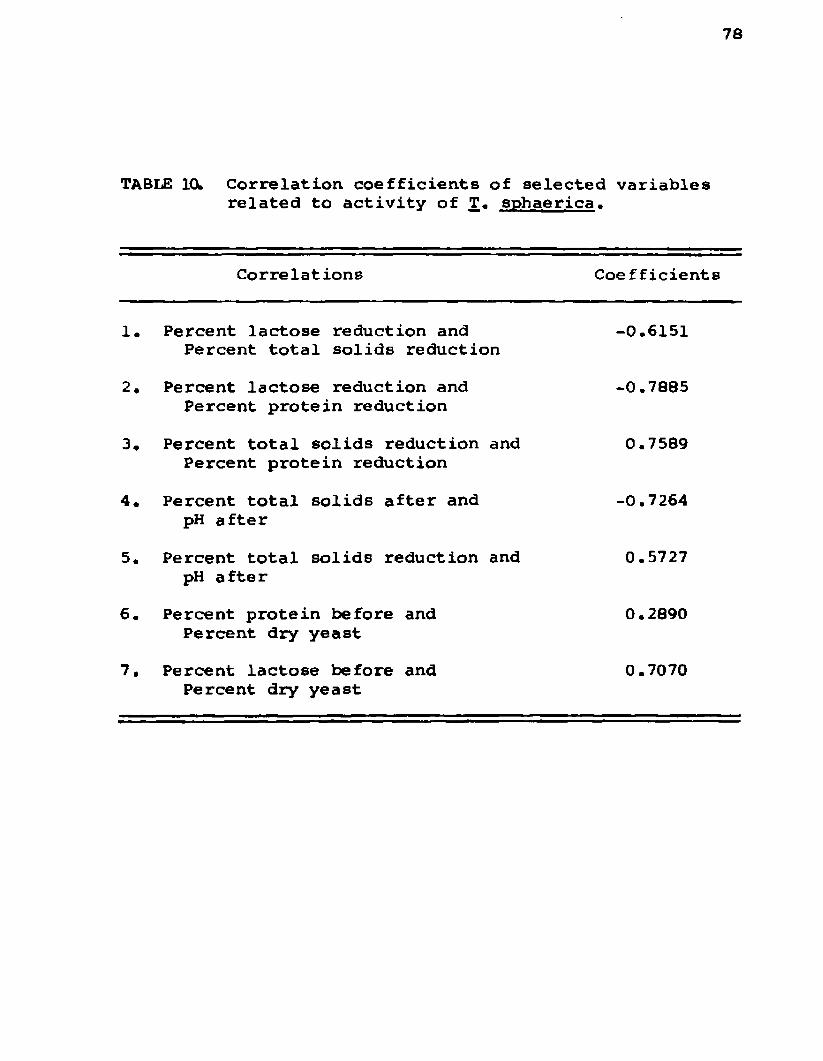
7 8
TABLE 10, Correlation coefficients of selected variables related to activity of T. sphaerica.
Correlations Coefficients
1. Percent lactose reduction and Percent to ta l solids reduction
-0.6151
2. Percent lactose reduction and Percent protein reduction
-0.7885
3* Percent to ta l solids reduction and Percent protein reduction
0.7589
4. Percent to ta l solids after and pH after
-0.7264
5. Percent to ta l solids reduction and pH after
0.5727
6. Percent protein before and Percent dry yeast
0.2890
7. Percent lactose before and Percent dry yeast
0.7070

7 9
as indicated by the correlation coefficient between the
percent reduction in protein and lactose of -0.7885. A
similar positive correlation coefficient of 0.7589 was
obtained between percent reduction in protein and to ta l
so lids.
Another component that affected to ta l solids after
fermentation was pH due to the presence of lac tic acid.
When a low pH was obtained i t implied that more lac tic acid
was present which caused the to ta l solids a fte r fermentation
to be increased. Thus, a negative correlation coefficient
of -0.7264 was observed between the final pH and the percent
of to ta l solids a fte r fermentation. The percentage of to ta l
solids reduction would therefore have a positive correlation
coefficient, 0.5727, with final pH.
There was a positive correlation coefficient of 0.7070
between the original lactose in whey and the percent of dry
ce lls . Original protein levels appear to have l i t t l e re la
tion to ce ll yield in that the correlation coefficient was
only 0.2890. As previously discussed th is may have been
due to other available nitrogen sources.
111. Detailed Studies of Kluvveromvces fra q ilis
This yeast K. f ra q il is . formerly named Saccharomvces
f ra q il is . was obtained from The American Type Culture
80
Collection catalog number 8601 (NRRLY-1156). The method
used for subculture was recommended by the ATCC (82) in
which YM broth was used as the liquid medium. During the
study, YM Agar slants were successfully used as the medium
for culture storage.
Lodder (46) reported that th is yeast he's the capacity
to u tilize both lactose and lac tic acid in i ts metabolic
process and generally has been used for the production of
single-cell protein from a whey medium. I t has been found
to effectively u tiliz e high acid cottage cheese whey.
Parameters in the studies with K. fraq ilis were the
same as for T. sphaerica which were: pH 6.0, 24 h incubation
time, temperature of 25, 30, and 35 C, a ir flow levels of
1*0 and 1.5 lite r /m in /lite r and inocula levels of 0*17 and
0.27 g dry c e l ls / l i te r . All combinations of parameters were
tested and the results reported in Appendix Tables 13-18 and
summarized in Appendix Table 19. Each parameter w ill be
discussed independently. A sweet whey without supplements
was used as the substrate and was prepared as previously
described in the T. sphaerica studies.
1. Effect of Incubation Temperature
The relationships of incubation temperature to cer
tain metabolic ac tiv itie s , as reported in Table 11, indicated
that temperature had a highly significant (P<.01) relation
ship to percent reductions in lactose, to ta l solids, and
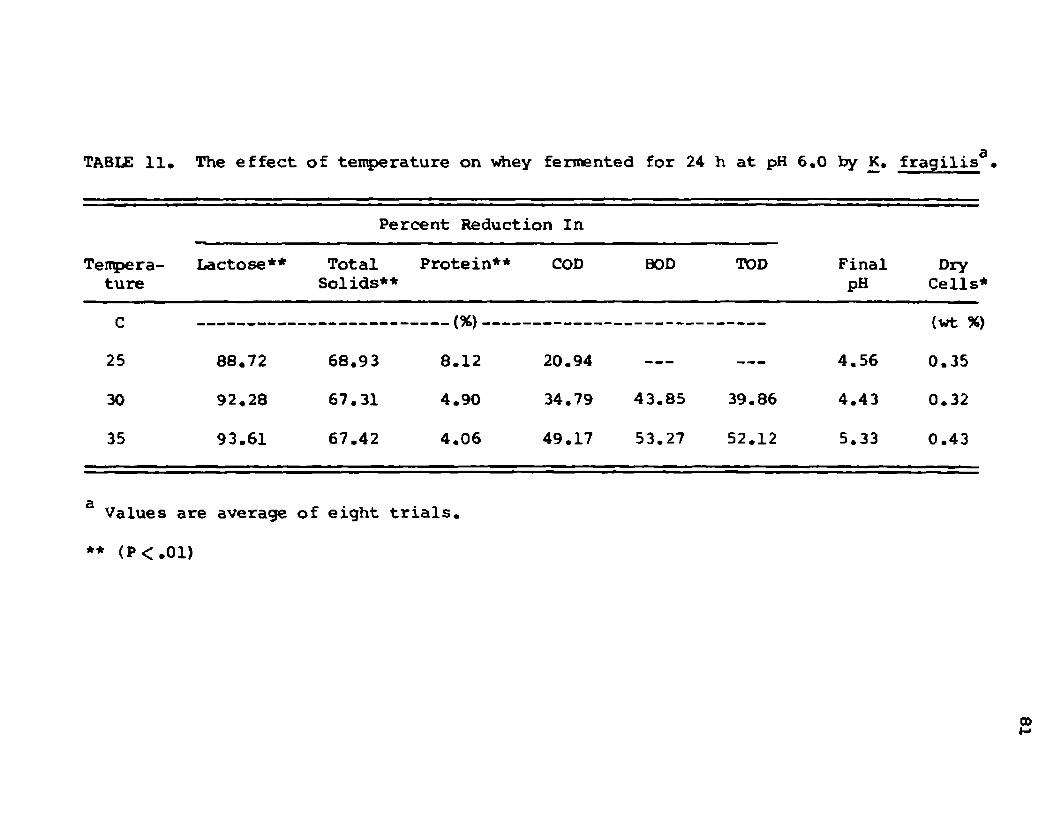
TABLE 1 1 , The e f f e c t o f t e m p e r a tu r e o n w hey fe r m e n te d f o r 24 h a t pH 6 . 0 by K. f r a g i l i s 3 •
Percent Reduction In
Temperature
Lactose** TotalSolids**
Protein** COD BOD TOD FinalpH
DryCells*
C -------- (%)--------- (wt %)
25 88.72 68.93 8.12 20.94 ------ ------ 4.56 0.35
30 92.28 67.31 4.90 34.79 43.85 39.86 4.43 0.32
35 93.61 67.42 4.06 49.17 53.27 52.12 5.33 0.43
3 Values are average of eight t r ia ls .
** (PC.01)
<D
82
protein. The differences in percent reductions of lactose
were highly significant. As temperature increased from 25
to 35 C, the percent reduction in lactose increased. The
COD, BOD, and TOD were not s ta tis tic a lly analyzed due to an
unequal number of observations. However, the results indi
cated marked increases in percent reduction of COD, BOD, and
TOD as temperature increased. Prom these results i t appeared
that of the temperatures evaluated, 35 C was the optimum.
Knight et a l. (38) have reported that a temperature of 35 to
40 C was optimum for K. f ra q ilis . In their study the high
est turbidity was produced at 40 C. Mickle et a l. (54) have
reported 35 ± 2 C to be the optimum for growing K. fraq ilis
in cottage cheese whey. Wasserman (92) reported that the
propagation of yeast was accomplished best at a temperature
of 31-33 C and that good yields were obtained when fermenta
tion temperatures were as high as 41-43 C. Many other re
searchers (3, 97, 100) have achieved satisfactory results at
a temperature near 30 C.
2. Effect of Air Flow
As reported in Table 12 the effects of using a higher
level of a ir , 1.5 lite r /m in /lite r vs, 1.0 lite r/m in /lite r ,
were highly significant (P <.01) increases in percent reduc
tions of lactose, final pH, and percent dry yeast ce lls .
There was no significant effect on percent reductions of
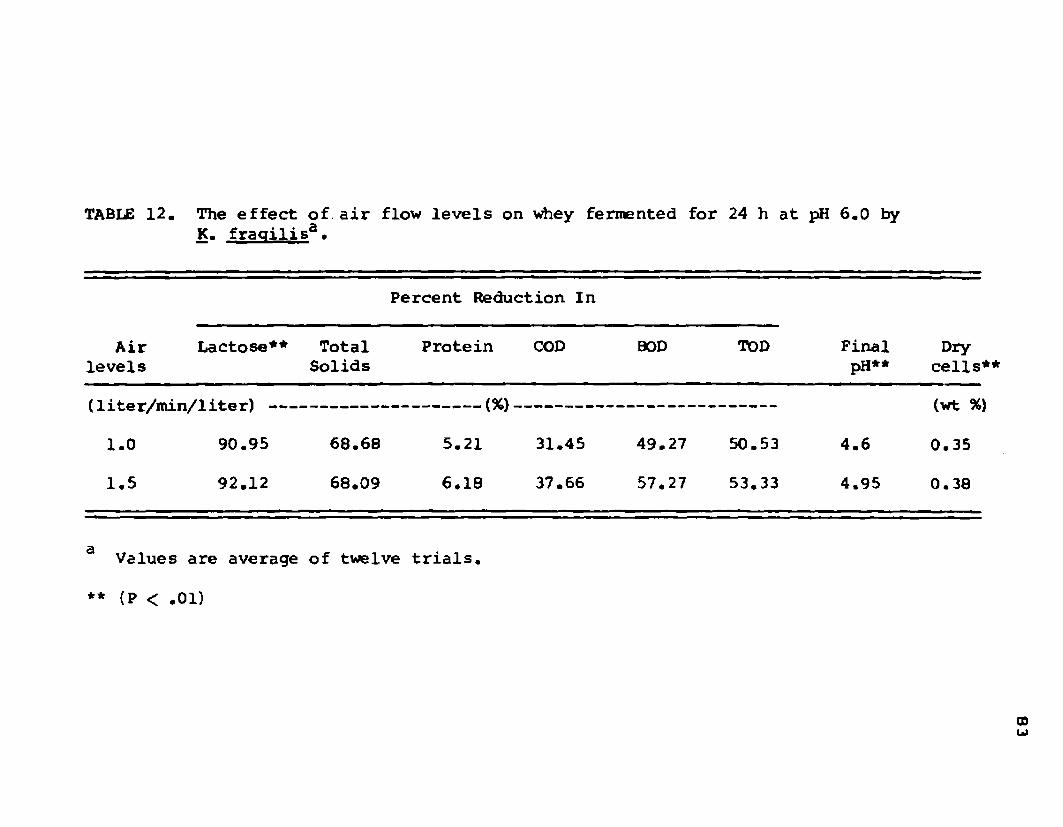
TABLE 1 2 . The e f f e c t o f . a i r f lo w l e v e l s o n w hey fe r m e n te d f o r 24 h a t pH 6 . 0 byK. f r a q i l i s 3 .
Percent Reduction In
FinalpH**
Drycells1*
Air Lactose** levels
TotalSolids
Protein COD BOD TOD
(liter/m in/liter) ----- --------------------- (%)_ (wt %)
1.0 90.95 68.68 5.21 31.45 49.27 50.53 4.6 0.35
1.5 92.12 68.09 6.18 37.66 57.27 53.33 4.95 0.38
Values are average of twelve tr ia ls .
** (P < .01)
cou>
8 4
solids and of protein. No analysis of variance was made on
COD, BOD, and TOD, but the results indicated improved value
with greater a ir volume. These findings are similar to those
of other workers. The use of 1,0 lite r /m in /lite r agreed with
Knight et a l, (38); however, Vananuvat and Kinsella (86, 87)
used 1,0 liter/m in for 500 ml of medium. That would be 2
lite r /m in /lite r , but when they used th is high a ir level, the
problem of foam was encountered and an antifoam agent was
necessary. The foam problem in th is study was solved by
avoiding excessive a ir which induced foam; however, when low
levels of foam were formed no significantly different results
were noted,
3, Effect of Inoculum Level
The results reported in Table 13 indicate that when
the inoculum was increased from 0,17 to 0,27 g dry c e lls /
l i t e r , a significant (P<,05) increase was found in percent
reductions of lactose and'of protein and a highly sign ifi
cant (P<,01) increase in the final pH, No significant
effects on percent reductions in to ta l solids and percent
dry yeast cells were found as the level of the inoculum was
changed. While no s ta tis tic a l analysis was made in relation
to COD, BOD, and TOD, a ll values improved with higher levels
of inoculum. Difference between the two levels of inoculum
could be limited because the small inoculum has the opport
unity to recover within a 24 h period.
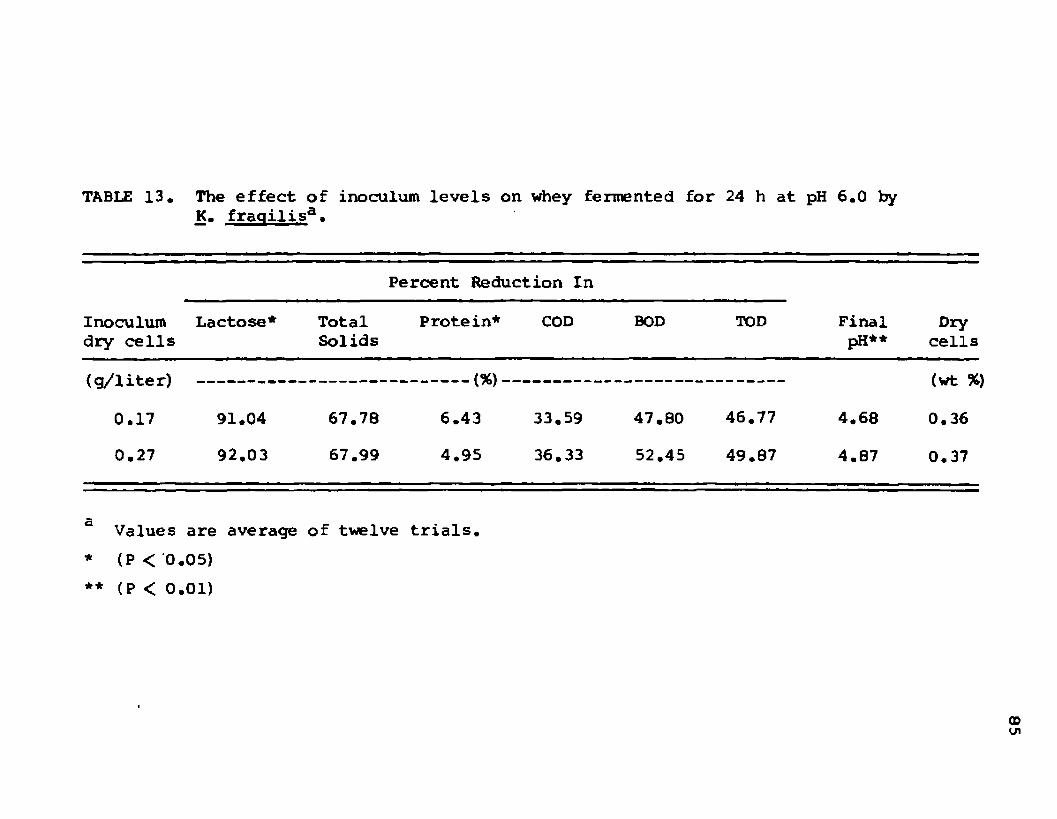
TABLE 1 3 . The e f f e c t o f in o c u lu m l e v e l s o n w hey fe r m e n te d f o r 24 h a t pH 6 . 0 byK. f r a q i l i s 3 .
Percent Reduction In
Inoculum dry cells
Lactose* TotalSolids
Protein* COD BOD TOD FinalpH**
Drycells
(g/liter) -------------------(%)- (wt %)
0.17 91.04 67.78 6.43 33.59 47.80 46.77 4.68 0.36
0.27 92.03 67.99 4.95 36.33 52.45 49.87 4.87 0.37
Values are average of twelve tr ia ls .
* (P < 0.05)
** (P < 0.01)
GOVi
8 6
The two levels of inoculum used in th is study were 0*17
and 0.27 g dry yeast ce lls /lite r* These were equivalent to
1.25 and 2,0 g of wet ce lls respectively consisting of 27%
to ta l solids in 2 l i te r s of whey or equivalent to 0,34% and
0,54% of the amount of lactose present. These quantities re
present a very small inoculum compared to the inoculum size
used by Wasserman et a l, (100) which represent 25-30% of the
lactose present. When the high inoculum levels were used by
Wasserman (100), the incubation time was shortened from 24 h
to 3-4 hours,
4, Correlations of Selected Variables
Correlation coefficients of selected variables related
to activ ity of T, sphaerica are reported in Table 14. A
correlation coefficient of -0.4651 was found between the per
cent lactose reduction and percent to ta l solids reduction
because the amount of lactose after fermentation is small in
comparison to the amount of protein and other components. I f
the yeast u tilized more lactose, i t tended to u tilize less
protein which caused the to ta l solids to have a negative
correlation of -0.5541 between percent reduction of lactose
and the percent reduction of protein.
A 0.5919 correlation coefficient was found between
percent lactose reduction and final pH which suggested that
the more lactose metabolized, the higher the final pH be
cause of reduced lac tic acid production. This correlation

87
TABLE 14* Correlation coefficients of selected variables related to activity of K. f ra q ilis .
Correlation Coefficients
1. Percent lactose reduction andpercent to ta l solids reduction
-0,4650
2. Percent lactose reduction and percent protein reduction
-0.5540
3. Percent lactose reduction and pH after fermentation
0.5918
4. pH after fermentation andpercent lactose afte r fermentation
-0.6037
5. pH after fermentation and percent dry cells
0.8949
68
coefficient helps to explain the correlation coefficient of
-0.6037 between final pH and the final percent lactose in
that the lower the amount of lactose remaining afte r fermen
tation the higher the final pH and at the same time, the
greater the dry cells production. This is indicated by the
higher correlation coefficient of 0.8949 between the final
pH and dry yeast cells produced. The above findings indi
cate that the more lactose that is u tilized , the greater the
cell yield and, the higher the final pH and at the same time,
a lower level lac tic acid.
These correlation exhibit a similar trend to those
obtained in the studies with T. sphaerica; however, the
coefficient values are somewhat smaller.
IV. Candida u t i l i s
The yeast, C. u t i l i s , was obtained from The American
Type Culture Collection (82) catalog number 9226. The lyo-
philized culture was activated by propagation in YM broth,
with subsequent satisfactory growth. Subsequently, the cul
ture was carried on Potato Dextrose Agar slants and/or YM
Agar with excellent growth for storage and use during th is
study.
Prior to use in the fermentation t r ia ls , the yeast
was conditioned to whey by five daily transfers. The

8 9
adaptation of C. u t i l is to u tiliz e whey lactose was not
achieved. This was due to the fact that C. u t i l i s does not
u tilize lactose but u tilize s lac tic acid as reported by
Lodder (46)• The pH of the whey was 6.0 thus, very l i t t l e
lac tic acid was present and growth was very slow.
The f irs t experimental fermentation was at 26 C, 1.0
lite r /m in /lite r a ir flow and, an inoculum of 0.17 g dry
c e l ls / l i te r . The percent reduction in lactose during the
fermentation was only 10%. A second t r i a l made at 35 C tem
perature, 1.5 lite r /m in /lite r a ir flow and 0.27 g dry c e lls /
l i t e r inoculum, resulted in only about 40% reduction in
lactose. Even th is growth may have been due to contamina
ting bacteria which produced lac tic acid; therefore, these
results indicated that sweet whey was not an ideal medium
for the growth of th is yeast. These results are supported
by the findings of Krajovan et al* (41) who reported on the
use of three strains of C, u t i l i s . Yeast adapted to a whey
medium gave the greatest yield of dry cells and the unadapted
yeast gave the lowest y ield . Graham et a l. (27) have worked
on species of Candida other than u t i l i s such as c . krusei.
They concluded that using such yeast resulted in a poor
u tiliza tio n of whey and poor yield of ce lls . Use of th is
yeast as a single strain was dropped in th is study due to the
above ineffective performance; however, i t was subsequently
used in combination with other strains,
V, Lactose as Lactic Acid
The percent titra tab le activ ity (T.A.) of four random
samples of original whey and sixteen random samples a fte r
fermentation was determined. The average percent of T,A,
on the original whey was 0,1%, This value was due to the
presence of small amounts of lactoalbumin, lactoglobulin,
other whey proteins, sa lts , minerals, and l i t t l e i f any
lac tic acid. The percent of T.A, of the samples after fer
mentation ranged from 0.185% to 0.45% which represented a
pH of 5.95 and 4.3, respectively. Calculations were made to
determine the amount of lactose converted to lac tic acid re
maining with the effluent. This indicated that the remaining
lac tic acid in the effluent might represent from 0.02 to 0.09%
of the original lactose. A value of 0.09% would represent a
difference of about 1.5% in the reduction of lactose. This
1.5% reduction was the greatest amount calculated and the
effect on the values found for the percent reduction in lac
tose would be insignificant. Therefore, most of the lactose
was u tilized by the yeast cells with l i t t l e remaining as lac
tic acid in the effluent. The amount remaining however, was
the primery factor which influenced the final pH in these
studies.

9 1
VI. Oxidation Demands on Whey and Fermented Whey Effluent
Whey is considered to be one of the main sources of
pollution in the dairy industry. I ts pollution potential
is often measured by the oxidation demand. Therefore BOD,
COD, and TOD were used to measure the pollution potential
of whey and i ts effluent a fte r fermentation. The varia
tion in the composition of whey used in th is study is small,
especially when the milk is not diluted with water, there
fore, the average composition used here is a true represents
tion of whey composition. The average composition of non
fermented whey medium is reported in Table 15.
TABLE 15. The average composition of non-fermented whey*
Item Ia l l b
Lactose 5.25% 5.15%Total Solids 6.46% 6.31%Protein 0.90% 0.89%BOD — - 42,600 ppmCOD 70,500 ppm 69,330 ppmTOD 71,170 ppm
Values are average of eleven samples*jjValues are average of three samples.
On the average the BOD values made up 60% of the TOD
value whereas COD value made up about 97% of the TOD value.
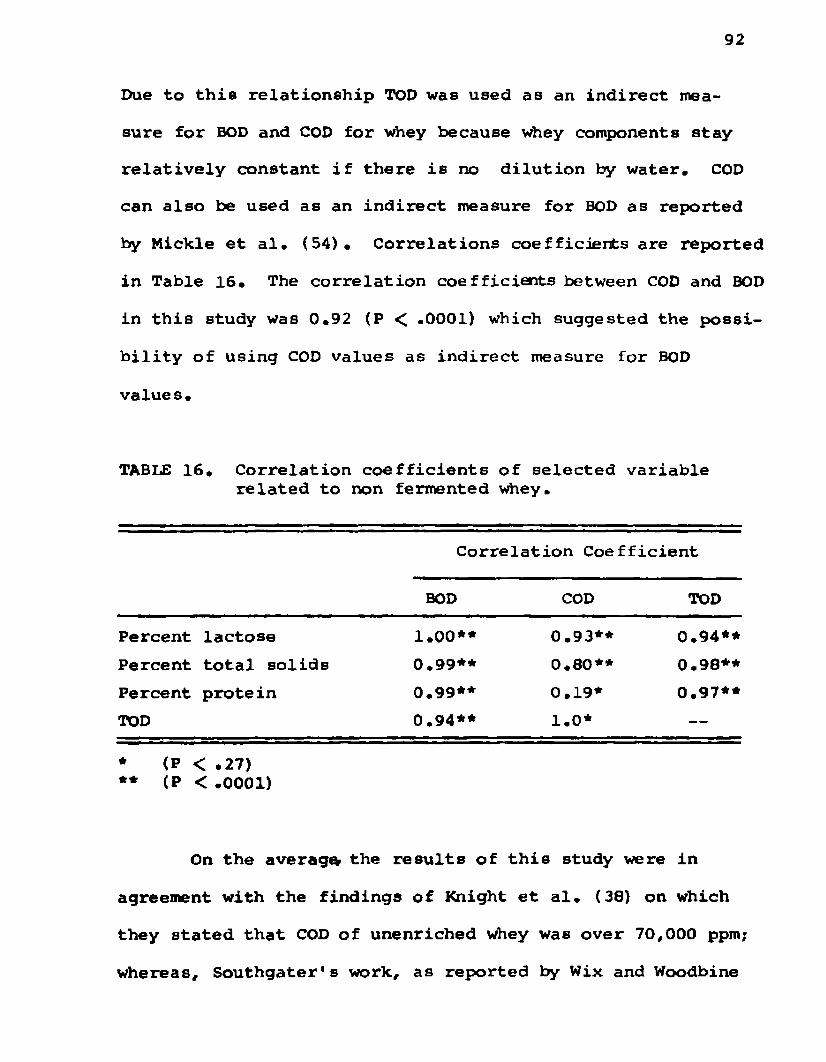
92
Due to th is relationship TOD was used as an indirect mea
sure for BOD and COD for whey because whey components stay
relatively constant i f there is no dilution by water. COD
can also be used as an indirect measure for BOD as reported
by Mickle et a l. (54). Correlations coefficients are reported
in Table 16. The correlation coefficients between COD and BOD
in th is study was 0.92 (P < .0001) which suggested the possi
b ility of using COD values as indirect measure for BOD
values.
TABLE 16. Correlation coefficients of selected variable related to non fermented whey.
Correlation Coefficient
BOD COD TOD
Percent lactose 1.00** 0.93** 0.94**
Percent to ta l solids 0.99** 0.80** 0.98**
Percent protein 0.99** 0.19* 0.97**
TOD 0.94** 1.0* —
* (P < .27)** (P < .0001)
On the average the results of th is study were in
agreement with the findings of Knight e t a l . (38) on which
they stated that COD of unenriched whey was over 70,000 ppm;
whereas, Southgater's work, as reported by Wix and Woodbine

9 3
(105), noted that in thirteen samples of whey, the BOD rang
ed from 38,000 to 46,000 ppm. The high correlation between
percent of lactose and COD was expected. Mickle et a l. (54)
noted that 69% of the BOD of whey was due to lactose.
Random samples of fermented whey effluent from th is
study were analyzed for BOD, COD, and TOD and then s ta tis
tica lly analyzed. The average composition of whey effluent
is reported in Table 17.
TABUS 17. The average composition of whey effluent after fermentation.
Item I3 l l b
Lactose 0.44% 0.34%Total solids 2.05% 2.07%Protein 0.83% 0.84%BOD ------ 21,040 ppmCOD 46,050 ppm 37,860 ppmTOD * 36,920 ppm
aValues are average of th irty-five samples.
^Values are average of twelve samples.
I t was normally expected that TOD should have the
highest value, but COD results were found to be slightly
higher than TOD. This could be due to experimental varia
tion because of the high dilutions (1-500) used and the pre
sence of bacteria or yeast cells in the filtra te* The BOD
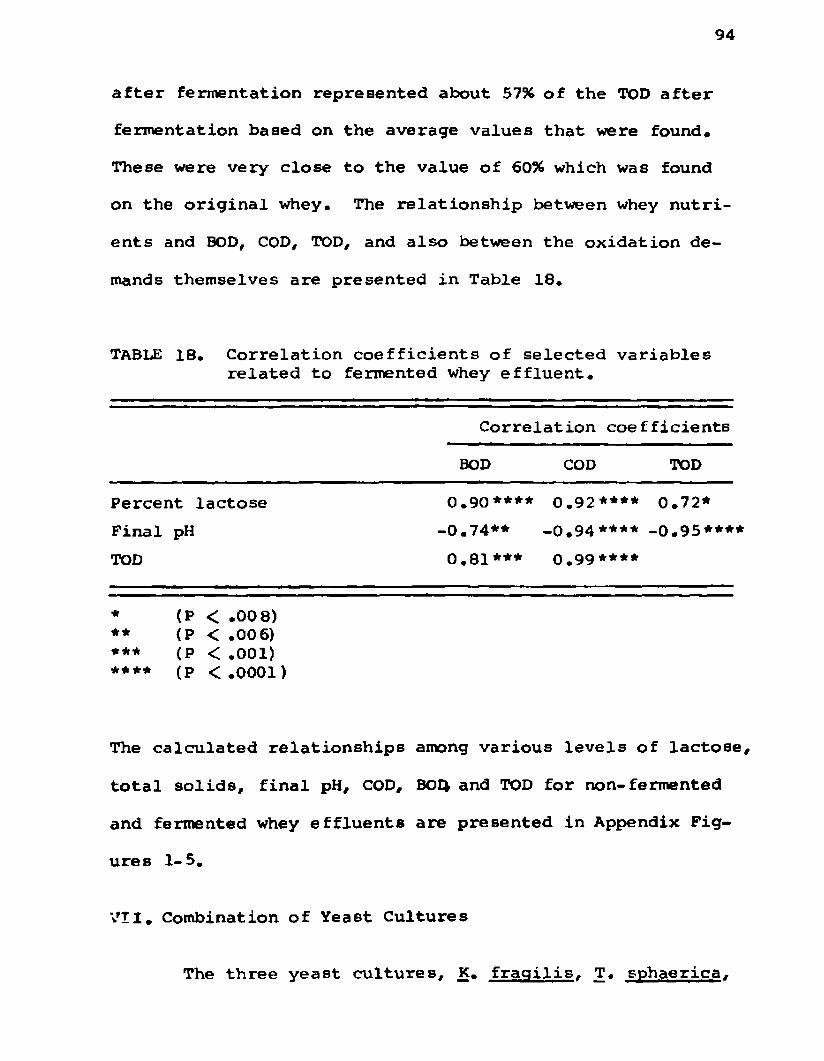
9 4
afte r fermentation represented about 57% of the TOD after
fermentation based on the average values that were found.
These were very close to the value of 60% which was found
on the original whey. The relationship between whey nutri
ents and BOD, COD, TOD, and also between the oxidation de
mands themselves are presented in Table 18.
TABLE 18. Correlation coefficients of selected variables related to fermented whey effluent.
Correlation coefficients
BOD COD TOD
Percent lactose 0.90**** 0.92**** 0.72*
Final pH -0.74** -0.94**** -0.95****
TOD 0.81*** 0.99****
* (P < .008)** (P < .006)*** (P < .001)**** (P <.0001)
The calculated relationships among various levels of lactose,
to ta l solids, final pH, COD, BOH and TOD for non-fermented
and fermented whey effluents are presented in Appendix Fig
ures 1-5.
VII. Combination of Yeast Cultures
The three yeast cultures, K. fra g ilis , T. sphaerica.

9 5
and u t i l i s , previously studied on a pure culture basis,
were investigated using a ll possible combinations. The
growth conditions selected were those which demonstrated the
best u tiliza tion when these yeasts were grown in pure culture*
A temperature of 35 C was originally selected because of
i ts favorable effect on K. f ra q ilis . which yielded high
final pH, and on T. sphaerica. which yielded an excellent
reduction of whey nutrients. In itia lly , the use of 35 C
temperature resulted in excessive foam and created an en
vironment favorable to the growth of long b ac illi gram posi
tive spore formers, which had resisted both pasteurization
and HjO2 treatment. The problem of bacillary growth was
also reported by Wasserman (9 2) with K. fraq ilis at 40-43 C
in whey medium. The temperature was reduced to 30 C which
solved the foam and reduced the b ac illi problems. This
temperature was within a favorable range for yeast growth
and was in agreement with the 30-32 C temperature used for
these yeast by Bechtle and Claydon (9). An a ir volume of
1.5 lite r /m in /lite r and an inoculum of 0.27 g dry c e lls / l i te r
were used.
The four possible combinations that were used were
as follows*
At K. fraq ilis + T. sphaerica
B: K. fraq ilis + C. u t i l is

C: T. sphaerica + C. u t i l i s
D: K. fraq ilis + T. sphaerica + c. u t i l i s
The results as presented in Table 19 indicated there
were highly significant differences (P<,01) in both percent
reductions of lactose and to ta l solids and percent dry yeast
due to the various combinations that were studied. A signi
ficant difference (P <.05) was also found in percent reduc
tions of protein, COD, and BOD in the same t r ia ls . No signi
ficant effect was found in relation to the final pH due to
any particular combination of yeasts.
Orthogonal comparisons were made to see which of
these combinations was best for u tiliz ing whey nutrients,
for reductions in COD and BOD and for production of ce lls .
The three possible comparison were as follows:
A vs D
A + D vs B + D
B VS C
From th is above comparison i t was noted that there was a
significant difference (PC ,05) between A and D in percent
reduction of lactose. While the difference between the tre a t
ments was s ta tis tic a lly significant, i t was not great and not
sufficient to be of practical importance when C. u t i l i s was
used in combination with K. frag ilis + T, sphaerica. When
A + D was compared to B + C a highly significant (P < .01)

TABLE 19. The effect of mixed yeast cultures on whey fermented at 30 C for 24 h withan a ir flow of 1.5 lite r/m in /lite r and an inoculum of 0.27 g dry c e lls /lite r at pH 6.0.
Percent Reduction In
Combination of Yeast
lactose** Totalsolids**
Protein* COD* BOD* pH Drycells1
K. fraqilis + T. sphaerica (A) 91.30 66.75 4.15 30.92 26.71 5.03 0.47
K. fraqilis + C. u ti l is (B) 85.55 64.25 3.54 23.68 19.88 4.95 0.24
T. sphaerica + C. u ti l is (C) 89.70 65.43 6.48 29.53 24.83 5.00 0.39
K. fraqilis + T. sphaerica + C. u ti l is (D) 92.51 66.80 3.45 31.60 26.71 5.00 0.47
Values are average of two t r i f l s . * (P < .05)** (P < .01)
v O
difference in percent reduction of lactose was found, which
indicated that the combination of K. fraq ilis + T. sphaerica
was a far more beneficial combination than e ither of them
with C. u t i l i s . A comparison of B vs C indicated a highly
significant difference (PC.01) in the percent reduction of
lactose. These resu lts suggest that a mixture of C. u t i l i s
and T. sphaerica was superior to a mixture of C. u t i l i s and
K. fra q ilis in obtaining lactose reduction. This may have
been caused by the competition of K. fraq ilis and C. u t i l i s
for lac tic acid. Lodder (46) reported T. sphaerica probably
did not u til iz e lac tic acid; therefore, there was probably
no competition between T. sphaerica and C. u t i l i s for lac tic
acid.
Orthogonal comparisons were made between the pre
vious combinations for the percent reduction in to ta l solids
and BOD. There was no significant difference between A vs
D, but there was a highly significant difference (P<.01)
between A + D vs B + D in the percent reduction of to ta l
solids and BOD. The difference in percent reduction of
to ta l solids was due primarily to difference in percent re
duction in lactose.
No significant differences were found in percent re
duction of protein between A vs D and A + D v s B + C. A
highly significant difference (P<*01)*was found between

99
B vs C in relation to percent reduction of protein and COD*m
No significant effect on final pH was noted by the different
combinations. No significant differences was apparent when
A vs D was compared, but a highly significant difference
(P <.01) was found between A + D vs B + C and also between
B vs C when they were compared in relation to the percent of
dry yeast production. This difference could have been due
to the ab ility to u tilize lactose.
The results suggest that C. u t i l i s did not sign ifi
cantly aid in to ta l whey nutrient u tiliza tion when used in
combination with K* fraq ilis and T. sphaerica or when used
with each independently. I f the objective is to consider
only yeast growth and i ts capacity for reduction of whey
nutrients, i t is probably better to u tilize C . u ti l is in a
combination with T. sphaerica.
VIII. Potential Applications for Dairy Plant Use
One of the main objectives of th is study was to eval
uate a practical and effic ien t system to u tilize whey in
dairy plants. A plant that processes 50,000 lb of milk into
cheddar cheese per day would produce about 43,000 lb of whey.
I f some sour whey were involved i t would be advantageous to
adjust the pH to near 6.0. A series of fermentation tanks
or round concrete vats could be provided with heating coils
to maintain temperature within the optimum range. D istri
bution lines could provide a ir to the fermentating materials,
A continuous input could be maneged by controlled overflow
and collection of yeast cells could be by centrifugation.
The amount of input or overflow would depend on the amount
of whey available and the time required to keep the whey in
the fermentation tanks. The time would be influenced by the
size of the inoculum and the amount of nutrients to be di
gested, The type of effluent that would result from th is
process would also be controlled by the levels of temperature,
a ir flow, inoculum and time used in the fermentation. I f
maximum cells were desired, minor changes as indicated by
these studies could easily be accomplished. I t was shown
that a high pH could be obtained by increasing the incubation
temperature and the a ir volume. A high pH would aid in com
pletion of digestion of whey effluent in a lagoon system.
According to the results that were found in th is study,
the fermentation of the above 43,000 lb of whey would produce
about 800-1000 lb of wet cells containing about 7 3 percent
moisture. Drying of th is small volume would be insignificant
in contrast to the to ta l Whey volume, Approxim?tely 220 lb of
yeast powder could be obtained with a composition of 45-50%
protein. Within a 24 h time period, the process might be
capable of 90-95% digestion of lactose and 70% reduction in
1 0 1
to ta l solids* The amount of original protein in the whey
would be changed insignificantly; however, the protein would
aid in raising the pH to optimum levels for microorganisms in
an oxidation system* Practice of good sanitation, use of a
pure culture, or a mixture of T. sphaerica and K. fraq ilis
should provide a satisfactory process* Addition of the
centrifuge sludge which contains many bacteria cells, yeast,
and enzymes to the oxidation ponds would aid final digestion
of the whey nutrients to C02 and Use of thi s fcyp® of
process would not require expensive equipment or significant
energy to produce a usable product and aid in the achievement
of the alternative goal of producing an effluent which would
meet the EPA requirement for point source pollution.
SUMMARY
1. Sweet whey obtained from nonhomogenized skim milk,
treated with H2°2 for cold s te riliza tion , was used as a med
ium without nutrient supplements for growing T. sphaerica*
K. fra q ilis . and C. u t i l i s and their possible combinations.
2. The parameters studied in relation to optimum
growth were: a. fermentation temperatures (2 5, 30, and
35 C) b. a ir volumes (1.0 and 1.5 lite r/m in /lite r) and
c. inoculum levels (0.17 and 0.27 g dry c e l ls / l i te r ) . A
pH of 6.0 and a 24 h fermentation time were the same for a ll
t r ia ls . The inoculum was obtained from the previous tr ia ls ,
and the pH was adjusted to 6.0 by use of lac tic acid.
3. Temperature changes showed a highly significant
(P < .01) effect on T. sphaerica in the percent reduction
of lactose, to ta l solids, protein, final pH, and dry cell
yield. The results suggested that 30 C was optimum for T.
sphaerica as indicated by the percent reduction in COD. The
use of 1.5 lite r /m in /lite r over 1.0 lite r /m in /lite r of a ir
flow was nearly optimum as indicated by a significant (P<.05)
increase in the percent reductions in lactose, dry cell
yield, and final pH level. Use of 0.27 g dry c e l ls / l i te r
1 0 2
10 3
over 0,17 g dry c e l l s / l i te r inoculum resulted in a highly
significant (P<*01) increase in percent reduction of
lactose.
4* The maximum percent reductions (P<.01) in lac
tose, to ta l solids, protein, COD, BOD, TOD, final pH, and
dry ce ll yield were noted when K. fraq ilis was grown at 35 C
in contrast to lower tenperatures. The use of 1.5 lite r/m in /
l i t e r over 1.0 l i te r /m in /li te r a ir f l o w indicated a sig n ifi
cant (P <.05) increase in the percent of reductions in lac
tose, final pH, and dry ce lls yield, and the greatest per
cent reductions in COD, BOD, and TOD. The use of 0.27 g
dry c e l l s / l i te r over 0.17 g dry c e l l s / l i t e r inoculum produced
a significant (P < .05) increase in percent reduction in
lactose, a significant (P < .05) decrease in percent reduct
ion of protein, and a highly significant (P < .0.1) increase
in final pH. The greatest percent reductions in COD, BOD,
and TOD were obtained at the maximum inoculum level.
5. Use of Candida u t i l i s resulted in a maximum
lactose reduction of 40% at the highest levels of temperature,
a ir flow volume, and inoculum.
6. Highly significant (P<.01) correlation coeffi
cients were as follows: Percent lactose and to ta l solids
with COD, BOD, and TOD respectively for the original whey
samples; percent of lactose and final pH with COD, BOD, and

1 0 4
TOD respectively for whey effluent samples afte r fermenta
tion; TOD with COD and BOD respectively for whey samples
before and afte r fermentation*
7* These studies suggest that use of either K.
fraq ilis or T* sphaerica individually or in combination gave
the best results in u tiliza tion of whey nutrients reduction
of pollution load, and cell yields than use of other cultures
or combinations of cultures.
BIBLIOGRAPHY
(1) Abd-El-Akher, M. A., A. M. Allan, and N. M. El-Shimy.1974* Production of high protein feed additives from fermented whey# I* Physical studies on cultiva tion of yeast in whey. Chemical Microbiology- Technology der Lebensmittel. 3:81. (From Dairy Sci. A bstr., 1974. 36:597).
(2) American Public Health Association. 1971. Standardmethods for the examination of water and wastewater. 13th ed. American Public Health Association . New York, N.Y.
(3) Amundson, C. H. 1967. Increasing protein content ofwhey. Am, Dairy Rev. 29:96.
(4) Anas, W. 1949. Milk and whey freeze-concentrationexperiments. In t. Dairy Congress. XII:454.
(5) Antila, Vv and M. Antila. 1965. Influence of yeaston the technical properties of long-milk. Sumo Kern. 38:123. (From Dairy Sci. Abstr., 1965. 27:547).
(6) Association of O fficial Analytical Chemists. 1975.O fficial methods of analysis. 12th ed. A. o.A. C. Washington, D.C.
(7) Backmeyer, D. p. 1946. Disposal of cheese whey bedigestion. Sewage Wks J . 20:1115.
(8) Bechtle, R. M. 1974. Conversion of whey solids toan edible yeast ce ll mass. United States Patent 3 818 109 (From Dairy Sci. Abstr., 1975. 37:378),
(9) Bechtle, R. M., and T. J . Cl ay don. 1971. Accelerationfermentation of cheese whey. Developing thesystem. J . Dairy Sci. 54:1595.
1 0 5

1 0 6
(1 0 )
( 11)
( 1 2 )
(13)
(14)
(15)
(16)
(17)
(18)
(1 9 )
Bell, J* M., V. E. Graham, D. L. Gibson, and Wa C.Lawton. 1954* Increasing the food value of whey by yeast fermentation IV. Feeding tr ia ls with mice. Canad. Food Technol. 32:55 (From Dairy Sci. Abstr., 1954. 16:568).
Berntein, S., and T. C. Everson. 1973. Protein production from acid whey-via fermentation. In proceedings Fourth National Symposium on Food Processing Wastes. March 26-28, 1973. Syracuse,New York. Washington, D. C. 2040 2 USA. (From Dairy Sci. Abstr., 1976. 38:14).
Chapman, L.P.J. 1966. Food yeast from whey. N. Z.JL. Dairy Technol. 1:78. (From Dairy Sci. Abstr., 1967. 29:84).
Chapman, L.P.J. 1970* Food yeast from whey. In t.Dairy Congress. XVIII IE:439.
Chu, H. D., J . G. Leeder, and S. G, Gilbert. 1975. Immobilized catalase reactor for use in peroxide s te riliza tion of dairy products. J . of Food Sci. 40:641.
Costamagha, L., and J. Rossi. 1971. Biomass formation from whey by some yeast spp* Industrial Latte. 7:273. (From Dairy Sci. Abstr., 1972. 34:375).
Davidov, R. B., L. E. Gul*ko, and B. I . Faingar. 1963. Enrichment of whey with protein and vitamins. I Z V Timiryazev. Sel1skokhoz. Akad. 5:166. (FromDairy Sci. Abstr., 1965. 27:234).
Dordevic, L., and V. Kolev. 1966. Refreshing beverages from whey. Mljekavstvd. 16:89. (From Dairy Sci. Abstr., 1967. 29:429).
Fenton-May, R. I . , and C. G. H ill, J r . 1971. Use of u ltrafiltra tion /reverse osmosis systems for the concentration of fractionation of whey. J . Food Sci. 36:14.
Feihring, C., Y. Koch, and H. A. Koch. 1972. Development of milk diet from lactose, galactose and glucose. Deutsche Gesundhertswesen 27:311. (From Dairy Sci. Abstr., 1973. 35:137)•
1 0 7
(2 0 )
( 2 1 )
( 2 2 )
(23)
(24)
(25)
(26)
(27)
(28)
(29)
Fonden, R., and L. Petterson. 1974, A simple method to ferment whey. In t. Dairy Congress. XIX IE: 816. (From Dairy Sci. Abstr., 1975. 37:239).
Fraingar, B. I . 1968. Some methods of economicu tiliza tion of whey. Zoolekhniya. (135). 67.(From Dairy Sci. Abstr., 1969. 31:142),
Gibson, D. L., and R. P. Aneja. 1968. Dried animalfeed produced from cheese whey and spent brewers yeast. Canad. Dairy Ice Cream J. 47:13. (FromDairy Sci, Abstr., 1969. 31:185).
G illies, M. T. 1974. Whey processing and u tiliz a tion. Noyes Data Corp., Park Ridge, N. J.
G la ttli, H., and B. Blanc. 1974. Production of yeast biomass from whey. Schweizerische, Milchwirt- schaftliche, Forschung. 3:14. (From Dairy Sci. Abstr., 1975. 37:378).
Goss, E. F. 1953. Techniques of dairy plant testing . Iowa State College. The Iowa State College Press. Ames, Iowa.
Graham, V. E., D. L. Gibson, and H. W. Klemmer. 1953. Increasing the food value of whey by yeast fermentation. I I . Investigations with small-scale laboratory fermenters. Canad. Food Technol.31:92. (From Dairy Sci. Abstr., 1953. 15:702).
Graham, V. E., D. L. Gibson, H. W. Klemmer, and J . M. Naylor. 1953. Increasing the food value of whey by yeast fermentation. I . Preliminary studies of the su itab ility of various yeast. Canad. Food Technol. 31:85. (From Dairy Sci. Abstr., 1953. 15:702) .
Graham, V. E., D. L. Gibson, and W. C. Lawton. 1953. Increasing value of whey by yeast fermentation.I I I . Pilot plant studies. Canad. Food Technol. 31:85. (From Dairy Sci. Abstr., 1953. 15:702).
Hinton, C. L., and T. Macara. 1927. The determination of aldose sugars by means of Chloramine-T with special refurcnce to the analysis of milk products. Analyst. 52:668.
108
(30)
(31)
(32)
(33)
(34)
(35)
(36)
(37)
(38)
(39)
Horton, B. S. 1970* Prevents whey pollution* Recovers profitable by-products. Food Eng. 12:81.
Horton, B, S., W, Eykamp, R. L. Goldsmith, S. Hossain, C. H. Amundson, and R. R. Zall. 1970. Membrane separation processes for the abatement of pollution from whey. In t. Dairy Congress, XVIII 1E:442.
Horton, B. S., R, L. Goldsmith, S. Hassain, and R. R. Zall. 1970. Membrane separation processes for the abatement of pollution from cottage cheese whey. Milk Ind. 67:24, 28, and 32.
Jackson, R. H., and G. W. Watrous, J r . 1954. Newer concepts of dairy waste disposal. J . Dairy Sci.38:231.
James, A., and C. L. Addyman. 1974. By-product recovery from food wastes by microbial protein production. In treatment of wastes from the food and drink industry. Institu te of Water Pollution Control. 149. (Dairy Sci. Abstr., 1976. 38:13).
Jaynes, H. o ., and T. asan. 197 3. Determination of lactose in milk by gas liquid chromatography. J. Milk Food Technol. 36:333.
Kaminski, S. 197 2. Prospects of improving feed protein supply by u tiliza tion of whey. Przemysl Fermentacyjny; I Rolony 16:16. (From Dairy Sci. Abstr., 1973. 35:79).
Kaminski, S. 1972. Yeast production from whey at the Borowo Experimental Station. Przemysl Fermentacy jny; I Rolony. 16:27. (From Dairy Sci. Abstr., 1973. 35:79).
Knight, S., W. Smith, and J . B. Mickle. 1972. Cheese whey disposal using Saccharomvces fraq ilis yeast. Cultured Dairy Prod. J . 7:17 and 20.
Knight, S., W. Smitl'v and J . B. Mickle. 1972. Lactose removal from cheese whey using Saccharomvces f ra q ilis . Miscellaneous Publication. Oklahoma Agricultural Experiment Station No. 87:158.(From Dairy Sci. Abstr., 1973. 35:).

1 0 9
(40)
(41)
(42)
(43)
(44)
(45)
(46)
(47)
(48)
(49)
(50)
Kosikowski, F. 1966. Cheese and fermented milk foods. Edwards Brothers, Inc. Ann Arbor, Michigan.
Krajovan, V., S. Veselinovic, and Z. Vokov. 1967, Production of fodder yeast from whey. Zborn.Rad. Tchnol. Fak. In st. Preh. Ind., Novi Sad 1:83. (From Dairy Sci. Abstr., 1968. 30:371).
Krostitz, W., and F. Zegarra. 1974. Whey and underu tilized protein source. Milk and milk products team basic foodstuffs service commodities and trade division. F.A.O. Rome, Ita ly .
Kyokoto Kagaku Sangyo Co. Ltd. 1970. Cheese wheyadditives. Jap. Pat. 13 429/70. (From Dairy Sci. Abstr., 1971. 33:28).
Ladet, J . , G. Moulin, P. Galzji, J . L. Joux, and F. Duval-Biju. 1972. Comparison of growth yields on lactose of some strains of Kluvveromvces Van der Walt. Lait. 52:613. (From Dairy Sci. Abstr., 197 3. 35:304).
Lefrancois, L., and V. Naiditch. 1971. Treatment of whey to obtain a food product. French Pat. 2049, (From Dairy Sci. Abstr., 1972. 34:802).
Lodder, J . 1970. The yeast. A taxonomic study. 2nd ed. North-Holland Publishing Company-Amsterdam. London.
Madsen, R. F., 0. J . Olsom, and W. K. Nielsen. 1970. Whey processing by reverse osmosis and u l t r a f i l tra tion . Nord. M ejeritidsskr. 36:185. (From Dairy Sci. Abstr., 1971. 33:287).
Marshall, P. G., W. L. Dunkley, and E. Lowe. 1968. Fractionation & concentration of whey by reverse osmosis. Food Technol. 22:969.
McDonough, F. E. 1971. Membrane processing, a new tool for whey disposal. Dairy Ind. 36:507.
McDonough, F. E., and W. A. Mattingly. 1970. P ilot- plant concentration of cheese whey by reverse osmosis. Food Technol. 24:194.
1 1 0
(51)
(52)
(53)
(54)
(55)
(56)
(57)
(58)
(59)
( 60)
McKenna, B. M. 1970* Reverse osmosis, a new concept in concentration for the dairy industry. Dairy Ind. 35:755.
Mergl, M., and J . Siman. 1963. Dried yeast feeding- stuffs from fermented whey. Drubeznictvi. 11:136. (From Dairy Sci. Abstr., 1965. 27:65).
Metwally, M. &., and C. H. Amundson, J. C. Garver and R. M. Shackleford. 1964. Preparation and u til iz a tion of protein-enriched food supplement from fermented whey. (Abstr.) J . Dairy Sci. 47:680.
Mickle, J . B., W. Smith, D. Halter, and S. Knight.1974. Performance and morphology of Kluyveromyces fraq ilis and Rhodotorula fraq ilis grown in cottage cheese whey. J . Food Technol. 37:481.
Moulin, G., P. Galzy, and J . L. Joux. 1974. Remarks on the production of single cell yeast on whey.IV. Internationa1 Congress of Food Scienee and Technology 4a:32. (From Dairy Sci. Abstr., 1975. 37:341).
Muller, W.R. 1949. Contribution to production ofyeast whey. Midchwissenschaft 3:147. (From Dairy Sci. Abstr., 1950. 12:119).
Muller, L. L. 1969. Yeast products from whey. Process Biochem. 4:21 and 26. (From Dairy Sci. Abstr., 1969. 31:185),
Naiditch, V. 1960* Method and equipment for the treatment of whey. French Pat. 1 235 978.(From Dairy Sci. Abstr., 1965. 27:64).
Naiditch, V. 1965. Method and plant for treatingwhey. Franch Pat. 86 177. Addition to 1 235 978. (From Dairy Sci. Abstr., 1968. 30:104).
Nakanishi, T., and I . Arai. 1972. Studies on lactose- fermenting yeasts. V. Changes in viable count, protein and lactose consumption in viable lactose containing media inoculated with the yeast.Japanese Journal of Dairy Sci. 21:A45. ( FromDairy Sci. Abstr., 1973. 35:134).

I l l
(6 1 )
(62)
(63)
(64)
(65)
( 66)
(67)
( 68)
(6 9 )
Nakanishi, T., and 1* Arai. 1972. Studies on lactose- fermenting yeast. VI. Investigations of the productions of ethanol fermented milk beverages by the mixed cultures with lactose-fermenting yeasts and lac tic acid bacteria. Japanese Journal of Dairy Sci. 21:A63. (From Dairy Sci. Abstr., 1973. 35:134).
Nielsen, W. K. 1974. Industrial membrane f iltra tio n plants. Maelkeritidende 87:1099. (From Dairy Sci. Abstr., 1975. 37:68).
Pechyulis, Y. P. 1972* U tilization of waste materials of food and meat/milk industries in yeast production. Pishchevaya Tekhnologiya No. 4:110. (From Dairy Sci. Abstr., 1974. 36:160).
Perzow, B. 1974. Fermentation of whey. In proceeding of the whey u tiliza tion symposium, June 27-28,1974. Ottawa Canada, Canada Department of Agriculture. 1974. (From Dairy Sci. Abstr., 1975. 37:520) .
Popova, M, G., S. S. Gulaev-Zaitsew, R. V. Keniksoova,A. S, Tihomirova, and A. K. Kulikova. 1974. Hydrolysis of lactose by the enzyme preparation B-galactosidase (lactase) in milk and milk products. In t. Dairy Congress XIX IE:353. (From Dairy Sci. Abstr., 1975. 37:208).
Porgers, N., J. B. Pepinsky, and L. F. Jasewics. 1951. Food yeast from dairy by-products. J . Dairy Sci. 34:615.
Ramsdell, G. A., and B. H. Webb. 1938. Sweetened condensed whey: I ts manufacture and properties. J .Dairy Sci. 21:305.
Reesen, L., and J . Arnold. 197 3. New consideration on complete u tiliza tio n of whey. Nordeuropaeisk.M ejeri-Tidsskrift• 39:95 and 106. (From Dairy Sci. Abstr., 1974. 36:44)•
Rogosa, M., H. H. Browne, and E. o. W hittier. 1947.Ethyl alcohol from Whey. J . Dairy Sci. 30:263.
1 1 2
(70)
(71)
(72)
(73)
(74)
(75)
(76)
(77)
(78)
(79)
Rorger, M., J . B. Pipinsky, N. C. Hendler, and S. R. Hoover. 1950. Biochemical oxidation of dairy waste. I . Methods of study. Sewage Industr. Wastes. 22:318.
Ruf/ H., and L. P. Warrick. 1934. Milk waste tre a tment studies in Wisconsin. Sewage Wks. J . 6:580.
Sammon, D. C. 1974. Membrane processes. Pure and applied chemistry. 37:42 3. (From Dairy Sci. Abstr., 1975. 37:65).
Satterlee, L. D. 1975. Improving u tiliza tio n ofanimal by-products for human foods-A reveiw. J . Anim. Sci* 41:687.
Shamgin, V. K., L. S. Zalashko, and A. M. Mixyakina.1974. Production of whole milk replacer by the biological processing of whey. In t. Dairy Congress* XIX IE:750. (From Dairy Sci. Abstr.,1975. 37:263).
Siman, J . , and M. Mergl. 1961. Manufacture of liquid yeast food from whey. Zpravy Vyzkamneho ustavu mlekarerskeho. 9:10. (From Dairy Sci. Abstr., 1962. 24:186).
Siman, J ., and M. Mergl. 1962. Growth of strains of Torulopsis and Candida in whey with added sources of inorganic N and P. Potravin Tech.6:127. (From Dairy Sci. Abstr., 1964. 26:175).
Simek, F., J . Kovacs, and I . Sarkany. 1964. Production of fodder yeast using dairy by-products. T ijipar. 13:75. (From Dairy Sci. Abstr., 1965. 27:155).
Snedecor, G. W. 1957. S ta tis tica l methods, 5th ed. Iowa State College Press, Ames, Iowa.
Surazynski, A. 1970 Effect of type of medium of B-lVGalactosidase activating of Saccharomyces f ra g ilis* Postepy Mikrobiologii. 9:529. (From Dairy Sci. Abstr., 1973. 35:92)•
1 1 3
( 8 0 )
(81)
(82)
(83)
(84)
(85)
( 86)
(87)
( 88)
(89)
Surazynski, A., J . Chudy, and Z. Aleksiejczyk. 1967. Biological value of protein of the dried yeasted whey powder. J . Nutr. Dietet- 4:118- (From Dairy Sci. Abstr,, 1968. 30:43).
Surazynski, A., S. Poznanski, W. Chojnowski, Z.Mrozek, and L. Rogala. 1974- Preparation and use of B-D-Galactosidase for lactose hydrolysis in milk. Technologia Zyvnosic 4, 77- (From Dairy Sci. Abstr-, 1975. 37:618).
The American Type Culture Collection. 1974. Catalogue of strains. Rockville, Maryland.
Thibaudat, C. 1964. U tilization of whey for the production of yeast preparation for feeding animals. Industr. Lait. (209) 131. (From Dairy Sci. Abstr.,1964. 26:313).
Tomisek, J . , and V. Gregr. 1961. Yeast protein manufacture from whey. Vyroba Kvasnicnych bilkovin Ze syrovantky. 7:130- (From Dairy Sci. Abstr., 1962- 24:20).
Vananuvat, P., and J . E- Kinsella. 1974. Amino acid composition of protein isolates from Saccharomvces f ra q ilis . J . Agric. Food. Chem. 23:595.
Vananuvat, P., and J . E. Kinsella- 1975. Production of yeast protein from crude lactose by Saccharo- myces fraq ilis . Batch culture studies. J . Food Sci. 40:336.
Vananuvat, P., and J . E. Kinsella. 1975. Protein production from crude lactose by Saccharomvces fraq ilis continuous culture studies. J . Food Sci. 40:823.
Vernois, G. 1970. Culture of fodder yeasts on milk serum from cheese making and i ts influence on water pollution. Lait. 50(493/494) 137. (From Dairy Sci. Abstr., 1971. 33:287).
Vrignaud, Y. 1971. Lactic yeasts. Revne de 1*In s titu t pasteur de lyon. 4:147. (From Dairy Sci. Abstr., 1974- 36:363).
1 1 4
(90)
(91)
(92)
(93)
(94)
(95)
(96)
(97)
(96)
(99)
(1 0 0 )
Wagner, K., and J. Meyrath. 1974. Identification of lactose assimilating yeast by numerical taxonomy.In preceeding of the Fourth International Symposium on yeast. (Abstr.)• (From Dairy Sci. Abstr.,1976. 38:196).
Ward, K. W. 1970. Whey processing. Industrial processing of whey today. Foremost Foods'Company.San Franciso, Calif.
Wasserman, A. E. 1960. The rapid conversion of whey to yeast. Dairy Eng. 77:374.
Wasserman, A.E. 1960. Whey u tiliza tion I I . Oxygen requirement of Saccharomvces fraq ilis growing in whey medium. Appl. Microb. 8:291.
Wasserman, A. E. 1960. Whey u tiliza tion , IV. Availab ility of whey nitrogen for the growth of Sacch- aromyfces f ra q ilis . J . Dairy Sci. 43:1231,
Wasserman, A. E. 1961. Amino acid and vitamin composition of Saccharomvces fraq ilis grown in whey.J . Dairy Sci. 44:379.
Wasserman, A. E., and J . W. Hampson. 1960. III .Oxygen absorption rate and the growth of Saccharomvces fraq ilis in several propagators. Appl. Microb. 8:293.
Wasserman, A. E., and J . W. Hampson. 1961. Wheyu tiliza tion V-Growth of Saccharomyces fraq ilis in whey in a p ilo t plant. J . Dairy Sci. 44:387.
Wasserman, A. E., J . W. Hampson, and N. F. Alvare.1961. Large-scale production of yeast in whey.J . Water Pollution Control Fed. 33:1094.
Wasserman, A* E,, W. J . Hopkins, and H. Porges. 1958. Whey u tiliza tion growth conditions for Saccharomvces f ra q ilis . Sewage Industr. Wastes. 30:913.
Wasserman, A. E., W. J . Hopkins, and J . Porges. 1959. Rapid conversion of whey to yeast. In t. Dairy Congress XV:1241.
1 1 5
(1 0 1 )
( 1 0 2 )
(103)
(104)
(105)
(106)
(107)
(108)
(1 0 9 )
Webb, B. H., and G. A. Ramsdell. 1936* The u ti l iz a tion of whey in preparation of some new food products. J . Dairy Sci. 19:502.
Webb, B. H., and E. O. Whitter. 1948. The u ti l iz a tion of whey. A review. J . Dairy Sci. 31:139.
Weisberg, S. M., and H. I . Goldsmith. 1969. Whey for food and feed. Food Technol. 23:186.
Wendorff, W. L., C. H. Amundson, and N. F. Olsom.1965. Production of lactose by Saccharomvces fraq ilis yeast fermentation of whey. J . Dairy Sci. 48:769.
Wix, P., and M. Woodbine. 1958. The Disposal andu tiliza tio n of whey. A review. Part I and Part I I . Dairy Sci. Abstr., 20:538 and 622.
Yakovenko, A. 1962. Whey concentrate rich in prote in and vitamins. Mol. Prom. 23:24. (From Dairy Sci. Abstr., 1962. 24:338).
Zalashko, L. S. 1968. Growth of fodder yeast in whey. In Uspekhi tekhnicheskoi Mikrobiologil.(From Dairy Sci. Abstr*, 1971. 33:551).
Zalashko, L. S., V. S. Olehko, and V. I . Tavigun.1973. Growth and accumulation of yeast biomass in d ifferent types of whey. In Ispol' zovanie Mikroorganizmov i ikh Metabolitov v Narodnom Khozyaistve. 31. (From Dairy Sci. Abstr., 1975. 37:618.)
Zalashko, L. S., V. I . Tsvigun, and V. S. Oleshko.197 3. Conditions of culturing Torulopisis Candida FK yeast on whey. In Ispo l1zovanie Mikroorganizmov i ikh Metabolitov v Narodnom Khozyaistve. 25.(From Dairy Sci. A bstr., 1975. 37:471).

APPENDICES
1 1 6

APPENDIX TABLES
1 1 7

A p p e n d ix T a b le 1
The effect of pH levels on whey* fermented at 30 C for 24 h with an inoculum of 0.17 g dry c e lls /l i te r and an a ir flow of 1.0 lite r/m in /lite r by T. sphaerica
pH Trials Dupl.**
After fermentation Percent reductionFinalPH
DrycellsLactose T.S. Prote in Lactose T.S. Protein
-(wt %). — (%) — (wt %)
1 a 0.29 1.977 0.811 94.59 71.92 10.42 4.30 0.97b 0.26 1.994 95.14 71.68 0.96
6.52 a 0.34 1.957 0.841 93.46 69.83 14.02 4.30 0.55
b 0.34 1.952 93,46 69.90 0.54
1 a 0.23 1.950 0.778 95.68 72.30 14.10 4.30 0.95b 0.31 1.914 94.05 72.81 0.95
6.02 a 0.37 1.952 0.832 92.92 69.90 14.98 4.30 0.51
b 0.37 1.959 92.92 69.80 0.46
1 a 0.27 2.050 0.824 94.78 70.98 9.06 4.20 0.96b 0.33 2.032 93.79 71.14 0.97
5.52 a 0.34 1.994 0.869 93.46 69.25 11.20 4.35 0.58
b 0.34 2.013 93.46 68.96 0.58
* Whey c o m p o s i t io n : 5 .26% l a c t o s e , 6 .76% t o t a l s o l i d s , and 0 .94% p r o t e i n .** D u p l i c a t e
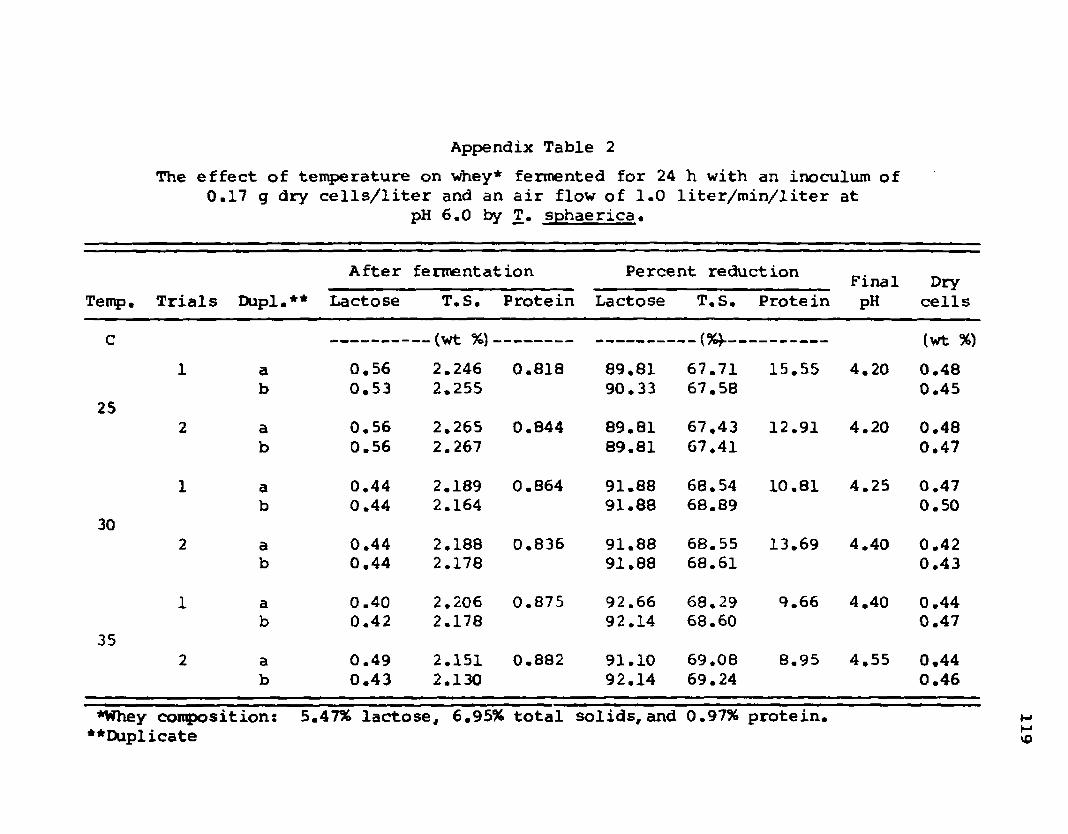
A p p e n d ix T a b le 2
The effect of temperature on whey* fermented for 24 h with an inoculum of 0.17 g dry c e lls /lite r and an a ir flow of 1.0 lite r/m in /lite r at
pH 6.0 by T. sphaerica.
Temp. Trials Dupl.^*
After fermentation Percent reductionPinalpH
DrycellsLactose T.S. Protein Lactose T.S. Protein
c — (wt %)-— --------------- --------------------- — (%}>------- ---------------------- (wt %)
1 a 0.56 2.246 0.818 89.81 67.71 15.55 4.20 0.48b 0.53 2.255 90.33 67.58 0.45
252 a 0.56 2.265 0.844 89.81 67.43 12.91 4.20 0.48
b 0.56 2.267 89.81 67.41 0.47
1 a 0.44 2.189 0.864 91.88 68.54 10.81 4.25 0.47b 0.44 2.164 91.88 68.89 0.50
302 a 0.44 2.188 0.836 91.88 68.55 13.69 4.40 0.42
b 0.44 2.178 91.88 68.61 0.43
1 a 0.40 2.206 0.875 92.66 68.29 9.66 4.40 0.44b 0.42 2.178 92.14 68.60 0.47
352 a 0.49 2.151 0.882 91.10 69.08 8.95 4.55 0.44
b 0.43 2.130 92.14 69.24 0.46
*Whey c o m p o s i t io n : 5 .47% l a c t o s e , 6 .95% t o t a l s o l i d s , and 0 .97% p r o t e i n .♦ ♦ D u p l ic a t e
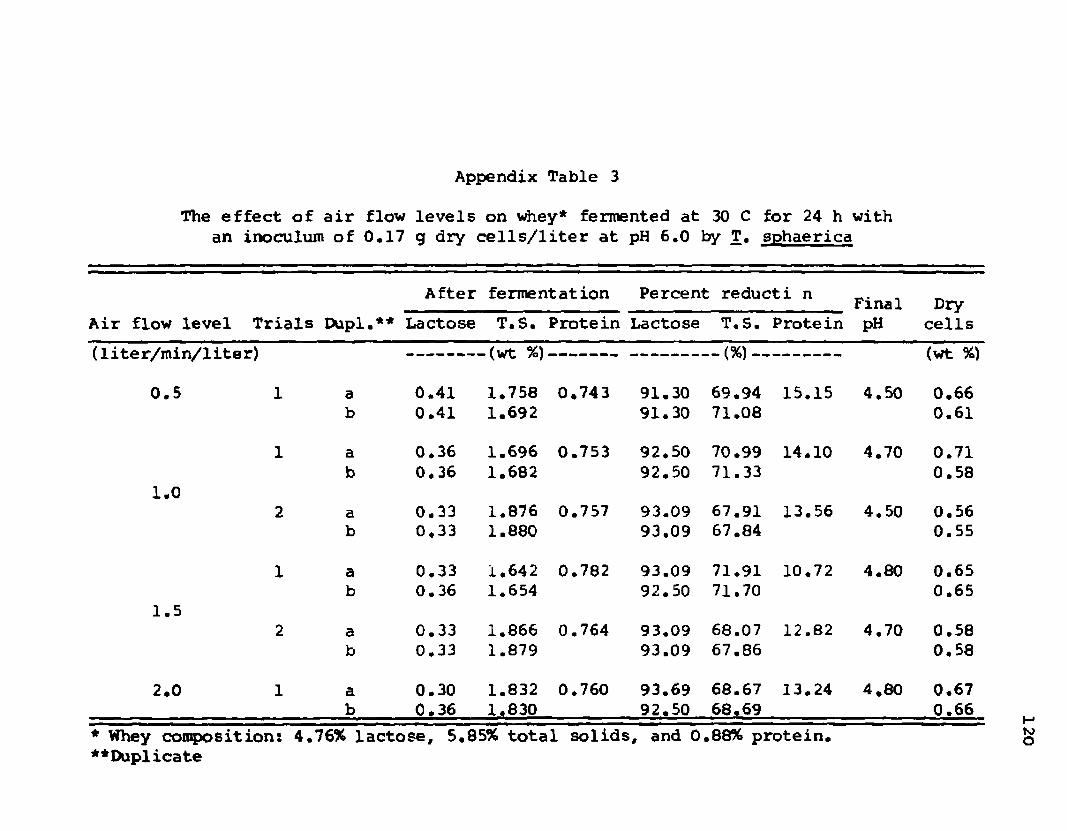
A p p e n d ix T a b le 3
The e f f e c t o f a i r f lo w l e v e l s o n w hey* fe r m e n te d a t 30 C f o r 24 h w it han in o c u lu m o f 0 . 1 7 g d r y c e l l s / l i t e r a t pH 6 . 0 by T , s p h a e r ic a
Air flow level Trials Dupl.**
After
Lactose
fermentation
T.S. Protein
Percent
Lactose
reducti n
T.S. ProteinFinalpH
Drycells
(1ite r/min/1ite r) -(wt %) ----------------- -(%)------------------ (wt %)
0.5 1 a 0.41 1.758 0,743 91.30 69.94 15.15 4.50 0.66b 0.41 1.692 91.30 71.08 0.61
1 a 0.36 1.696 0.753 92.50 70.99 14.10 4.70 0.71b 0.36 1.682 92.50 71.33 0.58
1.02 a 0.33 1.876 0.757 93.09 67.91 13.56 4.50 0.56
b 0.33 1.880 93.09 67.84 0.55
1 a 0.33 1.642 0.782 93.09 71.91 10.72 4.80 0.65b 0.36 1.654 92.50 71.70 0.65
1.52 a 0.33 1.866 0.764 93.09 68.07 12.82 4.70 0.58
b 0.33 1.879 93.09 67.86 0.58
2.0 1 a 0.30 1.832 0.760 93.69 68.67 13.24 4,80 0.67b 0.36 1.830 92.50 68.69 0.66
* Whey c o m p o s i t io n : 4 .76% l a c t o s e , 5.85% t o t a l s o l i d s , and 0 .8 8 % p r o t e i n ,♦ ♦ D u p l ic a t e

A p p e n d ix T a b le 4
The e f f e c t o f in o c u lu m l e v e l s o n w hey* fe r m e n te d a t 30 C f o r 24 h w i t h ana i r f lo w o f 1*0 l i t e r / m i n / l i t e r a t pH 6 * 0 b y T . s p h a e r i c a .
Inoculumdrycells Trials Dupl.**
After fermentation Percent reductionFinalpH
DrycellsLactose T.S. Protein Lactose T.S. Protein
(g/liter) (wt %)- — (%) — (wt %>
1 a 0.48 2.323 0.864 91,00 65.72 8.62 4.45 0.53b 0.48 2.317 91.00 65.61 0.56
0.072 a 0.39 2.358 0,921 92.93 64.90 2.64 4.40 0.48
b 0.39 2.362 92.93 64.84 0.50
1 a * 0.45 2.248 0.862 91.53 66.54 8.89 4.60 0.55b 0.42 2.266 92.06 66. 28 0.36
0.172 a 0.36 2.331 0.915 93.26 65.29 3.23 4.40 0.50
b 0.36 2.322 93.26 65.44 0.54
1 a 0.44 2.258 0.861 91.74 66.39 8.96 4.65 0.58b 0.44 2.257 91.74 66.41 0.58
0.272 a 0.33 2.264 0.905 93.76 66.29 4.35 4,60 0.54
b 0.33 2.245 93.76 66.59 0.56
* Whey c o m p o s i t io n : 5*28% l a c t o s e , 6 .72% t o t a l s o l i d ^ and 0*95% p r o t e i n *** D u p l i c a t e

A p p e n d ix T a b le 5
The effect of fermentation times on whey* fermented at 30C with an air flow of 1,0 1iter/m in/1iter and an inoculum of 0.17 g dry c e lls /lite r at pH 6.0 by T. sphaerica.
Time Trials Dupl.**
After fermentation Percent reductionFinalpH
DrycellsLactose T.S. Protein Lactose T.S. Protein
h -(wt %)■ — (%)-- (wt %)
1 a 1.02 3.011 0.945 80.15 56.60 7.59 4.50 0.12b 1.05 3.006 79.59 56.67 0.13
162 a 1.16 2.960 0.973 77.36 57.33 4.82 4.50 0.07
b 1.16 2.969 77.36 57.21 0.07
1 a 0.39 2.541 1.032 92.46 63.39 _ _ — 4.40 0.48b 0.39 2.581 92,46 62.80 0.48
242 a 0.39 2.561 0.991 92.46 63.08 3.09 4.40 0.49
b ,0.39 2.569 92.46 62.97 0.46
1 a 0.34 2.572 1.093 93.30 62.92 — * — 4.50 0.54b 0.23 2.583 95.53 62.76 0.53
322 a 0.29 2.557 1.031 94.42 63.14 ----- 4.70 0.48
b 0.29 2.579 94.42 62.83 0.45
* Whey c o m p o s i t io n : 5.4% l a c t o s e , 6 .94% t o t a l s o l i d s and 1.02% p r o t e i n .** D u p l i c a t e
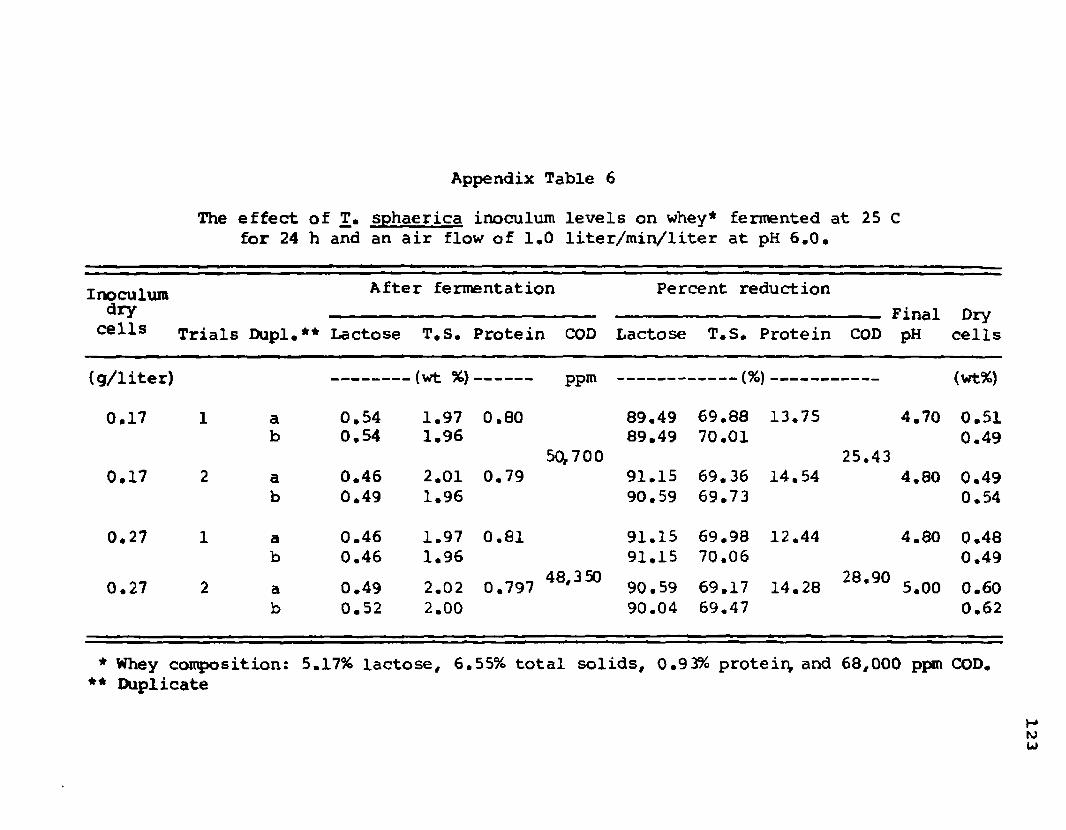
A p p e n d ix T a b le 6
The e f f e c t o f T . s p h a e r ic a in o c u lu m l e v e l s o n w hey* fe r m e n te d a t 25 Cf o r 24 h and an a i r f lo w o f 1 , 0 l i t e r / m i n / l i t e r a t pH 6 . 0 ,
Inoculumdry
cells Trials Dupl.**
After fermentation Percent reduction_ Pinal Dry
cellsLactose T.S. Protein. COD Lactose T.S, Protein COD pH
(g/liter) (wt %) ppm ---------------- ---------(%) --------------- -------- (wt%)
0.17 1 a 0.54 1.97 0.80 89.49 69.88 13.75 4.70 0.51b 0.54 1.96 89.49 70.01 0.49
50,7 0 0 25.430.17 2 a 0.46 2.01 0.79 91.15 69.36 14.54 4.80 0.49
b 0.49 1.96 90.59 69.73 0.54
0.27 1 a 0.46 1.97 0.81 91.15 69.98 12.44 4.80 0.48b 0.46 1.96 91,15 70.06 0.49
0.27 2 a 0.49 2.02 0.79748,3 50
90.59 69.17 14.2828.90 e
5.00 0.60b 0.52 2.00 90.04 69.47 0.62
* Whey c o m p o s i t io n : 5.17% l a c t o s e , 6 .55% t o t a l s o l i d s , 0 .93% p r o t e ir v and 6 8 ,0 0 0 ppm COD.** D u p l i c a t e
123
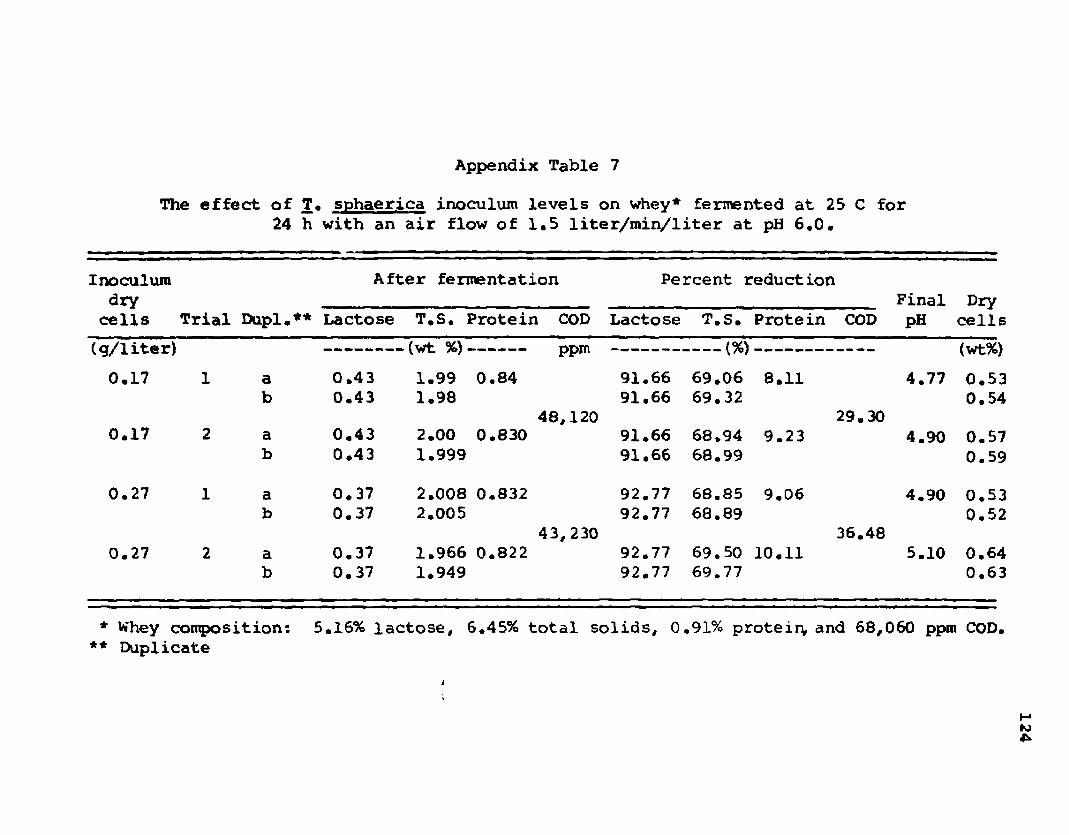
A p p e n d ix T a b le 7
The e f f e c t o f T . s p h a e r ic a in o c u lu m l e v e l s o n w h ey* f e r m e n te d a t 25 C f o r24 h w i t h an a i r f lo w o f 1 . 5 l i t e r / m i n / l i t e r a t pH 6 . 0 .
Inoculum After fermentation Percent reductiondry Pinal Dry
cells Trial Dupl.** Lactose T.S. Protein COD Lactose T.S. Protein COD pH cells
(g/liter) — (wt %)- ppm --------------- -------(%) --------------------------- (wt%)
0.17 1 a 0.43 1.99 0.84 91.66 69.06 8.11 4.77 0.53b 0.43 1.98 91.66 69.32 0.54
48,120 29.300.17 2 a 0.43 2.00 0.830 91.66 68.94 9.23 4.90 0.57
b 0.43 1.999 91.66 68.99 0.59
0.27 1 a 0.37 2.008 0.832 92.77 68.85 9.06 4.90 0.53b 0.37 2.005 92.77 68.89 0.52
43,230 36.480.27 2 a 0.37 1.966 0.822 92.77 69.50 10.11 5.10 0.64
b 0.37 1.949 92.77 69.77 0.63
* Whey c o m p o s i t io n : 5 .16% l a c t o s e , 6 .45% t o t a l s o l i d s , 0 .91% p r o t e ir v and 6 8 ,0 6 0 ppm COD.** D u p l ic a t e
124

A p p e n d ix T a b le 8
The e f f e c t o f T . s p h a e r ic a in o c u lu m l e v e l s o n w hey* fe r m e n te d a t 30C f o r24 h w i t h an a i r f lo w o f 1 - 0 l i t e r / m i n / l i t e r a t pH 6 . 0 .
Inoculumdry
cells Trial Dupl.**
After fermentation Percent reductionFinalpH
DrycellsLactose T.S. Protein COD Lactose T.S. Protein COD
(g/liter) -(wt %) ppm -----------------------(%) -------------------------- (wt%)
0.17 1 a 0.44 2.132 0.884 91.51 67.46 6.78 4.70 0.51b 0.44 2.143 91.51 67.28 0.51
0.17 2 a 0.42 2.151 0.883 91.96 67.17 6.86 4.60 0.55b 0.42 2.143 91.96 67.28 0.55
0.27 1 a 0.42 2.080 0.885 91.96 68.24 6.65 4.85 0.53b 0.36 2.057 93.07 68.60 0.53
43,840 35.660.27 2 a 0.36 2.186 0.905 93.07 66.64 4.61 4.50 0.47
b 0.33 2.220 93.62 66.10 0.50
* Whey composition: 5.16% lactose, 6.55% total solids, 0.95% protein, and 68,130 ppm COD.** Duplicate

A p p e n d ix T a b le 9
The e f f e c t o f T . s p h a e r ic a in o c u lu m l e v e l s o n w hey* fe r m e n te d a t 30 C f o r24 h w i t h an a i r f lo w o f 1 , 5 l i t e r / m i n / l i t e r a t pH 6 , 0 .
Inoculumdry
cells Trials Dupl.**
After fermentation Percent :reduction Pina]L Dry cellsLactose T.S., Protein COD Lactose T.S• Protein COD pH
(g/liter) — (wt %)------ ppm (%)-------------- (wt%)
0.17 1 a 0.34 2.107 0.684 93.33 67.54 5.02 4.70 0.55b 0.29 2.113 94.44 67.45 0.56
0.17 2 a 0.29 2.106 0.874 94.44 67.56 6.12 4.60 0.53b 0.29 2.102 94.44 67.62 0.52
0.27 1 a 0.32 2.111 0.873 93.89 67.49 6.09 4.75 0.53b 0.29 2.117 94.44 67.39 0.55
40,750 41.500.27 2 a 0.29 2.035 0.901 94.44 68.66 3.16 4.90 0.60
b 0.29 2.042 94.44 68.55 0.60
* Whey c o n p o s i t i o n : 5 .16% l a c t o s e , 6 .49% t o t a l s o l i d s , 0 .93% p r o t e i n , and 6 9 ,6 5 0 ppm COD.** I m p l i c a t e

A p p e n d ix T a b le 10
The e f f e c t o f T . s p h a e r ic a in o c u lu m l e v e l s o n w hey* fe r m e n te d a t 35 C f o r24 h w i t h an a i r f lo w o f 1 * 0 l i t e r / m i n / l i t e r a t pH 6 .0 #
Inoculumdry
cells Trials Dupl.**
After fermentation Percent reductionFinalpH
DrycellsLactose T.S. Protein COD Lactose T.S. Protein COD
(g/liter) (wt %)~-------------- ppm ---------------- ----------{%)-------------------------- (wt%)
0.17 1 a 0.34 1.963 0.842 92.89 68.68 7.49 5.20 0.42b 0.34 1.960 92.89 68.72 0.46
0.17 2 a 0.34 1.919 0.864 92.89 69.39 5.10 5.90 0.41b 0.34 1.935 92.89 69.14 0.42
0.27 1 a 0.32 2.053 0.855 93.49 67.25 6.09 4.8 0.42b 0.32 2.079 93.49 66.84 0.41
43,180 35,100.27 2 a 0.29 1.987 0.849 94.08 68.31 6.76 5.00 0.37
b 0.34 2.032 92.89 67.59 0.42
* Whey c o m p o s i t io n : 4*84% l a c t o s e , 6 ,27% t o t a l s o l i d s , 0 .91% p r o t e i i v and 6 6 ,5 3 0 ppm COD.♦ ♦ D u p l ic a t e

A p p e n d ix T a b le 11
The e f f e c t o f T , s p h a e r ic a in o c u lu m l e v e l s o n w hey* fe r m e n te d a t 35 C f o r24 h w i t h an a i r f lo w o f 1 . 5 l i t e r / m i n / l i t e r a t pH 6 . 0 .
Inoculumdry
cells Trials Dupl.**
After fermentation Percent reductionFinalpH
DrycellsLactose T.S. Protein COD Lactose T.S. Prote in COD
(g/liter) (wt %)------------- ppm ------ --------- --------(%) ----------------- --------- (wt%)
0.17 1 a 0.47 1.935 0.793 45,800 90.92 69.01 14.91 35.68 5.40 0.49b 0.47 1.936 90.92 69,89 0.49
0.17 2 a 0.53 1.907 0.796 44,700 89.79 70.34 14.53 37.24 5.80 0.56b 0,42 1.914 92.06 70.24 0.51
0.27 1 a 0.53 1.977 0.790 44,700 89.79 69.25 15.23 37.24 5.25 0.54b 0.42 1.977 92.06 69.25 0.47
0.27 2 a 0.42 1.968 0.797 44,320 92.06 69.55 14.50 37.76 5.25 0.54b 0.42 1,962 92.06 69.49 0,53
* Whey c o m p o s i t io n : 5.23% l a c t o s e , 6 .83% t o t a l s o l i d s , 0 .93% p r o t e i n , and 7 1 ,2 2 0 ppm COD.* * I X ip l ic a t e
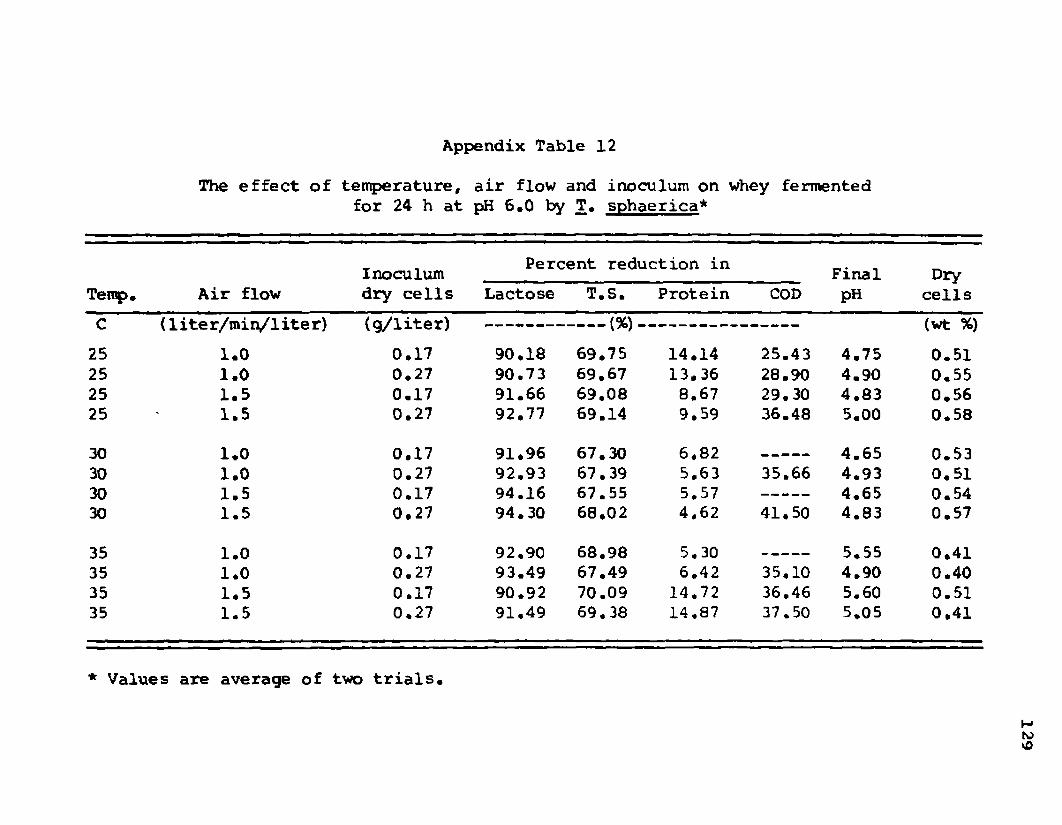
A p p e n d ix T a b le 12
The e f f e c t o f t e m p e r a t u r e , a i r f lo w and in o c u lu m o n w hey fe r m e n te df o r 24 h a t pH 6 .0 b y T . s p h a e r i c a *
Inoculum Percent reduction inFinal Dry
Temp. Air flow dry cells Lactose T.S. Protein COD pH cells
C {1ite r/min/1ite r ) (g/liter) ----------<%)_. (wt %)25 1.0 0.17 90.18 69.75 14.14 25.43 4.75 0.5125 1.0 0.27 90.73 69.67 13.36 28.90 4.90 0.5525 1.5 0.17 91.66 69.08 8.67 29.30 4.83 0.5625 1.5 0.27 92.77 69.14 9.59 36.48 5.00 0.58
30 1.0 0.17 91.96 67.30 6.82 W _ — — — 4.65 0.5330 1.0 0.27 92.93 67.39 5.63 35.66 4.93 0.5130 1.5 0.17 94.16 67.55 5.57 ------------ — 4.65 0.5430 1.5 0.27 94.30 68.02 4,62 41.50 4.83 0.57
35 1.0 0.17 92.90 68.98 5.30 — _ 5,55 0.4135 1.0 0.27 93.49 67.49 6.42 35,10 4.90 0.4035 1.5 0.17 90.92 70.09 14.72 36.46 5.60 0.5135 1.5 0.27 91.49 69.38 14.87 37.50 5,05 0.41
* Values are average of two tr ia ls .

A p p e n d ix T a b le 1 3
The e f f e c t o f K. f r a q i l i s in o c u lu m l e v e l s o n w hey* fe r m e n te d a t 25 C f o r24 h w i t h a n a i r f lo w o f 1 .0 1 i t e r / m i n / 1 i t e r a t pH 6 . 0 .
Inoculumdrycells Trials Dupl.**
After fermentation Percent reductionFinalpH
DrycellsLactose T.S. Protein COD Lactose T.S. Protein COD
(g/liter) -(wt %) ppm ---------------- ------------ (%)---------------------- (wt%)
0.17 1 a 0.75 2.185 0.820 61,610 86.22 67.75 10.81 16.67 4.40 0.36b 0.75 2.205 86.22 67.45 0.34
0.17 2 a 0.70 2.168 0.813 61,010 87.26 68.00 11.53 17.49 4.35 0.34b 0.70 2.218 87.26 67.27 0.29
0.27 1 a 0.58 2.165 0.854 60,800 89.34 68.05 7.15 17.75 4.40 0.35b 0.55 2.140 89.86 68.42 0.38
0.27 2 a 0.58 2.104 0.832 60,600 89.34 68.89 9.54 18.03 4.45 0.35b 0.58 2.114 89.34 68.80 0.34
* Whey c o m p o s i t io n : 5.47% l a c t o s e , 6 .78% t o t a l s o l i d s , 0 .94% p r o t e in # a n d 7 3 ,9 4 0 ppm COD.♦ ♦ D u p l ic a t e
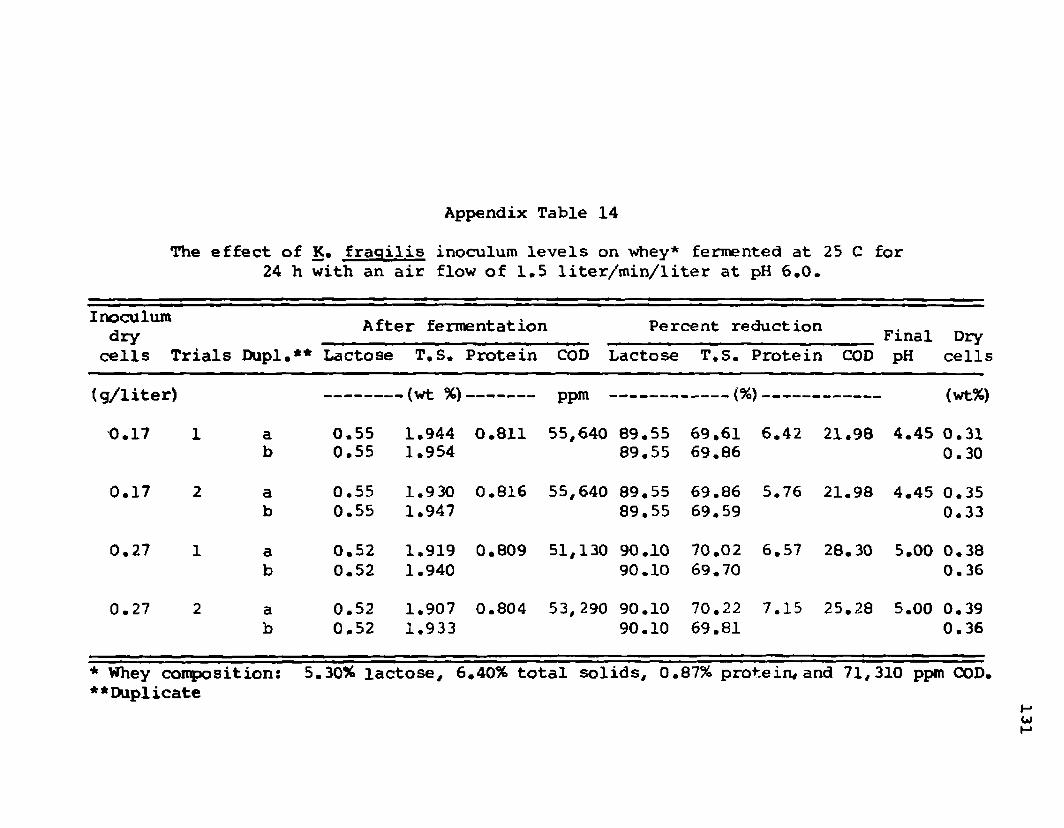
A p p e n d ix T a b le 14
The e f f e c t o f K. f r a q i l i s in o c u lu m l e v e l s on w hey* fe r m e n te d a t 25 C f o r24 h w i t h a n a i r f lo w o f 1 . 5 1 i t e r / m i n / 1 i t e r a t pH 6 . 0 .
Inoculumdry
cells Trials Dupl.**
After fermentation Percent reductionFinalpH
DrycellsLactose T.S. Prote in COD Lactose T.S. Protein COD
(g/liter) .(wt %) ppm -------------------------- (%)-------------- (wt%)
0.17 1 a 0.55 1.944 0.811 55,640 89.55 69.61 6.42 21.98 4.45 0.31b 0.55 1.954 89.55 69.86 0.30
0.17 2 a 0.55 1.930 0.816 55,640 89.55 69.86 5.76 21.98 4.45 0.35b 0.55 1.947 89.55 69.59 0.33
0.27 1 a 0.52 1.919 0.809 51,130 90.10 70.02 6.57 28.30 5.00 0.38b 0.52 1.940 90.10 69.70 0.36
0.27 2 a 0.52 1.907 0.804 53,290 90.10 70.22 7.15 25.28 5.00 0.39b 0.52 1.933 90.10 69.81 0.36
* Whey c o m p o s i t io n : 5 .30% l a c t o s e , 6 .40% t o t a l s o l i d s , 0 .87% p r o t e i n / a n d 7 1 ,3 1 0 ppm COD.* * D u p l ic a t e
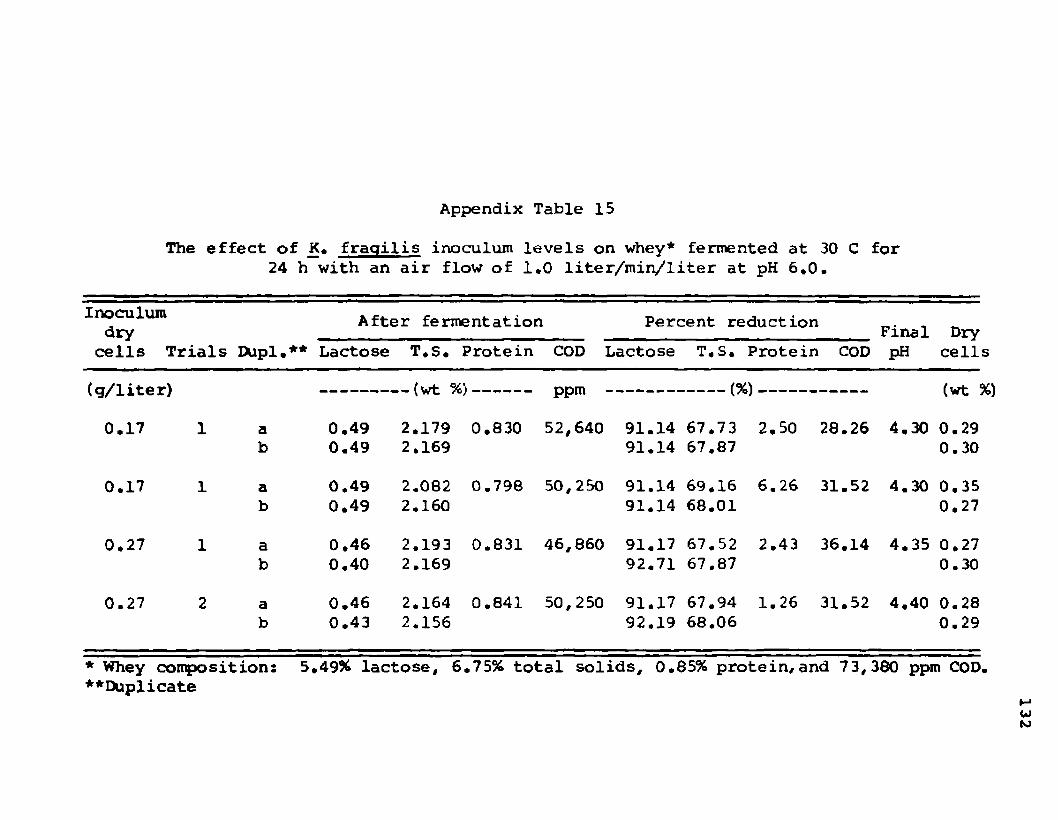
A p p e n d ix T a b le 15
The e f f e c t o f K. f r a q i l i s in o c u lu m l e v e l s o n w hey* fe r m e n te d a t 30 C f o r24 h w i t h a n a i r f lo w o f 1 . 0 1 i t e r / m i n / 1 i t e r a t pH 6 . 0 .
Inoculum After fermentation Percent reduction ^dry Final Dry
cells Trials Dupl.** Lactose T.S. Protein COD Lactose T.S. Protein COD pH cells
(g/liter) — (wt %) ppm ----------------------- (%) ----------- ------------- (wt !
0.17 1 a 0.49 2.179 0.830 52,640 91.14 67.73 2.50 28.26 4.30 0.29b 0.49 2.169 91.14 67.87 0.30
0.17 1 a 0.49 2.082 0.798 50,250 91.14 69.16 6.26 31.52 4.30 0.35b 0.49 2.160 91.14 68.01 0.27
0.27 1 a 0.46 2.193 0.831 46,860 91.17 67.52 2.43 36.14 4.35 0.27b 0.40 2.169 92.71 67.87 0.30
0.27 2 a 0.46 2.164 0.841 50,250 91.17 67.94 1.26 31.52 4.40 0.28b 0.43 2.156 92.19 68.06 0.29
♦♦Duplicate

A p p e n d ix T a b le 16
The e f f e c t o f K. f r a q i l i s in o c u lu m l e v e l s o n w hey* fe r m e n te d a t 30 C f o r24 h w i t h an a i r f lo w o f 1 . 5 1 i t e r / m i n / 1 i t e r a t pH 6 . 0 .
Inoculumdry
cells Trials Dupl•**
After fermentation Percent reductionFinalpH
DrycellsLactose T.S. Protein Lactose T.S. Prote in
(g/liter) -(wt %)- -{%)-- (wt%)
0.17 1 a 0.40 2.050 0.795 91.86 66.53 6.44 4.50 0.33b 0.32 2.040 93.61 66.69 0.34
0.17 2 a 0.37 2.063 0.791 92.44 66.31 6.85 4.50 0.33b 0.35 2.049 93.03 66.54 0.34
0.27 1 a 0.35 2.058 0.783 93.03 66.39 7.77 4.55 0.34b 0.32 2.087 93.61 65.93 0.31
0.27 2 a 0.35 2.006 0.801 93.03 67.25 5.72 4.55 0.36b 0.35 2.015 93.03 67.09 0,35
( c o n t in u e d )

A p p en d ix T a b le 16 ( c o n t in u e d )
Inoculumdrycells Trials Dupl.**
After fermentation Percent reduction
COD BOD TOD COD BOD TOD
(g/liter) — (ppm)-------- --------------------(%,----------------------
0.17 1 a 43,200 25, 200 42,500 36.47 38.24 38.41
0.17 2 a 43,600 22, 350 43,000 35.88 45.22 37.68
0.27 1 a 40,800 22,200 40,000 40.00 45.59 42.03
0.27 2 a 41,800 21,900 40,500 38.53 46.32 41.30
* Whey composition: 4.9596 lactose, 6.12% total solids, 0.85% protein, 68,000 ppm COD,40,800 ppm BOD, and 69,000 ppm TOD.
** Duplicate

A p p e n d ix T a b le 17
The e f f e c t o f IS. f r a q i l i s in o c u lu m l e v e l s o n w hey* fe r m e n te d a t 35 C f o r24 h w i t h an a i r f lo w o f 1 .0 1 i t e r / m i n / 1 i t e r a t pH 6 . 0 .
Inoculumdrycells Trials Dupl.**
After fermentation Percent reductionFinal
pHDry
CellsLactose T.S. Protein Lactose T.S* Protein
(g/liter) -(w t %) --------------- ---------------------- (%)----------------------- (wt %)0.17 1 a 0.35 2.222 0.933 93.62 66.43 1.00 5.00 0.39
b 0.40 2.211 93.56 66.59 0.40
0.17 2 a 0.38 2.186 0.874 93.09 66.98 7.24 5.00 0.39b 0.38 2.159 93.09 67.39 0.42
0.27 1 a 0.35 2.134 0.932 93.62 67.76 1.09 5.30 0.42b 0.38 2.113 93.09 68.07 0.44
0.27 2 a 0.40 2.244 0.927 92.56 66.09 1.67 4.90 0.41b 0.35 2.230 93.62 66.30 0.42
( c o n t in u e d )

A p p e n d ix T a b le 17 ( c o n t in u e d )
Inoculumdry U
After fermentation Percent reduction
cells Trials Dupl. COD BOD TOD COD BOD TOD
(g/liter)
0.17 1 a 39,920
------(ppm) —
23,460 38,500 45.06
--------- (%) —
47.87 49.34
0.17 2 a 38,720 24 20 38,500 46.70 45.73 49.34
0,27 1 a 36,7 20 21,720 35,250 49.45 51.73 53.62
0.27 2 a 37,120 21,720 37,000 48.90 51.73 51.32
a Whey composition: 5,43% lactose, 6,62% to ta l solids, 0.94% protein, 72,660 ppm COD,45,000 ppm BOD and 76,000 ppm TOD,
k Duplicate
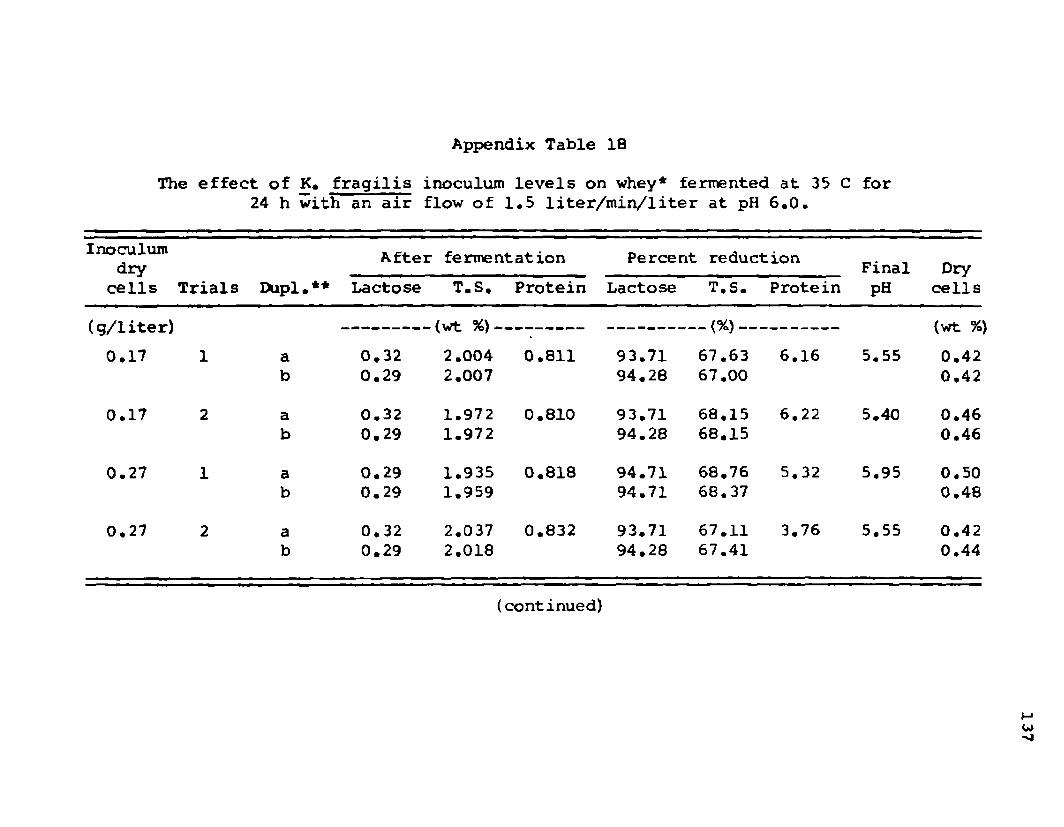
A p p e n d ix T a b le 18
The e f f e c t o f K. f r a g i l i s in o c u lu m l e v e l s o n w hey* fe r m e n te d a t 35 C f o r24 h w i t h an a i r f lo w o f 1 . 5 l i t e r / m i n / l i t e r a t pH 6 . 0 .
Inoculumdry
cells Trials Dupl.**
After fermentation Percent. reductionFinalpH
DrycellsLactose T.S. Protein Lactose T.S. Protein
fwt %) — _ !%\__ (wt %)v y/ J- ivtsr j
0.17 1 a 0.32 2.004 0.811 93.71 67.63 6.16 5.55 0.42b 0.29 2.007 94.28 67.00 0.42
0.17 2 a 0.32 1.972 0.810 93.71 68.15 6.22 5.40 0.46b 0.29 1.972 94.28 68.15 0.46
0.27 1 a 0.29 1.935 0.818 94.71 68.76 5.32 5.95 0.50b 0.29 1.959 94.71 68.37 0.48
0.27 2 a 0.32 2.037 0.832 93.71 67.11 3.76 5.55 0,42b 0.29 2.018 94.28 67.41 0.44
( c o n t in u e d )
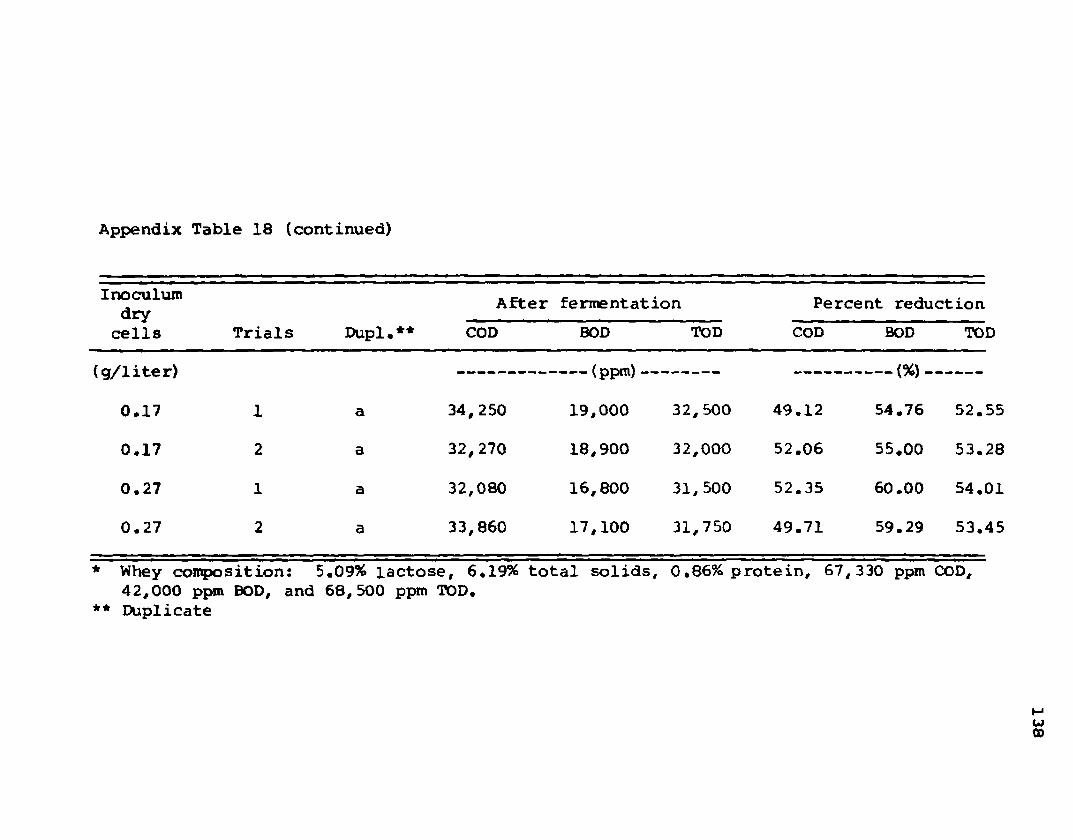
A p p e n d ix T a b le 18 ( c o n t in u e d )
Inoculumdry
cells Trials Dupl.**
After fermentation Percent reduction
COD BOD TOD COD BOD TOD
(g/liter) ----------------------(%)--------------
0.17 1 a 34,250 19,000 32,500 49.12 54.76 52.55
0.17 2 a 32,270 18,900 32,000 52.06 55.00 53.28
0.27 1 a 32,080 16,800 31,500 52.35 60.00 54.01
0.27 2 a 33,860 17,100 31,750 49.71 59.29 53.45
* Whey composition: 5,09% lactose, 6*19% to tal solids, 0,86% protein, 67,330 ppm COD,42,000 ppm BOD, and 68,500 ppm TOD.
** Duplicate

A p p e n d ix T a b le 19
The e f f e c t o f t e m p e r a t u r e , a i r f lo w and in o c u lu m o n w hey fe r m e n te df o r 24 h a t pH 6 , 0 by K. f r a q i l i s *
Temp. Air flowInoculum
dry cells Lactose
Percent reduction in
T.S. Protein COD BOD TODFinalPH
Drycells
C (1 iter/min/1i te r ) (g/liter) ------------(%) (wt %)
25 1.0 0.17 86.74 67.62 11.17 17.08 — — 4.38 0.3425 1.0 0.27 89.47 68.54 8.34 17.00 ----- - — — 4.43 0.3525 1.5 0.17 89.55 69.64 6.09 22.00 — — — — — 4.45 0.3225 1.5 0.27 90.10 69.94 6.86 26.79 ------ ------ 5.00 0.37
30 1.0 0.17 91.14 68.19 4.38 29.89 _ —_ w _ 4.30 0.3030 1.0 0.27 92.06 67.85 1.84 33.83 ----- . ------ 4.38 0.2830 1.5 0.17 92.73 66. 53 6.65 36.18 41.73 38.05 4.50 0.3330 1.5 0.27 93.17 66.66 6.75 39.72 45.96 41.67 4.55 0.34
35 1.0 0.17 93.09 66.84 4.12 45.88 46.80 49.34 5.00 0.4035 1.0 0.27 93.23 67.07 1.38 49.18 51.73 52.47 5.10 0.4235 1.5 0.17 94.00 67.88 f .19 50.59 54.88 52.92 5.48 0.4435 1.5 0.27 94.14 67.91 4.54 51.03 59.65 53.73 5.75 0.46
* Values are average of two tr ia ls .

A p p e n d ix T a b le 20
The e f f e c t o f m ix ed y e a s t c u l t u r e s o n w hey* fe r m e n te d a t 30 C f o r 24 h w i t h an a i r f lo wo f 1 * 5 l i t e r / m i n / l i t e r # and in o c u lu m o f 0 .2 7 g d r y c e l l s / l i t e r a t pH 6 .0
After fermentation Percent: reduction
Yeast combination Dupl.** Lactose T.S. Protein Lactose T.S. Protein FinalpH
K, fraq ilis +T. sphaerica a
b0.460.49
— <wt %)
2.3132.308
0.894 91.3590.81
-(%) —
65.5065.50
2.52 4.90
K. fraqilis + C. u til is a
b0.800.80
2.4172.431
0.904 84.8684.86
63.9263.70
1.81 4.90
T. sphaerica + C. u ti l is a
b0.630.57
2.3882.431
0.883 88.1089.20
64.3463.71
4.12 4.80
K. fragilis +T. sphaerica + C. u ti l is a
b0.400.34
2.2852.298
0,900 92.4393.51
65.9065.70
2.42 4.90
(cont inued)

A p p e n d ix T a b le 20 ( c o n t in u e d )
Yeast combination Dupl.**Dry
cells
AfterCOD
fermentationBOD
PercentCOD
reductionBOD
(wt %) -(ppm)--------- (ppm)-----------
K. fraqilis + T. sphaerica a 0.41 52,350 35,400 31.19 26.25b 0.43
K. fraqilis + C. u ti l is a 0.21 57,250 38,400 27.74 20.00b 0.25
T. sphaerica + C. u ti l is a 0.35 53, 330 37,200 29.90 32.50b 0.32
K. fraqilis + T. sphaerica +C. u til is a 0.43 49,410 35,400 35.10 26.25
b 0.43
* Whey composition: 5,30% lactose, 6.70% to tal solids, 0.92% protein, 76,080 ppm COD,and 48,000 ppm BOD.
** Duplicate
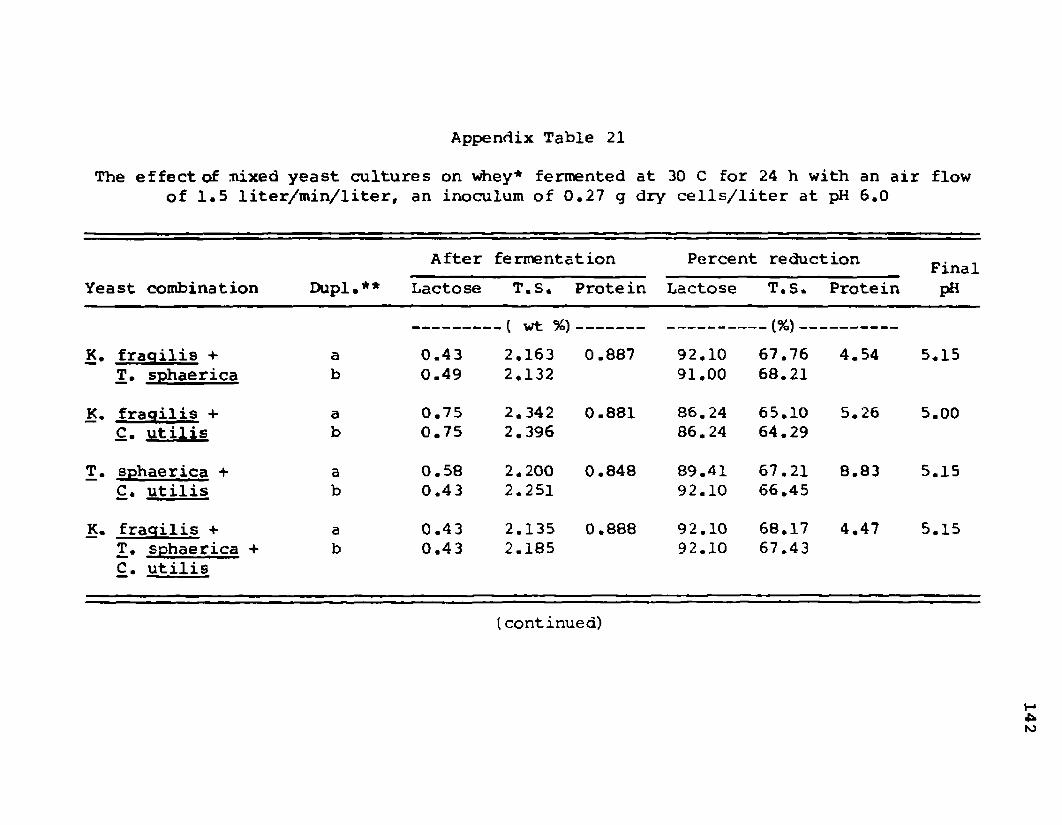
A p p e n d ix T a b le 21
The e f f e c t o f -•nixed y e a s t c u l t u r e s on Whey* fe r m e n te d a t 30 C f o r 24 h w it h an a i r f lo wo f 1 * 5 l i t e r / m i n / l i t e r , an in o c u lu m o f 0 , 2 7 g d r y c e l l s / l i t e r a t pH 6 .0
After fermentation Percent: reduction FinalYeast combination Dupl.** Lactose T.S. Protein Lactose T.S. Protein pH
K. fraqilis +T. sphaerica
ab
0.430.49
- ( wt %)2.1632.132
0.887 92.1091.00
- (%)-----
67.7668.21
4.54 5.15
K. fraqilis + C. u til is
ab
0.750.75
2.3422.396
0.881 86.2486.24
65.1064.29
5.26 5.00
T. sphaerica + C. u til is
ab
0.580.43
2.2002.251
0.848 89.4192.10
67.2166.45
8.83 5.15
K. fraqilis +T. sphaerica + C. u til is
ab
0.430.43
2.1352.185
0.888 92.1092.10
68.1767.43
4.47 5.15
( c o n t in u e d )
142

A p p e n d ix T a b le 21 ( c o n t in u e d )
Dry After fermentation Percent reduction
Yeast combination Dupl.** cells COD BOD COD BOD
-------------(ppm) --------------- (%) ---------------
K« fraailis + T. sphaerica ab
0.510.55
53,280 35,400 30.65 27.16
K. fraailis + C. u tilis ab
0.260.26
59,460 39,000 22.60 19.75
T. sphaerica + C. u til is ab
0.460.42
54,440 35,500 29.15 27.16
K. fraqilis + T. sphaerica + C. u tilis
ab
0.530.49
55,210 35,400 28.14 27.16
* Whey composition: 5.44% and 48,600 ppm BOD.
** Duplicate
lactose. 6.71% total solids, 0 .93% protein, 76,830 ppm COD,

APPENDIX FIGURES
1 4 4
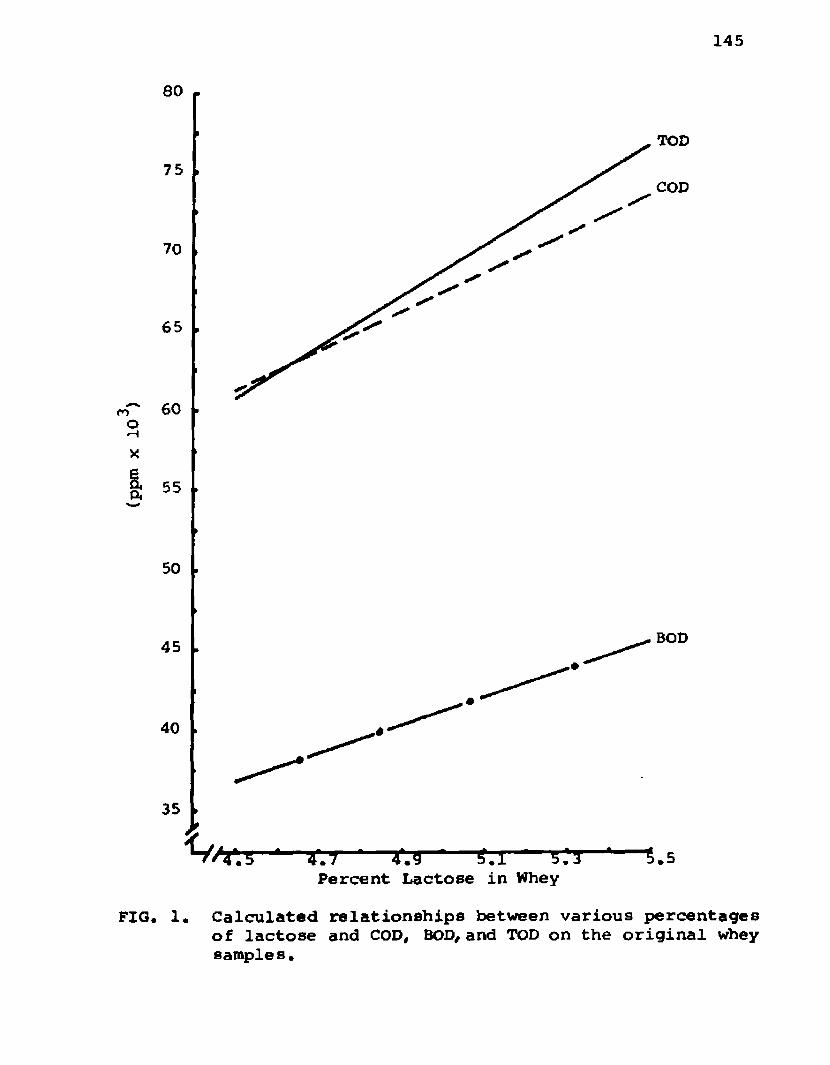
80
75
70
65
60
55
50
45
40
35
1 ,
1 4 5
TOD
COD
"—4*.7" * ~r.g-----?ti— sts—1— $.5Percent Lactose in Whey
Calculated relationships between various percentages of lactose and COD, BOD, and TOD on the original whey samples.
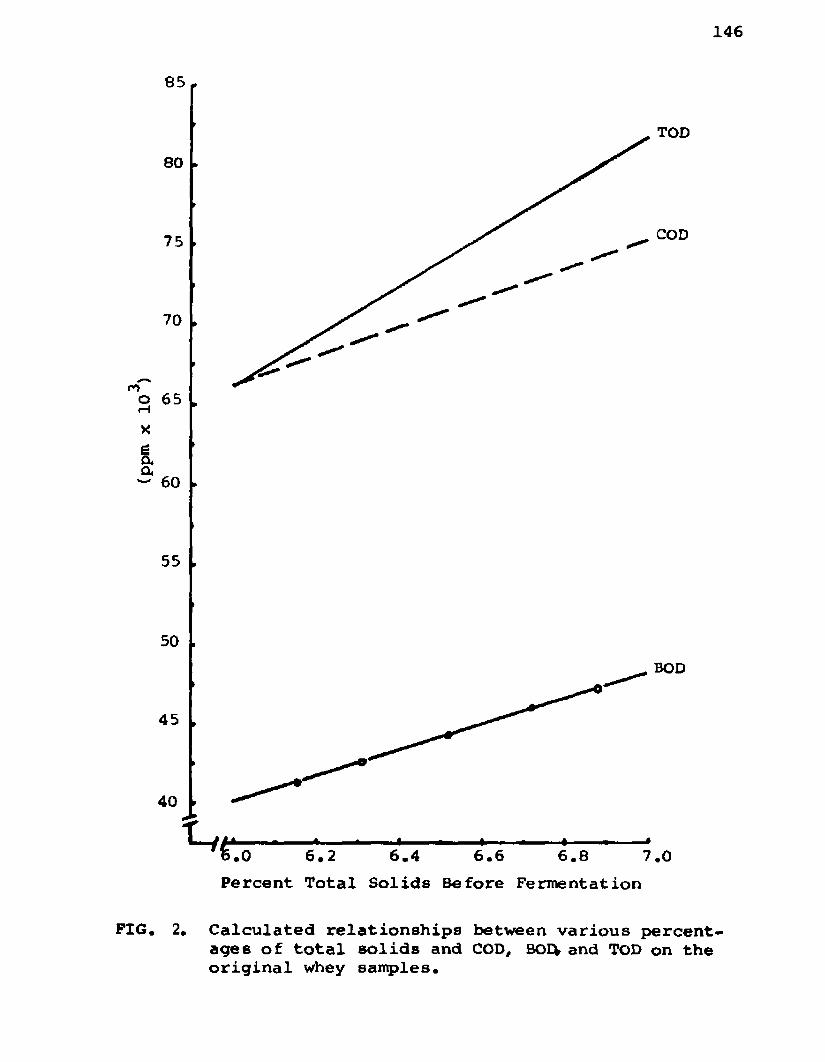
85
80
75
70
65
60
55
50
45
40
2.
1 4 6
TOD
COD
BOD
— / / » — ■ * ■ I i >— ■ - I — »6,0 6,2 6,4 6.6 6.8 7.0
Percent Total Solids Before Fermentation
Calculated relationships between various percentages of to ta l solids and COD, BOEV and TOD on the original whey samples.
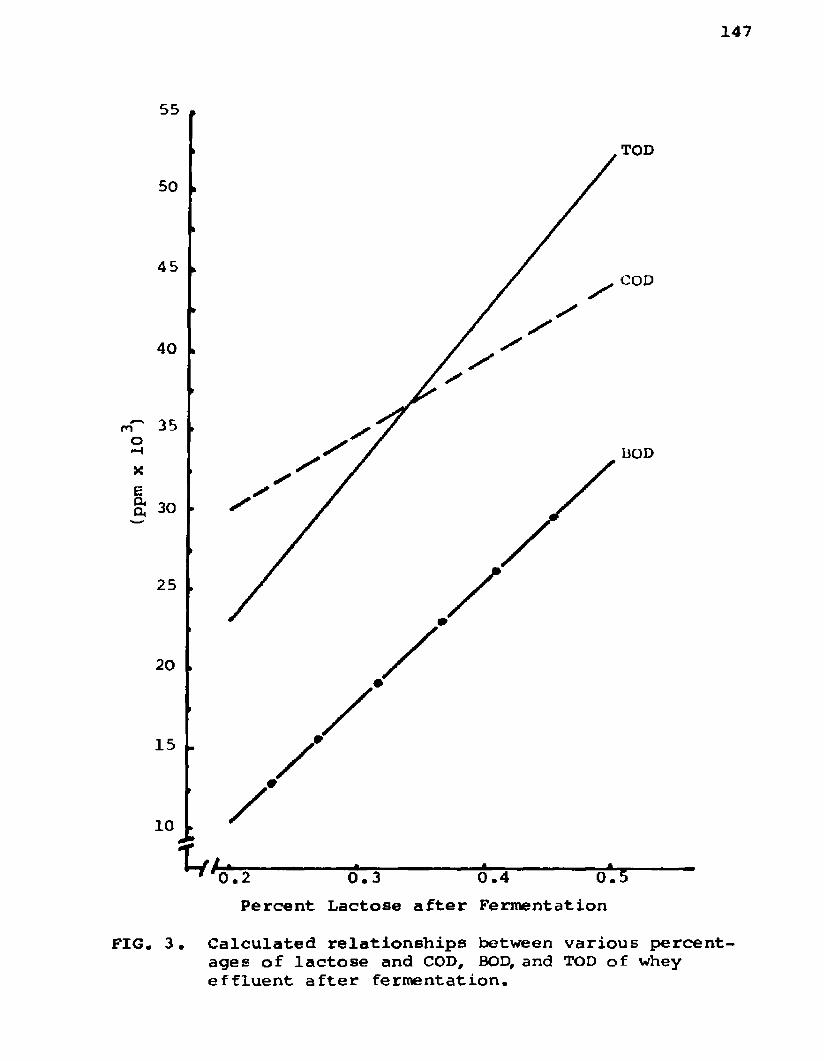
55
50
45
40
35
30
25
20
15
10
1
3 *
1 4 7
TOD
COD
BOD
■ . . . I — i - > —. — i ■ — ... — i* - i ■ ■.n>72 073 074 075
Percent Lactose a fte r Fermentation
Calculated relationships between various percentages of lactose and COD# BOD, and TOD of whey effluent a fte r fermentation.
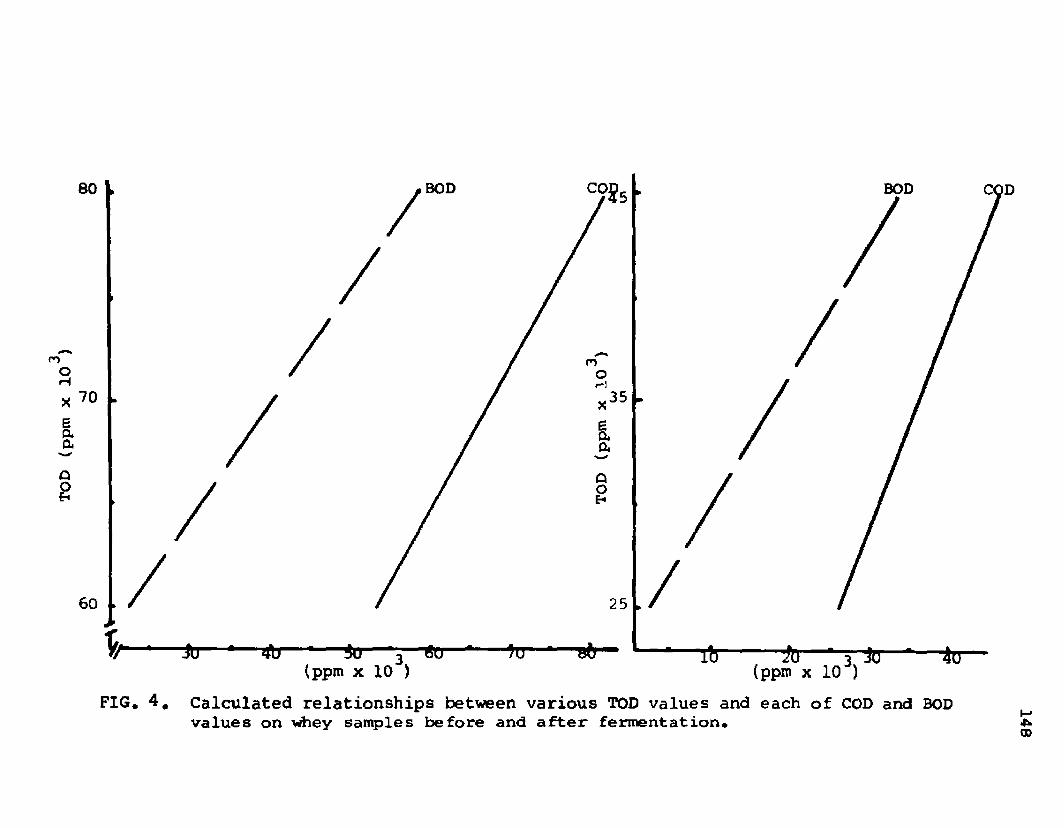
TOD
(ppm
80 BOD BOD
mO
70 35X
Ia.
ao
60 25
(ppm x 10 ) (ppm x 10 )
FIG. 4. Calculated relationships between various TOD values and each of COD and BOD values on whey samples before and after fermentation.
148
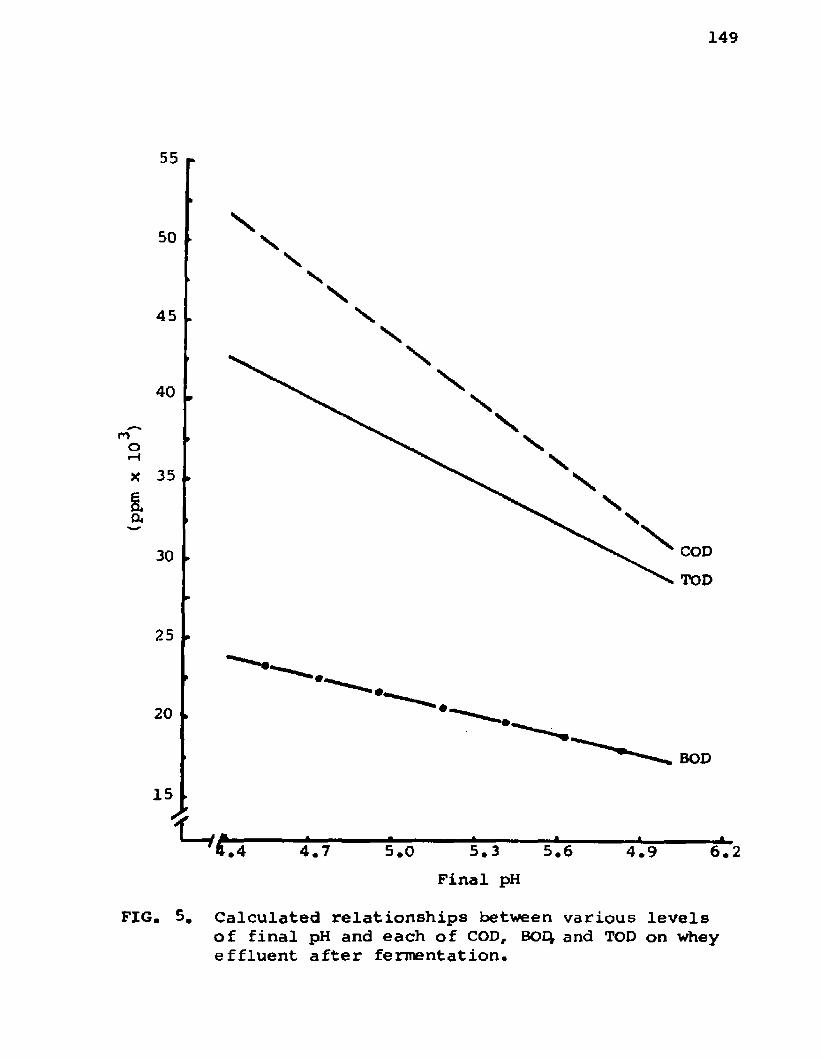
uid
d)
1 4 9
55 |.
50
45
40
oi—tX 35
30
25
20
15
\
u
s
\
COD
TOD
BOD
4.7 5.0 5.3 5.6
Final pH
4.9 6.2
FIG. 5. Calculated relationships between various levels of final pH and each of COD, BOI and TOD on whey effluent after fermentation.
VITA
Mahmood Bad Al-Omar was born July 1, 1946 in Ana,
Iraq, and graduated from Wasteran Ana High School in 1964,
In September, 1964, he entered the University of
Baghdad, Iraq, and received a Bachelor of Science in Animal
Production in June, 1968, with honors as the highest ranking
student in the College of Agriculture, Following graduation,
Mr, Al-Omar worked as a laboratory instructor in the Dairy
Manufacturing section un til September, 1970; at that time
he was selected by the FAO to further his education as a
graduate student in animal production at the University of
Copenhagen, Denmark, In June, 1971, he was granted a Diploma
in Animal Production a fte r which he came to the USA to com
plete his scien tific education,
Mr, Al-Omar entered the graduate school of Louisiana
State University in January, 1972, and graduated with a
degree of Master of Science in Dairy Manufacturing in August,
1973. While in graduate school, he was in itia ted into Gamma
Sigma Delta, Honor Society for Agriculture; Sigma Xi, The
Scientific Research Society, and Phi Kappa Phi Honor Society,
15 0
151
Since 1973 he has continued his graduate studies in the
Department of Dairy Science, Louisiana State University,
He is now a candidate for the degree of Doctor of
Philosophy and hopes to complete the requirements by August,
1977.