Embed Size (px)
Citation preview

ArticleRev Bras Cienc Solo 2018;42:e0170033
1https://doi.org/10.1590/18069657rbcs20170033
* Corresponding author: E-mail: [email protected]
Received: February 1, 2017Approved: August 8, 2017
How to cite: Vieira JLV, Nardi KT, Silva GRA, Moreira LA, Zavaschi E, Moura TA, Otto R. Nutrient uptake by high-yielding cotton crop in Brazil. Rev Bras Cienc Solo. 2018;42:e0170033. https://doi.org/10.1590/18069657rbcs20170033
Copyright: This is an open-access article distributed under the terms of the Creative Commons Attribution License, which permits unrestricted use, distribution, and reproduction in any medium, provided that the original author and source are credited.
Nutrient Uptake by High-Yielding Cotton Crop in BrazilJosé Luís Vilela Vieira(1), Kaue Tonelli Nardi(1), Gabriel Rodrigues Anastácio Silva(1), Lílian Angélica Moreira(2), Eduardo Zavaschi(2), Thiago Augusto Moura(3) and Rafael Otto(4)*
(1) Universidade de São Paulo, Escola Superior de Agricultura “Luiz de Queiroz”, Curso de Agronomia, Piracicaba, São Paulo, Brasil.
(2) Universidade de São Paulo, Escola Superior de Agricultura “Luiz de Queiroz”, Departamento de Ciência do Solo, Programa de Pós-Graduação em Solos e Nutrição de Plantas, Piracicaba, São Paulo, Brasil.
(3) Yara Brasil Fertilizantes S.A., Sumaré, São Paulo, Brasil.(4) Universidade de São Paulo, Escola Superior de Agricultura “Luiz de Queiroz”, Departamento de Ciência do
Solo, Piracicaba, São Paulo, Brasil.
ABSTRACT: Determining nutrient uptake and accumulation rates by cotton crops is important to define management strategies, especially for transgenic varieties, which are cultivated using high-technology approaches that require substantial investment to maximize yield. Currently in Brazil, the states of Bahia and Mato Grosso are responsible for 84.4 % of the total cotton growing area. In the present study, two trials were conducted in 2013, one that involved planting FM 940 GLT, FM 980 GLT, and FM 913 GLT varieties in the state of Bahia and the other which involved FM 940 GLT and FM 980 GLT varieties in the state of Mato Grosso. The aim of the two trials was to represent the two regions that currently encompass the largest areas of cotton cultivation. Tissue samples, consisting of leaves, stems, and reproductive components, were collected eleven times during the crop cycle for determination of nutrient content and shoot dry matter. After weighing, plant tissue samples were dried and ground to determine nutrient contents. Because there were no overall differences in nutrient contents and biomass accumulation of the varieties during the crop cycle, we undertook joint analysis of the data from all varieties at each site. Favorable climatic conditions in Bahia promoted plant biomass production that was twice as much as plants grown in Mato Grosso, with cotton yields of 6.2 and 3.8 t ha-1 of lint and seed, respectively. The maximum nutrient accumulation occurred between 137-150 days after emergence (DAE) for N; 143-148 for P; 172-185 for K; 100 for Ca; 144-149 for Mg; and 153-158 for S. Maximum uptake ranged from 218-362 kg ha-1 N; 26-53 kg ha-1 P; 233-506 kg ha-1 K; 91-202 kg ha-1 Ca; 28-44 kg ha-1 Mg; and 19-61 kg ha-1 S. On average, the sites revealed nutrient export of 14, 2, 23, 3, 2, and 2 kg t-1 of lint and seed for N, P, K, Ca, Mg, and S, respectively, with little variation among sites. Extraction of nutrients per area by cotton vary among sites, but nutritional requirement of cotton per unit of lint and seeds is similar independently of yield potential.
Keywords: Gossypium hirsutum, nutrient accumulation, cotton nutrition, uptake rate.
Division – Soil Use and Management | Commission – Soil Fertility and Plant Nutrition
Vieira et al. Nutrient uptake by high-yielding cotton crop in Brazil...
2Rev Bras Cienc Solo 2018;42:e0170033
INTRODUCTIONCotton (Gossypium hirsutum L.) is a perennial tropical crop of undetermined growth, grown as an annual crop for lint, oil, and animal feed (Constable and Bange, 2015). Annually, about 35 million hectares are grown worldwide, producing approximately 26 million tons of cotton lint (ICAC, 2015). The total area planted with cotton in Brazil is approximately 1.0 million hectares, with a production of 1.6 million tons of cotton (lint) (Conab, 2016). The states of Mato Grosso and Bahia encompass the largest cultivated area in Brazil, with around 563,000 and 281,000 hectares, respectively (Conab, 2016).
Cotton has high nutritional requirements (Rochester and Constable, 2015) and fertilizer account for 20-30 % of production costs. However, little information is available in the literature on the nutritional requirements of cotton, especially for newly cultivated varieties. Ensuring adequate nutrition of cotton is necessary to obtain high yields, reduce the production cost per ton, and increase the profitability of the production system (Schwab et al., 2000; Carvalho, 2007).
The suitability of the fertilizer application rate comes from specific knowledge of the history of an area, the amount of nutrients extracted and exported by the crop, and the results of soil and plant analysis. However, it is only through determination of the nutrient uptake rate that information can be obtained for the period of greatest demand across different phenological stages, allowing an optimal nutritional management approach to be adopted (Augostinho et al., 2008). Knowledge of the uptake rate, together with the nutrient dynamics of the soil, the loss potential (leaching, precipitation, fixation), and the extraction efficiency of the crop, can help to define the best methods and timing of application to optimize the efficiency of fertilizer use (Carvalho, 2007; Bruulsema et al., 2012).
The uptake of nutrients by cotton plants increases considerably from the 30th day after plant emergence, shortly after the beginning of flower budding, and reaches maximum daily uptake during the flowering phase, approximately 60 to 90 days after germination (Rosolem et al., 2012). Even in modern production systems, where cotton is grown as an annual crop, there are phenological stages in which vegetative growth occurs simultaneously with fruit development (Constable and Gleeson, 1977). This behavior poses a challenge for crop management in terms of optimizing nutrient uptake and an adequate supply of water to allow simultaneous growth of vegetative and reproductive components of the crop (Constable and Bange, 2015). Another challenge has been the introduction of modern varieties that can show differences in nutritional requirements, as well as in nutrient uptake rate. In Australia, for example, a 40 % increase in lint yield as well as a 25 % increase in crop biomass was observed with the introduction of new cultivars from 1973 to 2006 (Rochester and Constable, 2015). In the same study, the authors observed that the introduction of these new cultivars was associated with an increase in N, P, and K use efficiency of 20, 23, and 24 %, respectively. Studies of this nature have not yet been carried out in Brazil.
The development of transgenic cotton varieties has spread rapidly throughout the world (Gowda et al., 2016) primarily to control pests and diseases that can significantly compromise cotton yield (Constable and Bange, 2015; Trapero et al., 2016). In fact, the cultivation of transgenic varieties now represents the main modality of cotton cultivation in the world, including Brazil. The nutrient uptake studies of cotton in Brazil were carried out with varieties that are no longer cultivated today (Rosolem and Mikkelsen, 1989; Rosolem et al., 2012) and therefore may not represent the nutritional requirement of modern transgenic varieties that are most commonly grown within the regions of highest cotton production in Brazil, such as Mato Grosso and Bahia.
The hypothesis of this study is that high yielding sites use nutrients more efficiently than low yielding sites, presenting lower nutritional requirement per unit of lint and
Vieira et al. Nutrient uptake by high-yielding cotton crop in Brazil...
3Rev Bras Cienc Solo 2018;42:e0170033
seed produced. The objective of this study was to determine the rate of macro- and micronutrient uptake and nutrient partitioning in transgenic cotton varieties grown in the most representative production regions in Brazil.
MATERIALS AND METHODSThe research was conducted in two experimental areas, one located in the municipality of São Desidério, state of Bahia (45° 50’ 24” W, 12° 37’ 12” S, 810 m a.s.l.) in a Latossolo Vermelho-Amarelo of medium texture; and the other in Primavera do Leste, state of Mato Grosso (54° 20’ 24” W, 15° 42’ 36” S, 580 m a.s.l.) in a Latossolo Vermelho of clayey texture (Santos et al., 2013). Both soils represent a Typic Eutrudox according to Soil Taxonomy (Soil Survey Staff, 2014). Before the experiments were set up, soil samples were taken from the top layer (0.00-0.20 m) for the purpose of chemical and physical characterization. Chemical analysis was performed according to Raij et al. (2001) and physical analysis according to Camargo (1986) (Table 1).
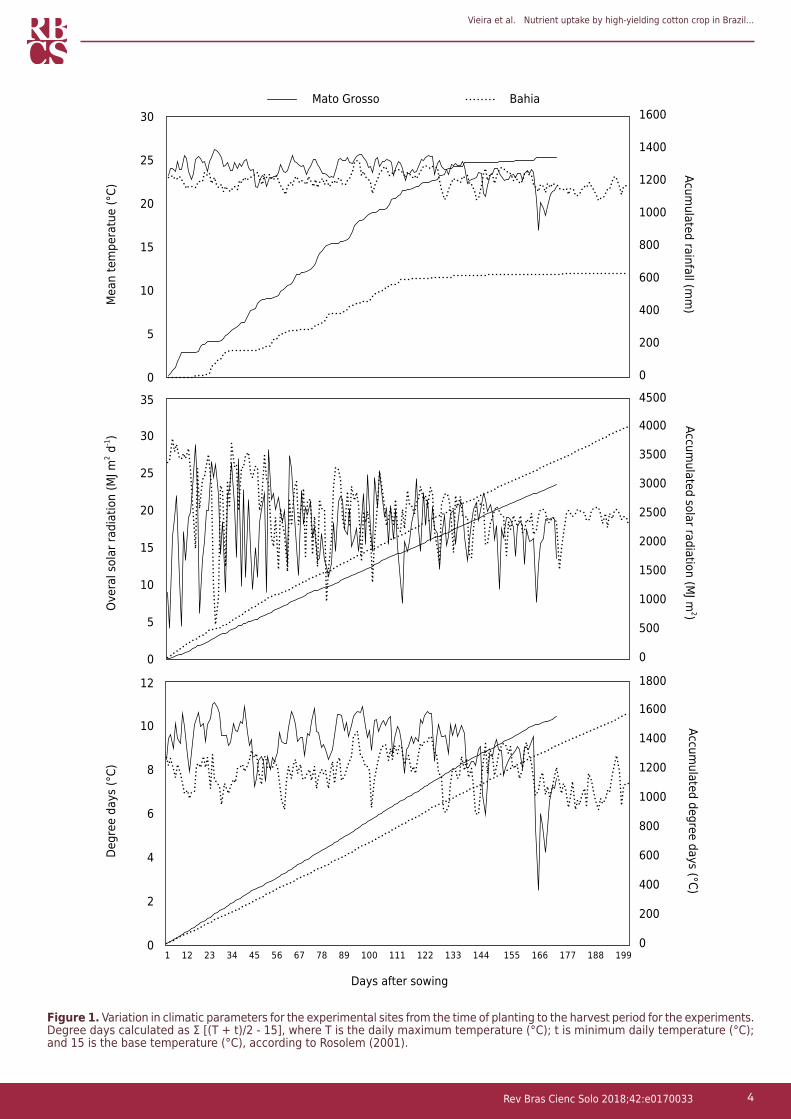
For the experiment conducted in Bahia, the cultivars FM 940 GLT, FM 980 GLT, and FM 913 GLT were planted on 30 December 2013. For the experiment in Mato Grosso, the varieties FM 940 GLT and FM 980 GLT were planted on 14 December 2013. The FM 940 GLT variety is characterized as high growth and medium cycle, and FM 980 GLT of long cycle. The FM 913 GLT variety is characterized by early blooming and average growth rate. Cotton with GLT technology have genes derived through genetic transfer that confer the plants defense against pests in the Lepidoptera order, as well as tolerance to the herbicides glufosinate-ammonium and glyphosate, which aid in plant health management of the crop. All varieties were sown at the same time to provide similar climatic conditions during the cycle. A summary of the rainfall and average temperature during the experiments is provided in figure 1.
Each variety, in both locations, was sown in a plot composed of 16 plant rows of 55 m length and a population density of 90 thousand plants per hectare. In Bahia, 0.76 m between-row spacing was used, while in Mato Grosso, spacing was 0.90 m, following the management practices adopted by the farms in which the experiments were set up. Each plot was randomly divided into 11 subplots, each of which was 5 meters in length, for temporal evaluations of biomass and nutrient accumulation. Plant samples were collected at 33, 45, 73, 86, 101, 118, 136, 150, 163, and 182 days after emergence (DAE) in Mato Grosso, and at 24, 37, 50, 60, 73, 78, 149, 164, 177, 191, and 205 DAE in Bahia, and on all occasions, were taken from rows 4, 7, 10, and 13 of each subplot.
At each sampling period, five plants were collected and subsequently separated into leaves, stems, and reproductive structures. Only competitive plants were selected, and all those assessed to be smaller than the average size of the plot were discarded. Each row collected within the subplot represented an individual replicate. Samples of leaves, stems, and reproductive structures were weighed separately (0.01 kg accuracy), placed in paper bags, and dried in a forced-air oven at 65 °C (until constant weight) for moisture
Table 1. Chemical characterization of soil from the two experimental sites, obtained from a depth of 0.00-0.20 m
Site pH(CaCl2) P K+ Ca2+ Mg2+ Al3+ H+Al CEC BS Textural class
mg dm-3 mmolc dm-3 %Mato Grosso 5.4 11 1.8 27 12 0 31 72 57 ClayBahia 5.6 26 1.7 18 3 0 16 39 58 Loam
pH in 0.01 mol L-1 CaCl2; P, K+, Ca2+, and Mg2+ extracted by exchangeable anionic resin; Al3+ extracted by KCl; H+Al determined by SMP buffer solution; textural class determined by the pipette method (Ruiz, 2005). CEC: cation exchange capacity; BS: base saturation.
Vieira et al. Nutrient uptake by high-yielding cotton crop in Brazil...
4Rev Bras Cienc Solo 2018;42:e0170033
Figure 1. Variation in climatic parameters for the experimental sites from the time of planting to the harvest period for the experiments. Degree days calculated as Σ [(T + t)/2 - 15], where T is the daily maximum temperature (°C); t is minimum daily temperature (°C); and 15 is the base temperature (°C), according to Rosolem (2001).
0
200
400
600
800
1000
1200
1400
1600
0
5
10
15
20
25
30Acum
ulated rainfall (mm
)Mato Grosso Bahia
0
500
1000
1500
2000
2500
3000
3500
4000
4500
0
5
10
15
20
25
30
35
Accumulated solar radiation (M
J m2)
0
200
400
600
800
1000
1200
1400
1600
1800
0
2
4
6
8
10
12
Accumulated degree days (°C)
Days after sowing
Ove
ral s
olar
radi
atio
n (M
J m2 d
-1)
Mea
n te
mpe
ratu
e (°
C)De
gree
day
s (°
C)
1 12 23 34 45 56 67 78 89 100 111 122 133 144 155 166 177 188 199
Vieira et al. Nutrient uptake by high-yielding cotton crop in Brazil...
5Rev Bras Cienc Solo 2018;42:e0170033
determination. The fresh matter and moisture content were used to quantify the biomass accumulation for each plant compartment in kg ha-1. After drying, the samples were ground in a Wiley-type mill and subjected to chemical analysis following the methods of Malavolta et al. (1997) for determination of nutrient content.
The accumulation of nutrients in each plant compartment was calculated by multiplying the nutrient content of the respective plant tissue by the corresponding dry matter weight. There was no significant difference at either site between the dry matter weight and nutrient accumulation among varieties for the duration of the experiments (pvariety>0.10). For that reason, the mean value of the variables analyzed in each evaluation period was used to determine the rate of uptake, extraction, and total export of nutrients.
The data were analyzed using non-linear regression, with model parameters estimated using the dynamic curve fitting function in the SigmaPlot version 12.5 program (Systat Software, San Jose, CA). To fit the non-linear regression model, we used the trend that had the highest statistical significance and highest coefficient of determination (R2). The three-parameter Gaussian sigmoidal model was chosen, described in equation 1:
y = a e [–0.5( x – x0b
)²] Eq. 1
in which: y is the nutrient accumulation (kg ha-1); a is the maximum accumulation value (kg ha-1); x0 is the value of x in DAE that provides the maximum accumulation; and b is the amplitude in the value of x in DAE between the inflection point and the maximum point.
From the fitted model, it was possible to precisely determine the inflection point (IP) value in the curve according to equation 2:
IP = x0 – b Eq. 2
Mathematically, IP corresponds to the value of x in which the curvature of the adjusted model changes signal; in practice, this corresponds to the value of x in DAE at which the daily accumulation rate, although positive, decreases.
To calculate nutrient extraction by cotton, the accumulation of nutrients by aboveground compartments was considered for the period of maximum accumulation by fitting the models. To calculate the export of nutrients, the accumulation of nutrients by reproductive structures during the harvest period was considered. However, because the final evaluation involved the collection of whole reproductive structures (boll, capsule, lint, and seed), it was necessary to estimate the biomass that corresponded only to lint and seeds, which are the main harvest components of the cotton crop. To do so, we assumed that 41 % of the total mass of reproductive structures corresponded to the lint and seed components, based on the study of Rosolem et al. (2012).
RESULTS AND DISCUSSION
Dry matter accumulation
The maximum shoot dry matter accumulation (MSDMA) was almost twice higher in Bahia than in Mato Grosso (Figure 2 and Table 2). The higher production of MSDMA in Bahia can be explained by the more favorable climatic conditions for the development of cotton in this area, such as adequate rainfall, a milder temperature that allowed a longer seasonal cycle, and more intense solar radiation (Figure 1). In Mato Grosso, there was excess rain during the cycle (1,350 mm in Mato Grosso compared to 640 mm in Bahia), which resulted in a decrease in solar radiation due to excess cloud cover during the summer months (Figure 1). In addition, the higher temperature observed in Mato Grosso resulted in a higher number of degree days during the season, accelerating the cycle and decreasing the yield potential. From the 50th DAE in Bahia and 70th DAE
Vieira et al. Nutrient uptake by high-yielding cotton crop in Brazil...
6Rev Bras Cienc Solo 2018;42:e0170033
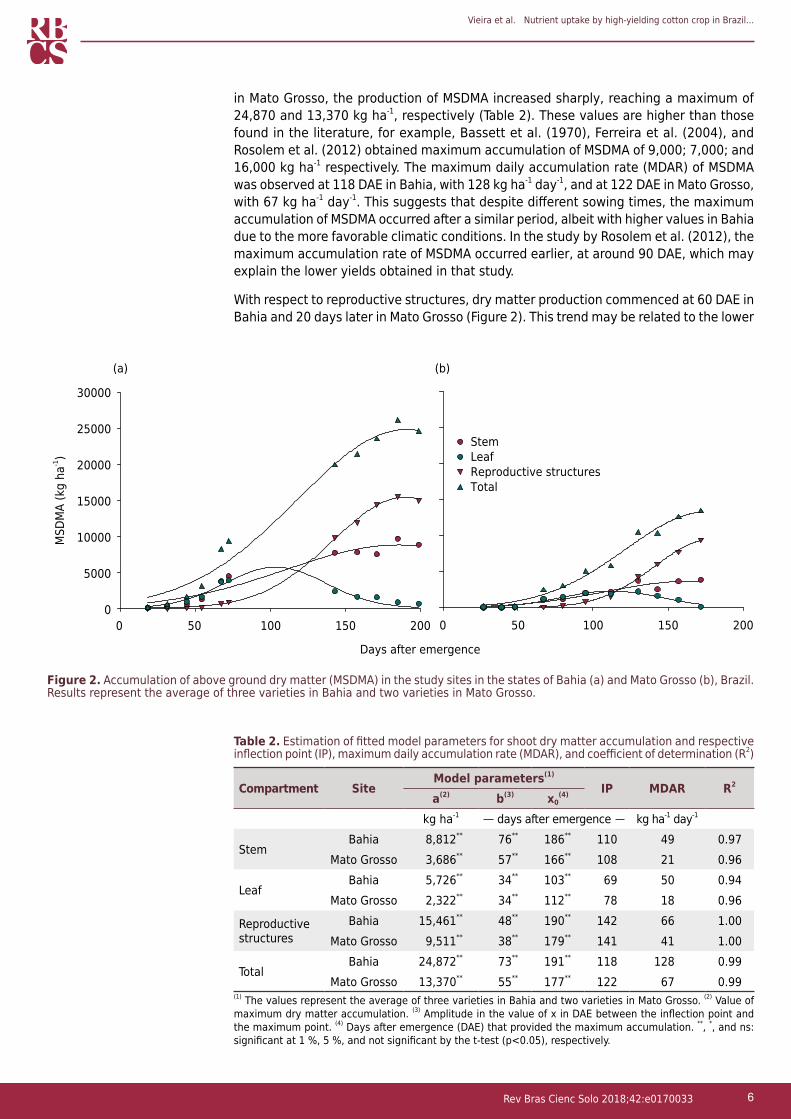
in Mato Grosso, the production of MSDMA increased sharply, reaching a maximum of 24,870 and 13,370 kg ha-1, respectively (Table 2). These values are higher than those found in the literature, for example, Bassett et al. (1970), Ferreira et al. (2004), and Rosolem et al. (2012) obtained maximum accumulation of MSDMA of 9,000; 7,000; and 16,000 kg ha-1 respectively. The maximum daily accumulation rate (MDAR) of MSDMA was observed at 118 DAE in Bahia, with 128 kg ha-1 day-1, and at 122 DAE in Mato Grosso, with 67 kg ha-1 day-1. This suggests that despite different sowing times, the maximum accumulation of MSDMA occurred after a similar period, albeit with higher values in Bahia due to the more favorable climatic conditions. In the study by Rosolem et al. (2012), the maximum accumulation rate of MSDMA occurred earlier, at around 90 DAE, which may explain the lower yields obtained in that study.
With respect to reproductive structures, dry matter production commenced at 60 DAE in Bahia and 20 days later in Mato Grosso (Figure 2). This trend may be related to the lower
Figure 2. Accumulation of above ground dry matter (MSDMA) in the study sites in the states of Bahia (a) and Mato Grosso (b), Brazil. Results represent the average of three varieties in Bahia and two varieties in Mato Grosso.
50 100 150 20050 100 150 200
MSD
MA
(kg
ha-1)
0
5000
10000
15000
20000
25000
30000
StemLeafReproductive structuresTotal
Days after emergence
(a) (b)
00
Table 2. Estimation of fitted model parameters for shoot dry matter accumulation and respective inflection point (IP), maximum daily accumulation rate (MDAR), and coefficient of determination (R2)
Compartment SiteModel parameters(1)
IP MDAR R2
a(2) b(3) x0(4)
kg ha-1 days after emergence kg ha-1 day-1
StemBahia 8,812** 76** 186** 110 49 0.97
Mato Grosso 3,686** 57** 166** 108 21 0.96
LeafBahia 5,726** 34** 103** 69 50 0.94
Mato Grosso 2,322** 34** 112** 78 18 0.96
Reproductive structures
Bahia 15,461** 48** 190** 142 66 1.00Mato Grosso 9,511** 38** 179** 141 41 1.00
TotalBahia 24,872** 73** 191** 118 128 0.99
Mato Grosso 13,370** 55** 177** 122 67 0.99(1) The values represent the average of three varieties in Bahia and two varieties in Mato Grosso. (2) Value of maximum dry matter accumulation. (3) Amplitude in the value of x in DAE between the inflection point and the maximum point. (4) Days after emergence (DAE) that provided the maximum accumulation. **, *, and ns: significant at 1 %, 5 %, and not significant by the t-test (p<0.05), respectively.
Vieira et al. Nutrient uptake by high-yielding cotton crop in Brazil...
7Rev Bras Cienc Solo 2018;42:e0170033
solar radiation in Mato Grosso at the beginning of the cycle (Figure 1), which delayed flowering and consequently increased fruit biomass. Later this period, the MSDMA values increased considerably, demonstrating the high contribution of the reproductive phase to overall biomass production and nutritional requirements (Rochester et al., 2012). At the beginning of this increased period of daily MSDMA accumulation by the reproductive structure, which was close to 115 DAE in both areas, there was a corresponding decrease in accumulation of other compartments, due to the high assimilation requirements of reproductive structure (Wells and Stewart, 2010). This result demonstrates the trait by which the cotton crop simultaneously allocates nutrients for vegetative growth and fruit development (Constable and Gleeson, 1977).
Macronutrient accumulation
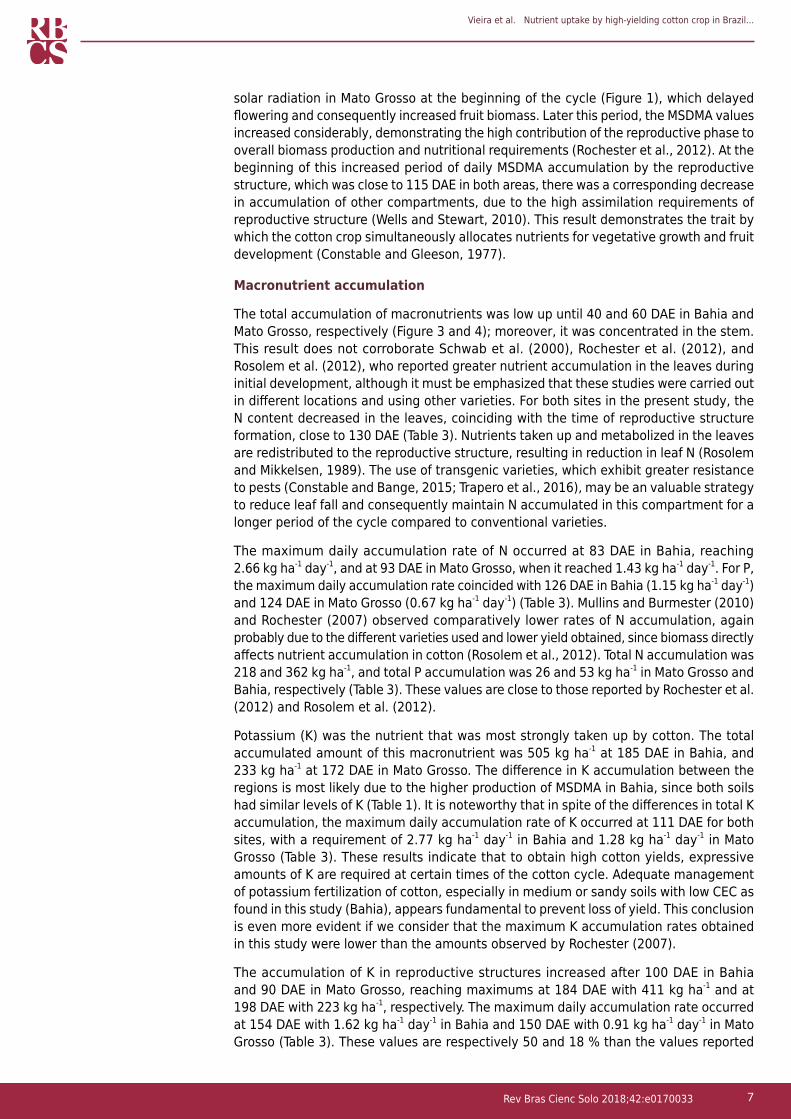
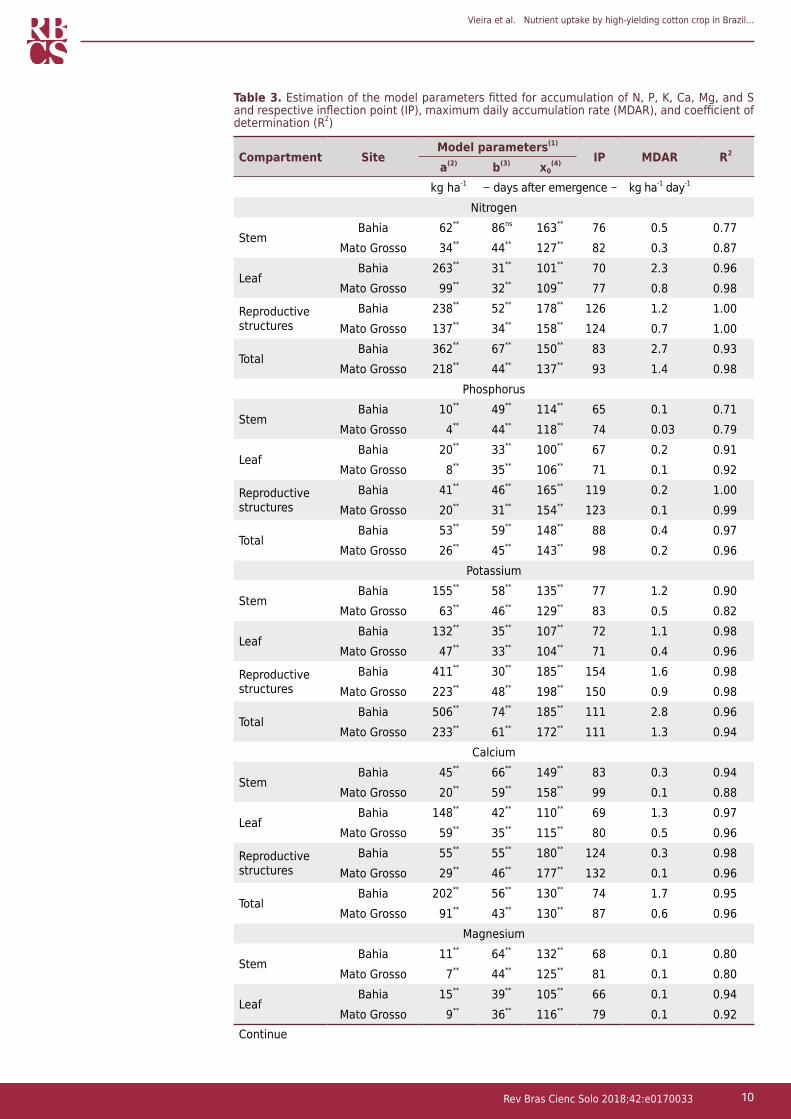
The total accumulation of macronutrients was low up until 40 and 60 DAE in Bahia and Mato Grosso, respectively (Figure 3 and 4); moreover, it was concentrated in the stem. This result does not corroborate Schwab et al. (2000), Rochester et al. (2012), and Rosolem et al. (2012), who reported greater nutrient accumulation in the leaves during initial development, although it must be emphasized that these studies were carried out in different locations and using other varieties. For both sites in the present study, the N content decreased in the leaves, coinciding with the time of reproductive structure formation, close to 130 DAE (Table 3). Nutrients taken up and metabolized in the leaves are redistributed to the reproductive structure, resulting in reduction in leaf N (Rosolem and Mikkelsen, 1989). The use of transgenic varieties, which exhibit greater resistance to pests (Constable and Bange, 2015; Trapero et al., 2016), may be an valuable strategy to reduce leaf fall and consequently maintain N accumulated in this compartment for a longer period of the cycle compared to conventional varieties.
The maximum daily accumulation rate of N occurred at 83 DAE in Bahia, reaching 2.66 kg ha-1 day-1, and at 93 DAE in Mato Grosso, when it reached 1.43 kg ha-1 day-1. For P, the maximum daily accumulation rate coincided with 126 DAE in Bahia (1.15 kg ha-1 day-1) and 124 DAE in Mato Grosso (0.67 kg ha-1 day-1) (Table 3). Mullins and Burmester (2010) and Rochester (2007) observed comparatively lower rates of N accumulation, again probably due to the different varieties used and lower yield obtained, since biomass directly affects nutrient accumulation in cotton (Rosolem et al., 2012). Total N accumulation was 218 and 362 kg ha-1, and total P accumulation was 26 and 53 kg ha-1 in Mato Grosso and Bahia, respectively (Table 3). These values are close to those reported by Rochester et al. (2012) and Rosolem et al. (2012).
Potassium (K) was the nutrient that was most strongly taken up by cotton. The total accumulated amount of this macronutrient was 505 kg ha-1 at 185 DAE in Bahia, and 233 kg ha-1 at 172 DAE in Mato Grosso. The difference in K accumulation between the regions is most likely due to the higher production of MSDMA in Bahia, since both soils had similar levels of K (Table 1). It is noteworthy that in spite of the differences in total K accumulation, the maximum daily accumulation rate of K occurred at 111 DAE for both sites, with a requirement of 2.77 kg ha-1 day-1 in Bahia and 1.28 kg ha-1 day-1 in Mato Grosso (Table 3). These results indicate that to obtain high cotton yields, expressive amounts of K are required at certain times of the cotton cycle. Adequate management of potassium fertilization of cotton, especially in medium or sandy soils with low CEC as found in this study (Bahia), appears fundamental to prevent loss of yield. This conclusion is even more evident if we consider that the maximum K accumulation rates obtained in this study were lower than the amounts observed by Rochester (2007).
The accumulation of K in reproductive structures increased after 100 DAE in Bahia and 90 DAE in Mato Grosso, reaching maximums at 184 DAE with 411 kg ha-1 and at 198 DAE with 223 kg ha-1, respectively. The maximum daily accumulation rate occurred at 154 DAE with 1.62 kg ha-1 day-1 in Bahia and 150 DAE with 0.91 kg ha-1 day-1 in Mato Grosso (Table 3). These values are respectively 50 and 18 % than the values reported
Vieira et al. Nutrient uptake by high-yielding cotton crop in Brazil...
8Rev Bras Cienc Solo 2018;42:e0170033
by Rochester (2007). However, for both the present study and that of Rochester (2007), K was the element most demanded by cotton.
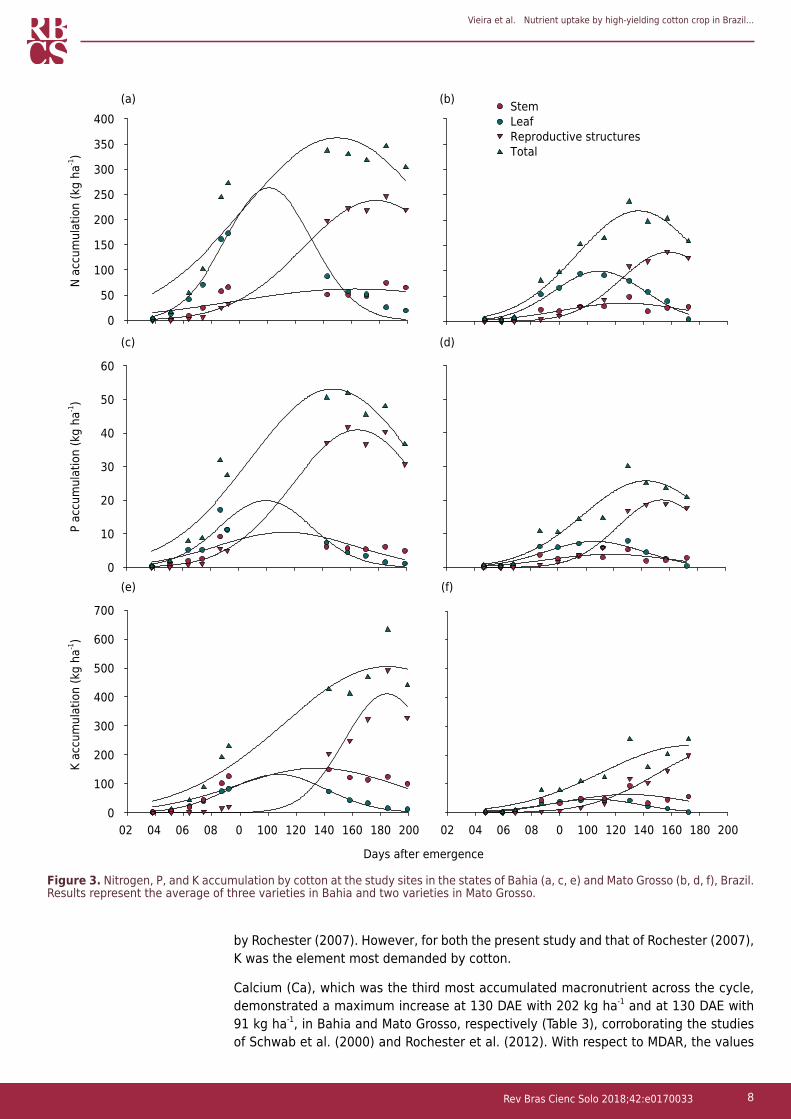
Calcium (Ca), which was the third most accumulated macronutrient across the cycle, demonstrated a maximum increase at 130 DAE with 202 kg ha-1 and at 130 DAE with 91 kg ha-1, in Bahia and Mato Grosso, respectively (Table 3), corroborating the studies of Schwab et al. (2000) and Rochester et al. (2012). With respect to MDAR, the values
0
50
100
150
200
250
300
350
400
0
10
20
30
40
50
60
02 04 06 08 0 100 120 140 160 180 200
K ac
cum
ulat
ion
(kg
ha-1)
0
100
200
300
400
500
600
700
02 04 06 08 0 100 120 140 160 180 200
StemLeafReproductive structuresTotal
(a) (b)
(c) (d)
(e) (f)
Days after emergence
P ac
cum
ulat
ion
(kg
ha-1)
N ac
cum
ulat
ion
(kg
ha-1)
Figure 3. Nitrogen, P, and K accumulation by cotton at the study sites in the states of Bahia (a, c, e) and Mato Grosso (b, d, f), Brazil. Results represent the average of three varieties in Bahia and two varieties in Mato Grosso.
Vieira et al. Nutrient uptake by high-yielding cotton crop in Brazil...
9Rev Bras Cienc Solo 2018;42:e0170033
observed in the present study were slightly higher than those of Rochester (2007). For reproductive structures, the maximum accumulation occurred at 180 in Bahia and 177 DAE in Mato Grosso (Table 3). The late accumulation of Ca by cotton plants was to be expected, since this element is immobile as a result of its structural role in the formation
0
50
100
150
200
250
0
10
20
30
40
50
0
10
20
30
40
50
60
70
80 100 120 140 160 180 200
StemLeafReproductive structuresTotal
(a) (b)
(c) (d)
(e) (f)
Days after emergence
604020080 100 120 140 160 180 2006040200
S ac
cum
ulat
ion
(kg
ha-1)
Mg
accu
mul
atio
n (k
g ha
-1)
Ca a
ccum
ulat
ion
(kg
ha-1)
Figure 4. Accumulation of Ca, Mg, and S by cotton at the study sites in the states of Bahia (a, c, e) and Mato Grosso (b, d, f), Brazil. Results represent the average of three varieties in Bahia and two varieties in Mato Grosso.
Vieira et al. Nutrient uptake by high-yielding cotton crop in Brazil...
10Rev Bras Cienc Solo 2018;42:e0170033
Table 3. Estimation of the model parameters fitted for accumulation of N, P, K, Ca, Mg, and S and respective inflection point (IP), maximum daily accumulation rate (MDAR), and coefficient of determination (R2)
Compartment SiteModel parameters(1)
IP MDAR R2
a(2) b(3) x0(4)
kg ha-1 days after emergence kg ha-1 day-1
Nitrogen
StemBahia 62** 86ns 163** 76 0.5 0.77
Mato Grosso 34** 44** 127** 82 0.3 0.87
LeafBahia 263** 31** 101** 70 2.3 0.96
Mato Grosso 99** 32** 109** 77 0.8 0.98
Reproductive structures
Bahia 238** 52** 178** 126 1.2 1.00Mato Grosso 137** 34** 158** 124 0.7 1.00
TotalBahia 362** 67** 150** 83 2.7 0.93
Mato Grosso 218** 44** 137** 93 1.4 0.98Phosphorus
StemBahia 10** 49** 114** 65 0.1 0.71
Mato Grosso 4** 44** 118** 74 0.03 0.79
LeafBahia 20** 33** 100** 67 0.2 0.91
Mato Grosso 8** 35** 106** 71 0.1 0.92
Reproductive structures
Bahia 41** 46** 165** 119 0.2 1.00Mato Grosso 20** 31** 154** 123 0.1 0.99
TotalBahia 53** 59** 148** 88 0.4 0.97
Mato Grosso 26** 45** 143** 98 0.2 0.96Potassium
StemBahia 155** 58** 135** 77 1.2 0.90
Mato Grosso 63** 46** 129** 83 0.5 0.82
LeafBahia 132** 35** 107** 72 1.1 0.98
Mato Grosso 47** 33** 104** 71 0.4 0.96
Reproductive structures
Bahia 411** 30** 185** 154 1.6 0.98Mato Grosso 223** 48** 198** 150 0.9 0.98
TotalBahia 506** 74** 185** 111 2.8 0.96
Mato Grosso 233** 61** 172** 111 1.3 0.94Calcium
StemBahia 45** 66** 149** 83 0.3 0.94
Mato Grosso 20** 59** 158** 99 0.1 0.88
LeafBahia 148** 42** 110** 69 1.3 0.97
Mato Grosso 59** 35** 115** 80 0.5 0.96
Reproductive structures
Bahia 55** 55** 180** 124 0.3 0.98Mato Grosso 29** 46** 177** 132 0.1 0.96
TotalBahia 202** 56** 130** 74 1.7 0.95
Mato Grosso 91** 43** 130** 87 0.6 0.96Magnesium
StemBahia 11** 64** 132** 68 0.1 0.80
Mato Grosso 7** 44** 125** 81 0.1 0.80
LeafBahia 15** 39** 105** 66 0.1 0.94
Mato Grosso 9** 36** 116** 79 0.1 0.92Continue
Vieira et al. Nutrient uptake by high-yielding cotton crop in Brazil...
11Rev Bras Cienc Solo 2018;42:e0170033
of the cell wall (Epstein and Bloom, 2004). Thus, accumulation increases gradually as fruit starts to form. The maximum daily accumulation rate in reproductive structures occurred at 124 DAE with 0.27 kg ha-1 day-1 in Bahia and 132 DAE with 0.13 kg ha-1 day-1 in Mato Grosso. Considering leaves, maximum accumulation occurred between 110 and 115 DAE during the period of leaf pre-senescence, which is governed by the characteristics of the variety.
Magnesium was accumulated in smaller quantities than the other macronutrients in Bahia. In Mato Grosso, Mg was accumulated in quantities that exceeded those of S. Maximum accumulation of Mg occurred at 149 DAE with 44 kg ha-1 in Bahia and 144 DAE with 28 kg ha-1 in Mato Grosso (Table 3). Rochester (2007) obtained maximum accumulation values for Mg of 72 kg ha-1, suggesting that accumulation of this element in the present study was low. The low amount of Mg in plant tissue may be partially explained by the correspondingly high K values, since these elements compete for the absorption channels in the cells (Rahmatullah and Baker, 1981; Peck and MacDonald, 1989), a fact that may be exacerbated in Mato Grosso by the restricted availability of Mg in the soil (Table 1). In addition, there is a dilution effect for Mg (Foloni and Rosolem, 2008) caused by increased yield due to adequate uptake of limiting nutrients such as K.
The maximum accumulation of S occurred at 153 DAE with 61 kg ha-1 in Bahia and 158 DAE with 19 kg ha-1 in Mato Grosso. In Bahia, the result was close to that of Rochester (2007); however, for Mato Grosso, the value was considerably lower, as was the maximum daily accumulation rate for both areas, occurring at 98 DAE with 0.38 kg ha-1 day-1 in Bahia and 103 DAE with 0.11 kg ha-1 day-1 in Mato Grosso (Table 3). Although S was not analyzed in the initial soil characterization, the discrepancy in results may be related to possible differences in soil S content between the areas.
Micronutrient accumulation
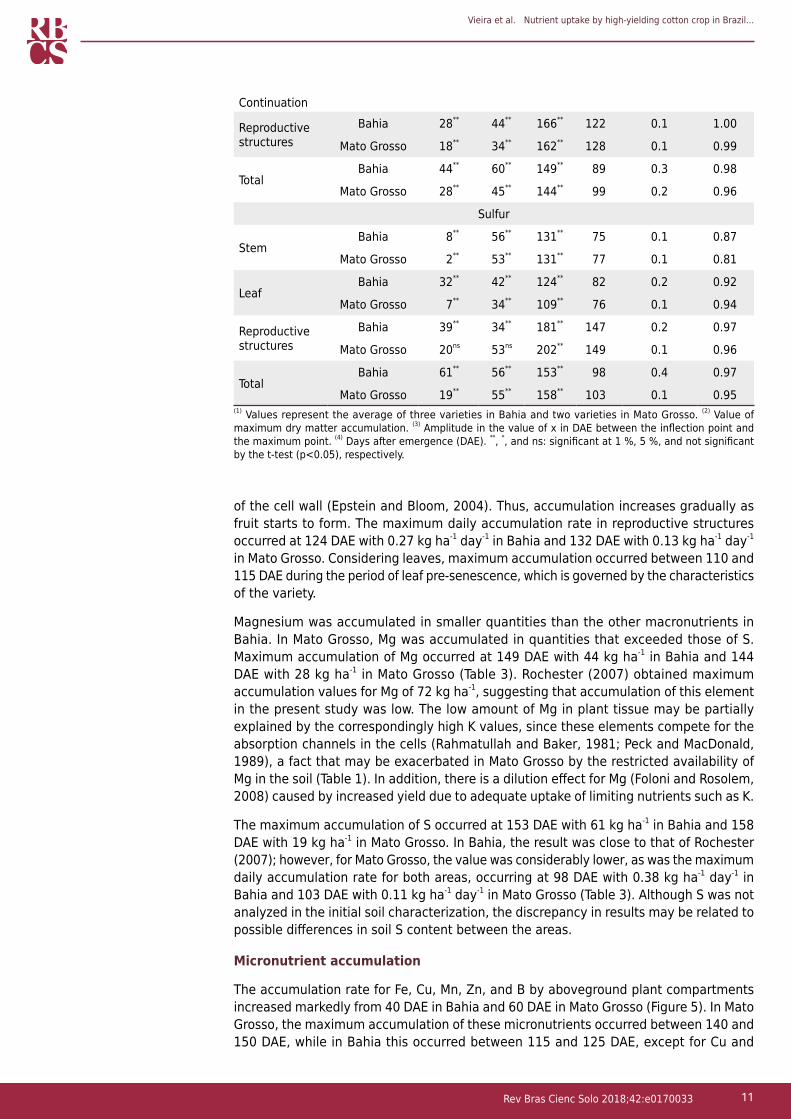
The accumulation rate for Fe, Cu, Mn, Zn, and B by aboveground plant compartments increased markedly from 40 DAE in Bahia and 60 DAE in Mato Grosso (Figure 5). In Mato Grosso, the maximum accumulation of these micronutrients occurred between 140 and 150 DAE, while in Bahia this occurred between 115 and 125 DAE, except for Cu and
Continuation
Reproductive structures
Bahia 28** 44** 166** 122 0.1 1.00
Mato Grosso 18** 34** 162** 128 0.1 0.99
TotalBahia 44** 60** 149** 89 0.3 0.98
Mato Grosso 28** 45** 144** 99 0.2 0.96
Sulfur
StemBahia 8** 56** 131** 75 0.1 0.87
Mato Grosso 2** 53** 131** 77 0.1 0.81
LeafBahia 32** 42** 124** 82 0.2 0.92
Mato Grosso 7** 34** 109** 76 0.1 0.94
Reproductive structures
Bahia 39** 34** 181** 147 0.2 0.97
Mato Grosso 20ns 53ns 202** 149 0.1 0.96
TotalBahia 61** 56** 153** 98 0.4 0.97
Mato Grosso 19** 55** 158** 103 0.1 0.95(1) Values represent the average of three varieties in Bahia and two varieties in Mato Grosso. (2) Value of maximum dry matter accumulation. (3) Amplitude in the value of x in DAE between the inflection point and the maximum point. (4) Days after emergence (DAE). **, *, and ns: significant at 1 %, 5 %, and not significant by the t-test (p<0.05), respectively.

Vieira et al. Nutrient uptake by high-yielding cotton crop in Brazil...
12Rev Bras Cienc Solo 2018;42:e0170033
B, in which maximum uptake occurred at 147 and 172 DAE, respectively. The delayed micronutrients accumulation in Mato Grosso can be explained by a longer rainfall period when compared to Bahia, which may have facilitated a longer period of nutrient uptake by plants. The micronutrient that was most taken up at both sites was Fe, with maximum accumulation of 1,758 g ha-1 in Bahia and 504 g ha-1 in Mato Grosso. Boron (B) exhibited a maximum accumulation of 459 g ha-1 in Bahia and 211 g ha-1 in Mato Grosso, and was the second most demanded micronutrient. This result concurs with a great deal of practical evidence that suggests cotton is highly demanding in boron. The maximum accumulation rate for B was close to 96 DAE in Bahia and 105 DAE in Mato Grosso. This observation, coupled with the low mobility of B within plants, highlights the need for continuous supplies of B to cotton crops.
Copper was the micronutrient that showed the lowest uptake by cotton, with a maximum accumulation of 70 g ha-1 in Bahia and 44 g ha-1 in Mato Grosso (Table 4). These data corroborate those of Rochester et al. (2012), who verified that Cu was the micronutrient least taken up in cotton grown in Australia. The maximum daily accumulation rate was 0.55 g ha-1 day-1 at 77 DAE in Bahia and 0.28 g ha-1 day-1 at 97 DAE in Mato Grosso.
The maximum accumulation of Zn in Bahia was 50 % greater than it was in Mato Grosso, with values in the order of 350 and 190 g ha-1, respectively (Table 4). For Mn, the maximum accumulation was almost two times higher in Bahia than in Mato Grosso, at 402 and 202 g ha-1, respectively (Table 4). The periods of highest uptake of Zn and Mn were very similar for both sites.
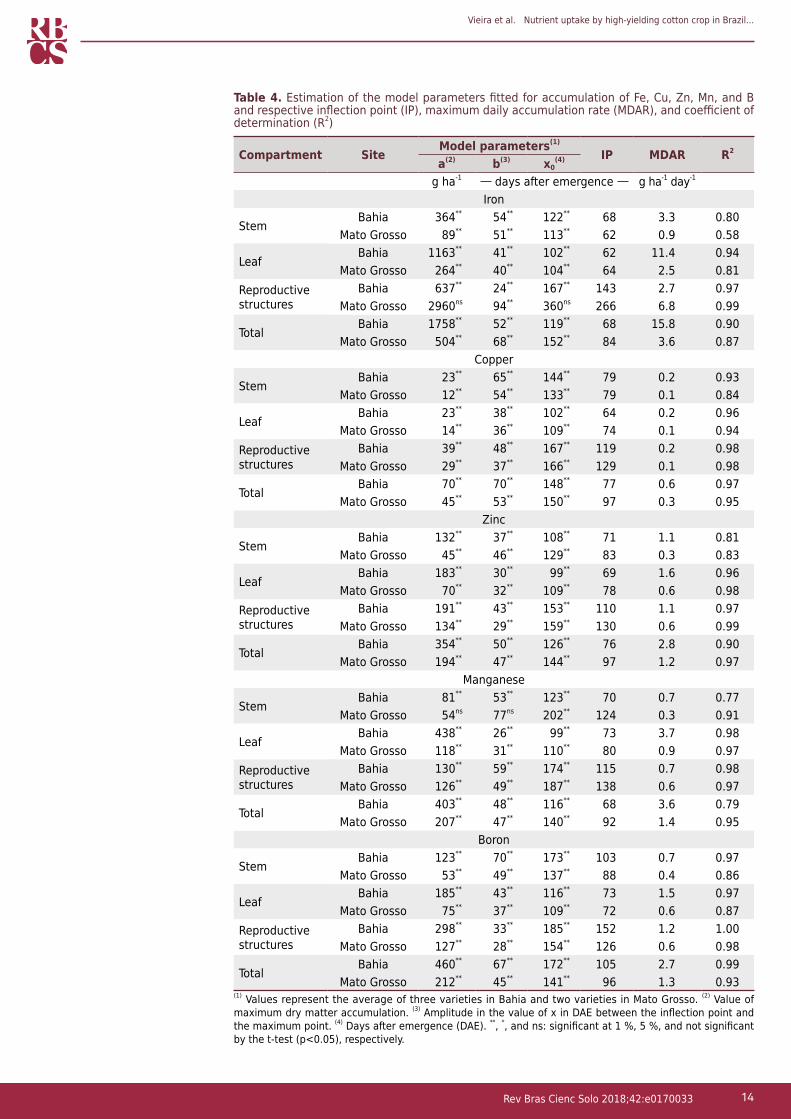
Extraction and export of nutrients
In general, there was no pronounced variation in the export and extraction of nutrients per unit of lint and seed produced by the different varieties cultivated in Mato Grosso and Bahia (Table 5). For N, the export ranged from 13-14 kg t-1, whereas for K, this ranged from 21 to 24 kg t-1. For S, the quantity exported was similar in both areas (2 kg t-1), but the extraction was almost double in Bahia compared to Mato Grosso (10 and 5 kg t-1, respectively). The higher S extraction in Bahia is possibly related to the higher S content available in the soil.
For K, despite the similarity observed in export values, the accumulated amount of crop residues was higher in Bahia (58 kg t-1) than it was in Mato Grosso (40 kg t-1) (Table 5). Although K content was similar for both sites (Table 1), the fact that the soils of Bahia have a more sandy texture may have permitted higher K uptake by the plants, since in more clayey soils K is present in a more exchangeable fraction (adsorbed on the CEC) than it is in solution (Ernani et al., 2007). For the micronutrients in general, despite variation in the quantities exported and extracted, values were in the same order of magnitude, with the exception of Fe, for which extraction more than doubled in Bahia.
Despite the differences in yield between regions (6.2 t ha-1 in Bahia and 3.8 t ha-1 in Mato Grosso, table 5), the nutritional requirement per tons of lint and seed was similar between the two sites. Variations in nutrient extraction between sites seem to be more closely related to soil nutrient availability (such as K and S) than any increased nutrient requirement provided by higher yields. These findings contradict those of Rochester (2007), who concluded that higher yielding plants take up more nutrients per unit produced. The introduction of modern cotton varieties in Australia has enabled a 20 % increase in the efficiency of N, P, and K use (Rochester and Constable, 2015), which may help to reconcile the difference between previous results and those obtained in the present study.
The maximum accumulation of biomass by cotton occurs later, from 180 to 190 DAE (Table 2), than the period of maximum accumulation of nutrients, which ranged from 120 to 190 DAE (Tables 3 and 4). These results validate the need for nutrient supply in the early stages of the cotton development cycle. In addition, unlike other studies

Vieira et al. Nutrient uptake by high-yielding cotton crop in Brazil...
13Rev Bras Cienc Solo 2018;42:e0170033
0200400600800
10001200140016001800
0
20
40
60
80
0
100
200
300
400
0
100
200
300
400
500
0
100
200
300
400
500
Days after emergence80 100 120 140 160 180 200604020080 100 120 140 160 180 2006040200
B ac
cum
ulat
ion
(g h
a-1)
Mn
accu
mul
atio
n (g
ha-1
)Zn
acc
umul
atio
n (g
ha-1
)Cu
acc
umul
atio
n (g
ha-1
)Fe
acc
umul
atio
n (g
ha-1
) StemLeafReproductive structuresTotal
(a) (b)
(c) (d)
(g) (h)
(i) (j)
(e) (f)
Figure 5. Accumulation of Fe, Cu, Zn, Mn, and B by cotton at the study sites in the states of Bahia (a, c, g, i) and Mato Grosso (b, d, f, h, j), Brazil. Results represent the average of three varieties in Bahia and two varieties in Mato Grosso.
Vieira et al. Nutrient uptake by high-yielding cotton crop in Brazil...
14Rev Bras Cienc Solo 2018;42:e0170033
Table 4. Estimation of the model parameters fitted for accumulation of Fe, Cu, Zn, Mn, and B and respective inflection point (IP), maximum daily accumulation rate (MDAR), and coefficient of determination (R2)
Compartment SiteModel parameters(1)
IP MDAR R2
a(2) b(3) x0(4)
g ha-1 days after emergence g ha-1 day-1
Iron
StemBahia 364** 54** 122** 68 3.3 0.80
Mato Grosso 89** 51** 113** 62 0.9 0.58
LeafBahia 1163** 41** 102** 62 11.4 0.94
Mato Grosso 264** 40** 104** 64 2.5 0.81Reproductive structures
Bahia 637** 24** 167** 143 2.7 0.97Mato Grosso 2960ns 94** 360ns 266 6.8 0.99
TotalBahia 1758** 52** 119** 68 15.8 0.90
Mato Grosso 504** 68** 152** 84 3.6 0.87Copper
StemBahia 23** 65** 144** 79 0.2 0.93
Mato Grosso 12** 54** 133** 79 0.1 0.84
LeafBahia 23** 38** 102** 64 0.2 0.96
Mato Grosso 14** 36** 109** 74 0.1 0.94Reproductive structures
Bahia 39** 48** 167** 119 0.2 0.98Mato Grosso 29** 37** 166** 129 0.1 0.98
TotalBahia 70** 70** 148** 77 0.6 0.97
Mato Grosso 45** 53** 150** 97 0.3 0.95Zinc
StemBahia 132** 37** 108** 71 1.1 0.81
Mato Grosso 45** 46** 129** 83 0.3 0.83
LeafBahia 183** 30** 99** 69 1.6 0.96
Mato Grosso 70** 32** 109** 78 0.6 0.98Reproductive structures
Bahia 191** 43** 153** 110 1.1 0.97Mato Grosso 134** 29** 159** 130 0.6 0.99
TotalBahia 354** 50** 126** 76 2.8 0.90
Mato Grosso 194** 47** 144** 97 1.2 0.97Manganese
StemBahia 81** 53** 123** 70 0.7 0.77
Mato Grosso 54ns 77ns 202** 124 0.3 0.91
LeafBahia 438** 26** 99** 73 3.7 0.98
Mato Grosso 118** 31** 110** 80 0.9 0.97Reproductive structures
Bahia 130** 59** 174** 115 0.7 0.98Mato Grosso 126** 49** 187** 138 0.6 0.97
TotalBahia 403** 48** 116** 68 3.6 0.79
Mato Grosso 207** 47** 140** 92 1.4 0.95Boron
StemBahia 123** 70** 173** 103 0.7 0.97
Mato Grosso 53** 49** 137** 88 0.4 0.86
LeafBahia 185** 43** 116** 73 1.5 0.97
Mato Grosso 75** 37** 109** 72 0.6 0.87Reproductive structures
Bahia 298** 33** 185** 152 1.2 1.00Mato Grosso 127** 28** 154** 126 0.6 0.98
TotalBahia 460** 67** 172** 105 2.7 0.99
Mato Grosso 212** 45** 141** 96 1.3 0.93(1) Values represent the average of three varieties in Bahia and two varieties in Mato Grosso. (2) Value of maximum dry matter accumulation. (3) Amplitude in the value of x in DAE between the inflection point and the maximum point. (4) Days after emergence (DAE). **, *, and ns: significant at 1 %, 5 %, and not significant by the t-test (p<0.05), respectively.
Vieira et al. Nutrient uptake by high-yielding cotton crop in Brazil...
15Rev Bras Cienc Solo 2018;42:e0170033
reported in the literature, this study suggests that the export of nutrients, in kg t-1 of lint and seeds, is similar for crops with yields varying from 250 to 400 @ ha-1. Therefore, in areas of high yield potential, higher rates of nutrients should be applied to avoid yield limitations. Despite the high amount of nutrients exported by cotton in high yielding crops, the cultivation of highly productive transgenic varieties is unlikely to promote a decline in soil fertility, as long as the quantities of nutrients exported by the cotton are restored.
CONCLUSIONSAdequate climate conditions allowed higher cotton yield in the site at Bahia than at Mato Grosso, obtaining yield (lint and seed) as high as 6.2 and 3.8 t ha-1, respectively. Improved yield resulted in higher extraction of nutrients per area, but extraction and export of nutrient (per t of lint and seed) were similar among the sites.
The maximum accumulation of nutrients by cotton occurred between 120 and 190 days after emergence, while the maximum accumulation of biomass occurred between 170 and 190 days after emergence.
The extraction and export of nutrients by cotton occurred in the following order: K> N> Ca> P = Mg = S> Fe> B> Mn> Zn> Cu.
REFERENCESAugostinho LMD, Prado RM, Rozane DE, Freitas N. Acúmulo de massa seca e marcha de absorção de nutrientes em mudas de goiabeira ‘Pedro Sato’. Bragantia. 2008;67:577-85. https://doi.org/10.1590/S0006-87052008000300004
Bassett DM, Anderson WD, Werkhoven CHE. Dry matter production and nutrient uptake in irrigated cotton (Gossypium hirsutum). Agron J. 1970;62:299-303. https://doi.org/10.2134/agronj1970.00021962006200020037x
Bruulsema TW, Fixen PE, Sulewski GD. 4R plant nutrition: a manual for improving the management of plant nutrition. Norcross: International Plant Nutrition Institute; 2012.
Camargo OA, Moniz AC, Jorge JA, Valadares JMAS. Métodos de análise química, mineralógica e física de solos do IAC. Campinas: Instituto Agronômico de Campinas; 1986. (Boletim Técnico, 106).
Carvalho MCS. Adubação de cobertura do algodoeiro cultivado em condições de sequeiro na região do Cerrado. Campina Grande: Embrapa Algodão; 2007. (Comunicado Técnico, 347).
Companhia Nacional de Abastecimento - Conab. Acompanhamento da safra brasileira: grãos [internet]. Brasília, DF; 2016 [acesso em 08 set 2016]. Disponível em: http://www.conab.gov.br/OlalaCMS/uploads/arquivos/16_09_06_09_03_20_boletim_12_setembro.pdf.
Table 5. Extraction and export of macro- and micronutrients by cotton cultivated in Bahia and Mato Grosso
Compartment YieldMacronutrients Micronutrients
N P K Ca Mg S Fe Cu Zn Mn Bt ha-1 @ ha-1 kg t-1 of lint and seed g t-1 of lint and seed
BahiaExport (lint and seed) 6.2 414 @ ha-1 14 2 24 3 1 2 16 2 7 8 18Crop residues(2) 18.7 - 44 7 58 29 6 8 267 9 50 57 56Extraction by shoots 24.9 - 58 9 82 32 7 10 283 11 57 65 74
Mato GrossoExport (lint and seed) 3.8 256 @ ha-1 13 2 21 3 2 2 43 3 13 13 11Crop residues(2) 9.6 - 44 5 40 21 6 3 88 9 38 41 44Extraction by shoots 13.4 - 57 7 61 24 8 5 132 12 51 54 55
The values represent the average of three varieties in Bahia and two varieties in Mato Grosso. (2) Leaf, stem, and other constituents of the fruit (other than lint and seed). One @ represent 15 kg of lint and seed.
Vieira et al. Nutrient uptake by high-yielding cotton crop in Brazil...
16Rev Bras Cienc Solo 2018;42:e0170033
Constable GA, Bange MP. The yield potential of cotton (Gossypium hirsutum L.). Field Crops Res. 2015;182:98-106. https://doi.org/10.1016/j.fcr.2015.07.017
Constable GA, Gleeson AC. Growth and distribution of dry matter in cotton (Gossypium hirsutum L.). Aust J Agr Res. 1977;28:249-56. https://doi.org/10.1071/AR9770249
Epstein E, Bloom AJ. Mineral nutrition of plants: principles and perspectives. 2nd ed. Sunderland: Sinauer; 2004.
Ernani PR, Almeida JA, Santos FC. Potássio. In: Novais RF, Alvarez V VH, Barros NF, Fontes RLF, Cantarutti RB, Neves JCL, editores. Fertilidade do solo. Viçosa, MG: Sociedade Brasileira de Ciência do Solo; 2007. p. 551-94.
Ferreira GB, Severino LS, Pedrosa MB, Alencar AR, Vasconcelos OL, Ferreira AF, Abreu JR. Resultados de pesquisa com a cultura do algodão no oeste e sudoeste da Bahia - safra 2003/2004. Campina Grande: Embrapa Algodão; 2004. (Documentos, 133).
Foloni JSS, Rosolem CA. Produtividade e acúmulo de potássio na soja em função da antecipação da adubação potássica no sistema de plantio direto. Rev Bras Cienc Solo. 2008;32:1549-61. https://doi.org/10.1590/S0100-06832008000400019
Gowda A, Rydel TJ, Wollacott AM, Brown RS, Akbar W, Clark TL, Flasinski S, Nageotte JR, Read AC, Shi X, Werner BJ, Pleau MJ, Baum JA. A transgenic approach for controlling Lygus in cotton. Nat Commun. 2016;7:12213. https://doi.org/10.1038/ncomms12213
International Cotton Advisory Committee - ICAC. [internet]. Washington, DC; 2015. [accessed on 30 Sept 2016]. Available at: http://www.icac.org
Malavolta E, Vitti GC, Oliveira SA. Avaliação do estado nutricional das plantas: princípios e aplicações. 2. ed. Piracicaba: Potafos; 1997.
Mullins GL, Burmester CH. Relation of growth and development to mineral nutrition. In: Stewart JMD, Oosterhuis DM, Heitholt JJ, Mauney JR, editors. Physiology of cotton. Netherlands: Springer; 2010. p. 97-105.
Peck NH, MacDonald GE. Sweet corn plant responses to P and K in the soil and to band-applied monoammonium phosphate, potassium sulfate, and magnesium sulfate. J Am Soc Hortic Sci. 1989;114:269-72.
Rahmatullah, Baker DE. Magnesium accumulation by corn (Zea mays L.) as a function of potassium-magnesium exchange in soils. Soil Sci Soc Am J. 1981;45:899-903. https://doi.org/10.2136/sssaj1981.03615995004500050016x
Raij B van, Andrade JC, Cantarella H, Quaggio JA. Análise química para avaliação da fertilidade de solos tropicais. Campinas: Instituto Agronômico; 2001.
Rochester IJ. Nutrient uptake and export from an Australian cotton field. Nutr Cycl Agroecosyst. 2007;77:213-23. https://doi.org/10.1007/s10705-006-9058-2
Rochester IJ, Constable GA. Improvements in nutrient uptake and nutrient use-efficiency in cotton cultivars released between 1973 and 2006. Field Crop Res. 2015;173:14-21. https://doi.org/10.1016/j.fcr.2015.01.001
Rochester IJ, Constable GA, Oosterhuis DM, Errington M. Nutritional requirements of cotton during flowering and fruiting. In: Oosterhuis DM, Cothren JT, editors. Flowering and fruiting in cotton. Cordova: The cotton foundation; 2012. Number Eight. p. 35-50.
Rosolem CA. Ecofisiologia e manejo da cultura do algodoeiro. Encarte Técnico Potafós. Informações Agronômicas Num. 95, Set. 2001. p. 1-9.
Rosolem CA, Echer FR, Lisboa IP, Barbosa TS. Acúmulo de nitrogênio, fósforo e potássio pelo algodoeiro sob irrigação cultivado em sistemas convencional e adensado. Rev Bras Cienc Solo. 2012;36:457-66. https://doi.org/10.1590/S0100-06832012000200015
Rosolem CA, Mikkelsen DS. Nitrogen source-sink relationship in cotton. J Plant Nutr. 1989;12:1417-33. https://doi.org/10.1080/01904168909364047
Ruiz HA. Incremento da exatidão da análise granulométrica do solo por meio da coleta da suspensão (Silte + Argila). Rev Bras Cienc Solo. 2005;29:297-300. http://dx.doi.org/10.1590/S0100-06832005000200015
Vieira et al. Nutrient uptake by high-yielding cotton crop in Brazil...
17Rev Bras Cienc Solo 2018;42:e0170033
Santos HG, Jacomine PKT, Anjos LHC, Oliveira VA, Oliveira JB, Coelho MR, Lumbreras JF, Cunha TJF. Sistema brasileiro de classificação de solos. 3. ed. rev. ampl. Rio de Janeiro: Embrapa Solos; 2013.
Schwab GJ, Mullins GL, Burmester CH. Growth and nutrient uptake by cotton roots under field conditions. Commun Soil Sci Plan. 2000;31:149-64. https://doi.org/10.1080/00103620009370426
SigmaPlot. SigmaPlot version 12.5. San Jose: Systat Software; 2013 [accessed on 20 Sept 2015]. Available at: htpp:www.systatsoftware.com.
Soil Survey Staff. Keys to soil taxonomy. 12th ed. Washington, DC: United States Department of Agriculture, Natural Resources Conservation Service; 2014.
Trapero C, Wilson IW, Stiller WN, Wilson LJ. Enhancing integrated pest management in GM cotton systems using host plant resistance. Front Plant Sci. 2016;7:500. https://doi.org/10.3389/fpls.2016.00500
Wells R, Stewart AM. Morphological alterations in response to management and environment. In: Stewart JMD, Oosterhuis DM, Heitholt JJ, Mauney JR, editors. Physiology of Cotton. Netherlands: Springer; 2010. p. 24-32