Embed Size (px)
Citation preview

Copyright
by
Felicia Angélica Durán
2010

The Dissertation Committee for Felicia Angélica Durán Certifies that this is the
approved version of the following dissertation:
Probabilistic Basis and Assessment Methodology for
Effectiveness of Protecting Nuclear Materials
Committee:
Sheldon Landsberger, Co-Supervisor
Gregory D. Wyss, Co-Supervisor
Steven Biegalski
Erich Schneider
Randall Charbeneau

Probabilistic Basis and Assessment Methodology for
Effectiveness of Protecting Nuclear Materials
by
Felicia Angélica Durán, B.S.M.S.E.; M.S.
Dissertation
Presented to the Faculty of the Graduate School of
The University of Texas at Austin
in Partial Fulfillment
of the Requirements
for the Degree of
Doctor of Philosophy
The University of Texas at Austin
December 2010

Dedication
With deep love and gratitude, I dedicate this endeavor to my family who love me, teach
me, encourage me, believe in me and inspire me ― especially to Mary Jane and Amelia
Jane, and to honor the memories of Cruzita, José Dolores, Sarah, David, and Rudolfo

v
Acknowledgements
In this endeavor, I am thankful to have had the opportunity to complete the
majority my PhD studies through the Sandia National Laboratories* (Sandia) Doctoral
Studies Program (DSP). Once upon a time, when I was developing a love of school, my
father told me that if I studied hard and kept getting good grades, I could get paid for
going to school. A few decades later in life, it actually did happen, and for most of the
time I’ve been working on my PhD, I have had the tremendous privilege of having as my
“job” an activity that I have always most enjoyed – going to school. My participation in
the DSP was supported by my managers and the University Programs staff at Sandia. My
thanks go especially to Robert Waters and Mark Allen for their support at the start, to
Carla Ulibarrí for her support at the finish, and to Bernadette Montaño, Irene Allen, and
Charline Wells for their support in University Programs.
I am most appreciative of my advisors, Greg Wyss and Professor Sheldon
Landsberger. To Greg, who is also a long-time colleague and a good friend, I give my
deepest, heartfelt thanks for his constant, patient, impressively knowledgeable, and at
times exuberant guidance and support. I consider it my great fortune to work with him
and am grateful for all that I have learned from him. I would like to thank Professor
* Sandia National Laboratories is a multi program laboratory operated by Sandia Corporation, a wholly owned subsidiary of Lockheed Martin Corporation, for the U.S. Department of Energy’s National Nuclear Security Administration under Contract DE-AC04-94-AL850000.

vi
Sheldon Landsberger for his experience and abilities as a university educator and his
leadership of the distance education program in Nuclear and Radiation Engineering at
The University of Texas at Austin. I would also like to thank the members of my PhD
committee, Professors Steven Biegalski, Erich Schneider, and Robert Charbeneau, for
their thoughtful review of this technical work.
I owe a special thanks to my current manager, Carla Ulibarrí who has been
unfailing in her support and encouragement of my efforts to finish this work and of
Greg’s efforts as my research advisor. I wish to acknowledge her technical expertise and
skilled leadership as manager of the Security Systems Analysis Department at Sandia.
Most importantly, I appreciate her attentive ear to both problems and successes and her
caring and firm words of wisdom when I need them.
This research was supported by Sandia in part by the Laboratory Directed
Research and Development Program, the DSP, and Tuition Assistance. My colleagues at
Sandia are a tremendous source of technical and scientific knowledge. I want to
especially acknowledge Pamela Dawson for sharing her work on insider analysis,
material control and accountability (MC&A), and material assurance indicators and for
her support at the outset of this work; John Darby for the much-needed instruction on
probabilistic convolution; and Ben Cipiti for his collaboration on possible application of
these methods for advanced fuel cycle facilities. Manuel Trujillo, Michael Benson, José
Rodriguez, and Bruce Berry provided technical expertise and collaboration in the areas of
MC&A and analysis of insider theft. I appreciate the opportunity to work with Greg
Conrad, Bruce Held, David Duggan, and Steve Conrad on other research related to the
insider threat. Also at Sandia, I have to thank three wonderful women who, in the course
of my research, I have dubbed the “Library Ladies.” Betsy Krause, Sandy Halliday, and
Kathleen Lee of the Building 823 Library provided an abundance of assistance to me,

vii
doing more than a few literature searches, locating copious and of course vital references,
and taking care of my numerous renewals. They were never wary when they saw me
coming; in fact, they always seemed pleased to see me and ready to go forth and seek out
the latest critical reference. I admire their talents as professional librarians. I also thank
Diane Ross, a most accomplished technical editor, for her review of the final draft of this
dissertation, and Gregg Flores and Joy Lynn Giron, co-workers who provide tremendous
support and friendship. Brad Key from QinetiQ, North America, provided instruction on
and support for two software programs: Analytic System and Software for Evaluating
Safeguards and Security (ASSESS) and Adversary Time-Line Analysis System
(ATLAS). Brad is always willing to discuss and answer questions about any aspect of
the insider problem and is most knowledgeable about ATLAS and ASSESS. I also wish
to acknowledge the interest and support of Jeff Jay, Scott Boeke, and Tom Williams at
the Savannah River Site, and Richard Donovan and Debarah Holmer at the U.S.
Department of Energy to consider this work for possible operational and policy
applications.
So many friends and colleagues have provided a constant source of
encouragement and support during the years that I have been working toward this
accomplishment. Vince Dandini and Beth Richards pursued their PhD degrees mid-
career as I did, and I appreciate their examples and the many conversations we shared
about the challenges of this type of endeavor. I know they truly understand the
experience I’ve had in this endeavor. I appreciate the opportunities I’ve had to work with
and learn from Allen Camp, John Kelly, Tim Wheeler, Frank Wyant, Donnie Whitehead,
and Jeff LaChance. My friends in World Senior Racquetball, Paula Sperling, Gary
Mazaroff, Luke St. Onge, Ralph and Edwina Waddington, Joe and Carol Gellman, Jane
and Jerry Bentley, knew me long before I started this work and have always encouraged

viii
and supported me. Suzette Driggers, Doctor of Oriental Medicine and treasured friend,
provided immeasurable skill and care to restore and sustain my health and wellness
throughout this journey. Gina Stack provided expertise in a legal matter that had to be
dealt with in the months when I was trying to finish this work. Her guidance allowed me
to minimize the distraction this matter had on finishing this work, and I am happy to now
have her as a valued friend. Warren and Anne Von Worley and Ed and Phoebe Tate are
wonderful, caring, and encouraging neighbors who on a regular basis inquired on the
progress of my work.
My most important acknowledgements are to my family to whom I have
dedicated this most significant effort of my career to date. My parents taught me, among
so many of the things I think I know now, the importance and value of education. My
mother, a wonderful woman who has always supported her children and now her
grandchildren in all their endeavors, is also the best example of a loving and caring
daughter, sister, mother, grandmother, aunt, and friend. My 14-year-old daughter, by far
the most amazing and joyful part of my life, is growing into an accomplished young
woman, in spite of the too many times over the last few years when I had to say, “Not
right now, sweetheart, I have to work on my PhD.” She’s smart, strong, caring, athletic,
and funny, and I love her more than words can say. My daughter’s paternal grandparents
are a constant source of love, encouragement and support for both me and my daughter.
My siblings are also among my best friends. I honor the memories of my grandparents
and uncles and treasure the experiences I’ve shared with them and my parents, siblings,
and many aunts, uncles, cousins, nephews and nieces who have been my most important
teachers and have fostered my love of learning. I hope I will always live up to their
regard of me and my abilities.

ix
Finally, I wish to acknowledge the most important thing I have learned in
completing this work – that this type of endeavor seemingly undertaken by an individual
is in reality supported by a cast of many. In the final months of completing this work, it
is with a sense of amazement and deep gratitude that I look back on this experience, so
very thankful for the love and support of family and friends, for the people I’ve met,
worked with and learned from along the way, for the challenges I had to face, for the
talent and abilities I was able to bring with me and the new ones I was able to develop. I
am simply grateful that I am the person who had the opportunity to do this work and to
share the experience with all those I’ve acknowledged here.

x
Probabilistic Basis and Assessment Methodology for
Effectiveness of Protecting Nuclear Materials
Publication No._____________
Felicia Angélica Durán, PhD
The University of Texas at Austin, 2010
Supervisors: Sheldon Landsberger and Gregory D. Wyss
Safeguards and security (S&S) systems for nuclear facilities include material
control and accounting (MC&A) and a physical protection system (PPS) to protect
nuclear materials from theft, sabotage and other malevolent human acts. The PPS for a
facility is evaluated using probabilistic analysis of adversary paths on the basis of
detection, delay, and response timelines to determine timely detection. The path analysis
methodology focuses on systematic, quantitative evaluation of the physical protection
component for potential external threats, and often calculates the probability that the PPS
is effective (PE) in defeating an adversary who uses that attack path. By monitoring and
tracking critical materials, MC&A activities provide additional protection against inside
adversaries, but have been difficult to characterize in ways that are compatible with the
existing path analysis methods that are used to systematically evaluate the effectiveness
of a site’s protection system. This research describes and demonstrates a new method to
incorporate MC&A protection elements explicitly within the existing probabilistic path
analysis methodology. MC&A activities, from monitoring to inventory measurements,

xi
provide many, often recurring opportunities to determine the status of critical items,
including detection of missing materials. Human reliability analysis methods are applied
to determine human error probabilities to characterize the detection capabilities of
MC&A activities. An object-based state machine paradigm was developed to
characterize the path elements of an insider theft scenario as a race against MC&A
activities that can move a facility from a normal state to a heightened alert state having
additional detection opportunities. This paradigm is coupled with nuclear power plant
probabilistic risk assessment techniques to incorporate the evaluation of MC&A activities
in the existing path analysis methodology. Event sequence diagrams describe insider
paths through the PPS and also incorporate MC&A activities as path elements. This
work establishes a probabilistic basis for incorporating MC&A activities explicitly within
the existing path analysis methodology to extend it to address insider threats. The
analysis results for this new method provide an integrated effectiveness measure for a
safeguards and security system that addresses threats from both outside and inside
adversaries.

xii
Table of Contents
List of Tables ....................................................................................................xiv
List of Figures ...................................................................................................xvi
Nomenclature ....................................................................................................xix
Chapter 1: Introduction ........................................................................................1
1.1 Material Control and Accounting Protection System ...........................2
1.2 Goal and Objectives ............................................................................3
1.3 Dissertation Organization ....................................................................4
Chapter 2: Background .........................................................................................6
2.1 Safeguards and Security System Assessment Methodology .................6
2.2 Design and Evaluation of A Physical Protection System ................... 10
2.3 Insider Studies and Evaluation of Insider Threats .............................. 16
2.4 Risk Assessment Tools ..................................................................... 22
Chapter 3: Methods for Extended Path Analysis – One Daily MC&A Activity in One Physical Protection Layer ................................................. 27
3.1 Object-Based Paradigm for Insider Theft .......................................... 28
3.2 Incorporating an Assessment of MC&A Activities ............................ 31
3.3 Insider Theft and MC&A Detection Timelines .................................. 33
3.4 Convolution Integral ......................................................................... 35
3.5 Human Reliability Models for MC&A Activities .............................. 36
3.6 Timely Detection .............................................................................. 42
3.7 Summary of Methods Development for a Single Physical Protection Layer ............................................................................... 51
Chapter 4: Methods for Extended Path Analysis – Daily and Combined MC&A Detection and Multiple Physical Protection Layers ....................... 53
4.1 Facility Overview ............................................................................. 53
4.2 Basic Insider Theft Scenario ............................................................. 57
4.3 Scenarios for One Daily MC&A Detection Activity and Varying Timelines .......................................................................................... 58

xiii
4.4 Summary of Methods Development for Daily and Combined MC&A Detection and Multiple Physical Protection Layers ............... 94
Chapter 5: Conclusions and Recommendations .................................................. 95
Appendix A: Combining Probability Distributions, Analytic, or Continuous Variable Case ............................................................................................ 99
References ....................................................................................................... 100
Vita ................................................................................................................ 107

xiv
List of Tables
Table 1. Characterization of MC&A activities as different types of NPP checking operations with estimated probabilities (HEPs) that a checker will fail to detect an error (columns 2 and 3 from [64, Table 19-1]) ................................................................................... 37
Table 2. Frequencies of key administrative MC&A activities (representative) .............................................................................. 37
Table 3. Calculation of timely detection over a 30-day scenario for a uniform insider theft timeline and one MC&A activity performed once a day based on an initial probability of detection of 0.02, for a moderate level of dependence .................... 46
Table 4. 30-day cumulative probability of MC&A detection for five dependence levels for low (0.20), medium (0.50), and high (0.99) initial probability of detect ................................................... 51
Table 5. Five scenario timelines................................................................... 74
Table 6. Event 4 probability of timely MC&A detection for the five scenario timelines for five dependence levels and low (0.02), medium (0.50), and high (0.99) initial probability of detection ....... 74
Table 7. Event 4 probability of timely MC&A detection for the five scenario timelines for five dependence levels and low (0.02), medium (0.50), and high (0.99) initial probability of detection ....... 76
Table 8: End state summary results for Timeline 1 – 5-day MAA/30-day PA timeline .................................................................................... 77
Table 9: End state summary results for Timeline 2 – 30-day MAA/30-day PA timeline ............................................................................. 78
Table 10: End state summary results for Timeline 3 – 90-day MAA/30-day PA timeline ............................................................................. 78
Table 11: End state summary results for Timeline 4 – 5-day MAA/5-day fixed PA timeline ........................................................................... 78
Table 12: End state summary results for Timeline 5 – 5-day MAA/30-day fixed PA timeline ........................................................................... 79
Table 13: Detection timeline for a notional set of six MC&A activities .......... 82
Table 14: Timely MC&A detection in the MAA (Event 2) and the PA (Event 4) for a set of MC&A activities and geometric distributions for theft timeline ........................................................ 88

xv
Table 15: Comparison of end state summary results for 5-day MAA/30-day PA timeline and geometric distributions for theft timeline for a set of MC&A activities .......................................................... 89
Table 16: Detection timeline for set of combined MC&A activities with a malicious insider performing activities 1 and 4 .............................. 91
Table 17: Detection timeline for set of combined MC&A activities with a malicious insider performing activity 1 and mitigation of a malicious insider performing activity 4 .......................................... 92
Table 18: Timely MC&A detection in the MAA (Event 2) and the PA (Event 4) and end state summary for baseline set of MC&A activities, malicious insider activity and insider mitigation ............. 94

xvi
List of Figures
Figure 1. The system assessment methodology used by the U.S. DOE for the design and evaluation of S&S protection systems [8]. ..................6
Figure 2. Design and evaluation process outline for physical protection systems [17]. ................................................................................... 11
Figure 3. Representation of an example facility’s physical areas and possible adversary paths to a target [17]. .......................................... 13
Figure 4. Basic adversary sequence diagram for a facility [17]. ...................... 13
Figure 5. Example adversary event timeline [32]. .......................................... 15
Figure 6. Categories of malevolent insiders. ................................................... 18
Figure 7a. State transition diagram for Insider Theft Object.............................. 29
Figure 7b. State transition diagram for Facility Object. ..................................... 29
Figure 8. Traditional event tree model of insider theft through protection layers. .............................................................................................. 32
Figure 9. Insider theft modeled as an event sequence diagram (ESD) incorporating MC&A. ..................................................................... 32
Figure 10: Daily probability of detection over a 30-day period for one MC&A activity performed once a day based on a BHEP of 0.98, or an initial probability of detection of 0.02, for five different levels of dependence. ....................................................................... 40
Figure 11: Daily probability of detection over a 30-day period for one MC&A activity performed once a day based on a BHEP of 0.50, or an initial probability of detection of 0.50, for five different levels of dependence. ....................................................................... 41
Figure 12: Daily probability of detection over a 30-day period for one MC&A activity performed once a day based on a BHEP of 0.01, or an initial probability of detection of 0.99, for the five different levels of dependence. ....................................................................... 41
Figure 13: Daily probability of timely detection over a 30-day scenario for one MC&A activity performed once a day based on a BHEP of 0.98, or a 0.02 initial probability of detection, for five different levels of dependence. ....................................................................... 48
Figure 14: Cumulative probability of timely detection over a 30-day scenario for one MC&A activity performed once a day based on a BHEP of 0.98, or a 0.02 initial probability of detection, for five different levels of dependence. ....................................................................... 48

xvii
Figure 15: Daily probability of timely detection over a 30-day scenario for one MC&A activity performed once a day based on a BHEP of 0.50, or a 0.50 initial probability of detection, for five different levels of dependence. ....................................................................... 49
Figure 16: Cumulative probability of timely detection over a 30-day scenario for one MC&A activity performed once a day based on a BHEP of 0.50, or a 0.50 initial probability of detection, for five different levels of dependence. ....................................................................... 49
Figure 17: Daily probability of timely detection over a 30-day scenario for one MC&A activity performed once a day based on a BHEP of 0.01, or a 0.99 initial probability of detection, for five different levels of dependence. ....................................................................... 50
Figure 18: Cumulative probability of timely detection over a 30-day scenario for one MC&A activity performed once a day based on a BHEP of 0.01, or a 0.99 initial probability of detection, for five different levels of dependence. ....................................................................... 50
Figure 19: Overview of Nuclear Manufacturing Facility layout [28]. ................ 54
Figure 20. ESD for tracking theft and detection. ............................................... 59
Figure 21: Event 1 of the ESD – Detection of the insider taking the material by the PPS in the MAA ................................................................... 60
Figure 22: The ESD through Event 2 – Timely MC&A detection in the MAA .. 60
Figure 23: The ESD through Event 3 – Detection of the insider moving the material by the PPS in the PA .......................................................... 62
Figure 24: Event tree for MC&A events in the composite timeline. .................. 64
Figure 25: The ESD through Event 4 – Timely MC&A detection in the PA ...... 65
Figure 26: The ESD through Event 5 – Detection by the PPS of the insider moving the material out of the PA ................................................... 67
Figure 27: Event sequence calculations for the 30-day MAA/30-day PA timeline scenarios for 0.02 initial probability of MC&A detection and five levels of dependence. ......................................................... 68
Figure 28: Event sequence calculations for the 30-day MAA/30-day PA timeline scenarios for 0.50 initial probability of MC&A detection and five levels of dependence. ......................................................... 71
Figure 29: Event sequence calculations for the 30-day MAA/30-day PA timeline scenarios for 0.99 initial probability of MC&A detection and five levels of dependence. ......................................................... 72
Figure 30: Plot of material recovered + alert end state summary results for the three uniform composite timelines ............................................. 80

xviii
Figure 31: Plot of material recovered + alert end state summary results for the three 5-day MAA timelines and respective uniform and fixed PA timelines .................................................................................... 80
Figure 32: Daily probability of detection over a 35-day period for a set of MC&A activities ............................................................................. 85
Figure 33: Geometric distributions for theft timeline generated from LHS. ....... 87
Figure 34: Detection timelines for baseline set of MC&A activities, malicious insider, and insider mitigation. ......................................... 93
xix
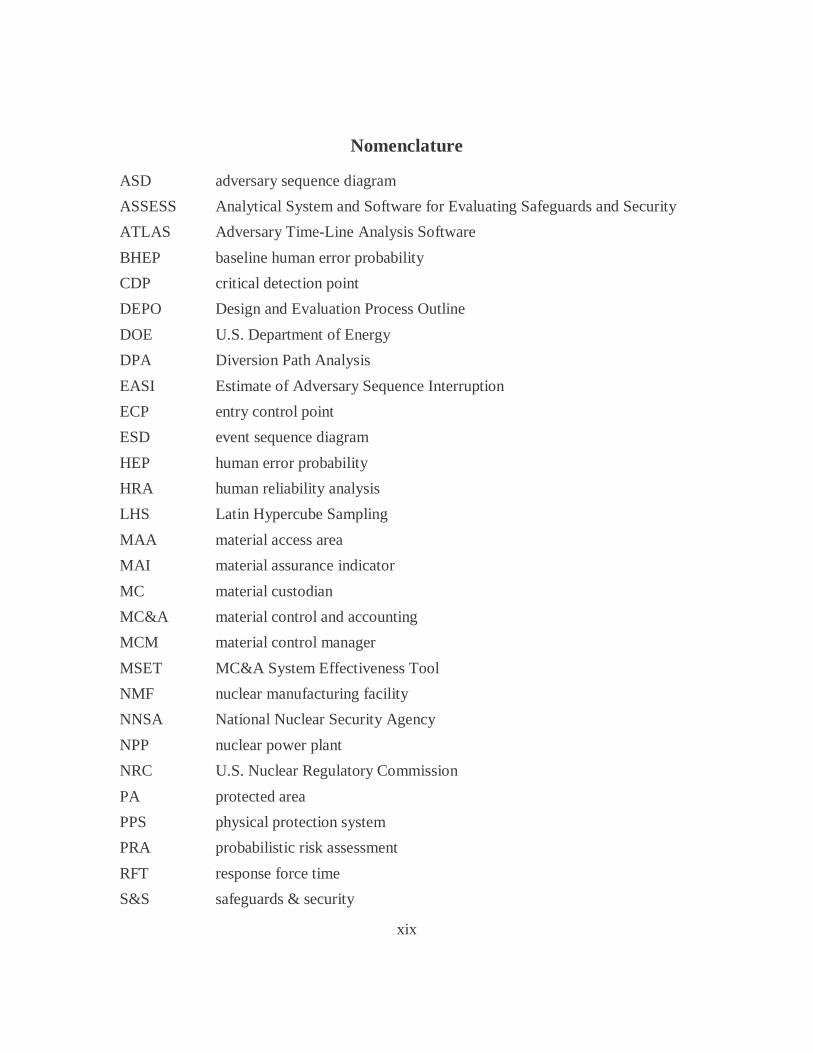
Nomenclature
ASD adversary sequence diagram
ASSESS Analytical System and Software for Evaluating Safeguards and Security
ATLAS Adversary Time-Line Analysis Software
BHEP baseline human error probability
CDP critical detection point
DEPO Design and Evaluation Process Outline
DOE U.S. Department of Energy
DPA Diversion Path Analysis
EASI Estimate of Adversary Sequence Interruption
ECP entry control point
ESD event sequence diagram
HEP human error probability
HRA human reliability analysis
LHS Latin Hypercube Sampling
MAA material access area
MAI material assurance indicator
MC material custodian
MC&A material control and accounting
MCM material control manager
MSET MC&A System Effectiveness Tool
NMF nuclear manufacturing facility
NNSA National Nuclear Security Agency
NPP nuclear power plant
NRC U.S. Nuclear Regulatory Commission
PA protected area
PPS physical protection system
PRA probabilistic risk assessment
RFT response force time
S&S safeguards & security

xx
SAVI Systematic Analysis of Vulnerability of Intrusion
SFPI Safeguards First Principles Initiative

1
Chapter 1: Introduction
Safeguards and security (S&S) systems for nuclear facilities are required to
protect nuclear materials from theft, sabotage, and other malevolent human acts.
Generally, a site’s S&S system is comprised of four overlapping components: physical
protection, material control and accounting (MC&A), personnel security and information
security. The physical protection system (PPS) for a facility is evaluated using
probabilistic analysis of adversary paths on the basis of detection, delay, and response
timelines to determine timely detection. The path analysis methodology focuses on a
systematic, quantitative evaluation of the physical protection component of the system for
potential external threats, and often calculates the probability that the PPS is effective in
defeating an adversary who uses that attack path (probability of effectiveness, PE). This
effectiveness measure is the degree to which the PPS can protect a broad spectrum of
targets against a wide range of potential threats. Other qualitative approaches have been
used for MC&A, personnel security, and information security components of the S&S
protection system [1-4].
Insider adversaries represent formidable threats to the protection of critical assets,
including information and materials. This threat takes many forms ranging from petty
theft and fraud to theft of critical assets to espionage and terrorism. Depending on their
positions, insiders can be very capable security threats because they have knowledge of
operations and the opportunity to access target materials. For facilities that have security
systems in place to protect critical assets, these individuals have access “inside” the
protective measures. They can take advantage of opportunities that arise to circumvent
system elements or to exploit system vulnerabilities and access a target directly without
being detected. The detection and delay timelines are not as relevant because insiders

2
can choose the most opportune times and optimum strategies, often using protracted or
discontinuous attacks. One strategy for addressing the insider threat would be to
optimize the control and accountability of materials, and to more fully account for
MC&A elements in the evaluation of the effectiveness of the S&S protection system.
1.1 MATERIAL CONTROL AND ACCOUNTING PROTECTION SYSTEM
S&S requirements for MC&A primarily address control and accountability
functions including access control, surveillance, material transfers, measurements, and
physical inventories. MC&A operations that track and account for critical assets at
nuclear facilities provide a key protection approach for defeating insider adversaries.
MC&A functions such as personnel access control and automated surveillance overlap
with PPS functions and are addressed by current path analysis methods. Some MC&A
protections are already incorporated, although perhaps not explicitly identified as such, in
the current approach to evaluating the effectiveness of a PPS. For example, procedures
and authorizations for material transfers are addressed within PPS elements that provide
access between protection layers, such as a personnel or vehicle portal. Other operational
activities, such as measurements and physical inventories, have been difficult to
characterize in ways that are compatible with the path analysis methods that are currently
used to systematically evaluate the effectiveness of a site’s protection system. “At the
very least, the effectiveness of certain elements has not been rigorously quantified; worse,
those elements are sometimes ignored, or simply assumed to be effective” [5]. One
approach for addressing this gap uses deterministic Material Assurance Indicators (MAIs)
as a metric to evaluate MC&A activities that are involved in protecting nuclear materials
[6, 7]. Initial testing successfully demonstrated that the MAI algorithm is useful for
evaluating characteristics of MC&A system capability, but it is not truly probabilistic.
Thus, the MAI algorithm is not compatible with probabilistic path analysis methods.

3
Early in the development of the MAI algorithm, it became apparent that MC&A
activities at an item level could be considered a type of sensor system, with both alarm
and assessment capabilities that are necessary for detection. The MAI also provides an
approach for evaluating an MC&A system capability to provide detection of an insider
attempting theft of nuclear material [7]. In addition, MC&A activities, from monitoring
to inventory measurements, include a variety of methods for providing information about
the attributes and location of target materials and for defining security elements useful
against insider threats. These activities can also serve to discourage insiders from
engaging in malevolent activity and provide many, often recurring opportunities to
determine the status of critical items.
Given this characterization of MC&A activities and the formulation of the
existing path analysis methodology, it is reasonable to investigate probabilistic risk
assessment (PRA) methods that may be applicable to the development of a probabilistic
approach to characterize MC&A activities and to evaluate the MC&A component to
provide an overall effectiveness measure of the S&S protection system to address threats
from both insider and outsider adversaries.
1.2 GOAL AND OBJECTIVES
The goal of this research is to develop a probabilistic basis and a new method to
incorporate MC&A protection elements explicitly within the existing probabilistic path
analysis methodology that is used to systematically evaluate the effectiveness of a site’s
protection system. To accomplish this, three problem areas need to be addressed:
• “Detection” capabilities of MC&A protections and quantitative probabilities of
detection – individually, in combination, and as a function of time;
• Competing delay and detection timelines for insider theft versus facility detection;
and

4
• Scenario development to integrate the evaluation of PPS and MC&A protections
within physical protection layers.
The objectives of this work include applying PRA techniques to develop
approaches to address these problems. Human reliability analysis (HRA) techniques are
investigated for characterizing and providing quantitative measures for MC&A elements
in a manner compatible with probabilistic analyses. An object-based state machine
paradigm is developed to characterize insider theft as a race against detection by facility
MC&A activities. This paradigm is coupled with nuclear power plant PRA techniques
to characterize detection and delay timelines for MC&A protection elements and
provides the framework for applying convolution mathematics to calculate timely
detection. Event sequence diagrams (ESDs) are applied to develop evaluation scenarios
for insider paths through the PPS and also incorporate MC&A activities as path elements.
The objectives also include demonstrating the new method with an analysis for several
hypothetical theft scenarios.
The development of such a probabilistic approach will enable security analysts to
explicitly evaluate the effectiveness of MC&A protections against insider threats similar
to the evaluation of outsider threats performed under the existing probabilistic path
analysis methodology. Along with the PE for the PPS, the overall result is an integrated
effectiveness measure of a protection system that addresses threats from both outsider
and insider adversaries.
1.3 DISSERTATION ORGANIZATION
This section provides an introduction, overview of an MC&A protection system,
and the goals and objectives of this research. The remainder of this dissertation is
organized as follows:

5
• Chapter 2 presents background material on physical protection, MC&A, the path
analysis methodology, characterization and evaluation of the insider threat, and
risk analysis tools.
• Chapter 3 presents the details of the extended methodology for one MC&A daily
activity in one physical protection layer.
• Chapter 4 presents the analyses used to demonstrate this new methodology for
multiple physical protection layers.
• Chapter 5 presents conclusions and recommendations for additional work.

6
Chapter 2: Background
The background for this research covers several topics, including:
• S&S system assessment methodology,
• Physical protection,
• MC&A,
• Design and evaluation of a PPS,
• Insider studies, and
• Risk assessment tools.
Each of these topics is discussed in the following sections.
2.1 SAFEGUARDS AND SECURITY SYSTEM ASSESSMENT METHODOLOGY
Design and evaluation of S&S protection systems generally follows a tailored
systems engineering process. The system assessment methodology, shown in Figure 1,
has evolved as a framework for assessing S&S systems to protect nuclear assets within
the U.S. Department of Energy (DOE) over 30 years [8]. This framework has been
adopted in some form by many organizations both in the U.S. and around the world for
nuclear and other critical infrastructure facilities [9-15].
NO
YES
Upgrade Analysis
Does
the Protection
System Meet S&S
Protection
Objectives?
Document Results
Specify S&S
Protection System
Objectives
Facility Description
Threat Analysis
Target Analysis
Scope the
Vulnerability
Assessment
Characterize S&S Protection
System
Physical Protection System
MC&A
Information Security
Personnel Security
Detection ResponseDelay
Analyze S&S Protection
System
Determine Probability of
Interruption
Estimate Probability of
Neutralization
Identify
Specific
Vulnerabilities
NO
YES
Upgrade Analysis
Does
the Protection
System Meet S&S
Protection
Objectives?
Document Results
Specify S&S
Protection System
Objectives
Facility Description
Threat Analysis
Target Analysis
Scope the
Vulnerability
Assessment
Characterize S&S Protection
System
Physical Protection System
MC&A
Information Security
Personnel Security
Physical Protection System
MC&A
Information Security
Personnel Security
Detection ResponseDelayDetection ResponseDelay
Analyze S&S Protection
System
Determine Probability of
Interruption
Estimate Probability of
Neutralization
Identify
Specific
Vulnerabilities
Figure 1. The system assessment methodology used by the U.S. DOE for the design and evaluation of S&S protection systems [8].

7
Generally, a site’s S&S system is comprised of four overlapping components:
physical protection, MC&A, personnel security and information security. The three
integrated functions of all S&S protection systems, including the physical protection and
MC&A components, are detection, delay, and response. Detection is determining that an
unauthorized action has occurred or is occurring. Detection includes sensing the action,
generating an alarm signal, communicating the alarm, and assessing that unauthorized
actions has occurred. Assessment is when a person determines the cause of an alarm and
judges it to be valid or invalid (a false or nuisance alarm). Delay is the slowing down of
the adversary’s progress toward the objective (theft or sabotage). Characterization of
delay establishes the time required by the adversary to bypass or defeat each delay
protection element. Common physical delay elements include fences, wall, doors, locks,
safes, and active and passive barriers. In combination, delay and detection elements
provide layers of protection that extend from a target to the exterior of the site. Response
primarily consists of the actions taken by the protective force to prevent adversary
success. In this physical response situation, it is important to characterize the response
force time (RFT), which is the time elapsed from detection to the response team arriving
at the adversary’s location with sufficient capabilities to interrupt the adversary’s tasks
and ultimately neutralize the attack.
2.1.1 Physical Protection
For the U.S. DOE S&S program, physical protection is defined as:
“PHYSICAL PROTECTION. The application of physical or technical methods
designed to protect personnel; prevent or detect unauthorized access to facilities,
material, and documents; protect against espionage, sabotage, damage, and theft;
respond to any such acts should they occur.” [16]

8
Garcia [17, 18] discusses the design and evaluation of a PPS in detail. The purpose of a
PPS is to protect important assets from theft, sabotage, or other malevolent attacks. The
design of a PPS considers how to combine physical delay elements with sensors,
procedures, communication devices, and security personnel to best achieve the overall
detection, delay and response functions to meet a protection objective. Evaluation of a
PPS design or an existing PPS includes characterizing physical protection elements and
their detection, delay, and response functions and determining the PPS effectiveness,
usually through a probabilistic path analysis.
2.1.2 Nuclear Material Control and Accountability
For the U.S. DOE S&S program, MC&A, nuclear materials accountability, and
nuclear materials control are defined as follows:
MATERIAL CONTROL AND ACCOUNTING (MC&A). “Those parts of the
safeguards program designed to provide information on, control of, and assurance
of the presence of nuclear materials, including those systems necessary to
establish and track nuclear material inventories, control access to and detect loss
or diversion of nuclear material, and ensure the integrity of those systems and
measures.” [16]
“NUCLEAR MATERIALS ACCOUNTABILITY. The part of the Material
Control and Accountability program encompassing the procedures and systems
to:
1. perform nuclear material measurements,
2. verify the locations and quantities of nuclear material through physical
inventories,
3. maintain records and provide reports,

9
4. perform data analyses to account for nuclear materials and to detect losses,
and
5. investigate and resolve apparent losses of nuclear material.” [16]
“NUCLEAR MATERIALS CONTROL. The part of the safeguards program
encompassing management and process controls to:
1. assign and exercise responsibility for nuclear materials;
2. maintain vigilance over the materials;
3. govern movement, location, and use of the materials;
4. monitor inventory and process status;
5. detect unauthorized activities for all nuclear materials; and
6. help to investigate and resolve apparent losses of nuclear materials.” [16]
Over the years, various technologies and methods have been developed and applied to
enhance nuclear material control [19-31]. These technologies range from software and
systems for continuous monitoring and inventory verification to personnel tracking to
monitoring weight and radiation attributes to real-time process monitoring. These
technologies are evaluated through testing and demonstration exercises that do not
generally address the overall system effectiveness of the MC&A component of an S&S
protection system. MC&A procedures and technologies, from monitoring to inventory
measurements, include a variety of methods that provide information about the attributes
and location of target materials.
More recently, the U.S. DOE’s National Nuclear Security Agency (NNSA) has
been working to implement the Safeguards First Principles Initiative (SFPI) as a
principle-based, risk-management standard for MC&A programs [20-22]. The SFPI
focuses on the effectiveness of the plan and procedures that are developed to implement
the requirements of an MC&A program at an individual NNSA site. The Comprehensive

10
Analysis of Safeguards Strategies (COMPASS) model is an MC&A system effectiveness
evaluation tool that has been developed as part of the SFPI initiative to compile site input
about nine MC&A program elements and their respective sub-elements and their ratings
for effectiveness weighted by a contribution factor, then provides an overall weighted
average that reflects the overall health of the MC&A program [20]. The COMPASS
effectiveness ratings are based on performance data and assessments of the MC&A
program elements and are reviewed by an evaluation board. The effectiveness ratings of
the 10-point scale are determined by objective criteria and reflect qualitative ratings of
high (8-10), medium (5-7) and low (1-4). The contribution factors are applied as an
indication of the relative importance of an element and are determined from a 0-4 point
scale, where a factor of 4 is assigned to an element that “provides loss detection or
accounts for material” [22]. The SFPI efforts focus on evaluation of the overall
programmatic effectiveness of an MC&A program, the requirements of which include the
detection and deterrence of theft and diversion of material [21]. While the SFPI
evaluation addresses detection of theft as part of the programmatic requirements, the
effectiveness ratings do not reflect the determination of a probability of detection that
material is missing or do not specifically address insider theft scenarios or integration
with PPS elements.
2.2 DESIGN AND EVALUATION OF A PHYSICAL PROTECTION SYSTEM
Garcia [17, 18] provides a comprehensive discussion of methods and their
application for designing a PPS and evaluating its effectiveness. Figure 1 illustrates the
overall systems engineering process for an S&S system. The parallel process flow for the
PPS component is the Design and Evaluation Process Outline (DEPO) shown in Figure 2.
The effectiveness of a site’s protection systems is systematically evaluated using
qualitative and/or quantitative techniques and is often calculated as the probability of PPS

11
effectiveness (PE), which is a measure of the degree to which the system can protect a
broad spectrum of targets against a wide range of potential threats. The DEPO
methodology focuses on a systematic quantitative evaluation of the physical protection
component of the S&S system for attack by potential outsider adversaries, whereas other
qualitative approaches have been used for MC&A, personnel security and information
security protection systems.
FinalPPS
Design
Analyze PPSDesign
ResponseForce
ResponseForce
Communications
AccessDelay
ExteriorSensors
InteriorSensors
AlarmAssessment
AlarmCommunication
& Display
Entry Control
Design PPS
Physical Protection Systems
Delay ResponseDetection
Determine PPS Objectives
Facility Characterization
Threat Definition
TargetIdentification
RedesignPPS
Analysis/Evaluation
Scenario andPath Analysis
EASI Model
Adversary SequenceDiagrams
Computer Models
Risk Assessment
Figure 2. Design and evaluation process outline for physical protection systems [17].
The goal of DEPO is to systematically evaluate the effectiveness of a site’s S&S
PPS using objective performance criteria. In this context, an effective PPS consists of
protection elements that provide
• timely and accurate detection and assessment of undesired acts,
• timely communication of this information to a response component,
• mechanisms that delay adversaries long enough for the response component to
intervene, and

12
• a response component capable of preventing adversaries from completing
undesired acts.
The overall effectiveness of the system depends upon the performance of each of the
components individually, as well as the interaction and performance of the system as a
whole. If the site does not meet the protection objectives, a vulnerability assessment [18,
32] identifies specific PPS weaknesses that could potentially be exploited by malevolent
threats. PPS upgrades are then implemented to achieve a system effectiveness that meets
the protection objectives.
The remainder of this section focuses on the quantitative analysis methods to
evaluate system effectiveness for the PPS component. To determine the effectiveness of
a PPS, path analysis is performed to evaluate adversary paths and the associated
detection, delay and response timelines. The facility is characterized in terms of physical
areas, protection layers, protection elements, path elements, path segments, and target
locations. Each protection layer contains delay and detection protection elements that
define the path elements and path segments of possible adversary paths. Figure 3
illustrates the physical areas of a facility and includes an example of adversary paths.
Figure 4 illustrates the physical areas and protection elements as an adversary sequence
diagram (ASD). PI is the probability of interruption of the adversary’s progress. Path
analysis determines PI as a quantitative measure of timely detection on an adversary path.
“Timely detection is the principle that system effectiveness is measured by the
cumulative probability of detection at the point where there is still enough time remaining
for the response force to interrupt the adversary” [17]. This point in the timeline is
defined as the critical detection point (CDP).

13
Protected Area
Controlled RoomControlled Building
Target Enclosure
TargetPath 1Path 2
Offsite
Protected Area
Controlled RoomControlled Building
Target Enclosure
TargetPath 1Path 2
Offsite
Figure 3. Representation of an example facility’s physical areas and possible adversary paths to a target [17].
Figure 4. Basic adversary sequence diagram for a facility [17].

14
For each adversary path, path element data are used to calculate a delay time, TR,
(calculated as a sum) and a probability of detection, PD, (calculated as a product,):
G
m
kiiR TTT >=∑
= (1)
∏=
−=k
iNDD i
PP1
1 (2)
where:
m = the total number of protection system elements along the path
k = the point at which the delay time, TR, just exceeds the response force time, TG
Ti = the minimum time delay provided by element i
PNDi = the nondetection probability provided by element i (that is, the probability that
element i will not detect the defined adversary), which is the complement of PD
For example, a nondetection probability of 0.2 means that there is a 20% probability the
adversary will not be detected; hence there is an 80% probability that the adversary will
be detected. Note that the analysis models use the probability of nondetection, while PD
is the performance measure for detection elements. Detection at each element is assumed
to be an independent variable. PI, the probability of interruption, is the cumulative
probability of detection for all elements up to the CDP.
Depending on the target(s) of interest, protection elements, adversary objectives,
and response tactics, among other things, many adversary paths can be defined for a
given facility. The critical path for a system is the path with the lowest PI. The overall
system effectiveness, then, is determined by the PI for this critical path:
NIE PPP ×= (3)
where PN is an estimated probability of neutralization, a measure of the response to the
attack. Figure 5 illustrates an example adversary event timeline. In this example, the

15
adversary must penetrate two protection layers, the portal and the vault wall, to reach the
target material.
EntryEntryEntryEntry ExitExitExitExitEntryEntryEntryEntry ExitExitExitExit
Start
T1
T2
T3 T4 T5
T6T7
FinishStart
T1
T2
T3 T4 T5
T6T7
Finish
PPPPDDDD:::: .3(at portal)
.99(at vault)
.8PPPPDDDD:::: .3(at portal)
.99(at vault)
.8
Portal (Exit)Vault (Entry)
Portal (Entry)
Time Remaining:(TR)
Portal (Exit)Vault (Entry)
Portal (Entry)
Time Remaining:(TR)
Timely Detection?
YesYesYesYes YesYesYesYes NoNoNoNoRFTRFTRFTRFTTimely Detection?
YesYesYesYes YesYesYesYes NoNoNoNoRFTRFTRFTRFT
Climb over portal
Penetrate Vault Wall
Climb out Hole In Vault
Force way out portal
Cross Area Grab SNM Cross Area
Climb over portal
Penetrate Vault Wall
Climb out Hole In Vault
Force way out portal
Cross Area Grab SNM Cross Area
Figure 5. Example adversary event timeline [32].
The actual path analysis for a facility can prove to be complex given the range of
targets, objectives, protection elements, and path combinations that must be considered.
Several tools have been developed to automate the path analysis. The EASI (Estimate of
Adversary Sequence Interruption) approach to physical security evaluation [33] was
developed to be executed on a hand-held calculator. Currently, a Microsoft® Excel
spreadsheet template is available to implement EASI [17]. SAVI (Systematic Analysis of
Vulnerability to Intrusion) is another modeling code that provides a comprehensive
analysis of adversary paths into a facility [34]. The ASSESS (Analytical System and
Software for Evaluating Safeguards and Security) software includes modules and a

16
baseline performance database to characterize the PPS elements of a facility as well as
perform the path analysis calculations [35]. The ATLAS (Adversary Time-Line Analysis
System) software [36] uses the same models as ASSESS, extends some of those
capabilities in the Facility and Outsider assessment modules, and provides updated
graphics, computational algorithms, and documentation capabilities. ATLAS, however,
does not yet include a complete capability for insider analysis.
The risk equations associated with the calculation of system effectiveness are
defined as follows [17]. First, the risk is defined in terms of the probability of an attack
occurring (PA), the probability of success of the attack (PS), and the consequences (C) of
the attack:
CPPR SA ××= (4)
Because of the difficulties and uncertainties in determining probabilities of adversary
attacks, the conditional risk (RC) was adopted, that is, RC is conditional on an attack
occurring. In addition, using the complement of the probability of an adversary attack in
terms of the system effectiveness gives:
CPR EC ×−= )1( (5)
Once the system effectiveness has been determined, the overall conditional risk can be
determined incorporating consequences of the adversary attack for the critical path.
2.3 INSIDER STUDIES AND EVALUATION OF INSIDER THREATS
Insiders are the most capable of security threats to any organization. An insider is
defined as anyone with knowledge of, access to, and authority at a facility [17]. This
definition implies that every employee in an organization is an insider, and any employee
may pose an insider threat. For facilities that have security systems in place to protect
critical assets, insiders have access “inside” the protective measures. In addition,

17
contractors, suppliers, vendors, visitors, and others who are not direct employees of an
organization may also be considered a part of the population that has access inside an
organization and pose an insider threat. Of concern is a malicious insider who might
attempt theft of critical assets, sabotage of equipment or operations, or other criminal
activities. The insider threat is a critical concern because successful attacks at secure
facilities almost always require the participation of a willing insider.
For theft or diversion of material, malicious insiders are formidable threats
because they have knowledge of operations and access to critical areas where target
materials may be located. They can take advantage of abnormal conditions (e.g., alarms)
or opportunities that arise to circumvent system elements and to access a target directly
without being detected. Detection and delay timelines are not as relevant because
insiders can choose the most opportune times and optimum strategies, often using
protracted or discontinuous attacks. One strategy for addressing the insider threat would
be to optimize the control and accountability of materials, and to more fully incorporate
MC&A elements into the evaluation of the S&S protection system.
Analysis of and protection against insider threats [37-41] can be challenging
because insiders have knowledge of operations and opportunity to access critical areas.
They can exploit this knowledge, opportunity and access to plan and implement an
attack. They are willing to abuse their access to handle material or monitor alarms.
Insider studies demonstrate that property theft is prevalent, and a majority of incidents
involve a single insider or insiders in collusion, in many cases with outsiders [37-39].
Malevolent insiders may be internally motivated or externally coerced [32].
Figure 6 illustrates characterization of malevolent insiders. Categories of malevolent
insiders include “passive” individuals who are willing only to provide information or
“active” individuals who will facilitate access or bypass or disable equipment. Active,

18
non-violent individuals actively participate in the attack, but are unwilling to use force,
while active, violent individuals are willing to use force to achieve their goals. All
malevolent insiders use stealth and deceit and do not want to have their activities
detected. They may also be rational or irrational; an irrational insider may not seem to
use clear decision rules.
MalevolentInsider
Active
Passive
Violent
Non-Violent
MalevolentInsider
Active
Passive
Violent
Non-Violent
Figure 6. Categories of malevolent insiders.
2.3.1 Insider Analysis with the Current Path Analysis Methodology
The path analysis described in Section 2.2 for an outsider threat can also be used
for the active, violent insider threat. Variations of this analysis, quantitative and
qualitative, are used for various other types of insider threats. For insider attacks,
detection and delay timelines are not as relevant because insiders can choose the most
opportune times and optimum strategies, often using protracted and discontinuous
attacks. In the case of Equation 2 above, determining the probability of detection can be
difficult for insider attack scenarios. In many cases, qualitative information about the
level of access, knowledge, detection likelihoods, and the resulting effectiveness are rated
as low, medium, or high. In other cases, subject matter experts can be used to estimate
quantitative detection probabilities.

19
Generally, for an insider, PI is the probability of detection, so, from Equation 3:
NDE PPP ×= (6)
where:
PD = conditional probability of detection given that both sensing and assessing the
adversary have occurred
PN = conditional probability of neutralization by the response force given that the
attack has been interrupted
In the case of the passive or active nonviolent insider, the adversary does not put
up a fight, so the threat is neutralized as soon as detection occurs – PN is certain, that is
equal to 1, so,
DE PP = (7)
While the insider analysis method does provide an analysis of the insider threat
within the framework for evaluating the effectiveness of the PPS, it does not specifically
address the effectiveness of the MC&A component of an S&S protection system.
2.3.2 Other Insider Assessment Methods
In the late 1970s, the U.S. DOE developed and used the Diversion Path Analysis
(DPA) methodology [42] specifically to evaluate the capability of the MC&A subsystem
to detect the diversion of nuclear material by a knowledgeable insider. The methodology
used an iterative process to analyze general diversion paths for each material in each
process area of a facility to derive a relative path weight based on attributes of the
diversion path. The relative path weight is a measure of the complexity of the path rather
than a measure of the probability that the insider will chose that path. Of concern was
theft of amounts of material attractive for making a crude nuclear explosive device.

20
Theft of other types and quantities of nuclear material and performance of the PPS were
not addressed by the DPA.
The Insider Safeguards Effectiveness Model is another model developed in the
late 1970s [43] to evaluate the effectiveness of a facility’s safeguards against a group of
insiders attempting theft or sabotage. The model requires user input, which in most cases
is very subjective. Safeguards Evaluation Tool (ET) [44] was another methodology and
computer tool that was developed as part of the subsequent Safeguards Evaluation
Method for nonviolent insider adversaries. The path analysis tools described in Section
2.2 (EASI, SAVI, and ASSESS) have also been applied to insider analyses, specifically
for a non-violent insider adversary on an exit path from the facility.
2.3.3 Material Assurance Indicator Algorithm Development
Prior to the work of Dawson and Hester [6, 7], no measures or standards for
comparison were defined to determine whether a protection system provided effective
control of nuclear materials, that is, the effectiveness of an MC&A system. The
development of the MAI for evaluating the MC&A activities involved in protecting
nuclear materials has shown promise for providing this type of metric [6, 7]. A perfect
materials control system would ensure that all the attributes and each location of
materials in a system are known all the time. In the case of evaluating the MC&A
component of an S&S system, the materials information would be evaluated within the
timeline for an adversary attack. The MAI algorithm computes an MAI on a per-item
basis and indicates material assurance at any given time. Items can be defined as the
container of a group of items or the physical containment of multiple items, such as a
vault configuration. The two-part formulation accounts for the attributes, locations, and
time interval of materials:

21
( )[ ]N
LFRAHMCFMAI
N
iiRRRi∑ ××
=,,
(8)
( )tt
tLFi ∆
∆=,max
(9)
where:
MAI = Material Assurance Indicator – the metric for assessed detection
MCF = Material Characterization Factor – what is the item to be protected
HR = Handling – where the item is located
AR = Attribute Monitoring – where the item is located
RR = Gamma/Neutron Monitoring – where the item is located
LF = Latency Factor – when the material was last handled or monitored
∆t = Critical time – based on protection strategies
t = Time when the last handling/monitoring occurred, subtracted from ∆t
N = Number of items defined
Values for MCF, handling, and monitoring are determined by relative rankings of
various MC&A procedures and technologies, on a scale of [0, 1], yielding an overall
measure between [0, 1]. The relative ranking is determined by subject-matter experts and
verified through experimental results. An informal elicitation was used to determine an
initial set of values for initial algorithm development and testing.
The algorithm was tested for four different scenarios at hypothetical facilities: to
use real-time information on an item basis to improve decision making on response
methods, to track unauthorized movement of material and heighten alert to increase PI, to
determine the frequency of a physical inventory given the failure probability of sensors in
a monitoring system, and to address the performance of MC&A protections. The initial
testing demonstrated that the algorithm shows promising capabilities to provide positive

22
responses for each of the four scenarios. Also, early in the development of the MAI
algorithm, it became apparent that activities at an item level could be considered a type of
sensor system, with both alarm and assessment capabilities that are necessary for
detection. The MAI algorithm can also evaluate MC&A system capability to provide
detection of an active non-violent insider attempting theft or diversion of nuclear
material.
The algorithm is currently formulated as a deterministic point estimate for an
individual item or group of items, separate from the path analysis methods for
determining system effectiveness of a PPS. A probabilistic analogue for the MAI will
enable security analysts to explicitly incorporate MC&A protections into the PE
calculations performed for the existing probabilistic path analysis methodology to
provide an effectiveness measure of both the physical protection and MC&A systems to
address outsider and insider threats.
2.4 RISK ASSESSMENT TOOLS
Given the techniques used in the probabilistic path analysis methodology, it is
reasonable to investigate other applications of PRA that may be applicable to the
development of a probabilistic analogue for the MAI. Since the WASH-1400 study [45],
PRA methods have been developed for and applied to for the assessment of nuclear
power plant safety. A summary of these methods for the subsequent severe accident risk
study (NUREG-1150) is provided in Breeding, et al. [46]; the South Texas Project
nuclear power plant also describes the details of PRA methods [47]. In the early 1990s,
the U.S. Nuclear Regulatory Commission (NRC) developed and adopted in 1995 a policy
statement regarding the expanded use of PRA and associated analyses [48] that has led to
a wider implementation of risk-informed decision-making. PRA techniques have also

23
been widely applied in the chemical processing, aerospace, aviation, and maritime safety
industries [49-52].
More recent work has applied PRA approaches to the evaluation of proliferation
resistance evaluation [53-56]. These efforts have employed a Markov modeling approach
for proliferation resistance in advanced fuel cycles consistent with the evaluation
framework being developed by the Proliferation Resistance and Physical Protection
Expert Group of the Generation IV International Forum [57]. The initial efforts [53, 54]
investigated the application of a Markov chain method to perform detailed proliferation
scenario and pathway analysis and to quantify measures of proliferation resistance,
including proliferation success, probability of detecting proliferation, technical difficulty,
and proliferation time. Analyses have been performed for misuse, diversion from the
front-end and back end of the fuel cycle, and abrogation scenarios for an advanced light-
water reactor [53, 54], different reprocessing facilities [53], and an example sodium fast
reactor [53, 55]. The Markov chain method has the capability to account for some of the
dynamic features of proliferation, including the large number of uncertainties, the
unpredictability of human performance, and the effect of changing conditions with time
[54, 56]. More recently, safeguards approaches, false alarms, concealment, and human
performance have been incorporated in the Markov modeling [54], and four different fuel
cycle arrangements have been analyzed to determine proliferation success and
proliferation risk, where consequence is represented by a material type index [56]. The
proliferation resistance problem has many similar characteristics to insider theft. The
Markov models described in these papers, however, are continuous-time models that are
solved as a system of continuous differential equations in time. With this solution
approach, hard delays that are characteristic of discontinuous insider theft scenarios
would be difficult to model. In addition, the Markov modeling approach is less

24
compatible than other approaches to the existing path analysis methods used to evaluation
system effectiveness of a PPS.
Other recent work has applied PRA techniques to develop a fault tree for a
functional MC&A model, including basic event probabilities determined by a Delphi
expert judgment process to evaluate MC&A effectiveness and relative risk calculations
performed using PRA software [58-62]. The functional model for the MC&A System
Effectiveness Tool (MSET) details 144 fundamental elements of a comprehensive
MC&A system, including key functions to deter, detect, and mitigate potential insider
threats [59, 60]. Quantitative values for the basic event probabilities are converted from
qualitative responses to a survey questionnaire about MC&A elements at a facility [60]
using a Delphi process to combine values provided by multiple experts. The fault tree,
based on the functional model, along with basic event probabilities indicative of
“operational quality” derived by experts are used to assess the basic reliability of the
MC&A system at a nuclear facility [59]. The results of the PRA calculations using the
fault tree provide relative risk measures, and an estimate of the overall failure probability
“to maintain nuclear material under the purview” of the MC&A system [59]. Addressing
the insider threat using the MSET model has been explored by examining “those
elements, which based on expert judgment, are most attractive to and vulnerable to
insiders,” [59] but determination of detection probabilities, analysis of insider theft
scenarios analyses, or integration with PPS elements are not addressed.
Of the many applications of PRA that were investigated, the techniques that were
identified to support the probabilistic basis for incorporating MC&A protections into the
existing path analysis methodology include techniques for variable event sequence
ordering and HRA techniques for determining detection probabilities for MC&A
activities.
25
2.4.1 Techniques for Variable Event Sequence Ordering
The path analysis performed to evaluate a PPS can be represented by a traditional
PRA event tree with binary branching for detection and non-detection through each
protection element of an adversary’s path. To incorporate MC&A activities that may be
characterized as having recurring “detection” opportunities, techniques for variable event
ordering need to be applied. The Object-based Event Sequence Tree methodology [63]
combines the best features of traditional event tree analysis and Monte Carlo-based event
simulation with concepts from object-oriented analysis into a PRA technique that easily
supports recurring or variable event ordering. Developing an object model provides a
framework for characterizing insider theft scenarios that include recurring MC&A
activities. The set of possible scenarios to be evaluated can be deduced by analyzing the
object model as an event sequence diagram (ESD) that extends the traditional event tree
representation of insider theft to include MC&A activities. ESDs are another PRA
technique that are used to represent the variability and uncertainty of events in accident
scenarios analyzed for safety analyses of space craft launches [50].
2.4.2 Human Reliability Analysis Techniques
Since the early 1970s, HRA has been considered to be an integral part of PRA for
a nuclear power plant (NPP). Human performance in NPP operations continues to be an
important element for reactor safety. Swain and Guttmann [64] developed a handbook
that includes methods, models, and estimated human error probabilities (HEPs) to
address human performance of operations for PRA of an NPP. The methods in the
handbook describe various approaches for representing human error in a PRA. The
frameworks for incorporating HRA in a PRA has evolved from Swain’s and Guttmann’s
Technique for Human Error Rate Prediction [64] that considers how performance shaping
factors (stress, workload, training) influence the occurrence and type of human error

26
mechanisms to more multi-disciplinary approaches that more fully consider the how
human factors, behavioral science and plant engineering contribute to plant conditions
that influence not only performance shaping factors, but also specific error mechanisms
and unsafe actions (“errors of commission”) that contribute to accidents [65, 66].
Most applicable to establishing a probabilistic basis for incorporating MC&A
activities with physical protection are Swain’s and Guttmann’s methods for checking
operations as recovery factors. A recovery factor is defined as “an element of an NPP
system that acts to prevent deviant conditions from producing unwanted effects” [64, p.
19-1]. Human redundancy is a type of recovery factor that occurs when one person
checks his or her own work or another person’s work, detects an error that has occurred
and corrects it. The handbook describes a variety of checking operations used in an NPP.
Some may involve checking routine tasks that recur on a regular basis performed by the
same or different persons with or without a written checklist. Others may involve one
person checking another person’s work; special short-term, one-of-a-kind checking with
alert factors; or special measurement tasks. HRA methods for evaluating operator
attention to unannuciated alarm signals during nuclear power plant operations also
provide insights for addressing MC&A activities. These methods also show how the
effectiveness of repeated inspections decreases over time if an anomalous condition is not
recognized the first time it occurs.

27
Chapter 3: Methods for Extended Path Analysis – One Daily MC&A Activity in One Physical Protection Layer
This work focused on a new method to incorporate MC&A protection elements
within the existing probabilistic path analysis methodology to estimate PE for insider
threats. The approaches taken to complete this work included:
• The use of available path analysis modeling techniques
• The characterization of MC&A activities
• The investigation of safety PRA methods as the basis for possible applicable
analogues
• The use of applicable statistical analysis techniques to investigate the
development of detection distributions for MC&A elements
• The development of data sets for representative hypothetical facilities
• The use of available path analysis modeling and computational tools to
demonstrate comparative PE calculations
Three important insights resulted from the initial investigation of MC&A
protection elements. These insights and how these might be incorporated in existing path
analysis modeling techniques include:
1. MC&A protection elements are interwoven within each physical protection layer,
and provide additional detection and delay opportunities within the S&S system.
In their MAI work, Dawson and Hester [6, 7] observed that many MC&A
activities provide sensing and detection capabilities, similar to other sensors in a
PPS. In addition, MC&A activities that discourage insiders provide many, often
recurring opportunities to determine the status of critical items (for example, daily
administrative checks).

28
2. MC&A protection elements can act as a “switch” that changes the state of the
facility from normal operation to one of heightened alert when material is
discovered “missing.”
3. Insider theft can be characterized as a “race” between insider theft stages that
move target material from internal to external physical protection layers and the
MC&A protection elements that detect that material is not where it should be.
These insights along with the identified PRA techniques provided a basis for
characterizing MC&A activities in a way that is compatible with the existing path
analysis methodology.
3.1 OBJECT-BASED PARADIGM FOR INSIDER THEFT
Considering the insights and observations about MC&A protection elements as
well as the characteristic differences with respect to delay and detection timelines for
insider scenarios and the relationship to protection layers, an object-oriented modeling
approach [63] was applied to develop an object-based state machine paradigm to
characterize insider theft scenarios. An example of such an object-based state machine is
shown in Figures 7a and 7b. The “system” is characterized by two objects: an Insider
Theft object and a Facility Status object. The figures illustrate the state transition
diagrams for each object: the Insider Theft object (7a) and the Facility Status object (7b)
and their interrelation. Each box in the diagrams is a possible “state” of the object at a
given point in time. The arcs between each state are events that can occur to move the
object from one state to another.
The Insider Theft object generally describes the possible steps in a specific insider
theft scenario. In this example, the adversary must:

29
Insider Theft
Material isOut of PA(in facility)
PlanningTheft
MaterialObtained
(Put in MAA)
Material isOut of MAA
(in PA)
Theft isUnsuccessful
Material isOut of Facility
UnacceptableConsequences
Occur
MaterialRecovered
MAA ProtectionsDefeated
PA ProtectionsDefeated
FacilitySafeguards
Defeated
Target ProtectionsDetect Theft
MAA ProtectionsDetect Theft
PA ProtectionsDetect Theft
Target ProtectionsDefeated
AdversaryUses Material
Figure 7a. State transition diagram for Insider Theft Object.
Detectabnormalsituation
Situation isresolved
NormalSearching forMissing Item
Facility Status
Detectabnormalsituation
Situation isresolved
NormalSearching forMissing Item
Facility Status
Figure 7b. State transition diagram for Facility Status Object.

30
1. defeat safeguards at the target to obtain the material,
2. defeat safeguards in the material access area (MAA), and move the material
through the protected area (PA),
3. defeat safeguards in the PA and move material through the facility boundary,
and then
4. defeat safeguards at the facility boundary and move the material out of the
facility.
The Facility object indicates how MC&A protection elements act as a “switch” that
changes the state of the facility from normal to heightened alert when the facility is
searching for material that is discovered “missing.”
This model is specifically constructed for each attack scenario, and the defined
states and state transitions will vary as appropriate to the modeled scenario. The
analytical examples presented in this work end at the state where material is out of the
facility, although modeling additional steps in the attack is also possible. This approach
characterizes insider theft as a “race” between insider theft stages from internal to
external physical protection layers and the MC&A system elements that detect that the
material is not where it should be. This characterization of an insider theft is similar to
the characterization of an outsider attack for the PPS as a race between the adversary and
facility response team after detection has occurred.
This modeling approach was used to develop an overall understanding of the
insider theft and its relationship to the facility state. This state machine could be modeled
using discrete event simulation methods that would provide relative probabilities of the
final end-states of all possible scenarios. In this work, however, it was important to
model, in detail, the intermediate steps of the insider theft scenarios to investigate the

31
importance of each MC&A activity and PPS element in detecting the insider theft
actions.
3.2 INCORPORATING AN ASSESSMENT OF MC&A ACTIVITIES
Event trees are often used in evaluating PPS scenarios, but are difficult to use here
because traditional event trees do not show dependency among events in a way that is
easily summarized by the analyst for a reviewer. Characterizing the protection system to
include MC&A elements interwoven within each physical protection layer provides a
basis for extending the traditional event tree representation with detection or no detection
of insider theft through the PPS (Figure 8) to include MC&A activities. The set of
possible scenarios to be evaluated can be deduced by analyzing the object model as an
ESD that incorporates MC&A detection with PPS detection. Figure 9 illustrates this
extension as an ESD where detection by MC&A (yellow boxes) and PPS protection
elements (white boxes) are considered in each protection layer. The ESD allows a more
detailed representation of the steps of insider theft, the incorporation of MC&A activities
within each layer, and event sequence progression for the differing facility state
conditions of normal or heightened alert. The ESD also provides a framework for
propagating probability values to determine effectiveness for detecting missing material.
Figure 9 indicates where MC&A activities trigger a change of facility state from normal
to “heightened alert,” when the facility is searching for material that is unaccounted for
and may be missing. This state change is modeled using different PPS detection
probabilities for the normal and heightened alert facility states at each detection
opportunity. Detection probabilities for a “Normal” facility state can be enhanced if an
MC&A alert has occurred and the facility state is “Searching for Missing Material.”
Logically, if an MC&A alert has occurred, the facility has a higher probability of

32
Detect (PD1)
No Detect (1 - PD1)
Detect (PD2)
No Detect (1 - PD2)Detect (PD3)
No Detect (1- PD3)
Initiating Event Layer 1 Layer 2 Layer 3
Figure 8. Traditional event tree model of insider theft through protection layers.
Attempt
Theft
MaterialRecovered
MaterialRecovered
MaterialRecovered
MaterialRecovered
MaterialRecovered
Material Lost
Alert
Detected in Z2 Removing Mat’l? PD2M
Y
N
Detected in Z2 Removing Mat’l? PD2/M
Y
N
Detected in Z1 Removing Mat’l? PD1/M
Y
N
Detected in Z1 Removing Mat’l? PD1M
Y
N
Material Detected as Missing? PM1
Y
N
Detected Taking
Material? PD1
Y
N
Material Detected as
Missing? PM2
N
YMC&A Places Facility in
“Searching for Missing Item” State
Different PD if “Searching for Missing Item”
Alert
AlertAlert
Alert
Attempt Theft
MaterialRecovered
MaterialRecovered
MaterialRecovered
MaterialRecovered
MaterialRecovered
Material Lost
Alert
Detected in Z2 Removing Mat’l? PD2M
Y
N
Detected in Z2 Removing Mat’l? PD2M
Y
N
Detected in Z2 Removing Mat’l? PD2/M
Y
N
Detected in Z2 Removing Mat’l? PD2/M
Y
N
Detected in Z1 Removing Mat’l? PD1/M
Y
N
Detected in Z1 Removing Mat’l? PD1/M
Y
N
Detected in Z1 Removing Mat’l? PD1M
Y
N
Detected in Z1 Removing Mat’l? PD1M
Y
N
Material Detected as Missing? PM1
Y
N
Material Detected as Missing? PM1
Y
N
Detected Taking
Material? PD1
Y
N
Material Detected as
Missing? PM2
N
YMaterial Detected as
Missing? PM2
N
YMC&A Places Facility in
“Searching for Missing Item” State
MC&A Places Facility in
“Searching for Missing Item” State
Different PD if “Searching for Missing Item”
Different PD if “Searching for Missing Item”
Alert
AlertAlert
Alert
Figure 9. Insider theft modeled as an event sequence diagram (ESD) incorporating MC&A.
33
detecting and finding the material, and the adversary has a lower probability of
successfully removing the material from a physical protection layer.
3.3 INSIDER THEFT AND MC&A DETECTION TIMELINES
One of the challenges for evaluating the effectiveness of an S&S protection
system against an insider adversary is that the detection and delay timelines determined
for the outside adversary and the PPS are not as relevant because an insider adversary can
choose the most opportune time to take advantage of system vulnerabilities. The various
theft events may be separated by large gaps in time (discontinuous or protracted theft).
The object-based state machine provides a framework for representing the time of
occurrence for each step in the theft as well as the MC&A detection time that changes the
facility state as probability distributions. Determining whether theft or detection occurs
first, that is who wins the race, is accomplished by convolution of the theft and detection
distributions for each scenario.
Time variables are defined for the insider theft timeline and the MC&A detection
timeline. As an insider theft is initiated and proceeds through the physical protection
layers of a facility, the insider theft timeline is defined by two (or more) time variables:
TR1 – Part of the insider theft timeline that represents the time for the adversary to
successfully remove target material from Physical Protection Layer 1. The
time interval begins when the adversary obtains the material and ends when
the adversary removes target material from Physical Protection Layer 1.
TRi – Part of the insider theft timeline that represents the time for the adversary to
successfully remove target material from the ith Physical Protection Layer.
The time interval begins when TR(n-1) ends and ends when the adversary
removes the target material from the ith Physical Protection Layer for layers
2 through n.

34
Additional time variables are defined as needed for each stage of an insider theft through
additional physical protection layers. Each of these times is represented as a probability
distribution in order to represent the variation in both the time before a removal
opportunity presents itself and the time to accomplish the removal task. The distributions
for the adversary theft timeline [P(TR1), P(TRi), …, P(TRn)] depend on the defeat methods
available to an adversary (e.g., removal through an SNM monitor after disabling the
monitor) and when the adversary may take advantage of opportunities to exploit system
vulnerabilities or to circumvent protection elements.
The MC&A detection timeline is defined by the detection opportunities provided
by MC&A activities as they are performed in each physical protection layer and is
defined as:
TMC&AAlert – The time when MC&A activities may indicate that target material is
missing. The time interval begins when theft occurs and ends when MC&A
alert occurs.
TMC&AAlert is the time when the Facility state transitions from the “Normal” state to the
“Searching for Missing Material” state (Alert). Times and associated probabilities
[P(TMC&AAlert )] are dependent on specific MC&A activities included in a scenario. The
distribution for the MC&A detection timeline can be developed considering specific
MC&A activities and associated operational considerations of when and how these
activities are performed. In a well-designed MC&A and security system, TMC&AAlert <<
TRn to allow for the maximum opportunity to interdict the adversary and stop the theft. If
TMC&AAlert > TRn, then the material has been stolen before the facility is even aware that it
is missing.

35
3.4 CONVOLUTION INTEGRAL 1
MC&A activities contribute to the effectiveness of the facility protection system
by providing alerts that material may be missing. The effectiveness of MC&A activities
can be determined by comparing the probability distributions for the time for MC&A
alerts [TMC&AAlert ] with the probability distributions for the time for removal of material
by the adversary [TR1, TRi, …, TRn] using probabilistic convolution to determine the
probability that detection occurs before theft. As presented in Appendix A, convolution
is a method of combining probability distributions that has been used in nuclear power
plant PRA [47] and security timeline analyses [33].
As a general example considering removal of material, let TM and TR be random
variables over time, where TM is the timing for MC&A alerts and TR is timing for insider
theft (removal of material). Let tM and tR be specific values of these random variables.
The range of TM and TR is [0, ∞).
Let P(tM) denote the probability density function for TM and let P(tR) denote the
probability density function for TR. Let P(tM, tR) denote the joint probability density
function for TM and TR.
A random variable for time of possible “detection” is defined as TD = TM - TR and
tD is a specific value of this random variable. The probability density function for TD is:
∫∞
−==0
}|),({)( MDMRRMD dttttttPtP (12)
If TM and TR are independent, then P(tM, tR)= P(tM)· P(tR), and
∫∞
−⋅=0
)()()( MDMMD dtttPtPtP (13)
The range of TD is [-∞, ∞]. The probability that TD is less than zero is:
1 The formulation for convolution of insider theft and MC&A detection was developed with the assistance
of John Darby of Sandia National Laboratories.

36
∫∞
=<0
)()0( DDD dttPtP (14)
This is the probability that an MC&A alert occurs and the Facility transitions from the
“Normal” state to the “Searching for Missing Material” state before the insider is
successful in moving the material past that physical protection layer.
3.5 HUMAN RELIABILITY MODELS FOR MC&A ACTIVITIES
The characterization of MC&A activities as having detection capabilities was a
first step for incorporating MC&A activities as additional sensors in a site’s protection
system. In addition, a probabilistic basis is needed to determine an appropriate
probability of detection (PD) for MC&A protection elements. HRA methods of Swain
and Guttmann [64], specifically NPP checking operations as recovery factors and the
associated HEPs, were applied as a basis to probabilistically characterize MC&A
detection.
3.5.1 MC&A Activities as NPP Checking Operations
MC&A activities have many similar characteristics to operator tasks performed in
an NPP in that the reliability of these activities depends significantly on human
performance. Many of the procedures involve human performance in checking for
anomalous conditions. As an example, checking the status of a valve in an NPP is similar
to checking the status of a nuclear material target in a vault. The respective associated
anomalous conditions are that a valve should be closed but is partially or completely open
(perhaps after a maintenance activity), and that a target in a vault is not where it should
be located. Both can be characterized as checking procedures, in which an identified
checking opportunity exists, and a person discovers or fails to discover an anomalous
condition. Further characterization of MC&A activities as procedures that check the

37
status of critical assets provides a basis for applying HRA models and methods to
determine probabilities of detection for MC&A protection elements – the probability of
detection is defined as the complement of the HEP for performing an operation.
Table 1 identifies typical MC&A activities and similar characteristics of operator
tasks identified by Swain and Guttman [64 Table 19-1]. The table also includes an
estimated baseline HEP (BHEP) associated with the NPP operator tasks as determined by
the HRA work of Swain and Guttman [64]. These estimated BHEPs can be applied to
MC&A protection elements by using the complement as a probability of detection for a
given MC&A activity.
3.5.2 Dependence Models for Recurring MC&A Activities
Within a PPS, sensor elements are designed to detect unauthorized activity. This
work has provided additional insights to characterize MC&A activities as additional
sensors within a site’s protection system. MC&A activities are interwoven within each
protection layer of the PPS and provide additional detection and delay opportunities
within the S&S protection system. These activities are important protection elements
against insider theft and can serve to discourage malicious insider activity. They provide
many, often recurring opportunities to determine the status of critical items (for example,
daily administrative checks). As an example, Table 2 lists some key administrative
MC&A activities that are performed on a recurring basis. A year-long detection
opportunity timeline can be constructed from the compilation of the recurrence of these
activities, which demonstrates the importance of these activities as protection elements
against insider threats.
In this work, MC&A activities have been characterized as a type of human
redundancy recovery factor. Generally, MC&A activities would be considered
independent events. However, because many of the MC&A activities are recurring, it is

38
Table 1: Characterization of MC&A activities as different types of NPP checking operations with estimated probabilities (HEPs) that a checker will fail to detect an error (columns 2 and 3 from [64, Table 19-1])
MC&A Activity Nuclear Power Plant Checking Operation BHEP Plan of the Day Checking routine tasks using written materials 0.10 Material Measurement Checking that involves active participation, such as
special measurements 0.01
Forms Reconciliation Special short-term, one-of-a-kind checking with alerting factors
0.05
Process Call Special short-term, one-of-a-kind checking with alerting factors
0.05
Material Request Checking routine tasks using written materials 0.10 Material Transfer Checking by reader/checker of the task performer in
a two-man team, or checking by a second checker, routine task
0.50
Product Storage Checking by reader/checker of the task performer in a two-man team, or checking by a second checker, routine task
0.50
Daily Administrative Check Checking routine tasks using written materials 0.10 Physical Inventory Checking that involves active participation, such as
special measurements 0.01
Inventory Audit Checking that involves active participation, such as special measurements
0.01
Table 2: Frequencies of key administrative MC&A activities (representative)
MC&A Activity (Examples of Key Administrative Controls)
Activity Frequency
(days) Plan of the Day 1 Daily Administrative Check 1 Forms Reconciliation 3 Process Call 15 Physical Inventory 30 Inventory Audit 365
important to consider and understand the dependence between the recurrences of the
same activity or between the occurrences of two different activities and whether they are
performed by the same or different persons. Dependence is a characteristic used in HRA

39
methods to consider how the success or failure of a subsequent task depends on the
success or failure of the immediately preceding task.
The failure to address the issue of dependence “may lead to an optimistic
assessment of joint HEPs for NPP tasks” [64, p. 10-1]. One method for assessing
dependence is a positive dependence model for estimating conditional probabilities for
two tasks. Positive dependence implies a positive relationship between events, that is
“…failure on the first task increases the probability of failure on the second task” [64, p.
10-4]. The positive dependence model can be applied in situations where actual data on
conditional probabilities of success or failure in the performance of tasks is not available.
Equation 15 provides the failure equation that is used to calculate conditional
probabilities of failure on Task M given failure on the previous Task M-1 for different
levels of dependence. The general formulation for the failure equation is:
1
1)|( 1
1 ++
= −− a
aPFFP M
MM (15)
where a ranges from 0 to ∞. Values of a equal to 0, 1, 6, 19, and correspond,
respectively, to points of complete, high, moderate, low, and zero positive dependence
[64, Equations 10-14 through 10-18].
To explore the dependence that may be generally associated with recurring
MC&A activities, the failure equation for the positive dependence model from Swain and
Guttmann [64] was applied for one MC&A activity that occurs once per day over a 30-
day period. Figures 10, 11, and 12 show how the daily probability of MC&A detection
varies across five different levels of dependence for a low (0.02), medium (0.50), and
high (0.99) initial probability of detection (complement of a BHEP for a type of NPP
operation associated with a specific MC&A activity). These plots demonstrate how, in
most cases of human performance, it is expected that when a person performs a recurring

40
activity, if he or she does not detect an anomaly in the first one or two opportunities, then
the likelihood that the anomaly will be detected will decrease significantly for subsequent
opportunities. Generally, with recurring activities, each subsequent opportunity has a
decreasing likelihood of successfully detecting an anomaly given that the previous
opportunity has failed. With no dependence between recurring MC&A activities (for
example, a different person performing the operation for each recurrence), the initial
probability of detection can be maintained over the 30-day timeline. The decrease in
probability of detection for each subsequent recurrence of the same activity or of two
activities, however, will vary with the level of dependence between the recurrences of the
activities, as shown in Figures 10, 11, and 12. The plots differ only in the scale on the y-
axis, which reflects the low, medium and high values, respectively, for the initial
probability of detection (0.02, 0.50, and 0.99).
0.000
0.005
0.010
0.015
0.020
0.025
0 5 10 15 20 25 30
Detection Timeline (Day)
Pro
bab
ilit
y o
f D
etec
tio
n b
y M
C&
A A
ctiv
ity
Zero Dependence
Low Dependence
Moderate Dependence
High Dependence
Complete Dependence
Figure 10: Daily probability of detection over a 30-day period for one MC&A activity performed once a day based on a BHEP of 0.98, or an initial probability of detection of 0.02, for five different levels of dependence.

41
0.00
0.10
0.20
0.30
0.40
0.50
0.60
0 5 10 15 20 25 30
Detection Timeline (Day)
Pro
bab
ilit
y o
f D
ecte
ctio
n b
y M
C&
A A
ctiv
ity
Zero Dependence
Low Dependence
Moderate Dependence
High Dependence
Complete Dependence
Figure 11: Daily probability of detection over a 30-day period for one MC&A activity performed once a day based on a BHEP of 0.50, or an initial probability of detection of 0.50, for five different levels of dependence.
0.00
0.10
0.20
0.30
0.40
0.50
0.60
0.70
0.80
0.90
1.00
0 5 10 15 20 25 30
Detection Timeline (Day)
Pro
bab
ilit
y o
f D
etec
tio
n b
y M
C&
A A
ctiv
ity
Zero Dependence
Low Dependence
Moderate Dependence
High Dependence
Complete Dependence
Figure 12: Daily probability of detection over a 30-day period for one MC&A activity performed once a day based on a BHEP of 0.01, or an initial probability of detection of 0.99, for the five different levels of dependence.

42
3.6 TIMELY DETECTION
The existing path analysis methodology evaluates the PPS for a facility on the
basis of detection, delay and response timelines using probabilistic analysis of adversary
paths to determine a quantitative probabilistic measure of timely detection. The path
analysis methodology calculates the probability PE that the PPS achieves timely detection
and is effective in defeating an attack by an outside adversary. This work has developed
several elements to provide a probabilistic basis for extending the existing path analysis
methodology to incorporate timely MC&A detection.
MC&A activities contribute to the effectiveness of the facility protection system
by providing alerts that material may be missing. While timely detection for a PPS
depends on detection, delay and response that interrupts and neutralizes an attack from an
outside adversary, timely detection for MC&A activities depends on detecting that
material is not where it should be and providing an alert. The mathematics for
probabilistic convolution provide a basis to determine the probability that an MC&A alert
(detection) causes the Facility to transition to the “Searching for Missing Material” state
before the insider moves the material past a given physical protection layer. The
effectiveness of MC&A activities can be determined by convolving the probability
distributions for the MC&A detection timeline with the insider theft timeline to determine
the probability that detection occurs before the theft of material can be completed.
3.6.1 Formulation of Timely MC&A Detection
In demonstrating the application of HRA methods for determining a probability of
detection for MC&A activities (Section 3.5.2), only the daily MC&A detection timeline,
specifically for a 30-day scenario, was described without considering the insider
adversary theft stages. To determine timely detection, the MC&A detection timeline
must be convolved with the insider adversary theft timeline. MC&A activities provide

43
recurring opportunities to detect that material is “missing” such that the facility state
transition occurs from normal state to alert state. Because MC&A activities are usually
discrete observations, discrete mathematics and discrete probability distributions are
appropriate. Because the frequency of recurrence for MC&A activities (Table 2) is
determined in days, this formulation used one day as the discretization time step. Other
discretization time steps could also be used (if appropriate) based on the frequency of
MC&A activities or theft opportunities. If material is detected as missing on day n and
the material has not been removed from the facility before day n, then detection will be
timely. To formulate the probability of timely detection by MC&A activities, PD,Timely is
the overall cumulative daily probability of detection over the scenario timeline of N days:
∑=
=N
nnTimelyDTimelyD PP
1,,, (16)
This is the sum of MC&A detection that occurs exactly on day n and is timely, that is,
detection happens before the insider moves the material out of a physical protection layer.
PD,Timely,n, the probability of timely detection on a given day n, is defined as:
NTnDEnnTimelyD PPP ×=,, (17)
where:
PDEn = the probability that the facility detects material is missing on exactly day n
PNTn = the probability that the material has not been removed from the facility
before day n
PNTn is the complementary cumulative probability that the theft occurred on day n, PTn:
∑−
=−=
1
1
1n
iTiNTn PP (18)

44
PTn is the daily probability of theft and is determined from the theft opportunity timeline.
For example, if an insider has an opportunity to take material once a day over a 30-day
time period, then
033.030
1 ==TnP (19)
PTn is determined for various timeline scenarios based on the type of insider and his or
her access to the target material.
Further, because detection on exactly day n implies that the material has not been
detected as missing before day n and is detected as missing on day n, PDEn is defined as:
1,,&, −×= nNDnAMCDDEn PPP (20)
where:
PD, MC&A,n = the probability of detection for the MC&A activities on the nth day
PND,n-1 = the probability that the material has not been detected as missing before
day n
The detection probabilities for MC&A activities can be determined as described
in Section 3.6.2 by characterizing individual activities as associated NPP operations and
defining applicable BHEPs and dependency relationships. The MC&A detection
probabilities are the complements of the BHEPs. An MC&A detection timeline for a
given scenario is defined as the set of MC&A activities that are performed on a day-to-
day basis.
PND,n-1, the probability that the material has not been detected as missing before
day n, is defined as:
nDnND PP <− −= 11, (21)
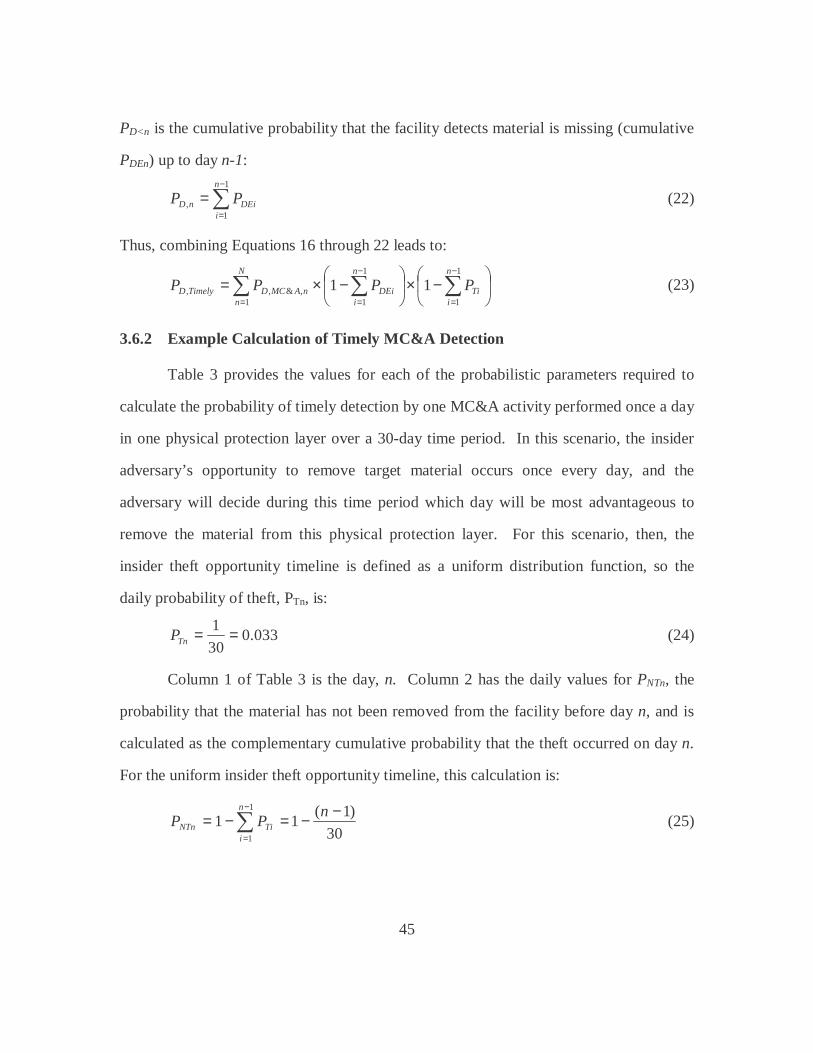
45
PD<n is the cumulative probability that the facility detects material is missing (cumulative
PDEn) up to day n-1:
∑−
==
1
1,
n
iDEinD PP (22)
Thus, combining Equations 16 through 22 leads to:
∑ ∑∑=
−
=
−
=
−×
−×=N
n
n
iTi
n
iDEinAMCDTimelyD PPPP
1
1
1
1
1,&,, 11 (23)
3.6.2 Example Calculation of Timely MC&A Detection
Table 3 provides the values for each of the probabilistic parameters required to
calculate the probability of timely detection by one MC&A activity performed once a day
in one physical protection layer over a 30-day time period. In this scenario, the insider
adversary’s opportunity to remove target material occurs once every day, and the
adversary will decide during this time period which day will be most advantageous to
remove the material from this physical protection layer. For this scenario, then, the
insider theft opportunity timeline is defined as a uniform distribution function, so the
daily probability of theft, PTn, is:
033.030
1 ==TnP (24)
Column 1 of Table 3 is the day, n. Column 2 has the daily values for PNTn, the
probability that the material has not been removed from the facility before day n, and is
calculated as the complementary cumulative probability that the theft occurred on day n.
For the uniform insider theft opportunity timeline, this calculation is:
30
)1(11
1
1
−−=−= ∑−
=
nPP
n
iTiNTn (25)

46
Table 3: Calculation of timely detection over a 30-day scenario for a uniform insider theft timeline and one MC&A activity performed once a day based on an initial probability of detection of 0.02, for a moderate level of dependence
Day (n) PNTn PD, MC&A,n PND,n-1 PDEn PD<n
PD,Timely,n (PDEn * PNTn)
1 1.000 0.020 1.000 0.020 0.020 0.020 2 0.967 0.017 0.980 0.017 0.037 0.016 3 0.933 0.015 0.963 0.014 0.051 0.013 4 0.900 0.013 0.949 0.012 0.063 0.011 5 0.867 0.011 0.937 0.010 0.073 0.009 6 0.833 0.009 0.927 0.009 0.082 0.007 7 0.800 0.008 0.918 0.007 0.089 0.006 8 0.767 0.007 0.911 0.006 0.095 0.005 9 0.733 0.006 0.905 0.005 0.100 0.004 10 0.700 0.005 0.900 0.004 0.105 0.003 11 0.667 0.004 0.895 0.004 0.109 0.003 12 0.633 0.004 0.891 0.003 0.112 0.002 13 0.600 0.003 0.888 0.003 0.115 0.002 14 0.567 0.003 0.885 0.002 0.117 0.001 15 0.533 0.002 0.883 0.002 0.119 0.001 16 0.500 0.002 0.881 0.002 0.121 0.001 17 0.467 0.002 0.879 0.001 0.122 0.001 18 0.433 0.001 0.878 0.001 0.124 0.001 19 0.400 0.001 0.876 0.001 0.125 4.4E-04 20 0.367 0.001 0.875 0.001 0.126 3.4E-04 21 0.333 0.001 0.874 0.001 0.127 2.7E-04 22 0.300 0.001 0.873 0.001 0.127 2.1E-04 23 0.267 0.001 0.873 0.001 0.128 1.6E-04 24 0.233 0.001 0.872 0.001 0.128 1.2E-04 25 0.200 4.9E-04 0.872 4.3E-04 0.129 8.6E-04 26 0.167 4.2E-04 0.871 3.7E-04 0.129 6.2E-04 27 0.133 3.6E-04 0.871 3.2E-04 0.129 4.2E-04 28 0.100 3.1E-04 0.871 2.7E-04 0.130 2.7E-04 29 0.067 2.7E-04 0.870 2.3E-04 0.130 1.6E-04 30 0.033 2.3E-04 0.870 2.0E-04 0.130 6.6E-04
Cumulative Probability of Timely Detection: 0.106
For the example scenario, one MC&A activity is performed once a day over the
30-day scenario, with a moderate level of dependence between recurrences and a BHEP
of 0.98. Column 3 has the daily MC&A probability of detection that is calculated from
Equation 15 with a=6 and an initial probability of detection equal to 0.02 (1-BHEP). As

47
expected from the dependence model, the probability of detection decreases for
subsequent daily recurrences. Columns 4 through 7 are calculated as described in Section
3.6.1.
The cumulative probability of MC&A detection is calculated by summing all the
daily values in Column 7, and this is the value that is used as the event probability for
timely MC&A detection for the 30-day scenario of one MC&A activity performed in one
physical protection layer once a day and a uniform insider theft timeline. For this
scenario, calculations for the probability of timely MC&A detection were completed for
the five different levels of dependence, for a low (0.02), medium (0.50), and high (0.99)
initial probability of detection. Figures 13, 15, and 17 show the relationship of daily
probability of timely MC&A detection and dependence for the different initial
probabilities of detection, respectively.
Additionally, Figures 14, 16, and 18 show the cumulative probability of detection
that could be achieved by one daily MC&A activity within one physical protection layer
over the scenario timeline. The cumulative probability of detection is the value that is
used in the ESD for the MC&A detection events in each physical protection layer to
calculate the overall effectiveness for each adversary path scenario.
Note that in each case, while the daily probability of timely detection decreases
with time, the cumulative probability of detection improves significantly over the initial
individual MC&A probability of detection. Table 4 summarizes the increase in the
cumulative probability of detection after 30 days for each of the initial probabilities of
detection and for each of the five dependence levels. Because of the multiple daily
detection opportunities, even an MC&A activity with a low initial probability of
detection can achieve a significantly higher cumulative detection probability if the
adversary timeline is extended and the dependence between recurrences of activities is

48
0.000
0.005
0.010
0.015
0.020
0.025
0 5 10 15 20 25 30
Scenario Timeline (Day)
Pro
bab
ilit
y o
f T
imel
y M
C&
A D
etec
tio
n
Zero Dependence
Low Dependence
Moderate Dependence
High Dependence
Complete Dependence
Figure 13: Daily probability of timely detection over a 30-day scenario for one MC&A activity performed once a day based on a BHEP of 0.98, or a 0.02 initial probability of detection, for five different levels of dependence.
0.000
0.050
0.100
0.150
0.200
0.250
0.300
0 5 10 15 20 25 30
Scenario Timeline (Day)
Cu
mu
lati
ve P
rob
abil
ity
of
Tim
ely
MC
&A
Det
ecti
on
Zero Dependence
Low Dependence
Moderate Dependence
High Dependence
Complete Dependence
Figure 14: Cumulative probability of timely detection over a 30-day scenario for one MC&A activity performed once a day based on a BHEP of 0.98, or a 0.02 initial probability of detection, for five different levels of dependence.
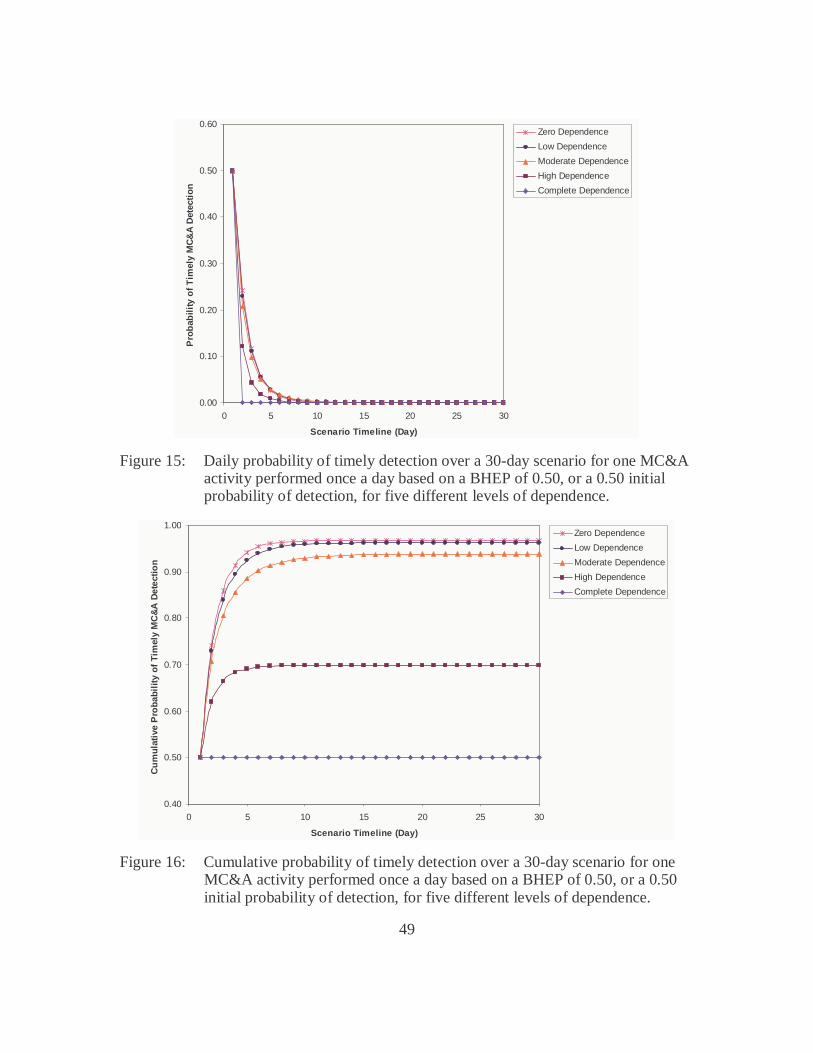
49
0.00
0.10
0.20
0.30
0.40
0.50
0.60
0 5 10 15 20 25 30
Scenario Timeline (Day)
Pro
bab
ilit
y o
f T
imel
y M
C&
A D
etec
tio
n
Zero Dependence
Low Dependence
Moderate Dependence
High Dependence
Complete Dependence
Figure 15: Daily probability of timely detection over a 30-day scenario for one MC&A activity performed once a day based on a BHEP of 0.50, or a 0.50 initial probability of detection, for five different levels of dependence.
0.40
0.50
0.60
0.70
0.80
0.90
1.00
0 5 10 15 20 25 30
Scenario Timeline (Day)
Cu
mu
lati
ve P
rob
abil
ity
of
Tim
ely
MC
&A
Det
ecti
on
Zero Dependence
Low Dependence
Moderate Dependence
High Dependence
Complete Dependence
Figure 16: Cumulative probability of timely detection over a 30-day scenario for one MC&A activity performed once a day based on a BHEP of 0.50, or a 0.50 initial probability of detection, for five different levels of dependence.

50
0.00
0.10
0.20
0.30
0.40
0.50
0.60
0.70
0.80
0.90
1.00
0 5 10 15 20 25 30
Scenario Timeline (Day)
Pro
bab
ilit
y o
f T
imel
y M
C&
A D
etec
tio
n
Zero Dependence
Low Dependence
Moderate Dependence
High Dependence
Complete Dependence
Figure 17: Daily probability of timely detection over a 30-day scenario for one MC&A activity performed once a day based on a BHEP of 0.01, or a 0.99 initial probability of detection, for five different levels of dependence.
0.988
0.990
0.992
0.994
0.996
0.998
1.000
0 5 10 15 20 25 30
Scenario Timeline (Day)
Cu
mu
lati
ve P
rob
abil
ity
of
Tim
ely
MC
&A
Det
ecti
on
Zero Dependence
Low Dependence
Moderate Dependence
High Dependence
Complete Dependence
Figure 18: Cumulative probability of timely detection over a 30-day scenario for one MC&A activity performed once a day based on a BHEP of 0.01, or a 0.99 initial probability of detection, for five different levels of dependence.

51
Table 4: 30-day cumulative probability of MC&A detection for five dependence levels for low (0.20), medium (0.50), and high (0.99) initial probability of detection
Initial Probability of
Detection
Level of Dependence
Complete High Moderate Low Zero
0.02 0.020 0.038 0.106 0.180 0.258 0.50 0.500 0.699 0.939 0.963 0.967 0.99 0.990 0.997 0.999 0.999 0.999
reduced. A more than ten-fold increase (0.02 to 0.258) is evident for an activity that has
0.02 initial probability of detection and zero dependence between recurrences of MC&A
observations. It is evident that even one MC&A activity can provide significant
additional detection capabilities; this substantiates the importance of MC&A activities to
protect against suspicious or unauthorized insider activities. This analysis also points to
three factors that can be used to “design” MC&A operations so that theft by a
knowledgeable insider is more difficult: developing MC&A activities that have low
BHEPs; reducing the dependency between recurrences of MC&A activities; and
extending the adversary’s theft timeline.
3.7 SUMMARY OF METHODS DEVELOPMENT FOR A SINGLE PHYSICAL PROTECTION LAYER
A focus of this research has been to investigate PRA methods that may be
applicable to the development of a probabilistic approach for characterizing MC&A
activities and incorporating an evaluation of the MC&A component to provide an overall
effectiveness measure of the S&S protection system. The methods in this chapter have
applied several PRA techniques and describe the modeling and quantification elements
for insider theft and MC&A characterization. The methods have been demonstrated for
the formulation and calculations of timely MC&A detection by one daily MC&A event in

52
a single physical protection layer for a single theft timeline. The calculation for the
insider theft timelines and MC&A detection becomes more complex as the number of
protection layers increases and more MC&A detection activities are considered. This
will be illustrated in analyses that follow in the next chapter for several scenarios with
different theft and MC&A detection timelines and multiple protection layers.

53
Chapter 4: Methods for Extended Path Analysis – Daily and Combined MC&A Detection and Multiple Physical Protection Layers
To demonstrate the extended path analysis methods beyond a single daily MC&A
activity in a single physical protection layer, additional methods development was
required. The calculation for the insider theft timelines and MC&A detection become
more complex as the number of protection layers increases and more MC&A detection
activities are considered. Methods are required for probabilistic inference to determine
values of timely MC&A detection in subsequent physical protection layers and for
composite timelines determined from the timelines for each physical protection layer.
Calculations were completed for several combinations of timelines for multiple
protection layers, with both uniform and variable theft timeline distributions, including a
geometric distribution developed using Latin Hypercube Sampling (LHS). In addition,
probability of detection calculations for sets of MC&A activities that occur at different
time intervals were completed.
To facilitate this phase of methods development, insider theft scenarios were
developed for a hypothetical facility.2 An overview of the facility is provided in the next
section, followed by a description of and calculations for the insider theft scenarios for
the various theft and detection timelines.
4.1 FACILITY OVERVIEW
The hypothetical nuclear manufacturing facility (NMF) recycles nuclear material
from old dismantled systems into parts for new systems. The dismantled parts are
shipped to the NMF where they are broken into chips, recast for machining into new
2 The facility description used here is adapted from one used in training exercises for the Advanced
Vulnerability Assessment Overview and Insider Training Courses developed by Sandia National Laboratories [32].

54
parts, then packaged and shipped out to be assembled into new systems. Figure 19
provides an overview of the NMF layout. The NMF includes two MAAs, the main
process facility (26) and storage bunker (20), within a PA inside a two-fence perimeter
with lights and towers. Two entrances allow vehicles into the PA, one (6) for non-
commercial vehicles (mostly the management’s personally owned vehicles) and the other
(4) for shipments of materials, chemicals, and nuclear material. The processing facility
workers park in a lot (3) outside the PA fence and enter on foot through the entry control
point (ECP) building (5). A rail entrance on the south of the facility allows for infrequent
rail shipments. Along with the process facility and storage bunker, six buildings are
inside the PA perimeter, including a cafeteria (16), three support buildings that house
Figure 19: Overview of Nuclear Manufacturing Facility layout [32].

55
offices and light laboratory facilities (17, 18, 19), a shipping and receiving facility (23),
an X-ray facility (24), The PA perimeter consists of two 2.5-m high chain-link fences
installed five meters apart; the fences are under observation primarily by the guards in
towers at each corner of the PA perimeter (7, 10, 12, 14). Random patrols inside the PA
perimeter are conducted by an officer on foot. The guards in the ECP also provide some
observation of the PA perimeter within viewing distance of the ECP building.
The outer perimeter of the site is enclosed by a single fence (1). The north fence
surrounding the external administrative campus (15) is a 2.5-m high with standard chain-
link fabric. The site entrance gate on the north side of the site (2) is unlocked during
normal working hours and is locked the rest of the time. The area outside the perimeter
has a 20-m cleared zone which is bounded by trees in several locations. The terrain is
relatively flat. Random patrols are conducted around the site on a road around the
outside of the perimeter.
The process facility near the center of the PA is where the bulk of the processing
work is performed. The ECP building straddles the PA perimeter and houses some of the
guard force. The ECP into the PA (5) is the main entry point for pedestrian and vehicular
traffic where checks are conducted on entry and egress. The outer gate (6) and the ECP
are unlocked and open during the normal five-day work hours, which are 7 AM to 6 PM,
but locked the rest of the time. Upon entry into the ECP, personnel must show their
badge, place their personal items on an X-ray machine belt, and walk through a metal
detector. Personnel exiting the processing area enter the ECP through the double doors
and pass through a nuclear material monitoring portal. Management and some visitors
may enter in personal vehicles through the outer gate to park in the PA. All vehicles
entering the PA are subject to search upon entry and pass through a nuclear material

56
detector upon exit. Commercial vehicles entering the ECP must present written
authorization.
Within the process facility, chipping, melting, casting, and machining operations
are performed. The process facility is the primary material area and includes vaults that
contain in-process materials (chips, billets, and finished product). The finished products
normally weigh between 2 and 3 kg (depending on the particular product being
manufactured). In preparation for off-site shipment, products are packaged in shipping
containers and moved to the bunker for storage pending shipment.
The storage bunker is used for storage of nuclear material shipped in for recycling
and for storage of finished products packed and ready to ship. The material for recycling
is received in approved shipping containers that weigh 100 kg. The product containers
weigh 50 or 100 kg (depending on the type). The 100-kg product containers are
essentially the same as the containers for received material. The 50-kg containers are
designed to fit inside a larger shipping overpack container and are not as robust as the
100-kg container. They are about one half as tall and the lids snap on with three quick
release levers. The same type of inner container is used for all items (there will be some
variations in shape/size).
The processing area has an extensive material measurement and control system in
place, including procedures to receive material from off-site, to transfer material from the
storage bunker to processing, to repackage and weigh material in-process, and to move
product within the site for X-ray and storage. All measurements and container
identification are documented at each process step. This information is sent to the
MC&A recording area where it is examined, stored, and used to derive a weekly book
inventory and material balance. In addition, a physical inventory is conducted monthly.
57
The personnel at the NMF include managers, shift supervisors, operators,
maintenance staff, technician, guards, and administrative support. The Material Control
Manager (MCM) is assigned responsibility for technical coordination of the overall
MC&A program and has specific duties associated with receipt of recycling material onto
the site, shipments of finished product off-site, and records for materials in the PA
outside the processing facility (storage bunker, X-ray, and sampling). The Material
Custodian (MC) reports directly to the MCM and has responsibility for materials in the
processing facility. Both these positions have a high level of access to materials,
equipment and tools in the PA; authority to request, document, and approve material
transfers and measurement records; and knowledge about processing and material control
operations.
4.2 BASIC INSIDER THEFT SCENARIO
The basic scenario used for the demonstration analyses involves theft of feed
material or finished product from the storage bunker within the PA and removal through
the personal vehicle entrance. The MCM is the insider adversary and has authorized
access through the outer gate to park in the PA and to enter to all buildings and areas
within the PA. Inventory in the bunker is conducted on a monthly basis, and transfers
from the bunker to the processing building occur on a regular basis. In addition, the
nuclear material detector on the outer gate into the PA has maintenance scheduled on a
monthly basis. While maintenance occurs, use of the nuclear material detector is
replaced by a general random vehicle search. The plan is to acquire target material
during authorized access at the bunker, conceal it on his person, move it to an office in
the laboratory/office building nearest the PA parking area, and then move it to his vehicle
to exit the PA when maintenance is occurring on the nuclear material detector on the
outer gate.

58
4.3 SCENARIOS FOR ONE DAILY MC&A DETECTION ACTIVITY AND VARYING TIMELINES
This set of scenarios will consider varying timelines for the MAA and PA
physical protection layers and one daily MC&A detection activity. The MCM has daily
access to the storage bunker. In these scenarios, the MCM’s opportunity to remove target
material occurs once every day, and this insider will make a decision during a given
timeline as to which day will be most advantageous to remove the material from each
physical protection layer. His decision to take action is based on his knowledge of when
certain operational conditions (material transfers or detector maintenance) might occur
and to what extent he can exploit these. Each protection layer considers both PPS and
MC&A detection elements.
4.3.1 30-Day Timeline for the MAA and for the PA
This scenario involves a 30-day theft timeline in both the MAA and PA, for a
total scenario timeline of 60 days. Inventory is performed once a month in the storage
bunker, and because of his access and authority, the MCM knows he has an opportunity
to use deceit to hide any inventory discrepancies in the MAA. Material transfers between
the bunker and the process building MAA occur on a regular basis, although the MCM
may not know specifically when a transfer may occur. This timeline also considers the
30-day window between maintenance of the nuclear material detector at the outer gate.
Because the opportunity to remove target material may occur on any given day in both
the MAA and PA, for this example the insider theft timelines are defined as uniform
discrete distributions for each of these theft stages.
This example tracks the theft and detection for this scenario through an ESD (see
Figure 20). The scenario begins with detection of theft by the PPS protection elements in
the MAA, Event 1 in the ESD. Because the adversary is an insider with authorized

59
access and operational knowledge, it is assumed that he will be able to circumvent the
PPS protection elements. The only PPS protection element that may provide detection in
this situation is general observation of suspicious or unauthorized activity by guards or
other personnel in the area. Garcia [17] discusses how general observation has a very
low probability of detection activity, so the probability of detection for this event is
estimated to be 0.02, and its complement of 0.98 is the probability of non-detection.
Attempt Theft
MaterialRecovered
MaterialRecovered
MaterialRecovered
MaterialRecovered
MaterialRecovered
Material Lost
Alert
Detected in Z2 Removing Mat’l? PD2M
Y
N
Detected in Z2 Removing Mat’l? PD2/M
Y
N
Detected in Z1 Removing Mat’l? PD1/M
Y
N
Detected in Z1 Removing Mat’l? PD1M
Y
N
Material Detected as Missing? PM1
Y
N
Detected Taking
Material? PD1
Y
N
Material Detected as
Missing? PM2
N
YMC&A Places Facility in
“Searching for Missing Item” State
Different PD if “Searching for Missing Item”
Alert
AlertAlert
Alert
Attempt Theft
MaterialRecovered
MaterialRecovered
MaterialRecovered
MaterialRecovered
MaterialRecovered
Material Lost
Alert
Detected in Z2 Removing Mat’l? PD2M
Y
N
Detected in Z2 Removing Mat’l? PD2M
Y
N
Detected in Z2 Removing Mat’l? PD2/M
Y
N
Detected in Z2 Removing Mat’l? PD2/M
Y
N
Detected in Z1 Removing Mat’l? PD1/M
Y
N
Detected in Z1 Removing Mat’l? PD1/M
Y
N
Detected in Z1 Removing Mat’l? PD1M
Y
N
Detected in Z1 Removing Mat’l? PD1M
Y
N
Material Detected as Missing? PM1
Y
N
Material Detected as Missing? PM1
Y
N
Detected Taking
Material? PD1
Y
N
Material Detected as
Missing? PM2
N
YMaterial Detected as
Missing? PM2
N
YMC&A Places Facility in
“Searching for Missing Item” State
MC&A Places Facility in
“Searching for Missing Item” State
Different PD if “Searching for Missing Item”
Different PD if “Searching for Missing Item”
Alert
AlertAlert
Alert
Figure 20. ESD for tracking theft and detection.
Figure 21 illustrates Event 1 in the ESD. If detection occurs and material is recovered,
the end state for this event sequence is “Material Recovered,” and the overall sequence
probability is 0.020. With no detection for this event, the sequence continues to Event 2.

60
Attempt Theft
MaterialRecoveredP = 0.02
Detected Taking
Material? PD1
PND1 = 0.98
PD1 = 0.02
Attempt Theft
MaterialRecoveredP = 0.02
Detected Taking
Material? PD1
PND1 = 0.98
PD1 = 0.02
Figure 21: Event 1 of the ESD – Detection of the insider taking the material by the PPS in the MAA
Event 2 is an MC&A detection that occurs while the stolen material is still in the
MAA. This scenario begins with the 30-day scenario calculations described in Section
3.6 for removal of material from the MAA. From the calculations in Section 3.6 for an
MC&A activity with a low initial probability of detection of 0.02 and a moderate level of
dependence, the probability of timely MC&A detection is 0.106, and the probability of
non-detection is 0.894. If timely MC&A detection occurs, then the facility moves to an
alert state in which it is known that material is not where it should be. Also, in this case,
the insider adversary has not been able to remove the material from the MAA into the
PA. Figure 22 illustrates the ESD through Event 2 with the possible paths to an alert
state or continued normal operations.
Material Detected as Missing? PD2
Alert
Attempt Theft
MaterialRecoveredP = 0.02
Detected Taking
Material? PD1
PND1 = 0.98
PD1 = 0.02
PD2 = 0.106
PND2 = 0.894
Normal
Material Detected as Missing? PD2
Alert
Attempt Theft
MaterialRecoveredP = 0.02
Detected Taking
Material? PD1
PND1 = 0.98
PD1 = 0.02
PD2 = 0.106
PND2 = 0.894
Normal
Figure 22: The ESD through Event 2 – Timely MC&A detection in the MAA

61
Events 3 and 4 will be for detection in the PA. Event 3 is for detection by PPS
protection elements of material moving into the PA. Two conditions and paths through
the ESD are possible here depending on whether the facility is in the alert state or
continued normal operations. If no alert occurs, then detection of unauthorized activity
again is provided only by general observation and the probability of detection is 0.02.
Once the MCM has taken the target material out of the bunker, he will have to move it
across the PA into the laboratory/office building nearest the PA parking lot. If detection
occurs, the end state for this event sequence is “Material Recovered,” and the overall
sequence probability is 0.018 (0.98 x 0.894 x 0.02). With no detection for this event, the
sequence continues onto Event 4.
For the second condition for Event 3, when the facility is in an alert state and it is
known that material is not where it should be, it is expected that additional efforts will be
made throughout the facility to locate the missing material. The probability for detection
then can be increased because of these additional efforts. If detection does not occur, the
MCM is able to successfully move the material out of the PA, but the facility remains in
the alert state. The probability of detection during an alert state is set at 0.50 to reflect
increased efforts (significantly greater than relying on general observation) to locate the
missing material. If detection occurs, the end state for this event sequence is “Material
Recovered,” and the overall sequence probability is 0.052 (0.98 x 0.106 x 0.50);
otherwise the event sequence skips Event 4 (because MC&A detection has already
occurred) and continues on to Event 5 with the facility in the alert state. Figure 23
illustrates the ESD through Event 3.

62
MaterialRecoveredP = 0.052
MaterialRecoveredP = 0.018
Detected inPA Removing Mat’l? PD3N
Detected Removing Mat’lout of PA? PD3A
Alert
Material Detected as Missing? PD2
Alert
Attempt Theft
MaterialRecoveredP = 0.02
Detected Taking
Material? PD1
PND1 = 0.98
PD1 = 0.02
PD2 = 0.106
PND2 = 0.894
PD3A = 0.50
PND3N = 0.98
PND3A = 0.50
PD3N = 0.02
Normal
Figure 23: The ESD through Event 3 – Detection of the insider moving the material by the PPS in the PA
Event 4 is MC&A detection that occurs while material is in the PA. To calculate
the probability of timely MC&A detection in the PA, first the probability of timely
MC&A detection any time before the material leaves the PA during the composite
timeline is calculated, PD,Comp. This value then is used with the probability of timely
MC&A detection in the MAA (PD2) to infer the probability of timely MC&A detection in
the PA (PD4). The calculation method for probabilistic inference is described later in this
section after a discussion of the composite theft timeline during which the MCM can
move material from the MAA and then the PA. Once the theft has progressed into the
PA, the scenario timeline is the sum of the individual timelines in the MAA and the PA,
in this case up to 30 days each for a total scenario timeline of up to 60 days. The theft
timeline includes every possible composite timeline over the 60-day duration. For this
scenario, the timeline for each physical protection layer ranges from 1 to 30 days, and so
30 x 30 = 900 composite timelines are possible. To determine the probability distribution
for theft over the complete 60-day scenario, the two individual uniform distributions have

63
to be summed to determine the probability of theft for the possible composite timelines
for each day. The individual timelines are independent discrete random variables, T1 and
T2, with uniform distribution functions, and T3 is their sum. The distribution function for
the composite timeline is determined by convolution of the distribution functions for T1
and T2, as follows:
( ) ( ) ( )∑=
=×===n
t
tTPtTPtTP1
221133
1
(26)
where
t2 = t3 - t1 for T3 = T1 + T2.
To calculate timely MC&A detection with Equation 16, PNTn, the probability that
the material has not been removed from the facility before day n is calculated as the
complementary cumulative probability distribution of the composite theft timeline. The
MC&A detection timeline is also determined for the 60-day duration of the theft timeline.
The calculation of timely MC&A detection then follows the same steps outlined for the
30-day scenario in Section 3.6. For an MC&A activity with an initial probability of
detection of 0.20 and a moderate level of dependence, the probability of timely MC&A
detection for the composite timeline is 0.126. This calculation of timely MC&A
detection considers the total 60-day timeline and is a composite of timely MC&A
detection for both the MAA and the PA. The portion that applies to timely detection in
the PA must be inferred from the composite detection and timely detection in the MAA.
The method for this probabilistic inference is described as follows. Figure 24 shows a
condensed event tree with the two MC&A detection events, one in the MAA and one in
the PA, along with the sequence probabilities for each of the three possible end states, as
follows:

64
( )( ) ( )42
42
2
11
1
DD
DD
D
PPZ
PPY
PX
−×−=×−=
= (27)
1-PD2
PD4 Y
1-PD4 Z
XPD2
MC&A Detectionin MAA
MC&A Detectionin PA
MaterialTaken
End State Probability
1-PD2
PD4 Y
1-PD4 Z
XPD2
MC&A Detectionin MAA
MC&A Detectionin PA
MaterialTaken
End State Probability
1-PD2
PD4 Y
1-PD4 Z
XPD2
MC&A Detectionin MAA
MC&A Detectionin PA
MaterialTaken
End State Probability
Figure 24: Event tree for MC&A events in the composite timeline.
The sum of the probabilities for the three end states must equal one. The required value
is PD4, which from the sequence probability for Y is:
( )( )
( )( )
( )2
2
224 111 D
D
DDD P
PYX
P
XYX
P
YP
−−+
=−
−+=−
= (28)
The value for (X + Y) is 0.126 and was calculated above as the probability of timely
MC&A detection for the composite 60-day timeline; the value of PD2 was calculated for
Event 2. The value
( ) ( ) 022.0106.01
106.0126.0
1 2
2,4 =
−−=
−−
=D
DCompDD P
PPP (29)
is the value for the probability of timely MC&A detection for Event 4; the probability of
non-detection is 0.978. If timely MC&A detection occurs here, then the facility has
another opportunity to move to an alert state in which it is known that material is not
where it should be. Again, in this case, the insider adversary has not been able to remove

65
the material out of the PA. Figure 25 illustrates the ESD through Event 4 with the
possible paths to an alert state or continued normal operations.
Material Detected as
Missing? PD4
Alert
MaterialRecoveredP = 0.052
MaterialRecoveredP = 0.018
Detected inPA Removing Mat’l? PD3N
Detected Removing Mat’lout of PA? PD3A
Alert
Material Detected as Missing? PD2
Alert
Attempt Theft
MaterialRecoveredP = 0.02
Detected Taking
Material? PD1
PND1 = 0.98
PD1 = 0.02
PD2 = 0.106
PND2 = 0.894
PD3A = 0.50
PND3N = 0.98
PND3A = 0.50
PD3N = 0.02
PD4 = 0.022
PND4 = 0.978
Normal
Figure 25: The ESD through Event 4 – Timely MC&A detection in the PA
Event 5 is for detection by PPS protection elements of material moving out of the
PA through the outer gate, which the MCM will plan to do when the nuclear material
detector is in maintenance so his vehicle is subject only to a random vehicle search.
Similarly to the case for Event 3, two conditions and paths through the ESD are possible
here depending on whether the facility is in the alert state or continued normal operations.
If no alert occurs, then detection of unauthorized activity again is provided only by
detection of the material during a random vehicle search. Once the MCM has moved the
target material across the PA into the laboratory/office building nearest the PA parking
lot, he will look for an opportunity to take it to his vehicle when the detector at the gate is
undergoing maintenance. Again, detection relies on general observation of suspicious or

66
unauthorized activity, and the probability of detection is set to 0.02. The final end states
for the two sequences from this event are “Material Recovered,” with an overall sequence
probability of 0.017 (0.98 x 0.894 x 0.98 x 0.978 x 0.02), and “Material Lost” with a
sequence probability of 0.823 (0.98 x 0.894 x 0.98 x 0.978 x 0.98).
For the second condition for Event 5, when the facility is in an alert state and it is
known that material is not where it should be, it is expected that additional efforts will be
made throughout the facility to locate the missing material. This is another opportunity
to increase the probability for detection because of these additional efforts. The
probability of detection during alert is set at 0.50, again to reflect increased efforts to
locate missing material. If detection occurs, the end state for this event sequence is
“Material Recovered,” and the overall sequence probability is 0.009 (0.98 x 0.894 x 0.98
x 0.022 x 0.50). Otherwise two event sequences end in an “Alert” state: the sequence
that continues from Event 3 with a sequence probability of 0.026 (0.98 x 0.106 x 0.50 x
0.50) and the sequence from Event 4 with a sequence probability of 0.009 (0.98 x 0.894 x
0.98 x 0.022 x 0.50). Figure 26 illustrates the ESD through Event 5.
If detection does not occur and the MCM is able to successfully move the material
out of the PA, the facility remains in the alert state. This is an important distinction in
terms of information a site has about the status of critical items. The “Material
Recovered” end state indicates that the theft was detected or an MC&A activity alerted
the facility that material was not where it should be and that subsequent actions recovered
the material before it could be taken out of the facility. The “Material Lost” end state
indicates that no MC&A alert occurred and the facility has no information at the end of
the scenario timeline that material is missing – the case of where you do not know what
you do not know. An end state of “Alert” indicates that although material may have been
successfully removed from the site, the facility knows that material is missing and can

67
continue efforts to recover the material, pursue those responsible for the theft and address
system vulnerabilities to prevent future theft.
MaterialRecoveredP = 0.017
MaterialRecoveredP = 0.009
Material LostP = 0.823
AlertP = 0.026P = 0.009
Detected Removing Mat’lout of PA? PD5A
Detected Removing Mat’lout of PA? PD5N
Material Detected as
Missing? PD4Alert
MaterialRecoveredP = 0.052
MaterialRecoveredP = 0.018
Detected inPA Removing Mat’l? PD3N
Detected Removing Mat’lout of PA? PD3A
Alert
Material Detected as Missing? PD2
Alert
Attempt Theft
MaterialRecoveredP = 0.02
Detected Taking
Material? PD1
PND1 = 0.98
PD1 = 0.02
PD2 = 0.106
PND2 = 0.894
PD3A = 0.50
PND3N = 0.98
PND3A = 0.50
PD3N = 0.02
PD4 = 0.022
PND4 = 0.978
PD5A = 0.50
PND5A = 0.50
PND3N = 0.98
PD3N = 0.02 MaterialRecoveredP = 0.017
MaterialRecoveredP = 0.009
Material LostP = 0.823
AlertP = 0.026P = 0.009
Detected Removing Mat’lout of PA? PD5A
Detected Removing Mat’lout of PA? PD5N
Material Detected as
Missing? PD4Alert
MaterialRecoveredP = 0.052
MaterialRecoveredP = 0.018
Detected inPA Removing Mat’l? PD3N
Detected Removing Mat’lout of PA? PD3A
Alert
Material Detected as Missing? PD2
Alert
Attempt Theft
MaterialRecoveredP = 0.02
Detected Taking
Material? PD1
PND1 = 0.98
PD1 = 0.02
PD2 = 0.106
PND2 = 0.894
PD3A = 0.50
PND3N = 0.98
PND3A = 0.50
PD3N = 0.02
PD4 = 0.022
PND4 = 0.978
PD5A = 0.50
PND5A = 0.50
PND3N = 0.98
PD3N = 0.02
Figure 26: The ESD through Event 5 – Detection by the PPS of the insider moving the material out of the PA
This set of calculations for the 30-day MAA/30-day PA timeline scenario was
performed for each level of dependence and the low, middle, and high initial probability
of MC&A detection. Figure 27 shows the event sequence calculations in which Events 2
and 4 represent the timely MC&A detection probabilities for each of the five dependence
levels for low probabilities of detection for the initial theft action, MC&A observations,
and the detection of moving materials. Some of these probabilities should be considered

68
Figure 27: Event sequence calculations for the 30-day MAA/30-day PA timeline scenarios for 0.02 initial probability of MC&A detection and five levels of dependence.
EV
EN
T1
EV
EN
T3
EV
EN
T5
PP
S -
MA
AP
PS
- P
AP
PS
- O
ut P
A
De
tect
T
aki
ng
Ma
teria
l
MC
&A
D
ete
ct-
C
MC
&A
D
ete
ct-
H
MC
&A
D
ete
ct-
M
MC
&A
D
ete
ct-
L
MC
&A
D
ete
ct-
Z
De
tect
M
ovi
ng
M
ate
ria
l
MC
&A
D
ete
ct-
C
MC
&A
D
ete
ct-
H
MC
&A
D
ete
ct-
M
MC
&A
D
ete
ct-
L
MC
&A
D
ete
ct-
Z
De
tect
Mo
vin
g M
ate
rial
MC
&A
D
ete
ct-
C
MC
&A
D
ete
ct-
H
MC
&A
D
ete
ct-
M
MC
&A
D
ete
ct-
L
MC
&A
D
ete
ct-
Z
D0
.02
00.
02
00.
02
00.
020
0.0
20
0.0
20
Mat
eri
al
Re
cove
red
Ale
rt
D0
.500
0.0
10
0.0
19
0.05
20
.08
80
.12
6M
ate
rial
R
eco
vere
d
D0.
02
00.
03
80.
106
0.1
80
0.2
58
Ale
rt
A0
.50
0D
0.5
00
0.0
05
0.0
09
0.02
60.
04
40.
06
3M
ate
rial
R
eco
vere
d
N0
.98
0N
orm
al
A0.
50
00.
00
50.
00
90.
026
0.0
44
0.0
63
Ale
rt
D0
.02
00.
01
90.
01
90.
018
0.0
16
0.0
15
Mat
eri
al
Re
cove
red
Ale
rt
N0.
98
00.
96
20.
894
0.8
20
0.7
42
D0.
50
00.
00
00.
00
10.
009
0.0
36
0.0
86
Mat
eri
al
Re
cove
red
A0
.00
00
.00
10.
022
0.0
92
0.2
42
A0
.50
00.
00
00.
00
10.
009
0.0
36
0.0
86
Ale
rt
N0
.98
0N
orm
al
N1
.00
00
.99
90.
978
0.9
08
0.7
58
D0
.02
00.
01
90.
01
80.
017
0.0
14
0.0
11
Mat
eri
al
Re
cove
red
N0
.98
00.
92
20.
90
40.
823
0.7
00
0.5
29
Mat
eri
al
Lo
stR
eco
vere
d0
.07
30
.08
60
.14
20
.21
90
.32
1
Ale
rt0
.00
50
.01
00
.03
50
.08
00
.15
0
Re
cove
red+
Ale
rt0
.07
80
.09
60
.17
70
.30
00
.47
1
Lo
st0
.92
20
.90
40
.82
30
.70
00
.52
9
EN
D S
TA
TE
SU
MM
AR
Y R
ES
UL
TS
EN
D
ST
AT
E
MC
&A
in M
AA
MC
&A
in P
A
EV
EN
T2
EV
EN
T4
SE
QU
EN
CE
PR
OB
AB
ILIT
IES

69
artificially low because no real facility would be permitted to operate with such poor PPS
and MC&A performance. In this figure, the events shaded in blue are for detection and
result in an end state of “Material Recovered,” those in purple are for MC&A “Alert”
states, and those in pink are for “Material Lost.” As expected from the dependence
relationships, except for the first end state, the values for the individual sequence end
states increase as dependence among MC&A observations decreases from complete to
zero dependence. This decrease factor varies from about 9 to about 12.
The end state summary results are also provided for this scenario in Figure 27.
The total probability for the “Material Recovered” end states increases from 0.073 to
0.321 (over 3 and a half times) as dependence among MC&A observations moves from
complete to zero dependence. The total probability for the “Alert” end states increases
from 0.005 to 0.150 (almost 30 times). The probability that the facility knows the
material is missing before it is taken offsite, which combines the “Material Recovered”
and the “Alert” end states, increases from 0.078 to 0.471 (over 5 times) as independence
among MC&A observations is achieved.
It is also important to note how the consideration of MC&A observations affects
the analyst’s perception of the likelihood of adversary success for an insider theft
scenario. For this scenario, with no MC&A detection, the total sequence probabilities for
the “Material Recovered” and “Material Lost” would be 0.059 and 0.941, respectively.
Including in each physical protection layer one daily MC&A activity with a low initial
probability of detection improves the probability of recovering the material from over
20% for complete dependence to more than four times for zero dependence for MC&A
observations. Including MC&A detection improves the probability that the facility
knows material is missing before it is taken offsite from over 30% to almost seven times
as dependence among MC&A observations decreases from complete to zero dependence.

70
Figures 28 and 29 show similar event sequence calculations for the medium
(0.50) and high (0.99) initial probabilities of MC&A detection, respectively. In each
case, the same type of increases with decreasing dependence among MC&A observations
are evident for the individual event sequences as well as for the “Material Recovered”
and “Alert” end state summaries. For the 0.50 initial MC&A detection probability, the
“Material Recovered,” and “Alert” end states almost double (increase from 0.529 to
0.998). Including in each physical protection one daily MC&A activity with a medium
initial probability of detection improves the probability of recovering the material from
about 8 times to about 16 times with decreasing dependence among MC&A observations.
For the 0.99 initial MC&A detection probability, the total probability for the “Material
Recovered” and “Alert” end states increases about 16 times over not including MC&A
detection.
4.3.2 Variations of Timelines in the MAA and PA
The previous section described the analysis of an adversary timeline in which the
time delay between each of the discontinuous events was defined as a uniform
distribution over 30 days. This section and the next two explore how the characteristics
of the adversary timeline and the MC&A detection timeline affect the security system
effectiveness computed by this method.
The characteristics of the adversary timeline are affected by the scheduling of
events that the adversary chooses to use or vulnerabilities he chooses to exploit in an
attack scenario, as well as the adversary’s knowledge of when the events occur. Both of
these effects are captured in the probability distributions used to represent the adversary
timelines. For this work, three types of timelines are used, each of which represent
different conditions:

71
Figure 28: Event sequence calculations for the 30-day MAA/30-day PA timeline scenarios for 0.50 initial probability of MC&A detection and five levels of dependence.
EV
EN
T1
EV
EN
T3
EV
EN
T5
PP
S -
MA
AP
PS
- P
AP
PS
- O
ut P
A
Det
ect
Tak
ing
Mat
eria
l
MC
&A
D
etec
t-C
MC
&A
D
etec
t-H
MC
&A
D
etec
t-M
MC
&A
D
etec
t-L
MC
&A
D
etec
t-Z
Det
ect
Mov
ing
Mat
eria
l
MC
&A
D
etec
t-C
MC
&A
D
etec
t-H
MC
&A
D
etec
t-M
MC
&A
D
etec
t-L
MC
&A
D
etec
t-Z
Det
ect M
ovin
g M
ater
ial
MC
&A
D
etec
t-C
MC
&A
D
etec
t-H
MC
&A
D
etec
t-M
MC
&A
D
etec
t-L
MC
&A
D
etec
t-Z
D0.
020
0.02
00.
020
0.02
00.
020
0.02
0M
ater
ial
Rec
over
ed
Ale
rt
D0.
500
0.24
50.
342
0.46
00.
472
0.47
4M
ater
ial
Rec
over
ed
D0.
500
0.69
90.
939
0.96
20.
967
Ale
rt
A0.
500
D0.
500
0.12
30.
171
0.23
00.
236
0.23
7M
ater
ial
Rec
over
ed
N0.
980
Nor
mal
A0.
500
0.12
30.
171
0.23
00.
236
0.23
7A
lert
D0.
020
0.01
00.
006
0.00
10.
001
0.00
1M
ater
ial
Rec
over
edA
lert
N0.
500
0.30
10.
061
0.03
80.
033
D0.
500
0.00
00.
006
0.01
90.
017
0.01
5M
ater
ial
Rec
over
ed
A0.
000
0.03
90.
648
0.91
70.
933
A0.
500
0.00
00.
006
0.01
90.
017
0.01
5A
lert
N0.
980
Nor
mal
N1.
000
0.96
10.
352
0.08
30.
067
D0.
020
0.01
00.
006
0.00
00.
000
0.00
0M
ater
ial
Rec
over
ed
N0.
980
0.47
10.
273
0.02
00.
003
0.00
2M
ater
ial
Lost
Rec
over
ed0.
407
0.55
10.
731
0.74
50.
746
Ale
rt0.
123
0.17
70.
249
0.25
20.
252
Rec
over
ed+
Ale
rt0.
529
0.72
70.
980
0.99
70.
998
Lost
0.47
10.
273
0.02
00.
003
0.00
2
EN
D
ST
AT
E
EN
D S
TA
TE
SU
MM
AR
Y R
ES
ULT
S
SE
QU
EN
CE
PR
OB
AB
ILIT
IES
MC
&A
in M
AA
MC
&A
in P
A
EV
EN
T2
EV
EN
T4

72
Figure 29: Event sequence calculations for the 30-day MAA/30-day PA timeline scenarios for 0.99 initial probability of MC&A detection and five levels of dependence.
EV
EN
T1
EV
EN
T3
EV
EN
T5
PP
S -
MA
AP
PS
- P
AP
PS
- O
ut
PA
De
tect
T
aki
ng
M
ate
ria
l
MC
&A
D
ete
ct-
C
MC
&A
D
ete
ct-
H
MC
&A
D
ete
ct-
M
MC
&A
D
ete
ct-
L
MC
&A
D
ete
ct-
Z
De
tect
M
ovi
ng
M
ate
rial
MC
&A
D
ete
ct-
C
MC
&A
D
ete
ct-
H
MC
&A
D
ete
ct-
M
MC
&A
D
ete
ct-
L
MC
&A
D
ete
ct-
Z
De
tect
Mo
vin
g
Mat
eri
al
MC
&A
D
ete
ct-
C
MC
&A
D
ete
ct-
H
MC
&A
D
ete
ct-
M
MC
&A
D
ete
ct-
L
MC
&A
D
ete
ct-
Z
D0
.02
00
.02
00.
02
00
.020
0.0
20
0.0
20
Ma
teria
l R
eco
vere
d
Ale
rt
D0
.50
00.
48
50
.48
80
.49
00.
49
00
.49
0M
ate
rial
Rec
ove
red
D0.
99
00
.99
71
.00
01.
00
01
.00
0A
lert
A0
.50
0D
0.5
00
0.2
43
0.2
44
0.2
45
0.2
45
0.2
45
Ma
teria
l R
eco
vere
d
N0
.98
0N
orm
al
A0
.50
00.
24
30
.24
40
.24
50.
24
50
.24
5A
lert
D0
.02
00.
00
00
.00
00
.00
00.
00
00
.00
0M
ate
rial
Rec
ove
red
Ale
rt
N0.
01
00
.00
30
.00
00.
00
00
.00
0D
0.5
00
0.0
00
0.0
00
0.0
00
0.0
00
0.0
00
Ma
teria
l R
eco
vere
d
A0
.00
00
.10
30
.95
20
.964
0.9
66
A0
.500
0.0
00
0.0
00
0.0
00
0.0
00
0.0
00
Ale
rt
N0
.98
0N
orm
al
N1
.00
00.
89
70
.048
0.0
36
0.0
34
D0
.020
0.0
00
0.0
00
0.0
00
0.0
00
0.0
00
Ma
teria
l R
eco
vere
d
N0
.980
0.0
09
0.0
03
0.0
00
0.0
00
0.0
00
Ma
teria
l L
ost
Re
cove
red
0.7
48
0.7
53
0.7
55
0.7
55
0.7
55
Ale
rt0.
24
30
.24
40
.24
50.
24
50
.24
5
Re
cove
red
+A
lert
0.9
91
0.9
97
1.0
00
1.0
00
1.0
00
Lo
st0.
00
90
.00
30
.00
00.
00
00
.00
0
EN
D
ST
AT
E
EN
D S
TA
TE
SU
MM
AR
Y R
ES
ULT
S
EV
EN
T2
EV
EN
T4
SE
QU
EN
CE
PR
OB
AB
ILIT
IES
MC
&A
in M
AA
MC
&A
in P
A

73
• Uniform timeline – timeline for a condition that occurs at regular intervals; the
interval is known to the insider, but the specific schedule is not; timeline is
represented by a uniform probability distribution.
• Fixed timeline – timeline for a condition that occurs a fixed duration after a
previous enabling condition; the enabling condition and fixed duration are known
to the insider; the timeline is represented by a fixed delay time.
• Uncertain timeline – timeline for a condition that occurs randomly with a specific
(estimated) likelihood each day; the timeline is represented by a geometric
probability distribution.
The duration of the delay between discontinuous tasks is captured in the parameters of
the distribution. Convolution must be used to calculate the values used in the model from
the distributions. This section examines four additional adversary theft timelines that
make use of different delays that are modeled as fixed durations and uniform durations in
order to demonstrate how the MC&A detection probabilities and overall event sequence
probabilities vary for changes in the delays the adversary will encounter between
discontinuous scenario events. The next two sections examines a more realistic facility
analysis by using a set of activities to determine the MC&A detection probabilities, first
with a uniform adversary theft timeline (Section 4.3.3) and then with a geometric
distribution for the adversary theft timeline (Section 4.3.4). Table 5 presents the four
adversary timelines evaluated in this section. The example from Section 4.3.1 (Timeline
2) is included as a point of comparison.
Timely MC&A detection for Event 2 is determined as described in Section 3.6.2.
Table 6 presents the MC&A detection probabilities for Event 2 for each of the five
different timeline scenarios. Comparing the three timeline durations within a single
dependence level, with the exception of complete dependence, the longer the timeline for

74
Table 5: Five adversary timelines
Timeline Event 2 Delay 2 Event 4 Delay 2
1
MC&A in MAA
5 days – uniform distribution
MC&A in PA
30 days – uniform distribution
2 30 days – uniform
distribution 30 days – uniform
distribution
3 90 days – uniform
distribution 30 days – uniform
distribution
4 5 days – uniform
distribution 5 days – fixed delay
5 5 days – uniform
distribution 30 days – fixed
delay
Table 6: Event 2 probability of timely MC&A detection for the five scenario timelines for five dependence levels and low (0.02), medium (0.50), and high (0.99) initial probability of detection
Timeline MAA/PA
Initial PD,MC&A
Dependence Complete High Moderate Low Zero
1. 5-day Uniform/ 30-day Uniform
0.02 0.020 0.032 0.049 0.055 0.058 0.50 0.500 0.638 0.764 0.792 0.806 0.99 0.990 0.995 0.998 0.998 0.998
2. 30-day Uniform/ 30-day Uniform
0.02 0.020 0.038 0.106 0.180 0.258 0.50 0.500 0.699 0.939 0.962 0.967 0.99 0.990 0.997 1.000 1.000 1.000
3. 90-day Uniform/ 30-day Uniform
0.02 0.020 0.039 0.123 0.269 0.544 0.50 0.500 0.707 0.969 0.987 0.989 0.99 0.990 0.997 0.999 0.999 0.999
4. 5-day Uniform/ 5-day Fixed
0.02 0.020 0.032 0.049 0.055 0.058 0.50 0.500 0.638 0.764 0.792 0.806 0.99 0.990 0.995 0.998 0.998 0.998
5. 5-day Uniform/ 30-day Fixed
0.02 0.020 0.032 0.049 0.055 0.058 0.50 0.500 0.638 0.764 0.792 0.806 0.99 0.990 0.995 0.998 0.998 0.998
MC&A detection in the MAA, the higher the probability of timely MC&A detection.
Similarly, across dependence levels, the probability of detection increases more with
decreasing dependence between MC&A observations for a longer timeline in the MAA.

75
These results again emphasize the importance of extending an insider’s theft timeline to
increase the facility’s probability of detecting suspicious or unauthorized actions.
The other significant difference among the timeline scenarios is the one-time theft
opportunity in the PA for the last two timeline scenarios listed above. Having only one
opportunity to move the material in the PA reduces significantly the calculations for the
number of possible composite timelines, each of which has a higher individual
probability (1/5 for the 5-day uniform/30-fixed timeline compared to 1/150 for the 5-day
uniform/30-day uniform timeline). With a fixed timeline in the PA, the total duration of
the composite timelines will vary from six to ten days for the 5-day uniform/5-day fixed
timeline and from 31 to 35 days for the 5-day uniform/30-day fixed timeline. For MC&A
detection in the PA, Table 7 presents the MC&A detection probabilities for Event 4 in the
ESD. Reducing the opportunity for moving material in the PA essentially removes theft
scenarios of two to five days for the 5-day uniform/5-day fixed timeline and two to 30
days for the 5-day uniform/30-day fixed timeline. Thus, the shortest adversary scenarios
timelines are prevented, so there is greater opportunity for MC&A observations to detect
the material as missing before it is removed from the facility. The resulting MC&A
detection probabilities in the PA generally increase compared to a uniform timeline in the
PA – for example 0.086, 0.931, and 0.999 for the low, moderate and high initial
probability of detection, for moderate dependence between MC&A observations for the
5-day uniform/30-day fixed composite timeline compared to 0.067, 0.831, and 0.956,
respectively, for the 5-day uniform/30-day uniform composite timeline.
Another point to note for the Event 4 MC&A detection probabilities is the very
low values for complete and high dependence. The low values are independent of
distribution type and somewhat independent of duration and initial probability of MC&A

76
Table 7: Event 4 probability of timely MC&A detection for the five scenario timelines for five dependence levels and low (0.02), medium (0.50), and high (0.99) initial probability of detection
Timeline MAA/PA
Initial PD,MC&A
Dependence of MC&A Detection Activities Complete High Moderate Low Zero
1. 5-day Uniform/ 30-day Uniform
0.02 0.000 0.007 0.067 0.149 0.242 0.50 0.000 0.189 0.831 0.920 0.933 0.99 0.000 0.397 0.956 0.964 0.966
2. 30-day Uniform/ 30-day Uniform
0.02 0.000 0.001 0.022 0.092 0.242 0.50 0.000 0.039 0.648 0.917 0.933 0.99 0.000 0.103 0.952 0.964 0.966
3. 90-day Uniform/ 30-day Uniform
0.02 0.000 4E-04 0.007 0.042 0.242 0.50 0.000 0.013 0.426 0.916 0.933 0.99 0.000 0.037 0.944 0.964 0.966
4. 5-day Uniform/ 5-day Fixed
0.02 0.000 0.007 0.041 0.062 0.078 0.50 0.000 0.192 0.745 0.886 0.938 0.99 0.000 0.406 0.987 1.000 1.000
5. 5-day Uniform/ 30-day Fixed
0.02 0.000 0.008 0.086 0.235 0.443 0.50 0.000 0.202 0.931 1.000 1.000 0.99 0.000 0.420 0.999 1.000 1.000
detection. These higher levels of dependence make later MC&A observations less
effective (in fact, MC&A detection probability in the PA is 0 for complete dependence).
If material has not been detected missing by the time it is moved out of the MAA, it is
unlikely that it will be detected as missing while it is still in the PA.
Tables 8 through 12 present the end state summaries for the five different
timelines. It is evident from these results that MC&A detection as an alert provides an
additional significant contribution to overall detection of an insider theft. Figure 30 is a
plot of the results for the three uniform composite timelines that shows the general trends
of increasing probability for the alert and material recovered end states with decreasing
dependence between MC&A observations and increasing timelines for the PA. Figure 31
is a plot of the results for the three 5-day MAA timelines with the respective uniform or
fixed PA timelines.

77
Table 8: End state summary results for Timeline 1 – 5-day MAA/30-day PA timeline
Initial PD,MC&A End State
Dependence of MC&A Detection Activities Complete High Moderate Low Zero
0.02
Material Recovered 0.073 0.084 0.122 0.162 0.205 Alert 0.005 0.011 0.043 0.081 0.124 Material Recovered + Alert
0.078 0.096 0.165 0.243 0.329
Material Lost 0.922 0.904 0.835 0.757 0.671
0.50
Material Recovered 0.407 0.535 0.681 0.699 0.703 Alert 0.123 0.189 0.281 0.286 0.284 Material Recovered + Alert
0.529 0.724 0.963 0.984 0.988
Material Lost 0.471 0.276 0.037 0.016 0.012
0.99
Material Recovered 0.748 0.752 0.754 0.754 0.754 Alert 0.243 0.245 0.246 0.246 0.246 Material Recovered + Alert
0.991 0.997 ~0.999 ~1.000 ~1.000
Material Lost 0.009 0.003 1E-04 7E-05 6E-05
These results further reinforce the insights from the analysis in the previous
section, namely:
• Decreasing dependence among MC&A observations increase the sequence
probabilities for the Material Recovered and Alert end states. MC&A activities
with at most a moderate level of dependence between observations can provide
significant improvement in overall effectiveness.
• Longer timelines improve detection effectiveness. Forcing the adversary to keep
material in a physical protection layer longer provides more opportunity for
detection so that even low initial probabilities of MC&A detection can result in a
significantly higher cumulative probability of detection.
• Higher initial probabilities of MC&A detection for an activity can accommodate a
higher level of dependence between MC&A observations, although less
opportunity is available to improve overall cumulative probability of detection.

78
Table 9: End state summary results for Timeline 2 – 30-day MAA/30-day PA timeline
Initial PD,MC&A End State Dependence of MC&A Detection Activities
Complete High Moderate Low Zero
0.02
Material Recovered 0.073 0.086 0.142 0.219 0.321 Alert 0.005 0.010 0.035 0.080 0.150 Material Recovered + Alert 0.078 0.096 0.177 0.300 0.471
Material Lost 0.922 0.904 0.823 0.700 0.529
0.50
Material Recovered 0.407 0.551 0.731 0.745 0.746 Alert 0.123 0.177 0.249 0.252 0.252 Material Recovered + Alert 0.529 0.727 0.980 0.997 0.998
Material Lost 0.471 0.273 0.020 0.003 0.002
0.99
Material Recovered 0.748 0.753 0.755 0.755 0.755 Alert 0.243 0.244 0.245 0.245 0.245 Material Recovered + Alert 0.991 0.997 ~1.000 ~1.000 ~1.000
Material Lost 0.009 0.003 2E-05 1E-05 1E-05
Table 10: End state summary results for Timeline 3 – 90-day MAA/30-day PA timeline
Initial PD,MC&A End State Dependence of MC&A Detection Activities
Complete High Moderate Low Zero
0.02
Material Recovered 0.073 0.086 0.147 0.260 0.488 Alert 0.005 0.010 0.033 0.081 0.186 Material Recovered + Alert 0.078 0.096 0.180 0.341 0.674
Material Lost 0.922 0.904 0.820 0.659 0.326
0.50
Material Recovered 0.407 0.553 0.739 0.752 0.752 Alert 0.123 0.175 0.244 0.247 0.247 Material Recovered + Alert 0.530 0.728 0.983 0.999 0.999
Material Lost 0.470 0.272 0.017 0.001 0.001
0.99
Material Recovered 0.748 0.753 0.755 0.755 0.755 Alert 0.243 0.244 0.245 0.245 0.245 Material Recovered + Alert 0.991 0.997 ~1.000 ~1.000 ~1.000
Material Lost 0.009 0.003 7E-06 4E-06 4E-06

79
Table 11: End state summary results for Timeline 4 – 5-day MAA/5-day fixed PA timeline
Initial PD,MC&A End State Dependence of MC&A Detection Activities
Complete High Moderate Low Zero
0.02
Material Recovered 0.073 0.084 0.111 0.124 0.133 Alert 0.005 0.011 0.031 0.042 0.049 Material Recovered + Alert 0.078 0.096 0.142 0.166 0.182
Material Lost 0.922 0.904 0.858 0.834 0.818
0.50
Material Recovered 0.407 0.535 0.672 0.695 0.704 Alert 0.123 0.190 0.272 0.282 0.285 Material Recovered + Alert 0.530 0.725 0.944 0.977 0.989
Material Lost 0.470 0.275 0.056 0.023 0.011
0.99
Material Recovered 0.748 0.752 0.754 0.754 0.755 Alert 0.243 0.245 0.246 0.246 0.245 Material Recovered + Alert 0.991 0.997 ~1.000 ~1.000 ~1.000
Material Lost 0.009 0.003 3E-05 5E-07 2E-11
Table 12: End state summary results for Timeline 5 – 5-day MAA/30-day fixed PA timeline
Initial PD,MC&A End State Dependence of MC&A Detection Activities
Complete High Moderate Low Zero
0.02
Material Recovered 0.073 0.085 0.130 0.199 0.292 Alert 0.005 0.011 0.051 0.120 0.215 Material Recovered + Alert 0.078 0.096 0.181 0.319 0.507
Material Lost 0.922 0.904 0.819 0.681 0.493
0.50
Material Recovered 0.407 0.537 0.692 0.706 0.709 Alert 0.123 0.191 0.293 0.294 0.291 Material Recovered + Alert 0.530 0.728 0.985 ~1.000 ~1.000
Material Lost 0.471 0.272 0.015 6E-05 3E-10
0.99
Material Recovered 0.757 0.755 0.754 0.754 0.755 Alert 0.243 0.245 0.246 0.246 0.245 Material Recovered + Alert 0.990 ~1.000 ~1.000 ~1.000 1.000
Material Lost 0.009 0.003 2E-06 1E-13 0.000

80
0.00 0.20 0.40 0.60 0.80 1.00
Event Sequence Alert + Win Probability
0.02
0.50
0.99
0.02
0.50
0.99
0.02
0.50
0.99
Tim
elin
e S
cen
ario
(L
, M
, H
Pro
bab
ilit
y o
f M
C&
A D
etec
tio
n)
5d U
/30d
U
30d
U/3
0d U
3
0d U
/90d
U
Figure 30: Plot of material recovered + alert end state summary results for the three uniform composite timelines
0.00 0.20 0.40 0.60 0.80 1.00
Event Sequence Alert + Win Probability
0.02
0.50
0.99
0.02
0.50
0.99
0.02
0.50
0.99
Tim
elin
e S
cen
ario
(L
, M
, H
Pro
bab
ilit
y o
f M
C&
A D
etec
tio
n)
5d U
/30d
U
5d
U/3
0d F
5
d U
/5d
F
Figure 31: Plot of material recovered + alert end state summary results for the three 5-day MAA timelines and respective uniform and fixed PA timelines

81
4.3.3 Analysis for Facility-level MC&A Operations
To explore the proposed methods, the previous analyses demonstrate the extended
path analysis methodology for the following limited conditions:
• One daily MC&A activity
• Low, medium and high initial probabilities of MC&A detection (complements of
BHEPs associated with certain types of NPP operations)
• Detection timelines based on the dependency relationships between MC&A
observations
• Uniform and fixed timelines of varying durations and
• Multiple physical protection layers.
Actual facility-level MC&A operations are much more complex and involve many
MC&A activities that are performed at various intervals. To demonstrate the extended
path analysis methodology for scenarios that are more representative of the complexity of
actual facility MC&A operations, additional analyses were done for a 5-day MAA/30-day
PA scenario timeline for a set of MC&A activities that occur at different intervals.
Table 13 presents a detection opportunity timeline for a notional set of six MC&A
activities at a facility. Each of the six activities occurs at a different interval and has been
assigned a BHEP as determined in Table 1. Also, each activity has been assigned a given
level of dependence, and the day-to-day calculations of the BHEP reflect this dependence
relationship. For example, the Forms Reconciliation activity, which occurs every three
days, has a high level of dependence between each performance of this activity. The
Process Call, which occurs every 14 days, has a moderate level of dependence between

82

83

84
each performance of this activity. In this example, the Plan of the Day and Daily
Administrative Check are performed once a day by the same person, so these activities
are assigned a high level of dependence between the performance of each of these
activities.
The daily probability of detection can be determined by combining the BHEPs as
non-detection probabilities and taking the complement:
∏=
−=M
mmDayn BHEPP
1
1 (30)
For example, on Day 3, the set of MC&A activities includes:
• 1 – Plan of the Day,
• 3 – Forms Reconciliation, and
• 4 – Daily Administrative Check.
and the daily probability of detection, PMC&A,3, is calculated as:
( )( )( )[ ]( )( )( )[ ]
[ ]954.0
046.01
972.0050.0944.01
1
1
3,&
3,&
3,&
4313,&
1,&
=−=−=−=
−= ∏=
AMC
AMC
AMC
AMC
M
mmnAMC
P
P
P
BHEPBHEPBHEPP
BHEPP
(31)
The probability of MC&A detection on day three is higher than that for the previous two
days because additional MC&A activities have occurred on this day to contribute to a
higher level of detection for the set of MC&A activities. The MC&A detection timeline
for the scenario is determined from the daily probabilities of MC&A detection. This
detection timeline for 35 days is illustrated in Figure 32. Over the course of the 35-day
timeline, the daily probability of MC&A detection increases as additional activities occur
to contribute to detection, or decreases as the dependence relationships reduce detection

85
between observations. The underlying effect of the dependency relationships is also
evident in Figure 32.
0.000
0.100
0.200
0.300
0.400
0.500
0.600
0.700
0.800
0.900
1.000
1 2 3 4 5 6 7 8 9 10 11 12 13 14 15 16 17 18 19 20 21 22 23 24 25 26 27 28 29 30 31 32 33 34 35
Detection Timeline (Day)
Pro
bab
ilit
y o
f D
etec
tio
n b
y S
et o
f M
C&
A A
ctiv
itie
s
Underlying effect of dependency for Activity 3
Underlying effect of dependency for Activity 3
Underlying effect of dependency for Activities 1 and 4
Figure 32: Daily probability of detection over a 35-day period for a set of MC&A activities
The detection timeline for the set of MC&A activities was evaluated against an
adversary timeline in which Delay 1 for MC&A in the MAA was represented as a 5-day
uniform distribution and Delay 2 for MC&A in the PA was represented as a 30-day
uniform distribution. For the 5-day MAA timeline, the daily values of MC&A detection
for the first five days (Table 14) are used in the convolution calculation. For this case,
timely MC&A detection for Event 2 in the ESD is calculated to be 0.98. For the
composite MAA/PA timelines, the daily values of MC&A detection for the 35-day
composite timeline are used in the convolution calculation, and timely MC&A detection
for Event 4 in the ESD is calculated to be 0.938. The sequence probabilities for the
Material Recovered and Alert end states are 0.750 and 0.249, respectively. Thus, the set

86
of MC&A activities result in a level of MC&A detection similar to that for a single
MC&A activity with a high initial probability of detection, even though some of the
MC&A activities in the set have high and moderate levels of dependence between
observations and across activities.
This analysis demonstrates the applicability of the extended path analysis methods
for more realistic facility conditions. The daily probability of detection in Figure 32
provides insights for evaluating the protection level provided by MC&A activities over
time and identifying gaps in that protection level. For example, daily probability of
detection from days 15 through 27 indicate that additional protection is needed and action
should be taken to reduce dependency in the performance of MC&A activities, or to add
other activities that would increase the protection level during that time period. The
importance of MC&A activities is also evident – while a single MC&A activity has the
potential to contribute significantly to cumulative detection, a set of activities has the
potential to maintain cumulative detection over time.
4.3.4 Addressing Uncertainty in Insider Theft Timelines
To further address the complexity of actual insider theft scenarios, the detection
timeline for the set of MC&A activities described in Section 4.3.3 was used with an
insider theft timeline composed of geometric distributions. The convolution of these
distributions was computed using LHS sampling. This approach to determine an insider
theft timeline reflects the uncertainty in an insider’s theft timeline as well as an analyst’s
lack of knowledge about possible insider theft timelines.
In LHS, the convolution for the composite MAA/PA timeline was determined by
sampling 2000 observations for two each of the distributions (MAATHEFT and
PATHEFT) for a geometric distribution with three different values for probability of
failure. The geometric distribution was selected because it represents the number of

87
successful trials that might be observed before a failure occurs. For insider theft, the
probability of failure is the probability that the facility will be in a vulnerable state that
the malicious insider will find favorable enough to attempt to move material to the next
physical protection layer. Figure 33 is a plot of each of the three geometric distributions
over their first 30 days. In each composite theft timeline, the distributions for the MAA
and PA theft timelines are the same. Thus the three composite timelines considered in
this analysis are each composed of two identical, but uncorrelated geometric distributions
with failure probabilities of 0.20, 0.50, and 0.80, respectively.
0.0000
0.1000
0.2000
0.3000
0.4000
0.5000
0.6000
0.7000
1 2 3 4 5 6 7 8 9 10 11 12 13 14 15 16 17 18 19 20 21 22 23 24 25 26 27 28 29 30
GeoDist1 P=0.2
GeoDist2 P=0.5
GeoDist3 P=0.8
Figure 33: Geometric distributions for theft timeline generated from LHS.
To perform the calculations for timely MC&A detection in the MAA, each
geometric distribution was used in the calculations as described in Section 3.6.2. The

88
calculations for timely detection in the PA require convolution of the distributions for the
MAA theft timeline and the PA theft timeline, which was done as follows. LHS was
used to draw 2000 observations for each distribution, and the values for each distribution
were summed on an observation-by-observation basis to obtain observations for the total
duration of the theft timeline. The probability of each unique theft timeline value was
determined through a frequency analysis of the resulting observation set. The resulting
set of probabilities was used to represent the theft timeline in the calculation of timely
MC&A detection in the PA with an MC&A detection timeline for a set of MC&A
activities as describe in Section 4.3.3. Table 14 provides the values for timely MC&A
detection in the MAA and PA. Table 15 provides the end state summary results from the
ESD calculations for the three geometric timeline scenarios.
Table 14: Timely MC&A detection in the MAA (Event 2) and the PA (Event 4) for a set of MC&A activities and geometric distributions for theft timeline
Composite MAA/PA Timeline
Timely MC&A Detection MAA – Event 2 PA – Event 4
Geometric Distribution 1 P=0.20
0.629 0.702
Geometric Distribution 2 P=0.50 0.241 0.328
Geometric Distribution 3 P=0.80
0.038 0.064
4.3.5 Mitigating Potential Malicious Insider Activity
The application of HRA methods has provided a probabilistic basis for
incorporating MC&A activities in an extended path analysis methodology. One purpose
for analyzing a PPS is to identify vulnerabilities or gain insights on the possible impacts
of additional protection elements. The final application of HRA methods for
characterizing MC&A activities was an exercise to demonstrate how these methods
might be used to explore strategies for mitigating malicious insider activity. This

89
Table 15: Comparison of end state summary results for 5-day MAA/30-day PA timeline and geometric distributions for theft timeline for a set of MC&A activities
Composite MAA/PA Timeline Initial PD,MC&A End State Sequence
Probability
Geometric Distribution 1 P=0.20 (mean time before material is removed – 4 days)
0.945
Material Recovered 0.617 Alert 0.279 Material Recovered + Alert 0.996
Material Lost 0.004
Geometric Distribution 2 P=0.50 (mean time before material is removed – 1 day)
0.945
Material Recovered 0.341 Alert 0.179 Material Recovered + Alert 0.520
Material Lost 0.480
Geometric Distribution 3 P=0.80 (mean time before material is removed – < 1 day)
0.945
Material Recovered 0.114 Alert 0.039 Material Recovered + Alert 0.153
Material Lost 0.847
5-day Uniform/30-day Uniform 0.945
Material Recovered 0.750 Alert 0.249 Material Recovered + Alert
0.999
Material Lost 0.001
analysis used the 5-day MAA/5-day PA scenario timeline with uniform distributions for
the theft timelines and the detection timeline developed for a set of MC&A activities.
This scenario timeline has a two-day to ten-day possible duration and 25 possible
composite timelines. Three cases for the MC&A detection timeline were addressed: one
for the baseline set of combined MC&A activities described in Table 13; a second
assuming a malicious insider performs activities 1 and 4, which have a high level of
dependence; and a third assuming the dependency relationship is removed for activity 4.
The baseline case assumes that the insider has access to the material, but is not in a
position of performing MC&A tasks.
For the first ten-day composite timeline, the detection timeline used the daily
MC&A detection probabilities for the first ten days from the baseline set of combined

90
MC&A activities (Table 13). In this baseline set of activities, it was assumed that
activities 1 and 4 are performed by the same person on a daily basis, and therefore they
are assigned a high level of dependence between recurrences of these activities. The next
variation for this timeline assumes that the person who performs activities 1 and 4 is a
malicious insider who is seeking to steal material. Consequently, the BHEP for these
activities is set to 1 and the probability of detection is 0 because the thief is concealing
the activities by misstating the results of the MC&A tasks. In the third variation, the
facility does not know about any malicious insider activity, but an operational change is
made to remove the dependency relationship among these activities – instead of one
person performing both activities, two people perform these activities. The person who
performs activity 1 is still assumed to be the malicious insider, and activity 4 is assumed
to have the high level of dependence, the same as for the baseline set of activities because
a single person (but not the malicious insider) always performs these tasks.
Tables 16 and 17 provide the detection timelines for the variations with the
malicious insider and the insider mitigation, respectively. Figure 34 is a plot of these
detection timelines. The original BHEPs for activities 1 and 4 provided in Table 13 for
the set of MC&A activities no longer apply. For the case of the malicious insider, these
values in Table 16 are set to 1.0, as the insider who performs both these activities is
trying to conceal malicious activity. The probability of detection for these individual
activities is zero. Because activities 1 and 4 are the only ones performed on days 1 and 2,
the daily probability of MC&A detection is also zero. Over the ten-day timeline for this
case MC&A detection occurs only on days 3, 6 and 9 when an activity other than 1 or 4 is
performed. Activity 3 is performed on these days and is defined to have a high level of
dependence for its performance. For the case with malicious insider mitigation for
activity 4, the daily BHEP values reflect the removal of the dependency between activity

91

92

93
0.000
0.100
0.200
0.300
0.400
0.500
0.600
0.700
0.800
0.900
1.000
1 2 3 4 5 6 7 8 9 10
Baseline Set
Malicious Insider
Insider Mitigation
Figure 34: Detection timelines for baseline set of MC&A activities, malicious insider, and insider mitigation.
1 and activity 4, but there is still a high level of dependence for the performance of
activity 4 because the same person (although not a malicious insider) always performs
this task. The operational change to remove the dependence between activities 1 and 4 to
mitigate possible malicious insider actions results in additional daily MC&A detection
that is at least as high as or higher than the baseline case.
Table 18 provides the values for timely MC&A detection in the MAA and PA and
the end state summaries for each of the three cases. These results show that the case for
malicious insider mitigation allows overall detection to recover up to the baseline case.
These analyses demonstrate the application of the extended path analysis methodology to
evaluate the effectiveness of a set of MC&A activities, to identify possible vulnerabilities

94
and to provide insights for operational strategies to address possible malicious insider
activity.
Table 18: Timely MC&A detection in the MAA (Event 2) and the PA (Event 4) and end state summary for baseline set of MC&A activities, malicious insider activity and insider mitigation
5-day MAA/5-day PA timeline scenario with uniform theft distributions
Timely MC&A Detection End State Summary
MAA Event 2
PA Event 4 End State Probability
MC&A detection timeline for baseline set of activities and dependency relationships
0.980 0.507
Material Recovered 0.746 Alert 0.245 Material Recovered + Alert
0.991
Material Lost 0.009 MC&A detection timeline assuming malicious insider for daily activities 1 and 4 with high dependence relationship
0.570 0.641
Material Recovered 0.583 Alert 0.272 Material Recovered + Alert
0.855
Material Lost 0.145
MC&A detection timelines assuming insider mitigation for activity 4
0.968 0.699
Material Recovered 0.743 Alert 0.248 Material Recovered + Alert 0.991
Material Lost 0.009
4.4 SUMMARY OF METHODS DEVELOPMENT FOR DAILY AND COMBINED MC&A DETECTION AND MULTIPLE PHYSICAL PROTECTION LAYERS
The analyses presented in this chapter further demonstrate the use of the extended
path analysis to model insider theft and integrated PPS and MC&A protection elements
and to quantify the effectiveness of these protection elements against an insider threat.
The methods provide tools to evaluate the protection level MC&A activities provide over
time, identify gaps, and model potential insider activity. The results provide insights on
how MC&A activities can be implemented in facility operations to provide a desired
level of protection over time.

95
Chapter 5: Conclusions and Recommendations
The goal of this research was to develop a probabilistic basis and a new method to
incorporate MC&A protection elements explicitly within the existing probabilistic path
analysis methodology to address insider theft. To accomplish this, three problem areas
were addressed:
• “Detection” capabilities of MC&A protections and quantitative probabilities of
detection – individually, in combination, and as a function of time;
• Competing delay and detection timelines for insider theft versus facility detection;
and
• Scenario development to integrate the evaluation of PPS and MC&A protections
within physical protection layers.
This work applied PRA methods to develop and demonstrate three key methods for
incorporating MC&A protection elements in to the existing probabilistic path analysis
methodology, as follows:
1. HRA methods and HEPs for human performance of NPP operations to
develop detection probabilities for MC&A activities;
2. An object-based state paradigm to model the stages and timing for insider
theft and to characterize insider theft as a race against detection by facility
MC&A activities; and
3. ESDs to incorporate MC&A activities within the protection layers of a PPS, to
develop insider theft scenarios, and to propagate detection probabilities for a
theft scenario.
Using these approaches to characterize and evaluate MC&A activities has
demonstrated the importance of these activities as protection elements for insider theft.

96
The application of HRA methods to define MC&A detection probabilities also identified
three key factors for “designing” MC&A activities to address insider theft scenarios: (1)
the type of operation based on a desired probability of detection, (2) the level of
dependence in the performance of the operation, and (3) the scenario timelines of interest
for achieving timely detection. While MC&A activities do not indicate actual detection
of an insider adversary, the timely detection afforded by MC&A activities provides an
alert that material is not where it should be. The possible end states (Material Recovered,
Alert, and Material Lost) for each theft scenario provide additional insights about the
status and recovery of critical assets. The “Material Recovered” end state indicates that
an MC&A activity alerted the facility that material was not where it should be and that
subsequent actions recovered the material before it could be taken out of the facility. The
“Material Lost” end state indicates that no MC&A alert occurred, and the facility has no
information that material is missing even at the end of the scenario timeline.
The demonstration analysis provides calculations for a range of initial MC&A
detection probabilities and several scenarios with different theft and MC&A detection
timelines. These calculations indicate that the methods developed in this work provide
flexibility for application to a wide range of insider theft scenarios. In evaluating the
results of the analysis, however, it is evident that these methods are likely to be most
applicable for discontinuous timeline and protracted theft scenarios. Current methods are
adequate for abrupt theft scenarios because these scenarios assume detection occurs
almost immediately and thus can be analyzed using the exit path for an outside adversary
attack.
The methods resulting from this work have been developed within the framework
of the existing path analysis methodology, and as such can be integrated with existing

97
methods and tools in a fairly straightforward manner. Additional work in the following
areas will be required to accomplish this fully.
• Explore other approaches for developing insider adversary timelines and develop
more concrete guidance for this part of the method.
• Develop a comprehensive MC&A performance database to identify all possible
MC&A activities and the corresponding BHEPs, similar to the performance
database that has been developed for PPS protection elements. Explore
complementary aspects of the SFPI [20-22], Markov chain [53-56], and MSET
[58-62] approaches that might provide the basis for performance data. The
database would include the initial probabilities of detection, and would relate
these activities to insider positions and their associated performance, as well as
access, knowledge and authority. Development of an MC&A performance data
base will facilitate automation of this method in a software tool.
• Investigate the application of other HRA techniques in this methodology (e.g.,
Swain [64] and the NRC multidisciplinary framework [65]). These techniques
could support more detailed characterization of some MC&A activities to
determine detection probabilities, as well as the development of the MC&A
performance data base. In addition, other HRA methods identify “error forcing
contexts” and consider errors of omission as well as errors of commission for
human operators. An insider who could create an error forcing context in an area
of facility operations may be able to establish as system vulnerability that would
facilitate a theft or diversion path.
• Develop metrics to be applied with the extended path analysis methodology to
show the relative importance of particular MC&A activities to preventing
different types of insider theft scenarios. The method has provided significant

98
insight for characterizing and evaluating a specific MC&A program against
specific theft scenarios. Importance metrics would extend these insights to allow
analysts to better understand which MC&A operations are useful and which may
be an added burden or expense and support decision making to improve efficiency
and save money.
• Analyze additional types of systems using this method to determine if more
design heuristics for MC&A systems could be identified.
• Use Monte Carle discrete event simulation methods to directly solve the problem
for more complex timelines or MC&A inspection regimes.
• Incorporate this method into a tool like ASSESS or ATLAS to automate insider
path identification and link those paths to the generation of a discontinuous
timeline and MC&A activities in the performance data base to form more realistic
estimates of PE without hand-crafting every scenario. Automated evaluation may
also require linking with LHS so that the analyst has access to several types of
probability distributions with which to represent the adversary timeline.
The methods developed in this work support the probabilistic basis for and have
enabled the development of an extended path analysis methodology in which MC&A
protections can be combined with traditional sensor data in the calculation of PPS
effectiveness. Explicitly incorporating MC&A protection into the existing S&S system
evaluation provides a basis to measure the effectiveness measure of the PPS against
insider threats. The resulting PE calculations will provide an integrated effectiveness
measure that addresses both outsider and insider threats.

99
Appendix A: Combining Probability Distributions, A nalytic, or Continuous Variable Case3
Let x and y be independent variables having the probability density functions px(x), py(y). If z = x + y, then the density function for z is expressed by the convolution integral
( ) ( ) ( )∫∞
∞−
−= dxxzpxpzp yxz (A.3.2)
Similarly, if
yxz = (A.3.3) then
( ) ( )∫∞
∞−
= dxxx
zpxpzp yxz
1 (A.3.4)
(with any ambiguity at x = 0 handled by limit operations from both sides in the obvious way). More generally, let
( )yxfz ,= (A.3.5) where, for any specific values of z and x, y has a specific value denoted by
( );,1 xzfy −= (A.3.6) that is
( )( )[ ]xzfxfz ,, 1−≡ (A.3.7) Then
( ) ( ) ( )[ ] ( )∫−−
∂∂= dxxzfz
xzfpxpzp yxz ,, 11 (A.3.8)
which may be thought of as a more general form of convolution. Again, there are obvious further generalizations possible but this is sufficient for our purposes. In real life applied work, we rarely have the luxury of dealing with analytic forms and even in those rare cases may be unable to perform the integrations [Equation (A.3.8)] analytically. We are therefore led to seek approximate procedures. 3 The content here is an excerpt of Section A.3.1 from “Appendix A. PRA Methodology Detail” [47].
The equation numbers cited here correspond to the equation number from this reference

100
References
[1] U.S. Department of Energy. 2006. Material Control and Accountability, DOE M
470.4-6. Washington DC: U.S. Department of Energy. [2] Venkatesh, S., and C. Key. 2009. “A Self-Assessment of the Material Control and
Accountability Implementation Function by National Nuclear Security Administration Headquarters (NNSA-HQ) Program Organization,” in Proceedings of the 50th Annual Meeting of the Institute for Nuclear Materials Management. Deerfield IL: Institute of Nuclear Materials Management.
[3] U.S. Department of Energy. 2005. Personnel Security, DOE M 470.4-5.
Washington DC: U.S. Department of Energy. [4] U.S. Department of Energy. 2009. Information Security, DOE M 470.4-4A.
Washington DC: U.S. Department of Energy. [5] Morzinski, J., and P. Dawson. 2000. “Designing Safeguards Performance
Analysis to Determine and Validate Detection Probabilities, “Proceedings of the 41st Annual Meeting of the Institute for Nuclear Materials Management. Deerfield IL: Institute of Nuclear Materials Management.
[6] Dawson, P.G., and P. Hester, 2006. “Real-Time Effectiveness Approach to
Protecting Nuclear Materials,” Proceedings of the 47th Annual Meeting of the Institute for Nuclear Materials Management. Deerfield IL: Institute of Nuclear Materials Management.
[7] Dawson, P.G., P. Hester, T. Suski, and C. Williams. 2007. Real-Time
Effectiveness Approach to Protecting Nuclear Materials, LCP SNL-1709, Unclassified Controlled Nuclear Information. Albuquerque NM: Sandia National Laboratories.
[8] Sandia National Laboratories. 2005. Department of Energy Office of Security and
Safety Performance Assurance, Technology Transfer Manual, Vulnerability Assessment, SAND05-3929P, Unclassified Controlled Nuclear Information. Albuquerque NM: Sandia National Laboratories.
[9] International Atomic Energy Agency (IAEA). 1999. The Physical Protection of
Nuclear Materials and Nuclear Facilities, IAEA-INFCIRC/225/Rev. 4 (Corrected). Vienna: IAEA.
[10] U.S. Dept. of the Army. 2001. Physical Security, Report FM 3-19.30.

101
[11] IAEA, 2002. Handbook on the physical protection of nuclear materials and facilities, IAEA-TECDOC-1276, Official Use Only. Vienna: IAEA.
[12] Jaeger, C.D. 2002, “Risk Assessment Methodology for Chemical Facilities,” in
Probabilistic Safety Assessment and Management PSAM6, E. J. Bonano, A. L. Camp, M. J. Majors, and R. A. Thompson (eds.), pp. 1471-1476. Oxford: Elsevier Science Ltd.
[13] Bashurov, V V., V.O., Filimonenkov, A.A. Yaroslavtsev, and Y.I. Churikov.
2004. “Evaluation of Risk of Security Failure of a Protected Object,” Journal of Nuclear Materials Management, Vol. XXXIII, No. 1, pp. 31-35. Deerfield IL: Institute of Nuclear Materials Management.
[14] Kim, C., S. Kwak, and C-H. Chung. 2005. “A Simulation Methodology for the
Evaluation of the Physical Protection Systems in Nuclear Power Plants,” Transactions, Vol. 93, pp. 320-321. Lagrange Park IL: American Nuclear Society.
[15] Whitehead, D.W., C.S. Potter, and S.L. O’Connor. 2007. Nuclear Power Plant
Security Assessment Technical Manual, SAND2007-5591. Albuquerque NM: Sandia National Laboratories.
[16] U.S. Department of Energy. 2005. “Safeguards and Security Program
References,” DOE M 470.4-1.Washington DC: U.S. Department of Energy. [17] Garcia, M.L. 2008. The Design and Evaluation of Physical Protection Systems
Second Edition, Boston: Butterworth-Heinemann. [18] Garcia, M.L. 2005. Vulnerability Assessment of Physical Protection Systems.
Boston: Elsevier Butterworth-Heinemann. [19] Cipiti, B.B. 2009. “Virtual Safeguards Testing for Process Monitoring and
Advanced Materials Accountancy,” in Proceedings of the 50th Annual Meeting of the Institute for Nuclear Materials Management. Deerfield IL: Institute of Nuclear Materials Management.
[20] Poorbaugh, J. 2009. “Comprehensive Analysis of Safeguards Strategies
(COMPASS) as a Program Effectiveness Indicator,” in Proceedings of the 50th Annual Meeting of the Institute for Nuclear Materials Management. Deerfield IL: Institute of Nuclear Materials Management.
[21] Whitworth, A. 2009. “Safeguards First Principles Initiative (SFPI),” in
Proceedings of the 50th Annual Meeting of the Institute for Nuclear Materials Management. Deerfield IL: Institute of Nuclear Materials Management.

102
[22] Johnson, G. 2008. “Criteria for Determination of MC&A System Effectiveness,” in Proceedings of the 49th Annual Meeting of the Institute for Nuclear Materials Management. Deerfield IL: Institute of Nuclear Materials Management.
[23] Cipiti, B.B., P.E. Rexroth, and N.L. Ricker. 2007, Safeguards Performance
Modeling of a UREX+1a Reprocessing Plant, SAND2007-6586. Albuquerque NM: Sandia National Laboratories.
[24] Parker, R. 2007. Inventory of Safeguards Software, LA-UR-07-6991. Los Alamos
NM: Los Alamos National Laboratory. [25] Hines, J.W., and J. Bowling. 2004. “An Expert System for Long-Term
Monitoring of Special Nuclear Materials,” Journal of Nuclear Materials Management, Vol. XXXIII, No. 4, pp. 13-21. Deerfield IL: Institute of Nuclear Materials Management.
[26] Raeder, C.R., D. Farmer, H. Burns, B. Trivett, and L. Bowers. 2004. “The Local
Area Nuclear Material Accountability Software, (LANMAS),” Journal of Nuclear Materials Management, Vol. XXXIII, No. 1, pp. 55-58. Deerfield IL: Institute of Nuclear Materials Management.
[27] Janssens-Maenhout, G., and L. Dechamp. 2004. “Process Monitoring Appropriate
for Near-Real-Time Accountancy,” Journal of Nuclear Materials Management, Vol. XXXII, No. 3, pp. 10-16. Deerfield IL: Institute of Nuclear Materials Management.
[28] Waddoups, I.G., 1996, “National and International Nuclear Material Monitoring,”
presented at The 12th Annual Joint Government-Industry Security Technology Symposium & Exhibition, June-17-20, Williamsburg, VA.
[29] Jaeger, C., and I. Waddoups. 1995. “Nuclear Material Control in the United
States,” presented at the Workshop on Physical Protection, September 11-14, Moscow, Russia.
[30] Rodriguez, C. A., and I. Waddoups. 1993. “Safeguards Experience with Materials
Monitoring Systems,” Journal of Nuclear Materials Management. Deerfield IL: Institute of Nuclear Materials Management.
[31] Waddoups, I.G., and J.A. Abbott. 1993. “Material Control Evaluation,” in
Proceedings of the 34th Annual Meeting of the Institute for Nuclear Materials Management. Deerfield IL: Institute of Nuclear Materials Management.
[32] Sandia National Laboratories. 2006. Advanced Vulnerability Analysis Overview
Course, SAND2006-2096P. Albuquerque NM: Sandia National Laboratories.

103
[33] Bennett, H. A. 1977. The EASI Approach to Physical Security Evaluation, SAND76-0500. Albuquerque NM: Sandia National Laboratories.
[34] Sandia National Laboratories 1989. SAVI: Systematic Analysis of Vulnerability
to Intrusion, Vol. 1 and 2, SAND89-0926. Albuquerque NM: Sandia National Laboratories.
[35] ASSESS (Analytical System and Software for Evaluating Safeguards and
Security), Version 2.56, Copyright 1989-2003. Livermore CA: Lawrence Livermore National Laboratory.
[36] ATLAS (Adversary Time-Line Analysis System) Software, Version 4.2. Build
171, developed at Sandia National Laboratories for the U.S. Department of Energy.
[37] Mullen, S. A., J.J. Davidson, and H.B. Jones, Jr. 1980. Potential Threat to
Licensed Nuclear Activities from Insiders (Insider Study), NUREG-0703. Washington DC: U.S. Nuclear Regulatory Commission.
[38] Sutton, R H. 1983. Insider Adversary Study for the Office of Safeguards and
Security, U.S. Department of Energy, Final Report, IEAL-294. Washington DC: International Energy Associates Limited.
[39] Hoffman, B., C. Meyer, B. Schwarz, and J. Duncan. 1990. Insider Crime: The
Threat to Nuclear Facilities and Programs, R-3782-DOE, prepared for the U.S. Department of Energy. Santa Monica, CA: RAND Corporation.
[40] Brackney, R.C., and R.H. Anderson. 2004. Understanding the Insider Threat,
Proceedings of a March 2004 Workshop. Santa Monica, CA: RAND Corporation.
[41] U.S. Department of Defense. 2000. DoD Insider Threat Mitigation, Final Report
of the Insider Threat Integrated Process Team. [42] Goodwin, K.E., J.C. Schleter, and M.D.K. Maltese. 1978. Diversion Path
Analysis Handbook, HCP/D6010-01/1. Washington DC: U.S. Department of Energy.
[43] Boozer, D.D., and D. Engi. 1977. Insider Safeguards Effectiveness Model
(ISEM) Users Guide, SAND77-0043. Albuquerque NM: Sandia National Laboratories.
[44] Lawrence Livermore National Laboratory. 1984. Safeguards Evaluation Method –
Insider Threat, UCID-20145, Rev. 2. Livermore CA: University of California.

104
[45] U.S. Nuclear Regulatory Commission. 1975. Reactor Safety Study – An Assessment of Accident Risks in U.S. Commercial Nuclear Power Plants, WASH-1400 (NUREG-75/014). Washington DC: U.S. Nuclear Regulatory Commission.
[46] Breeding, R.J., J.C. Helton, E.D. Gorham, and F.T. Harper. 1992. “Summary
Description of the Methods Using in the Probabilistic Risk Assessment for NUREG-1150,” Nuclear Engineering and Design 135, pp. 1-27. Amsterdam: North Holland.
[47] Houston Lighting and Power Company. 1989. South Texas Project Probabilistic
Safety Assessment, PLG-0675. Houston TX: Houston Lighting and Power Company.
[48] U.S. Nuclear Regulatory Commission. 1995. “Use of Probabilistic Risk
Assessment Methods in Nuclear Activities: Final Policy Statement,” Federal Register, Vol. 60, p. 42622, August 16.
[49] Jaeger, C.D. 2002. “Risk Assessment Methodology for Chemical Facilities,” in
Probabilistic Safety Assessment and Management PSAM6, E. J. Bonano, A. L. Camp, M. J. Majors, and R. A. Thompson (eds.), pp. 1471-1476. Oxford: Elsevier Science Ltd.
[50] Lockheed Martin Missiles & Space. 1997. GPHS-RTGs in Support of the Cassini
Mission Final Safety Analysis Report (FSAR). Philadelphia PA: Lockheed Martin.
[51] Miller, D. and J. Forester. 2000. Aviation Safety Human Reliability Analysis
Method (ASHRAM), SAND2000-2955. Albuquerque NM: Sandia National Laboratories.
[52] Wheeler, T.A., K. Gawande, K. and S. Bespalko. 1997. “Development of Risk-
Based Ranking Measures of Effectiveness for the United States Coast Guard’s Vessel Inspection Program,” Risk Analysis, Vol. 17, No. 3. Society for Risk Analysis.
[53] Yue, M., L. Cheng, and R. Bari. 2005. Application of Probabilistic Methods to Proliferation Resistance: Misuse, Diversion, and Abrogation Scenarios. Upton NY: Brookhaven National Laboratory.
[54] Yue, M., L. Cheng, I. Papazoglou, M. Azarm, and R. A. Bari. 2005. “Calculations of Proliferation Resistance for Generation III Nuclear Energy Systems,” Proceedings of Global 2005 International Conference on Nuclear Energy System for Future Generation and Global Sustainability, Tsukuba Japan.
105
[55] Yue, M., L. Cheng, and R. A. Bari. 2008. “A Markov Model Approach to Proliferation-Resistance Assessment of Nuclear Energy Systems,” Nuclear Technology, Vol. 162, pp. 26-44.
[56] Yue, M., L. Cheng, and R. A. Bari. 2009. “Relative Proliferation Risks for Different Fuel Cycle Arrangements,” Nuclear Technology, Vol. 165, pp. 1-17.
[57] “Evaluation Methodology for Proliferation Resistance and Physical Protection of Generation IV Nuclear Energy Systems.” 2006. Proliferation Resistance and Physical Protection Evaluation Method Experts Group, available on the Internet at http://www.gen-4.org/Technology/horizontal/PRPPEM.pdf.
[58] Sviridov, A.S., A.A. Petrov, I.N. Sazonov ,V.V. Erastov, A.V. Stepashko, A.A.
Voronkov, B. Jensen, R. Elwood, L. Neymotin, and C. Roche. 2009. “Application of MSET Method for Assessing Effectiveness of the Material Control & Accounting System at a Nuclear Facility,” in Proceedings of the 50th Annual Meeting of the Institute for Nuclear Materials Management. Deerfield IL: Institute of Nuclear Materials Management.
[59] Elwood, R., R. Brown, B.J. Campbell, C. Duncan, G.M. Fuller, G. Hammond, D.
Hyde, B. Jensen, E. Owings, W. Brunsdon, M. Fontana, W. Kenna, G. Klopp, L. Neymotin, and C. Roche. 2008. “Benchmarking MSET: A Progress Report On The MC&A System Effectiveness Tool,” in Proceedings of the 49th Annual Meeting of the Institute for Nuclear Materials Management. Deerfield IL: Institute of Nuclear Materials Management.
[60] Meppen, B., T. Bean, R. Haga, K. Moedl, J. Sanders, M.A. Thom. 2008.
“Validation of Nuclear Material Control and Accountability (MC&A) System Effectiveness Tool (MSET) at Idaho National Laboratory (INL),” in Proceedings of the 49th Annual Meeting of the Institute for Nuclear Materials Management. Deerfield IL: Institute of Nuclear Materials Management.
[61] Elwood, R., B.J. Campbell, G.M. Fuller, G. Hammond, D. Hyde, B. Jensen, E.
Owings, W. Brunsdon, M. Fontana, W. Kenna, G. Klopp, and C. Roche. 2007. “Nuclear Material Control And Accountability (MC&A) Functional Model And MC&A System Effectiveness Tool (MSET),” in Proceedings of the 48th Annual Meeting of the Institute for Nuclear Materials Management. Deerfield IL: Institute of Nuclear Materials Management.
[62] Klopp, G.T., M. Fontana, C.T. Roche, W. Brunsdon, R.H. Elwood, B.A. Jensen,
G.M. Fuller, B.J. Campbell, Hammond, E. Owings, W. Kenna. 2007. “The Use of Probabilistic Risk Assessment Technology for Evaluating MC&A Effectiveness and Relative Risk Contributions,” in Proceedings of the 48th Annual Meeting of the Institute for Nuclear Materials Management. Deerfield IL: Institute of Nuclear Materials Management.

106
[63] Wyss, G.D., and F.A. Durán. 2001. OBEST: The Object-Based Event Scenario
Tree Methodology, SAND2001-0828. Albuquerque NM: Sandia National Laboratories.
[64] Swain III, A.D., and H.E. Guttmann. 1983. Handbook of Human Reliability
Analysis with Emphasis on Nuclear Power Plants, SAND80-0200. Albuquerque NM: Sandia National Laboratories.
[65] Barriere, M.T., J.Wreathall, S.E. Cooper, D.C. Bley, W.J. Luckas, and A. Ramey-
Smith. 1995. Multidisciplinary Framework for Human Reliability Analysis with an Application to Errors of Commission and Dependencies, NUREG/CR-6526. Washington DC: U.S. Nuclear Regulatory Commission.
[66] Cooper, S.E., A.M. Ramey-Smith, J. Wreathall, G.W. Parry, D.C. Bley, W.J.
Luckas, J.H. Taylor, and M.T. Barriere. 1996. A Technique for Human Error Analysis (ATHEANA), NUREG/CR-6350. Washington DC: U.S. Nuclear Regulatory Commission.

107
Vita
Felicia Angelica Durán is a nuclear engineer in the Security Systems Analysis
Department at Sandia National Laboratories (Sandia) in Albuquerque, New Mexico. She
joined Sandia in September 1995 and was promoted to Principal Member of Technical
Staff in August 2002. Felicia is a member of the Institute of Nuclear Materials
Management (INMM), serves as Associated Editor for Physical Protection of the Journal
of Nuclear Materials Management, and is on the Executive Committee of the Southwest
Chapter of INMM. She earned her Masters Degree in Nuclear Engineering in December
1995 from The University of New Mexico (UNM) and was inducted into the UNM
chapter of Tau Beta Pi, the National Engineering Honor Society. In May 1985, she
received her Bachelors Degree in Materials Science and Engineering from the
Massachusetts Institute of Technology (MIT), where she was an active student leader,
president of the Hispanic student group, a Charter Member of Alpha Phi (the first sorority
at MIT) and an officer of the Intrafraternity Council, among other activities. She was
awarded the MIT Karl Taylor Compton Award in 1985 for outstanding sustained
community contribution.
Felicia has more than 20 years of professional experience supporting technical
research programs for the U.S. Nuclear Regulatory Commission (NRC) and the U.S.
Department of Energy (DOE). Most recent technical areas of experience include:
integrated safeguards and security; security systems analysis; insider threat analysis;
systems reliability and risk analysis; risk-informed regulation; methodology and software
development for (1) nuclear reactor equipment condition monitoring and reliability, (2)
object-based risk analysis methods with applications to aviation safety, and (3) dose
modeling for decontamination and decommissioning; and technical project management.

108
Other areas of experience include Level 2 probabilistic risk analysis (PRA) for boiling
water reactors; environmental decision support; conceptual model development and
treatment of uncertainty for performance assessment of waste management sites; expert
judgement elicitation; regulatory compliance integration; waste management program
support; geologic repository technology; nuclear waste transportation systems;
emergency response training; and arms treaty verification.
She was born in Cuba, New Mexico, the oldest of four children. Her father was a
coach with Cuba Schools and a coach, educator and middle school counselor with
Albuquerque Public Schools in New Mexico. Her mother was a secretary for the Cuba
Schools Superintendent, and for Longfellow, Mountain View and Dolores Gonzales
Elementary Schools in Albuquerque. Felicia attended Armijo Elementary School and
Ernie Pyle Middle School, and graduated Valedictorian of her class from Rio Grande
High School in Albuquerque. She is the mother of a 14-year old daughter. Felicia has
coached and plays soccer, and is an active community volunteer. She plays racquetball
and has served on the local organizing committee for the World Senior Racquetball
Championships since 1988. In 2003, she was one of four women nominated by Sandia
for the Outstanding Women of Color in Research and Technology Awards; as one of the
first 40 women to receive Emerald Honors, she was honored for Professional
Achievement. In 2005, she received one of the Mayor Martin Chavez’s first Move Up
awards in recognition for her volunteer service in Albuquerque.
Permanent address: 11501 Paseo del Oso NE, Albuquerque, NM 87111
This dissertation was typed by the author.