Embed Size (px)
Citation preview

Nutrient Digestibility, Growth Performance, and Carcass Characteristics of Broilers
Fed Diets Formulated with Low Oligosaccharide Soybean Meals
by
Kurt Richard Perryman
A thesis submitted to the Graduate Faculty of
Auburn University
in partial fulfillment of the
requirements for the Degree of
Master of Science
Auburn, Alabama
August 4, 2012
Keywords: soybean meal, oligosaccharide, apparent metabolizable energy, amino acid
digestibility, broiler
Copyright 2012 by Kurt Richard Perryman
Approved by
William A. Dozier, III, Chair, Associate Professor of Poultry Science
Joseph B. Hess, Professor of Poultry Science
Wallace D. Berry, Associate Professor of Poultry Science

ii
ABSTRACT
The objective of this research was to evaluate nutrient digestibility, growth performance,
and processing yields of Ross × Ross 708 male broilers fed diets formulated with low
oligosaccharide soybean meal (LOSBM) and ultra-low oligosaccharide soybean meal (ULSBM).
Experiments 1 through 4 determined the AMEn and digestible amino acid (AA) composition of a
control soybean meal (CSBM), LOSBM, and ULSBM from 27 to 31 d of age. In experiments 1
and 3, LOSBM had increased (P = 0.011) AMEn and higher (P = 0.002) digestible AA
concentrations compared with CSBM. Experiments 2 and 4 were expanded to evaluate ULSBM.
Low oligosaccharide SBM had greater (P = 0.012) AMEn compared with CSBM and ULSBM.
Both LOSBM and ULSBM had higher (P < 0.001) digestible AA concentrations compared with
CSBM, while ULSBM had greater (P < 0.05) concentrations of digestible AA compared with
LOSBM. Experiments 5 and 6 evaluated feeding diets formulated with CSBM, LOSBM, or
ULSBM during a 6 wk production period using nutrient values determined in experiments 1
through 4. In experiment 5, broilers fed diets containing LOSBM or CSBM had similar growth
and carcass characteristics. Dietary fat inclusions were reduced over 50% in all feeding phases in
diets formulated with LOSBM. In experiment 6, diets were formulated with CSBM, LOSBM, or
ULSBM and moderate or reduced (-25 kcal of AMEn/kg) energy concentrations. No negative
effects on growth performance or carcass characteristics were observed for broilers fed diets
formulated with the 3 SBM types or moderate or reduced energy concentrations. Diets formulated
with LOSBM and ULSBM contained up to 70% less supplemental fat compared with CSBM-
based diets. Formulating diets using LOSBM and ULSBM compared with CSBM reduced the

iii
amount of supplemental fat inclusion with no adverse effects on broiler performance and
processing yields.

iv
ACKNOWLEDGEMENTS
I would like to express my sincere appreciation to Dr. Bill Dozier for sharing his
extensive knowledge of the poultry industry and for being an excellent mentor. I would like to
thank my graduate committee, Drs. Joe Hess and Wallace Berry for their assistance and support. I
would also like to extend appreciation to Schillinger Genetics for providing the experimental
soybean meals and the United Soybean Board for funding this research.
This research would not have been possible without the efforts of Dr. Dozier’s entire lab
group, consisting of Leslie Speegle, Matilda Bryant, Curran Gehring, Sam Rochell, Kate
Meloche, Laura Thomas, and Andy Goldman. All of these individuals were instrumental in
helping me obtain my Masters degree. I would also like to thank Drs. James Usry and Paul
Tillman who were the first to encourage me to enroll in graduate school and their continued
assistance and valuable advice.
Most importantly, I would like to offer my dearest thanks to my friends and family.
Without the continued support and encouragement of my parents Kim and Kevin Perryman or my
fiancée Tara Leaderbrand, this work would not have been possible.

v
TABLE OF CONTENTS
ABSTRACT ..................................................................................................................................... ii
ACKNOWLEDGEMENTS ............................................................................................................... iii
LIST OF TABLES .......................................................................................................................... vii
LIST OF FIGURES .......................................................................................................................... ix
I. INTRODUCTION ...........................................................................................................................1
II. LITERATURE REVIEW ...............................................................................................................3
SUPPLY AND DEMAND OF FAT.................................................................................................3
FACTORS INFLUENCING METABOLIZABLE ENERGY OF SOYBEAN MEAL .........................4
SOYBEAN MEAL CARBOHYDRATE COMPOSITION ................................................................5
REDUCTION OF GALACTOOLIGOSACCHARIDES OF SOYBEAN MEAL ................................9
REFERENCES.............................................................................................................................12
III. APPARENT METABOLIZABLE ENERGY AND APPARENT ILEAL AMINO ACID
DIGESTIBILITY OF LOW AND ULTRA-LOW OLIGOSACCHARIDE SOYBEAN
MEAL FED TO BROILER CHICKENS ................................................................................20
ABSTRACT ................................................................................................................................20
INTRODUCTION ........................................................................................................................21
MATERIALS AND METHODS ...................................................................................................22
RESULTS AND DISCUSSION ....................................................................................................27

vi
REFERENCES.............................................................................................................................31
IV. GROWTH PERFORMANCE AND MEAT YIELDS OF BROIER CHICKENS FED DIETS
CONTAINING LOW AND ULTRA-LOW OLIGOSACCHARIDE SOYBEAN MEALS
DURING A SIX WEEK PRODUCTION PERIOD .................................................................42
ABSTRACT ................................................................................................................................42
INTRODUCTION ........................................................................................................................43
MATERIALS AND METHODS ...................................................................................................44
RESULTS AND DISCUSSION ....................................................................................................50
ACKNOWLEDGEMENTS ...........................................................................................................56
REFERENCES.............................................................................................................................57
V. CONCLUSIONS .........................................................................................................................74

vii
LIST OF TABLES
Table 3.1 Ingredient and calculated nutrient composition of the basal diets fed from 20 to 29 d of
age for AMEn determination ................................................................................................................... 36
Table 3.2 Ingredient composition of semi-purified diets fed from 26 to 31 d of age to determine
apparent ileal amino acid digestibility of a control, low oligosaccharide, and ultra-low
oligosaccharide soybean meal fed to broiler chickens ............................................................................. 37
Table 3.3 Physical and chemical characteristic of control, low oligosaccharide, and ultra-low
oligosaccharide soybean meals on an as-is basis ...................................................................................... 38
Table 3.4 Apparent ileal amino acid digestibility coefficients and concentrations of digestible
amino acids of control and low-oligosaccharide soybean meals .............................................................. 39
Table 3.5 Apparent ileal amino acid digestibility coefficients and concentrations of digestible
amino acids of control, low-oligosaccharide, and ultra-low oligosaccharide soybean meals .................... 40
Table 4.1 Physical and chemical characteristic of control , low oligosaccharide, and ultra-low
oligosaccharide soybean meals on an as-is basis ...................................................................................... 63
Table 4.2 Apparent metabolizable energy and total concentrations of digestible amino acids for
the first 5 limiting amino acids in Ross × Ross 708 male broilers for control soybean meal, low
oligosaccharide soybean meal, and ultra-low oligosaccharide soybean meal fed to growing
broilers used in diet formulations ............................................................................................................. 64
Table 4.3 Ingredient and calculated composition of diets formulated with control soybean meal or
low oligosaccharide soybean meal fed to Ross × Ross 708 male broilers from 1 to 40 d of age ............. 65
Table 4.4 Ingredient and calculated composition of diets formulated with moderate or reduced
AMEn concentrations and either control soybean meal, low oligosaccharide soybean meal, or
ultra-low oligosaccharide soybean meal fed to Ross × Ross 708 male broilers from 1 to 14 d of
age............................................................................................................................................................. 66

viii
Table 4.5 Ingredient and calculated composition of diets formulated with moderate or reduced
AMEn concentrations and either control soybean meal, low-oligosaccharide soybean meal, or
ultra-low oligosaccharide soybean meal fed to Ross × Ross 708 male broilers from 15 to 28 d of
age ............................................................................................................................................................ 67
Table 4.6 Ingredient and calculated composition of diets formulated with moderate or reduced
AMEn concentrations and either control soybean meal, low-oligosaccharide soybean meal, or
ultra-low oligosaccharide soybean meal fed to Ross × Ross 708 male broilers from 29 to 42 d of
age ............................................................................................................................................................ 68
Table 4.7 Growth performance of Ross × Ross 708 male broilers fed control soybean meal or low
oligosaccharide soybean meal diets from 1 to 40 d of age ....................................................................... 69
Table 4.8 Growth performance of Ross × Ross 708 male broilers fed control soybean meal, low
oligosaccharide soybean meal, or ultra-low oligosaccharide soybean meal diets with moderate or
reduced levels of AMEn during a 42 d production period ........................................................................ 70
Table 4.9 Processing characteristics of Ross × Ross 708 broilers fed diets containing control or
low oligosaccharide soybean meal at 40 d of age ..................................................................................... 71
Table 4.10 Processing characteristics of Ross × Ross 708 broilers fed control, low
oligosaccharide, or ultra-low oligosaccharide soybean meal based diets with either moderate or
reduced AMEn concentrations at 42 d of age ............................................................................................ 72

ix
LIST OF FIGURES
Figure 3.1 Apparent MEn of low oligosaccharide soybean meals fed to Ross × Ross 708 broilers.
A) Apparent MEn of a control and low oligosaccharide SBM determined in experiment 1. B)
Apparent MEn of control, low oligosaccharide, and ultra-low oligosaccharide SBM determined in
experiment 2. The soybean meals were fed as part of a complete diet from 20 to 29 d of age for
both experiments. Apparent MEn of soybean meals were determined using the substitution
method developed by Sibbald and Slinger (1963). Least square means were separated using
Tukey’s Honestly Significant Difference Multiple Comparison Test ...................................................... 41
Figure 4.1 Incidence of pododermatitis in Ross × Ross male broilers fed diets containing a
control, low oligosaccharide, or ultra-low oligosaccharide soybean meal at 42 d of age. Birds
were evaluated for pododermatitis by assigning a score of 0, 1, or 2 based on the severity of
footpad lesions via the method describe by Nagaraj et al. (2007). Values represent least-square
means of 20 replications per treatment, with each pen having 25 broilers at 1 d of age. Means not
sharing a common superscript differ by (P ≤ 0.05) . ................................................................................ 73

1
I. INTRODUCTION
Dietary energy sources represent a significant portion of diet costs in the poultry industry
(Donohue and Cunningham, 2009). Due to government mandates for the use of renewable fuels,
like biodiesel, the cost of energy-providing ingredients have increased dramatically over the past
decade (Donohue and Cunningham, 2009). Demand and prices for fat/oil are predicted to remain
high, creating further financial strain for the poultry industry. As a result, it is of upmost
importance for nutritionists to maximize the energy utilization of the primary ingredients in
poultry diets in order to reduce dependence on supplemental fat. Increasing energy utilization of
primary ingredients instead of relying on energy provided by supplemental fat to meet dietary
energy recommendations can translate to lower dietary costs.
While the gross energy of soybean meal (SBM) is greater than corn, poultry metabolize
28% less energy from SBM compared with corn (NRC, 1994, 1998). Poor energy utilization of
SBM is related to its carbohydrate fraction (Choct et al., 2010). The carbohydrate fraction of
SBM is variable, and is composed of approximately 10% free sugars and 20 to 30% non-starch
polysaccharides (Choct et al., 2010). Both the galactooligosaccharides and non-starch
polysaccharides contain carbohydrates that are poorly digested by poultry (Choct et al., 2010).
The free sugar segment consists of 5% sucrose, and 5% galactooligosaccharides (4% stachyose
and 1% raffinose) on an as-is basis (Bach Knudsen, 1997; Grieshop et al., 2003). While sucrose is
highly digestible, raffinose and stachyose have been reported to have ileal digestibilities of less
than 1% in poultry (Coon et al., 1990). These small molecular weight galactooligosaccharides
(GAL) cannot be digested and absorbed due to monogastric animals lacking endogenous α-1,6
galactosidase activity (Gitzelmann and Auricchio, 1965; Cristofaro et al., 1974). Furthermore,

2
stachyose and raffinose have been reported to act as anti-nutritional factors when fed to poultry.
Researchers have reported poor performance in broilers fed raffinose and stachyose, which was
attributed to increased osmotic pressure in the lumen. Increased osmotic pressure decreased
transit time and diluted digestive enzymes and substrates in poultry (Irish and Balnave, 1993;
Leske et al., 1993).
Previous research has reported that removal of raffinose and stachyose from SBM can
increase the energy utilization of SBM by broilers (Coon et al., 1990; Leske and Coon, 1999;
Parsons et al., 2000). Several strategies have been implemented to ameliorate the adverse effects
of raffinose and stachyose on nutrient utilization, which include ethanol extraction of SBM,
galactosidase supplementation, and developing new varieties of low galactooligosaccharide SBM.
However, results showing increased energy utilization of low GAL SBM by poultry utilizing
either of the 3 strategies have been inconsistent (Irish et al., 1995; Kidd et al., 2001; Baker et al.,
2011).
Soybean meals stemming from novel genetic varieties of soybeans have been developed
to contain either a 75% (low oligosaccharide SBM [LOSBM]) or 90% (ultra-low oligosaccharide
SBM [ULSBM]) reduction in GAL concentrations. Research is limited on the nutrient
digestibility of these SBM types, specifically AMEn and AA digestibility. Therefore, the
proposed research determined the AMEn and AA digestibility of LOSBM and ULSBM compared
with a control SBM over 4 experiments. Then, using the AMEn and digestible AA concentrations
determined in the first 4 experiments, 2 growth experiments were conducted emulating
commercial conditions. These experiments assessed growth performance, carcass yields, and
physiological variables of broilers consuming diets formulated with LOSBM or ULSBM
compared with a control SBM.

3
II. LITERATURE REVIEW
SUPPLY AND DEMAND OF FAT
Fat is an excellent source of energy and linoleic acid for poultry (Leeson and Summers,
2001). Dietary fat supplementation has been reported to decrease feed conversion in broilers
(Hidalgo et al., 2004, Dozier et al., 2006, 2011). The benefit of fat may be related to a lower heat
increment following absorption and during metabolism (Leeson and Summers, 2001) and a
slower rate of feed passage (Mateos et al., 1982). Diets fed to broilers typically contain added fat
from 1 to 3% with inclusion concentrations varying with the phase of production.
In addition to their use in livestock and poultry diets, animal fats and vegetable oils are
being utilized as inputs for biodiesel production. Rising petroleum costs and the Renewable Fuel
Mandate have led to a dramatic increase in biodiesel production since 2000 (National Biodiesel
Board, 2012). The United States produced over 4.2 billion liters of biodiesel in 2011(National
Biodiesel Board, 2012), resulting in increased demand for animal fats and vegetable oils. As a
result, the price of poultry oil has increased from $0.25 to $1.00 per kg during the past 7 yr, and
prices may continue to increase with demand for animal fat and vegetable oils (Donohue and
Cunningham, 2009).
The majority of the energy in poultry diets is provided by cereal grains and oilseed meals
with supplemental fat added to meet the desired energy density of the diet. Energy utilization of
corn is relatively high, but gross energy (GE) of SBM is poorly utilized by poultry (Hill et al.,
1960). By increasing the energy utilization of SBM in poultry, less supplemental fat could be
used in dietary formulations, translating into lower dietary costs.

4
FACTORS INFLUCING METABOLIZABLE ENERGY OF SOYBEAN MEAL
Gross energy of SBM is greater than in corn, but it has 42% less metabolizable energy
(ME) (Hill et al., 1960; Sibbald and Slinger, 1962). These differences in ME can be attributed to
the differences in nutrient composition between corn and SBM. Annison and Choct (1993)
reported that carbohydrates are more complex in SBM than cereal grains. The carbohydrate
fraction of corn is primarily composed of starch, while the carbohydrate fraction of SBM contains
variable concentrations of non-starch polysaccharides (NSP) and poorly digested sugars (Potter
and Potchanakorn, 1985). Variability in the carbohydrate fraction of SBM can occur depending
on soybean variety, agronomic conditions, and processing techniques (Grieshop et al., 2003;
Karr-Lilienthal et al., 2005). Moreover, differences in the ratio of starch and sugars to dietary
fiber can have a pronounced effect on the nutritive value of the carbohydrate fraction and affect
nutrient digestibility of various feed ingredients (Pettersson and Lindberg, 1996).
Differences in the ME of SBM have also been reported between species. National
Research Council (1994, 1998) published values for ME of SBM for poultry as 2,440 kcal of
ME/kg, while the value for swine approximates 3,380 kcal ME/kg. Energy utilization of SBM in
poultry is 27% lower compared with pigs due to anatomical differences between animals. Poultry
have 2 large ceca and a short colon, while swine have a single short cecum and a long colon
(Moran, 1982). The larger hind gut of the pig provides a greater fermentative capacity due to an
increased microflora population. The larger microflora population metabolizes indigestible SBM
carbohydrates more efficiently. Furthermore, the greater length of the porcine alimentary tract
allows for more complete SBM carbohydrate digestion compared with poultry due to increased
retention time (Choct and Cadogan, 2001). This fermentative process converts relatively
indigestible carbohydrates into short chained fatty acids, which can supply a source of energy in
swine (Bach Knudsen and Hansen, 1991; Carré and Chagneau, 1995).

5
SOYBEAN MEAL CARBOHYDRATE COMPOSITION
Soybean meal is considered the ―gold standard‖ protein source for monogastric animals
(Cromwell, 1999). While SBM is primarily used as a protein source because of a favorable amino
acid (AA) profile, SBM contains high concentrations of both protein and carbohydrates (Potter
and Potchanakorn, 1985). Once soybeans have been processed into meal, the resulting dehulled
SBM is typically 48% crude protein, 35% carbohydrates, 10% water, 5% minerals, 1% oil, and
<1% other (Choct et al., 2010). Published research has reported high (85 to 95%) digestibility
values for the protein fraction of SBM fed to chickens (Ivy et al., 1971; Parsons et al., 1981), but
studies are limited on evaluating the digestibility of the carbohydrate fraction of SBM in poultry.
Carbohydrate digestibility of SBM has been reported at 35% in rats (Karimzadegan et al., 1979),
61% in turkeys (Potter and Potchanakorn, 1985), and 40% in broiler chicks (Lodhi et al., 1969).
A possible explanation for the low digestibility is the complex nature of SBM carbohydrates
(Annison and Choct, 1993). The carbohydrate fraction of SBM is composed of approximately 20
to 30% non-starch polysaccharides (NSP) (Choct, 1997) and 10% free sugars, including
oligosaccharides (Macrae et al., 1993).
Non-Starch Polysaccharides
Non-starch polysaccharides in SBM are a variable mixture of approximately 8% cellulose
and 17% pectic polysaccharides such as type I and II rhamnogalacturonans, arabinogalactan I,
and xylogalacturonan (Fransen, 1999). Due to the complexity of SBM carbohydrates,
fermentative capacity and gastrointestinal tract adaptation are the primary factors influencing
NSP digestibility in monogastric animals (Choct et al., 2010). Pectic polysaccharides are highly
complex carbohydrates, which are partially water soluble, whereas cellulose is insoluble and has
limited digestibility in poultry (Carré et al., 1990; Smits and Annison, 1996). Insoluble NSP are
partially resistant to microbial fermentation, while soluble NSP can be metabolized by

6
gastrointestinal microflora producing short chain fatty acids. These short chain fatty acids are
absorbed and utilized by poultry for energy (Carré and Chagneau, 1995). However, due to the
limited fermentative capacity of the chicken, the contribution of short chain fatty acids to the ME
of the bird is limited to 2 to 3% of total dietary ME (Jørgensen et al., 1996). In swine, ME
provided through microbial fermentation of complex carbohydrates can provide up to 24% of
dietary ME (Bach Knudsen and Hansen, 1991), however, net efficiency of energy utilization of
complex carbohydrate fermentation is low (Yen et al., 1991).
Researchers have also suggested that NSP may lead to decreased digestibility of other
nutrients (Antoniou et al., 1981; Choct and Annison, 1990). Soluble NSP are able to bind water in
the lumen of the small intestine, which increases the viscosity of the digesta, leading to changes
in the physiology and microbial ecosystem of the alimentary tract (Angkanaporn et al., 1994). A
more viscous digesta transits more slowly through the gastrointestinal tract and can lead to lower
O2 concentrations, providing a favorable environment for the establishment of fermentative
bacteria (Wagner and Thomas, 1978). This finding was supported by researchers who reported an
increase in microbial fermentation in the small intestine when soluble soy NSP were added to
broiler diets (Choct et al., 1996). Furthermore, viscous digesta stemming from large
concentrations of dietary NSP has been attributed to increased losses of endogenous nutrients in
broilers.
Angkanaporn et al. (1994) reported increased endogenous losses of protein, including
digestive enzymes and AA, in roosters precision fed diets high in soluble NSP. Viscous digesta
caused by high dietary NSP concentrations have been reported to increase bile acid secretion and
loss of endogenous products in the feces of rats (Ide et al., 1989). Furthermore, it has been
reported that NSP can bind bile salts, lipids, and cholesterol leading to further nutrient losses in
the excreta (Vahouny et al., 1981). Sequestration and increased fecal loss of enzymes, bile acids,
lipids, and cholesterol could lead to major changes in the digestive and absorptive dynamics of

7
the alimentary tract with poor overall efficiency of nutrient absorption as a consequence (Choct et
al., 2010).
Free Sugars and Galactooligosaccharides
The free sugar component of the carbohydrate fraction of SBM is composed of about 5%
sucrose and 6% galactooligosaccharides (GAL) (5% stachyose and 1% raffinose) (Kuriyama and
Mendel, 1917; Bach Knudsen, 1997; Grieshop et al., 2003). Sucrose is highly digestible when
consumed by poultry, while GAL have poor digestibility (Waldroup et al., 2006). Concentrations
of the carbohydrates of SBM, specifically raffinose and stachyose, have been reported to vary
depending on the location where the soybeans were grown and specific soybean genotype
(Greishop et al., 2003).
Limited digestibility of GAL is related to the structure of these molecules and the lack of
endogenous enzymes in poultry necessary to hydrolyze and absorb these carbohydrates. Raffinose
is a trisaccharide with a galactose bonded to the glucose of a sucrose molecule via an α-1-6
linkage. Stachyose is a tetrasaccharide that is analogous to raffinose with an additional galactose
bonded to the galactose molecule of raffinose via an additional α-1-6 linkage (Choct et al., 2010).
Digestibility of raffinose and stachyose is low in monogastric animals because non-ruminants do
not produce α-1-6-galactosidase in the intestinal mucosa, which is necessary to hydrolyze the α-1-
6-galactosidic bonds (Gitzelmann and Auricchio, 1965). Hydrolysis of the bonds produces 2 free
galactose molecules and a sucrose molecule. If these bonds cannot be hydrolyzed, raffinose and
stachyose are unable to cross cell membranes and remain in the lumen of the gastrointestinal
tract. Coon et al. (1990) reported ileal digestibility values of raffinose and stachyose to be less
than 1% in roosters. The poor ileal digestibility of raffinose and stachyose has led researchers to
investigate the negative impact of undigested GAL present in the lumen of the small intestine on
nutrient digestibility and intestinal characteristics.
8
Veldman et al. (1993) reported a 25% reduction in CP and organic matter digestibility
when pigs were fed diets containing high concentrations of raffinose and stachyose (2.8 and
15.2%, respectively). This finding was attributed to an increase in osmolality in the lumen of the
small intestine. Increased osmolality of the gastrointestinal tract can be attributed to the small
molecular weight of raffinose and stachyose, which results in water passing through the
permeable epithelial cells into the lumen. A higher volume of water in the lumen leads to a
dilution of digestive enzymes and substrates, reducing nutrient breakdown and digestibility.
Smiricky et al. (2002) reported reduced N and AA digestibility in growing pigs corresponding
with higher concentrations of raffinose and stachyose in the diet. Furthermore, Leske et al. (1993)
reported a negative dose-dependent response (0.61 to 5.41% GAL) on TMEn when raffinose and
stachyose were added to soy protein concentrate. Poor energy utilization of GAL in poultry has
been attributed to the ability of raffinose and stachyose present in the diet to increase fluid
retention, hydrogen production, and cause diarrhea (Coon et al., 1990). Irish and Balnave (1993)
reported negative correlations of stachyose concentrations in the distal ileum with BW gain (r2 =
0.90, P < 0.05) and feed intake (r2 = 0.74, P < 0.05). Furthermore, feed conversion was positively
correlated with stachyose concentration (r2 = 0.81, P < 0.05). The poor performance was
attributed to increased osmotic pressure resulting in increased fluid retention and a faster rate of
passage resulting in poor nutrient digestibility.
Because raffinose and stachyose are primarily metabolized by microbiota in the small
intestine, GAL present in the diet may result in a prebiotic effect attributed to the growth of
beneficial microorganisms. Spring et al. (2000) reported a change in the composition of
microbiome of small intestine, indicative of a beneficial effect, when indigestible
oligosaccharides were added to poultry diets. Beneficial effects have been credited to an increase
in the number of Lactobacilli and Bifidobacteria, and a decrease in Clostridia and
Enterobaceteria due to oligosaccharide digestion (Nemcova et al., 1999). However, the overall

9
effect of changes to the microflora attributed to the presence of undigested GAL is not well
understood, and it is still generally accepted that GAL can lead to intestinal disorders and poor
performance in broilers (Choct et al., 2010).
REDUCTION OF GALACTOLIGOSACCHARIDES OF SOYBEAN MEAL
Due to the relative inability of monogastric animals to digest GAL in SBM, and the
potential anti-nutritional effects of GAL, researchers have developed strategies to reduce or
hydrolyzed the GAL of SBM. Further processing of SBM via ethanol extraction has been
reported to remove over 90% of GAL content (Coon et al., 1990; Leske et al., 1991, 1993;
Veldman et al., 1993). Researchers have also utilized exogenous α-1-6 galactosidase in vivo or in
vitro to hydrolyze α-1-6 galactosidic bonds present in raffinose and stachyose to increase nutrient
digestibility (Irish et al., 1995; Ghazi et al., 1997, 2003; Kidd et al., 2001; Graham et al., 2002;
Waldroup et al., 2006). Furthermore, plant geneticists have developed new genetic varieties of
soybeans that yield SBM with dramatically less GAL. While each of these methods were
effective at limiting the concentration of GAL in SBM, most studies have published inconsistent
results on the effects of less GAL in SBM-based diets improving nutrient digestibility and growth
performance of broilers.
Ethanol Extraction
Ethanol extraction of SBM results in a 90% reduction of raffinose and stachyose
concentrations (Veldman et al., 1993). When ethanol-extracted SBM was precision fed to
roosters, TMEn, DM digestibility, and apparent digestibilities of hemicellulose and cellulose were
increased compared with roosters fed a control SBM (Coon et al., 1990). These researchers
attributed the increase in nutrient digestibility and energy utilization to a 50% slower rate of
passage for chickens consuming ethanol-extracted SBM compared with roosters fed the control
SBM. Moreover, other researchers reported that feeding roosters ethanol-extracted SBM resulted

10
in greater TMEn concentrations compared with a control SBM (Leske et al., 1991, 1993). When
raffinose and stachyose were added to ethanol-extracted SBM, these authors observed a decrease
in TMEn compared with ethanol-extracted SBM. In addition to GAL, ethanol extraction of SBM
removes a large percentage of soluble NSP. Because NSP have been reported to decrease nutrient
digestibility, this could explain the positive effects ethanol extraction has on nutrient utilization
(Coon et al., 1990). Conversely, Irish et al. (1995) did not observe increases in TMEn, weight
gain, feed efficiency, or protein digestibility when an ethanol-extracted SBM was fed to chickens.
These authors attributed the results to the ethanol extraction process altering the nutrient
composition of the SBM and the low palatability of the experimental diet.
Enzyme Supplementation
Galactooligosaccharides have limited nutrient value when fed to broilers because poultry
lack the enzymes required for the hydrolysis and subsequent absorption of these molecules.
Research attempting to supplement diets with α-galactosidase has been met with limited success.
Ghazi et al. (1997) provided SBM supplemented with gradient concentrations of α-galactosidase
(0, 0.025, 0.0625, 0.250 g/kg) to cockerels in a precision fed assay. These authors reported a
10.8% increase in N retention and a 15.6% increase in TMEn when feeding SBM incubated with
0.25 g/kg of α-galactosidase. Moreover, Ghazi et al. (2003) found similar increases in TMEn and
true N digestibility when α-galactosidase was supplemented into corn-SBM-based diets,
especially when fed in conjunction with various proteases. Graham et al. (2002) reported
increased TMEn when SBM was sprayed and incubated with α-galactosidase, but no differences
in growth performance were observed when diets containing enzyme-incubated SBM were fed to
broiler chicks from 3 to 27 d of age. Additionally, the autolysis of raffinose and stachyose of soy
flakes resulted in a 94 % reduction of GAL concentrations (hydrolyzed into their monosaccharide
constituents) (Angel et al., 1988). When these soy flakes were fed to chickens, no increases in
TMEn, growth rate, or feed efficiency were observed compared with chickens fed water incubated

11
soy flakes. Due to a lack of response in TMEn or growth rate, these authors hypothesized that
energy utilization of SBM may not be exclusively related to GAL concentrations. Furthermore, α-
galactosidase or carbohydrase cocktails containing α-galactosidase supplemented in corn-SBM-
based diets have not enhanced growth performance of broilers (Irish et al., 1995; Kidd et al.,
2001; Waldroup et al., 2006).
Trait Enhanced Soybean Meal
Genetic varieties of soybeans have been developed with low concentrations of raffinose
and stachyose. In addition to a reduction in GAL content, these enhanced soybeans contained
increased concentrations of CP and sucrose (Parsons et al., 2000; Baker and Stein, 2009; Baker et
al., 2011). The altered nutrient composition of SBM produced from low GAL soybeans may
influence nutrient digestibility and growth performance of broilers. Parsons et al. (2000) fed 5
types of low GAL SBM to roosters and reported a 7% increase in TMEn compared with a control
SBM. The greater TMEn was attributed to a reduction in GAL content and higher concentrations
of CP and sucrose in the low GAL SBM. Conversely, Baker et al. (2011) reported no differences
in TMEn or AA digestibility of low GAL SBM compared with a control SBM when fed to
chickens. These authors also observed higher CP and sucrose concentrations in the low GAL
SBM compared with a control SBM. When these SBM were fed to chicks, no differences in BW
gain, feed intake, or feed conversion were observed. In agreement with results determined in
poultry, low GAL SBM had similar AA digestibility values compared with conventional SBM
when fed to pigs (Baker and Stein, 2009).
Novel types of SBM have recently been developed with a 75% (low oligosaccharide
SBM [LOSBM]) and 90% (ultra-low oligosaccharide SBM [ULSBM]) reduction in GAL
concentrations. Data are limited on the nutrient digestibility of LOSBM, including AMEn and AA
digestibility. In addition, AMEn and AA digestibility have not been reported with broilers fed

12
diets containing ULSBM. Furthermore, growth performance and meat yield responses of broilers
fed LOSBM or ULSBM during a complete production cycle have not been evaluated. The
proposed research will address the aforementioned knowledge gaps in the literature by evaluating
AMEn and AA digestibility through 4 experiments. Additionally, 2 experiments will examine
growth performance and meat yield responses of broilers fed diets formulated with LOSBM,
ULSBM, or a control SBM during a 6 wk production period. Apparent MEn and digestible AA
concentrations determined in the first 4 experiments will be used in formulating diets in
experiments 5 and 6.
REFERENCES
Angel, C. R., J. L. Sell, and D. R. Zimmerman. 1988. Autolysis of α-galactosides of defatted soy
flakes: Influence on nutritive value for chickens. J. Agric. Food Chem. 36:542-546.
Angkanaporn, K., M. Choct, W. L. Bryden, E. F. Annison, and G. Annison. 1994. Effects of
wheat pentosans on endogenous amino acid losses in chickens. J. Sci. Food Agric.
66:399-404.
Anninson, G. and M. Choct. 1993. Enzymes in poultry diets. Pages 61-77 in Enzymes in Animal
Nutrition. ETH-Zurich, Zurich, Switzerland.
Antoniou, T., R. R. Marquardt, and E. Cansfield. 1981. Isolation partial characterization, and
antinutritional activity of a factor (pentosans) in rye grain. J. Agric. Food Chem. 28:1240-
1247.
Bach Knudsen, K. E. 1997. Carbohydrate and lignin contents of plant materials used in animal
feeding. Anim. Feed Sci. Technol. 67:319-338.

13
Bach Knudsen, K. E. and I. Hansen. 1991. Gastrointestinal implications in pigs of wheat and oat
fractions. Digestibility and bulking properties of polysaccharides and other major
constituents. Br. J. Nutr. 65:217-232.
Baker, K. M. and H. H. Stein. 2009. Amino acid digestibility and concentration of digestible and
metabolizable energy in soybean meal produced from high protein or low oligosaccharide
varieties of soybeans and fed to growing pigs. J. Anim. Sci. 87:2282-2290.
Baker, K. M., P. L. Utterback, C. M. Parsons, and H. H. Stein. 2011. Nutritional value of soybean
meal produced from conventional, high-protein, or low-oligosaccharide varieties of
soybeans and fed to broiler chicks. Poult. Sci. 90:390-395.
Carré, B., J. Gomez, and A. M. Chagneau. 1995. Contribution of oligosaccharide and
polysaccharide digestion, and excreta losses of lactic acid and short chain fatty acids, to
dietary metabolizable energy values in broiler chickens and adult cockerels. Br. Poult.
Sci. 36:611-629.
Carré, B., L. Derouet, and B. Leclercq. 1990. The digestibility of cell-wall polysaccharides from
wheat (bran or whole grain), soybean meal, and white lupin meal in cockerels, muscovy
ducks, and rats. Poult. Sci. 69:623-633.
Choct, M. 1997. Feed non-starch polysaccharides: Chemical structures and nutritional
significance. Feed Mill. Int. 7:13-26.
Choct, M. and D. J. Cadogan. 2001. How effective are supplemental enzymes in pig diets? Pages
240-247 in Manipulating Pig Production VIII. Adelaide, South Asutralia.
Choct, M. and G. Annison. 1990. Anti-nutritive activity of wheat pentosans in broiler diets. Br.
Poult. Sci. 31:811-821.

14
Choct, M., R. J. Hughes, J. Wang, M. R. Bedford, A. J. Morgan, and G. Annison. 1996. Increased
small intestinal fermentation is partly responsible for the anti-nutritive activity of non-
starch polysaccharides in chickens. Br. Poult. Sci. 37:609-621.
Choct, M., Y. Dersjant-Li, J. McLeish, and M. Peisker. 2010. Soy oligosaccharides and soluble
non-starch polysaccharides: a review of digestion, nutritive and anti-nutritive effects in
pigs and poultry. Asian-Aust. J. Anim. Sci. 10:1386-1398.
Coon, C. N., K. L. Leske, O. Akavanichan, and T. K. Cheng. 1990. Effect of oligosaccharide-free
soybean meal on true metabolizable energy and fiber digestion in adult roosters. Poult.
Sci. 69:787-793.
Cromwell, G. L. 1999. Soybean Meal – The ―Gold Standard‖. The Farmer’s Pride, KPPA News,
Vol. 11. No 20.
Donohue, M. and D. L. Cunningham. 2009. Effects of grain and oilseed prices on the costs of US
poultry production. J. Appl. Poult. Res. 18:325-337.
Dozier, W. A. III, C. J. Price, M. T. Kidd, A. Corzo, J. Anderson, and S. L. Branton. 2006.
Growth performance, meat yield, and economics of broilers fed diets varying in
metabolizable energy from thirty to fifty-nine days of age. J. Appl. Poult. Res. 15:367-
382.
Dozier, W. A. III, C. K. Gehring, A. Corzo, and H. A. Olanrewaju. 2011. Apparent metabolizable
energy needs of male and female broilers from 36 to 47 days of age. Poult. Sci. 90:804-
814.
Fransen, C. T. M. 1999. Structural analysis of soybean polysaccharides and transgalactosylation
of products from lactose. PhD Diss. Univ. of Utrecht. Utrecht, Netherlands.

15
Ghazi, S., J. A. Rooke, H. Galbraith, and A. Morgan. 1997. Effect of adding protease and alpha-
galactosidase enzymes to soybean meal on nitrogen retention and true metabolizable
energy in broilers. Br. Poult. Sci. 38:528-531.
Ghazi, S., J. A. Rooke, and H. Galbraith. 2003. Improvements in the nutritive value of soybean
meal by protease and αlpha-galactosidase treatment in broiler cockerels and broiler
chicks. Br. Poult. Sci. 44:410-418.
Gitzelmann, R. and S. Auricchio. 1965. The handling of soy alpha-galactosidase by a normal and
galactosemic child. Pediatrics 36:231-232.
Graham, K. K., M. S. Kerley, J. D. Firman, and G. L. Allee. 2002. The effect of enzyme
treatment of soybean meal on oligosaccharide disappearance and chick growth
performance. Poult. Sci. 81:1014-1019.
Grieshop, C. M., C. T. Kadzere, G. M. Clapper, E. A. Flickinger, L. L. Bauer, R. L. Frazier, and
G. C. Fahey, Jr. 2003. Chemical and nutritional characteristics of United States soybeans
and soybean meals. J. Agric. Food Chem. 51:7684-7691.
Hidalgo, M. A., W. A. Dozier III, A. J. Davis, and R. W. Gordon. 2004. Live performance and
meat yield responses of broilers to progressive concentrations of dietary energy
maintained at a constant metabolizable energy-to-crude protein ratio. J. Appl. Poult. Res.
13:319-327.
Hill, F. W., D. L. Anderson, R. Renner, and L. B. Carew, Jr. 1960. Studies of the metabolizable
energy of grain and grain products for chickens. Poult. Sci. 39:573-579.
Ide, T., M. Horii, K. Kawashim, and T. Yamamoto. 1989. Bile acid conjugation and hepatic
taurine concentration in rats fed on pectin. Br. J. Nutr. 62:539-550.

16
Irish, G. G. and D. Balnave. 1993. Non-starch polysaccharides and broiler performance on diets
containing soyabean meal as the sole protein concentrate. Aust. J. Agric. Res. 44:1483-
1499.
Irish, G. G., G. W. Barbour, H. L. Classen, R. T. Tyler, and M. R. Bedford. 1995. Removal of the
α-galactosides of sucrose from soybean meal using either ethanol extraction or exogenous
α-galactosidase and broiler performance. Poult. Sci. 74:1484-1494.
Ivy, C. A., D. B. Bragg, and E. L. Stephenson. 1971. The availability of amino acids from
soybean meal for the growing chick. Poult. Sci. 50:408-410.
Jørgensen, H., X. Zhao, K. E. Bach Knudsen, and B. O. Eggum. 1996. The influence of dietary
fibre source and level on the development of the gastrointestinal tract, digestibility, and
energy metabolism in broiler chickens. Br. J. Nutr. 75:379-395.
Karimzadegan, E., A. J. Clifford, and F. W. Hill. 1979. A rat bioassay for measuring the
comparative availability of carbohydrates and its application to legume foods, pure
carbohydrates, and polyols. J. Nutr. 109:2247-2259.
Karr-Lilienthal, L. K., C. T. Kadzere, C. M. Grieshop, and G. C. Fahey, Jr. 2005. Chemical and
nutritional properties of soybean carbohydrates as related to nonruminants: A review. J.
Livestock Prod. Sci. 97:1-12.
Kidd, M. T., G. W. Morgan, Jr., C. J. Price, P. A. Welch, and E. A. Fontana. 2001. Enzyme
supplementation to corn and soybean meal diets for broilers. J. Appl. Poult. Res. 10:65-
70.
Kuriyama, S. and L. B. Mendel. 1917. The physiological behavior of raffinose. J. Biol. Chem.
31:125-147.

17
Leeson, S. and J. D. Summers. 2001. Pages 64-65 in Scott’s Nutrition of the Chicken. 4th
ed. M.L
Scott and Associates, Ithaca, N.Y.
Leske, K. L., C. J. Jevne, and C. N. Coon. 1993. Effect of oligosaccharide additions on nitrogen
corrected true metabolizable energy of soy protein concentrate. Poult. Sci. 72:664-668.
Leske, K. L., O. Akavanichan, T. K. Cheng, and C. N. Coon. 1991. Effect of ethanol extraction
on nitrogen-corrected true metabolizable energy for soybean meal with broilers and
roosters. Poult. Sci. 70:892-895.
Lodhi, G. N., R. Renner, and D. R. Clandinin. 1969. Available carbohydrate in rapeseed meal and
soybean meal as determined by a chemical method and a chick bioassay. J. Nutr. 99:413-
418
Macrae, R., R. K. Robinson, and M. J. Sadler. 1993. Soya beans. Pages 4215-4218 in
Encyclopedia of Food Science, Food Technology and Nutrition. Academic Press.
London.
Moran, E. T., Jr. 1982. Starch digestion in fowl. Poult. Sci. 61:1257-1267.
National Biodiesel Board. 2012. Production Statistics.
http://www.biodiesel.org/production/production-statistics Accessed Apr. 2012.
Nemcova, R., A. Bomba, S. Gancarcikova, R. Herich, and P. Guba. 1999. Study of the effect of
Lactobacillus paracasei and fructooligosaccharides on the fecal microflora in weanling
piglets. Berl. Munich Tierarztl Wochenschr 112:225-228.
NRC. 1994. Nutrient Requirements of Poultry. 9th ed. Natl. Acad. Press, Washington, D.C.
NRC. 1998. Nutrient Requirements of Swine. 10th rev. ed. Natl. Acad. Press, Washington, D.C.
18
Parsons, C. M., L. M. Potter, and R. D. Brown, Jr. 1981. True metabolizable energy and amino
acid digestibility of dehulled soybean meal. Poult. Sci. 60:2687-2696.
Parsons, C. M., Y. Zhang, and M. Araba. 2000. Nutritional evaluation of soybean meals varying
in oligosaccharide content. Poult. Sci. 79:1127-1131.
Pettersson, A. and J. E. Lindberg. 1996. Ileal and total tract digestibility in pigs of naked and
hulled barley with different starch composition. Anim. Feed Sci. Technol. 66:97-109.
Potter, L. M., and M. Potchanakorn. 1985. Digestibility of the carbohydrate fraction of soybean
meal by poultry. Pages 218-224 in World Soybean Conf. III Proc. R. Shibles, ed. West
View Press, Boulder, CO.
Sibbald, I. R. and S. J. Slinger. 1962. The metabolizable energy of materials fed to growing
chicks. Poult. Sci. 41:1612-1613.
Smiricky, M. R., C. M. Grieshop, D. M. Albin, J. E. Wubben, V. M. Gabert, and G. C. Fahey, Jr.
2002. The influence of soy oligosaccharides on apparent and true ileal amino acid
digestibilities and fecal consistency in growing pigs. J. Anim. Sci. 80:2433-2441.
Smits, C. H. M. and G. Annison. 1996. Non-starch polysaccharides in broiler nutrition – Towards
a physiologically valid approach to their determination. World’s Poult. Sci. J. 52:203-
221.
Spring, P., C. Wenk, K. A. Dawson, and K. E. Newman. 2000. The effects of dietary
mannaoligosaccharides on cecal parameters and the concentrations of enteric bacteria in
the ceca of salmonella-challenged broiler chicks. Poult. Sci. 79:205-211.

19
Vahouny, G. V., R. Tombes, M. M. Cassidy, D. Kritchevsky, and L. L. Gallo. 1981. Dietary
fibres. VI: Binding of fatty acids and monolein from mixed micelles containing bile salts
and lecithin. Proc. Exp. Biol. Med. 166:12-16.
Veldman, A., W. A. G. Veen, D. Barug, and P. A. van Paridon. 1993. Effect of α-galactosides
and α-galactosidase in feed on ileal piglet digestive physiology. J. Anim. Physiol. Anim.
Nutr. 69:57-65.
Wagner, D. D. and O. P. Thomas. 1978. Influence of diets containing rye or pectin on the
intestinal flora of chicks. Poult. Sci. 57:971-975.
Waldroup, P. W., C. A. Keen, F. Yan, and K. Zhang. 2006. The effect of levels of α-galactosidase
enzyme on performance of broilers fed diets based on corn and soybean meal. J. Appl.
Poult. Res. 15:48-57.
Yen, J. T., J. A. Nienaber, D. A. Hill, and W. G. Pond. 1991. Potential contribution of absorbed
volatile fatty acids to whole animal energy requirement in conscious swine. J. Anim. Sci.
69:2001-2012.

20
III. APPARENT METABOLIZABLE ENERGY AND APPARENT ILEAL AMINO ACID
DIGESTIBILITY OF LOW AND ULTRA-LOW OLIGOSACCHARIDE SOYBEAN
MEALS FED TO BROILER CHICKENS
ABSTRACT
Four experiments were conducted using 1,992 Ross × Ross 708 male broilers to
determine AMEn and apparent ileal amino acid digestibility (AIAAD) of low oligosaccharide
(LOSBM), ultra-low oligosaccharide (ULSBM), and control soybean meal (CSBM) fed to
broilers from 20 to 31 d of age. An AMEn assay was conducted in experiments 1 and 2 while
AIAAD was determined in experiments 3 and 4. Chicks were randomly assigned to 3, 4, 2, or 3
dietary treatments, respectively, for experiments 1, 2, 3, or 4. The additional treatment in
experiments 2 and 4 was to evaluate ULSBM. In the AMEn assays, treatments were fed from 20
to 29 d of age and a 48 h excreta collection period was conducted from 27 to 29 d of age.
Treatment 1 consisted of a basal diet and treatments 2, 3, and 4 consisted of 70% of the basal diet
plus 30% CSBM, LOSBM, or ULSBM, respectively. The difference method was used to
determine AMEn utilizing a N correction factor to account for N retention. To determine AIAAD,
broilers were fed semi-purified diets with CSBM, LOSBM, or ULSBM as the sole source of
amino acids (AA) from 26 to 31 d of age with digesta collection occurring at 31 d of age.
In experiment 1, LOSBM had 194 kcal/kg more AMEn compared with CSBM (P =
0.011). Apparent MEn value of LOSBM was 141 and 134 kcal/kg higher (P = 0.012) compared
with CSBM and ULSBM, respectively, in experiment 2. In experiment 3, digestible Lys, Met, Ile,
and Val concentrations were higher (P < 0.001) for LOSBM vs. CSBM, even though digestibility
coefficients were lower (P < 0.001) for LOSBM. In experiment 4, higher (P < 0.001)

21
concentrations of digestible Met, Lys, Thr, Val, and Ile were observed for ULSBM and LOSBM
compared with CSBM. In conclusion, genetically selected soybean meals with reduced stachyose
and raffinose concentrations had higher AMEn and AIAAD values compared with CSBM.
INTRODUCTION
Dietary energy sources represent a significant cost of poultry diets (Donohue and
Cunningham, 2009). Prices for energy-providing ingredients increased over 250% from 2006 to
2008 due to a portion of the corn and oil supply being diverted away from animal agriculture for
the production of ethanol and biodiesel (Donohue and Cunningham, 2009). In the future, a larger
proportion of the fat/oil supply may be utilized in biodiesel production creating a need to increase
the energy utilization of cereal grains and oilseed meals.
Apparent MEn of soybean meal (SBM) is approximately 28% less for poultry when
compared with swine (NRC, 1994 and 1998). Poor energy utilization of SBM fed to poultry may
relate to its carbohydrate fraction (Choct et al., 2010). Raffinose and stachyose are water soluble
galactooligosaccharides (GAL) and comprise between 5 and 7% of SBM on a DM basis (Bach
Knudsen, 1997; Grieshop et al., 2003). These small molecular weight sugars are not hydrolyzed
into smaller mono- and disaccharides necessary to facilitate absorption because poultry lack
endogenous α-1,6 galactosidase activity (Gitzelmann and Auricchio, 1965; Cristofaro et al.,
1974). As a result, GAL pass through the small intestine undigested (Coon et al., 1990).
Previous research has demonstrated that removal of stachyose and raffinose from SBM
increases MEn in poultry via ethanol extraction or genetic selection (Coon et al., 1990; Leske and
Coon, 1999; Parsons et al., 2000). Ethanol extraction of SBM removes more than 90% of GAL
content and increases TMEn of SBM (Coon et al., 1990), but increases in MEn have not been
consistently observed in previous research (Irish et al., 1995). Soybeans have been developed
with reduced raffinose and stachyose content through genetic selection (Parsons et al., 2000;
Baker and Stein, 2009; Baker et al., 2011). Parsons et al. (2000) observed increases of 7 to 9% in

22
TMEn when several SBM genetically selected for low GAL concentrations and were fed to
roosters compared with several commercial SBM sources. Conversely, Baker et al. (2011)
reported no difference in TMEn between low GAL SBM and a control SBM.
In addition to low oligosaccharide SBM (LOSBM), a new variety of ultra-low
oligosaccharide soybean has been developed that when processed yields ultra-low
oligosaccharide SBM (ULSBM) with over a 90% reduction in GAL content compared with a
control SBM (CSBM). To our knowledge, published research is unavailable evaluating AMEn
and AIAAD of both LOSBM and ULSBM when fed to growing broilers. Therefore, the objective
of this research was to determine AMEn and AIAAD of CSBM, LOSBM, and ULSBM fed to
broilers.
MATERIALS AND METHODS
General
The Institutional Animal Care and Use Committee at Auburn University approved all
experimental protocols involving live birds (PRN 2009-1668; 2010-1699). Four experiments
were conducted with broilers from 1 to 31 d of age to determine AMEn (experiments 1 and 2) and
AIAAD (experiments 3 and 4) of CSBM, LOSBM, and ULSBM. Experiments 1 and 3 were
conducted in March, 2010, whereas experiments 2 and 4 were initiated in March, 2011.
Bird Husbandry
In each experiment, Ross × Ross 708 male broilers (experiment 1 = 576; experiment 2 =
768; experiment 3 = 288; experiment 4 = 360) were obtained from a commercial hatchery and
vaccinated for Marek’s disease, Newcastle disease, and infectious bronchitis. In each experiment,
broilers (12 per cage; 0.04 m2/bird) were placed into grower battery cages (Petersime, Gettysburg,
OH). Each cage (68 cm × 68 cm × 38 cm) was equipped with 1 trough feeder and 1 trough
waterer. The experimental facility was a solid-sided house with temperature control. Temperature
was set to 33oC at placement, which was decreased gradually to 27
oC by the conclusion of the
experiment. A 23L:1D lighting schedule was used from 1 to 21 d of age, after which a 12L:12D

23
lighting schedule was utilized to ensure adequate feed intake for digesta sample collection.
Broilers were fed a common corn-soybean meal starter diet (AMEn, 3,075 kcal/kg; digestible Lys,
1.22%; digestible TSAA, 0.92%; digestible Thr, 0.83%; Ca, 0.90%; and non-phytate P, 0.45%)
until receiving experimental diets.
Soybean Meals
Five SBM were evaluated throughout the 4 experiments. Two SBM (CSBM and
LOSBM) were utilized in 2010, which were produced from soybeans grown in the 2009 crop yr
and evaluated in experiments 1 and 3. In 2011, a CSBM, LOSBM, and ULSBM produced from
soybeans grown in the 2010 crop yr were evaluated in experiments 2 and 4. Soybeans were
obtained from Schillinger Genetics (Schillinger Genetics, West Des Moines, IA) and processed at
Zeeland Farm Services’ processing plant (Zeeland Farm Services, Zeeland, MI). To avoid
agronomic differences (Grieshop et al., 2003), soybeans were grown in the same geographic
location in northeast Indiana. Soybeans were processed at the same facility utilizing identical
procedures to avoid processing differences.
The 5 resulting SBM were analyzed for CP by determining nitrogen content via the
Dumas method (method 990.03; AOAC International, 2006) using a N analyzer (Rapid N Cube,
Elementar Analysensyteme GmbH, Hanau, Germany) with CP being calculated by multiplying
percent N by a correction factor (6.25). Sucrose, raffinose, and stachyose were estimated (Bhatti
et al., 1970), as well as DM (method 934.01; AOAC International, 2006), starch (method 76-13;
AACC International, 2006), acid detergent fiber (ADF) (method 973.18 (A-D); AOAC
International, 2006), neutral detergent fiber (NDF) (Holst, 1973), cellulose (method 973.18 (A-
D); AOAC International, 2006), and trypsin inhibitors (method 22-40.01; AACC International,
2006). Soybean meals were analyzed for gross energy (GE) using bomb calorimetry (Model
6300, Parr Instruments, Moline, IL). Crude fat concentrations were estimated by boiling samples
in hexane (method 2003.06; AOAC International, 2006) in a fat extractor (Soxtec model number
2043, Foss North America, Inc., Eden Prarie, MN). Particle size was determined on a 13 half-

24
height sieve shaker (Tyler RoTap, Mentor, OH) as described by Baker and Herrman (2002). Bulk
density was determined by utilizing a standard weight per bushel tester (USDA, 1953).
Dietary Treatments
Birds were randomly assigned to 1 of 3, 4, 2, or 3 dietary treatments for experiments 1
through 4, respectively. For the AMEn assays (experiments 1 and 2), broilers were fed
experimental diets from 20 to 29 d of age. Treatment 1 for both experiments was 100% basal diet
(Table 3.1), while the remaining treatments were a blend of 70% basal and 30% experimental
SBM resulting in 3 dietary treatments for experiment 1 (100% basal; 70% basal and 30% CSBM;
70% basal and 30% LOSBM). In experiment 2, 4 dietary treatments were fed to broilers (100%
basal; 70% basal and 30% CSBM; 70% basal and 30% LOSBM; 70% basal and 30% ULSBM).
The basal diet was formulated to meet or exceed NRC (1994) nutrient recommendations with
corn, peanut meal, distiller’s grains, and poultry by-product meal as the primary ingredients. All
dietary treatments were fed in pelleted form.
In experiment 3, birds were assigned to 1 of 2 semi-purified diets for AIAAD
determination (Table 3.2). Diets were formulated to contain 43% of either the 2 test SBM (CSBM
or LOSBM) with the remainder of the diet composed of dextrose, poultry oil, and solkafloc. In
experiment 4, broilers were randomly assigned to 1 of 3 semi-purified diets. Diets were
formulated to contain 20% CP resulting in SBM inclusion levels of 41.8, 37.3, and 36.2% for
CSBM, LOSBM, and ULSBM, respectively. In both experiments, titanium dioxide was included
in the experimental diets at 0.50% as an inert marker.
Nitrogen Corrected Apparent Metabolizable Energy Measurements
Following a 7 d acclimation period, a 48 h energy balance assay was conducted from 27
to 29 d of age. Feed disappearance, net excreta weight, and excreta samples were collected after
48 h on d 29 to calculate energy and nitrogen intake and excretion. From each cage, 4 subsamples
were collected (free from feed and feather contamination) from the total amount of excreta on the
pan. Samples were homogenized, and a representative sample of 500 g was placed in a plastic bag

25
for analysis. Samples of feed and excreta were then frozen at -20°C until later analysis. Feed and
excreta samples were lyophilized (Virtis Genesis Pilot Lyophilizer, SP Industries, Warminster,
PA) and ground through a cyclone mill (Cyclotec model number 1093, Foss North America, Inc.,
Eden Prairie, MN) equipped with a 1 mm screen to ensure a homogeneous mixture. Gross energy
of feed and excreta was determined on a 0.8 g sample using an isoperibol oxygen bomb
calorimeter (Parr Instruments, Moline, IA), and analysis was performed 8 times for feed or twice
for excreta due to the effect these measurements have on AMEn determination. Nitrogen content
of feed and excreta was determined on a 0.25 g sample with a combustion analyzer (Rapid N
Cube, Elementar Americas, Inc., Mt. Laurel, NJ) in duplicate using a previously established
method (method 968.06; AOAC International, 2006). Apparent MEn for each dietary treatment
was calculated using 8,220 (kcal/kg) as the N correction factor (Hill and Anderson, 1958) and
using the following equations by Sibbald and Slinger (1963) with units [AMEn (kcal/kg); GE
intake (kcal/kg); GE excreted (kcal/kg); 8,220 (kcal/kg); N intake (kg); N excreted (kg); feed
intake (kg); SBM AMEn (kcal/kg); basal AMEn (kcal/kg); treatment AMEn (kcal/kg)].
( ) [ ( )]
(
)
Apparent Ileal Amino Acid Digestibility Measurements
In experiments 3 and 4, broilers were provided experimental diets at 26 d of age.
Following a 5 d acclimation period, an AIAAD assay was conducted at 31 d of age for both
experiments. Eight birds per pen were euthanized via CO2 asphyxiation and digesta were
collected by gently flushing out the contents of the terminal ileum (4 to 30 cm proximal to the

26
ileo-cecal junction) using deionized water. Samples were pooled by pen and kept on ice before
being frozen at -20°C for later analysis. After lyophilization, samples were finely ground with an
electric coffee grinder to avoid significant loss due to the small sample size of the collected
digesta. Complete AA content of the diets and digesta were analyzed by a commercial laboratory
(University of Missouri Agricultural Experiment Station Chemical Laboratory, Columbia, MO) in
quadruplicates for diets and duplicates for digesta (method 982.30 E (a,b,c); AOAC International,
2006). Performic acid oxidation (method 985.28; AOAC International, 2006) was conducted
before acid hydrolysis for the determination of Met and Cys, whereas all other AA were
determined after acid hydrolysis. Titanium dioxide concentrations were determined in
quadruplicates and duplicates for diets and digesta, respectively, by a method based on that of
Leone (1973). Briefly, 0.25 g of digesta or feed were added to threaded glass test tubes and ashed
at 580°C for 10 h; 0.8 g of NaSO4 was added to the ashed samples, which were diluted with 5 mL
of H2SO4 and then heated at 130°C for 72 h; tube contents were diluted to 50 mL with distilled
deionized water and held for 12 h at 25°C; 3 mL of feed samples or 1 mL of digesta samples plus
2 mL of 1.8 M H2SO4 were added to glass test tubes with 150 µL of H2O2; and after allowing 30
min for color development, absorbance was measured on a spectrophotometer (DU 730, Beckman
Coulter, Brea, CA) at 410 nm. Apparent ileal AA digestibility was calculated using the following
equation (Adedokun et al., 2008):
* (
) (
)+
Statistics
Data were analyzed using a randomized complete block design with cage location as the
blocking factor. Experiments 1, 2, 3, and 4 were represented by 16, 16, 12, and 10 replicate cages
respectively. Analysis of variance was performed using PROC MIXED (SAS Institute, 2004) by

27
the following mixed-effects model:
Yij = μ.. + ρi + τj + εij
where μ.. is the overall mean; the ρi are identically and independently normally distributed
random block effects with mean 0 and variance σ2
ρ; the τj are fixed factor level effects
corresponding to the jth
soybean variety (CSBM, LOSBM, and ULSBM) such that Στj = 0; and
the random error εij are identically and independently normally distributed with mean 0 and
variance σ2. For experiments 2 and 4, treatment means were separated using Tukey’s Honestly
Significant Difference test (Tukey, 1953). Statistical significance was considered at P ≤ 0.05.
RESULTS AND DISCUSSION
Physical and Chemical Characteristics
Quantifying changes in chemical composition is valuable when interpreting nutrient
digestibility differences due to SBM types. Low GAL SBM has been reported to have altered
sugar, fiber, and CP composition (Baker et al., 2011). Both LOSBM and ULSBM exhibited
altered chemical and physical composition compared with a CSBM (Table 3.3). The following
chemical and physical characteristics are presented as numerical changes as statistical analysis
could not be applied due to a lack of replication. For SBM utilized in experiments 1 and 3 that
was grown during the 2009 crop yr, stachyose and raffinose concentrations decreased from 6.79
to 1.56% and 0.71 to 0.21%, respectively, between CSBM and LOSBM. Sucrose and starch
concentrations increased by 21% and 39%, respectively, between CSBM and LOSBM. Acid
detergent fiber (-36%), NDF (-43%), and cellulose (-32%) had lower concentrations for LOSBM
vs. CSBM. Low oligosaccharide SBM had higher CP than CSBM, whereas crude fat content of
LOSBM was lower compared with CSBM. Particle size was determined to be 1,300 and 1,166
µm mean diameter for CSBM and LOSBM, respectively, resulting in a 23% higher bulk density
for LOSBM compared with CSBM.
Control SBM, LOSBM, and ULSBM utilized in experiments 2 and 4 originated from
soybeans grown during the 2010 crop yr. Both LOSBM and ULSBM had lower concentrations of

28
stachyose (-72 and -90%) and raffinose (-74 and -91%) and higher sucrose (+17 and +4%) and
CP (+12 and +16%) concentrations compared with CSBM. Cellulose (-36 and -24%), ADF (-38
and -24%), and NDF (-40 and -27%) concentrations were lower for LOSBM and ULSBM
compared with CSBM. Particle size and bulk density were determined as 1,059, 1,279, and 1,106
µm mean diameter and 0.69, 0.75, and 079 g/cc for CSBM, LOSBM, and ULSBM, respectively.
In table 3, the nutrients measured do not account for the total nutrient composition of the
different SBM types. Minerals and some soluble carbohydrates were not determined. While
concentrations of sucrose, starch, raffinose, stachyose, ADF, NDF, and cellulose were
determined, concentrations of soluble NSP (pectins) were not documented. While insoluble NSP
remain undigested, digestibility of soluble NSP may be as high as 80 to 90% in poultry and may
influence nutrient digestibility (Carré et al., 1995).
Nitrogen Corrected Apparent Metabolizable Energy Assays
In experiment 1, LOSBM had 194 kcal/kg more (P = 0.011) AMEn compared with
CSBM when fed to growing broilers (Figure 1A). In experiment 2, LOSBM had 141 and 134
kcal/kg more (P = 0.012) AMEn compared with CSBM and ULSBM, respectively (Figure 1B).
Feed intake between treatments was not different in either experiment (grand means: experiment
1 = 0.121 kg/bird/d; experiment 2 = 0.134 kg/bird/d). The increase in AMEn observed between
CSBM and LOSBM was most likely attributed to a reduction of GAL and fiber concentrations
and an increase in sucrose concentration for LOSBM vs. CSBM (Table 3.3). Previous research
has observed that a reduction of GAL from SBM increases MEn in poultry (Coon et al., 1990;
Parsons et al., 2000). Parsons et al. (2000) also reported that higher sucrose concentrations of low
oligosaccharide SBM may lead to better energy utilization of SBM due to the high digestibility of
sucrose in poultry.
In experiment 2, ULSBM did not have a higher AMEn than CSBM when fed to broilers
even though ULSBM had a 90% reduction in GAL concentrations. The lower AMEn value of
ULSBM was due to higher (P = 0.041) excreta energy output per bird for broilers consuming

29
diets containing ULSBM (+4.1%) compared with lower excreta energy output for broilers
consuming diets containing LOSBM. The lower AMEn (higher excreta energy output per bird) of
ULSBM is most likely due to higher concentrations of ADF, NDF, and cellulose, as well as a
lower concentrations of sucrose compared with LOSBM (Table 3.3). While sucrose is highly
digestible, fiber is poorly digested by poultry due to a quick digesta transit time and the limited
capacity of the gut microbiota to utilize complex carbohydrates, which could translate to higher
excreta GE output (Carré et al., 1990; Choct et al., 2010). Furthermore, fiber digestibility varies
between bird ages with roosters having higher fiber digestibility than broilers (Carré et al., 1995).
This difference in fiber digestibility may explain differences in the present data utilizing broilers
and research conducted by Baker et al. (2011), who reported similar TMEn values between a
CSBM and LOSBM when precision fed to roosters.
Crude protein of SBM has been reported to influence AMEn among SBM types. Baker et
al. (2011) reported a higher TMEn for a high CP SBM (54.9% CP) compared with a control SBM.
These authors suggested that increased AMEn of the high CP SBM may have occurred due to
excess AA being metabolized for energy utilization, yet no difference was reported in TMEn
between a LOSBM (53.6% CP) and a CSBM (47.5% CP). In the current research, LOSBM and
ULSBM had higher CP concentrations than CSBM (54.2 and 55.6 vs. 47.8%), but only LOSBM
had higher AMEn. A 1.4% difference in CP existed between LOSBM and ULSBM, so differences
in AA intake and N excretion influencing AMEn response for LOSBM and ULSBM appears
unlikely.
Additionally, previous research has reported that dietary oligosaccharides can influence
gut microflora populations (Nemcova et al., 1999). Coon et al. (1990) found ileal digestibility of
GAL to be less than 1% in roosters, but total tract digestibility varied from 84 to 90% based on
raffinose and stachyose concentrations in the excreta. This finding likely signifies raffinose and
stachyose being metabolized via microbial fermentation in the ceca. Fermentation by gut
microflora releases volatile fatty acids, which can be utilized by the bird as energy. However, the

30
effects of raffinose and stachyose utilization by gut microflora on the contribution to AMEn are
not well documented.
Apparent MEn values varied between experiment 1 and 2, but the relative increase of
AMEn was similar between the CSBM and LOSBM in both experiments. Differences in AMEn
values between experiments 1 and 2 may be attributed to lower crude fat values for SBM utilized
in experiment 2. However, crude fat differences between SBM types were small between
experiments (Table 3.3). Furthermore, variability in AMEn of SBM has been previously reported
in the literature and could contribute to differences observed in this research (Grieshop et al.,
2003; Lopez and Leeson, 2008).
Apparent Ileal Amino Acid Digestibility Assays
Apparent ileal AA digestibility coefficients for both indispensable and dispensable AA
were greater (P ≤ 0.012) for CSBM vs. LOSBM in experiment 3 (Table 3.4). Conversely, total
digestible AA concentrations were greater (P ≤ 0.003) for LOSBM vs. CSBM except for Trp. In
experiment 4, AIAAD coefficients were higher (P < 0.05) for Cys, Gly, and Pro for LOSBM and
ULSBM vs. CSBM (Table 3.5). Higher (P < 0.05) AIAAD coefficients were observed for Ser for
ULSBM vs. CSBM, but CSBM had a higher (P < 0.05) Arg digestibility coefficient compared
with ULSBM and LOSBM. No differences (P > 0.05) were observed for the AIAAD coefficients
of Lys, Met, Val, His, Ile, Leu, Phe, Thr, Val, Trp, Asp, Glu, and Tyr between SBM types.
Digestible AA concentrations were highest (P < 0.001) in ULSBM, followed by LOSBM, with
CSBM having the lowest digestible concentrations for both indispensable and dispensable AA.
Increased digestible AA concentrations occurred due to higher total AA concentrations in
ULSBM and LOSBM vs. CSBM. Baker et al. (2011) reported no differences in AA digestibility
coefficients when a low GAL SBM was precision fed to roosters but did observe increased
digestible AA concentrations for the low GAL SBM vs. a control SBM due to the higher total AA
content of the low GAL SBM.
Amino acid digestibility coefficients for LOSBM were lower than the digestibility

31
coefficients for CSBM in experiment 3 (Table 3.4). Trypsin inhibitor concentrations were 73%
higher for LOSBM vs. CSBM (Table 3.3). Previous research has also observed higher trypsin
inhibitor values for low GAL SBM vs. a control SBM (Baker and Stein, 2009; Baker et al., 2011).
In experiment 4, the trypsin inhibitor concentration difference was less between CSBM and
LOSBM, and birds fed diets containing LOSBM did not exhibit lower AA digestibility
coefficients. Conversely, no differences in AA digestibility coefficients were observed between
ULSBM and CSBM even though ULSBM had a higher trypsin inhibitor concentration. The
reason for this result is not known and might indicate that trypsin inhibitor concentrations under
6,000 TIU/g may be adequate for AA digestion. Further supporting adequate SBM processing,
the protein solubility index for each of the SBM types were within the range (70 to 85%) of
adequate heat treatment during processing (Araba and Dale, 1990).
In conclusion, these data indicated that LOSBM and ULSBM have a better nutrient
profile compared with CSBM. Low oligosaccharide SBM had on average (experiments 1 and 2)
168 more kcal of AMEn/kg compared with CSBM. In experiment 3, LOSBM had 5.8% higher
AIAAD concentrations vs. CSBM, and in experiment 4, LOSBM and ULSBM had 8.0 and 17.0%
greater AIAAD concentrations compared with CSBM, respectively, for the first 5 limiting AA in
broilers. Further research is warranted to better understand the changes in chemical composition
of ULSBM on AMEn.
REFERENCES
AACC International. 2006. Approved Methods of Analysis, 11th Ed. Method 22-40.01.
Measurement of trypsin inhibitor activity of soy products—spectrophotometric method.
AACC Int., St. Paul, MN, U.S.A.
Adedokun, S. A., O. Adeola, C. M. Parsons, M. S. Lilburn, and T. J. Applegate. 2008.
Standardized ileal amino acid digestibility of plant feedstuffs in broiler chickens and
turkey poults using a nitrogen-free or casein diet. Poult. Sci: 87:2535-2548.

32
Ajinomoto Heartland, LLC. 2004. True Digestibility of Essential Amino Acids for Poultry.
Revision 7. Ajinomoto Heartland, LLC. Chicago, IL.
American Society of Agricultural Engineers. 1993. Method of determining and expressing
fineness of feed materials by sieving. American Society of Agricultural Engineers
Yearbook of Standard. ASAE, St. Joesph, MO.
AOAC International. 2006. Official Methods of Analysis of AOAC International. 18th ed. AOAC
Int., Gaithersburg, MD.
Araba, M. and N.M. Dale. 1990. Evaluation of protein solubility as an indicator of overprocessing
soybean meal. Poult. Sci. 6976-83.
Bach Knudsen, K. E. 1997. Carbohydrate and lignin contents of plant materials used in animal
feeding. Anim. Food Sci. Technol. 67:319-338.
Baker, K. M. and H. H. Stein. 2009. Amino acid digestibility and concentration of digestible and
metabolizable energy in soybean meal produced from high protein or low oligosaccharide
varieties of soybeans and fed to growing pigs. J. Anim. Sci. 87:2282-2290.
Baker, K. M., P. L. Utterback, C. M. Parsons, and H. H. Stein. 2011. Nutritional value of soybean
meal produced from conventional, high-protein, or low-oligosaccharide varieties of
soybeans and fed to broiler chicks. Poult. Sci. 90:390-395.
Baker, S. and T. Herrman. 2002. Evaluating feed particle size. Bulletin MF-2051. Kansas State
Agricultural Experiment Station and Cooperative Extension Service, Manhattan, KS.
Bhatti, T., R. E. Chambers, and J.R. Clamp. 1970. The gas chromatographic properties of
biologically important N-acetylglucosamine derivatives, monosaccharides, disaccharides,
trisaccharides, tetrasaccharides and pentasaccharides. Biochim Biophys Acta. 222:339-
347.
Carré, B., L. Derouet, and B. Leclercq. 1990. The digestibility of cell-wall polysaccharides from
wheat (bran or whole grain), soybean meal, and white lupin meal in cockerels, muscovy
ducks, and rats. Poult. Sci. 69:623-633.
33
Carré, B., J. Gomez, and A. M. Chagneau. 1995. Contribution of oligosaccharide and
polysaccharide digestion, and excreta losses of lactic acid and short chain fatty acids, to
dietary metabolizable energy values in broiler chickens and adult cockerels. Br. Poult.
Sci. 36:611-629.
Choct, M., Y. Dersjant-Li, J. McLeish, and M. Peisker. 2010. Soy oligosaccharides and soluble
non-starch polysaccharides: a review of digestion, nutritive and anti-nutritive effects in
pigs and poultry. Asian-Aust. J. Anim. Sci. 10:1386-1398.
Coon, C. N., K. L. Leske, O. Akavanichan, and T. K. Cheng. 1990. Effect of oligosaccharide-free
soybean meal on true metabolizable energy and fiber digestion in adult roosters. Poult.
Sci. 69:787-793.
Cristofaro, E., F. Mottu, and J. J. Wuhrmann. 1974. Involvement of the raffinose family of
oligosaccharides in flatulence. Pages 313-336 in Sugars in Nutrition. H. Sipple and K.
McNutt, ed. Academic Press. New York, NY.
Donohue, M. and D. L. Cunningham. 2009. Effects of grain and oilseed prices on the costs of US
poultry production. J. Appl. Poult. Res. 18:325-337.
Gitzelmann, R. and S. Auricchio. 1965. The handling of soy alpha-galactosidase by a normal and
galactosemic child. Pediatrics 36:231-238.
Grieshop, C. M., C. T. Kadzere, G. M. Clapper, E. A. Flickinger, L. L. Bauer, R. L. Frazier, and
G. C. Fahey Jr. 2003. Chemical and nutritional characteristics of United States soybeans
and soybean meals. J. Agric. Food Chem. 51:7684-7691.
Hill, F. W. and L. Anderson. 1958. Comparison of metabolizable energy and productive energy
determinations with growing chicks. J. Nutr. 64:587-603.
Holst, D. O. 1973. Holst filtration apparatus for Van Soest detergent fiber analysis. J. AOAC
56:1352–1356.

34
Irish, G. G., G. W. Barbour, H. L. Classen, R. T. Tyler, and M. R. Bedford. 1995. Removal of the
α-galactosides of sucrose from soybean meal using either ethanol extraction or exogenous
α-galactosidase and broiler performance. Poult. Sci. 74:1484-1494.
Leone, J. L. 1973. Collaborative study of the quantitative determination of titanium dioxide in
cheese. J. Assoc. Off. Anal. Chem. 56:535-537.
Leske, K. L. and C. N. Coon. 1999. Nutrient content and protein and energy digestibilities of
ethanol extracted, low α-galactoside soybean meal as compared to intact soybean meal.
Poult. Sci. 78:1177–1183.
Lopez, G. and S. Leeson. 2008. Assessment of the nitrogen correction factor in evaluating
metabolizable energy of corn and soybean meal in diets for broilers. Poult. Sci. 87:298-
306.
Nemcova, R., A. Bomba, S. Gancarcikova, R. Herich, and P. Guba. 1999. Study of the effect of
Lactobacillus paracasei and fructooligosaccharides on the fecal microflora in weanling
piglets. Berl. Munich Tierarztl Wochenschr 112:225-228.
NRC. 1994. Nutrient Requirements of Poultry. 9th ed. Natl. Acad. Press, Washington, D.C.
NRC. 1998. Nutrient Requirements of Swine. 10th rev. ed. Natl. Acad. Press, Washington, D.C.
Parsons, C. M., K. Hashimoto, K. J. Wedekind, and D. H. Baker. 1991. Soybean protein
solubility in potassium hydroxide: an in vitro test of in vivo protein quality. J. Anim. Sci.
69:2918-2924.
Parsons, C. M., Y. Zhang, and M. Araba. 2000. Nutritional evaluation of soybean meals varying
in oligosaccharide content. Poult. Sci. 79:1127-1131.
SAS Institute. 2004. SAS User’s Guide. Statistics. Version 9.1 ed. SAS Inst. Inc., Cary, NC.
Sibbald, I. R. and S. J. Slinger. 1963. A biological assay for metabolizable energy in poultry feed
ingredients together with findings which demonstrate some of the problems associated
with the evaluation of fats. Poult. Sci. 42:313–325.

35
Tukey, J. W. 1953. The problem of multiple comparisons. Pages 1948-1983 in The Collected
Works of John W. Tukey VIII. Multiple Comparisons. Chapman and Hall, New York.
USDA. 1953. The test weight per bushel of grain: Method of use and calibration of the apparatus.
Circular No.921. U.S. Government Printing Office, Washington, D.C.

36
Table 3.1 Ingredient and calculated nutrient composition of the basal diets fed from 20 to 29 d of
age for AMEn determination (experiments 1 and 2)
Item Basal
Ingredient, % ―as-fed‖
Ground corn 64.24
Distillers dried grains with solubles 12.06
Peanut meal (41% CP) 10.05
Poultry by-product meal 10.05
Poultry oil 1.00
Limestone 0.85
Sodium chloride 0.32
Dicalcium phosphate 0.23
DL-Met 0.19
L-Lys.HCl 0.38
L-Thr 0.11
L-Trp 0.02
Vitamin Premix1 0.25
Mineral premix2 0.25
Calculated Analysis (%)3
AMEn (kcal/kg) 3,213
CP 19.50
digestible TSAA 0.74
digestible Lys 0.98
digestible Thr 0.66
digestible Ile 0.63
digestible Val 0.78
digestible Trp 0.16
digestible Arg 1.19
Ca 0.81
Non-phytate P 0.40
Na 0.21 1Vitamin premix includes per kg of diet: Vitamin A (Vitamin A acetate), 8,000 IU; Vitamin D
(cholecalciferol), 2,000 IU; Vitamin E (DL-alpha tocopherol acetate), 8 IU; menadione
(menadione sodium bisulfate complex), 2 mg; Vitamin B12 (cyanocobalamin), 0.02 mg; folacin
(folic acid), 0.5 mg: D-pantothenic acid (calcium pantothenate), 15 mg; riboflavin (riboflavin), 5.4
mg; niacin (niacinamide), 45 mg; thiamin (thiamin mononitrate), 1 mg; D-biotin (biotin), 0.05 mg;
and pyridoxine (pyridoxine hydrochloride), 2.2 mg; choline (choline chloride), 500 mg. 2Mineral premix include per kg of diet: Mn (manganous oxide), 65 mg; Zn (zinc oxide), 55 mg; Fe
(iron sulfate monohydrate), 55 mg; Cu (copper sulfate pentahydrate), 6 mg; I (calcium iodate), 1
mg; Se (sodium selenite), 0.3 mg. 3Values reported as percentages unless noted otherwise. Digestible amino acid values were
determined from digestibility coefficients and calculated total amino acid content of the
ingredients (Ajinomoto Heartland, LLC. 2004).

Table 3.2 Ingredient composition of semi-purified diets fed from 26 to 31 d of age for apparent ileal amino acid
digestibility of control (CSBM), low oligosaccharide (LOSBM), and ultra-low oligosaccharide (ULSBM)
soybean meal fed to broiler chickens (experiments 3 and 4)
Experiment 3 Experiment 4
CSBM LOSBM CSBM LOSBM ULSBM
Ingredient, % ―as-fed‖
Soybean meal 43.00 43.00 41.80 37.30 36.20
Dextrose 41.85 41.85 43.05 47.55 48.65
Poultry oil 5.00 5.00 5.00 5.00 5.00
Solkafloc 5.00 5.00 5.00 5.00 5.00
Titanium dioxide 0.50 0.50 0.50 0.50 0.50
Dicalcium phosphate 1.90 1.90 1.90 1.90 1.90
Limestone 1.00 1.00 1.00 1.00 1.00
Choline chloride 0.25 0.25 0.25 0.25 0.25
Sodium chloride 0.20 0.20 0.20 0.20 0.20
Sodium bicarbonate 0.55 0.55 0.55 0.55 0.55
Vitamin premix1 0.50 0.50 0.50 0.50 0.50
Mineral premix2 0.25 0.25 0.25 0.25 0.25
1Vitamin premix includes per kg of diet: Vitamin A (Vitamin A acetate), 8,000 IU; Vitamin D (cholecalciferol),
2,000 IU; Vitamin E (DL-alpha tocopherol acetate), 8 IU; menadione (menadione sodium bisulfate complex), 2
mg; Vitamin B12 (cyanocobalamin), 0.02 mg; folacin (folic acid), 0.5 mg: D-pantothenic acid (calcium
pantothenate), 15 mg; riboflavin (riboflavin), 5.4 mg; niacin (niacinamide), 45 mg; thiamin (thiamin
mononitrate), 1 mg; D-biotin (biotin), 0.05 mg; and pyridoxine (pyridoxine hydrochloride), 2.2 mg; choline
(choline chloride), 500 mg.
2Mineral premix include per kg of diet: Mn (manganous oxide), 65 mg; Zn (zinc oxide), 55 mg; Fe (iron sulfate
monohydrate), 55 mg; Cu (copper sulfate pentahydrate), 6 mg; I (calcium iodate), 1 mg; Se (sodium selenite),
0.3 mg.
37

Table 3.3 Physical and chemical characteristic of control (CSBM), low oligosaccharide (LOSBM), and ultra-low oligosaccharide (ULSBM) soybean
meals on an as-is basis1
Item (%), unless otherwise
noted
Experiments 1 and 3
Experiments 2 and 4
Analytical Method CSBM LOSBM CSBM LOSBM ULSBM
Dry Matter 91.16 91.69 90.70 91.50 91.90 AOAC5 934.01. 2006
Crude Protein 47.60 54.59 47.86 53.73 55.63 AOAC 990.03. 2006 Crude Fat 1.71 1.12 1.24 0.79 0.77 AOAC 2003.06. 2006 Sucrose 6.95 8.38 7.47 8.71 7.78 Bhatti et al., 1970 Raffinose 0.71 0.21 0.82 0.21 0.07 Bhatti et al., 1970 Stachyose 6.79 1.56 5.08 1.44 0.50 Bhatti et al., 1970 Starch 0.89 1.24 0.81 0.61 0.40 AACC
6 76-13. 2006
7
ADF 5.54 3.52 5.50 3.39 4.19 AOAC 973.18 (A-D). 2006 NDF 8.09 4.60 8.07 4.84 5.91 Holst, 1973 Cellulose 5.53 3.74 5.71 3.68 4.36 AOAC 973.18 (A-D). 2006 Gross Energy (kcal/kg) 4,226 4,287 3,998 4,037 4,149 Isoperibol bomb calorimeter
7 Particle Size (Dgw)
2 1,300 1,166 1,059 1,279 1,106 ASAE
8 S319.4. 1993
Bulk Density (g/cc)3
0.53 0.65 0.69 0.75 0.79 USDA, 1953 KOH Solubility 82.24 83.44 78.93 84.31 82.58 Parsons et al., 1991 Trypsin Inhibitor (TIU/g)
4 3,429 5,924 3,183 4,323 5,677 AACC
22-40. 2006
1Unless otherwise noted, all methods of analysis were determined by the University of Missouri Experimental Station Chemical Laboratories,
Columbia, MO. 2Dgw = geometric mean diameter in µm, determined by Iowa State University.
3(g/cc) = grams per cubic centimeter, determined by Iowa State University.
4TIU = Trypsin inhibitor units.
5AOAC = Association of Official Analytical Chemists.
6AACC = Association of American Cereal Chemists.
7Modified Starch Assay Kit (product code STA-20, Sigma, St. Louis, MO).
7Isoperibol bomb calorimeter (Parr model no. 6300) determined by Auburn University Laboratory (Auburn, AL).
8ASAE = American Society of Agricultural Engineers
38

Table 3.4 Apparent ileal amino acid digestibility (AIAAD) coefficients and concentrations of digestible amino acids (AA) of control
(CSBM) and low-oligosaccharide (LOSBM) soybean meals1 (experiment 3)
AIAAD Coefficients (%) Digestible AA Concentrations (%)
Source2
CSBM LOSBM SEM3 P-Value CSBM LOSBM SEM
3 P-Value
Indispensable Amino Acids
Arginine 91.7 90.6 0.2 <0.001 3.32 4.08 0.010 <0.001
Histidine 91.4 89.7 0.3 <0.001 1.20 1.29 0.004 <0.001
Isoleucine 87.6 85.3 0.3 <0.001 2.06 2.14 0.008 <0.001
Leucine 88.9 86.8 0.3 <0.001 3.45 3.63 0.012 <0.001
Lysine 91.8 90.1 0.2 <0.001 2.83 2.97 0.008 <0.001
Methionine 92.0 90.4 0.3 <0.001 0.59 0.61 0.002 <0.001
Phenylalanine 89.4 87.0 0.3 <0.001 2.29 2.41 0.008 <0.001
Threonine 86.5 84.0 0.3 <0.001 1.76 1.79 0.007 0.003
Valine 87.9 85.8 0.3 <0.001 2.14 2.21 0.008 <0.001
Tryptophan 88.7 86.9 0.3 <0.001 0.59 0.59 0.002 0.176
Dispensable Amino Acids
Alanine 89.1 86.0 0.3 <0.001 1.95 1.86 0.006 <0.001
Aspartic Acid 90.9 88.4 0.3 <0.001 4.79 5.19 0.017 <0.001
Cystine 85.4 84.0 0.4 0.012 0.60 0.65 0.003 <0.001
Glutamic Acid 90.9 88.4 0.3 <0.001 7.77 8.38 0.026 <0.001
Glycine 87.2 85.3 0.3 <0.001 1.84 1.90 0.007 <0.001
Proline 90.0 87.2 0.3 <0.001 2.58 2.64 0.009 <0.001
Serine 88.1 86.1 0.3 <0.001 2.18 2.29 0.008 <0.001
Tyrosine 88.6 85.3 0.3 <0.001 1.07 1.05 0.004 0.002 1Values were least-square means of 12 replicate cages with each cage containing 12 birds from 26 to 31 d of age.
2CSBM = control soybean meal; LO-SBM = low oligosaccharide soybean meal.
3Pooled standard error.
39

Table 3.5 Apparent ileal amino acid digestibility (AIAAD) coefficients and concentrations of digestible amino acids (AA) of control
(CSBM), low-oligosaccharide (LOSBM), and ultra-low oligosaccharide (ULSBM) soybean meals1 (experiment 4)
AIAAD Coefficients (%) Digestible AA Concentrations(%)
Source2
CSBM LOSBM ULSBM SEM3 P-Value
4 CSBM LOSBM ULSBM SEM
3 P-Value4
Indispensable Amino Acids
Arginine 94.2a
93.1b
93.0b
0.4 0.022 3.49c
3.88b
4.26a
0.015 <0.001
Histidine 87.9
89.2
88.9
0.4 0.085 1.18c
1.28b
1.39a
0.006 <0.001
Isoleucine 85.8
87.0
86.2
0.5 0.213 1.85c
2.03b
2.23a
0.012 <0.001
Leucine 85.9
87.3
86.8
0.5 0.139 3.30c
3.58b
3.85a
0.020 <0.001
Lysine 88.4
89.4
89.2
0.4 0.182 2.78c
2.96b
3.21a
0.014 <0.001
Methionine 90.1 90.9 90.5 0.4 0.421 0.62c
0.66b
0.71a
0.003 <0.001
Phenylalanine 86.6
88.0
87.6
0.5 0.117 2.16c
2.34b
2.55a
0.013 <0.001
Threonine 80.6
82.3
82.1
0.6 0.074 1.57c
1.69b
1.78a
0.012 <0.001
Valine 83.1 84.7 83.6 0.5 0.110 1.90c
2.08b
2.27a
0.014 <0.001
Tryptophan 90.8 91.4 91.2 0.3 0.381 0.59c
0.66b
0.68a
0.002 <0.001
Dispensable Amino Acids
Alanine 84.8
86.3
86.1
0.5 0.072 1.79c
1.92b
2.05a
0.011 <0.001
Aspartic Acid 84.9 86.2 86.1 0.4 0.119 4.80c
5.33b
5.72a
0.030 <0.001
Cystine 74.4b
77.6a
79.1a
0.7 <0.001 0.51c
0.58b
0.66a
0.005 <0.001
Glutamic Acid 88.9 89.8 89.5 0.4 0.302 7.55c
8.39b
8.89a
0.039 <0.001
Glycine 82.4b
84.7a
84.2a
0.5 0.009 1.71c
1.86b
2.00a
0.012 <0.001
Proline 84.3b
86.2a
85.9a
0.5 0.015 2.07c
2.28b
2.49a
0.013 <0.001
Serine 84.4b
85.8ab
86.1a
0.5 0.048 1.99b
2.24a
2.25a
0.013 <0.001
Tyrosine 86.7
87.8
87.9
0.4 0.115 1.57c
1.69b
1.80a
0.008 <0.001 1Values were least-square means of 10 replicate cages with each cage containing 12 birds from 26 to 31 d of age.
2CSBM = control soybean meal; LOSBM = low oligosaccharide soybean meal; ULSBM = ultra low oligosaccharide soybean meal.
3Pooled standard error.
4Least-square means within the same row with different superscripts are different at (P < 0.05).
40

41
A)
B)
Figure 3.1 Apparent MEn of low oligosaccharide soybean meals fed to Ross × Ross
708 broilers. A) Apparent MEn of a control SBM (CSBM) and low oligosaccharide
SBM (LOSBM) determined in experiment 1. B) Apparent MEn of CSBM, LOSBM,
and ultra-low oligosaccharide SBM (ULSBM) determined in experiment 2. The
soybean meals were fed as part of a complete diet from 20 to 29 d of age for both
experiments. Apparent MEn of soybean meals were determined using the substitution
method developed by Sibbald and Slinger (1963). Means were separated using Tukey’s
Honestly Significant Difference multiple comparison test.
2,241
2,435
1,800
1,900
2,000
2,100
2,200
2,300
2,400
2,500
CSBM LOSBM
kca
l/k
g
P = 0.011
SEM = 53
2,073b
2,214a
2,080b
1,900
1,950
2,000
2,050
2,100
2,150
2,200
2,250
2,300
CSBM LOSBM ULSBM
kca
l/k
g
P = 0.012
SEM = 36

42
IV. GROWTH PERFORMANCE AND MEAT YIELDS OF BROILER CHICKENS FED
DIETS CONTAINING LOW AND ULTRA-LOW OLIGOSACCHARIDE SOYBEAN
MEAL DURING A SIX WEEK PRODUCTION PERIOD
ABSTRACT
Two experiments were conducted to determine the effects of broilers fed diets containing
low oligosaccharide soybean meals (SBM) on growth performance, meat yields, and
physiological variables during a 6 wk production period. In experiment 5, 600 Ross × Ross 708
male chicks were randomly distributed to 24 floor pens (25 birds per pen; 0.09 m2 per bird at 1 d
of age). Birds were fed corn-soybean meal-poultry by-product meal-based diets with either low
oligosaccharide (LOSBM) or control SBM (CSBM) from 1 to 40 d of age. In experiment 6, 1,500
Ross × Ross 708 male chicks were randomly distributed to 60 floor pens (25 birds per pen; 0.09
m2 per bird at 1 d of age). Broilers were fed corn-soybean meal-poultry by-product meal-based
diets containing 1 of 3 SBM sources (CSBM, LOSBM, or ultra-low oligosaccharide SBM
[ULSBM]) and formulated with moderate or reduced AMEn concentrations (25 kcal/kg
reduction) resulting in a 3 × 2 factorial design. Diets were formulated using AMEn and digestible
amino acid (AA) values determined from previous research utilizing the same SBM types.
Variables measured consisted of BW gain, feed intake, feed conversion ratio (FCR), mortality,
carcass weight and yield, abdominal fat percentage, total breast meat weight and yield, digesta
viscosities and pH, plasma nonesterfied fatty acids, plasma glucose, and plasma triglycerides. In
experiment 5, broilers fed diets containing LOSBM grew faster (P = 0.02) and had decreased (P
< 0.001) feed conversion from 1 to 14 d of age. Abdominal fat percentage was higher (P < 0.001)
for birds fed LOSBM vs. CSBM. In experiment 6, no differences were observed for interaction

43
effects or main effects of energy concentration. Feed conversion ratio was lower (P < 0.001) for
broilers fed diets containing ULSBM vs. LOSBM and CSBM from 1 to 28 and 1 to 42 d of age.
Broilers fed diets formulated with ULSBM had higher (P < 0.05) carcass yield vs. birds fed diets
with CSBM. Total breast yield was higher (P = 0.021) for birds fed diets containing LOSBM and
ULSBM vs. CSBM. Abdominal fat percentage was higher (P = 0.027) for broilers fed diets
containing LOSBM vs. CSBM. Diets formulated with LOSBM and ULSBM required
approximately 45% less supplemental fat, and broilers fed these diets exhibited no adverse effects
on growth performance and meat yields compared with broilers fed diets containing CSBM.
INTRODUCTION
Dietary energy sources represent a significant cost of poultry diets (Donohue and
Cunningham, 2009). Since 2006, prices for energy-providing ingredients have increased
dramatically due to a large portion of the corn and oil supply being diverted away from animal
agriculture to satisfy production demands for ethanol and biodiesel (Donohue and Cunningham,
2009). In the future, a larger proportion of animal fats and vegetable oils may be utilized for
biodiesel production leading to further increases in cost for these products, hence creating a need
to identify strategies to enhance energy utilization of cereal grains and oilseed meals. Optimizing
energy utilization of these primary ingredients will allow nutritionists to formulate diets with
lower inclusions of supplemental fat.
Apparent MEn of SBM is approximately 28% less for poultry compared with swine
(NRC, 1994, 1998). Lower AMEn values for SBM may be attributed to its carbohydrate fraction,
which is primarily composed of cellulose, non-starch polysaccharides, and
galactooligosaccharides (GAL) (Choct et al., 2010). Besides sucrose, the carbohydrate fraction of
SBM is poorly utilized by poultry due to a lack of endogenous galactosidase and low
fermentative capacity of the gastrointestinal tract (Gitzelmann and Auricchio, 1965; Carré et al.,
1995). Galactooligosaccharides (raffinose and stachyose) comprise between 5 and 7% of SBM on

44
a DM basis (Bach Knudsen, 1997; Grieshop et al., 2003) and are poorly digested because
monogastric animals do not produce endogenous α-1,6 galactosidase necessary for GAL
hydrolysis into its constituent monosaccharides (Gitzelmann and Auricchio, 1965; Cristofaro et
al., 1974). Several strategies have been implemented to reduce the concentration of raffinose and
stachyose of SBM to enhance dietary energy utilization with poultry (Coon et al., 1990; Parsons
et al., 2000; Ghazi et al., 2003).
Novel soybean varieties have been genetically selected for reduced raffinose and
stachyose content, which may lead to increased AMEn and higher concentrations of digestible AA
when fed to broilers (Parsons et al., 2000; Baker et al., 2011; Perryman and Dozier, 2012). Baker
et al. (2011) reported higher true digestible AA concentrations for a low GAL SBM vs. a control
SBM, but did not observe differences in TMEn or growth performance in broilers from 8 to 22 d
of age. Perryman and Dozier (2012) reported a 7 to 9% increase in AMEn for LOSBM vs. CSBM
and observed 8.0 and 17% greater apparent ileal AA digestibility (AIAAD) concentrations for
Met, Lys, Thr, Val, and Ile for LOSBM and ULSBM, respectively, compared with CSBM.
To our knowledge, growth and meat yield responses of broilers fed diets formulated with
LOSBM or ULSBM have not been reported on in the literature. Therefore, the objective of this
research was to evaluate growth and meat yield responses of broilers fed diets formulated with
LOSBM, ULSBM, or CSBM during a 6 wk production period. In experiment 6, diets were also
formulated to contain either moderate or reduced AMEn concentrations. Feeding broilers a
reduced AMEn diet may accentuate growth and meat yield responses with diets containing
LOSBM and ULSBM compared with CSBM.
MATERIALS AND METHODS
The Institutional Animal Care and Use Committee at Auburn University approved all
experimental protocols involving live birds (PRN 2009-1668).

45
Soybean Meals
In experiment 5, 2 SBM (CSBM and LOSBM) were produced from soybeans grown in
the 2009 crop yr. In experiment 6, CSBM, LOSBM, and ULSBM produced from soybeans grown
during the 2010 crop yr were evaluated. Soybeans were obtained from Schillinger Genetics
(Schillinger Genetics, West Des Moines, IA) and processed at Zeeland Farm Services’ processing
plant (Zeeland Farm Services, Zeeland, MI). Nutrient composition of SBM has been reported to
be influenced by production location, fertilization rate, and rainfall (Greishop et al., 2003; Karr-
Lilienthal et al., 2005). To avoid agronomic differences, soybeans were grown in the same
geographic location in northeast Indiana. The resulting soybeans were processed at the same
facility, utilizing identical procedures to avoid processing differences.
The 5 SBM types were analyzed for CP by determining nitrogen content via the Dumas
method (method 990.03; AOAC International, 2006) using a N analyzer (Rapid N Cube,
Elementar Analysensyteme GmbH, Hanau, Germany), and CP was calculated by multiplying
percent N by a factor of 6.25 (Table 4.1). Sucrose, raffinose, and stachyose were determined
(Bhatti et al., 1970), as well as starch (method 76-13; AACC International, 2006), acid detergent
fiber (ADF) (method 973.18 (A-D); AOAC International, 2006), neutral detergent fiber (NDF)
(Holst, 1973), cellulose (method 973.18 (A-D); AOAC International, 2006), and trypsin inhibitor
concentration (method 22-40.01; AACC International, 2006). Soybean meals were dried to
determine DM (method 934.01; AOAC International, 2006) and were analyzed for gross energy
(GE) using bomb calorimetry (Model 6300, Parr Instruments, Moline, IL). Crude fat
concentrations were estimated by boiling samples in hexane (method 2003.06; AOAC
International, 2006) in a fat extractor (Soxtec model number 2043, Foss North America, Inc.,
Eden Prairie, MN). Particle size was determined on a 13 half-height sieve shaker (Tyler RoTap,
Mentor, OH) as described by Baker and Herrman (2002). Bulk density was determined utilizing a
standard weight per bushel tester (USDA, 1953).

46
Dietary Treatments
In each experiment, broilers were fed diets using a 3-phase feeding program: starter (1 to
14 d of age), grower (15 to 28 d of age), and finisher (29 to 40 or 42 d of age for experiments 5
and 6, respectively) feeding phases. Starter diets were provided as crumbles, and subsequent
feeds were provided as whole pellets. All diets were formulated to meet or exceed NRC (1994)
nutrient recommendations and were formulated utilizing AMEn and AIAAD concentrations for
CSBM, LOSBM, and ULSBM determined from previous research (Perryman and Dozier, 2012;
Table 4.2).
In experiment 5, broilers were fed 1 of 2 dietary treatments formulated to contain either
LOSBM or CSBM (Table 4.3). In experiment 6, 6 dietary treatments were implemented utilizing
a 3 × 2 factorial design consisting of 3 types of SBM (CSBM, LOSBM, or ULSBM) and 2 AMEn
concentrations (moderate or reduced) (Tables 4.4-4.6). Diets with moderate AMEn were
formulated to contain 3,025, 3,115, and 3,160 kcal AMEn/kg in the starter, grower, and finisher
phases, respectively. Diets with reduced AMEn were formulated to contain a 25 kcal/kg reduction
in AMEn compared with the moderate AMEn diets.
Common Procedures
Ross × Ross 708 male broiler chicks (experiment 5 = 600; experiment 6 = 1,500) were
obtained from a commercial hatchery at 1 d of age and distributed randomly to 24 (experiment 5)
or 60 (experiment 6) floor pens (0.09 m2/bird; 25 birds per pen). At the hatchery, chicks received
vaccinations for Marek’s disease, Newcastle disease, and infectious bronchitis. The experimental
facility was solid-sided with a negative-pressure ventilation system equipped with an electronic
controller, vent boards, exhaust fans, and evaporative cooling pads. Ambient temperature set
points consisted of 33°C from placement until 4 d of age, 32°C from 5 to 8 d of age, 31°C from 9
to 13 d of age, 29°C from 14 to 22 d of age, 26°C from 23 to 27 d of age, 25°C from 28 to 32 d of
age, 23°C from 33 to 38 d of age, and 21°C from 39 to 42 d of age. Actual average ambient
temperatures during experimentation were 26.2°C ± 1.9 SD for experiment 5 and 24.9°C ± 2.3

47
SD for experiment 6. The lighting schedule followed the primary breeder recommendation with a
23L:1D photoperiod at a light intensity of 30 lux, which was implemented from placement to 7 d
of age, then, a 20L:4D photoperiod with an intensity of 3 lux was utilized until 40 or 42 d of age.
Light intensity was verified at bird level using a photometric sensor (LI-250A Light Meter, LI-
COR Bioscience, Lincoln, NE) with National Institute of Standards and Technology traceable
calibration for each intensity adjustment. Each pen had fresh pine shavings, a hanging feeder,
and a nipple drinker line, and birds were offered feed and water ad libitum. Birds and feed were
weighed on a per pen basis at 1, 14, 28, and 40 or 42 d of age for the determination of growth
rate, feed intake, and FCR (ratio of feed intake to BW gain). Mortality was recorded daily.
At 37 d of age, 3 birds per pen were randomly selected for blood collection. Blood was
collected via the ulnar vein using a 10 mL non-heparinized syringe equipped with an 18-gauge
needle. An 8 mL sample of blood per bird was obtained for the determination of plasma glucose,
triglyceride, and nonesterfied fatty acid concentrations. Samples were centrifuged using a Sorvall
Legend 23R centrifuge (ThermoFisher Scientific Inc., Waltham, MA) at 2000 × g for 5 min and
1.5 mL of plasma was obtained and stored at -20°C for later analysis. Plasma glucose (Kunst et
al., 1986) and triglyceride (Wahlefeld and Bergmeyer, 1974) concentrations were determined
using a Cobas C 311 analyzer (Roche Diagnostics, Indianapolis, IN). Plasma nonesterfied fatty
acid concentrations were determined using the method described by Tripathy et al. (2003).
Concentrations of plasma nonesterfied fatty acids were measured using a universal microplate
spectrophotometer (Bio-Tek Instrument Inc., Winooski, VT) with reagent assay test kits (Wako
Diagnostics, Richmond, VA) according to the manufacturer’s instructions. Five µL of sample,
standard, or blank were added to the appropriate wells and analyzed utilizing enzymatic
procedures described by Hintz (2000). All samples were evaluated in triplicate during the same
assay in order to avoid inter-assay variability. The amount of nonesterfied fatty acid in the sample
was determined using standard curves from the optical density measured at 550 nm.

48
At 40 (experiment 5) and 42 d of age (experiment 6), 14 birds per pen were individually
weighed and selected for processing based on having a BW within ±15% of the mean pen weight.
In addition to BW determination, all birds were evaluated for pododermatitis (PD) by trained
personnel assigning a score of 0, 1, or 2 based on the severity of footpad lesions via the method
describe by Nagaraj et al. (2007). Feed was removed 12 h prior to processing, after which, pre-
selected birds were placed in coops and transported to the Auburn University Processing Plant.
Broilers were electrically stunned, exsanguinated, scalded, mechanically picked, mechanically
eviscerated, and then placed on ice. Whole carcass (without abdominal fat) and abdominal fat
were weighed, and carcasses were split into front and back halves and then placed on ice for 18 h.
The front halves were then deboned to obtain total breast weights, which were composed of the
pectoralis major and minor muscles. Carcass, abdominal fat percentage, and total breast meat
yields were determined from individual BW of broilers selected for processing at 40 (experiment
5) and 42 d of age (experiment 6).
At 41 (experiment 5) or 43 d of age (experiment 6), 3 birds per pen were euthanized via
CO2 asphyxiation to collect foregut (proximal duodenum to Meckel’s diverticulum) and hindgut
(Meckel’s diverticulum to ileocecocolic junction) segments of the intestine to determine digesta
pH and viscosity. Digesta were gently expressed from each segment into a 50 mL tube, and pH
values were recorded before the samples were placed on ice and transferred to a -20°C freezer
until later analysis. For viscosity determination, samples were centrifuged at 1,500 × g for 5 min,
and the supernatant was transferred to 15 mL tubes for further analysis. Samples were centrifuged
at 12,500 × g for 5 min and 8 mL of supernatant was collected and stored at -20°C until later
analysis. Viscosities were measured in centipoises (cP) using a Brookfield DV-E viscometer
(Brookfield Engineering Laboratories Inc., Midddleboro, MA) following the manufacturer’s
recommended procedure. Briefly, an 8 mL sample was heated to 40°C and placed in the
viscometer. Using the S18 spindle and a rotational speed of 12 rpm, the spindle was submerged

49
completely in sample using the sample guard as a guide. The viscometer was activated and a
viscosity (cP) value was recorded after 10 s.
Statistical Analyses
Data were analyzed using a randomized complete block design with pen location as the
blocking factor. Experiment 5 was represented by 12 replicate pens per treatment. Analysis of
variance was performed using PROC MIXED (SAS Institute, 2004) by the following mixed-
effects model:
Yij = μ.. + ρi + τj + εij
where μ.. is the overall mean; the ρi are identically and independently normally distributed
random block effects with mean 0 and variance σ2
ρ; the τj are fixed factor level effects
corresponding to the jth
soybean variety (CSBM or LOSBM) such that Στj = 0; and the random
error εij are identically and independently normally distributed with mean 0 and variance σ2.
Experiment 6 was designed as a 3 × 2 factorial with 3 SBM types (CSBM, LOSBM, or
ULSBM) and 2 AMEn concentrations (moderate or reduced) and each treatment was represented
by 10 replicate pens. Interaction and main effects were evaluated using PROC MIXED (SAS
Institute, 2004) by the following mixed-effects model:
Yijk = μ... + ρi + αj + βk + (αβ)jk + εijk
where μ... is the overall mean; the ρi are identically and independently normally distributed
random block effects with mean 0 and variance σ2
ρ; the αj are fixed factor level effects
corresponding to the jth
soybean variety (CSBM, LOSBM, or ULSBM) such that Σαj = 0; the βk
are fixed factor level effects corresponding to the kth
AMEn concentration (moderate or reduced)
such that Σβk = 0; the (αβ)jk are interaction level effects corresponding to either the jth
soybean
and the kth
AMEn concentration such that Σj(αβ)jk = 0 and Σk(αβ)jk = 0; and the random error εijk
are identically and independently normally distributed with mean 0 and variance σ2. Statistical
significance was established at P ≤ 0.05, and significantly different treatment means were
separated using Tukey’s Honestly Significant Difference test (Tukey, 1953).

50
RESULTS AND DISCUSSION
Physical and Chemical Characteristics
Soybean meal genetically selected for low concentrations of GAL contained altered
sugar, fiber, and CP composition compared with commodity SBM (Baker and Stein, 2009; Baker
et al., 2011). Quantifying changes in chemical composition of trait enhanced SBM is valuable
when interpreting growth responses and carcass characteristic differences. Both LOSBM and
ULSBM exhibited altered chemical and physical composition compared with CSBM (Table 4.1).
The resulting chemical and physical characteristics are presented as numerical diferences because
statistical analysis could not be applied due to a lack of replication. In experiment 5, LOSBM had
less stachyose (-77%), raffinose (-70%), ADF (-36%), NDF (-43%), and cellulose (-32%), and
more CP (+15%), sucrose (+21%), and starch (+39%) compared with CSBM. Particle size was
determined to be 1,300 and 1,166 µm mean diameter for CSBM and LOSBM, respectively, and
bulk density was greater (+23%) for LOSBM vs. CSBM.
In experiment 6, both LOSBM and ULSBM had lower concentrations of stachyose (-72
and -90%) and raffinose (-74 and -91%), and higher sucrose (+17 and +4%) and CP (+12 and
+16%) concentrations compared with CSBM. Moreover, cellulose (-36 and -24%), ADF (-38 and
-24%), and NDF (-40 and -27%) concentrations were lower for LOSBM and ULSBM vs. CSBM.
Particle size was determined as 1,059, 1,279, and 1,106 µm mean diameter for CSBM, LOSBM,
and ULSBM, respectively, and bulk density was greater (+9 and +15%) for LOSBM and ULSBM
compared with CSBM.
Growth Performance, Physiological Variables, and Pododermatitis
In experiment 5, broilers consuming diets formulated with LOSBM had increased (P =
0.020) BW gain and decreased (P < 0.001) FCR compared with broilers fed diets formulated with
CSBM from 1 to 14 d of age (Table 4.7). Feed intake and mortality were without change between
broilers consuming either CSBM- and LOSBM-based diets from 1 to 14 d of age. Additionally,

51
BW gain, feed intake, FCR, and mortality were not different between broilers fed diets
formulated with CSBM and LOSBM from 1 to 28 and 1 to 40 d of age. No differences were
observed between broilers consuming diets formulated with CSBM or LOSBM for the
physiological variables measured (data not shown; grand means for foregut viscosity = 35.8 cPa,
hindgut viscosity = 39.8 cPa, foregut pH = 5.95, hindgut pH = 5.33, NEFA = 451 mEq/L, plasma
glucose = 220 mg/dL, and plasma triglycerides = 131 mg/dL).
In experiment 6, interaction effects were not significant between AMEn concentration and
SBM type. Thus, data are presented as main effects of SBM type and AMEn concentration (Table
4.8). Body weight gain, feed intake, and mortality were similar between broilers fed the 3 SBM
types throughout the experimental period. Feed conversion was decreased (P < 0.001) for broilers
fed diets containing ULSBM from 1 to 28 and 1 to 42 d of age compared with birds receiving
CSBM- or LOSBM-based diets. Feeding broilers diets with moderate or reduced AMEn
concentration did not elicit differences in growth performance. Additionally, broilers consuming
diets with either of the 3 SBM types and moderate or reduced AMEn had similar viscosity, pH,
and blood plasma profile (data not shown; grand means forforegut viscosity = 30.7 cPa, hindgut
viscosity = 37.2 cPa, foregut pH = 5.91, hindgut pH = 5.33, NEFA = 279 mEq/L, plasma glucose
= 253 mg/dL, and plasma triglycerides = 48 mg/dL).
In experiment 5, broilers fed diets formulated with LOSBM had higher BW gain and
lower FCR than birds fed diets formulated with CSBM from 1 to 14 d of age. These advantages
of growth performance with broilers fed diets formulated with LOSBM may be attributed to the
inability of young broilers to metabolize the complex carbohydrates of SBM due to the immature
gastrointestinal tract of the young chick (Carré et al., 1995). Soybean meal genetically selected
for low concentrations of GAL had reduced concentrations of ADF, NDF, and cellulose
compared with CSBM. Increased amounts of complex carbohydrates in the diet have been
reported to be detrimental to nutrient digestibility due to their possible anti-nutritive effect and the
limited fermentative capacity of the poultry gastrointestinal tract (Choct and Annison, 1990).

52
In contrast to experiment 5, a reduction in feed conversion was not observed among
broilers fed either of the 3 SBM types from 1 to 14 d of age in experiment 6. In agreement, Baker
et al. (2011) observed no differences in BW gain, feed intake, FCR, or mortality when comparing
chicks fed diets formulated with low GAL SBM vs. a control SBM from 8 to 22 d of age.
However, in the present research, FCR was reduced from 1 to 28 and 1 to 42 d of age for broilers
consuming diets formulated with ULSBM compared with CSBM and LOSBM. The basis for this
decrease in FCR is elusive, but may have been attributed to an underestimation of the
predetermined AMEn and digestible AA content of ULSBM utilized in diet formulation
(Perryman and Dozier, 2012). Higher concentrations of dietary AMEn have been reported to
decrease FCR in broilers compared with diets formulated with lower AMEn concentrations
(Hidalgo et al., 2004; Dozier et al., 2006, 2011). Similarly, previous research has reported that
broilers consuming diets with increased AA density have reduced FCR in modern genetic strains
(Kidd et al., 2005; Dozier et al., 2006, 2007; Corzo et al., 2010).
Feeding broilers diets with reduced AMEn density did not elicit any differences in BW
gain, feed intake, FCR, or mortality compared with broilers that consumed diets formulated with
moderate AMEn concentrations (Table 4.8). Similarly, Hidalgo et al. (2004) reported no
differences in cumulative BW gain, feed intake, or FCR of broilers fed diets with weighted
energy concentrations of 3,100 or 3,144 kcal of ME/kg from 1 to 38 d of age. However, broilers
fed diets containing a weighted average of 3,233 kcal of ME/kg were 0.066 kg heavier than
broilers consuming diets with a weighted average of 3,056 kcal of ME/kg from 1 to 38 d of age.
Similarly, FCR was decreased by 6% (1.40 vs. 1.49 kg:kg) for broilers consuming diets
formulated with 3,153 vs. 3,020 kcal of ME/kg from 18 to 30 d of age and decreased by 8% (2.07
vs. 2.24 kg:kg) for broilers consuming diets with 3,175 vs. 3,086 kcal of ME/kg from 31 to 38 d
of age. Poor growth was related to diets being formulated to a constant ME:CP ratio. Broilers did
not compensate for the low ME concentration of the diet, so intake of essential AA was also
lower for birds consuming diets formulating with low ME. In agreement, Saleh et al. (2004)

53
reported no differences in BW gain, feed intake, or FCR for broilers consuming diets with
weighted average energy concentrations of 3,101 or 3,140 kcal of ME/kg from 1 to 42 d of age.
Broilers fed diets with a weighted energy concentration of 3,227 kcal of ME/kg grew faster than
birds fed diets formulated with a weighted average ME concentration of 3,023 kcal of ME/kg
from 1 to 42 d of age. Poor feed conversion in both studies was attributed to reduced BW gain
with broilers fed diets with low energy concentrations. Broilers did not increase feed intake to
compensate for the low energy concentrations of the diets. Feed consumption was not different
between broilers consuming diets varying in ME concentrations by less than 132 kcal of ME/kg
during a 5 or 6 wk production period (Hidalgo et al., 2004; Saleh et al., 2004). These data provide
evidence that birds younger than 42 d of age may not adjust feed intake to compensate for
differences in energy concentrations of the diet. These findings could explain the lack of growth
responses observed in experiment 6 due to broilers consuming diets differing in AMEn by only 25
kcal/kg.
Broilers fed diets formulated with LOSBM or ULSBM had a lower incidence (P = 0.002)
of PD compared with broilers that consumed diets formulated with CSBM, which may have been
due to decreased GAL concentrations of the LOSBM and ULSBM (Figure 1). Bedford (1995)
reported that GAL causes excreta to have hydroscopic properties resulting in increased litter
moisture, and elevated litter moisture has been reported to influence incidences of PD (Martland
1984, 1985; Mayne et al., 2007). Additionally, reduced incidences of PD may be attributed to
lower concentrations of SBM in diets formulated with LOSBM and ULSBM. Soybean meal is
relatively high in K (1.98%) compared with corn (0.30%) (NRC, 1994), so reducing the
concentration of SBM in the diet could lead to lower concentrations of K in the diet. High dietary
K concentrations have been implicated in causing an increase in water intake translating to
elevated litter moisture (Eichner et al., 2007). While litter moisture was not measured in this
experiment, diets formulated with LOSBM and ULSBM had on average 16% less SBM
compared with diets formulated with CSBM. Therefore, diets formulated with LOSBM and

54
ULSBM had less GAL and lower K concentrations due to less SBM formulated into the diet,
which may have had a synergetic effect contributing to a reduction in PD.
Processing Characteristics
In experiment 5, broilers fed diets formulated with CSBM or LOSBM had similar
weights and yields of the whole carcass and total breast meat (Table 4.9). Broilers consuming
diets formulated with LOSBM had increased (P < 0.001) abdominal fat percentage compared
with broilers consuming diets formulated with CSBM. In experiment 6, neither interaction
effects nor main effects of AMEn were observed for carcass yield, but carcass and breast yields
were different among broilers consuming the 3 SBM types (Table 4.10). Broilers fed diets
formulated with ULSBM had greater (P < 0.05) carcass yield compared with birds consuming
CSBM-based diets. Additionally, total breast meat yield was increased (P = 0.021) for broilers
fed diets containing LOSBM and ULSBM vs. CSBM. Increased breast and carcass yields in birds
fed diets formulated with LOSBM or ULSBM may be attributed to better AA utilization of these
diets compared with diets formulated with CSBM. Researchers have reported that increasing
concentrations of complex carbohydrates in poultry diets may negatively influence AA
digestibility (Antoniou et al., 1981; Choct and Annison, 1990). Both LOSBM and ULSBM had
less ADF, NDF, and cellulose compared with CSBM. Furthermore, a possible underestimation of
the digestible AA content of ULSBM and LOSBM determined in previous research could have
been responsible for the greater lean tissue deposition reported herein (Perryman and Dozier,
2012). Previous research has reported that higher concentrations of dietary AA resulted in
increased deposition of lean tissue resulting in higher carcass and total breast weights in broilers
(Bartov et al., 1998; Kidd et al., 2004; Corzo et al., 2005, 2010; Dozier et al., 2008b; Lilly et al.,
2011).
In agreement with experiment 5, broilers fed diets containing LOSBM had higher (P =
0.027) abdominal fat percentage compared with birds consuming CSBM-based diets in
experiment 6 (Table 4.10). Increased abdominal fat percentage could be attributed to the higher

55
AMEn of LOSBM compared with CSBM. Diets in both experiments were formulated to meet the
recommended requirements for the first 5 limiting AA in poultry. Due to higher concentrations of
less limiting AA in LOSBM compared with CSBM, excess AA may have been catabolized for
energy, increasing AMEn and translating to a higher abdominal fat percentage. Parsons et al.
(2000) partially attributed the higher TMEn of several low GAL SBM types to the higher
concentrations of AA of these SBM types, which may have provided a source of energy via their
carbon skeletons. Furthermore, ratios of AMEn:CP were not kept constant between treatments,
and the AMEn:CP ratio was highest for diets formulated with LOSBM compared with CSBM-
and ULSBM-based diets. Additionally, underestimating AMEn of LOSBM would lead to
experimental diets with higher AMEn:CP ratios. Broilers fed diets with progressively higher
AMEn:CP ratio have been reported to have increased abdominal fat percentage with increasing
energy concentrations (Bartov et al., 1974).
In experiment 6, broilers fed diets with varying AMEn concentrations had similar carcass
characteristics (Table 4.10). In agreement, Hidalgo et al. (2004) reported no differences in carcass
and breast weights with broilers fed 6 diets varying in energy density from 1 to 38 d of age.
Similarly, Leeson et al. (1996) reported no differences in breast or carcass weights with broilers
fed diets ranging from 2,700 to 3,100 kcal of ME/kg from 0 to 49 d of age. Conversely, carcass
weights and breast weights were different between broilers fed diets formulated with weighted
dietary energy concentrations of 3,054 or 3,214 kcal of ME/kg from 0 to 63 d of age (Saleh et al.,
2004). These authors attributed this response to the ability of older broilers to increase feed
intake to compensate for the low energy density of the diet. The increase in feed intake resulted in
an increased consumption of essential AA, translating to greater lean tissue deposition. In the
present research, a lack of differences in carcass characteristics may be due to broilers not
increasing feed intake to compensate for lower dietary AMEn concentrations. This finding agrees
with previous research, which reported broilers younger than 42 d of age may not have the ability

56
to increase feed intake to compensate for lower dietary AMEn concentrations (Hidalgo et al.,
2004; Saleh et al., 2004; Dozier et al., 2008a).
Diets formulated with LOSBM or ULSBM contained lower concentrations of poultry oil
compared with diets formulated with CSBM. Less oil supplementation occurred as a result of the
better nutrient profiles of LOSBM and ULSBM (Perryman and Dozier, 2012). Due to higher
digestible AA content, less LOSBM and ULSBM were necessary to satisfy dietary AA
specifications compared with diets formulated with CSBM. With lower inclusions of LOSBM
and ULSBM, higher concentrations of corn entered into diet formulation, which resulted in lower
supplementation of poultry oil. Additionally, LOSBM had a higher AMEn compared with
ULSBM. Therefore, diets formulated with LOSBM required the lowest inclusions of poultry oil
to satisfy dietary energy specifications.
In conclusion, due to the better nutrient profiles of ULSBM and LOSBM, diets
formulated with these SBM types had between 28 and 71% less supplemental oil compared with
diets formulated with CSBM. Broilers consuming diets formulated with either LOSBM or
ULSBM resulted in acceptable growth performance and meat yield responses compared with
birds consuming diets formulated with CSBM. Feeding broilers diets formulated with LOSBM
and ULSBM compared with CSBM also resulted in a 58% reduction in incidences of
pododermatitis during a 6 wk production period. These data support that nutrient utilization of
LOSBM and ULSBM is increased in broilers compared with CSBM. Due to better nutrient
utilization, less supplemental fat is required in diets formulated with LOSBM or ULSBM, which
can translate to a reduction in dietary costs.
ACKNOWLEDGEMENTS
The authors would like to express appreciation to Schillinger Genetics for providing the
experimental soybean meals and to the United Soybean Board for funding this research.

57
REFERENCES
AACC International. 2006. Approved Methods of Analysis, 11th Ed. Method 22-40.01.
Measurement of trypsin inhibitor activity of soy products-spectrophotometric method.
AACC International, St. Paul, MN, U.S.A.
American Society of Agricultural Engineers. 1993. S319.2. Method of determining and
expressing fineness of feed materials by sieving. American Society of Agricultural
Engineers Yearbook of Standard. ASAE, St. Joseph, MO.
Antoniou, T., R. R. Marquardt, and E. Cansfield. 1981. Isolation partial characterization, and
antinutritional activity of a factor (pentosans) in rye grain. J. Agric. Food Chem. 28:1240-
1247.
AOAC International. 2006. Official Methods of Analysis of AOAC International. 18th ed. AOAC
International, Gaithersburg, MD.
Bach Knudsen, K. E. 1997. Carbohydrate and lignin contents of plant materials used in animal
feeding. Anim. Feed Sci. Technol. 67:319-338.
Baker, K. M. and H. H. Stein. 2009. Amino acid digestibility and concentration of digestible and
metabolizable energy in soybean meal produced from high protein or low oligosaccharide
varieties of soybeans and fed to growing pigs. J. Anim. Sci. 87:2282-2290.
Baker, K. M., P. L. Utterback, C. M. Parsons, and H. H. Stein. 2011. Nutritional value of soybean
meal produced from conventional, high-protein, or low-oligosaccharide varieties of
soybeans and fed to broiler chicks. Poult. Sci. 90:390-395.
Baker, S. and T. Herrman. 2002. Evaluating feed particle size. Bulletin MF-2051. Kansas State
Agricultural Experiment Station and Cooperative Extension Service, Manhattan, KS.
Bartov, I. and I. Plavnik. 1998. Moderate excesss of dietary protein increases breast meat yield of
broiler chicks. Poult. Sci. 77:680-688.

58
Bartov, I., S. Bornstein, and B. Lipstein. 1974. Effect of calorie to CP ratio on the degree of
fatness in broilers fed on practical diets. Br. Poult. Sci. 15:107-117.
Bedford, M. R. 1995. Mechanism of action and potential environmental benefits from the use of
feed enzymes. Anim Feed Sci. Technol. 53:145-155.
Bhatti, T., R. E. Chambers, and J.R. Clamp. 1970. The gas chromatographic properties of
biologically important N-acetylglucosamine derivatives, monosaccharides, disaccharides,
trisaccharides, tetrasaccharides and pentasaccharides. Biochim Biophys Acta. 222:339-
347.
Carré, B., J. Gomez, and A. M. Chagneau. 1995. Contribution of oligosaccharide and
polysaccharide digestion, and excreta losses of lactic acid and short chain fatty acids, to
dietary metabolisable energy values in broiler chickens and adult cockerels. Br. Poult.
Sci. 36:611-629.
Choct, M. and G. Annison. 1990. Anti-nutritive activity of wheat pentosans in broiler diets. Br.
Poult. Sci. 31:811-821.
Choct, M., Y. Dersjant-Li, J. McLeish, and M. Peisker. 2010. Soy oligosaccharides and soluble
non-starch polysaccharides: a review of digestion, nutritive and anti-nutritive effects in
pigs and poultry. Asian-Aust. J. Anim. Sci. 10:1386-1398.
Coon, C. N., K. L. Leske, O. Akavanichan, and T. K. Cheng. 1990. Effect of oligosaccharide-free
soybean meal on true metabolizable energy and fiber digestion in adult roosters. Poult.
Sci. 69:787-793.
Corzo, A., M. T. Kidd, D. J. Burnham, E. R. Miller, S. L. Branton, and R. Gonzalez-Esquerra.
2005. Dietary amino acid density effects on growth and carcass of broilers differing in
strain cross and sex. J. Appl. Poult. Res.14:1-9.
Corzo, A., M. W. Schilling, R. E. Loar II, L. Mejia, L. C. G. S. Barbosa, and M. T. Kidd. 2010.
Responses of Cobb × Cobb 500 broilers to dietary amino acid density regimens. J. Appl.
Poult. Res. 19:227-236.

59
Cristofaro, E., F. Mottu, and J. J. Wuhrmann. 1974. Involvement of the raffinose family of
oligosaccharides in flatulence. Pages 313-336 in Sugars in Nutrition. H. Sipple and K.
McNutt, ed. Academic Press. New York, NY.
Donohue, M. and D. L. Cunningham. 2009. Effects of grain and oilseed prices on the costs of US
poultry production. J. Appl. Poult. Res. 18:325-337.
Dozier, W. A. III, A. Corzo, and M. T. Kidd. 2008a. Apparent metabolizable energy needs of
broiler chicks subjected to diverse ambient temperature regimens. J. Appl. Poult. Res.
17:134-140.
Dozier, W. A. III, C. K. Gehring, A. Corzo, and H. A. Olanrewaju. 2011. Apparent metabolizable
energy needs of male and female broilers from 36 to 47 days of age. Poult. Sci. 90:804-
814.
Dozier, W. A. III, M. T. Kidd, and A. Corzo. 2008b. Dietary amino acid responses of broiler
chickens. J. Appl. Poult. Res. 17:157-167.
Dozier, W. A. III, C. J. Price, M. T. Kidd, A. Corzo, J. Anderson, and S. L. Branton. 2006.
Growth performance, meat yield, and economics of broilers fed diets varying in
metabolizable energy from thirty to fifty-nine days of age. J. Appl. Poult. Res. 15:367-
382.
Dozier, W. A., III, J. L. Purswell, M. T. Kidd, A. Corzo, and S. L. Branton. 2007. Dietary
apparent metabolizable energy and amino acid density effects on growth and carcass
traits of heavy broilers. J. Appl. Poult. Res. 16:192-205.
Eichner, G., S. L. Vieira, C. A. Torres, J. L. B. Coneglian, D. M. Freitas, and O. A. Oyarzabal.
2007. Litter moisture and footpad dermatitis as affected by diets formulated on an all-
vegetable basis or having the inclusion of poultry by-product. J. Appl. Poult. Res. 16:344-
350.

60
Ghazi, S., J. A. Rooke, and H. Galbraith. 2003. Improvements in the nutritive value of soybean
meal by protease and α-galactosidase treatment in broiler cockerels and broiler chicks.
Br. Poult. Sci. 44:410-418.
Gitzelmann, R. and S. Auricchio, 1965. The handling of soy alpha-galactosidase by a normal and
galactosemic child. Pediatrics 36:231-238.
Grieshop, C. M., C. T. Kadzere, G. M. Clapper, E. A. Flickinger, L. L. Bauer, R. L. Frazier, and
G. C. Fahey, Jr. 2003. Chemical and nutritional characteristics of United States soybeans
and soybean meals. J. Agric. Food Chem. 51:7684-7691.
Hidalgo, M. A., W. A. Dozier III, A. J. Davis, and R. W. Gordon. 2004. Live performance and
meat yield responses of broilers to progressive concentrations of dietary energy
maintained at a constant metabolizable energy-to-crude protein ratio. J. Appl. Poult. Res.
13:319-327.
Hintz, J. V. 2000. The hormonal regulation of premigratory fat deposition and winter fattening in
red-winged blackbirds. Comp. Biochem. Physiol. 125:239-249.
Holst, D. O. 1973. Holst filtration apparatus for Van Soest detergent fiber analysis. J. AOAC
56:1352-1356.
Karr-Lilienthal, L. K., C. T. Kadzere, C. M. Grieshop, and G. C. Fahey, Jr. 2005. Chemical and
nutritional properties of soybean carbohydrates as related to nonruminants: A review. J.
Livestock Prod. Sci. 97:1-12.
Kidd, M. T., A. Corzo, D. Hoehler, E. R. Miller, and W. A. Dozier, III. 2005. Broiler
responsiveness (Ross × 708) to diets varying in amino acid density. Poult. Sci. 84:1389-
1396.
Kidd, M. T., C. D. McDaniel, S. L. Branton, E. R. Miller, B. B. Boren, and B. L. Francher. 2004.
Increasing amino acid density improves live performance and carcass yields of
commercial broilers. J. Appl. Poult. Res. 13:593-604.

61
Kunst, A., B. Draeger, and J. Ziegenhorn. 1984. Metabolites 1: Carbohydrates. Pages 163-172 in
Methods of Enzymatic Analysis, 3rd
ed. Volume VI.
Leeson, S., L. Caston, and J. D. Summers. 1996. Broiler responses to diet energy. Poult. Sci.
75:529-535.
Lilly, R. A., M. W. Schilling, J. L. Silva, J. M. Martin, and A. Corzo. 2011. The effects of dietary
amino acid density in broiler feed on carcass characteristics and meat quality. J. Appl.
Poult. Res. 20:56-67.
Martland, M. F. 1985. Ulcerative dermatitis in broiler chickens. The effects of wet litter. Avian
Pathol. 14:353-364.
Martland, M. F. 1984. Wet litter as a cause of plantar pododermatitis, leading to foot ulceration
and lameness in fattening turkeys. Avain Pathol. 12:241-252.
Mayne, R. K., R. W. Else, and P. M. Hocking. 2007. High litter moisture alone is sufficient to
cause foot pad dermatitis in growing turkeys. Brit. Poult. Sci. 48:538-545.
Nagaraj, M., J. B. Hess, and S. F. Bilgili. 2007. Evaluation of a feed-grade enzyme in broiler diets
to reduce pododermatitis. J. Appl. Poult. Res. 16:52-61.
NRC. 1998. Nutrient Requirements of Swine. 10th rev. ed. Natl. Acad. Press, Washington, D.C.
NRC. 1994. Nutrient Requirements of Poultry. 9th ed. Natl. Acad. Press, Washington, D.C.
Parsons, C. M., Y. Zhang, and M. Araba. 2000. Nutritional evaluation of soybean meals varying
in oligosaccharide content. Poult. Sci. 79:1127-1131.
Perryman, K. R. and W. A. Dozier, III. 2012. Apparent metabolizable energy and apparent ileal
amino acid digestibility of low and ultra-low oligosaccharide soybean meals fed to broiler
chickens. Poult. Sci. (submitted April, 2012).
Saleh, E. A., S. E. Watkins, A. L. Waldroup, and P. W. Waldroup. 2004. Effects of dietary
nutrient density on performance and carcass quality of male broilers grown for further
processing. Int. J. Poult. Sci. 3:1-10.
SAS Institute. 2004. SAS User’s Guide. Statistics. Version 9.1 ed. SAS Inst. Inc., Cary, NC.

62
Tripathy, D., P. Mohanty, S. Dhindsa, T. Syed, H. Ghanim, A. Aljada, and P. Dandona. 2003.
Elevation of free fatty acids induces inflammation and impairs vascular reactivity in
healthy subjects. Diabetes 52:2882-2887.
Tukey, J. W. 1953. The problem of multiple comparisons. Pages 1948-1983 in The Collected
Works of John W. Tukey VIII. Multiple Comparisons. Chapman and Hall, New York,
NY.
USDA. 1953. The test weight per bushel of grain: Method of use and calibration of the apparatus.
Circular No.921. U.S. Government Printing Office, Washington, D.C.
Wahlefeld, A. W. and H. U. Bergmeyer. 1974. Page 1831 in Methods of Enzymatic Analysis. 2nd
ed. Acad. Press Inc, New York, NY.

Table 4.1 Physical and chemical characteristic of control (CSBM), low oligosaccharide (LOSBM), and ultra-low oligosaccharide (ULSBM)
soybean meals on an as-is basis1
Item (%), unless otherwise
noted
Experiment 5
Experiments 6
Analytical Method CSBM LOSBM CSBM LOSBM ULSBM
Dry Matter 91.16 91.69 90.70 91.50 91.90 AOAC5 934.01. 2006
Crude Protein 47.60 54.59 47.86 53.73 55.63 AOAC 990.03. 2006 Crude Fat 1.71 1.12 1.24 0.79 0.77 AOAC 2003.06. 2006 Sucrose 6.95 8.38 7.47 8.71 7.78 Bhatti et al., 1970 Raffinose 0.71 0.21 0.82 0.21 0.07 Bhatti et al., 1970 Stachyose 6.79 1.56 5.08 1.44 0.50 Bhatti et al., 1970 Starch 0.89 1.24 0.81 0.61 0.40 AACC
6 76-13. 2006
7
ADF 5.54 3.52 5.50 3.39 4.19 AOAC 973.18 (A-D). 2006 NDF 8.09 4.60 8.07 4.84 5.91 Holst, 1973 Cellulose 5.53 3.74 5.71 3.68 4.36 AOAC 973.18 (A-D). 2006 Gross Energy (kcal/kg) 4,226 4,287 3,998 4,037 4,149 Isoperibol bomb calorimeter
7 Particle Size (Dgw)
2 1,300 1,166 1,059 1,279 1,106 ASAE
8 S319.4. 1993
Bulk Density (g/cc)3
0.53 0.65 0.69 0.75 0.79 USDA, 1953 KOH Solubility 82.24 83.44 78.93 84.31 82.58 Parsons et al., 1991 Trypsin Inhibitor (TIU/g)
4 3,429 5,924 3,183 4,323 5,677 AACC
22-40. 2006
1Unless otherwise noted, all methods of analysis were determined by the University of Missouri Experimental Station Chemical
Laboratories, Columbia, MO. 2Dgw = geometric mean diameter in µm, determined at Iowa State University.
3(g/cc) = grams per cubic centimeter, determined at Iowa State University.
4TIU = Trypsin inhibitor units.
5AOAC = Association of Official Analytical Chemists.
6AACC = Association of American Cereal Chemists.
7Modified Starch Assay Kit (product code STA-20, Sigma, St. Louis, MO).
7Isoperibol bomb calorimeter (Parr model no. 6300) determined by Auburn University Laboratory (Auburn, AL).
8ASAE = American Society of Agricultural Engineers.
63

Table 4.2 Apparent metabolizable energy and total concentrations of digestible amino acids for the first 5 limiting amino
acids in Ross × Ross 708 male broilers for control soybean meal, low oligosaccharide soybean meal, and ultra-low
oligosaccharide soybean meal fed to growing broilers used in diet formulations1
Soybean Meal AMEn, kcal/kg
2
Digestible Amino Acid Concentrations, %3
Met Lys Thr Ile Val
2010 Control 2,241 0.59 2.83 1.76 2.06 2.14 Low Oligosaccharide 2,435 0.61 2.97 1.79 2.14 2.21
2011 Control 2,073 0.62 2.78 1.57 1.85 1.90 Low Oligosaccharide 2,214 0.66 2.96 1.69 2.03 2.08 Ultra-Low Oligosaccharide 2,080 0.71 3.21 1.78 2.23 2.27
1Values were determined by Perryman and Dozier (2012).
2Values are least-square means of 16 replicate cages with each cage containing 12 broilers at placement from 27 to 29 d
of age. 3Values were least-square means of 12 replicate cages (2010) or 10 replicate cages (2011) with each cage containing 12
birds from 26 to 31 d of age during an apparent ileal amino acid digestibility assay.
64

65
Table 4.3 Ingredient and calculated composition of diets formulated with control soybean meal (CSBM)
or low oligosaccharide soybean meal (LOSBM) fed to Ross × Ross 708 male broilers from 1 to 40 d of age
(experiment 5)
1 to 14 d of age 15 to 28 d of age 29 to 40 d of age
Ingredient, % ―as-fed‖ CSBM LOSBM CSBM LOSBM CSBM LOSBM Ground corn 58.20 65.36 67.30 72.56 71.50 75.95 CSBM 32.00 - 23.47 - 19.83 - LOSBM - 26.66 - 19.55 - 16.52 Poultry by-product meal 4.00 4.00 4.00 4.00 4.00 4.00 Poultry oil 2.84 0.82 2.38 0.89 2.24 0.98 Limestone 0.88 0.89 0.86 0.87 0.83 0.84 Sodium Chloride 0.37 0.36 0.41 0.40 0.44 0.44 Defluorinated Phosphate 0.65 0.69 0.35 0.38 0.07 0.09 DL-Met 0.26 0.28 0.26 0.27 0.20 0.21 L-Lys
.HCl - 0.10 0.15 0.23 0.12 0.18
L-Thr 0.04 0.08 0.11 0.14 0.08 0.10 Builders Sand 0.19 0.19 0.14 0.14 0.12 0.12 Vitamin premix
1 0.25 0.25 0.25 0.25 0.25 0.25 Mineral premix
2 0.25 0.25 0.25 0.25 0.25 0.25 Phytase
3 0.02 0.02 0.02 0.02 0.02 0.02
Salinomycin4
0.05 0.05 0.05 0.05 0.05 0.05 Calculated Analysis
AMEn, kcal/kg 3,025 3,025 3,115 3,115 3,160 3,160 CP, % 22.67 22.67 19.50 19.50 18.00 18.00 digestible Lys, % 1.17 1.17 1.07 1.07 0.95 0.95 digestible TSAA, % 0.88 0.88 0.80 0.80 0.71 0.71 digestible Thr, % 0.76 0.76 0.72 0.72 0.64 0.64 digestible Ile, % 0.92 0.88 0.76 0.73 0.70 0.67 digestible Val, % 1.02 0.98 0.86 0.83 0.80 0.77 digestible Trp, % 0.19 0.18 0.15 0.15 0.14 0.14 digestible Arg, % 1.44 1.49 1.18 1.22 1.07 1.11 Ca, % 0.92 0.92 0.80 0.80 0.69 0.69 Non-phytate P, % 0.44 0.44 0.38 0.38 0.33 0.33 Na, % 0.21 0.21 0.21 0.21 0.21 0.21
1Vitamin premix include per kg of diet: Vitamin A (Vitamin A acetate), 8,000 IU; Vitamin D
(cholecalciferol), 2,000 IU; Vitamin E (DL-alpha tocopherol acetate), 8 IU; menadione (menadione sodium
bisulfate complex), 2 mg; Vitamin B12 (cyanocobalamin),0.02 mg; folacin (folic acid), 0.5 mg: D-
pantothenic acid (calcium pantothenate) 15 mg; riboflavin (riboflavin), 5.4 mg; niacin (niacinamide), 45
mg; thiamin (thiamin mononitrate), 1 mg; D-biotin (biotin), 0.05 mg; and pyridoxine (pyridoxine
hydrochloride), 2.2 mg; choline (choline chloride), 500 mg. 2Mineral premix include per kg of diet: Mn (manganous oxide), 65 mg; Zn (zinc oxide), 55 mg; Fe (iron
sulfate monohydrate), 55 mg; Cu (copper sulfate pentahydrate), 6 mg; I (calcium iodate), 1 mg; Se (sodium
selenite), 0.3 mg. 3Quantum phytase from ABVista, Marlborough, Wiltshire, UK.
4BioCox 60 provided 60 g/907 kg of salinomycin (Alpharma, Fort Lee, NJ).

66
Table 4.4 Ingredient and calculated composition of diets formulated with moderate or reduced AMEn
concentrations and either control soybean meal (CSBM), low-oligosaccharide soybean meal (LOSBM), or
ultra-low oligosaccharide soybean meal (ULSBM) fed to Ross × Ross 708 male broilers from 1 to 14 d of
age (experiment 6)
Moderate AMEn
Reduced AMEn
Ingredient, % ―as-fed‖ CSBM LOSBM ULSBM CSBM LOSBM ULSBM
Ground corn 57.74 63.65 64.27 58.31 64.20 64.86 Soybean Meal 32.25 28.13 26.97 32.16 28.06 26.88 Poultry by-product meal 4.00 4.00 4.00 4.00 4.00 4.00 Poultry oil 3.15 1.45 1.88 2.66 0.96 1.39 Limestone 0.74 0.77 0.77 0.75 0.77 0.77 Defluorinated Phosphate 0.65 0.67 0.69 0.65 0.67 0.68 Sodium Chloride 0.37 0.37 0.36 0.37 0.37 0.36 DL-Met 0.32 0.28 0.29 0.32 0.28 0.29 L-Lys
.HCl 0.11 0.05 0.12 0.11 0.06 0.12
L-Thr 0.10 0.06 0.08 0.10 0.06 0.08 Vitamin Premix
1 0.25 0.25 0.25 0.25 0.25 0.25
Mineral Premix2
0.25 0.25 0.25 0.25 0.25 0.25 Phytase
3 0.02 0.02 0.02 0.02 0.02 0.02
Salinomycin4
0.05 0.05 0.05 0.05 0.05 0.05 Calculated Analysis
AMEn, kcal/kg 3,025 3,025 3,025 3,000 3,000 3,000 CP, % 22.67 22.67 22.68 22.67 22.67 22.68 digestible Lys, % 1.17 1.17 1.17 1.17 1.17 1.17 digestible TSAA, % 0.88 0.88 0.88 0.88 0.88 0.88 digestible Thr, % 0.76 0.76 0.76 0.76 0.76 0.76 digestible Ile, % 0.82 0.86 0.81 0.82 0.87 0.81 digestible Val, % 0.91 0.97 0.90 0.91 0.97 0.90 digestible Trp, % 0.23 0.24 0.22 0.23 0.24 0.23 digestible Arg, % 1.37 1.49 1.45 1.37 1.49 1.45 Ca, % 0.92 0.92 0.92 0.92 0.92 0.92 Non-phytate P, % 0.44 0.44 0.44 0.44 0.44 0.44 Na, % 0.21 0.21 0.21 0.21 0.21 0.21
1Vitamin premix included per kg of diet: Vitamin A (Vitamin A acetate), 8,000 IU; Vitamin D
(cholecalciferol), 2,000 IU; Vitamin E (DL-alpha tocopherol acetate), 8 IU; menadione (menadione
sodium bisulfate complex), 2 mg; Vitamin B12 (cyanocobalamin), 0.02 mg; folacin (folic acid), 0.5 mg:
D-pantothenic acid (calcium pantothenate) 15 mg; riboflavin (riboflavin), 5.4 mg; niacin (niacinamide),
45 mg; thiamin (thiamin mononitrate), 1 mg; D-biotin (biotin), 0.05 mg; and pyridoxine (pyridoxine
hydrochloride), 2.2 mg; choline (choline chloride), 500 mg. 2Mineral premix include per kg of diet: Mn (manganous oxide), 65 mg; Zn (zinc oxide), 55 mg; Fe (iron
sulfate monohydrate), 55 mg; Cu (copper sulfate pentahydrate), 6 mg; I (calcium iodate), 1 mg; Se
(sodium selenite), 0.3 mg. 3Quantum phytase from ABVista, Marlborough, Wiltshire, UK.
4BioCox 60 provided 60 g/907 kg of salinomycin (Alpharma, Fort Lee, NJ).

67
Table 4.5 Ingredient and calculated composition of diets formulated with moderate or reduced AMEn
concentrations and either control soybean meal (CSBM), low-oligosaccharide soybean meal (LOSBM),
or ultra-low oligosaccharide soybean meal (ULSBM) fed to Ross × Ross 708 male broilers from 15 to
28 d of age (experiment 6)
Moderate AMEn
Reduced AMEn
Ingredient, % ―as-fed‖ CSBM LOSBM ULSBM CSBM LOSBM ULSBM Ground corn 63.29 70.79 68.13 63.87 71.35 68.70 Soybean Meal 26.75 21.05 22.86 26.66 20.98 22.77 Poultry by-product meal 4.00 4.00 4.00 4.00 4.00 4.00 Poultry oil 3.36 1.45 2.42 2.86 0.96 1.93 Limestone 0.75 0.79 0.77 0.76 0.79 0.78 Deflourinated Phosphate 0.32 0.36 0.35 0.32 0.36 0.35 Sodium Chloride 0.41 0.40 0.41 0.41 0.40 0.41 DL-Met 0.28 0.27 0.25 0.28 0.27 0.25 L-Lys
.HCl 0.15 0.19 0.14 0.15 0.19 0.14
L-Thr 0.12 0.13 0.10 0.12 0.13 0.10 Vitamin Premix
1 0.25 0.25 0.25 0.25 0.25 0.25
Mineral Premix2
0.25 0.25 0.25 0.25 0.25 0.25 Phytase
3 0.02 0.02 0.02 0.02 0.02 0.02
Salinomycin4
0.05 0.05 0.05 0.05 0.05 0.05 Calculated Analysis
AMEn, kcal/kg 3,115 3,115 3,115 3,090 3,090 3,090 CP, % 20.47 19.55 20.69 20.47 19.55 20.69 digestible Lys, % 1.07 1.07 1.07 1.07 1.07 1.07 digestible TSAA, % 0.80 0.80 0.80 0.80 0.80 0.80 digestible Thr, % 0.72 0.72 0.72 0.72 0.72 0.72 digestible Ile, % 0.73 0.72 0.73 0.73 0.72 0.73 digestible Val, % 0.82 0.82 0.82 0.82 0.82 0.82 digestible Trp, % 0.19 0.20 0.20 0.20 0.20 0.20 digestible Arg, % 1.22 1.24 1.30 1.22 1.24 1.30 Ca, % 0.80 0.80 0.80 0.80 0.80 0.80 Non-phytate P, % 0.38 0.38 0.38 0.38 0.38 0.38 Na, % 0.21 0.21 0.21 0.21 0.21 0.21
1`Vitamin premix include per kg of diet: Vitamin A (Vitamin A acetate), 8,000 IU; Vitamin D
(cholecalciferol), 2,000 IU; Vitamin E (DL-alpha tocopherol acetate), 8 IU; menadione (menadione
sodium bisulfate complex), 2 mg; Vitamin B12 (cyanocobalamin), 0.02 mg; folacin (folic acid), 0.5 mg:
D-pantothenic acid (calcium pantothenate) 15 mg; riboflavin (riboflavin), 5.4 mg; niacin (niacinamide),
45 mg; thiamin (thiamin mononitrate), 1 mg; D-biotin (biotin), 0.05 mg; and pyridoxine (pyridoxine
hydrochloride), 2.2 mg; choline (choline chloride), 500 mg. 2Mineral premix include per kg of diet: Mn (manganous oxide), 65 mg; Zn (zinc oxide), 55 mg; Fe (iron
sulfate monohydrate), 55 mg; Cu (copper sulfate pentahydrate), 6 mg; I (calcium iodate), 1 mg; Se
(sodium selenite), 0.3 mg. 3Quantum phytase from ABVista, Marlborough, Wiltshire, UK.
4BioCox 60 provided 60 g/907 kg of salinomycin (Alpharma, Fort Lee, NJ).

68
Table 4.6 Ingredient and calculated composition of diets formulated with moderate or reduced AMEn
concentrations and either control soybean meal (CSBM), low-oligosaccharide soybean meal (LOSBM), or
ultra-low oligosaccharide soybean meal (ULSBM) fed to Ross × Ross 708 male broilers from 29 to 42 d of
age (experiment 6)
Moderate AMEn Reduced AMEn
Ingredient, % ―as-fed‖ CSBM LOSBM ULSBM CSBM LOSBM ULSBM
Ground corn 70.05 74.36 73.88 70.61 74.92 74.42 Soybean Meal 20.95 17.86 17.86 20.88 17.78 17.81 Poultry by-product meal 4.00 4.00 4.00 4.00 4.00 4.00 Poultry oil 2.67 1.47 1.93 2.18 0.98 1.44 Limestone 0.75 0.77 0.77 0.75 0.77 0.77 Deflourinated Phosphate 0.06 0.08 0.08 0.06 0.08 0.08 Sodium Chloride 0.44 0.44 0.44 0.44 0.44 0.44 DL-Met 0.23 0.21 0.21 0.23 0.21 0.21 L-Lys
.HCl 0.17 0.15 0.17 0.17 0.16 0.17
L-Thr 0.11 0.09 0.09 0.11 0.09 0.09 Vitamin Premix
1 0.25 0.25 0.25 0.25 0.25 0.25
Mineral Premix2
0.25 0.25 0.25 0.25 0.25 0.25 Phytase
3 0.02 0.02 0.02 0.02 0.02 0.02
Salinomycin4
0.05 0.05 0.05 0.05 0.05 0.05 Calculated Analysis
AMEn, kcal/kg 3,160 3,160 3,160 3,135 3,135 3,135 CP, % 18.17 18.00 18.32 18.17 18.00 18.32 digestible Lys, % 0.95 0.95 0.95 0.95 0.95 0.95 digestible TSAA, % 0.71 0.71 0.71 0.71 0.71 0.71 digestible Thr, % 0.64 0.64 0.64 0.64 0.64 0.64 digestible Ile, % 0.64 0.66 0.64 0.64 0.66 0.64 digestible Val, % 0.73 0.76 0.73 0.73 0.76 0.73 digestible Trp, % 0.17 0.18 0.17 0.17 0.18 0.17 digestible Arg, % 1.06 1.12 1.12 1.06 1.12 1.12 Ca, % 0.69 0.69 0.69 0.69 0.69 0.69 Non-phytate P, % 0.33 0.33 0.33 0.33 0.33 0.33 Na, % 0.21 0.21 0.21 0.21 0.21 0.21
1Vitamin premix included per kg of diet: Vitamin A (Vitamin A acetate), 8,000 IU; Vitamin D
(cholecalciferol), 2,000 IU; Vitamin E (DL-alpha tocopherol acetate), 8 IU; menadione (menadione sodium
bisulfate complex), 2 mg; Vitamin B12 (cyanocobalamin), 0.02 mg; folacin (folic acid), 0.5 mg: D-
pantothenic acid (calcium pantothenate) 15 mg; riboflavin (riboflavin), 5.4 mg; niacin (niacinamide), 45
mg; thiamin (thiamin mononitrate), 1 mg; D-biotin (biotin), 0.05 mg; and pyridoxine (pyridoxine
hydrochloride), 2.2 mg; choline (choline chloride), 500 mg. 2Mineral premix include per kg of diet: Mn (manganous oxide), 65 mg; Zn (zinc oxide), 55 mg; Fe (iron
sulfate monohydrate), 55 mg; Cu (copper sulfate pentahydrate), 6 mg; I (calcium iodate), 1 mg; Se (sodium
selenite), 0.3 mg. 3Quantum phytase from ABVista, Marlborough, Wiltshire, UK.
4BioCox 60 provided 60 g/907 kg of salinomycin (Alpharma, Fort Lee, NJ).

69
Table 4.7 Growth performance of Ross × Ross 708 male broilers fed control soybean meal (CSBM)
or low oligosaccharide soybean meal (LOSBM) diets from 1 to 40 d of age1 (experiment 5)
Item BW Gain (kg) Feed Intake (kg) FCR2 (kg:kg) Mortality (%)
1 to 14 d of age CSBM 0.330 0.417 1.263 0.0 LOSBM 0.341 0.418 1.226 0.7 SEM 0.003 0.003 0.007 0.3
Analysis of Variance
Probabilities
SBM 0.020 0.696 <0.001 0.166
1 to 28 d of age CSBM 1.448 2.113 1.467 0.7 LOSBM 1.417 2.073 1.467 1.7 SEM 0.018 0.014 0.007 0.6
Analysis of Variance
Probabilities
SBM 0.199 0.052 0.972 0.275
1 to 40 d of age CSBM 2.681 4.280 1.595 0.7 LOSBM 2.624 4.218 1.594 3.3 SEM 0.021 0.035 0.007 1.0
Analysis of Variance
Probabilities
SBM 0.071 0.213 0.973 0.079 1Vaules are least-square means of 12 replicate pens with 25 broilers per pen at 1 d of age.
2FCR = Feed conversion ratio was a ratio of feed intake to BW gain.

70
Table 4.8 Growth performance of Ross × Ross 708 male broilers fed control soybean meal (CSBM),
low oligosaccharide soybean meal (LOSBM), or ultra-low oligosaccharide soybean meal (ULSBM)
diets with moderate or reduced levels of AMEn during a 42 d production period (experiment 6)1,2
Item BW Gain (kg) Feed Intake (kg) FCR3 (kg:kg) Mortality (%)
1 to 14 d of age CSBM 0.351 0.410 1.166 0.4 LOSBM 0.354 0.411 1.162 0.2 ULSBM 0.357 0.413 1.158 0.4 SEM 0.003 0.003 0.004 0.3
Moderate AMEn 0.354 0.412 1.165 0.5 Reduced AMEn 0.354 0.411 1.159 0.1 SEM 0.002 0.002 0.003 0.2
Analysis of Variance
Probabilities
SBM 0.126 0.742 0.143 0.810 AMEn 0.534 0.639 0.230 0.175
1 to 28 d of age CSBM 1.522 2.052 1.353
a 0.6
LOSBM 1.505 2.057 1.366a
0.2 ULSBM 1.551 2.035 1.317
b 0.1
SEM 0.021 0.028 0.007 0.3
Moderate AMEn 1.513 2.040 1.349 0.5 Reduced AMEn 1.538 2.057 1.342 0.0 SEM 0.017 0.024 0.007 0.2 Analysis of Variance
Probabilities
SBM 0.474 0.826 <0.001 0.435 AMEn 0.429 0.593 0.194 0.118
1 to 42 d of age CSBM 3.008 4.755 1.581
a 3.5
LOSBM 2.984 4.687 1.571a
2.1 ULSBM 3.036 4.692 1.544
b 0.8
SEM 0.021 0.036 0.005 0.8
Moderate AMEn 2.996 4.657 1.563 2.8 Reduced AMEn 3.023 4.735 1.567 1.5 SEM 0.019 0.045 0.005 0.6
Analysis of Variance
Probabilities
SBM 0.096 0.127 <0.001 0.054 AMEn 0.184 0.114 0.425 0.140
1Vaules are least-square means of 10 replicate pens with 25 broilers per pen from 1 to 42 d of age.
2Apparent MEn concentrations reduced by 25 kcal/kg from moderate concentration. (Moderate: 3,025,
3,115, and 3,160 kcal of AMEn/kg for starter, grower and finisher, respectively). 3FCR = Feed conversion ratio was a ratio of feed intake to BW gain.
abMeans within a column for a given measurement not sharing a common superscript differ (P ≤ 0.05).

Table 4.9 Processing characteristics of Ross × Ross 708 broilers fed diets containing control (CSBM) or low
oligosaccharide soybean meal (LOSBM) at 40 d of age1 (experiment 5)
Item
Live Weight
(kg) Carcass Weight
(kg) Breast Weight
2
(kg) Carcass Yield
3
(%) Breast Yield
2,3
(%) Abdominal Fat
Percentage3 (%)
CSBM 2.782 1.960 0.641 70.5 23.0 1.54 LOSBM 2.748 1.951 0.623 71.0 22.7 1.86 SEM 0.017 0.015 0.009 0.4 0.2 0.05
Analysis of
Variance
Probabilities
SBM 0.170 0.669 0.118 0.322 0.259 <0.001
1Vaules are least-square means of 12 replicate pens with 14 broilers per pen at 40 d of age.
2Breast is composed of pectoralis major and minor muscles.
3Yield or percentage represents grams of tissue per 100 g of tissue per grams live weight.
71

Table 4.10 Processing characteristics of Ross × Ross 708 broilers fed control (CSBM), low oligosaccharide (LOSBM), or ultra-low
oligosaccharide (ULSBM) soybean meal based diets with moderate or reduced AMEn values at 42 d of age1 (experiment 6)
SBM AMEn 2
Live Weight
(kg) Carcass Weight
(kg) Breast Weight
3
(kg) Carcass Yield
4
(%) Breast
Yield
3,4
(%) Abdominal Fat
Percentage4 (%)
CSBM
3.134 2.248 0.725 71.7
b 23.1
b 1.50
b
LOSBM
3.119 2.245 0.732 72.0ab
23.5a
1.60a
ULSBM 3.145 2.273 0.739 72.3a
23.5a
1.58ab
SEM
0.022 0.017 0.007 0.1 0.1 0.03
Moderate 3.128 2.250 0.729 71.9 23.3 1.57
Reduced 3.137 2.260 0.735 72.1 23.4 1.56
SEM 0.019 0.015 0.006 0.1 0.1 0.02
Analysis of Variance Probabilities
SBM 0.623 0.288 0.256 0.010 0.021 0.027 Energy 0.690 0.522 0.362 0.395 0.251 0.789
1Vaules are least-square means of 12 replicate pens with 14 broilers per pen at 40 d of age.
2AMEn was reduced by 25 kcal/kg from moderate concentrations (Moderate: 3,025, 3,115, and 3,160 kcal/kg, respectively, for starter,
grower, and finisher phases). 3Breast is composed of pectoralis major and minor muscles.
4Yield or percentage represents grams of tissue per 100 grams of live weight.
abMeans within a column for a given measurement not sharing a common superscript differ (P ≤ 0.05).
72
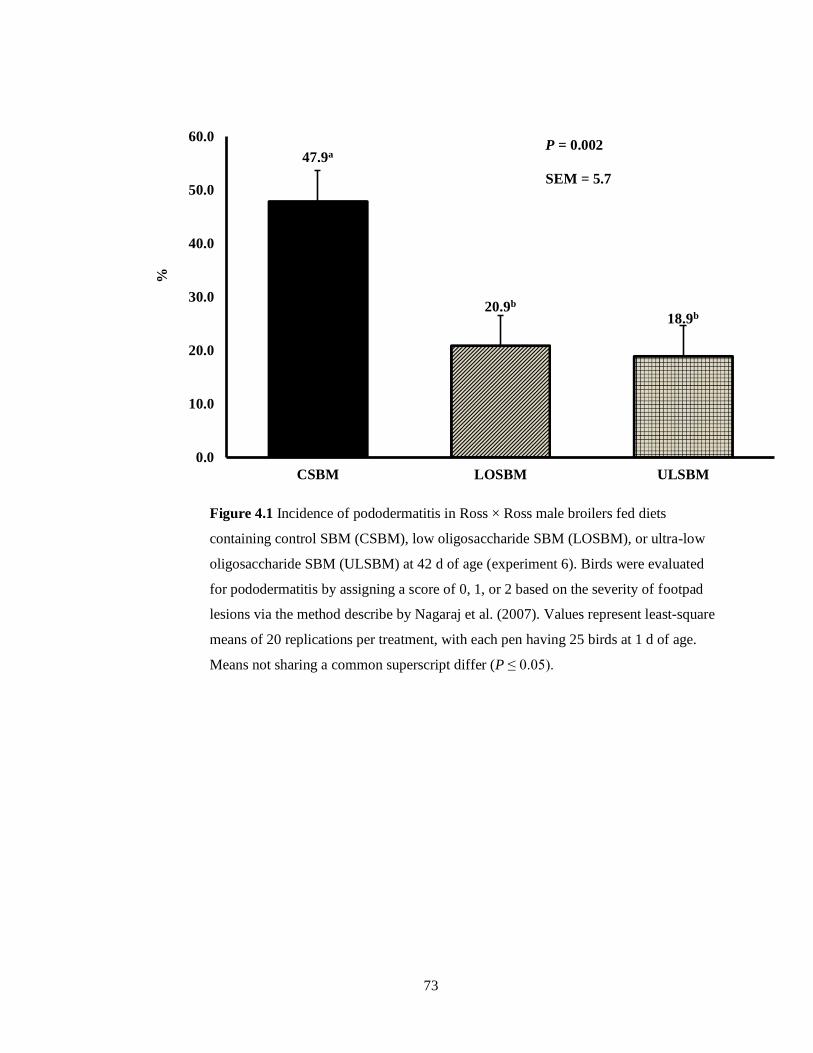
73
Figure 4.1 Incidence of pododermatitis in Ross × Ross male broilers fed diets
containing control SBM (CSBM), low oligosaccharide SBM (LOSBM), or ultra-low
oligosaccharide SBM (ULSBM) at 42 d of age (experiment 6). Birds were evaluated
for pododermatitis by assigning a score of 0, 1, or 2 based on the severity of footpad
lesions via the method describe by Nagaraj et al. (2007). Values represent least-square
means of 20 replications per treatment, with each pen having 25 birds at 1 d of age.
Means not sharing a common superscript differ (P ≤ 0.05).
47.9a
20.9b 18.9b
0.0
10.0
20.0
30.0
40.0
50.0
60.0
CSBM LOSBM ULSBM
%
P = 0.002
SEM = 5.7

74
V. CONCLUSIONS
Soybean meal is an excellent source of dietary AA for poultry, but its energy content is
not efficiently utilized due to the poorly digestible nature of its carbohydrate fraction. Over the
past decade, the prices of energy-providing ingredients have increased dramatically. Because feed
costs represent over 70% of live production cost for broilers, strategies should be developed to
maximize energy utilization of the primary ingredients in order to minimize feed costs. Soybeans
have been developed with reduced raffinose and stachyose concentrations through genetic
selection. The research presented herein evaluated nutrient digestibility, growth performance, and
meat yield responses of broilers fed diets formulated with either LOSBM, ULSBM, or CSBM.
The first 4 experiments were conducted to determine the nutrient digestibility of a
LOSBM and ULSBM compared with a CSBM. It was concluded that LOSBM had higher AMEn
compared with CSBM and ULSBM. This finding was attributed to nutrient composition changes
due to genetic selection. Low oligosaccharide SBM had over a 70% reduction in GAL content,
lower concentrations of ADF, NDF, and cellulose, and higher concentrations of sucrose
compared with CSBM. Furthermore, LOSBM and ULSBM were determined to have greater
concentrations of digestible AA compared with CSBM.
In experiments 5 and 6, growth performance and carcass yields of broilers fed diets
formulated with CSBM, LOSBM, or ULSBM were evaluated during a 6 wk production period. In
experiment 5, cumulative growth and carcass characteristics were similar for broilers fed diets
formulated with either LOSBM or CSBM. Experiment 6 was expanded to evaluate ULSBM in
conjunction with CSBM and LOSBM. Additionally, diets were formulated with moderate or
reduced concentrations of AMEn to determine whether birds fed diets containing LOSBM or
ULSBM with reduced AMEn might accentuate growth and meat yield responses. However, main

75
effects of SBM type and AMEn concentration did not negatively impact growth rate, carcass
yields, or physiological variables. Broilers fed diets containing ULSBM had more efficient
growth from 1 to 28 and 1 to 42 d of age than birds fed diets formulated with the 2 other SBM.
Due to the enhanced nutrient profile of LOSBM and ULSBM, diets were formulated with 28 to
71% less fat compared with CSBM-based diets. Moreover, broilers that consumed ULSBM- and
LOSBM-based diets had less incidence of PD compared with broilers fed CSBM-based diets.
Research is necessary to further evaluate the effect of diets containing LOSBM or ULSBM on
incidences of PD.
Overall, these findings provide evidence that nutrient utilization of LOSBM and ULSBM
is greater than CSBM when fed to poultry. Due to higher digestible AA and AMEn
concentrations, less supplemental fat can be used in diets formulated with LOSBM or ULSBM,
which can translate to a reduction in dietary costs.