Embed Size (px)
Citation preview
UNITED STATES SECURITIES AND EXCHANGE COMMISSIONWashington, D.C. 20549
FORM 10-K(Mark One)☑ ANNUAL REPORT PURSUANT TO SECTION 13 OR 15(d) OF THE SECURITIES EXCHANGE ACT OF 1934
For the fiscal year ended December 31, 2020 OR
☐ TRANSITION REPORT PURSUANT TO SECTION 13 OR 15(d) OF THE SECURITIES EXCHANGE ACT OF 1934 For the transition period from to
Commission File Number 1-16417
NUSTAR ENERGY L.P. (Exact name of registrant as specified in its charter)
Delaware 74-2956831
(State or other jurisdiction of incorporation or organization) (I.R.S. Employer Identification No.)
19003 IH-10 West San Antonio, Texas 78257
(Address of principal executive offices) (Zip Code)Registrant’s telephone number, including area code (210) 918-2000
Securities registered pursuant to Section 12(b) of the Act:
Title of each class Trading Symbol(s) Name of each exchange on which registeredCommon units NS New York Stock ExchangeSeries A Fixed-to-Floating Rate Cumulative Redeemable Perpetual Preferred Units NSprA New York Stock ExchangeSeries B Fixed-to-Floating Rate Cumulative Redeemable Perpetual Preferred Units NSprB New York Stock ExchangeSeries C Fixed-to-Floating Rate Cumulative Redeemable Perpetual Preferred Units NSprC New York Stock Exchange
Securities registered pursuant to 12(g) of the Act: None.Indicate by check mark if the registrant is a well-known seasoned issuer, as defined in Rule 405 of the Securities Act. Yes þ No oIndicate by check mark if the registrant is not required to file reports pursuant to Section 13 or Section 15(d) of the Act. Yes o No þIndicate by check mark whether the registrant (1) has filed all reports required to be filed by Section 13 or 15(d) of the Securities Exchange Act of 1934 during the preceding 12 months (or for such shorter period that the registrant was required to file such reports), and (2) has been subject to such filing requirements for the past 90 days. Yes þ No oIndicate by check mark whether the registrant has submitted electronically every Interactive Data File required to be submitted pursuant to Rule 405 of Regulation S-T (§232.405 of this chapter) during the preceding 12 months (or for such shorter period that the registrant was required to submit such files). Yes þ No oIndicate by check mark whether the registrant is a large accelerated filer, an accelerated filer, a non-accelerated filer, a smaller reporting company, or an emerging growth company. See the definitions of “large accelerated filer,” “accelerated filer,” “smaller reporting company,” and “emerging growth company” in Rule 12b-2 of the Exchange Act:
Large accelerated filer þ Accelerated filer ☐
Non-accelerated filer ☐ Smaller reporting company ☐
Emerging growth company ☐If an emerging growth company, indicate by check mark if the registrant has elected not to use the extended transition period for complying with any new or revised financial accounting standards provided pursuant to Section 13(a) of the Exchange Act. oIndicate by check mark whether the registrant has filed a report on and attestation to its management’s assessment of the effectiveness of its internal control over financial reporting under Section 404(b) of the Sarbanes-Oxley Act (15 U.S.C. 7262(b)) by the registered public accounting firm that prepared or issued its audit report. ☑Indicate by check mark whether the registrant is a shell company (as defined in Rule 12b-2 of the Exchange Act). Yes ☐ No þThe aggregate market value of the common units held by non-affiliates was approximately $1.4 billion based on the last sales price quoted as of June 30, 2020, the last business day of the registrant’s most recently completed second quarter.The number of common units outstanding as of January 31, 2021 was 109,468,140.
DOCUMENTS INCORPORATED BY REFERENCE:Portions of the Proxy Statement for the registrant’s 2021 annual meeting of unitholders, expected to be filed within 120 days after the end of the fiscal year covered by this Form 10-K, are incorporated by reference into Part III to the extent described therein.
Table of Contents
NUSTAR ENERGY L.P.FORM 10-K
TABLE OF CONTENTS
PART IItems 1., 2. & 7 Business, Properties and Management's Discussion and Analysis of Financial Condition and
Results of Operations 3Overview 3Recent Developments 5Trends and Outlook 6Consolidated Results of Operations 7Segments and Results of Operations 9Liquidity and Capital Resources 18Human Capital Management 28Properties 28Rate Regulation 29Environmental, Health, Safety and Security Regulation 29Critical Accounting Policies 31New Accounting Pronouncements 34Available Information 34
Item 1A. Risk Factors 34
Item 1B. Unresolved Staff Comments 48
Item 3. Legal Proceedings 48
Item 4. Mine Safety Disclosures 48
PART IIItem 5. Market for Registrant’s Common Units, Related Unitholder Matters and Issuer Purchases of
Equity Securities 49
Item 6. Selected Financial Data 51Item 7A. Quantitative and Qualitative Disclosures about Market Risk 51
Item 8. Financial Statements and Supplementary Data 52
Item 9. Changes in and Disagreements with Accountants on Accounting and Financial Disclosure 108
Item 9A. Controls and Procedures 108
Item 9B. Other Information 108
PART IIIItem 10. Directors, Executive Officers and Corporate Governance 109
Item 11. Executive Compensation 109
Item 12. Security Ownership of Certain Beneficial Owners and Management and Related Unitholder Matters 109
Item 13. Certain Relationships and Related Transactions and Director Independence 109
Item 14. Principal Accountant Fees and Services 109
PART IVItem 15. Exhibits and Financial Statement Schedules 110
Item 16. Form 10-K Summary 117
Signatures 118
Table of Contents
2
PART I
Unless otherwise indicated, the terms “NuStar Energy,” “the Partnership,” “we,” “our” and “us” are used in this report to refer to NuStar Energy L.P., to one or more of our consolidated subsidiaries or to all of them taken as a whole.
CAUTIONARY STATEMENT REGARDING FORWARD-LOOKING INFORMATION AND OTHER DISCLAIMERSIn this Form 10-K, we make certain forward-looking statements, such as statements regarding our plans, strategies, objectives, expectations, estimates, predictions, projections, assumptions, intentions and resources and the future impact of the coronavirus, or COVID-19, the responses thereto, the decline in economic activity and the actions by oil-producing nations on our business. While these forward-looking statements, and any assumptions upon which they are based, are made in good faith and reflect our current judgment regarding the direction of our business, actual results will almost always vary, sometimes materially, from any estimates, predictions, projections, assumptions or other future performance suggested in this report. These forward-looking statements can generally be identified by the words “anticipates,” “believes,” “expects,” “plans,” “intends,” “estimates,” “forecasts,” “budgets,” “projects,” “will,” “could,” “should,” “may” and similar expressions. These statements reflect our current views with regard to future events and are subject to various risks, uncertainties and assumptions, which may cause actual results to differ materially. Please read Item 1A. “Risk Factors” for a discussion of certain of those risks, uncertainties and assumptions.
If one or more of these risks or uncertainties materialize, or if the underlying assumptions prove incorrect, our actual results may vary materially from those described in any forward-looking statement. Other unknown or unpredictable factors could also have material adverse effects on our future results. Readers are cautioned not to place undue reliance on this forward-looking information, which is as of the date of this Form 10-K. We do not intend to update these statements unless we are required by the securities laws to do so, and we undertake no obligation to publicly release the result of any revisions to any such forward-looking statements that may be made to reflect events or circumstances after the date of this report or to reflect the occurrence of unanticipated events.
This Form 10-K contains trade names, trademarks and service marks of others, which are the property of their respective owners. Solely for convenience, trademarks and trade names referred to in this Form 10-K appear without the ® or ™ symbols.
ITEMS 1., 2. and 7. BUSINESS, PROPERTIES AND MANAGEMENT’S DISCUSSION AND ANALYSIS OF FINANCIAL CONDITION AND RESULTS OF OPERATIONS
OVERVIEW
NuStar Energy L.P. (NuStar Energy) is a Delaware limited partnership. Our principal executive offices are located at 19003 IH-10 West, San Antonio, Texas 78257, and our telephone number is (210) 918-2000. Our business is managed under the direction of the board of directors of NuStar GP, LLC, the general partner of our general partner, Riverwalk Logistics, L.P., both of which are wholly owned subsidiaries of ours. Our limited partner interests consist of the following:
• common units (NYSE: NS);• 8.50% Series A fixed-to-floating rate cumulative redeemable perpetual preferred units (NYSE: NSprA);• 7.625% Series B fixed-to-floating rate cumulative redeemable perpetual preferred units (NYSE: NSprB);• 9.00% Series C fixed-to-floating rate cumulative redeemable perpetual preferred units (NYSE: NSprC); and• Series D cumulative convertible preferred units.
We are engaged in the transportation of petroleum products and anhydrous ammonia, and the terminalling, storage and marketing of petroleum products. The term “throughput” as used in this document generally refers to barrels of crude oil or refined product or tons of ammonia, as applicable, that pass through our pipelines, terminals or storage tanks.
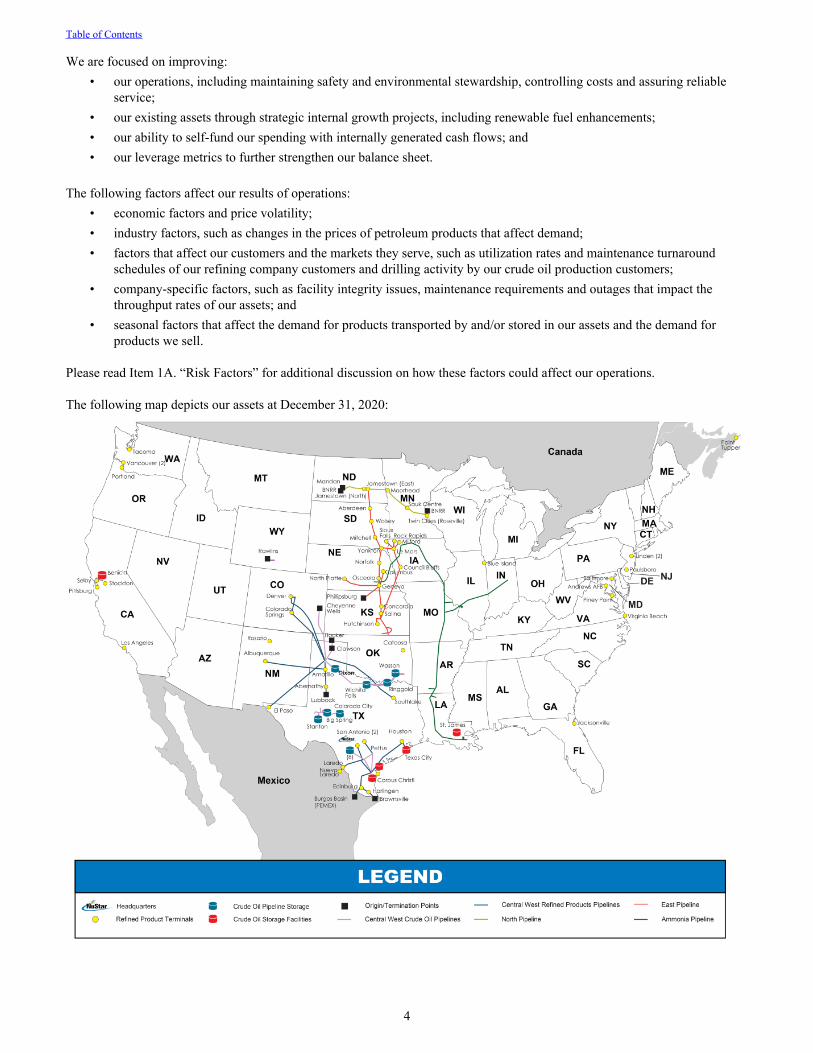
We divide our operations into the following three reportable business segments: pipeline, storage and fuels marketing. As of December 31, 2020, our assets included 9,910 miles of pipeline and 73 terminal and storage facilities, which provide approximately 72 million barrels of storage capacity. We conduct our operations through our wholly owned subsidiaries, primarily NuStar Logistics, L.P. (NuStar Logistics) and NuStar Pipeline Operating Partnership L.P. (NuPOP). We generate revenue primarily from:
• tariffs for transporting crude oil, refined products and anhydrous ammonia through our pipelines;• fees for the use of our terminal and storage facilities and related ancillary services; and• sales of petroleum products.
Table of Contents
3
We are focused on improving:• our operations, including maintaining safety and environmental stewardship, controlling costs and assuring reliable
service;• our existing assets through strategic internal growth projects, including renewable fuel enhancements; • our ability to self-fund our spending with internally generated cash flows; and• our leverage metrics to further strengthen our balance sheet.
The following factors affect our results of operations:• economic factors and price volatility;• industry factors, such as changes in the prices of petroleum products that affect demand;• factors that affect our customers and the markets they serve, such as utilization rates and maintenance turnaround
schedules of our refining company customers and drilling activity by our crude oil production customers;• company-specific factors, such as facility integrity issues, maintenance requirements and outages that impact the
throughput rates of our assets; and• seasonal factors that affect the demand for products transported by and/or stored in our assets and the demand for
products we sell.
Please read Item 1A. “Risk Factors” for additional discussion on how these factors could affect our operations.
The following map depicts our assets at December 31, 2020:
Table of Contents
4
RECENT DEVELOPMENTS
In 2020, we prioritized protecting our employees, maintaining safe, reliable operations, reducing spending to preserve cash and exercising financial discipline, as we continued to execute on the comprehensive plan that we began in 2018, which included simplifying our capital structure and reducing our leverage metrics to further strengthen our balance sheet. We also completed an asset sale and several financing arrangements to address our near-term debt maturities and bolster our liquidity. In 2020, we met our goal of generating sufficient cash from operations to fund all of our distribution requirements and reliability capital expenditures.
COVID-19 and OPEC+ Actions. The coronavirus, or COVID-19, has had a severe negative impact on global economic activity, as government authorities instituted stay-home orders, business closures and other measures to reduce the spread of the virus, and people around the world ceased or altered their usual day-to-day activities. The scale of this decrease in economic activity has significantly reduced demand for petroleum products. In March 2020, the negative economic impact of the COVID-19 pandemic and demand deterioration was exacerbated by disputes among the Organization of Petroleum Exporting Countries and other oil-producing nations (OPEC+) regarding their agreed production rates that contributed to a significant over-supply in crude oil, resulting in a sharp decline in, and increase in the volatility of, crude oil prices. Beginning in the second quarter of 2020, crude oil prices stabilized somewhat, and although lower compared to recent years, crude oil prices began to increase in the fourth quarter of 2020, and have continued to do so in 2021.
In March 2020, the negative impact of the COVID-19 pandemic, combined with actions by OPEC+, also drove significant declines in stock prices and market capitalization of companies across the energy industry, including NuStar’s. As a result, we recorded a goodwill impairment charge of $225.0 million associated with our crude oil pipelines in the first quarter of 2020. Please refer to Note 11 of the Notes to Consolidated Financial Statements in Item 8. “Financial Statements and Supplementary Data” for additional information.
Also, in March 2020, in response to the COVID-19 pandemic, we took measures to ensure we continue to conduct business, operate safely and maintain a safe working environment for our employees, whether working remotely or on-site at our locations across North America. We have implemented social distancing through revised shift schedules, work from home policies and designated remote work locations where appropriate, restricted non-essential business travel and began requiring self-screening for employees and contractors. We did not incur significant expenses related to business continuity as a result of these measures. Because the number of cases of COVID-19 fluctuated across North America, we closely monitored each of our locations to ensure the safety of our employees as well as the operational functionality of each location.
Throughout 2020, we took several important steps to improve our liquidity and financial flexibility in an uncertain global economic environment. We began preserving and enhancing our liquidity by cutting spending to preserve cash and completed several financing arrangements to address our near-term debt maturities. Specifically, we reduced our 2020 planned capital expenditures, our controllable and operating expenses for the full-year 2020 and our common unit distribution, beginning with the distribution related to the first quarter of 2020. In addition, we completed the sale of two terminals in Texas City, Texas.
Beginning in March 2020, the COVID-19 pandemic lowered consumer gasoline demand, which in turn depressed utilization rates at refineries across the country, including those our assets serve. Additionally, lower crude oil prices from over-supply across global oil markets undermined drilling and production in U.S. shale plays, including in the Permian and Eagle Ford Basins, where our Permian and Corpus Christi Crude Systems are located. Together, reduced demand for refined products, lower refinery utilization and lower drilling activity resulted in reduced demand for and utilization of our pipeline assets; however, fortunately, our operations were partially insulated from these negative conditions by the geographic location of our assets and the products we transport. For example, our refined product pipelines are located mainly in Texas, where the stay-home orders began being lifted at the beginning of May, and in the Midwest, where demand had been insulated somewhat by lower-density population centers and continued strong agricultural demand. In addition, diesel demand in the markets we serve has remained stable throughout the year, mainly supported by trucking demand, for delivery of supplies across the country, and agricultural demand. Our crude oil pipelines were somewhat insulated by minimum volume commitments on certain systems, but we did experience lower throughputs, compared to our expectations at the beginning of 2020, on our crude oil pipelines that serve producer demand in shale plays, especially in the Permian Basin, as the decline in the price of crude oil caused producers to reduce drilling activity. While crude oil prices have depressed production growth in the Permian Basin in the near-term, we believe the Permian Basin, and our system in particular, has geological advantages over other shale plays, including lower production costs and higher product quality, that have benefitted and will continue to benefit our assets, as crude demand, price and production recover. Although the price of crude oil remained low in 2020, compared to recent years, it supported the completion of drilled yet unfinished wells, or DUCs, by producers in the Permian Basin due to the Permian Basin’s low break-even point. This drilling activity, combined with prior year growth projects, drove an increase in 2020 throughputs on our system, compared to 2019, which has served to mute the negative effect from declines in the price of crude oil.
Table of Contents
5
While overall demand for refined petroleum products took a precipitous decline in the second quarter of 2020 that only started rebounding as lockdowns were lifted across the country, throughout 2020, the impact of lower economic activity on our assets was somewhat mitigated by our minimum volume commitments on certain pipeline assets, as well as our storage segment, including our contracted rates for storage and minimum throughput agreements. In addition, we benefitted from the oil market conditions that emerged in March and April of 2020, which resulted in contango, which occurs when the current prices of oil are lower than the expected future price. This past spring’s contango market increased demand for storage, and we were able to enter into additional terminal contracts resulting in the lease of all of our available storage capacity across our asset footprint.
Although the continuing impact of the COVID-19 pandemic and actions by OPEC+ have depressed global economic activity, which has had a negative impact on our results of operations, particularly during the second quarter of 2020, we began to see some initial signs of recovery and rebound in June, which improved our results of operations for the remainder of 2020. Ongoing uncertainty surrounding the COVID-19 pandemic, including its duration and lingering impacts to the economy, as well as uncertainty surrounding future production decisions by OPEC+, continue to cause volatility and could have a significant impact on management’s estimates and assumptions in 2021 and beyond.
Sale of Texas City Terminals. On December 7, 2020, we sold the equity interests in our wholly owned subsidiaries that owned two terminals in Texas City, Texas for $106.0 million, subject to adjustment (the Texas City Sale). The two terminals have an aggregate storage capacity of 3.0 million barrels and were previously included in our storage segment. We recorded a non-cash loss of $34.7 million on the sale in the fourth quarter of 2020 and utilized the sales proceeds to improve our debt metrics. Please refer to Note 4 of the Notes to Consolidated Financial Statements in Item 8. “Financial Statements and Supplementary Data” for additional information.
Senior Notes. On September 14, 2020, NuStar Logistics issued $600.0 million of 5.75% senior notes due October 1, 2025 and $600.0 million of 6.375% senior notes due October 1, 2030. We received net proceeds of approximately $1.2 billion, which we used to repay outstanding borrowings under the Term Loan, as defined below, as well as outstanding borrowings under our revolving credit agreement. Please refer to Note 13 of the Notes to Consolidated Financial Statements in Item 8. “Financial Statements and Supplementary Data” for further discussion.
Term Loan Credit Agreement. On April 19, 2020, NuStar Energy and NuStar Logistics entered into an unsecured term loan credit agreement with certain lenders and Oaktree Fund Administration, LLC, as administrative agent for the lenders (the Term Loan). The Term Loan provided for an aggregate commitment of up to $750.0 million pursuant to a three-year unsecured term loan credit facility. On April 21, 2020, we drew $500.0 million, which we repaid on September 16, 2020. The repayment required certain contractual premiums, and we recognized a loss of $137.9 million in the third quarter of 2020. We terminated the Term Loan on February 16, 2021. Please refer to Note 13 of the Notes to Consolidated Financial Statements in Item 8. “Financial Statements and Supplementary Data” for further discussion.
TRENDS AND OUTLOOK
Although strides have been made in the effort to control the spread of the COVID-19 pandemic through the development and distribution of vaccines, remote working, social distancing, changes in the way businesses provide goods and services and other measures, the duration and lingering impacts of the COVID-19 pandemic to the economy are uncertain for 2021 and beyond.
In the fourth quarter of 2020 and for the start of 2021, U.S. refinery utilization rates have been recovering and crude oil prices have been rising. While the decline in the price of crude oil depressed production growth in the Permian Basin in 2020, we believe the Permian Basin, and our system in particular, has geological advantages over other shale plays, including lower production costs and higher product quality, that will benefit our assets in 2021 as crude demand, price and production continue to recover. Although the price of crude oil remains low compared to recent years, we believe it currently supports the completion of drilled yet unfinished wells, or DUCs, by producers in the Permian Basin for at least one to two years, even if the price of crude oil dips below current levels, due to the Permian Basin’s low break-even point. We expect this drilling activity, along with the active rig count on our Permian Crude System, to continue to drive increased throughputs on our system and help mute the negative effect from any near-term declines in the price of crude oil.
Although not as severe as 2020, we expect the COVID-19 pandemic will continue to have a negative impact during 2021. The rate at which the economy recovers will drive 2021 consumer demand for refined products, refinery utilization, and drilling and production activity in the Permian and Eagle Ford Basins, and therefore demand for and utilization of our pipeline assets. Fortunately, we expect our operations to continue to be partially insulated from any negative conditions by strong agricultural demand, stable diesel demand, our minimum throughput agreements, the resiliency of our Permian assets and the basin overall, as well as our contracted rates for storage. In addition, we expect our storage segment to continue to benefit from the contango
Table of Contents
6
market from last spring, as many of the storage contracts entered into during that contango market will continue into and through much of 2021. Amid the ongoing recovery in 2021, we may see, and some industry experts suggest, that storage utilization may further improve through 2021 and 2022 due to contango market conditions. Furthermore, we expect our St. James terminal to benefit from unit train activity from unloading Canadian heavy crude and our West Coast terminals to benefit from completing additional renewable fuels-related projects in 2021. However, a significant spike in COVID-19 cases in the markets our assets serve could undermine demand and result in lower utilization of our assets.
We plan to continue to manage our operations with fiscal discipline in this turbulent environment and to evaluate divestitures of non-core assets to reduce leverage. For the full-year 2021, we expect reliability and strategic capital expenditures to be comparable to 2020. We have positioned ourselves to self-fund all of our expenses, distribution requirements and capital expenditures for the full-year 2021 using internally generated cash flows. We expect our first quarter 2021 operational results and throughputs to be lower than the comparable period due to the strong pre-pandemic demand in the first quarter of 2020, and we expect our full-year 2021 results to be comparable to 2020.
Our outlook for the partnership, both overall and for any of our segments, may change, as we base our expectations on our continuing evaluation of several factors, many of which are outside our control. These factors include, but are not limited to, uncertainty surrounding the COVID-19 pandemic, including its duration and lingering impacts to the economy, as well as uncertainty surrounding future production decisions by OPEC+, the state of the economy and the capital markets, changes to our customers’ refinery maintenance schedules and unplanned refinery downtime, crude oil prices, the supply of and demand for crude oil, refined products and anhydrous ammonia, demand for our transportation and storage services and changes in laws and regulations affecting our operations.
CONSOLIDATED RESULTS OF OPERATIONS
The following discussion of our results of operations should be read in conjunction with Item 8. “Financial Statements and Supplementary Data” included in this report, which also contains additional detailed financial information about our segments in Note 25 of the Notes to Consolidated Financial Statements. A comparative discussion of our 2019 to 2018 results of operations can be found in Item 7. “Management’s Discussion and Analysis of Financial Condition and Results of Operations” included in our Annual Report on Form 10-K for the year ended December 31, 2019 filed with the Securities Exchange Commission (SEC) on February 27, 2020.
Table of Contents
7
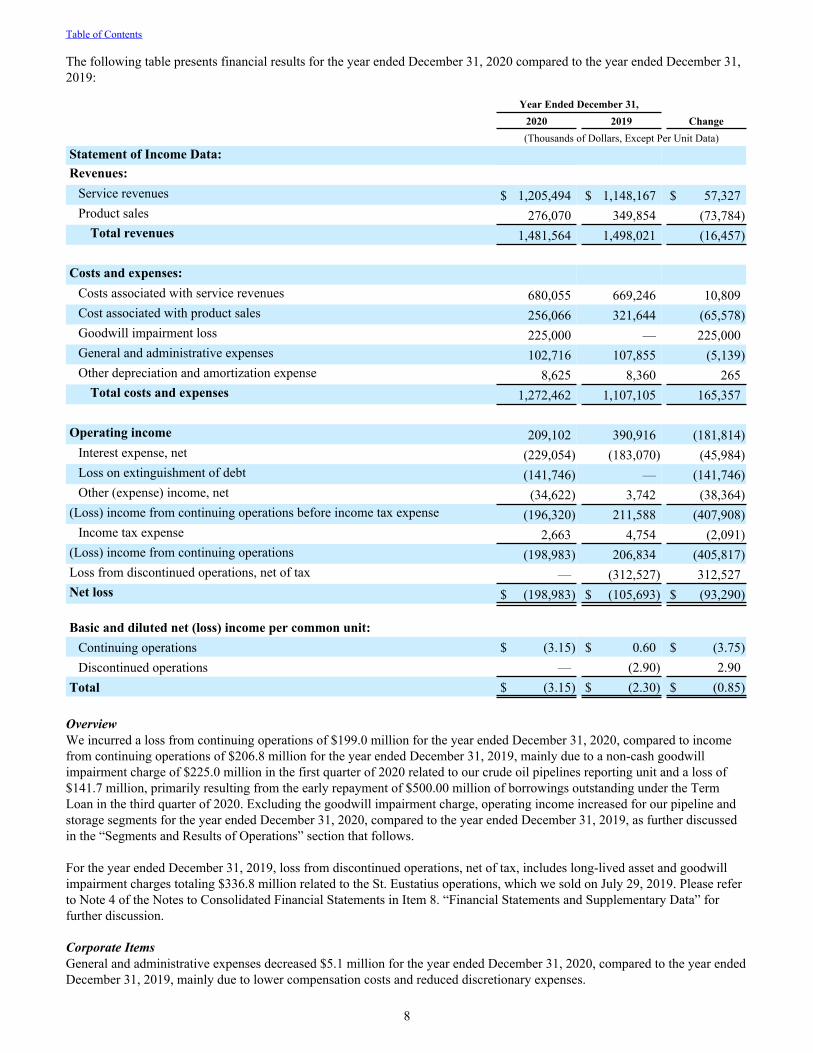
The following table presents financial results for the year ended December 31, 2020 compared to the year ended December 31, 2019:
Year Ended December 31, 2020 2019 Change
(Thousands of Dollars, Except Per Unit Data)Statement of Income Data:Revenues:
Service revenues $ 1,205,494 $ 1,148,167 $ 57,327 Product sales 276,070 349,854 (73,784)
Total revenues 1,481,564 1,498,021 (16,457)
Costs and expenses:Costs associated with service revenues 680,055 669,246 10,809 Cost associated with product sales 256,066 321,644 (65,578) Goodwill impairment loss 225,000 — 225,000 General and administrative expenses 102,716 107,855 (5,139) Other depreciation and amortization expense 8,625 8,360 265
Total costs and expenses 1,272,462 1,107,105 165,357
Operating income 209,102 390,916 (181,814) Interest expense, net (229,054) (183,070) (45,984) Loss on extinguishment of debt (141,746) — (141,746) Other (expense) income, net (34,622) 3,742 (38,364)
(Loss) income from continuing operations before income tax expense (196,320) 211,588 (407,908) Income tax expense 2,663 4,754 (2,091)
(Loss) income from continuing operations (198,983) 206,834 (405,817) Loss from discontinued operations, net of tax — (312,527) 312,527 Net loss $ (198,983) $ (105,693) $ (93,290)
Basic and diluted net (loss) income per common unit:Continuing operations $ (3.15) $ 0.60 $ (3.75) Discontinued operations — (2.90) 2.90
Total $ (3.15) $ (2.30) $ (0.85)
OverviewWe incurred a loss from continuing operations of $199.0 million for the year ended December 31, 2020, compared to income from continuing operations of $206.8 million for the year ended December 31, 2019, mainly due to a non-cash goodwill impairment charge of $225.0 million in the first quarter of 2020 related to our crude oil pipelines reporting unit and a loss of $141.7 million, primarily resulting from the early repayment of $500.00 million of borrowings outstanding under the Term Loan in the third quarter of 2020. Excluding the goodwill impairment charge, operating income increased for our pipeline and storage segments for the year ended December 31, 2020, compared to the year ended December 31, 2019, as further discussed in the “Segments and Results of Operations” section that follows.
For the year ended December 31, 2019, loss from discontinued operations, net of tax, includes long-lived asset and goodwill impairment charges totaling $336.8 million related to the St. Eustatius operations, which we sold on July 29, 2019. Please refer to Note 4 of the Notes to Consolidated Financial Statements in Item 8. “Financial Statements and Supplementary Data” for further discussion.
Corporate ItemsGeneral and administrative expenses decreased $5.1 million for the year ended December 31, 2020, compared to the year ended December 31, 2019, mainly due to lower compensation costs and reduced discretionary expenses.
Table of Contents
8
Interest expense, net increased $46.0 million for the year ended December 31, 2020, compared to the year ended December 31, 2019, primarily due to the interest on the Term Loan we entered into in April 2020 and the September 2020 issuance of $1.2 billion of senior notes.
For the year ended December 31, 2020, other expense, net includes a non-cash loss of $34.7 million related to the Texas City Sale.
SEGMENTS AND RESULTS OF OPERATIONS
PIPELINE SEGMENTOur pipeline operations consist of the transportation of refined products, crude oil and anhydrous ammonia. As of December 31, 2020, we owned and operated:
• refined product pipelines with an aggregate length of 3,205 miles and crude oil pipelines with an aggregate length of 2,205 miles in Texas, Oklahoma, Kansas, Colorado and New Mexico (collectively, the Central West System);
• a 2,050-mile refined product pipeline originating in southern Kansas and terminating at Jamestown, North Dakota, with a western extension to North Platte, Nebraska and an eastern extension into Iowa (the East Pipeline);
• a 450-mile refined product pipeline originating at Marathon Petroleum Corporation’s (Marathon) Mandan, North Dakota refinery and terminating in Minneapolis, Minnesota (the North Pipeline); and
• a 2,000-mile anhydrous ammonia pipeline originating in the Louisiana delta area and then running north through the Midwestern United States to Missouri before forking east and west to terminate in Indiana and Nebraska (the Ammonia Pipeline).
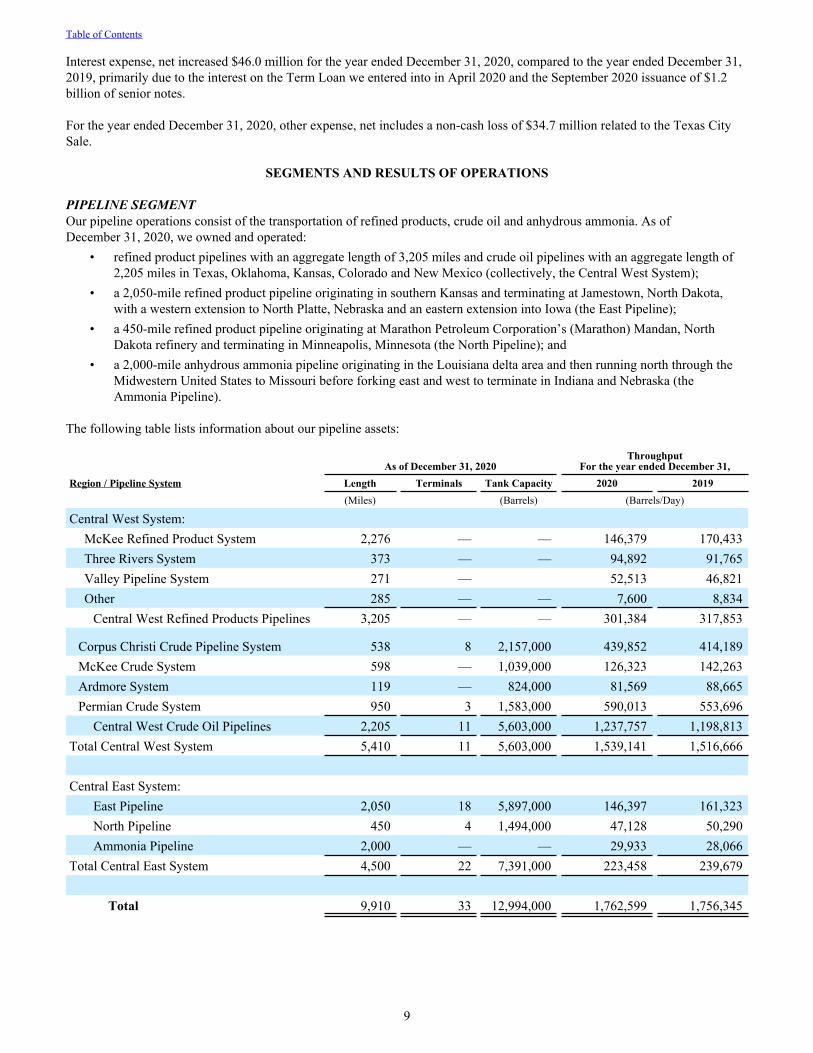
The following table lists information about our pipeline assets:
As of December 31, 2020Throughput
For the year ended December 31,Region / Pipeline System Length Terminals Tank Capacity 2020 2019
(Miles) (Barrels) (Barrels/Day)
Central West System:McKee Refined Product System 2,276 — — 146,379 170,433 Three Rivers System 373 — — 94,892 91,765 Valley Pipeline System 271 — 52,513 46,821 Other 285 — — 7,600 8,834
Central West Refined Products Pipelines 3,205 — — 301,384 317,853
Corpus Christi Crude Pipeline System 538 8 2,157,000 439,852 414,189 McKee Crude System 598 — 1,039,000 126,323 142,263 Ardmore System 119 — 824,000 81,569 88,665 Permian Crude System 950 3 1,583,000 590,013 553,696
Central West Crude Oil Pipelines 2,205 11 5,603,000 1,237,757 1,198,813 Total Central West System 5,410 11 5,603,000 1,539,141 1,516,666
Central East System:East Pipeline 2,050 18 5,897,000 146,397 161,323 North Pipeline 450 4 1,494,000 47,128 50,290 Ammonia Pipeline 2,000 — — 29,933 28,066
Total Central East System 4,500 22 7,391,000 223,458 239,679
Total 9,910 33 12,994,000 1,762,599 1,756,345
Table of Contents
9
Description of PipelinesCentral West System. The Central West System covers a total of 5,410 miles, including refined product and crude oil pipelines. The refined product pipelines have an aggregate length of 3,205 miles (Central West Refined Products Pipelines) and transport gasoline, distillates (including diesel and jet fuel), natural gas liquids and other products produced at the refineries to which they are connected, including Valero Energy Corporation’s (Valero Energy) McKee, Corpus Christi and Three Rivers refineries.
The crude oil pipelines have an aggregate length of 2,205 miles (Central West Crude Oil Pipelines) and transport crude oil and other feedstocks to the refineries to which they are connected, including Valero Energy’s McKee, Three Rivers and Ardmore refineries, or from the Permian Basin and Eagle Ford Shale regions to our North Beach marine export terminal or to third-party refineries in Corpus Christi, Texas. Our Corpus Christi Crude Pipeline System is comprised of pipelines that transport crude oil from the Eagle Ford region to Corpus Christi, Texas, including eight terminals along those pipelines, with aggregate storage capacity of 2.2 million barrels. In addition, the Corpus Christi Crude Pipeline System is connected to third-party long-haul pipelines that transport crude oil from the Permian Basin region to Corpus Christi, Texas.
Our Permian Crude System consists of crude oil transportation, pipeline connection and storage assets located in the Midland Basin of West Texas, that aggregate receipts from wellhead connection lines into intra-basin trunk lines for delivery to regional hubs and to connections with third-party mainline takeaway pipelines. The system consists of 950 miles of pipelines and covers approximately 500,000 dedicated acres controlled by producers, with approximately 300 receipt points. The Permian Crude System also includes three terminals in Texas, at Big Spring, Stanton and Colorado City, as well as several truck stations and other operational storage facilities, with an aggregate storage capacity of 1.6 million barrels.
Central East System. The Central East System covers a total of 4,500 miles and consists of the East Pipeline, the North Pipeline and the Ammonia Pipeline.
The East Pipeline covers 2,050 miles and transports refined products and natural gas liquids north via pipelines to our terminals and third-party terminals along the system and to receiving pipeline connections in Kansas. Shippers on the East Pipeline obtain refined products from refineries in Kansas, Oklahoma and Texas. The East Pipeline includes 18 truck-loading terminals, with storage capacity of 4.5 million barrels and two tank farms with storage capacity of 1.4 million barrels at McPherson and El Dorado, Kansas.
The North Pipeline originates at Marathon’s Mandan, North Dakota refinery and runs from west-to-east for approximately 450 miles to its termination in Minneapolis, Minnesota. The North Pipeline includes four truck-loading terminals with storage capacity of 1.5 million barrels.
The 2,000-mile Ammonia Pipeline originates in the Louisiana delta area, where it connects to three third-party marine terminals and three anhydrous ammonia plants located along the Mississippi River. The line then runs north through Louisiana and Arkansas into Missouri, where, at Hermann, Missouri, it splits into two branches, one of which goes east into Illinois and Indiana, while the other branch continues north into Iowa and then turns west into Nebraska. The Ammonia Pipeline is connected to multiple third-party-owned terminals, which include industrial facility delivery locations. Product is supplied to the pipeline from anhydrous ammonia plants in Louisiana and imported product delivered through the marine terminals. Anhydrous ammonia is primarily used as agricultural fertilizer. It is also used as a feedstock to produce other nitrogen derivative fertilizers and explosives.
Pipeline OperationsWe charge tariffs on a per-barrel basis for transporting refined products, crude oil and other feedstocks in our refined product and crude oil pipelines and on a per-ton basis for transporting anhydrous ammonia in the Ammonia Pipeline. Fees related to storage facilities included with these pipeline systems predominately relate to the volumes transported on the pipelines and are included in the respective pipeline tariff. As a result, these storage facilities are included in this segment instead of the storage segment.
In general, shippers on our crude oil and refined product pipelines deliver petroleum products to our pipelines for transport to/from: (i) refineries that connect to our pipelines, (ii) third-party pipelines or terminals and (iii) our terminals for further delivery to marine vessels or pipelines. We charge our shippers tariff rates based on transportation from the origination point on the pipeline to the point of delivery.
Our pipelines are regulated by one or more of the following federal governmental agencies: the Federal Energy Regulatory Commission (the FERC), the Surface Transportation Board (the STB), the Department of Transportation (the DOT), the Environmental Protection Agency (the EPA) and the Department of Homeland Security. In addition, our pipelines are subject to the respective jurisdictions of the states those lines traverse. See “Rate Regulation” and “Environmental, Health, Safety and Security Regulation” below for additional discussion.
Table of Contents
10
The majority of our pipelines are deemed to be “common carrier” lines. Common carrier activities are those for which transportation is available to any shipper who requests such services and satisfies the conditions and specifications for transportation. Published tariffs for our petroleum product pipeline shipments are (i) filed with the FERC for interstate pipeline shipments and (ii) filed with the relevant state authority for intrastate pipeline shipments.
We operate our pipelines remotely through an operational technology system called the Supervisory Control and Data Acquisition, or SCADA, system.
Demand for and Sources of Refined Products and Crude Oil Throughput activity on our Central West Refined Product Pipelines and the East and North Pipelines depends on the level of demand for refined products in the markets served by those pipelines, as well as the ability and willingness of the refiners and marketers with access to the pipelines to supply that demand through our pipelines.
The majority of the refined products delivered through the Central West Refined Product Pipelines and the North Pipeline are gasoline and diesel fuel that originate at refineries connected to our pipelines. Demand for motor fuels fluctuates as prices for these products fluctuate. Prices fluctuate for a variety of reasons, including the overall balance in supply and demand, which is affected by general economic conditions, among other factors. Prices for gasoline and diesel fuel usually increase in the warm weather months when people tend to drive automobiles more often and for longer distances.
Much of the refined products and natural gas liquids delivered through the East Pipeline, and a portion of volumes on the North Pipeline, are ultimately used as fuel for railroads, ethanol denaturant or in agricultural operations, including fuel for farm equipment, irrigation systems, trucks used for transporting crops and crop-drying facilities. Demand for refined products for agricultural use, and the relative mix of products required, is affected by weather conditions in the markets served by the East and North Pipelines. The agricultural sector is also affected by government agricultural policies and crop commodity prices. Although periods of drought suppress agricultural demand for some refined products, particularly those used for fueling farm equipment, the demand for fuel to power irrigation systems often increases during such times. The mix of refined products delivered for agricultural use varies seasonally, with gasoline demand peaking in early summer, diesel fuel demand peaking in late summer and propane demand highest in the fall.
Our refined product pipelines are also dependent upon adequate levels of production of refined products by refineries connected to the pipelines, directly or through connecting pipelines. The refineries are, in turn, dependent upon adequate supplies of suitable grades of crude oil. Certain of our Central West Refined Products Pipelines are connected directly to Valero Energy refineries and are subject to long-term throughput agreements with Valero Energy. If operations at one of these refineries were discontinued or significantly reduced, it could have a material adverse effect on our operations, although we would endeavor to minimize the impact by seeking alternative customers for those pipelines.
The North Pipeline is heavily dependent on Marathon’s Mandan, North Dakota refinery, which primarily runs North Dakota crude oil (although it has the ability to process other crude oils), and an interruption in operations at the Marathon refinery could have a material adverse effect on our operations. In addition, the North Pipeline receives refined products from the Laurel, Montana refinery operated by CHS Inc. The majority of the refined products transported through the East Pipeline are produced at three refineries located at McPherson and El Dorado, Kansas and Ponca City, Oklahoma, which are operated by CHS Inc., HollyFrontier Corporation and Phillips 66, respectively. The East Pipeline also has access to Gulf Coast supplies of products through third-party connecting pipelines that receive products originating from Gulf Coast refineries.
Other than the Valero Energy refineries and the Marathon refinery described above, if operations at any one refinery were discontinued, we believe (assuming stable demand for refined products in markets served by the refined product pipelines) that the effects thereof would be short-term in nature, and our business would not be materially adversely affected over the long-term because such discontinued production could be replaced by other refineries or other sources.
Our crude oil pipelines are dependent on our customers’ continued access to sufficient crude oil and sufficient demand for refined products for our customers to operate their refineries. The supply of crude oil production (domestic and foreign) could fluctuate with the price of crude oil. Changes in crude oil prices could also affect the exploration and production of shale plays, which could affect demand for crude oil pipelines serving those regions, such as our Corpus Christi Crude Pipeline System and Permian Crude System. During periods of sustained low prices, as is currently the case, producers tend to reduce their capital spending and drilling activity and narrow their focus to assets in the most cost-advantaged regions.
In addition, certain of our crude oil pipelines, including the McKee System, are the primary source of crude oil for our customers’ refineries. Therefore, these “demand-pull” pipelines are less affected by changes in crude oil prices. For example, refiners can benefit from lower crude oil prices if they are able to take advantage of lower feedstock prices in areas with healthy regional demand; however, as refined product inventories increase, refiners typically reduce their production rate, which may reduce the degree to which they are able to benefit from low crude prices.
Table of Contents
11
The impacts from COVID-19 and actions by OPEC+, including crude oil price volatility and reduced refinery production rates, drilling activity and overall consumer demand, have negatively impacted demand for our crude and refined product pipelines for 2020, primarily in the second quarter. The duration, severity and lingering impact on economic activity from the COVID-19 pandemic and future production decisions from OPEC+ could continue to cause volatility in demand for the transportation in our pipelines.
Demand for and Sources of Anhydrous AmmoniaThe Ammonia Pipeline currently is the only major pipeline in the United States transporting anhydrous ammonia into the nation’s corn belt. The pipeline is connected to domestic production facilities and also has the capability to receive products from outside the United States directly into the system.
Throughputs on our Ammonia Pipeline depend on overall demand for nitrogen fertilizer use, the price of natural gas, which is the primary component of anhydrous ammonia, and the level of demand for direct application of anhydrous ammonia as a fertilizer for crop production (Direct Application). Demand for Direct Application is dependent on the weather, as Direct Application is not effective when soil is either too wet or too dry.
Corn producers have fertilizer alternatives to anhydrous ammonia, such as liquid or dry nitrogen fertilizers. Liquid and dry nitrogen fertilizers are both less sensitive to weather conditions during application but are generally more costly than anhydrous ammonia. In addition, anhydrous ammonia has the highest nitrogen content of any nitrogen-derivative fertilizer.
Demand for anhydrous ammonia has been insulated from the negative impacts from COVID-19 and actions by OPEC+ by continued strong agricultural demand and lower-density population centers in the Midwest.
CustomersAs discussed above, our customers include integrated oil companies, refining companies and others. Valero Energy, the largest customer of our pipeline segment, accounted for approximately 26% of the total segment revenues for the year ended December 31, 2020. No other single customer accounted for a significant portion of the total revenues of our pipeline segment.
Competition and Other Business ConsiderationsBecause pipelines are generally the lowest-cost method for intermediate and long-haul movement of crude oil and refined products, our more significant competitors are common carrier and proprietary pipelines owned and operated by major integrated and large independent oil companies and other pipeline companies in our service areas. Competition between common carrier pipelines is based primarily on transportation charges, quality of customer service and proximity to end users. Trucks may deliver products competitively for short-hauls; however, trucking costs render that mode of transportation uncompetitive with pipeline options for longer hauls or larger volumes.
Most of our refined product pipelines and certain of our crude oil pipelines within the Central West System are physically integrated with, and principally serve, refineries owned by Valero Energy. As a result, we do not believe that we will face significant competition for transportation services provided to the Valero Energy refineries we serve.
Certain of our crude oil pipelines serve areas and/or refineries that are affected by domestic shale oil production in the Eagle Ford, Permian Basin and Granite Wash regions. Our pipelines also face competition from other crude oil pipelines and truck transportation in these regions. However, some of that exposure is mitigated through our long-term contracts and minimum volume commitments with creditworthy customers.
The East and North Pipelines compete with an independent common carrier pipeline system owned by Magellan Midstream Partners, L.P. (Magellan) that operates approximately 100 miles east of and parallel to the East Pipeline and in close proximity to the North Pipeline. Certain of the East Pipeline’s and the North Pipeline’s delivery terminals are in direct competition with Magellan’s terminals. Competition with Magellan is based primarily on transportation charges, quality of customer service and proximity to end users.
Competitors of the Ammonia Pipeline include Midwest production facilities, nitrogen fertilizer substitutes and barge and railroad transportation under certain market conditions.
Table of Contents
12
Results of OperationsThe following table presents operating highlights for the pipeline segment: Year Ended December 31, 2020 2019 Change
(Thousands of Dollars, Except Barrel Data)Crude oil pipelines throughput (barrels/day) 1,237,757 1,198,813 38,944 Refined products and ammonia pipelines throughput (barrels/day) 524,842 557,532 (32,690)
Total throughput (barrels/day) 1,762,599 1,756,345 6,254
Throughput and other revenues $ 718,823 $ 701,830 $ 16,993 Operating expenses 198,010 202,359 (4,349) Depreciation and amortization expense 177,384 166,991 10,393 Goodwill impairment loss 225,000 — 225,000
Segment operating income $ 118,429 $ 332,480 $ (214,051)
Despite the dual impacts of COVID-19 and actions by OPEC+, which negatively affected overall demand on certain of our crude and refined product pipelines in 2020, total revenues increased $17.0 million and total throughputs increased 6,254 barrels per day for the year ended December 31, 2020, compared to the year ended December 31, 2019, primarily due to:
• an increase in revenues of $19.0 million and an increase in throughputs of 5,692 barrels per day on our Valley Pipeline System, mainly due to the completion of an expansion project in the third quarter of 2019 and an increase in minimum volume commitments on a customer contract beginning in the third quarter of 2020;
• an increase in revenues of $12.1 million and an increase in throughputs of 36,317 barrels per day on our Permian Crude System due to the completion of new pipeline connections with higher tariffs and expansion projects;
• an increase in revenues of $4.1 million and an increase in throughputs of 1,867 barrels per day on our Ammonia Pipeline, mainly due to lower throughputs in 2019 as a result of unfavorable weather conditions;
• an increase in revenues of $4.0 million and an increase in throughputs of 3,127 barrels per day on our Three Rivers System, mainly due to the reactivation of our refined products pipeline to transport diesel to our Nuevo Laredo terminal in Mexico, which began early service in the third quarter of 2019 and was at full service at the end of the first quarter of 2020; and
• an increase in revenues of $2.4 million on our Ardmore System, mainly due to an increase in the number of barrels moved at higher average tariffs in 2020 and a customer agreement that began in the second quarter of 2019, despite a decrease in throughputs of 7,096 barrels per day resulting from lower run rates at a customer’s refinery in 2020.
The increase in revenues was partially offset by:• a decrease in revenues of $13.9 million and a decrease in throughputs of 39,994 barrels per day on our McKee System
pipelines, mainly due to lower demand in 2020; • a decrease in revenues of $6.9 million on our Houston pipeline due to a reduction in the lease rate and the expiration of
the customer contract; • a decrease in revenues of $4.1 million and a decrease in throughputs of 18,088 barrels per day on our North Pipeline
and East Pipeline combined, due to a decline in demand; and• a decrease in revenues of $1.0 million, despite an increase in throughputs of 25,663 barrels per day, on our Corpus
Christi Crude System. Throughputs increased mainly due to the completion of the 30-inch crude oil pipeline from Taft, Texas to our Corpus Christi North Beach terminal in the third quarter of 2019 and the completion of a new pipeline connection in the fourth quarter of 2019, but were mostly offset by lower volumes from the Eagle Ford due to demand decline in 2020, resulting in overall slightly lower revenues.
Operating expenses decreased $4.3 million for the year ended December 31, 2020, compared to the year ended December 31, 2019, mainly due to a decrease in power and rental costs of $8.5 million across multiple pipelines, mainly resulting from the addition of permanent power on our Permian Crude System and lower throughputs on certain of our pipelines. These decreases were partially offset by higher ad valorem taxes of $2.4 million due to a 2019 settlement and an overall increase in 2020, as well as an increase of $2.2 million in insurance expenses due to higher premiums.
Depreciation and amortization expense increased $10.4 million for the year ended December 31, 2020, compared to the year ended December 31, 2019, mainly due to projects associated with the Permian Crude System and the completion of three major projects in the third quarter of 2019 on our Valley Pipeline System, Three Rivers System and Corpus Christi Crude System.
Table of Contents
13
In the first quarter of 2020, the negative impact of the COVID-19 pandemic, combined with actions by OPEC+, led to a decline in our unit price and market capitalization in March 2020, and as a result, we recorded a non-cash goodwill impairment charge of $225.0 million related to our crude oil pipelines reporting unit. Please refer to Note 11 of the Notes to Consolidated Financial Statements in Item 8. “Financial Statements and Supplementary Data” for further discussion.
STORAGE SEGMENTOur storage segment is comprised of our facilities that provide storage, handling and other services for petroleum products, crude oil, specialty chemicals, renewable fuels and other liquids. As of December 31, 2020, we owned and operated 38 terminal and storage facilities in the United States, one terminal in Nuevo Laredo, Mexico and one terminal located in Point Tupper, Canada with an aggregate storage capacity of 59.0 million barrels.
The following table sets forth information about our terminal and storage facilities as of December 31, 2020:
Facility Tank Capacity(Barrels)
Colorado Springs, CO 328,000 Denver, CO 110,000 Albuquerque, NM 251,000 Rosario, NM 166,000 Catoosa, OK 359,000 Abernathy, TX 161,000 Amarillo, TX 269,000 Corpus Christi, TX 491,000 Corpus Christi, TX (North Beach) 3,962,000 Edinburg, TX 346,000 El Paso, TX (a) 419,000 Harlingen, TX 286,000 Laredo, TX 218,000 San Antonio, TX (b) 377,000 Southlake, TX 569,000 Nuevo Laredo, Mexico 268,000
Central West Terminals 8,580,000
Jacksonville, FL 2,593,000 St. James, LA 9,906,000 Houston, TX 86,000
Gulf Coast Terminals 12,585,000
Blue Island, IL 690,000 Andrews AFB, MD (c) 75,000 Baltimore, MD 813,000 Piney Point, MD 5,402,000 Linden, NJ (b) 5,134,000 Paulsboro, NJ 74,000 Virginia Beach, VA (c) 41,000
North East Terminals 12,229,000
Table of Contents
14
Facility Tank Capacity(Barrels)
Los Angeles, CA 608,000 Pittsburg, CA 397,000 Selby, CA 2,672,000 Stockton, CA 816,000 Portland, OR 1,348,000 Tacoma, WA 391,000 Vancouver, WA (b) 774,000
West Coast Terminals 7,006,000
Benicia, CA 3,683,000 Corpus Christi, TX 4,030,000 Texas City, TX 3,141,000
Refinery Storage Tanks 10,854,000
Point Tupper, Canada 7,778,000
Total 59,032,000
(a) We own a 67% undivided interest in the El Paso refined product terminal. The tank capacity represents the proportionate share of capacity attributable to our ownership interest.
(b) Location includes two terminal facilities.(c) Terminal facility also includes pipelines to U.S. government military base locations.
Description of Major Terminal and Storage FacilitiesRefinery Storage Tanks. We own and operate crude oil storage tanks with an aggregate storage capacity of 10.9 million barrels that are physically integrated with and serve refineries owned by Valero Energy at Corpus Christi and Texas City, Texas and Benicia, California. We lease our refinery storage tanks to Valero Energy in exchange for a fixed fee.
St. James, Louisiana. Our St. James terminal, which is located on the Mississippi River near St. James, Louisiana, has a total storage capacity of 9.9 million barrels. The facility is located on almost 900 acres of land, some of which is undeveloped. The majority of the storage tanks and infrastructure are suited for light crude oil, with certain of the tanks capable of fuel oil or heated crude oil storage. Additionally, the facility has one barge dock and two ship docks. Our St. James terminal is connected to (i) offshore pipelines in the Gulf of Mexico, (ii) long-haul pipelines that can receive crude oil from the Eagle Ford, Permian Basin and other domestic shale plays, and (iii) pipelines to refineries in the Gulf Coast and Midwest. The St. James terminal also has two unit train rail facilities that are served by the Union Pacific Railroad. Each facility has the capacity to simultaneously off-load 120 railcars, at a minimum, in a 24-hour period.
Point Tupper. We own and operate a 7.8 million barrel terminalling and storage facility located at Point Tupper on the Strait of Canso, near Port Hawkesbury, Nova Scotia. This facility is the deepest ice-free marine terminal on the North American Atlantic coast, with access to the East Coast, Canada and the Midwestern United States markets via the St. Lawrence Seaway and the Great Lakes system. With one of the premier jetty facilities in North America, the Point Tupper facility can accommodate heavily laden ultra-large crude carriers (ULCCs) for loading and discharging crude oil, petroleum products and petrochemicals. Crude oil and petroleum product movements at the terminal are fully automated. Separate fees apply for use of the jetty facility, as well as associated services, including pilotage, tug assistance, line handling, launch service, emergency response services and other ship services (all of which are considered optional services).
Linden, New Jersey. Our Linden terminal facility includes two terminals that provide deep-water terminalling capabilities in the New York Harbor and primarily stores petroleum products, including gasoline, jet fuel and fuel oils. The two terminals have a total storage capacity of 5.1 million barrels and can receive and deliver products via ship, barge, truck and pipeline. The terminal facility also has two docks.
Corpus Christi North Beach. We own and operate a 4.0 million barrel crude oil storage and terminalling facility located at the Port of Corpus Christi in Texas. The facility supports our pipelines that transport crude oil from the Eagle Ford and Permian Basin regions to Corpus Christi for export or refineries owned by third parties. This facility also provides our customers with the flexibility to segregate and deliver crude oil and processed condensate. This facility has access to four docks, including one
Table of Contents
15
dock for which we have exclusive use and that is able to accommodate Aframax-class vessels, and two private docks. We can load crude oil onto ships simultaneously on all four docks.
We refer to our pipelines that transport crude oil from the Eagle Ford and Permian Basin regions to Corpus Christi, together with our Corpus Christi North Beach terminal, as the Corpus Christi Crude System.
Storage OperationsWe generate storage segment revenues through fees for tank storage agreements, under which a customer agrees to pay for a certain amount of storage in a tank over a period of time (storage terminal revenues), and throughput agreements, under which a customer pays a fee per barrel for volumes moved through our terminals (throughput terminal revenues). Our terminals also provide blending, additive injections, handling and filtering services for which we charge additional fees. Certain of our facilities charge fees to provide marine services, such as pilotage, tug assistance, line handling, launch service, emergency response services and other ship services.
Demand for Storage ServicesThe operations of our refined product terminals depend in large part on the level of demand for products stored in our terminals in the markets served by those assets. Demand for our terminalling services will generally increase or decrease with demand for refined products, and demand for refined products tends to increase or decrease with the relative strength of the economy. In addition, the forward pricing curve can have an impact on demand. For example, crude oil traders focus less on the current market commodity price than on whether that price is higher or lower than expected future market prices: if the future price for a product is believed to be higher than the current market price, or a “contango market,” traders are more likely to purchase and store products to sell in the future at the higher price. On the other hand, when the current price of crude oil nears or exceeds the expected future market price, or “backwardation,” traders are no longer incentivized to purchase and store product for future sale. Our storage terminal revenues are somewhat insulated from demand volatility due to contracted rates for storage and minimum volume commitments.
Crude oil delivered to our St. James and Corpus Christi North Beach terminals will generally increase or decrease with crude oil production rates in the Bakken, Permian and Eagle Ford shale plays. In addition, the market price relationship between various grades of crude oil impacts the demand for our unit train facilities at our St. James terminal.
The continued increase in North American shale play production has increased exports of crude oil from Texas Gulf Coast ports, including our Corpus Christi North Beach facility, to destinations as close as the U.S. East Coast, to as far away as Europe and Asia. The negative impacts from COVID-19 are somewhat mitigated by the low break-even point in the Permian and Eagle Ford shale plays, which resulted in Corpus Christi exports returning to pre-pandemic levels in the third quarter of 2020.
Demand for renewable diesel, renewable jet fuel, ethanol and other renewable fuels continues to grow in markets served by our West Coast terminals due to new regulations with aggressive carbon emissions reduction goals. As this demand growth is expected to continue, our West Coast terminals have completed and continue to develop renewable fuel storage projects to meet this demand.
Overall, the dual effect of the COVID-19 pandemic and actions by OPEC+, including crude oil price volatility, reduced refinery production rates, drilling activity and overall consumer demand, depressed demand on our terminal and storage facilities in 2020, primarily in the second quarter. However, the detrimental impact of the pandemic and crude oil price pressure was somewhat mitigated by our contracted rates for storage and minimum throughput agreements. In response to oil market conditions, a contango market emerged in March and April of 2020 resulting in increased demand for crude oil storage at certain of our storage facilities. The duration, severity and lingering impact on economic activity from the COVID-19 pandemic and future production decisions from OPEC+ could continue to cause volatility in demand for our terminal and storage facilities.
CustomersWe provide storage and terminalling services for crude oil, refined products and other products to many of the world’s largest producers of crude oil, integrated oil companies, chemical companies, oil traders and refiners. In addition, our blending capabilities in our storage assets have attracted customers who have leased capacity primarily for blending purposes. Valero Energy and Trafigura Trading LLC, the largest customers of our storage segment, accounted for approximately 22% and 20%, respectively, of the total revenues of the segment for the year ended December 31, 2020. No other customer accounted for a significant portion of the total revenues of the storage segment.
Table of Contents
16
Competition and Other Business Considerations Many major energy and chemical companies own extensive terminal storage facilities. Although such terminals often have the same capabilities as terminals owned by independent operators, they generally do not provide terminalling services to third parties. In many instances, major energy and chemical companies that own storage and terminalling facilities are also significant customers of independent terminal operators. Such companies typically have strong demand for terminals owned by independent operators when independent terminals have more cost-effective locations near key transportation links, such as deep-water ports. Major energy and chemical companies also need independent terminal storage when their owned storage facilities are inadequate, either because of size constraints, the nature of the stored material or specialized handling requirements.
Independent terminal owners generally compete on the basis of the location and versatility of terminals, service and price. A favorably located terminal will have access to various cost-effective transportation modes both to and from the terminal. Transportation modes typically include waterways, railroads, roadways and pipelines.
Terminal versatility is a function of the operator’s ability to offer complex handling requirements for diverse products. The services typically provided by the terminal include, among other things, the safe storage of the product at specified temperature, moisture and other conditions, as well as receipt at and delivery from the terminal, all of which must comply with applicable environmental regulations. A terminal operator’s ability to obtain attractive pricing is often dependent on the quality, versatility and reputation of the facilities owned by the operator. Although many products require modest terminal modification, operators with versatile storage capabilities typically require less modification prior to usage, ultimately making the storage cost to the customer more attractive.
Our crude oil refinery storage tanks are physically integrated with and serve refineries owned by Valero Energy, and we have entered into various agreements with Valero Energy governing the use of these tanks. As a result, we believe that we will not face significant competition for our services provided to those refineries.
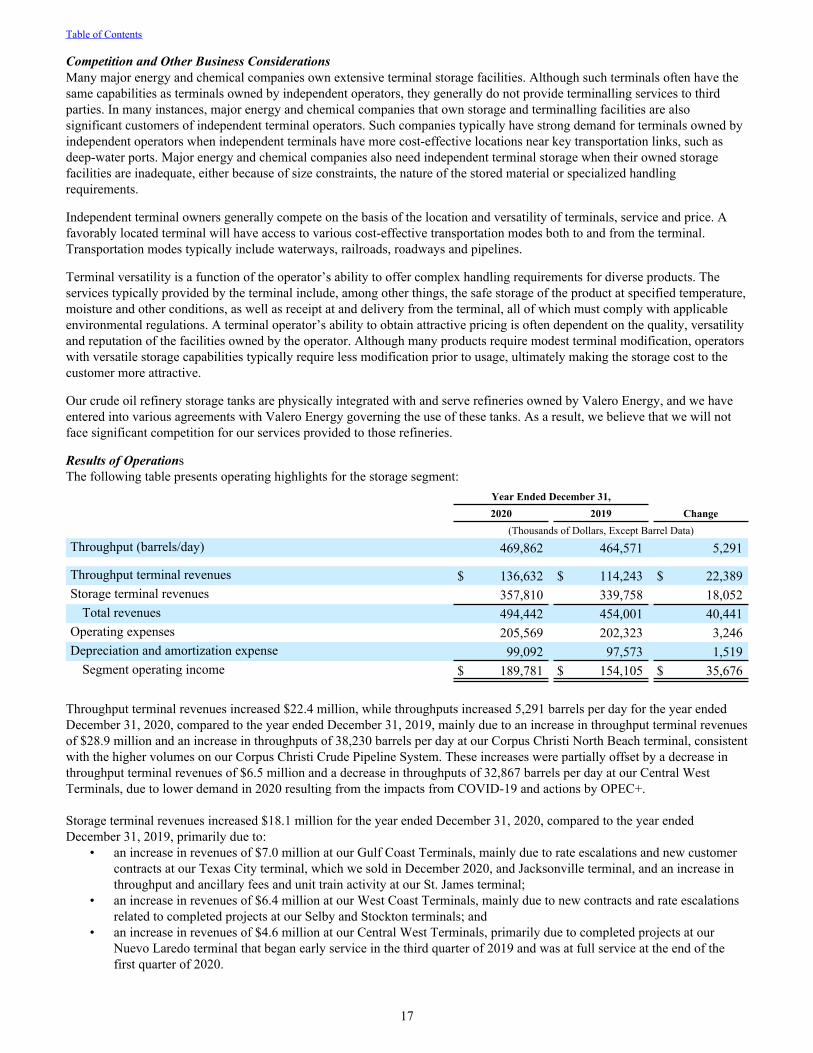
Results of OperationsThe following table presents operating highlights for the storage segment: Year Ended December 31, 2020 2019 Change
(Thousands of Dollars, Except Barrel Data)Throughput (barrels/day) 469,862 464,571 5,291
Throughput terminal revenues $ 136,632 $ 114,243 $ 22,389 Storage terminal revenues 357,810 339,758 18,052
Total revenues 494,442 454,001 40,441 Operating expenses 205,569 202,323 3,246 Depreciation and amortization expense 99,092 97,573 1,519
Segment operating income $ 189,781 $ 154,105 $ 35,676
Throughput terminal revenues increased $22.4 million, while throughputs increased 5,291 barrels per day for the year ended December 31, 2020, compared to the year ended December 31, 2019, mainly due to an increase in throughput terminal revenues of $28.9 million and an increase in throughputs of 38,230 barrels per day at our Corpus Christi North Beach terminal, consistent with the higher volumes on our Corpus Christi Crude Pipeline System. These increases were partially offset by a decrease in throughput terminal revenues of $6.5 million and a decrease in throughputs of 32,867 barrels per day at our Central West Terminals, due to lower demand in 2020 resulting from the impacts from COVID-19 and actions by OPEC+.
Storage terminal revenues increased $18.1 million for the year ended December 31, 2020, compared to the year ended December 31, 2019, primarily due to:
• an increase in revenues of $7.0 million at our Gulf Coast Terminals, mainly due to rate escalations and new customer contracts at our Texas City terminal, which we sold in December 2020, and Jacksonville terminal, and an increase in throughput and ancillary fees and unit train activity at our St. James terminal;
• an increase in revenues of $6.4 million at our West Coast Terminals, mainly due to new contracts and rate escalations related to completed projects at our Selby and Stockton terminals; and
• an increase in revenues of $4.6 million at our Central West Terminals, primarily due to completed projects at our Nuevo Laredo terminal that began early service in the third quarter of 2019 and was at full service at the end of the first quarter of 2020.
Table of Contents
17
Operating expenses increased $3.2 million for the year ended December 31, 2020, compared to the year ended December 31, 2019, primarily due to the following:
• an increase in insurance expense of $5.5 million due to higher premiums; and• an increase in reimbursable expenses of $4.3 million, mostly resulting from higher reimbursable wharfage activity at
our Corpus Christi North Beach terminal and increased customer activity at our Texas City terminal prior to its sale in December 2020.
These increases were partially offset by the business interruption insurance recovery of $6.7 million in 2020 related to a fire at our Selby terminal in the fourth quarter of 2019.
Depreciation and amortization expense increased $1.5 million for the year ended December 31, 2020, compared to the year ended December 31, 2019, mainly due to the $2.7 million increase resulting from the completion of the Nuevo Laredo terminal project and other various projects, partially offset by a decrease of $1.2 million due to the Texas City Sale.
FUELS MARKETING SEGMENTThe fuels marketing segment includes our bunkering operations in the Gulf Coast, as well as certain of our blending operations associated with our Central East System. The results of operations for the fuels marketing segment depend largely on the margin between our cost and the sales prices of the products we market. Therefore, the results of operations for this segment are more sensitive to changes in commodity prices compared to the operations of the pipeline and storage segments.
Customers for bunker fuel sales are mainly ship owners, including cruise line companies, marketers and traders. In the sale of bunker fuel, we compete with ports offering bunker fuels that are along the route of travel of the vessel. No customer accounted for a significant portion of the total revenues of the fuels marketing segment for the year ended December 31, 2020.
The COVID-19 pandemic has negatively impacted commodity prices and volumes, especially for our blending operations and bunker fuel sales to cruise ships for 2020, for which the duration and lingering impact is not known.
Results of OperationsThe following table presents operating highlights for the fuels marketing segment: Year Ended December 31, 2020 2019 Change
(Thousands of Dollars)Product sales $ 268,345 $ 342,215 $ (73,870) Cost of goods 253,704 318,869 (65,165)
Gross margin 14,641 23,346 (8,705) Operating expenses 2,408 2,768 (360)
Segment operating income $ 12,233 $ 20,578 $ (8,345)
Segment operating income decreased $8.3 million for the year ended December 31, 2020, compared to the year ended December 31, 2019, primarily due to a decrease in gross margins from our blending operations, resulting from a decline in demand due to the impacts from COVID-19 and actions by OPEC+.
LIQUIDITY AND CAPITAL RESOURCES
OverviewOur primary cash requirements are for distributions to our partners, debt service, capital expenditures and operating expenses. Our partnership agreement requires that we distribute all “Available Cash” to our common limited partners each quarter. “Available Cash” is defined in the partnership agreement generally as cash on hand at the end of the quarter, plus certain permitted borrowings made subsequent to the end of the quarter, less cash reserves determined by our board of directors, subject to requirements for distributions for our preferred units.
For 2020 and prior years, our objective was to fund our reliability capital expenditures and distribution requirements with net cash provided by operating activities during that year. If we did not generate sufficient cash from operations to meet that objective, we used cash on hand or other sources of cash flow, which primarily included borrowings under our revolving credit agreement, sales of non-strategic assets and, to the extent necessary, funds raised through debt or equity offerings. In recent years, we have funded our strategic capital expenditures primarily from borrowings under our revolving credit agreement, funds raised through debt or equity offerings and/or sales of non-strategic assets. However, our ability to raise funds by issuing debt
Table of Contents
18
or equity depends on many factors beyond our control, including our ability to access such markets with the continued uncertainty surrounding the duration and severity of the impact from the COVID-19 pandemic and actions by OPEC+. Our risk factors in Item 1A. “Risk Factors” describe the risks inherent to these sources of funding and the availability thereof.
Also, we may maintain our distribution level with other sources of Available Cash, as provided in our partnership agreement, including borrowings under our revolving credit agreement and proceeds from the sales of assets.
Due to the negative impact of, and the continued uncertainty stemming from, the COVID-19 pandemic and actions taken by OPEC+ in 2020, we took steps to preserve and enhance our liquidity. To reduce our overall cash requirements, we reduced our strategic capital expenditures for the full-year 2020 by $165.0 million, approximately 50% below our forecast at the beginning of 2020, to $160.0 million. We also reduced our controllable and operating expenses for the full-year 2020, mainly related to power and other costs associated with lower throughput compared to our forecast at the beginning of 2020 and certain discretionary maintenance, travel and other expenses. Further, we lowered our distribution, beginning with the distribution related to the first quarter of 2020, to $0.40 per common unit, which reduces our overall cash requirements.
In March 2020, we enhanced our sources of liquidity by extending the maturity on our revolving credit agreement from October 2021 to October 2023. In June 2020, we completed the reoffering and conversion of $322.1 million aggregate principal amount of Revenue Bonds Series 2008, Series 2010, Series 2010A, Series 2010B and Series 2011 issued by the Parish of St. James, Louisiana pursuant to the Gulf Opportunity Zone Act of 2005 (collectively, GoZone Bonds) with respect to our St. James, Louisiana terminal. The reoffering and conversion transaction provided us with additional financial flexibility by converting the interest rate on the GoZone Bonds from a weekly rate to a long-term rate, and eliminating the need to remarket the bonds prior to 2025, and, in some cases, until 2030 or the maturity of the bonds in 2040. In addition, the reoffering and conversion transaction provided us with additional liquidity by eliminating the letters of credit previously issued by various individual banks on our behalf to support the payments required in connection with the GoZone Bonds.
In addition, in April, we entered into a $750.0 million three-year unsecured Term Loan, which allowed us to pay down our revolving credit agreement with the proceeds of our initial $500.0 million draw to provide the financial flexibility to address our near-term debt maturities. In September 2020, we issued $600.0 million of 5.75% senior notes due October 1, 2025 and $600.0 million of 6.375% senior notes due October 1, 2030, which we used to repay the outstanding borrowings under the Term Loan and outstanding borrowings under our revolving credit agreement. As a result of the issuance of these senior notes, we had no outstanding borrowings under our $1.0 billion revolving credit agreement as of December 31, 2020. We expect that amounts available under the revolving credit agreement will be sufficient to address senior note maturities in 2021 and 2022, and we have no other senior note maturities until 2025.
After recognizing the shifting expectations of our industry, including continuing to reduce leverage, combined with the recent lack of access to equity markets and the uncertain COVID-19 environment, we expect the structural changes described above to continue through 2021. As a result, for the full-year 2021, we have positioned ourselves to self-fund all of our expenses, distribution requirements and capital expenditures using internally generated cash flows.
A discussion of our cash flows and other changes in financial position for 2018 can be found in Item 7. “Management’s Discussion and Analysis of Financial Condition and Results of Operations” included in our Annual Report on Form 10-K for the year ended December 31, 2019 filed with the SEC on February 27, 2020.
Table of Contents
19
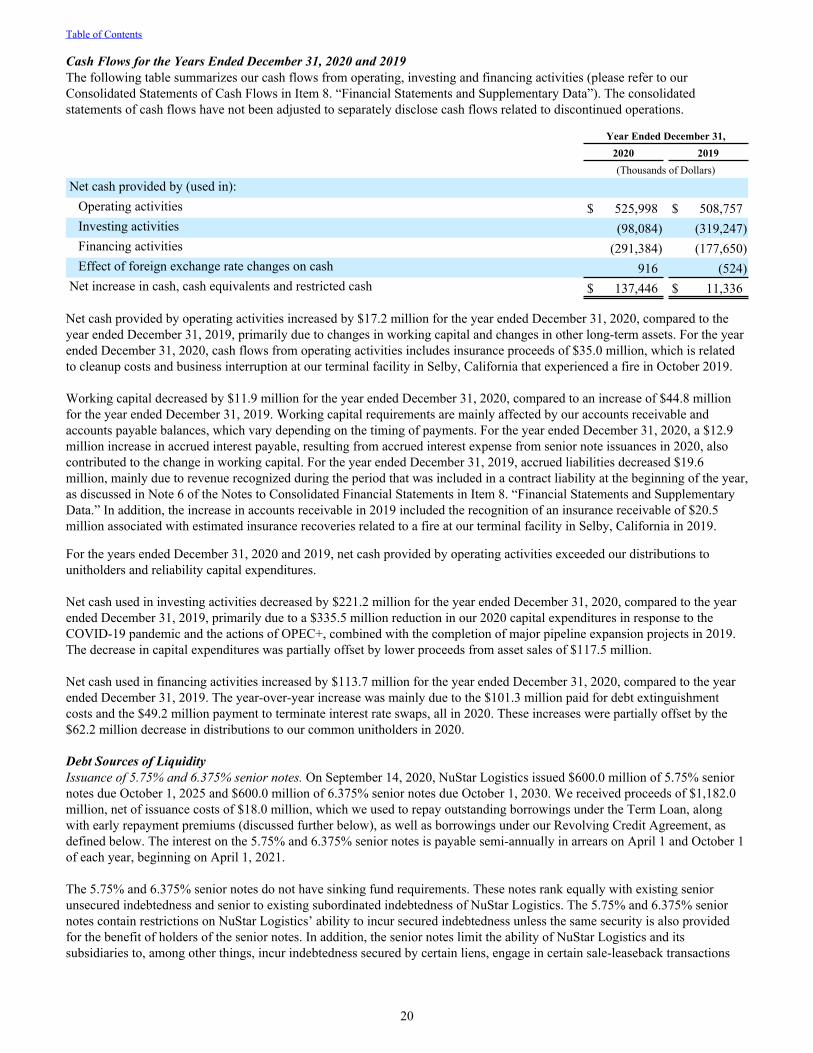
Cash Flows for the Years Ended December 31, 2020 and 2019The following table summarizes our cash flows from operating, investing and financing activities (please refer to our Consolidated Statements of Cash Flows in Item 8. “Financial Statements and Supplementary Data”). The consolidated statements of cash flows have not been adjusted to separately disclose cash flows related to discontinued operations.
Year Ended December 31, 2020 2019
(Thousands of Dollars)Net cash provided by (used in):
Operating activities $ 525,998 $ 508,757 Investing activities (98,084) (319,247) Financing activities (291,384) (177,650) Effect of foreign exchange rate changes on cash 916 (524)
Net increase in cash, cash equivalents and restricted cash $ 137,446 $ 11,336
Net cash provided by operating activities increased by $17.2 million for the year ended December 31, 2020, compared to the year ended December 31, 2019, primarily due to changes in working capital and changes in other long-term assets. For the year ended December 31, 2020, cash flows from operating activities includes insurance proceeds of $35.0 million, which is related to cleanup costs and business interruption at our terminal facility in Selby, California that experienced a fire in October 2019.
Working capital decreased by $11.9 million for the year ended December 31, 2020, compared to an increase of $44.8 million for the year ended December 31, 2019. Working capital requirements are mainly affected by our accounts receivable and accounts payable balances, which vary depending on the timing of payments. For the year ended December 31, 2020, a $12.9 million increase in accrued interest payable, resulting from accrued interest expense from senior note issuances in 2020, also contributed to the change in working capital. For the year ended December 31, 2019, accrued liabilities decreased $19.6 million, mainly due to revenue recognized during the period that was included in a contract liability at the beginning of the year, as discussed in Note 6 of the Notes to Consolidated Financial Statements in Item 8. “Financial Statements and Supplementary Data.” In addition, the increase in accounts receivable in 2019 included the recognition of an insurance receivable of $20.5 million associated with estimated insurance recoveries related to a fire at our terminal facility in Selby, California in 2019.
For the years ended December 31, 2020 and 2019, net cash provided by operating activities exceeded our distributions to unitholders and reliability capital expenditures.
Net cash used in investing activities decreased by $221.2 million for the year ended December 31, 2020, compared to the year ended December 31, 2019, primarily due to a $335.5 million reduction in our 2020 capital expenditures in response to the COVID-19 pandemic and the actions of OPEC+, combined with the completion of major pipeline expansion projects in 2019. The decrease in capital expenditures was partially offset by lower proceeds from asset sales of $117.5 million.
Net cash used in financing activities increased by $113.7 million for the year ended December 31, 2020, compared to the year ended December 31, 2019. The year-over-year increase was mainly due to the $101.3 million paid for debt extinguishment costs and the $49.2 million payment to terminate interest rate swaps, all in 2020. These increases were partially offset by the $62.2 million decrease in distributions to our common unitholders in 2020.
Debt Sources of LiquidityIssuance of 5.75% and 6.375% senior notes. On September 14, 2020, NuStar Logistics issued $600.0 million of 5.75% senior notes due October 1, 2025 and $600.0 million of 6.375% senior notes due October 1, 2030. We received proceeds of $1,182.0 million, net of issuance costs of $18.0 million, which we used to repay outstanding borrowings under the Term Loan, along with early repayment premiums (discussed further below), as well as borrowings under our Revolving Credit Agreement, as defined below. The interest on the 5.75% and 6.375% senior notes is payable semi-annually in arrears on April 1 and October 1 of each year, beginning on April 1, 2021.
The 5.75% and 6.375% senior notes do not have sinking fund requirements. These notes rank equally with existing senior unsecured indebtedness and senior to existing subordinated indebtedness of NuStar Logistics. The 5.75% and 6.375% senior notes contain restrictions on NuStar Logistics’ ability to incur secured indebtedness unless the same security is also provided for the benefit of holders of the senior notes. In addition, the senior notes limit the ability of NuStar Logistics and its subsidiaries to, among other things, incur indebtedness secured by certain liens, engage in certain sale-leaseback transactions
Table of Contents
20
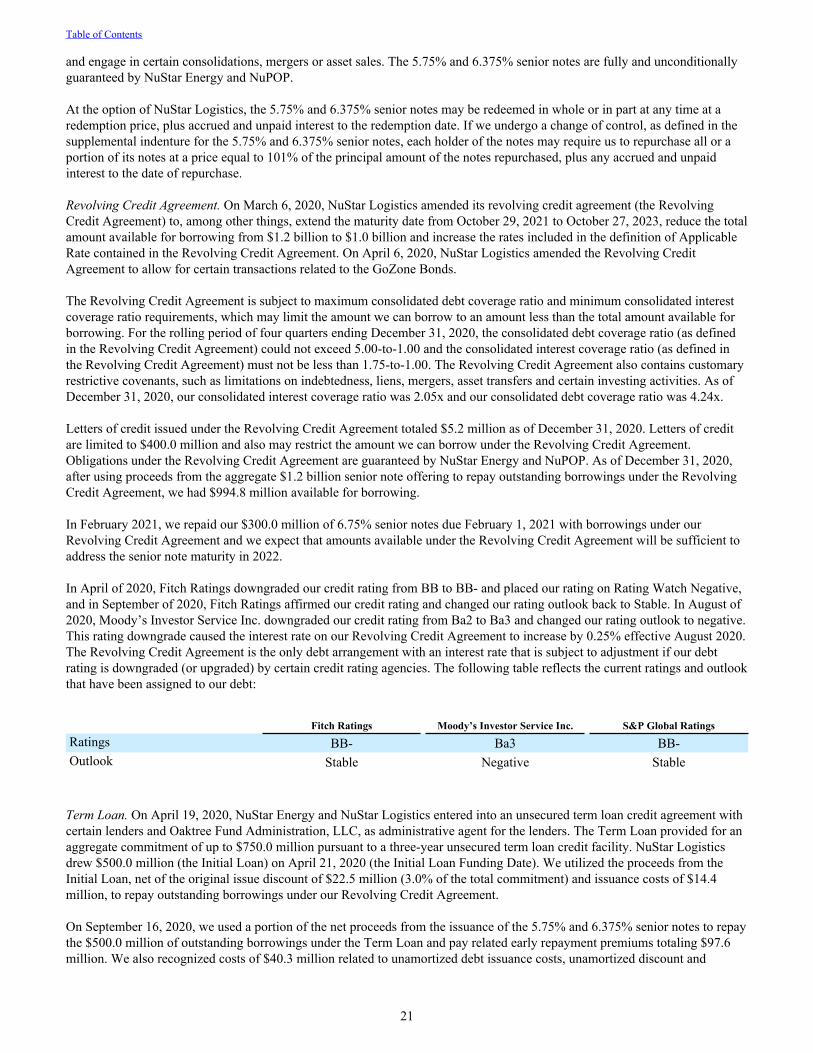
and engage in certain consolidations, mergers or asset sales. The 5.75% and 6.375% senior notes are fully and unconditionally guaranteed by NuStar Energy and NuPOP.
At the option of NuStar Logistics, the 5.75% and 6.375% senior notes may be redeemed in whole or in part at any time at a redemption price, plus accrued and unpaid interest to the redemption date. If we undergo a change of control, as defined in the supplemental indenture for the 5.75% and 6.375% senior notes, each holder of the notes may require us to repurchase all or a portion of its notes at a price equal to 101% of the principal amount of the notes repurchased, plus any accrued and unpaid interest to the date of repurchase.
Revolving Credit Agreement. On March 6, 2020, NuStar Logistics amended its revolving credit agreement (the Revolving Credit Agreement) to, among other things, extend the maturity date from October 29, 2021 to October 27, 2023, reduce the total amount available for borrowing from $1.2 billion to $1.0 billion and increase the rates included in the definition of Applicable Rate contained in the Revolving Credit Agreement. On April 6, 2020, NuStar Logistics amended the Revolving Credit Agreement to allow for certain transactions related to the GoZone Bonds.
The Revolving Credit Agreement is subject to maximum consolidated debt coverage ratio and minimum consolidated interest coverage ratio requirements, which may limit the amount we can borrow to an amount less than the total amount available for borrowing. For the rolling period of four quarters ending December 31, 2020, the consolidated debt coverage ratio (as defined in the Revolving Credit Agreement) could not exceed 5.00-to-1.00 and the consolidated interest coverage ratio (as defined in the Revolving Credit Agreement) must not be less than 1.75-to-1.00. The Revolving Credit Agreement also contains customary restrictive covenants, such as limitations on indebtedness, liens, mergers, asset transfers and certain investing activities. As of December 31, 2020, our consolidated interest coverage ratio was 2.05x and our consolidated debt coverage ratio was 4.24x.
Letters of credit issued under the Revolving Credit Agreement totaled $5.2 million as of December 31, 2020. Letters of credit are limited to $400.0 million and also may restrict the amount we can borrow under the Revolving Credit Agreement. Obligations under the Revolving Credit Agreement are guaranteed by NuStar Energy and NuPOP. As of December 31, 2020, after using proceeds from the aggregate $1.2 billion senior note offering to repay outstanding borrowings under the Revolving Credit Agreement, we had $994.8 million available for borrowing.
In February 2021, we repaid our $300.0 million of 6.75% senior notes due February 1, 2021 with borrowings under our Revolving Credit Agreement and we expect that amounts available under the Revolving Credit Agreement will be sufficient to address the senior note maturity in 2022.
In April of 2020, Fitch Ratings downgraded our credit rating from BB to BB- and placed our rating on Rating Watch Negative, and in September of 2020, Fitch Ratings affirmed our credit rating and changed our rating outlook back to Stable. In August of 2020, Moody’s Investor Service Inc. downgraded our credit rating from Ba2 to Ba3 and changed our rating outlook to negative. This rating downgrade caused the interest rate on our Revolving Credit Agreement to increase by 0.25% effective August 2020. The Revolving Credit Agreement is the only debt arrangement with an interest rate that is subject to adjustment if our debt rating is downgraded (or upgraded) by certain credit rating agencies. The following table reflects the current ratings and outlook that have been assigned to our debt:
Fitch Ratings Moody’s Investor Service Inc. S&P Global RatingsRatings BB- Ba3 BB-Outlook Stable Negative Stable
Term Loan. On April 19, 2020, NuStar Energy and NuStar Logistics entered into an unsecured term loan credit agreement with certain lenders and Oaktree Fund Administration, LLC, as administrative agent for the lenders. The Term Loan provided for an aggregate commitment of up to $750.0 million pursuant to a three-year unsecured term loan credit facility. NuStar Logistics drew $500.0 million (the Initial Loan) on April 21, 2020 (the Initial Loan Funding Date). We utilized the proceeds from the Initial Loan, net of the original issue discount of $22.5 million (3.0% of the total commitment) and issuance costs of $14.4 million, to repay outstanding borrowings under our Revolving Credit Agreement.
On September 16, 2020, we used a portion of the net proceeds from the issuance of the 5.75% and 6.375% senior notes to repay the $500.0 million of outstanding borrowings under the Term Loan and pay related early repayment premiums totaling $97.6 million. We also recognized costs of $40.3 million related to unamortized debt issuance costs, unamortized discount and
Table of Contents
21
commitment fee, which resulted in a loss from extinguishment of debt of $137.9 million in the third quarter of 2020. We terminated the Term Loan on February 16, 2021.
Receivables Financing Agreement. NuStar Energy and NuStar Finance LLC (NuStar Finance), a special purpose entity and wholly owned subsidiary of NuStar Energy, are parties to a receivables financing agreement with third-party lenders (the Receivables Financing Agreement) and agreements with certain of NuStar Energy’s wholly owned subsidiaries (together with the Receivables Financing Agreement, the Securitization Program). On September 3, 2020, they amended the Receivables Financing Agreement to, among other things: (i) extend the maturity date from September 20, 2021 to September 20, 2023, (ii) reduce the amount available for borrowing from $125.0 million to $100.0 million, (iii) provide that the failure to satisfy the consolidated debt coverage ratio, as defined in the Revolving Credit Agreement, would constitute an Event of Default as defined in the Receivables Financing Agreement, and (iv) increase the interest rate. The amount available for borrowing under the Receivables Financing Agreement is based on the availability of eligible receivables and other customary factors and conditions. The Securitization Program contains various customary affirmative and negative covenants and default, indemnification and termination provisions, and the Receivables Financing Agreement provides for acceleration of amounts owed upon the occurrence of certain specified events.
Issuance of 6.0% senior notes. On May 22, 2019, NuStar Logistics issued $500.0 million of 6.0% senior notes due June 1, 2026. We received net proceeds of $491.6 million, which we initially used to repay outstanding borrowings under our Revolving Credit Agreement. The interest on the 6.0% senior notes is payable semi-annually in arrears on June 1 and December 1 of each year, beginning on December 1, 2019. The 6.0% senior notes rank equally with existing senior unsecured indebtedness and senior to existing subordinated indebtedness of NuStar Logistics. The 6.0% senior notes contain terms comparable to our other senior notes, including the 5.75% and 6.375% senior notes described above.
Please refer to Note 13 of the Notes to Consolidated Financial Statements in Item 8. “Financial Statements and Supplementary Data” for a discussion of our debt agreements.
LOC Agreement. NuStar Logistics is a party to a $100.0 million uncommitted letter of credit agreement, which provides for standby letters of credit or guarantees with a term of up to one year (LOC Agreement). Any letters of credit issued under the LOC Agreement do not reduce availability under the Revolving Credit Agreement. As of December 31, 2020, we had no letters of credit issued under the LOC Agreement.
Other Sources of LiquidityAsset Sales. Proceeds from the Texas City Sale in 2020 were used to improve our debt metrics. Proceeds from the sale of our St. St. Eustatius terminal and bunkering operations in 2019 (the St. Eustatius Disposition) and the sale of our European operations in 2018 (the European Disposition) were initially used to repay outstanding borrowings under our revolving credit agreement, increasing the amount available for borrowing. The St. Eustatius Disposition and the European Disposition were part of our plan to improve our debt metrics and partially fund capital projects to grow our core business in North America.
Repatriation. We may repatriate a portion of undistributed foreign earnings in order to provide greater flexibility to meet cash flow needs. We will continue to evaluate our cash flow needs and may repatriate funds from our foreign subsidiaries as a source of liquidity.
Capital RequirementsOur operations require significant investments to maintain, upgrade or enhance the operating capacity of our existing assets. Our capital expenditures consist of:
• strategic capital expenditures, such as those to expand or upgrade the operating capacity, increase efficiency or increase the earnings potential of existing assets, whether through construction or acquisition, as well as certain capital expenditures related to support functions; and
• reliability capital expenditures, such as those required to maintain the current operating capacity of existing assets or extend their useful lives, as well as those required to maintain equipment reliability and safety.
Table of Contents
22
The following table summarizes our capital expenditures:Strategic Capital
ExpendituresReliability Capital
Expenditures Total(Thousands of Dollars)
For the year ended December 31:2020 $ 159,507 $ 38,572 $ 198,079 2019 $ 466,996 $ 66,572 $ 533,568
Expected for the year ended December 31, 2021 $ 140,000 - 170,000 $ 40,000 - 50,000
Strategic capital expenditures for the years ended December 31, 2020 and December 31, 2019 mainly consisted of expansion projects on our Permian Crude System and Corpus Christi Crude System, as well as West Coast biofuels terminal projects. Strategic capital expenditures also included Northern Mexico refined products supply projects in 2019 and projects to increase flexibility at our St. James and other terminals in 2020. Reliability capital expenditures primarily related to maintenance upgrade projects at our terminals, including $17.7 million in costs to repair the property damage at the St. Eustatius terminal prior to its sale in July 2019.
For the year ended December 31, 2021, we expect a significant portion of our strategic capital spending to relate to our expansion projects to accommodate production growth in the Permian Basin and projects to handle biofuels demand on the West Coast. We continue to evaluate our capital budget and make changes as economic conditions warrant, and our actual capital expenditures for 2021 may increase or decrease from the expected amounts noted above. In addition, we are currently evaluating reconstruction efforts related to a fire at our terminal facility in Selby, California, which could cause capital expenditures to be higher than the expected amounts noted above; however, we continue to expect that insurance proceeds will offset these capital expenditures. We expect to self-fund our capital expenditures in 2021, and our internal growth projects can be accelerated or scaled back depending on market conditions or customer demand.
Defined Benefit Plans FundingDuring 2020, we contributed $11.7 million to our pension and postretirement benefit plans. We expect to contribute approximately $9.7 million to our pension and postretirement benefit plans in 2021, which principally represents contributions either required by regulations or laws or, with respect to unfunded plans, necessary to fund current benefits. Pension and postretirement benefit plans funding beyond 2021 is uncertain as the funding varies from year to year based upon changes in the fair value of the plan assets and actuarial assumptions.
DistributionsCommon Limited Partners. Distribution payments are made to our common limited partners within 45 days after the end of each quarter as of a record date that is set after the end of each quarter. The following table summarizes information about cash distributions to our common limited partners applicable to the period in which the distributions were earned:
Cash Distributions
Per UnitTotal Cash
Distributions Record Date Payment Date(Thousands of Dollars)
Quarter ended:December 31, 2020 $ 0.40 $ 43,787 February 8, 2021 February 12, 2021September 30, 2020 0.40 43,678 November 6, 2020 November 13, 2020June 30, 2020 0.40 43,678 August 7, 2020 August 13, 2020March 31, 2020 0.40 43,730 May 11, 2020 May 15, 2020
Year ended December 31, 2020 $ 1.60 $ 174,873
Year ended December 31, 2019 $ 2.40 $ 259,136
Table of Contents
23
Preferred Units. The following table provides the terms related to distributions for our Series A, Series B and Series C Fixed-to-Floating Rate Cumulative Redeemable Perpetual Preferred Units (collectively, the Series A, B and C Preferred Units):
Units
Fixed Distribution Rate Per Annum (as a
Percentage of the $25.00 Liquidation
Preference Per Unit)
Fixed Distribution
Rate Per Unit Per Annum
Fixed Distribution Per Annum
Optional Redemption Date/Date at Which Distribution Rate Becomes Floating
Floating Annual Rate (as a Percentage of the
$25.00 Liquidation Preference Per Unit)
(Thousands of Dollars)
Series A Preferred Units 8.50% $ 2.125 $ 19,252 December 15, 2021Three-month LIBOR plus 6.766%
Series B Preferred Units 7.625% $ 1.90625 $ 29,357 June 15, 2022Three-month LIBOR plus 5.643%
Series C Preferred Units 9.00% $ 2.25 $ 15,525 December 15, 2022Three-month LIBOR plus 6.88%
The distribution rates on the Series D Cumulative Convertible Preferred Units (Series D Preferred Units) are as follows: (i) 9.75%, or $57.6 million, per annum ($0.619 per unit per distribution period) for the first two years (beginning with the September 17, 2018 distribution); (ii) 10.75%, or $63.4 million, per annum ($0.682 per unit per distribution period) for years three through five; and (iii) the greater of 13.75%, or $81.1 million, per annum ($0.872 per unit per distribution period) or the distribution per common unit thereafter. While the Series D Preferred Units are outstanding, the Partnership will be prohibited from paying distributions on any junior securities, including the common units, unless full cumulative distributions on the Series D Preferred Units (and any parity securities) have been, or contemporaneously are being, paid or set aside for payment through the most recent Series D Preferred Unit distribution payment date. Any Series D Preferred Unit distributions in excess of $0.635 may be paid, in the Partnership’s sole discretion, in additional Series D Preferred Units, with the remainder paid in cash. If we fail to pay in full any Series D Preferred Unit distribution amount, then, until we pay such distributions in full, the applicable distribution rate for those distribution periods shall be increased by $0.048 per Series D Preferred Unit. We would also be subject to other requirements. The Series D Preferred Units also contain various conversion and redemption features, including the option to convert the Series D Preferred Units into common units on a one-for-one basis, as described in Note 18 of the Notes to Consolidated Financial Statements in Item 8. “Financial Statements and Supplementary Data.”
Distributions on our preferred units are payable out of any legally available funds, accrue and are cumulative from the original issuance dates, and are payable on the 15th day (or next business day) of each of March, June, September and December of each year to holders of record on the first business day of each payment month. Please see Notes 18 and 19 of the Notes to Consolidated Financial Statements in Item 8. “Financial Statements and Supplementary Data” for additional information.
In January 2021, our board of directors declared quarterly distributions with respect to the Series A, B and C Preferred Units and the Series D Preferred Units to be paid on March 15, 2021.
Debt ObligationsOur debt obligations as of December 31, 2020 are listed below:
• $300.0 million of 6.75% senior notes due February 1, 2021, $250.0 million of 4.75% senior notes due February 1, 2022; $600.0 million of 5.75% senior notes due October 1, 2025; $500.0 million of 6.0% senior notes due June 1, 2026; $550.0 million of 5.625% senior notes due April 28, 2027; $600.0 million of 6.375% senior notes due October 1, 2030; and $402.5 million of subordinated notes due January 15, 2043 with a floating interest rate, which was 7.0% as of December 31, 2020;
• $322.1 million in GoZone Bonds due from 2038 to 2041; and• Receivables Financing Agreement due September 20, 2023, with $57.0 million of borrowings outstanding as of
December 31, 2020.
We repaid our $450.0 million of 4.8% senior notes due September 1, 2020 at maturity with borrowings under our Revolving Credit Agreement. In February 2021, we repaid our $300.0 million of 6.75% senior notes due February 1, 2021 with borrowings under our Revolving Credit Agreement.
On June 3, 2020, NuStar Logistics completed the reoffering and conversion of the GoZone Bonds, which, among other things, converted the interest rate from a weekly rate to a long-term rate. We did not receive any proceeds from the reoffering, and the reoffering did not increase our outstanding debt. As reflected in the table below, certain series of GoZone Bonds in principal amounts totaling $75.0 million and $103.8 million contain a requirement for the bondholders to tender their bonds in exchange
Table of Contents
24
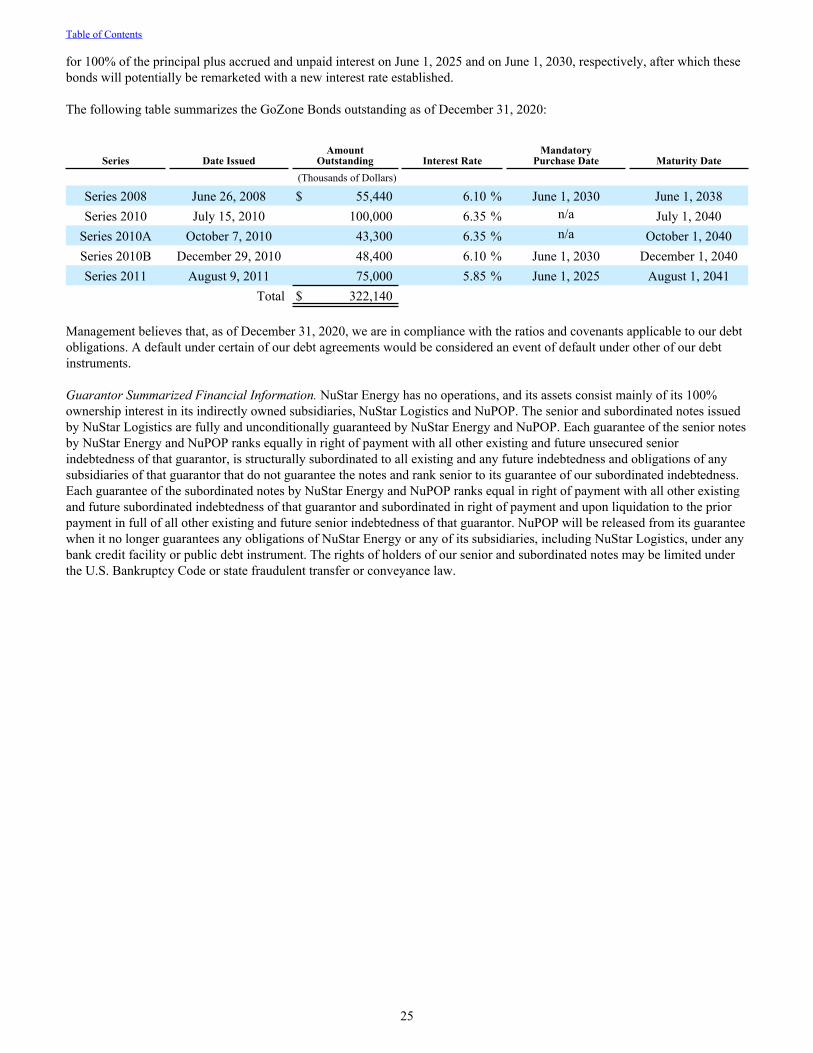
for 100% of the principal plus accrued and unpaid interest on June 1, 2025 and on June 1, 2030, respectively, after which these bonds will potentially be remarketed with a new interest rate established.
The following table summarizes the GoZone Bonds outstanding as of December 31, 2020:
Series Date IssuedAmount
Outstanding Interest RateMandatory
Purchase Date Maturity Date (Thousands of Dollars)
Series 2008 June 26, 2008 $ 55,440 6.10 % June 1, 2030 June 1, 2038Series 2010 July 15, 2010 100,000 6.35 % n/a July 1, 2040
Series 2010A October 7, 2010 43,300 6.35 % n/a October 1, 2040Series 2010B December 29, 2010 48,400 6.10 % June 1, 2030 December 1, 2040Series 2011 August 9, 2011 75,000 5.85 % June 1, 2025 August 1, 2041
Total $ 322,140
Management believes that, as of December 31, 2020, we are in compliance with the ratios and covenants applicable to our debt obligations. A default under certain of our debt agreements would be considered an event of default under other of our debt instruments.
Guarantor Summarized Financial Information. NuStar Energy has no operations, and its assets consist mainly of its 100% ownership interest in its indirectly owned subsidiaries, NuStar Logistics and NuPOP. The senior and subordinated notes issued by NuStar Logistics are fully and unconditionally guaranteed by NuStar Energy and NuPOP. Each guarantee of the senior notes by NuStar Energy and NuPOP ranks equally in right of payment with all other existing and future unsecured senior indebtedness of that guarantor, is structurally subordinated to all existing and any future indebtedness and obligations of any subsidiaries of that guarantor that do not guarantee the notes and rank senior to its guarantee of our subordinated indebtedness. Each guarantee of the subordinated notes by NuStar Energy and NuPOP ranks equal in right of payment with all other existing and future subordinated indebtedness of that guarantor and subordinated in right of payment and upon liquidation to the prior payment in full of all other existing and future senior indebtedness of that guarantor. NuPOP will be released from its guarantee when it no longer guarantees any obligations of NuStar Energy or any of its subsidiaries, including NuStar Logistics, under any bank credit facility or public debt instrument. The rights of holders of our senior and subordinated notes may be limited under the U.S. Bankruptcy Code or state fraudulent transfer or conveyance law.
Table of Contents
25
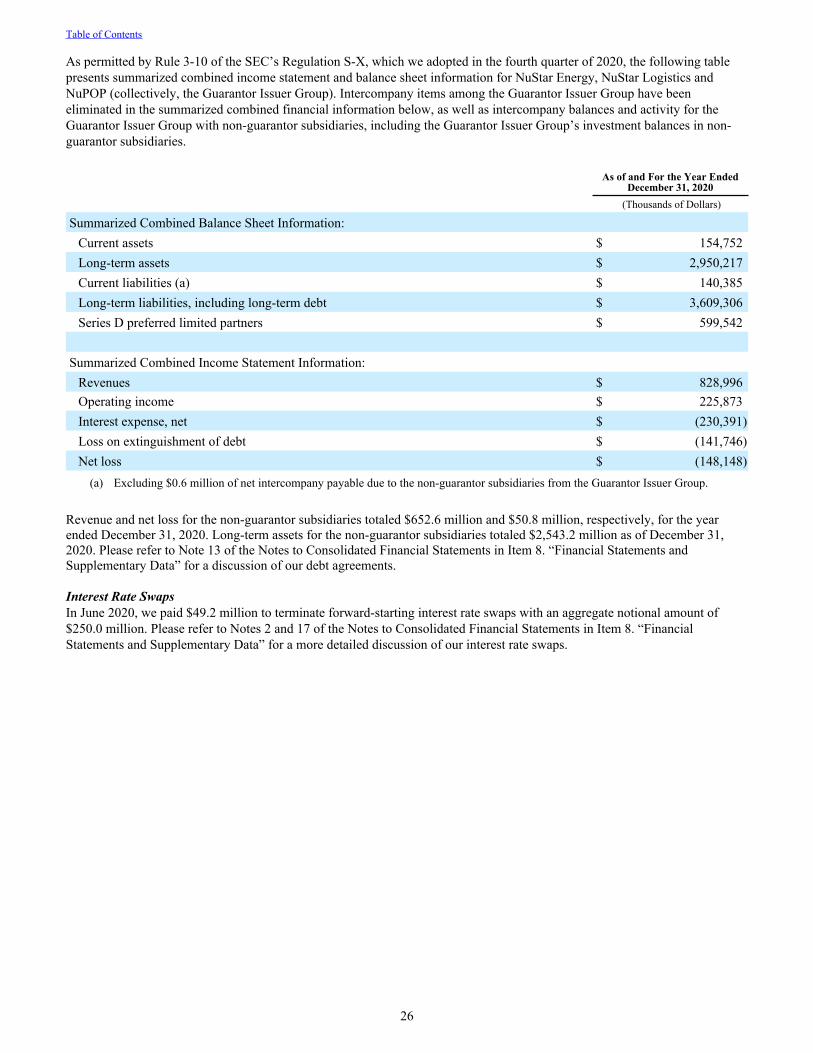
As permitted by Rule 3-10 of the SEC’s Regulation S-X, which we adopted in the fourth quarter of 2020, the following table presents summarized combined income statement and balance sheet information for NuStar Energy, NuStar Logistics and NuPOP (collectively, the Guarantor Issuer Group). Intercompany items among the Guarantor Issuer Group have been eliminated in the summarized combined financial information below, as well as intercompany balances and activity for the Guarantor Issuer Group with non-guarantor subsidiaries, including the Guarantor Issuer Group’s investment balances in non-guarantor subsidiaries.
As of and For the Year EndedDecember 31, 2020
(Thousands of Dollars)
Summarized Combined Balance Sheet Information:Current assets $ 154,752 Long-term assets $ 2,950,217 Current liabilities (a) $ 140,385 Long-term liabilities, including long-term debt $ 3,609,306 Series D preferred limited partners $ 599,542
Summarized Combined Income Statement Information:Revenues $ 828,996 Operating income $ 225,873 Interest expense, net $ (230,391) Loss on extinguishment of debt $ (141,746) Net loss $ (148,148)
(a) Excluding $0.6 million of net intercompany payable due to the non-guarantor subsidiaries from the Guarantor Issuer Group.
Revenue and net loss for the non-guarantor subsidiaries totaled $652.6 million and $50.8 million, respectively, for the year ended December 31, 2020. Long-term assets for the non-guarantor subsidiaries totaled $2,543.2 million as of December 31, 2020. Please refer to Note 13 of the Notes to Consolidated Financial Statements in Item 8. “Financial Statements and Supplementary Data” for a discussion of our debt agreements.
Interest Rate SwapsIn June 2020, we paid $49.2 million to terminate forward-starting interest rate swaps with an aggregate notional amount of $250.0 million. Please refer to Notes 2 and 17 of the Notes to Consolidated Financial Statements in Item 8. “Financial Statements and Supplementary Data” for a more detailed discussion of our interest rate swaps.
Table of Contents
26
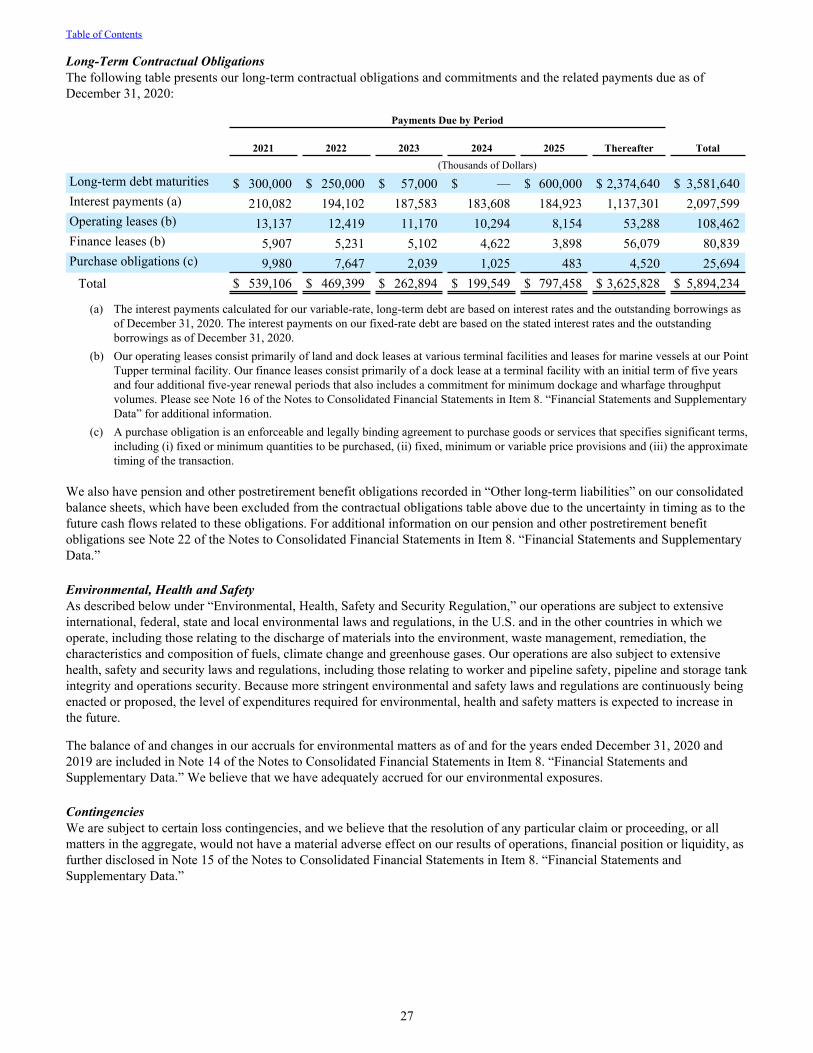
Long-Term Contractual ObligationsThe following table presents our long-term contractual obligations and commitments and the related payments due as of December 31, 2020:
Payments Due by Period
2021 2022 2023 2024 2025 Thereafter Total (Thousands of Dollars)Long-term debt maturities $ 300,000 $ 250,000 $ 57,000 $ — $ 600,000 $ 2,374,640 $ 3,581,640 Interest payments (a) 210,082 194,102 187,583 183,608 184,923 1,137,301 2,097,599 Operating leases (b) 13,137 12,419 11,170 10,294 8,154 53,288 108,462 Finance leases (b) 5,907 5,231 5,102 4,622 3,898 56,079 80,839 Purchase obligations (c) 9,980 7,647 2,039 1,025 483 4,520 25,694
Total $ 539,106 $ 469,399 $ 262,894 $ 199,549 $ 797,458 $ 3,625,828 $ 5,894,234
(a) The interest payments calculated for our variable-rate, long-term debt are based on interest rates and the outstanding borrowings as of December 31, 2020. The interest payments on our fixed-rate debt are based on the stated interest rates and the outstanding borrowings as of December 31, 2020.
(b) Our operating leases consist primarily of land and dock leases at various terminal facilities and leases for marine vessels at our Point Tupper terminal facility. Our finance leases consist primarily of a dock lease at a terminal facility with an initial term of five years and four additional five-year renewal periods that also includes a commitment for minimum dockage and wharfage throughput volumes. Please see Note 16 of the Notes to Consolidated Financial Statements in Item 8. “Financial Statements and Supplementary Data” for additional information.
(c) A purchase obligation is an enforceable and legally binding agreement to purchase goods or services that specifies significant terms, including (i) fixed or minimum quantities to be purchased, (ii) fixed, minimum or variable price provisions and (iii) the approximate timing of the transaction.
We also have pension and other postretirement benefit obligations recorded in “Other long-term liabilities” on our consolidated balance sheets, which have been excluded from the contractual obligations table above due to the uncertainty in timing as to the future cash flows related to these obligations. For additional information on our pension and other postretirement benefit obligations see Note 22 of the Notes to Consolidated Financial Statements in Item 8. “Financial Statements and Supplementary Data.”
Environmental, Health and SafetyAs described below under “Environmental, Health, Safety and Security Regulation,” our operations are subject to extensive international, federal, state and local environmental laws and regulations, in the U.S. and in the other countries in which we operate, including those relating to the discharge of materials into the environment, waste management, remediation, the characteristics and composition of fuels, climate change and greenhouse gases. Our operations are also subject to extensive health, safety and security laws and regulations, including those relating to worker and pipeline safety, pipeline and storage tank integrity and operations security. Because more stringent environmental and safety laws and regulations are continuously being enacted or proposed, the level of expenditures required for environmental, health and safety matters is expected to increase in the future.
The balance of and changes in our accruals for environmental matters as of and for the years ended December 31, 2020 and 2019 are included in Note 14 of the Notes to Consolidated Financial Statements in Item 8. “Financial Statements and Supplementary Data.” We believe that we have adequately accrued for our environmental exposures.
ContingenciesWe are subject to certain loss contingencies, and we believe that the resolution of any particular claim or proceeding, or all matters in the aggregate, would not have a material adverse effect on our results of operations, financial position or liquidity, as further disclosed in Note 15 of the Notes to Consolidated Financial Statements in Item 8. “Financial Statements and Supplementary Data.”
Table of Contents
27
HUMAN CAPITAL MANAGEMENT
As of December 31, 2020, we have 1,408 employees, of which 1,339 are based in the United States and 69 are based in Canada. Of our 1,408 employees, 93 are represented under collective bargaining agreements. In the United States, 512 of our employees are located at our headquarters in San Antonio, Texas, with the remaining 827 employees located at our field offices.
We strive to make NuStar a safe, positive, inclusive and rewarding workplace, with competitive compensation, benefits and health and wellness programs and opportunities for our employees to grow and develop in their careers. We also are committed to supporting the communities in which we operate, and we organize opportunities for our employees to engage in our communities through a variety of initiatives, such as fundraising activities, community clean-up projects and educational programs. NuStar’s culture revolves around our nine guiding principles: safety; integrity; commitment; make a difference; teamwork; respect; communication; excellence; and pride. We believe that these principles are the building blocks for NuStar’s success and have helped us to recruit and retain our employees and make NuStar a great place to work. NuStar has been recognized on Fortune’s list of Great Places to Work 11 times and Fortune’s list of Best Workplaces for Millennials four times, and also has been recognized as a top employer by regional and local publications, many of which base their determinations primarily on confidential surveys of our employees. In addition, as of December 31, 2020, 275 of our employees have been employed by NuStar or predecessor entities for at least 20 years.
As a midstream energy company, safety is our first priority. In managing our business, we focus on the safety of our employees and contractors, as well as the communities in which we operate. We have implemented safety programs and management practices to promote a culture of safety, including required training for field and office employees and contractors, as well as specific qualifications and certifications for field employees and contractors. To further emphasize the importance of safety at NuStar, our Audit Committee or our Board of Directors receives a comprehensive annual report regarding our health, safety and environmental performance, and our Board receives safety updates at least monthly. The Compensation Committee of our Board of Directors evaluates our health, safety and environmental performance annually as one of the metrics used to determine the annual incentive bonus for all of our employees, including our executive officers.
We are proud of NuStar’s safety performance. Our safety statistics have been substantially better than those reported by the U.S. Bureau of Labor Statistics for our industries. NuStar participates in the Occupational Health and Safety Administration’s (OSHA) Voluntary Protection Program (VPP), which promotes effective worksite health and safety. Achieving VPP Star Status requires rigorous OSHA review and audit, and requires recertification every three years. As of December 31, 2020, 85% of our eligible U.S. terminals have received VPP Star Status. NuStar also has received the International Liquids Terminals Association’s Safety Excellence Award 10 times.
Throughout the COVID-19 pandemic, we have continued to focus on safety and have taken measures to protect our employees and maintain safe, reliable operations to continue supplying the energy our country needs, and we have done so without furloughs or layoffs. We implemented social distancing through revised shift schedules, work from home policies and designated remote work locations where appropriate; enhanced cleaning protocols; provided personal protective equipment; restricted non-essential business travel; and adopted COVID-19 testing protocols and self-screening for employees and contractors. Even during the COVID-19 pandemic, our employees have continued to make a positive difference in the communities in which we operate by donating their time and resources.
PROPERTIES
Our principal properties are described above under the caption “Segments and Results of Operations” above, and that information is incorporated herein by reference. We believe that we have satisfactory title to all of our properties. Although title to these properties is subject to encumbrances in some cases, such as customary interests generally retained in connection with the acquisition of real property, liens for current taxes and other burdens and easements, and restrictions or other encumbrances, including those related to environmental liabilities associated with historical operations, to which the underlying properties were subject at the time of acquisition by us or our predecessors, we believe that none of these burdens will materially detract from the value of these properties or from our interest in these properties or will materially interfere with their use in the operation of our business. In addition, we believe that we have obtained sufficient right-of-way grants and permits from public authorities and private parties for us to operate our business in all material respects as described in this report. We perform scheduled maintenance on all of our pipelines, terminals, crude oil tanks and related equipment and make repairs and replacements when necessary or appropriate. We believe that our pipelines, terminals, crude oil tanks and related equipment have been constructed and are maintained in all material respects in accordance with applicable federal, state and local laws and the regulations and standards prescribed by the American Petroleum Institute, the DOT and accepted industry practice.
Table of Contents
28
RATE REGULATION
Several of our pipelines are interstate common carrier pipelines, which are subject to regulation by the FERC under the Interstate Commerce Act (ICA) and the Energy Policy Act of 1992 (the EP Act). The ICA and its implementing regulations give the FERC authority to regulate the rates charged for service on interstate common carrier pipelines and generally require the rates and practices of interstate liquids pipelines to be just, reasonable, not unduly discriminatory and not unduly preferential. The ICA also requires tariffs that set forth the rates a common carrier pipeline charges for providing transportation services on its interstate common carrier liquids pipelines, as well as the rules and regulations governing these services, to be maintained on file with the FERC and posted publicly. The EP Act deemed certain rates in effect prior to its passage to be just and reasonable and limited the circumstances under which a complaint can be made against such “grandfathered” rates. The EP Act and its implementing regulations also allow interstate common carrier liquids pipelines to annually index their rates up to a prescribed ceiling level and require that such pipelines index their rates down to the prescribed ceiling level if the index is negative. In addition, the FERC retains cost-of-service ratemaking, market-based rates and settlement rates as alternatives to the indexing approach.
The Ammonia Pipeline is subject to regulation by the STB pursuant to the Interstate Commerce Act applicable to such pipelines (which differs from the ICA applicable to interstate liquids pipelines). Under that regulation, the Ammonia Pipeline’s rates, classifications, rules and practices related to the interstate transportation of anhydrous ammonia must be reasonable and, in providing interstate transportation, the Ammonia Pipeline may not subject a person, place, port or type of traffic to unreasonable discrimination.
In addition to federal regulatory body oversight, various states, including Colorado, Kansas, Louisiana, North Dakota and Texas, maintain commissions focused on the rates and practices of common carrier pipelines offering services within their borders. Although the applicable state statutes and regulations vary, they generally require that intrastate pipelines publish tariffs setting forth all rates, rules and regulations applying to intrastate service, and generally require that pipeline rates and practices be just, reasonable and nondiscriminatory.
Shippers may challenge tariff rates, rules and regulations on our pipelines. In most instances, state commissions have not initiated investigations of the rates or practices of pipelines in the absence of shipper complaints. There are no pending challenges or complaints regarding our tariffs.
ENVIRONMENTAL, HEALTH, SAFETY AND SECURITY REGULATION
Our operations are subject to extensive international, federal, state and local environmental laws and regulations, in the U.S. and in the other countries in which we operate, including those relating to the discharge of materials into the environment, waste management, remediation, the characteristics and composition of fuels, climate change and greenhouse gases. Our operations are also subject to extensive health, safety and security laws and regulations, including those relating to worker and pipeline safety, pipeline and storage tank integrity and operations security. The principal environmental, health, safety and security risks associated with our operations relate to unauthorized emissions into the air, releases into soil, surface water or groundwater, personal injury and property damage. We have adopted policies, practices, systems and procedures designed to comply with the laws and regulations, and to help minimize and mitigate these risks, limit the liability that could result from such events, prevent material environmental or other damage, ensure the safety of our employees and the public and secure our pipelines, terminals and operations. Compliance with environmental, health, safety and security laws, regulations and related permits increases our capital expenditures and operating expenses, and violation of these laws, regulations or permits could result in significant civil and criminal liabilities, injunctions or other penalties.
In 2020, our capital expenditures attributable to compliance with environmental regulations were $9.9 million, and we currently project regulatory compliance spending of approximately $5.3 million in 2021. However, future governmental actions could result in more restrictive laws and regulations, which could increase required capital expenditures and operating expenses. At this time, we are unable to estimate either the impact, if any, of potential future regulation and/or legislation on our financial condition or results of operations, or the amount and timing of such possible future expenditures or expenses. We believe that we are in substantial compliance with the environmental, health, safety and security laws and regulations applicable to our operations, but risk of additional compliance expenditures, expenses and liabilities are inherent to government-regulated industries, including midstream energy. As a result, there can be no assurances that significant expenditures, expenses and liabilities will not be incurred in the future. However, while compliance may affect our capital expenditures and operating expenses, we believe that the cost of such compliance will not have a material impact on our competitive position, financial condition or results of operations. Further, we do not believe that our cost of compliance is proportionately greater than the cost to other companies operating in our industry.
Table of Contents
29
Discussed below are the primary U.S. environmental, health, safety and security laws applicable to our operations. Compliance with or violations of any of these laws and related regulations could result in significant expenditures, expenses and liabilities.
Occupational, Safety and HealthWe are subject to the Occupational Safety and Health Act, as amended, and analogous or more stringent international, state and local laws and regulations for the protection of worker safety and health. In addition, we have operations subject to the Occupational Safety and Health Administration’s Process Safety Management regulations. These regulations apply to processes that involve certain chemicals at or above specified thresholds.
Fuel Standards and Renewable Energy International, federal, state and local laws and regulations regulate the fuels we transport and store for our customers. Changes in these laws or regulations could affect our earnings, including by reducing our throughput volumes, or require capital expenditures and expenses to segregate and separately store fuels. In addition, several federal and state programs require, subsidize or encourage the purchase and use of competing fuels or energy, renewable energy, electric battery-powered motor vehicle engines and renewable fuels and blending additives, like ethanol, biodiesel and renewable diesel. These programs may over time offset projected increases or reduce the demand for refined products, particularly gasoline, in certain markets. However, the increased production and use of renewable fuels may also create opportunities for pipeline transportation and fuel blending. Other legislative changes in the future may similarly alter the expected demand and supply projections for refined products in ways that cannot be predicted.
Hazardous Substances and Hazardous WasteThe Federal Comprehensive Environmental Response, Compensation and Liability Act, referred to as CERCLA or “Superfund,” and analogous or more stringent international, state and local laws and regulations, impose restrictions and liability related to the release, threatened release, disposal and remediation of hazardous substances. This liability can be joint and several strict liability, without regard to fault or the legality of the original release or disposal. Current operators of a facility, past owners or operators of a facility and parties who arranged for the disposal of a hazardous substance can be held liable under these laws and regulations.
We currently own, lease, and operate on, and have in the past owned, leased and operated on, properties and at facilities that handled, transported and stored hazardous substances. Our current operating and disposal practices comply with applicable laws, regulations and industry standards, and we believe our past practices complied at the time. Despite our compliance, hazardous substances may have been released on or under our facilities and properties, or on or under locations where these substances were taken for disposal. We are currently remediating subsurface contamination at several facilities, and, based on currently available information, we believe the costs related to these remedial activities should not materially affect our financial condition or results of operations. However, the aggregate total cost of remediation projects can be difficult to estimate, and there are no assurances that the cost of future remedial activities will not become material. Further, applicable laws or regulation, including those dictating the degree of remediation required, may be revised to be more restrictive in the future. As a result, we are unable to estimate the effect of future regulation on our financial condition or results of operations or the amount and timing of future expenditures required to comply with such possible regulatory changes.
The Federal Resource Conservation and Recovery Act, as amended, and analogous or more stringent international, state and local laws and regulations impose restrictions and strict controls regarding the handling and disposal of wastes, including hazardous wastes. We generate hazardous wastes and it is possible that additional wastes, which could include wastes currently generated during operations, will be designated as hazardous wastes in the future. Hazardous wastes are subject to more rigorous requirements than are non-hazardous wastes.
AirThe Federal Clean Air Act, as amended, and various applicable international, state and local laws and regulations impose restrictions and strict controls regarding emission into the air, including greenhouse gas emissions. These laws and regulations generally require permits issued by applicable federal, state or local authorities for emissions, and impose monitoring and reporting requirements. Such laws and regulations can also require pre-approval for the construction or modification of certain operations or facilities expected to produce or increase air emissions.
WaterThe Federal Water Pollution Control Act, as amended, also known as the Clean Water Act, the federal Spill Prevention, Control, and Countermeasure and Facility Response Plan Rules and analogous or more stringent international, state and local laws and regulations impose restrictions and strict controls regarding the discharge of pollutants into state waters or waters of the United States. The discharge of pollutants into waters is generally prohibited, except in accordance with a permit issued by
Table of Contents
30
applicable federal or state authorities. The Oil Pollution Act further regulates the discharge of oil, and the response to and liability for oil spills, and the Rivers and Harbors Act regulates pipelines crossing navigable waters.
Pipeline and Other Asset Integrity, Safety and SecurityOur pipeline, storage tank and other operations are subject to extensive international, federal, state and local laws and regulations governing integrity, safety and security, including those in Title 49 of the U.S. Code and its implementing regulations. These laws and regulations include the Pipeline and Hazardous Materials Safety Administration’s requirements for safe pipeline design, construction, operation, maintenance, inspection, testing and corrosion control, control rooms and qualification programs for operating personnel. In addition, we have marine terminal operations subject to Coast Guard safety, integrity and security regulations and standards. We also have operations subject to the Department of Homeland Security Chemical Facility Anti-Terrorism Standards and Transportation Security Administration’s Pipeline Security Guidelines. We believe that we are in material compliance with all applicable laws and regulations regarding the security of our facilities.
We have cybersecurity programs and protocols in place and we monitor for changes to cybersecurity laws and regulations that may be applicable to our facilities and technology. We believe we are in material compliance with these laws; however, we cannot guarantee the effectiveness of our cybersecurity program and protocols and a successful penetration of our critical systems could have a material effect on our operations and those of our customers and vendors.
CRITICAL ACCOUNTING POLICIES
The preparation of financial statements in accordance with U.S. generally accepted accounting principles requires management to select accounting policies and to make estimates and assumptions related thereto that affect the amounts reported in the consolidated financial statements and accompanying notes. Actual results could differ from those estimates. The accounting policies below are considered critical due to judgments made by management and the sensitivity of these estimates to deviations of actual results from management’s assumptions. Ongoing uncertainty surrounding the COVID-19 pandemic, including its duration and lingering impacts, and uncertainty surrounding future production decisions by oil-producing nations continue to cause volatility and could significantly impact management’s estimates and assumptions. The critical accounting policies should be read in conjunction with Note 2 of the Notes to the Consolidated Financial Statements in Item 8. “Financial Statements and Supplementary Data,” which summarizes our significant accounting policies.
Impairment of Long-Lived Assets We test long-lived assets for recoverability whenever events or changes in circumstances indicate that the carrying amount of the asset may not be recoverable. We evaluate recoverability using undiscounted estimated net cash flows generated by the related asset or asset group. If the results of that evaluation indicate that the undiscounted cash flows are less than the carrying amount of the asset (i.e., the asset is not recoverable) we perform an impairment analysis. If our intent is to hold the asset for continued use, we determine the amount of impairment as the amount by which the net carrying value exceeds its fair value. If our intent is to sell the asset, and the criteria required to classify an asset as held for sale are met, we determine the amount of impairment as the amount by which the net carrying amount exceeds its fair value less costs to sell.
In determining the existence of an impairment of the carrying value of an asset, we make a number of subjective assumptions as to:
• whether there is an event or circumstance that may indicate that the carrying amount of an asset may not be recoverable;
• the grouping of assets;• the intention of holding, abandoning or selling an asset;• the forecast of undiscounted expected future cash flows with respect to an asset or asset group; and• if an impairment exists, the fair value of the asset or asset group.
Our estimates of undiscounted future cash flows include: (i) discrete financial forecasts, which rely on management’s estimates of revenue and operating expenses; (ii) long-term growth rates; and (iii) estimates of useful lives of the assets. The identification of impairment indicators and the estimates of future undiscounted cash flows are highly subjective and are based on numerous assumptions about future operations and market conditions, which we believe to be reasonable but are inherently uncertain. The uncertainties underlying our assumptions and estimates could differ significantly from actual results and could cause a different conclusion about the recoverability of our assets. If we determined one or more assets was impaired, the amount of impairment could be material to our results of operations.
We recorded long-lived asset impairment charges of $305.7 million in 2019. Please refer to Note 4 of the Notes to Consolidated Financial Statements in Item 8. “Financial Statements and Supplementary Data,” for discussion of the impairment charges.
Table of Contents
31
Impairment of GoodwillWe perform an assessment of goodwill annually or more frequently if events or changes in circumstances warrant. We have the option to first perform a qualitative annual assessment to determine whether it is necessary to perform a quantitative goodwill impairment test. A qualitative assessment includes, among other things, industry and market considerations, overall financial performance, other entity-specific events and events affecting individual reporting units. If after assessing the totality of events or circumstances for each reporting unit, we determine that it is more likely than not that the carrying value exceeds its fair value, then we would perform an impairment test for that reporting unit.
We recognize an impairment of goodwill if the carrying value of a reporting unit that contains goodwill exceeds its estimated fair value. In order to estimate the fair value of the reporting unit, including goodwill, management must make certain estimates and assumptions that affect the total fair value of the reporting unit including, among other things, an assessment of market conditions, projected cash flows, discount rates and growth rates. Management’s estimates of projected cash flows related to the reporting unit include, but are not limited to, future earnings of the reporting unit, assumptions about the use or disposition of assets included in the reporting unit, estimated remaining lives of those assets, and future expenditures necessary to maintain the assets’ existing service potential.
We calculate the estimated fair value of each of our reporting units using a weighted-average of values calculated using an income approach and a market approach. The income approach involves estimating the fair value of each reporting unit by discounting its estimated future cash flows using a discount rate, consistent with a market participant’s assumption. The market approach bases the fair value measurement on information obtained from observed stock prices of public companies and recent merger and acquisition transaction data of comparable entities.
As of December 31, 2020 and 2019, our reporting units to which goodwill has been allocated consisted of the following:• crude oil pipelines;• refined product pipelines; and• terminals, excluding our Point Tupper facility and our refinery crude storage tanks.
In March 2020, the COVID-19 pandemic and actions taken by OPEC+ resulted in severe disruptions in the capital and commodities markets, which led to significant decline in our unit price. As a result, our equity market capitalization fell significantly. The decline in crude oil prices and demand for petroleum products also led to a decline in expected earnings from some of our goodwill reporting units. These factors and others related to COVID-19 and OPEC+ caused us to conclude there were triggering events that occurred in March that required us to perform a goodwill impairment test as of March 31, 2020, and we recognized goodwill impairment charges of $225.0 million associated with our crude oil pipelines. Please refer to Note 11 of the Notes to Consolidated Financial Statements in Item 8. “Financial Statements and Supplementary Data,” for discussion of the impairment charges.
We elected to bypass the qualitative assessment for all reporting units as of October 1, 2020 and performed a quantitative assessment. Although we determined that no impairment charges resulted from our October 1, 2020 impairment assessment, the fair value of the crude oil pipelines reporting unit exceeded its carrying value by approximately 4%. The goodwill associated with the crude oil pipelines reporting unit totaled $308.6 million as of December 31, 2020. Our estimate of the fair value of the crude oil pipelines reporting unit is sensitive to typical valuation assumptions, particularly our estimates for the weighted-average cost of capital (WACC) used for the income approach and the guideline public company (GPC) multiple used for the market approach. Considering that the carrying value of the reporting unit was written down to its fair value with the first quarter of 2020 impairment charge discussed above, changes to the WACC or GPC multiple used in our estimate could cause the fair value to be less than the carrying value of the crude oil pipelines reporting unit, resulting in an impairment. The fair values of the refined product pipelines and terminals reporting units substantially exceed their carrying values.
Management’s estimates are based on numerous assumptions about future operations and market conditions, which we believe to be reasonable but are inherently uncertain. The uncertainties underlying our assumptions and estimates could differ significantly from actual results, including with respect to the duration and severity of the COVID-19 pandemic, the extent of travel restrictions, business closures and other efforts to control the spread of COVID-19 and the impact of actions by OPEC+, which could lead to a different determination of the fair value of our assets. If we determined goodwill was impaired, the amount of impairment could be material to our results of operations. We will continue to monitor the business and consider additional interim analysis of goodwill as appropriate.
Table of Contents
32
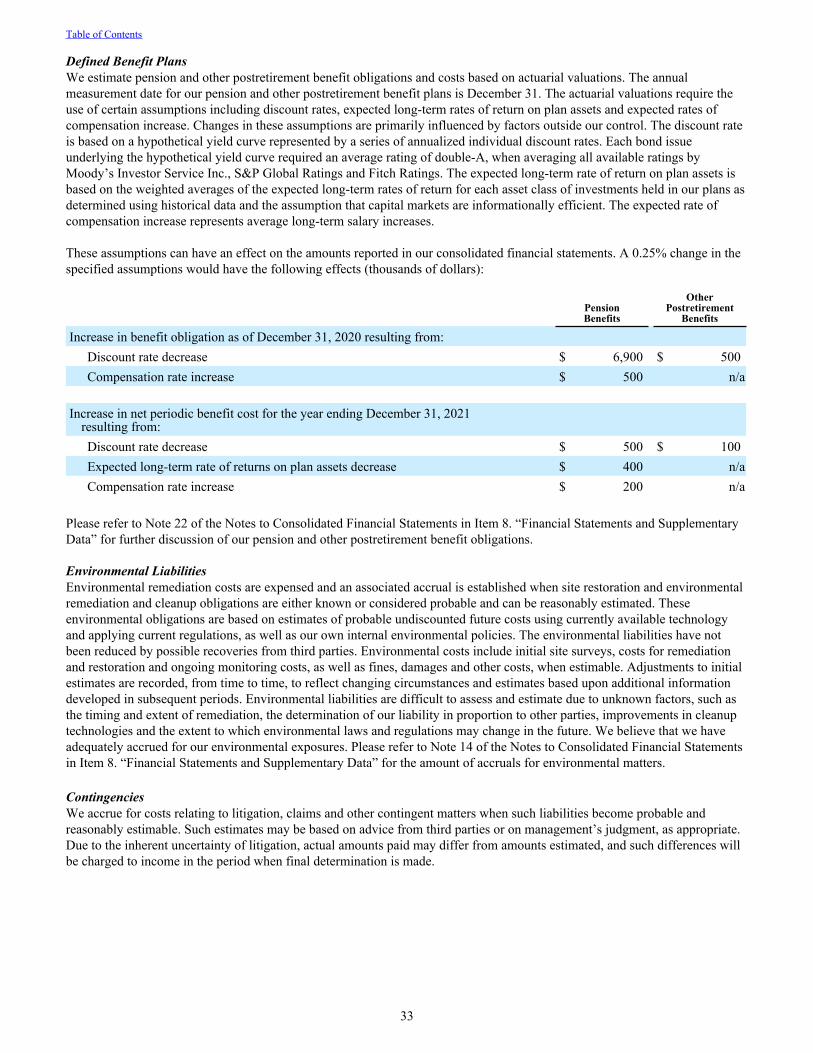
Defined Benefit PlansWe estimate pension and other postretirement benefit obligations and costs based on actuarial valuations. The annual measurement date for our pension and other postretirement benefit plans is December 31. The actuarial valuations require the use of certain assumptions including discount rates, expected long-term rates of return on plan assets and expected rates of compensation increase. Changes in these assumptions are primarily influenced by factors outside our control. The discount rate is based on a hypothetical yield curve represented by a series of annualized individual discount rates. Each bond issue underlying the hypothetical yield curve required an average rating of double-A, when averaging all available ratings by Moody’s Investor Service Inc., S&P Global Ratings and Fitch Ratings. The expected long-term rate of return on plan assets is based on the weighted averages of the expected long-term rates of return for each asset class of investments held in our plans as determined using historical data and the assumption that capital markets are informationally efficient. The expected rate of compensation increase represents average long-term salary increases.
These assumptions can have an effect on the amounts reported in our consolidated financial statements. A 0.25% change in the specified assumptions would have the following effects (thousands of dollars):
PensionBenefits
OtherPostretirement
Benefits
Increase in benefit obligation as of December 31, 2020 resulting from:Discount rate decrease $ 6,900 $ 500 Compensation rate increase $ 500 n/a
Increase in net periodic benefit cost for the year ending December 31, 2021 resulting from:Discount rate decrease $ 500 $ 100 Expected long-term rate of returns on plan assets decrease $ 400 n/aCompensation rate increase $ 200 n/a
Please refer to Note 22 of the Notes to Consolidated Financial Statements in Item 8. “Financial Statements and Supplementary Data” for further discussion of our pension and other postretirement benefit obligations.
Environmental LiabilitiesEnvironmental remediation costs are expensed and an associated accrual is established when site restoration and environmental remediation and cleanup obligations are either known or considered probable and can be reasonably estimated. These environmental obligations are based on estimates of probable undiscounted future costs using currently available technology and applying current regulations, as well as our own internal environmental policies. The environmental liabilities have not been reduced by possible recoveries from third parties. Environmental costs include initial site surveys, costs for remediation and restoration and ongoing monitoring costs, as well as fines, damages and other costs, when estimable. Adjustments to initial estimates are recorded, from time to time, to reflect changing circumstances and estimates based upon additional information developed in subsequent periods. Environmental liabilities are difficult to assess and estimate due to unknown factors, such as the timing and extent of remediation, the determination of our liability in proportion to other parties, improvements in cleanup technologies and the extent to which environmental laws and regulations may change in the future. We believe that we have adequately accrued for our environmental exposures. Please refer to Note 14 of the Notes to Consolidated Financial Statements in Item 8. “Financial Statements and Supplementary Data” for the amount of accruals for environmental matters.
ContingenciesWe accrue for costs relating to litigation, claims and other contingent matters when such liabilities become probable and reasonably estimable. Such estimates may be based on advice from third parties or on management’s judgment, as appropriate. Due to the inherent uncertainty of litigation, actual amounts paid may differ from amounts estimated, and such differences will be charged to income in the period when final determination is made.
Table of Contents
33
NEW ACCOUNTING PRONOUNCEMENTS
Management’s Discussion and Analysis, Selected Financial Data, and Supplementary Financial Information In November 2020, the Securities and Exchange Commission (SEC) issued final rules to modernize, simplify, and enhance certain financial disclosure requirements in Regulation S-K. Among other changes, the amended guidance eliminates the requirements to present five-year selected financial data, the two-year quarterly financial data table, and the contractual obligations table in the Form 10-K, while it adds requirements to disclose material cash requirements and additional information regarding critical accounting estimates. The rule changes became effective on February 10, 2021, and we are required to apply the amended rules in our filings for the fiscal year ending on December 31, 2021. Early application by amended Regulation S-K item is permitted any time after the effective date. We elected to apply provisions related to selected financial data and quarterly financial information in our Annual Report on Form 10-K for the year ended December 31, 2020 and expect to apply the remaining provisions in our Annual Report on Form 10-K for the year ended December 31, 2021.
Please refer to Note 3 of the Notes to Consolidated Financial Statements in Item 8. “Financial Statements and Supplementary Data” for a further discussion of new accounting pronouncements.
AVAILABLE INFORMATION
Our internet website address is http://www.nustarenergy.com. Information contained on our website is not part of this report. Our annual reports on Form 10-K, quarterly reports on Form 10-Q and current reports on Form 8-K, and any amendments thereto, filed with (or furnished to) the SEC are available on our website, free of charge, as soon as reasonably practicable after we file or furnish such material (select the “Investors” link, then the “SEC Filings” link). We also post our corporate governance guidelines, code of business conduct and ethics, code of ethics for senior financial officers and the charters of our board’s committees on our website free of charge (select the “Investors” link, then the “Corporate Governance” link).
Our governance documents are available in print to any unitholder that makes a written request to Corporate Secretary, NuStar Energy L.P., 19003 IH-10 West, San Antonio, Texas 78257 or [email protected].
ITEM 1A. RISK FACTORS
RISKS RELATED TO OUR BUSINESS
The ongoing effects of the COVID-19 pandemic, the actions taken in response thereto and developments in the global oil markets may continue to adversely affect our business, financial condition, results of operations or cash flows.The COVID-19 pandemic has had a severe negative impact on global economic activity, as government authorities instituted stay-home orders, travel restrictions, business closures and other measures to reduce the spread of the virus. The scale of this decrease in economic activity significantly reduced demand for petroleum products. In March 2020, the negative economic impact of the COVID-19 pandemic and demand deterioration was exacerbated by disputes among the Organization of Petroleum Exporting Countries and other oil-producing nations (OPEC+) regarding their agreed production rates that contributed to a significant over-supply in crude oil, resulting in a sharp decline in, and increase in the volatility of, crude oil prices.
As further described in the risk factors below, prolonged periods of reduced demand or low prices for crude oil and refined products can lead to a significant reduction in the demand for and utilization of our assets, which could have a material adverse impact on our results of operations, cash flows and our ability to make distributions to our unitholders and service our debt. The COVID-19 pandemic and other public health crises may also have the effect of heightening many of the other risks described in those risk factors.
Beginning in March 2020, the COVID-19 pandemic lowered consumer gasoline demand, which in turn depressed utilization rates at refineries across the country, including those our assets serve. Additionally, lower crude oil prices from over-supply across global oil markets undermined drilling and production in U.S. shale plays, including the Permian and Eagle Ford Basins, where our Permian and Corpus Christi Crude Systems are located. Together, reduced demand for refined products, lower refinery utilization and lower drilling activity resulted in reduced demand for and utilization of our pipeline assets. The continuing impact of the COVID-19 pandemic and actions by OPEC+ have depressed global economic activity, which has had a negative impact on our results of operations, particularly during the second quarter of 2020. While we began to see some initial signs of recovery and rebound in June, which improved our results of operations for the remainder of 2020, ongoing uncertainty surrounding the pandemic, as well as uncertainty surrounding future production decisions by OPEC+, continues to cause volatility and could have a significant impact on our estimates and assumptions in 2021 and beyond. The extent of the impacts on our business, financial condition, results of operations and cash flows will depend on future developments that are highly uncertain and cannot be accurately predicted, such as: the duration and severity of the COVID-19 pandemic or other
Table of Contents
34
public health crises; the availability of personnel, equipment, services and timely permitting approvals essential to our operations; the depth and duration of the economic downturn, the decline in demand for petroleum products and other economic effects of the pandemic; the extent and impacts of travel restrictions, business closures and other efforts to reduce the spread of COVID-19 or other public health crises in impacted areas; and future actions by OPEC+.
We may not be able to generate sufficient cash from operations to enable us to pay quarterly distributions to our unitholders.The amount of cash that we can distribute to our unitholders each quarter principally depends upon the amount of cash we generate from our operations, based on, among other things:
• prevailing economic conditions;• demand for and supply of crude oil, refined products and anhydrous ammonia;• volumes transported in our pipelines;• volumes stored in our terminals and storage facilities;• tariff and/or contractually determined rates and fees we charge and the revenue we realize for our services;• domestic and foreign governmental laws, regulations, sanctions, embargoes and taxes; • the effect of worldwide energy conservation measures on demand for and consumption of crude oil and refined
products;• our operating costs;• the costs to comply with environmental, health, safety and security laws and regulations;• weather conditions; and• the results of our marketing, trading and hedging activities, which fluctuate depending upon the relationship between
refined product prices and prices of crude oil and other feedstocks.
Furthermore, the amount of cash that we will have available for distribution depends on a number of other factors, including:• our debt service requirements and restrictions on distributions contained in our current or future financing agreements;• our capital expenditures;• fluctuations in our working capital needs;• adjustments in cash reserves made by our board of directors, in its discretion; • availability of and access to equity capital and debt markets; and• the sources of cash used to fund our acquisitions, if any.
Moreover, the total amount of cash that we have available for distribution to common unitholders is further reduced by the required distributions with respect to our preferred units.
It is possible that one or more of the factors listed above, which may be further impacted by the ongoing COVID-19 pandemic or other public health crises as well as the actions of oil-producing nations, may reduce our available cash to such an extent that we could be rendered unable to pay distributions at the current level or at all in a given quarter. Cash distributions to our unitholders depend primarily upon our cash flows, including cash flows from reserves and working capital borrowings, and not solely on profitability, which is affected by non-cash items; in other words, we may be able to make cash distributions during periods in which we record net losses and may not be able to make cash distributions during periods in which we record net income.
An extended period of reduced demand for or supply of crude oil and refined products could have an adverse impact on our results of operations, cash flows and ability to make distributions to our unitholders.Our business is ultimately dependent upon the long-term demand for and supply of the crude oil and refined products we transport in our pipelines and store in our terminals. Market prices for crude oil and refined products, including fuel oil, are subject to wide fluctuation in response to changes in global and regional supply that are beyond our control. Increases in the price of crude oil may result in a lower demand for refined products that we transport, store and market, including fuel oil, while sustained low prices may lead to reduced production in the markets served by our pipelines and storage terminals.
Any sustained decrease in demand for refined products in the markets our pipelines and terminals serve that extends beyond the expiration of our existing throughput and deficiency agreements could result in a significant reduction in throughputs in our pipelines and storage in our terminals, which would reduce our cash flows and impair our ability to make distributions to our unitholders. Factors that tend to decrease market demand include:
• a recession or other adverse economic conditions that result in lower spending by consumers on gasoline, diesel and travel;
• events that negatively impact global economic activity, travel and demand generally, such as has occurred in response to the COVID-19 pandemic;
• higher fuel taxes or other governmental or regulatory actions that increase, directly or indirectly, the cost of gasoline;• an increase in aggregate automotive engine fuel economy; • new government and regulatory actions or court decisions requiring the phase out or reduced use of gasoline-fueled
vehicles;
Table of Contents
35
• the increased use of and public demand for use of alternative fuel sources;• an increase in the market price of crude oil that increases refined product prices, which may reduce demand for refined
products and drive demand for alternative products; and• a decrease in corn acres planted for ethanol, which may reduce demand for anhydrous ammonia.
Similarly, any sustained decrease in the supply of crude oil and refined products in markets we serve could result in a significant reduction in throughputs in our pipelines and storage in our terminals, which would reduce our cash flows and undermine our ability to make distributions to our unitholders. Factors that tend to decrease supply and, by extension, utilization of our pipelines and terminals include:
• prolonged periods of low prices for crude oil and refined products that result in decreased exploration and development activity and reduced production in markets served by our pipelines and storage terminals;
• macroeconomic forces affecting, or actions taken by, oil and gas producing nations that impact supply of and prices for crude oil and refined products, such as the decline in prices resulting, in part, from disputes over production levels by OPEC+;
• a lack of drilling services or equipment available to producers to accommodate production needs;• changes in laws, regulations, sanctions or taxation that directly or indirectly delay supply or production or increase the
cost of production of refined products; and• political unrest or hostilities, activist interference and the resulting governmental response thereto.
If we were unable to retain or replace current customers and existing contracts to maintain utilization of our pipeline and storage assets at current or more favorable rates, our revenue and cash flows could be reduced to levels that could adversely affect our ability to make quarterly distributions to our unitholders.Our revenue and cash flows are generated primarily from our customers’ payments of fees under throughput contracts and storage agreements. Failure to renew or enter into new contracts or our customers’ material reduction of utilization under existing contracts results from many factors, including:
• sustained low crude oil prices; • a material decrease in the supply or price of crude oil;• a material decrease in demand for refined products in the markets served by our pipelines and terminals;• political, social or economic instability in the U.S. or another country that has a detrimental impact on customers based
there and our ability to conduct our operations;• competition for customers from companies with comparable assets and capabilities;• scheduled turnarounds or unscheduled maintenance at refineries we serve;• operational problems or catastrophic events affecting our assets or customers we serve;• environmental or regulatory proceedings or other litigation that compel the cessation of all or a portion of the
operations of our assets or those of the customers we serve;• increasingly stringent environmental, health, safety and security regulations; • a decision by our current customers to redirect refined products transported in our pipelines to markets not served by
our pipelines or to transport crude oil or refined products by means other than our pipelines; or• a decision by our current customers to shut down, limit operations of or sell one or more of the refineries we serve to a
purchaser that elects not to use our pipelines and terminals.
Depending on conditions in the credit and capital markets at a given time, we may not be able to obtain funding on acceptable terms or at all, which may hinder or prevent us from meeting our future capital needs, satisfying our debt obligations, or making quarterly distributions to our unitholders.From time to time, the domestic and global financial markets and economic conditions are volatile and disrupted by a variety of factors, including low consumer confidence, high unemployment, geoeconomic and geopolitical issues, weak economic conditions, uncertainty in the market and negative sentiment toward energy-related companies generally, or master limited partnerships specifically. For example, due to the ongoing COVID-19 pandemic and actions by OPEC+, global financial markets have experienced significant volatility and steep declines, which volatility and downturn are expected to continue during the pendency of the pandemic. Credit markets and the debt and equity capital markets have been distressed and the uncertainty surrounding the future of the global credit markets has resulted in reduced access to credit worldwide, particularly for the energy industry, which has been detrimentally affected by reduced crude oil prices. In addition, there are fewer investors and lenders for master limited partnership debt and equity capital market issuances than there are for corporate issuances. As a result, the cost of raising capital in the debt and equity capital markets has increased, the availability of funds from these markets has diminished and lenders may refuse to refinance existing debt on similar terms or at all and reduce, or in some cases cease to provide, funding to borrowers.
In general, if we do not generate sufficient cash from operations to finance our expenditures and funding from external sources is not available when needed, or is available only on unfavorable terms, we may be unable to execute our growth strategy, complete future acquisitions or construction projects or take advantage of other business opportunities and may be required to
Table of Contents
36
reduce investments or capital expenditures or sell assets, which could have a material adverse effect on our revenues and results of operations, and we may not be able to satisfy our debt obligations or pay distributions to our unitholders.
Our future financial and operating flexibility may be adversely affected by our significant leverage, any future downgrades of our credit ratings, restrictions in our debt agreements and conditions in the financial markets.As of December 31, 2020, our consolidated debt was $3.6 billion, and we have the ability to incur more debt. In addition to any potential direct financial impact of our debt, it is possible that any material increase to our debt or other adverse financial factors may be viewed negatively by credit rating agencies, which could result in ratings downgrades, increased costs or inability for us to access the capital markets and an increase in interest rates on amounts borrowed under our revolving credit agreement.
Our revolving credit agreement contains restrictive covenants, such as limitations on indebtedness, liens, mergers, asset transfers and certain investing activities. In addition, that agreement generally limits us to a consolidated debt coverage ratio (consolidated debt to consolidated EBITDA, each as defined in the agreement) not to exceed 5.00-to-1.00 and requires us to maintain a minimum consolidated interest coverage ratio (as defined in the agreement) of at least 1.75-to-1.00. Failure to comply with any of the restrictive covenants or the maximum consolidated debt coverage ratio or minimum consolidated interest coverage ratio requirements would constitute an event of default and could result in acceleration of our obligations under our revolving credit agreement and possibly other agreements. Our accounts receivable securitization program, senior notes and other debt obligations also contain various customary affirmative and negative covenants and default, indemnification and termination provisions, and provide for acceleration of amounts owed upon the occurrence of certain specified events. Future financing agreements we may enter into may contain similar or more restrictive covenants and ratio requirements than those we have negotiated for our current financing agreements.
Our debt service obligations, restrictive covenants, ratio requirements and maturities may adversely affect our ability to finance future operations, pursue acquisitions, fund our capital needs and pay cash distributions to our unitholders. In addition, this leverage may make our results of operations more susceptible to adverse economic or operating conditions, limit our flexibility in planning for, or reacting to, changes in our business and industry and place us at a competitive disadvantage compared to competitors with proportionately less indebtedness. For example, during an event of default under certain of our debt agreements, we would be prohibited from making cash distributions to our unitholders.
Our ability to service our debt will depend on, among other things, our future financial and operating performance and our ability to access the capital markets, which will be affected by prevailing economic conditions and financial, business, regulatory and other factors, some of which are beyond our control. If our operating results are not sufficient to service our indebtedness and we are unable to access the capital markets or otherwise refinance our indebtedness, we may be required to reduce our distributions, reduce or delay our business activities, investments or capital expenditures, sell assets or issue additional equity, which could materially and adversely affect our financial condition, results of operations, cash flows and ability to make distributions to unitholders, as well as the trading price of our units.
Changes in interest rates could adversely affect our business and the trading price of our units.We have significant exposure to increases in interest rates through variable rate provisions in certain of our debt instruments and our Series A, B and C preferred units. At December 31, 2020, we had approximately $3.6 billion of consolidated debt, of which $3.1 billion was at fixed interest rates and $0.5 billion was at variable interest rates. In addition, the distribution rates on our Series A, B and C preferred units convert from fixed rates to floating rates, beginning in December 2021, June 2022 and December 2022, respectively. Our results of operations, cash flows and financial position could be materially adversely affected by significant changes in interest rates.
Furthermore, although we have positioned ourselves to self-fund all of our expenses, distribution requirements and capital expenditures for 2021 using internally generated cash flows, we have historically funded our strategic capital expenditures and any acquisitions primarily from borrowings under our revolving credit agreement, funds raised through debt or equity offerings and/or sales of non-strategic assets. An increase in interest rates may also have a negative impact on our ability to access the capital markets at economically attractive rates.
Moreover, the market price of master limited partnership units, like other yield-oriented securities, may be affected by, among other factors, implied distribution yield. The distribution yield is often used by investors to compare and rank yield-oriented securities for investment decision-making purposes. Therefore, increases or decreases in interest rates may affect whether or not certain investors decide to invest in master limited partnership units, including ours, and a rising interest rate environment could have an adverse impact on our unit price and impair our ability to issue additional equity or incur debt to fund growth or for other purposes, including distributions.
Table of Contents
37
Our inability to develop, fund and execute growth projects and acquire new assets could limit our ability to maintain and grow quarterly distributions to our unitholders.Our ability to maintain and grow our distributions to unitholders depends on the growth of our existing businesses and strategic acquisitions. Decisions regarding new growth projects rely on numerous estimates, including, among other factors, the ability to secure a commitment from a customer that sufficiently exceeds our cost of capital to justify the project cost, predictions of future demand for our services, future supply shifts, crude oil production estimates, commodity price environments, economic conditions, both domestic and foreign, and potential changes in the financial condition of our customers. Our predictions of such factors could cause us to forego certain investments and to lose opportunities to competitors who make investments based on different predictions or have greater access to financial resources. In addition, volatile market conditions have caused us to reevaluate the estimates underlying certain planned projects and delay the timing of certain projects until conditions improve. If we are unable to develop and execute expansion projects, implement business development opportunities, acquire new assets and finance such activities on economically acceptable terms, our future growth will be limited, which could have a significant adverse impact on our results of operations and cash flows and, accordingly, result in reduced distributions over time.
Failure to complete capital projects as planned adversely affects our financial condition, results of operations and cash flows.While we incur financing costs during the planning and construction phases of our projects, a project does not generate expected operating cash flows until it is at least substantially completed, if at all. Additionally, our forecasted operating results from capital spending projects are based on future market fundamentals that are not within our control, including changes in general economic conditions, the supply and demand of crude oil and refined products, availability to our customers of attractively priced alternative solutions for storage, transportation or supplies of crude oil and refined products and overall customer demand. As a result of these uncertainties, the anticipated benefits associated with our capital projects may not be achieved or could be delayed. In turn, this could have a negative impact on our results of operations and cash flow and our ability to make cash distributions to our unitholders.
Although we evaluate and monitor each capital spending project and try to anticipate difficulties that may arise, delays or cost increases related to capital spending programs involving construction of new facilities (or improvements and repairs to our existing facilities) adversely affect our ability to achieve forecasted operating results. Delays or cost increases arise as a result of many factors that are beyond our control, including:
• adverse economic conditions;• market-related increases in a project’s debt or equity financing costs; • severe adverse weather conditions, natural disasters or other events (such as hurricanes, equipment malfunctions,
explosions, fires, spills or public health events) affecting our facilities or employees, or those of vendors and suppliers;• non-performance or delay by, or disputes with, counterparties, vendors, suppliers, contractors or sub-contractors
involved with a project; • denial or delay in issuing requisite regulatory approvals and/or permits;• delay or increased costs to obtain right-of-way or other property rights;• delays or failures by third parties to complete related projects;• protests and other activist interference with planned or in-process projects;• unplanned increases in the cost of construction materials or labor;• disruptions in transportation of modular components and/or construction materials; or• shortages of sufficiently skilled labor, or labor disagreements resulting in unplanned work stoppages.
Competing midstream service providers, including certain major energy and chemical companies, possess, or have greater financial resources to acquire, assets better suited to meet customer demand, which could undermine our ability to obtain and retain customers or reduce utilization of our assets, which could reduce our revenues and cash flows, thereby reducing our ability to make our quarterly distributions to unitholders.We face competition in all aspects of our business and can give no assurances that we will be able to compete effectively against our competitors. Our competitors include major energy and chemical companies, some of which have greater financial resources, more pipelines or storage terminals, greater capacity pipelines or storage terminals and greater access to supply than we do. Certain of our competitors also have advantages in competing for acquisitions or other new business opportunities because of their financial resources and synergies in operations. As a consequence of increased competition in the industry or market conditions, some customers are and others may be in the future reluctant to renew or enter into long-term contracts or contracts that provide for minimum throughput amounts. Our inability to renew or replace a significant portion of our current contracts as they expire, to enter into contracts for newly acquired, constructed or expanded assets and to respond appropriately to changing market conditions would have a negative effect on our revenue, cash flows and ability to make quarterly distributions to our unitholders.
Table of Contents
38
Our operations are subject to operational hazards and interruptions, and we cannot insure against or predict all potential losses and liabilities that might result therefrom. Our operations and those of our customers and suppliers are subject to operational hazards and unforeseen interruptions due to natural disasters, adverse weather conditions (such as hurricanes, tornadoes, storms, floods and earthquakes), accidents, fires, explosions, hazardous materials releases, mechanical failures, cyberattacks, acts of terrorism and other events beyond our control. These events might result in a loss of life or equipment, injury or extensive property or environmental damage, as well as an interruption in our operations or those of our customers or suppliers. In the event any of our facilities, or those of our customers or suppliers, suffer significant damage or are forced to shut down for a significant period of time, it may have a material adverse effect on our earnings, our other results of operations and our financial condition as a whole. Additionally, our pipelines, terminals and storage assets are generally long-lived assets, and some have been in service for many years. The age and condition of our assets could result in increased maintenance or repair expenditures in the future.
As a result of market conditions, losses experienced by us and other companies, premiums and deductibles for our insurance policies have increased and could continue to increase substantially; therefore, we may not be able to maintain or obtain insurance of the type and amount we desire at reasonable rates. In addition, certain insurance coverage is subject to broad exclusions, and may become subject to further exclusions, become unavailable altogether or become available only for reduced amounts of coverage and at higher rates. We are not fully insured against all hazards and risks to our business, and the insurance we carry requires us to meet deductibles before we collect for losses we sustain. If we incur a significant liability for which we are uninsured or not fully insured, or if there is a significant delay in payment of a major insurance claim, such a liability could have a material adverse effect on our financial position.
We are exposed to counterparty credit risk. Nonpayment and nonperformance by our customers, vendors or other counterparties reduces our revenues and increases our expenses, and any significant level of nonpayment and nonperformance could have a negative impact on our ability to conduct our business, operating results, cash flows and our ability to service our debt obligations and make distributions to our unitholders.Weak economic conditions and widespread financial stress has reduced and may continue to reduce the liquidity of our customers, vendors or other counterparties, making it more difficult for them to meet their obligations to us. We are therefore subject to risks of loss resulting from nonpayment or nonperformance by our customers to whom we extend credit. Financial problems encountered by our customers limit our ability to collect amounts owed to us, or to enforce the performance of obligations owed to us under contractual arrangements. In addition, nonperformance by vendors or their subcontractors, who have committed to provide us with critical products or services, increases our costs and could result in significant disruptions or interfere with our ability to successfully conduct our business. Although we attempt to mitigate our risk through warehouseman’s liens and other security protections, we are not always able to enforce such liens and protections due to competing claims from other parties. Any substantial increase in the nonpayment and nonperformance by our customers, vendors or other counterparties or our inability to enforce our warehouseman’s liens and other security protections could have a material adverse effect on our results of operations, cash flows and ability to make distributions to our unitholders.
We could be subject to damages or lose customers due to failure to maintain certain quality specifications or other claims related to the operation of our assets and the services we provide to our customers.Certain of the products we store and transport are produced to precise customer specifications. If the quality and purity of the products we receive are not maintained or a product fails to perform in a manner consistent with the quality specifications required by our customers, customers have sought, and could in the future seek, replacement of the product or damages for costs incurred as a result of the product failing to perform as guaranteed. We also have faced, and could in the future face, other claims by our customers if our assets do not operate as expected by our customers or our services otherwise do not meet our customers’ expectations. Successful claims or a series of claims against us result in unforeseen expenditures and could result in the loss of one or more customers.
Cybersecurity breaches and other disruptions could compromise our information and operations, and expose us to liability, which would cause our business and reputation to suffer and increase our costs and could adversely affect our ability to make distributions to our unitholders.We rely on our information technology systems and our operational technology systems to process, transmit and store information, such as employee, customer and vendor data, and to conduct almost all aspects of our business, including safely operating our pipelines and storage facilities, recording and reporting commercial and financial transactions and receiving and making payments. We also rely on systems hosted by third parties, with respect to which we have limited visibility and control. The security of these networks and systems is critical to our operations and business strategy.
Despite our security measures, we could suffer a serious cybersecurity incident due to attacks from a variety of external threat actors, internal employee error or malfeasance, or even cybersecurity incidents suffered by our service providers or other vendors or customers. In addition, in connection with COVID-19 precautions, a large number of our employees and those of our service providers, vendors and customers have been working, and may continue to work, from home, where their cybersecurity protections may be less robust and our cybersecurity procedures and safeguards may be less effective. Moreover,
Table of Contents
39
certain cybersecurity incidents, such as surveillance, may remain undetected for an extended period of time. A significant failure, compromise, breach or interruption in our systems could result in a disruption of our operations, physical damage to our assets or the environment, physical harm to employees or others, safety incidents, damage to our reputation, loss of customers or revenues, increased costs for remedial actions and potential litigation or regulatory fines. If any such failure, interruption or similar event results in the loss or improper disclosure of information maintained in our systems and networks or those of our vendors, including personnel, customer and vendor information, we could also be subject to liability under relevant contractual obligations and laws and regulations protecting personal data and privacy. Our financial results could also be adversely affected if our systems are breached or an employee, vendor or customer causes our systems to fail, either as a result of inadvertent error or deliberate tampering with or manipulation of our systems.
The number of cyberattacks generally, by both state-sponsored and criminal organizations, and the resulting risks associated with such attacks continue to increase. In addition, evolving laws and regulations governing data privacy and protection pose increasingly complex compliance challenges. Although we believe that we have robust cybersecurity procedures and other safeguards in place, we cannot guarantee their effectiveness, and a significant failure, compromise, breach or interruption in our systems or those of our vendors could have a material effect on our operations and those of our customers and vendors. As threats continue to evolve and cybersecurity and data protection laws and regulations continue to develop, we spend and expect to continue spending additional resources to continue to enhance our cybersecurity, data protection, business continuity and incident response measures and to investigate and remediate any vulnerabilities to, or consequences of, cyber incidents.
Climate change and fuels legislation and other regulatory initiatives may decrease demand for the products we store, transport and sell, increase our operating costs or reduce our ability to expand our facilities.In response to findings that emissions of certain greenhouse gases such as carbon dioxide and methane present a danger to public health and the environment, including contributing to warming of the Earth’s atmosphere, various federal, state and local legislative and regulatory proposals have been introduced to regulate the emission of greenhouse gases. In addition, there have been international efforts seeking legally binding reductions in emissions of greenhouse gases. To the extent the United States and other political bodies enact additional climate change laws or regulations that increase costs, reduce demand or otherwise impede our operations, it could, directly or indirectly, have an adverse direct or indirect effect on our business. Specifically, certain changes have and future changes could restrict our ability to expand our operations and also increase our costs to operate and maintain our existing facilities by requiring that we measure and report our emissions, install new emission controls on our facilities, acquire allowances to authorize our emissions, pay taxes related to our emissions or administer and manage an emissions program, among other things.
In addition, certain of our blending operations subject us to potential requirements to purchase renewable fuels credits. Even though we attempt to mitigate such lost revenues or increased costs through the contracts we sign with our customers, we sometimes are not able to recover those revenues or mitigate the increased costs, and any such recovery depends on events beyond our control, including the outcome of future rate proceedings before the Federal Energy Regulatory Commission (FERC) or other regulators and the provisions of any final legislation or regulations. Reductions in our revenues or increases in our expenses as a result of climate change legislation or other regulatory initiatives could have adverse effects on our business, financial position, results of operations and prospects.
Finally, increasing concentrations of greenhouse gases in the Earth’s atmosphere may produce climate changes that have significant physical effects, such as increased frequency and severity of storms, floods and other climatic events. Such events have had and may in the future have an adverse effect on our assets and operations, especially those located in coastal regions.
Public sentiment towards climate change, fossil fuels and sustainability could adversely affect our business, operations and ability to attract capital.Our business plans are based upon the assumption that public sentiment and the regulatory environment will continue to enable the future development, transportation and use of carbon-based fuels. Negative public perception of the industry in which we operate and the influence of environmental activists and initiatives aimed at limiting climate change could interfere with our business activities, operations and access to capital. Activists concerned about the potential effects of climate change have directed their attention towards sources of funding for fossil fuel energy companies, which has resulted in certain financial institutions, funds and other sources of capital restricting or eliminating their investment in energy-related activities. Such negative sentiment regarding the fossil fuel industry could influence consumer preference and decrease demand for the products we store and result in increased regulatory scrutiny, which could then result in additional laws, regulations, guidelines and enforcement interpretations, at the federal, state or local level. These actions may cause operational delays or restrictions, increased operating costs, additional regulatory burdens and increased risk of litigation.
Members of the investment community are also increasing their focus on sustainability practices, including practices related to greenhouse gas emissions and climate change, in the energy industry. As a result, we and the energy industry generally face increasing pressure regarding sustainability disclosures and practices. Additionally, some members of the investment community screen companies such as ours for sustainability performance before investing in our units.
Table of Contents
40
Our operations are subject to federal, state and local laws and regulations, in the U.S. and in the other countries in which we operate, relating to environmental, health, safety and security that require us to make substantial expenditures.Our operations are subject to increasingly stringent international, federal, state and local environmental, health, safety and security laws and regulations. Transporting, storing and distributing hazardous materials, including petroleum products, entails the risk of releasing these products into the environment, potentially causing substantial expenditures for a response action, significant government penalties, liability to government agencies including for damages to natural resources, personal injury or property damages to private parties and significant business interruption. Further, our pipeline facilities are subject to the pipeline integrity and safety regulations of various federal and state regulatory agencies. In recent years, increased regulatory focus on pipeline integrity and safety has resulted in various proposed or adopted regulations. The implementation of these regulations has required, and the adoption of future regulations could require, us to make additional capital expenditures, including to install new or modified safety measures, or to conduct new or more extensive inspection and maintenance programs.
Legislative action and regulatory initiatives have resulted in, and could in the future result in, changes to operating permits, material changes in operations, increased capital expenditures and operating costs, increased costs of the goods we transport and/or decreased demand for products we handle. Future impacts cannot be assessed with certainty at this time. Required expenditures to modify operations or install pollution control equipment or release prevention and containment systems could materially and adversely affect our business, financial condition, results of operations and liquidity if these expenditures, as with all costs, are not ultimately reflected in the tariffs and other fees we receive for our services.
We own or lease a number of properties that were used to transport, store or distribute products for many years before we acquired them; therefore, such properties were operated by third parties whose handling, disposal or release of products and wastes was not under our control. Environmental laws and regulations could impose obligations to conduct assessment or remediation efforts at our facilities, third-party sites where we take wastes for disposal, or where wastes have migrated. Environmental laws and regulations also impose joint and several liability on us for the conduct of third parties or for actions that complied with applicable requirements when taken, regardless of negligence or fault. If we were to incur a significant liability pursuant to environmental, health, safety or security laws or regulations, such a liability could have a material adverse effect on our financial position.
We operate assets outside of the United States, which exposes us to different legal and regulatory requirements and additional risk.A portion of our revenues are generated from our assets located in Canada and northern Mexico. Our operations in both locations are subject to various risks unique to each country in which we operate that could have a material adverse effect on our business, results of operations and financial condition. With respect to any particular country, these risks may include political and economic instability, including: civil unrest; labor strikes; war and other armed conflict; inflation; and currency fluctuations, devaluation and conversion restrictions. Any deterioration of social, political, labor or economic conditions, including the increasing threat of terrorist organizations and drug cartels, in a country or region in which we do business, or affecting a customer with whom we do business, as well as difficulties in staffing and managing foreign operations, may adversely affect our operations or financial results. We are also exposed to the risk of foreign and domestic governmental actions that may: impose additional costs on us; delay permits or otherwise impede our operations; limit or disrupt markets for our operations, restrict payments or limit the movement of funds; impose sanctions on or otherwise restrict our ability to conduct business with certain customers or persons or in certain countries; or result in the deprivation of contract rights. Our operations outside the United States may also be affected by changes in trade protection laws, policies and measures, and other regulatory requirements affecting trade and investment, including the Foreign Corrupt Practices Act and foreign laws prohibiting corrupt payments, as well as travel restrictions and import and export regulations.
We may be unable to obtain or renew permits necessary for our current or proposed operations, which could inhibit our ability to conduct or expand our business.Our facilities operate under a number of federal, state and local permits, licenses and approvals with terms and conditions containing a significant number of prescriptive limits and performance standards in order to operate. These limits and standards require a significant amount of monitoring, recordkeeping and reporting in order to demonstrate compliance with the underlying permit, license or approval. Noncompliance or incomplete documentation of our compliance status may result in the imposition of fines, penalties and injunctive relief. In addition, public protest, political activism and responsive government intervention have recently made it more difficult for some energy companies to acquire the permits required to complete planned infrastructure projects. A decision by a government agency to deny or delay issuing a new or renewed permit, license or approval, or to revoke or substantially modify an existing permit, license or approval, could have a material adverse effect on our ability to continue or expand our operations and on our financial condition, results of operations, cash flows and ability to make distributions to our unitholders.
Table of Contents
41
We could be subject to liabilities from our assets that predate our acquisition of those assets, but that are not covered by indemnification rights we have against the sellers of the assets.We have acquired assets and businesses and we are not always indemnified by the seller for liabilities that precede our ownership. In addition, in some cases, we have indemnified the previous owners and operators of acquired assets or businesses. Some of our assets have been used for many years to transport and store crude oil and refined products, and past releases could require costly future remediation. If a significant release or event occurred in the past, the liability for which was not retained by the seller, or for which indemnification by the seller is not available, it could adversely affect our financial position and results of operations. Conversely, if liabilities arise from assets we have sold, we could incur costs related to those liabilities if the buyer possesses valid indemnification rights against us with respect to those assets.
Our interstate common carrier pipelines are subject to regulation by the FERC, which could have an adverse impact on our ability to recover the full cost of operating our pipelines and the revenue we are able to receive from those operations. The FERC regulates the tariff rates and terms and conditions of service for interstate oil movements on common carrier pipelines. FERC requires that these rates be just and reasonable and that the pipeline not engage in undue discrimination with respect to any shipper. The FERC or shippers may challenge required pipeline tariff filings, including rates and terms and conditions of service. Further, other than for rates set under market-based rate authority, if a new rate is challenged by protest and investigated by the FERC, the FERC may require the pipeline owner to refund amounts collected in excess of the deemed just and reasonable rate. In addition, shippers may challenge by complaint tariff rates and terms and conditions of service even after they take effect, and the FERC may order a carrier to change its rates prospectively to a just and reasonable level. A complaining shipper also may obtain reparations for damages sustained during the two years prior to the date of the complaint.
We are able to use various FERC-authorized rate change methodologies for our interstate pipelines, including indexed rates, cost-of-service rates, market-based rates and negotiated rates. Typically, we adjust our rates annually in accordance with the FERC indexing methodology, which currently allows a pipeline to change its rates within prescribed ceiling levels that are tied to an inflation index. For the five-year period beginning July 1, 2016, which will end on June 30, 2021, the index allows for annual changes in rates equal to the change in the Bureau of Labor’s producer price index for finished goods plus 1.23%. It is possible that the index may result in negative rate adjustments in some years, or that changes in the index might not be large enough to fully reflect actual increases in our costs. The FERC’s indexing methodology is subject to review and revision every five years, with the most recent five-year review occurring in 2020. On December 17, 2020, the FERC established the index level for the five-year period commencing July 1, 2021 at the Bureau of Labor’s producer price index for finished goods plus 0.78%. FERC’s order is subject to appellate or other review, which could result in a further change in the index.
FERC has granted us authority to charge market-based rates on some of our pipelines, which are not subject to cost-of-service or indexing constraints. If we were to lose market-based rate authority, however, we could be required to establish rates on some other basis, such as cost-of-service, which could reduce our revenues and cash flows. Additionally, because competition constrains our rates in various markets, we may from time to time be forced to reduce some of our rates to remain competitive.
We do not own all of the land on which our pipelines and facilities are located, and we are therefore subject to the possibility of increased costs or the inability to retain necessary land use.Like other pipeline and storage logistics services providers, certain of our pipelines, storage terminals and other facilities are located on land owned by third parties and governmental agencies that we have obtained the right to utilize for these purposes through contract (rather than through outright purchase). Many of our rights-of-way or other property rights are perpetual in duration, but others are for a specific period of time. In addition, some of our facilities are located on leased premises. A potential loss of property rights through our inability to renew right-of-way contracts or leases or otherwise retain property rights on acceptable terms or the increased costs to renew such rights could adversely affect our financial condition, results of operations and cash flows available for distribution to our unitholders.
Increases in power prices could adversely affect our operating expenses and our ability to make distributions to our unitholders.Power costs constitute a significant portion of our operating expenses. For the year ended December 31, 2020, our power costs equaled approximately $46.5 million, or 11% of our operating expenses for the year. We use mainly electric power at our pipeline pump stations and terminals, and such electric power is furnished by various utility companies. Requirements for utilities to use less carbon intensive power or to add pollution control devices also could cause our power costs to increase and our cash flows may be adversely affected, which could adversely affect our ability to make distributions to our unitholders.
We may be adversely affected by changes in the method of determining the London Interbank Offering Rate (LIBOR) or the replacement of LIBOR with an alternative reference rate.As of December 31, 2020, we had approximately $0.5 billion of variable-rate indebtedness, which uses LIBOR as a benchmark for establishing the interest rate. In addition, the distribution rates on our Series A, B and C preferred units convert from fixed rates to floating rates based on LIBOR, beginning in December 2021, June 2022 and December 2022, respectively. The U.K. Financial Conduct Authority (the “FCA”) has announced its expectation that the publication of non-U.S. dollar LIBOR rates
Table of Contents
42
will cease after publication on December 31, 2021 and the publication of U.S. dollar LIBOR rates for the most common tenors (overnight and one, three, six and twelve months) will cease after publication on June 30, 2023, instead of on December 31, 2021 as previously expected. The FCA and the LIBOR Administrator have emphasized that, despite any continued publication of U.S. dollar LIBOR rates through June 30, 2023, no new contracts using U.S. dollar LIBOR rates should be entered into after December 31, 2021. Accordingly, the transition away from the widespread use of LIBOR to alternative rates is expected to occur over the next couple of years. Further, there is no assurance that LIBOR, of any particular currency and tenor, will continue to be published until any particular date. The timing of the transition and the consequences of these developments cannot be entirely predicted but could include an increase in the cost of our variable-rate indebtedness, our Series A, B and C preferred units and other commercial arrangements tied to LIBOR. In addition, we have incurred and expect to incur further expenses to renegotiate or clarify the rate provisions in certain of our variable-rate arrangements to affect the transition away from LIBOR-based rates and implement replacement indices, as necessary, but may not be able to do so on terms favorable to us. Furthermore, uncertainty regarding the continued use and reliability of LIBOR as a benchmark rate and uncertainty regarding its replacement could disrupt the financial markets or adversely affect the value of our arrangements tied to LIBOR.
An impairment of goodwill or long-lived assets could reduce our earnings.As of December 31, 2020, we had $0.8 billion of goodwill and $4.6 billion of long-lived assets, including property, plant and equipment, net and intangible assets, net. U.S. generally accepted accounting principles requires us to test both goodwill and long-lived assets for impairment when events or circumstances occur indicating that either goodwill or long-lived assets might be impaired and, in the case of goodwill, at least annually. Charges to impair our goodwill or our long-lived assets reduce earnings and partners’ capital. Any event that causes a reduction in demand for our services could result in a reduction of our estimates of future cash flows and growth rates in our business, which could cause us to record an impairment charge to reduce the value of goodwill. For example, as a result of the effects of the COVID-19 pandemic, combined with actions by OPEC+, which led to a decline in our unit price and market capitalization, we recorded a goodwill impairment charge of $225.0 million associated with our crude oil pipelines in the first quarter of 2020. Similarly, any event or change in circumstances that causes the carrying value of our long-lived assets to no longer be recoverable may require us to record an impairment charge to reduce the value of our long-lived assets.
RISKS INHERENT IN AN INVESTMENT IN US
As a master limited partnership, we do not have the same flexibility as corporations and other types of organizations may have to accumulate cash and prevent illiquidity in the future, which may also limit our growth.Unlike a corporation, our partnership agreement requires us to make quarterly distributions to our common unitholders of all available cash, after taking into account reserves for commitments and contingencies, including growth and other capital expenditures and operating costs, debt service requirements and payments with respect to our preferred units. We are therefore more likely than those organizations to require issuances of additional debt and equity securities to finance our growth plans, meet unforeseen cash requirements and service our debt and other obligations.
In addition, to the extent we issue additional units in connection with any acquisitions or growth capital expenditures, the payment of distributions on those additional units may increase the risk that we will be unable to maintain our current per unit distribution level and the value of our common units and other limited partner interests may decrease in correlation with any reduction in our cash distributions per unit. Accordingly, if we experience a liquidity shortage in the future, we may not be able to issue more equity to recapitalize.
Unitholders have limited voting rights, and our partnership agreement restricts the voting rights of certain unitholders owning 20% or more of any class of our units.Unlike holders of common stock in a corporation, unitholders have only limited voting rights on matters affecting our business and, therefore, limited ability to influence management’s decisions regarding our business. Unitholders’ voting rights are further restricted by a provision in our partnership agreement providing that units held by certain persons that own 20% or more of any class of units then outstanding cannot vote on any matter without the prior approval of our general partner.
We may issue additional equity securities, including equity securities that are senior to our common units, which would dilute our unitholders’ existing ownership interests.Our partnership agreement allows us to issue an unlimited number of additional equity securities without the approval of other unitholders as long as the newly issued equity securities are not senior to, or equally ranked with, our preferred units. With the consent of the holders of a majority of the Series D Preferred Units, we may issue an unlimited number of units that are senior to our common units and equally ranked with our preferred units. However, in certain circumstances, we may be required to obtain the approval of the holders of a majority of each class of our preferred units before we could issue equity securities that are equally ranked with our preferred units.
Table of Contents
43
Our issuance of additional units or other equity interests of equal or senior rank will have the following effects:• our unitholders’ proportionate ownership interest in us will decrease;• the amount of cash available for distribution on each unit may decrease;• the amount of cash available for redemption of, or payment of the liquidation preference on, each preferred unit may
decrease;• the ratio of taxable income to distributions may increase;• the relative voting strength of each previously outstanding unit may be diminished; and• the market price of our common units and preferred units may decline.
Holders of our Series D Preferred Units generally have the same voting rights as holders of our common units and generally vote on an as-converted basis with the holders of our common units as a single class. Although holders of our other preferred units also have voting rights, such rights are limited to certain matters and require that such holders vote as a separate class with all other series of our equally ranked securities that may be issued and possess similar voting rights. As a result, the voting rights of holders of our preferred units may be significantly diluted, and the holders of such future securities of equal rank may be able to control or significantly influence the outcome of any vote with respect to which the holders of our preferred units are entitled to vote. Our partnership agreement contains limited protections for the holders of our preferred units (other than Series D Preferred Units) in the event of a transaction, including a merger, sale, lease or conveyance of all or substantially all of our assets or business, which might adversely affect the holders of our preferred units.
Future issuances and sales of securities that rank equally with our preferred units, or the perception that such issuances and sales could occur, may cause prevailing market prices for our preferred units and our common units to decline and may adversely affect our ability to raise additional capital in the financial markets at times and prices favorable to us. Furthermore, the payment of distributions on any additional units may increase the risk that we will not be able to make distributions at our prior per unit distribution levels. To the extent new units are senior to our common units, their issuance will increase the uncertainty of the payment of distributions on our common units.
If we do not pay distributions on our preferred units in any distribution period, we would be unable to declare or pay distributions on our common units until all unpaid preferred unit distribution obligations have been paid, and our common unitholders are not entitled to receive distributions for such prior period.Our preferred units rank senior to our common units with respect to distribution rights and rights upon liquidation. If we do not pay the required distributions on our preferred units, we will be unable to declare or pay distributions on our common units. Additionally, because distributions to our preferred unitholders are cumulative, we will have to pay all unpaid accumulated preferred distributions before we can declare or pay any distributions to our common unitholders. Also, because distributions to our common unitholders are not cumulative, if we do not pay distributions on our common units with respect to any quarter, our common unitholders will not be entitled to receive distributions covering any prior periods. In addition, if we do not pay the required distributions on our Series D Preferred Units for three consecutive distribution periods, the holders of our Series D Preferred Units have certain additional rights until such distributions are paid, including the right to convert the Series D Preferred Units into common units, the right to appoint one director to our board of directors and the right to approve certain subsequent indebtedness, acquisitions or asset sales. The preferences and privileges of our preferred units could adversely affect the market price for our common units, or could make it more difficult for us to sell our common units in the future.
If a court were to determine that a unitholder action constituted control of our business, the unitholders may lose their legal protection from liability and be required to repay distributions wrongfully distributed to them.Under Delaware law, if a court were to determine that actions of a unitholder constituted participation in the “control” of our business, unitholders would be held liable for our obligations to the same extent as a general partner. In addition, under Delaware law, the general partner generally has unlimited liability for the obligations of the partnership, such as its debts and environmental liabilities, except for those contractual obligations of the partnership that are expressly made without recourse to the general partner.
Furthermore, under Delaware law, we may not make a distribution to our unitholders if the distribution would cause our liabilities to exceed the fair value of our assets. Liabilities to partners on account of their partnership interests and liabilities that are nonrecourse to the partnership are not counted for purposes of determining whether a distribution is permitted. Delaware law provides that, for a period of three years from the date of an impermissible distribution, limited partners who received the distribution and who knew at the time of the distribution that it violated Delaware law will be liable to us for the repayment of the distribution amount. Likewise, upon the winding up of our partnership, in the event that (a) we do not distribute assets in the following order: (1) to creditors in satisfaction of our debts; (2) to partners and former partners in satisfaction of liabilities for distributions owed under our partnership agreement; (3) to partners for the return of their contributions; and finally (4) to the partners in the proportions in which the partners share in distributions and (b) a limited partner knows at the time that the distribution violated Delaware law, then such limited partner will be liable to repay the distribution for a period of three years from the impermissible distribution under applicable Delaware law.
Table of Contents
44
A purchaser of our common or preferred units becomes a limited partner and is liable for the obligations of the transferring limited partner to make contributions to us that are known to such purchaser of common or preferred units at the time it became a limited partner and, for unknown obligations, if the liabilities could be determined from our partnership agreement.
The NYSE does not require a publicly traded limited partnership like us to comply with certain of its corporate governance requirements.We currently list our common units on the NYSE under the symbol “NS” and certain of our preferred units on the NYSE under the symbols “NSprA,” “NSprB” and “NSprC,” respectively. Although our general partner has maintained a majority of independent directors on its board and all members of its board’s audit committee, compensation committee and nominating/governance & conflicts committee are independent directors, because we are a publicly traded limited partnership, the NYSE does not require us to have a majority of independent directors on our general partner’s board of directors or to have a compensation committee or a nominating committee consisting of independent directors. Additionally, any future issuance of additional common or preferred units or other securities, including to affiliates, will not be subject to the NYSE’s shareholder approval rules that apply to a corporation. Accordingly, the NYSE does not mandate the same protections for our unitholders as are required for certain corporations that are subject to all of the NYSE corporate governance requirements.
TAX RISKS TO OUR UNITHOLDERS
If we were treated as a corporation for federal or state income tax purposes or we were otherwise subject to a material amount of entity-level taxation, then our cash available for distribution to unitholders would be substantially reduced.The anticipated after-tax benefit of an investment in our units depends largely on our being treated as a partnership for federal income tax purposes. Despite the fact that we are a limited partnership under Delaware law, we will be treated as a corporation for federal income tax purposes unless we satisfy a “qualifying income” requirement. Based upon our current operations, we believe we satisfy the qualifying income requirement.
If we were treated as a corporation, we would pay federal income tax at the corporate tax rate and would likely pay state and local income tax at varying rates. Distributions to unitholders would generally be taxed again as corporate distributions, and no income, gains, losses, deductions or credits would flow through to unitholders. Because a tax would be imposed upon us as a corporation, our distributable cash flow would be substantially reduced. Additionally, at the state level, several states are evaluating ways to subject partnerships to entity-level taxation through the imposition of state income, franchise and other forms of taxation. If we were treated as a corporation for federal income tax purposes or otherwise subjected to a material amount of entity-level taxation, then our cash available for distribution to unitholders would be substantially reduced and there would be a material reduction in the after-tax return to our unitholders, likely causing a substantial reduction in the value of our units.
The tax treatment of publicly traded partnerships or an investment in our units could be subject to potential legislative, judicial or administrative changes or differing interpretations, possibly applied on a retroactive basis.The present U.S. federal income tax treatment of publicly traded partnerships, including us, or an investment in our units may be modified by administrative, legislative or judicial changes or differing interpretations at any time. From time to time, members of Congress propose and consider such substantive changes to the existing federal income tax laws that affect publicly traded partnerships, including elimination of partnership tax treatment for certain publicly traded partnerships.
Any changes to the federal income tax laws and interpretations thereof may be applied retroactively and could make it more difficult or impossible for us to meet the exception for certain publicly traded partnerships to be treated as partnerships for federal income tax purposes or otherwise adversely affect our business, financial condition or results of operations. We are unable to predict whether any additional changes or other proposals will ultimately be enacted. Any such changes could negatively impact the value of an investment in our units.
If the IRS makes audit adjustments to our income tax returns for tax years beginning after December 31, 2017, it (and some states) may assess and collect any taxes, penalties and interest directly from us. If we bear such payment, our cash available for distribution to our unitholders might be substantially reduced. For tax years beginning after December 31, 2017, if the IRS makes audit adjustments to our income tax returns, it (and some states) may assess and collect any taxes, penalties and interest resulting from such audit adjustment directly from us. To the extent possible under applicable rules, our general partner may pay such amounts directly to the IRS or, if we are eligible, elect to issue a revised Schedule K-1 to each unitholder with respect to an audited and adjusted return. No assurances can be made that such election will be practical, permissible or effective in all circumstances. As a result, our current unitholders may bear some or all of the tax liability resulting from such audit adjustment, even if such unitholders did not own common units in us during the tax year under audit. If, as a result of any such audit adjustment, we make payments of taxes, penalties and interest, our cash available for distribution to our unitholders could be substantially reduced.
Table of Contents
45
Unitholders will be required to pay taxes on their share of our taxable income even if they do not receive cash distributions from us.Unitholders will be required to pay federal income taxes and, in some cases, state and local income taxes on their respective share of our taxable income, whether or not the unitholders receive cash distributions from us. For example, if we sell assets and use the proceeds to repay existing debt or fund capital expenditures, unitholders may be allocated taxable income and gain resulting from the sale and our cash available for distribution would not increase. Similarly, taking advantage of opportunities to reduce our existing debt, such as debt exchanges, debt repurchases, or modifications of our existing debt could result in “cancellation of indebtedness income” being allocated to our unitholders as taxable income without any increase in our cash available for distribution. Unitholders may not receive cash distributions from us equal to their respective share of our taxable income or even equal to the actual tax liability that results from their share of our taxable income.
Tax gain or loss on the disposition of our units could be different than expected.A unitholder who sells units will recognize a gain or loss equal to the difference between the amount realized and the unitholder’s tax basis in those units. Prior distributions to the unitholder in excess of the total net taxable income with respect to a unit will reduce the unitholder’s tax basis in that unit. As a result, the selling unitholder can recognize gain if such unit is sold at a price greater than the unitholder’s tax basis in that unit, even if the price the unitholder receives is less than the unit’s original cost. A substantial portion of the amount realized, even if there is a net taxable loss realized on the sale, may be ordinary income to the selling unitholder.
Unitholders may be subject to limitations on their ability to deduct interest expense incurred by us.Our ability to deduct interest paid or accrued on indebtedness properly allocable to a trade or business, “business interest”, may be limited in certain circumstances. Should our ability to deduct business interest be limited, the amount of taxable income allocated to our unitholders in the taxable year in which the limitation is in effect may increase. However, in certain circumstances, a unitholder may be able to utilize a portion of a business interest deduction subject to this limitation in future taxable years. Prospective unitholders should consult their tax advisors regarding the impact of this business interest deduction limitation on an investment in our units.
Tax-exempt entities face unique tax issues from owning our units that may result in adverse tax consequences to them.Investment in our units by tax-exempt entities, such as employee benefit plans and individual retirement accounts (IRAs) raises issues unique to them. For example, virtually all of our income allocated to organizations that are exempt from U.S. federal income tax, including IRAs and other retirement plans, will be unrelated business taxable income and will be taxable to them. Further, with respect to taxable years beginning after December 31, 2017, a tax-exempt entity with more than one unrelated trade or business (including by attribution from investment in a partnership such as ours) is required to compute the unrelated business taxable income of such tax-exempt entity separately with respect to each such trade or business (including for purposes of determining any net operating loss deduction). As a result, for years beginning after December 31, 2017, it may not be possible for tax-exempt entities to utilize losses from an investment in us to offset unrelated business taxable income from another unrelated trade or business and vice versa. Tax-exempt entities should consult a tax advisor before investing in our units.
Non-U.S. unitholders will be subject to U.S. taxes and withholding with respect to their income and gain from owning our units.Non-U.S. unitholders are subject to U.S. federal income tax on income effectively connected with a U.S. trade or business (effectively connected income). A unitholder’s share of our income, gain, loss and deduction, and any gain from the sale or disposition of our units will generally be considered to be effectively connected income and subject to U.S. federal income tax. Additionally, distributions to a non-U.S. unitholder will be subject to withholding at the highest applicable effective tax rate.
Moreover, upon the sale, exchange or other disposition of a unit by a non-U.S. unitholder, the transferee is generally required to withhold 10% of the amount realized on such transfer if any portion of the gain on such transfer would be treated as effectively connected income. The withholding requirement on transfers of publicly traded interests, including our units, is suspended until December 31, 2021. For transfers of units occurring after December 31, 2021, the amount realized on a transfer of units will generally be the amount of gross proceeds paid to the broker effecting the applicable transfer on behalf of the transferor, and such broker will generally be responsible for the relevant withholding obligations. Non-U.S. unitholders should consult a tax advisor before investing in our units.
We will treat each purchaser of our common units as having the same tax benefits without regard to the units purchased. The IRS may challenge this treatment, which could adversely affect the value of our common units.Because we cannot match transferors and transferees of our common units, we have adopted depreciation and amortization positions that may not conform with all aspects of existing Treasury regulations. A successful IRS challenge to those positions could adversely affect the amount of tax benefits available to unitholders. It also could affect the timing of these tax benefits or
Table of Contents
46
the amount of gain from a unitholder’s sale of common units and could have a negative impact on the value of our common units or result in audit adjustments to the unitholder’s tax returns.
Unitholders will likely be subject to state and local taxes and return filing requirements as a result of investing in our units.In addition to federal income taxes, unitholders will likely be subject to other taxes, such as state and local income taxes, unincorporated business taxes and estate, inheritance or intangible taxes that are imposed by the various jurisdictions in which we do business or own property. Unitholders will likely be required to file state and local income tax returns and pay state and local income taxes in some or all of these various jurisdictions. Further, unitholders may be subject to penalties for failure to comply with those requirements. We may own property or conduct business in other states or foreign countries in the future. It is each unitholder’s responsibility to file all federal, state and local tax returns.
We prorate our items of income, gain, loss and deduction between transferors and transferees of our common units each month based upon the ownership of our common units on the first day of each month, instead of on the basis of the date a particular common unit is transferred. The IRS may challenge this treatment, which could change the allocation of items of income, gain, loss and deduction among our common unitholders.We prorate our items of income, gain, loss and deduction between transferors and transferees of our common units each month based upon the ownership of our common units on the first day of each month, instead of on the basis of the date a particular common unit is transferred. Treasury regulations allow a similar monthly simplifying convention, but such regulations do not specifically authorize all aspects of our proration method. If the IRS were to challenge our proration method, we may be required to change the allocation of items of income, gain, loss and deduction among our common unitholders.
We have adopted certain valuation methodologies in determining a common unitholder’s allocations of income, gain, loss and deduction. The IRS may challenge these methods or the resulting allocations and such a challenge could adversely affect the value of our common units.In determining the items of income, gain, loss and deduction allocable to our common unitholders, we must routinely determine the fair market value of our respective assets. Although we may from time to time consult with professional appraisers regarding valuation matters, we make fair market value estimates using a methodology based on the market value of our common units as a means to measure the fair market value of our respective assets. The IRS may challenge these valuation methods and the resulting allocations of income, gain, loss and deduction.
A successful IRS challenge to these methods or allocations could adversely affect the amount, character and timing of taxable income or loss being allocated to our common unitholders. It also could affect the amount of gain from our unitholders’ sale of common units and could have a negative impact on the value of the common units or result in audit adjustments to our common unitholders’ tax returns without the benefit of additional deductions.
A unitholder whose units are the subject of a securities loan (e.g., a loan to a “short seller”) may be considered as having disposed of those units. If so, the unitholder would no longer be treated for tax purposes as a partner with respect to those units during the period of the loan and may recognize gain or loss from the disposition.Because there are no specific rules governing the federal income tax consequences of loaning a partnership interest, a unitholder whose units are the subject of a securities loan may be considered as having disposed of the loaned units. In that case, the unitholder may no longer be treated for tax purposes as a partner with respect to those units during the period of the loan and the unitholder may recognize gain or loss from such disposition. Moreover, during the period of the loan, any of our income, gain, loss or deduction with respect to those units may not be reportable by the unitholder and any cash distributions received by the unitholder as to those units could be fully taxable as ordinary income. Unitholders desiring to assure their status as partners and avoid the risk of gain recognition from a loan to a short seller are urged to consult a tax advisor to discuss whether it is advisable to modify any applicable brokerage account agreements to prohibit their brokers from borrowing their units.
Treatment of distributions on our preferred units as guaranteed payments for the use of capital creates a different tax treatment for the holders of preferred units than the holders of our common units and such distributions are not eligible for the 20% deduction for qualified publicly traded partnership income.The tax treatment of distributions on our preferred units is uncertain. We will treat the holders of preferred units as partners for tax purposes and will treat distributions on the preferred units as guaranteed payments for the use of capital that will generally be taxable to the holders of preferred units as ordinary income. Although a holder of preferred units could recognize taxable income from the accrual of such a guaranteed payment even in the absence of a contemporaneous distribution, we anticipate accruing and making the guaranteed payment distributions quarterly. Otherwise, the holders of preferred units are generally not anticipated to share in our items of income, gain, loss or deduction, nor will we allocate any share of our nonrecourse liabilities to the holders of preferred units. If the preferred units were treated as indebtedness for tax purposes, rather than as guaranteed payments for the use of capital, distributions likely would be treated as payments of interest by us to the holders of preferred units.
Table of Contents
47
The Tax Cuts and Jobs Act allows individuals and other non-corporate owners of interests in a publicly traded partnership to take a deduction equal to 20% of their allocable share of the partnership’s income that is “qualified publicly traded partnership income.” However, income attributable to a guaranteed payment for the use of capital is not eligible for the 20% deduction. As a result, income attributable to a guaranteed payment for the use of capital recognized by holders of preferred units is not eligible for the 20% deduction for qualified publicly traded partnership income. Investment in the preferred units by tax-exempt investors, such as employee benefit plans and IRAs, and non-U.S. persons raises issues unique to them. The treatment of guaranteed payments for the use of capital to tax-exempt investors is not certain and the income resulting from such payments may be treated as unrelated business taxable income for U.S. federal income tax purposes. A non-U.S. holder’s income from guaranteed payments and any gain from the sale or disposition of our units may be considered to be effectively connected income and subject to U.S. federal income tax. Distributions and any gain from the sale or disposition of our preferred units to non-U.S. holders of preferred units may be subject to withholding taxes. If the amount of withholding exceeds the amount of U.S. federal income tax actually due, non-U.S. holders of preferred units may be required to file U.S. federal income tax returns in order to seek a refund of such excess.
All holders of our preferred units are urged to consult a tax advisor with respect to the consequences of owning and selling our preferred units.
ITEM 1B. UNRESOLVED STAFF COMMENTS
None.
ITEM 3. LEGAL PROCEEDINGS
We are named as a defendant in litigation and are a party to other claims and legal proceedings relating to our normal business operations, including regulatory and environmental matters. Due to the inherent uncertainty of litigation, there can be no assurance that the resolution of any particular claim or proceeding would not have a material adverse effect on our results of operations, financial position or liquidity.
We are insured against various business risks to the extent we believe is prudent; however, we cannot assure you that the nature and amount of such insurance will be adequate, in every case, to protect us against liabilities arising from future legal proceedings from our business activity.
ITEM 4. MINE SAFETY DISCLOSURES
Not applicable.
Table of Contents
48
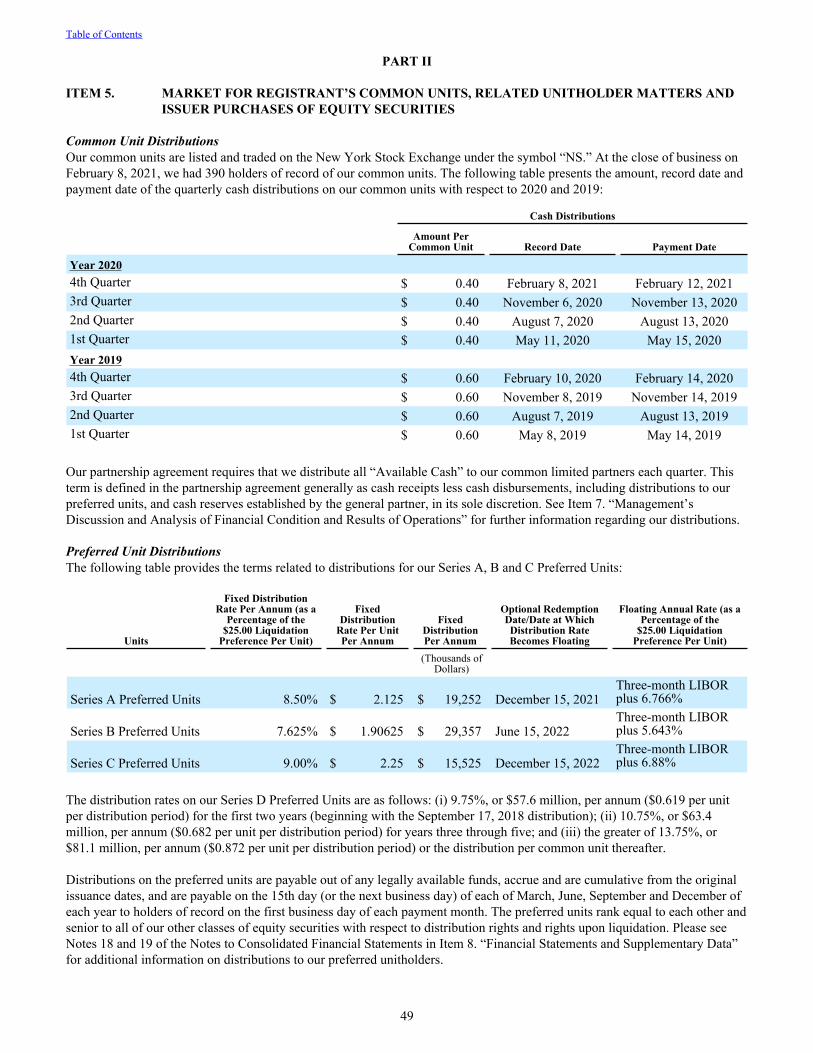
PART II
ITEM 5. MARKET FOR REGISTRANT’S COMMON UNITS, RELATED UNITHOLDER MATTERS AND ISSUER PURCHASES OF EQUITY SECURITIES
Common Unit DistributionsOur common units are listed and traded on the New York Stock Exchange under the symbol “NS.” At the close of business on February 8, 2021, we had 390 holders of record of our common units. The following table presents the amount, record date and payment date of the quarterly cash distributions on our common units with respect to 2020 and 2019:
Cash Distributions
Amount Per
Common Unit Record Date Payment Date
Year 20204th Quarter $ 0.40 February 8, 2021 February 12, 20213rd Quarter $ 0.40 November 6, 2020 November 13, 20202nd Quarter $ 0.40 August 7, 2020 August 13, 20201st Quarter $ 0.40 May 11, 2020 May 15, 2020Year 20194th Quarter $ 0.60 February 10, 2020 February 14, 20203rd Quarter $ 0.60 November 8, 2019 November 14, 20192nd Quarter $ 0.60 August 7, 2019 August 13, 20191st Quarter $ 0.60 May 8, 2019 May 14, 2019
Our partnership agreement requires that we distribute all “Available Cash” to our common limited partners each quarter. This term is defined in the partnership agreement generally as cash receipts less cash disbursements, including distributions to our preferred units, and cash reserves established by the general partner, in its sole discretion. See Item 7. “Management’s Discussion and Analysis of Financial Condition and Results of Operations” for further information regarding our distributions.
Preferred Unit DistributionsThe following table provides the terms related to distributions for our Series A, B and C Preferred Units:
Units
Fixed Distribution Rate Per Annum (as a
Percentage of the $25.00 Liquidation
Preference Per Unit)
Fixed Distribution
Rate Per Unit Per Annum
Fixed Distribution Per Annum
Optional Redemption Date/Date at Which Distribution Rate Becomes Floating
Floating Annual Rate (as a Percentage of the
$25.00 Liquidation Preference Per Unit)
(Thousands of Dollars)
Series A Preferred Units 8.50% $ 2.125 $ 19,252 December 15, 2021Three-month LIBOR plus 6.766%
Series B Preferred Units 7.625% $ 1.90625 $ 29,357 June 15, 2022Three-month LIBOR plus 5.643%
Series C Preferred Units 9.00% $ 2.25 $ 15,525 December 15, 2022Three-month LIBOR plus 6.88%
The distribution rates on our Series D Preferred Units are as follows: (i) 9.75%, or $57.6 million, per annum ($0.619 per unit per distribution period) for the first two years (beginning with the September 17, 2018 distribution); (ii) 10.75%, or $63.4 million, per annum ($0.682 per unit per distribution period) for years three through five; and (iii) the greater of 13.75%, or $81.1 million, per annum ($0.872 per unit per distribution period) or the distribution per common unit thereafter.
Distributions on the preferred units are payable out of any legally available funds, accrue and are cumulative from the original issuance dates, and are payable on the 15th day (or the next business day) of each of March, June, September and December of each year to holders of record on the first business day of each payment month. The preferred units rank equal to each other and senior to all of our other classes of equity securities with respect to distribution rights and rights upon liquidation. Please see Notes 18 and 19 of the Notes to Consolidated Financial Statements in Item 8. “Financial Statements and Supplementary Data” for additional information on distributions to our preferred unitholders.
Table of Contents
49
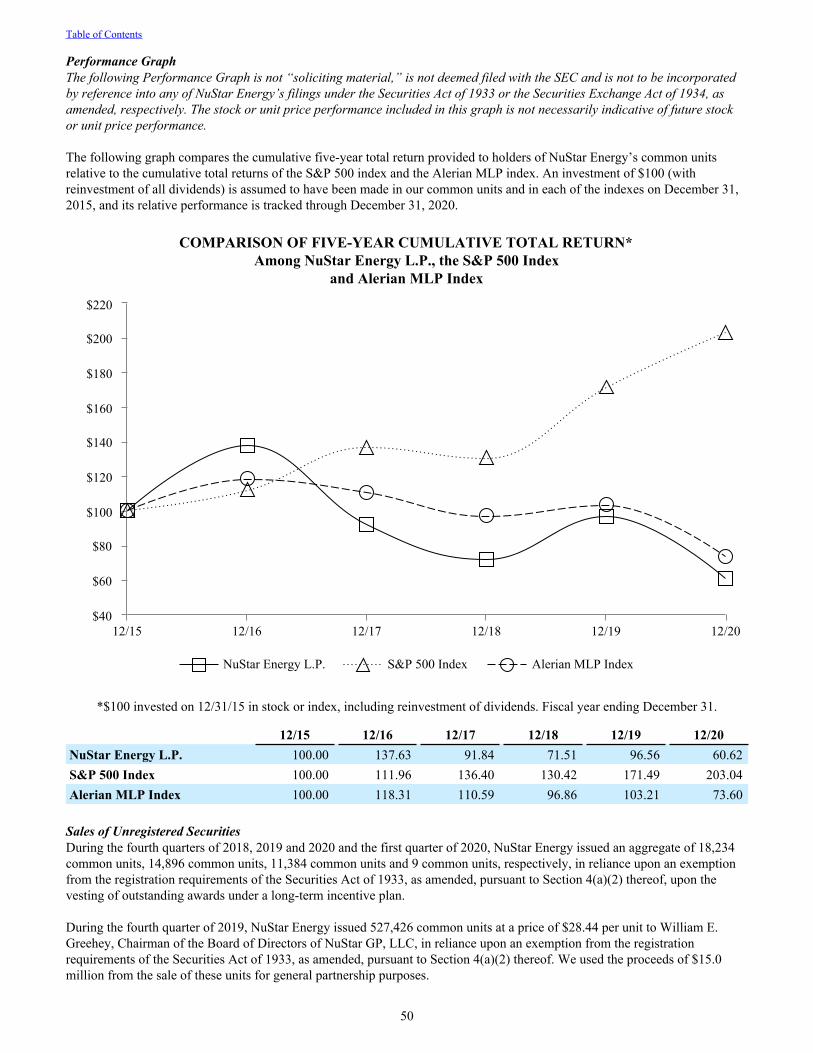
Performance GraphThe following Performance Graph is not “soliciting material,” is not deemed filed with the SEC and is not to be incorporated by reference into any of NuStar Energy’s filings under the Securities Act of 1933 or the Securities Exchange Act of 1934, as amended, respectively. The stock or unit price performance included in this graph is not necessarily indicative of future stock or unit price performance.
The following graph compares the cumulative five-year total return provided to holders of NuStar Energy’s common units relative to the cumulative total returns of the S&P 500 index and the Alerian MLP index. An investment of $100 (with reinvestment of all dividends) is assumed to have been made in our common units and in each of the indexes on December 31, 2015, and its relative performance is tracked through December 31, 2020.
COMPARISON OF FIVE-YEAR CUMULATIVE TOTAL RETURN*Among NuStar Energy L.P., the S&P 500 Index
and Alerian MLP Index
NuStar Energy L.P. S&P 500 Index Alerian MLP Index
12/15 12/16 12/17 12/18 12/19 12/20$40
$60
$80
$100
$120
$140
$160
$180
$200
$220
*$100 invested on 12/31/15 in stock or index, including reinvestment of dividends. Fiscal year ending December 31.
12/15 12/16 12/17 12/18 12/19 12/20NuStar Energy L.P. 100.00 137.63 91.84 71.51 96.56 60.62 S&P 500 Index 100.00 111.96 136.40 130.42 171.49 203.04 Alerian MLP Index 100.00 118.31 110.59 96.86 103.21 73.60
Sales of Unregistered SecuritiesDuring the fourth quarters of 2018, 2019 and 2020 and the first quarter of 2020, NuStar Energy issued an aggregate of 18,234 common units, 14,896 common units, 11,384 common units and 9 common units, respectively, in reliance upon an exemption from the registration requirements of the Securities Act of 1933, as amended, pursuant to Section 4(a)(2) thereof, upon the vesting of outstanding awards under a long-term incentive plan.
During the fourth quarter of 2019, NuStar Energy issued 527,426 common units at a price of $28.44 per unit to William E. Greehey, Chairman of the Board of Directors of NuStar GP, LLC, in reliance upon an exemption from the registration requirements of the Securities Act of 1933, as amended, pursuant to Section 4(a)(2) thereof. We used the proceeds of $15.0 million from the sale of these units for general partnership purposes.
Table of Contents
50
ITEM 6. SELECTED FINANCIAL DATA
Not applicable.
ITEM 7A. QUANTITATIVE AND QUALITATIVE DISCLOSURES ABOUT MARKET RISK
We manage our exposure to changing interest rates principally through the use of a combination of fixed-rate debt and variable-rate debt. Borrowings under our variable-rate debt expose us to increases in interest rates.
On June 3, 2020, NuStar Logistics completed the reoffering and conversion of the GoZone Bonds. The GoZone Bonds were converted from a weekly rate to a long-term rate. NuStar Logistics did not receive any proceeds from the reoffering and the reoffering did not increase NuStar Logistics’ outstanding debt. On September 14, 2020, NuStar Logistics issued $600.0 million of 5.75% senior notes due October 1, 2025 and $600.0 million of 6.375% senior notes due October 1, 2030. Please refer to Note 13 of the Notes to Consolidated Financial Statements in Item 8. “Financial Statements and Supplementary Data” for additional information about our debt instruments.
The following tables present principal cash flows and related weighted-average interest rates by expected maturity dates for our long-term debt, excluding finance leases:
December 31, 2020 Expected Maturity Dates
2021 2022 2023 2024 2025There-after Total
FairValue
(Thousands of Dollars, Except Interest Rates)Fixed-rate debt $ 300,000 $ 250,000 $ — $ — $ 600,000 $ 1,972,140 $ 3,122,140 $ 3,396,542
Weighted-average rate 6.8 % 4.8 % — — 5.8 % 6.0 % 5.9 % —
Variable-rate debt $ — $ — $ 57,000 $ — $ — $ 402,500 $ 459,500 $ 402,836 Weighted-average
rate — — 2.3 % — — 7.0 % 6.4 % —
December 31, 2019 Expected Maturity Dates
2020 2021 2022 2023 2024There-after Total
FairValue
(Thousands of Dollars, Except Interest Rates)Fixed-rate debt $ 450,000 $ 300,000 $ 250,000 $ — $ — $ 1,050,000 $ 2,050,000 $ 2,123,964
Weighted-average rate 4.8 % 6.8 % 4.8 % — — 5.8 % 5.6 % —
Variable-rate debt $ — $ 537,200 $ — $ — $ — $ 767,940 $ 1,305,140 $ 1,318,037 Weighted-average
rate — 3.7 % — — — 5.3 % 4.7 % —
In June 2020, we paid $49.2 million to terminate forward-starting interest rate swaps with an aggregate notional amount of $250.0 million. Prior to the termination, we utilized forward-starting interest rate swap agreements to lock in the rate on the interest payments related to forecasted debt issuances. Please refer to Notes 2 and 17 of the Notes to Consolidated Financial Statements in Item 8. “Financial Statements and Supplementary Data” for a more detailed discussion of our interest rate swaps.
Since the operations of our fuels marketing segment expose us to commodity price risk, we also use derivative instruments to attempt to mitigate the effects of commodity price fluctuations. Derivative financial instruments associated with commodity price risk were not material for any periods presented.
Table of Contents
51
ITEM 8. FINANCIAL STATEMENTS AND SUPPLEMENTARY DATA
Management’s Report on Internal Control over Financial Reporting
Our management is responsible for establishing and maintaining effective internal control over financial reporting as defined in Rule 13a-15(f) under the Securities Exchange Act of 1934. Our management assessed the effectiveness of NuStar Energy L.P.’s internal control over financial reporting as of December 31, 2020. In its evaluation, management used the criteria set forth by the Committee of Sponsoring Organizations of the Treadway Commission (COSO) in Internal Control-Integrated Framework (2013). Based on this assessment, management believes that, as of December 31, 2020, our internal control over financial reporting was effective based on those criteria.
Because of its inherent limitations, internal control over financial reporting may not prevent or detect misstatements. Therefore, even those systems determined to be effective can provide only reasonable assurance with respect to financial statement preparation and presentation.
The effectiveness of internal control over financial reporting as of December 31, 2020 has been audited by KPMG LLP, the independent registered public accounting firm who audited our consolidated financial statements included in this Form 10-K. KPMG LLP’s attestation on the effectiveness of our internal control over financial reporting appears on page 55.
Table of Contents
52
Report of Independent Registered Public Accounting Firm
To the Board of Directors of NuStar GP, LLCand Unitholders of NuStar Energy L.P.:
Opinion on the Consolidated Financial StatementsWe have audited the accompanying consolidated balance sheets of NuStar Energy L.P. and subsidiaries (the Partnership) as of December 31, 2020 and 2019, the related consolidated statements of (loss) income, comprehensive (loss) income, partners’ equity and mezzanine equity, and cash flows for each of the years in the three‑year period ended December 31, 2020, and the related notes (collectively, the consolidated financial statements). In our opinion, the consolidated financial statements present fairly, in all material respects, the financial position of the Partnership as of December 31, 2020 and 2019, and the results of its operations and its cash flows for each of the years in the three‑year period ended December 31, 2020, in conformity with U.S. generally accepted accounting principles.
We also have audited, in accordance with the standards of the Public Company Accounting Oversight Board (United States) (PCAOB), the Partnership’s internal control over financial reporting as of December 31, 2020, based on criteria established in Internal Control – Integrated Framework (2013) issued by the Committee of Sponsoring Organizations of the Treadway Commission, and our report dated February 25, 2021 expressed an unqualified opinion on the effectiveness of the Partnership’s internal control over financial reporting.
Basis for OpinionThese consolidated financial statements are the responsibility of the Partnership’s management. Our responsibility is to express an opinion on these consolidated financial statements based on our audits. We are a public accounting firm registered with the PCAOB and are required to be independent with respect to the Partnership in accordance with the U.S. federal securities laws and the applicable rules and regulations of the Securities and Exchange Commission and the PCAOB.
We conducted our audits in accordance with the standards of the PCAOB. Those standards require that we plan and perform the audit to obtain reasonable assurance about whether the consolidated financial statements are free of material misstatement, whether due to error or fraud. Our audits included performing procedures to assess the risks of material misstatement of the consolidated financial statements, whether due to error or fraud, and performing procedures that respond to those risks. Such procedures included examining, on a test basis, evidence regarding the amounts and disclosures in the consolidated financial statements. Our audits also included evaluating the accounting principles used and significant estimates made by management, as well as evaluating the overall presentation of the consolidated financial statements. We believe that our audits provide a reasonable basis for our opinion.
Critical Audit MattersThe critical audit matters communicated below are matters arising from the current period audit of the consolidated financial statements that were communicated or required to be communicated to the audit committee and that: (1) relate to accounts or disclosures that are material to the consolidated financial statements and (2) involved our especially challenging, subjective, or complex judgments. The communication of critical audit matters does not alter in any way our opinion on the consolidated financial statements, taken as a whole, and we are not, by communicating the critical audit matters below, providing separate opinions on the critical audit matters or on the accounts or disclosures to which they relate.
Identification of Triggering Events Related to the Recoverability of Certain Long-Lived Assets or Asset GroupsAs discussed in Note 2, the Partnership tests long-lived assets, including property, plant, and equipment, for impairment whenever events or changes in circumstances (triggering events) indicate that the carrying amount may not be recoverable. The Partnership evaluates recoverability using undiscounted estimated net cash flows generated by the related asset or asset group considering the intended use of the asset. The balance of property, plant, and equipment, net as of December 31, 2020 was $3,957.5 million, or 68.0% of total assets, of which certain assets or asset groups were not supported by existing revenue generating contracts or have not historically had consistent revenue generating activities.
We identified the assessment of the identification of triggering events related to the recoverability of certain long-lived assets or asset groups as a critical audit matter. Challenging auditor judgment was required to assess the identification of triggering events for certain long-lived assets or asset groups that were not supported by existing revenue generating contracts or have not historically had consistent revenue generating activities. Specifically, this assessment included the evaluation of subjective qualitative considerations, such as alternative customers and alternative uses for the asset or asset group, and the Partnership’s intent for the asset or asset group.
Table of Contents
53
The following are the primary procedures we performed to address this critical audit matter. We evaluated the design and tested the operating effectiveness of certain internal controls over the Partnership’s triggering event assessment. This included controls over the identification of long-lived asset groups that would be at greater risk for a triggering event and evaluation of the qualitative considerations in assessing the identification of a triggering event. We examined the Partnership’s analysis of the long-lived assets and asset groups identified to be evaluated for a potential triggering event and assessed the factors considered in determining the identification of a triggering event. Specifically, we evaluated the Partnership’s assessment of the factors considered, including alternative customers, alternative uses for the assets or asset group, and the Partnership’s intent for the assets or asset group by evaluating internal and external documentation. Documentation evaluated included internal presentations, draft customer contracts, publicly available market data, and communications between the Partnership and potential customers.
Evaluation of the Fair Value of the Crude Oil Pipelines Reporting UnitAs discussed in Note 11 to the consolidated financial statements, the goodwill balance as of December 31, 2020 was $766.4 million. As discussed in Note 2, the Partnership assesses goodwill for impairment annually or more frequently if events or changes in circumstances indicate goodwill might be impaired. During 2020, the Partnership identified a triggering event, performed an impairment analysis, and recorded a goodwill impairment charge of $225.0 million associated with the crude oil pipelines reporting unit. The Partnership estimated the fair value of the reporting unit using a weighted-average of values determined from an income approach and a market approach.
We identified the evaluation of the fair value of the crude oil pipelines reporting unit as a critical audit matter. Due to the degree of estimation uncertainty, a high level of auditor judgment was required to evaluate certain assumptions used in the Partnership’s estimate of fair value. Specifically, the discount rate used in the income approach and the guideline public company multiple used in the market approach to estimate the fair value of the crude oil pipelines reporting unit required subjective and challenging auditor judgment, as changes to those assumptions could have had a significant effect on the Partnership’s estimate of the fair value of the reporting unit. Additionally, the audit effort to evaluate these assumptions required specialized skills and knowledge.
The following are the primary procedures we performed to address this critical audit matter. We evaluated the design and tested the operating effectiveness of certain internal controls over the Partnership’s goodwill impairment process. This included controls related to the assumptions used to estimate the fair value of the reporting unit. In addition, we involved valuation professionals with specialized skills and knowledge, who assisted in:
• evaluating the discount rate by comparing it to a discount rate range that was independently developed using publicly available data for a group of comparable entities;
• assessing the reasonableness of the crude oil pipeline reporting unit’s fair value using the reporting unit’s cash flow forecast and an independently developed discount rate; and
• assessing the reasonableness of the multiple utilized in the guideline public company method by reviewing the business activities, markets served, expected growth, profitability, size, capital structure, geography and other considerations of the comparable entities and the selected multiple within the guideline public company range.
We have served as the Partnership’s auditor since 2004.
/s/ KPMG LLP
San Antonio, TexasFebruary 25, 2021
Table of Contents
54
Report of Independent Registered Public Accounting Firm
The Board of Directors of NuStar GP, LLCand Unitholders of NuStar Energy L.P.:
Opinion on Internal Control Over Financial Reporting We have audited NuStar Energy L.P. and subsidiaries (the Partnership) internal control over financial reporting as of December 31, 2020, based on criteria established in Internal Control – Integrated Framework (2013) issued by the Committee of Sponsoring Organizations of the Treadway Commission. In our opinion, the Partnership maintained, in all material respects, effective internal control over financial reporting as of December 31, 2020, based on criteria established in Internal Control – Integrated Framework (2013) issued by the Committee of Sponsoring Organizations of the Treadway Commission.
We also have audited, in accordance with the standards of the Public Company Accounting Oversight Board (United States) (PCAOB), the consolidated balance sheets of the Partnership as of December 31, 2020 and 2019, the related consolidated statements of (loss) income, comprehensive (loss) income, partners’ equity and mezzanine equity, and cash flows for each of the years in the three-year period ended December 31, 2020, and the related notes (collectively, the consolidated financial statements), and our report dated February 25, 2021 expressed an unqualified opinion on those consolidated financial statements.
Basis for Opinion The Partnership’s management is responsible for maintaining effective internal control over financial reporting and for its assessment of the effectiveness of internal control over financial reporting, included in the accompanying Management’s Report on Internal Control over Financial Reporting. Our responsibility is to express an opinion on the Partnership’s internal control over financial reporting based on our audit. We are a public accounting firm registered with the PCAOB and are required to be independent with respect to the Partnership in accordance with the U.S. federal securities laws and the applicable rules and regulations of the Securities and Exchange Commission and the PCAOB.
We conducted our audit in accordance with the standards of the PCAOB. Those standards require that we plan and perform the audit to obtain reasonable assurance about whether effective internal control over financial reporting was maintained in all material respects. Our audit of internal control over financial reporting included obtaining an understanding of internal control over financial reporting, assessing the risk that a material weakness exists, and testing and evaluating the design and operating effectiveness of internal control based on the assessed risk. Our audit also included performing such other procedures as we considered necessary in the circumstances. We believe that our audit provides a reasonable basis for our opinion.
Definition and Limitations of Internal Control Over Financial Reporting A company’s internal control over financial reporting is a process designed to provide reasonable assurance regarding the reliability of financial reporting and the preparation of financial statements for external purposes in accordance with generally accepted accounting principles. A company’s internal control over financial reporting includes those policies and procedures that (1) pertain to the maintenance of records that, in reasonable detail, accurately and fairly reflect the transactions and dispositions of the assets of the company; (2) provide reasonable assurance that transactions are recorded as necessary to permit preparation of financial statements in accordance with generally accepted accounting principles, and that receipts and expenditures of the company are being made only in accordance with authorizations of management and directors of the company; and (3) provide reasonable assurance regarding prevention or timely detection of unauthorized acquisition, use, or disposition of the company’s assets that could have a material effect on the financial statements.
Because of its inherent limitations, internal control over financial reporting may not prevent or detect misstatements. Also, projections of any evaluation of effectiveness to future periods are subject to the risk that controls may become inadequate because of changes in conditions, or that the degree of compliance with the policies or procedures may deteriorate.
/s/ KPMG LLPSan Antonio, TexasFebruary 25, 2021
Table of Contents
55
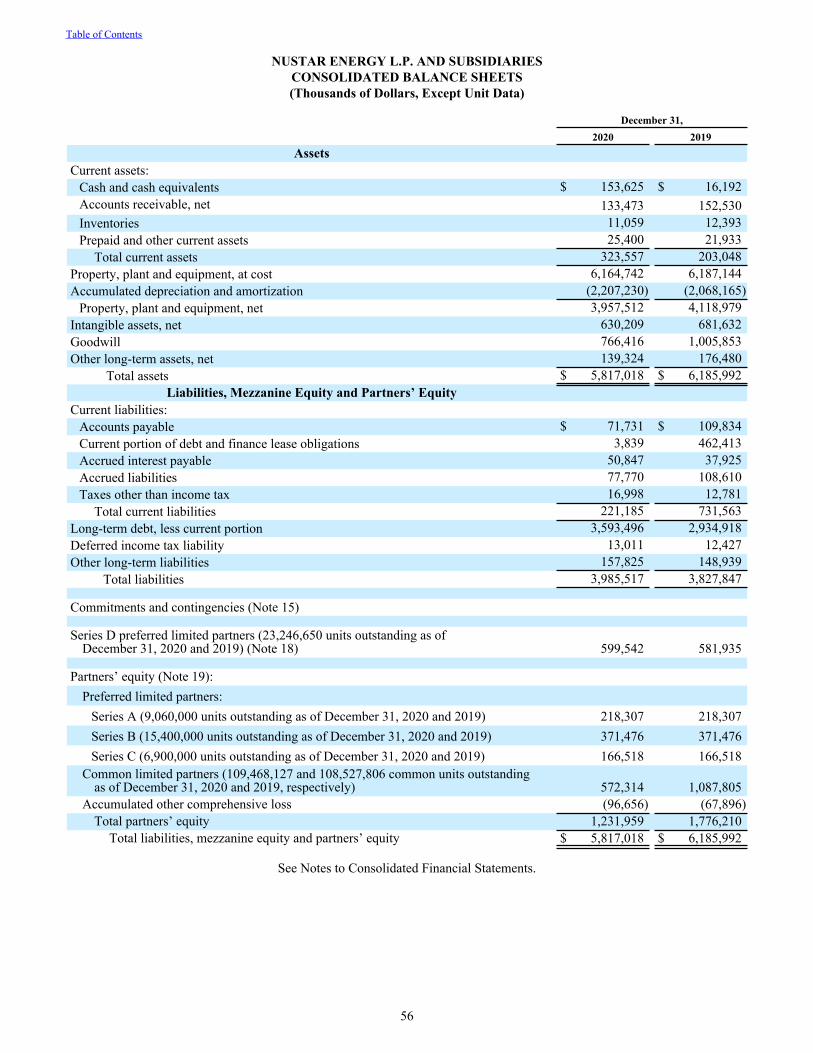
NUSTAR ENERGY L.P. AND SUBSIDIARIESCONSOLIDATED BALANCE SHEETS(Thousands of Dollars, Except Unit Data)
December 31, 2020 2019
AssetsCurrent assets:
Cash and cash equivalents $ 153,625 $ 16,192 Accounts receivable, net 133,473 152,530 Inventories 11,059 12,393 Prepaid and other current assets 25,400 21,933
Total current assets 323,557 203,048 Property, plant and equipment, at cost 6,164,742 6,187,144 Accumulated depreciation and amortization (2,207,230) (2,068,165)
Property, plant and equipment, net 3,957,512 4,118,979 Intangible assets, net 630,209 681,632 Goodwill 766,416 1,005,853 Other long-term assets, net 139,324 176,480
Total assets $ 5,817,018 $ 6,185,992 Liabilities, Mezzanine Equity and Partners’ Equity
Current liabilities:Accounts payable $ 71,731 $ 109,834 Current portion of debt and finance lease obligations 3,839 462,413 Accrued interest payable 50,847 37,925 Accrued liabilities 77,770 108,610 Taxes other than income tax 16,998 12,781
Total current liabilities 221,185 731,563 Long-term debt, less current portion 3,593,496 2,934,918 Deferred income tax liability 13,011 12,427 Other long-term liabilities 157,825 148,939
Total liabilities 3,985,517 3,827,847
Commitments and contingencies (Note 15)
Series D preferred limited partners (23,246,650 units outstanding as of December 31, 2020 and 2019) (Note 18) 599,542 581,935
Partners’ equity (Note 19):Preferred limited partners:
Series A (9,060,000 units outstanding as of December 31, 2020 and 2019) 218,307 218,307 Series B (15,400,000 units outstanding as of December 31, 2020 and 2019) 371,476 371,476 Series C (6,900,000 units outstanding as of December 31, 2020 and 2019) 166,518 166,518
Common limited partners (109,468,127 and 108,527,806 common units outstandingas of December 31, 2020 and 2019, respectively) 572,314 1,087,805
Accumulated other comprehensive loss (96,656) (67,896) Total partners’ equity 1,231,959 1,776,210
Total liabilities, mezzanine equity and partners’ equity $ 5,817,018 $ 6,185,992
See Notes to Consolidated Financial Statements.
Table of Contents
56
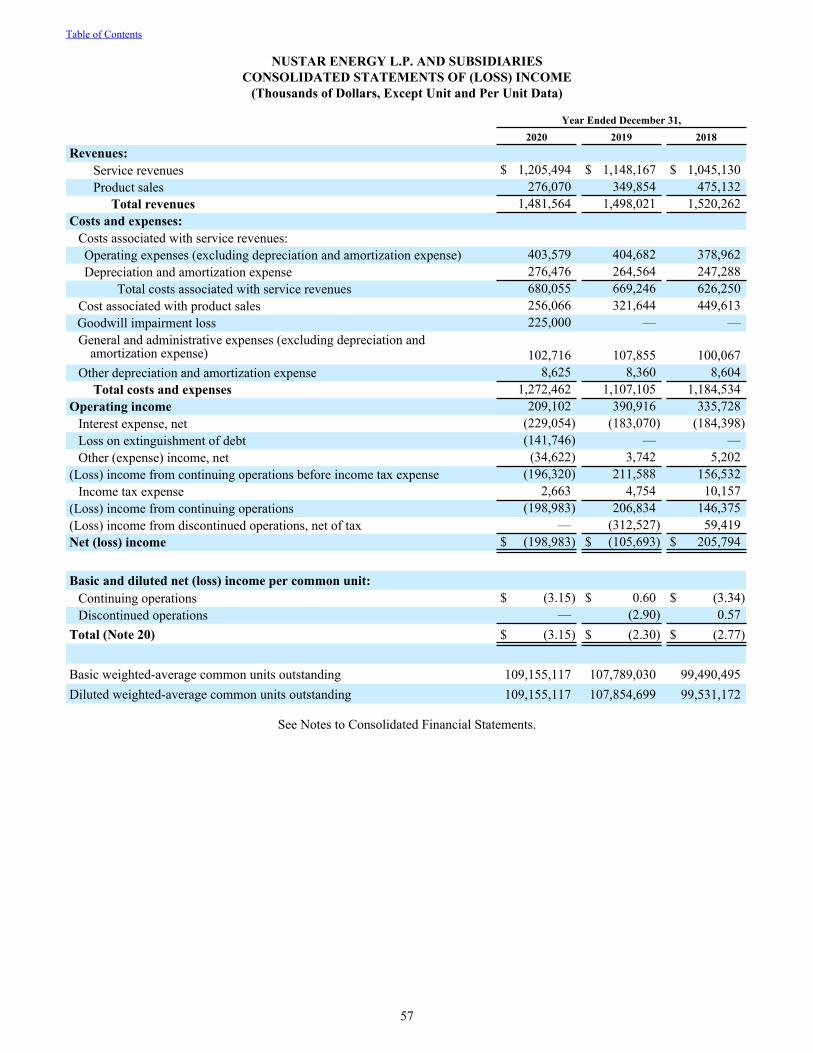
NUSTAR ENERGY L.P. AND SUBSIDIARIESCONSOLIDATED STATEMENTS OF (LOSS) INCOME
(Thousands of Dollars, Except Unit and Per Unit Data)
Year Ended December 31, 2020 2019 2018Revenues:
Service revenues $ 1,205,494 $ 1,148,167 $ 1,045,130 Product sales 276,070 349,854 475,132
Total revenues 1,481,564 1,498,021 1,520,262 Costs and expenses:
Costs associated with service revenues:Operating expenses (excluding depreciation and amortization expense) 403,579 404,682 378,962 Depreciation and amortization expense 276,476 264,564 247,288
Total costs associated with service revenues 680,055 669,246 626,250 Cost associated with product sales 256,066 321,644 449,613 Goodwill impairment loss 225,000 — — General and administrative expenses (excluding depreciation and
amortization expense) 102,716 107,855 100,067 Other depreciation and amortization expense 8,625 8,360 8,604
Total costs and expenses 1,272,462 1,107,105 1,184,534 Operating income 209,102 390,916 335,728
Interest expense, net (229,054) (183,070) (184,398) Loss on extinguishment of debt (141,746) — — Other (expense) income, net (34,622) 3,742 5,202
(Loss) income from continuing operations before income tax expense (196,320) 211,588 156,532 Income tax expense 2,663 4,754 10,157
(Loss) income from continuing operations (198,983) 206,834 146,375 (Loss) income from discontinued operations, net of tax — (312,527) 59,419 Net (loss) income $ (198,983) $ (105,693) $ 205,794
Basic and diluted net (loss) income per common unit:Continuing operations $ (3.15) $ 0.60 $ (3.34) Discontinued operations — (2.90) 0.57
Total (Note 20) $ (3.15) $ (2.30) $ (2.77)
Basic weighted-average common units outstanding 109,155,117 107,789,030 99,490,495 Diluted weighted-average common units outstanding 109,155,117 107,854,699 99,531,172
See Notes to Consolidated Financial Statements.
Table of Contents
57
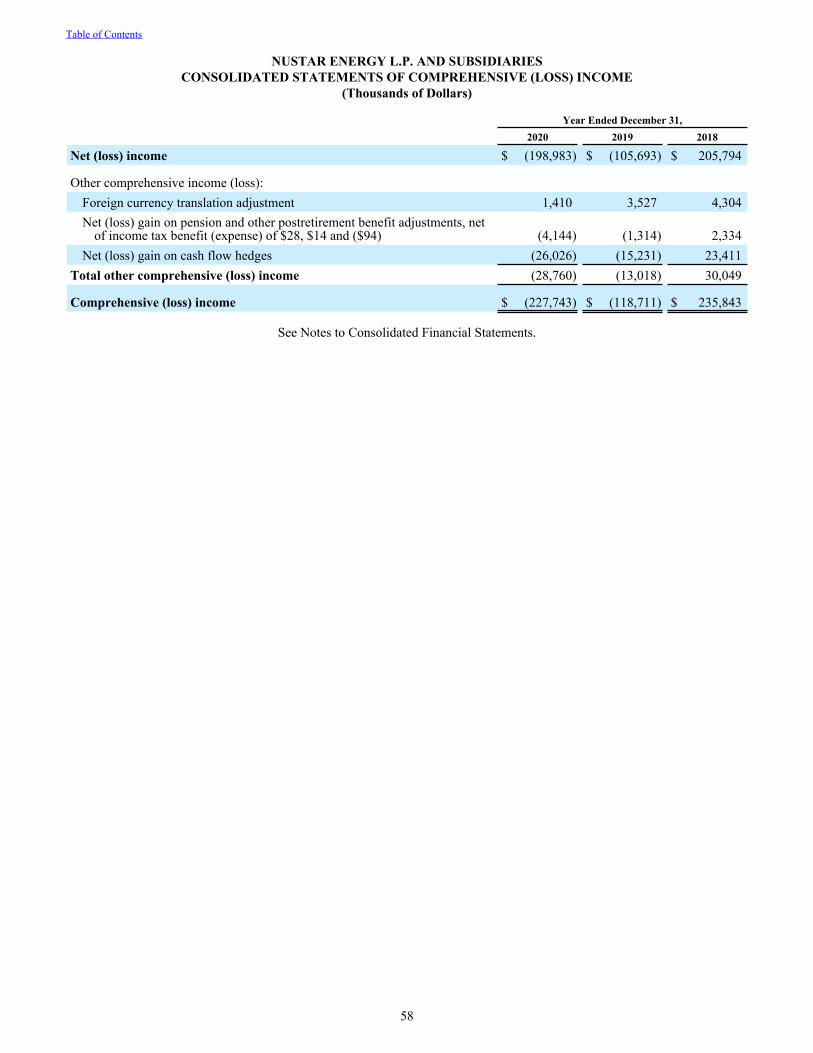
NUSTAR ENERGY L.P. AND SUBSIDIARIESCONSOLIDATED STATEMENTS OF COMPREHENSIVE (LOSS) INCOME
(Thousands of Dollars)
Year Ended December 31,2020 2019 2018
Net (loss) income $ (198,983) $ (105,693) $ 205,794
Other comprehensive income (loss):Foreign currency translation adjustment 1,410 3,527 4,304 Net (loss) gain on pension and other postretirement benefit adjustments, net
of income tax benefit (expense) of $28, $14 and ($94) (4,144) (1,314) 2,334 Net (loss) gain on cash flow hedges (26,026) (15,231) 23,411
Total other comprehensive (loss) income (28,760) (13,018) 30,049
Comprehensive (loss) income $ (227,743) $ (118,711) $ 235,843
See Notes to Consolidated Financial Statements.
Table of Contents
58
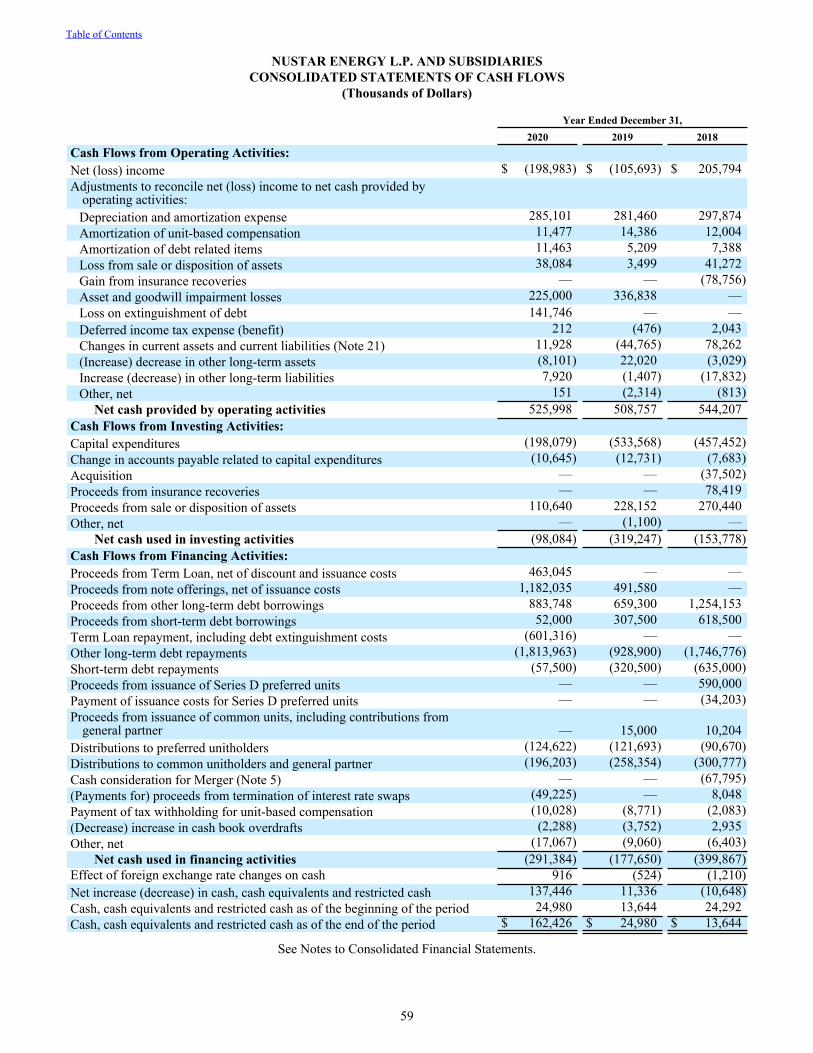
NUSTAR ENERGY L.P. AND SUBSIDIARIESCONSOLIDATED STATEMENTS OF CASH FLOWS
(Thousands of Dollars)
Year Ended December 31, 2020 2019 2018Cash Flows from Operating Activities:Net (loss) income $ (198,983) $ (105,693) $ 205,794 Adjustments to reconcile net (loss) income to net cash provided by
operating activities:Depreciation and amortization expense 285,101 281,460 297,874 Amortization of unit-based compensation 11,477 14,386 12,004 Amortization of debt related items 11,463 5,209 7,388 Loss from sale or disposition of assets 38,084 3,499 41,272 Gain from insurance recoveries — — (78,756) Asset and goodwill impairment losses 225,000 336,838 — Loss on extinguishment of debt 141,746 — — Deferred income tax expense (benefit) 212 (476) 2,043 Changes in current assets and current liabilities (Note 21) 11,928 (44,765) 78,262 (Increase) decrease in other long-term assets (8,101) 22,020 (3,029) Increase (decrease) in other long-term liabilities 7,920 (1,407) (17,832) Other, net 151 (2,314) (813)
Net cash provided by operating activities 525,998 508,757 544,207 Cash Flows from Investing Activities:Capital expenditures (198,079) (533,568) (457,452) Change in accounts payable related to capital expenditures (10,645) (12,731) (7,683) Acquisition — — (37,502) Proceeds from insurance recoveries — — 78,419 Proceeds from sale or disposition of assets 110,640 228,152 270,440 Other, net — (1,100) —
Net cash used in investing activities (98,084) (319,247) (153,778) Cash Flows from Financing Activities:Proceeds from Term Loan, net of discount and issuance costs 463,045 — — Proceeds from note offerings, net of issuance costs 1,182,035 491,580 — Proceeds from other long-term debt borrowings 883,748 659,300 1,254,153 Proceeds from short-term debt borrowings 52,000 307,500 618,500 Term Loan repayment, including debt extinguishment costs (601,316) — — Other long-term debt repayments (1,813,963) (928,900) (1,746,776) Short-term debt repayments (57,500) (320,500) (635,000) Proceeds from issuance of Series D preferred units — — 590,000 Payment of issuance costs for Series D preferred units — — (34,203) Proceeds from issuance of common units, including contributions from
general partner — 15,000 10,204 Distributions to preferred unitholders (124,622) (121,693) (90,670) Distributions to common unitholders and general partner (196,203) (258,354) (300,777) Cash consideration for Merger (Note 5) — — (67,795) (Payments for) proceeds from termination of interest rate swaps (49,225) — 8,048 Payment of tax withholding for unit-based compensation (10,028) (8,771) (2,083) (Decrease) increase in cash book overdrafts (2,288) (3,752) 2,935 Other, net (17,067) (9,060) (6,403)
Net cash used in financing activities (291,384) (177,650) (399,867) Effect of foreign exchange rate changes on cash 916 (524) (1,210) Net increase (decrease) in cash, cash equivalents and restricted cash 137,446 11,336 (10,648) Cash, cash equivalents and restricted cash as of the beginning of the period 24,980 13,644 24,292 Cash, cash equivalents and restricted cash as of the end of the period $ 162,426 $ 24,980 $ 13,644
See Notes to Consolidated Financial Statements.
Table of Contents
59
NUSTAR ENERGY L.P. AND SUBSIDIARIESCONSOLIDATED STATEMENTS OF PARTNERS’ EQUITY AND MEZZANINE EQUITY
(Thousands of Dollars, Except Per Unit Data)
Limited PartnersMezzanine
Equity
Preferred CommonGeneralPartner
Accumulated Other
ComprehensiveLoss
Total Partners’
Equity (Note 19)
Series D Preferred Limited Partners (Note 18) Total
Balance as of January 1, 2018 $ 756,603 $ 1,770,587 $ 37,826 $ (84,927) $ 2,480,089 $ — $ 2,480,089 Net income 64,091 110,788 2,466 — 177,345 28,449 205,794 Other comprehensive income — — — 30,049 30,049 — 30,049 Distributions to partners:Series A, B and C preferred (64,091) — — — (64,091) — (64,091) Common ($2.895 per unit)
and general partner — (286,398) (14,379) — (300,777) — (300,777) Series D preferred — — — — — (28,449) (28,449)
Issuance of common units, including contribution from general partner — 10,000 204 — 10,204 — 10,204
Issuance of Series D preferred units — — — — — 555,797 555,797
Unit-based compensation — 7,925 — — 7,925 — 7,925 Adjustments related to the Merger
(refer to Note 5 for discussion) — (41,973) (25,999) — (67,972) — (67,972) Series D Preferred Unit accretion — (8,195) — — (8,195) 8,195 — Other (302) (6,426) (118) — (6,846) — (6,846)
Balance as of December 31, 2018 756,301 1,556,308 — (54,878) 2,257,731 563,992 2,821,723 Net income (loss) 64,134 (227,386) — — (163,252) 57,559 (105,693) Other comprehensive loss — — — (13,018) (13,018) — (13,018) Distributions to partners:Series A, B and C preferred (64,134) — — — (64,134) — (64,134) Common ($2.40 per unit) — (258,354) — — (258,354) — (258,354) Series D preferred — — — — — (57,559) (57,559)
Issuance of common units — 15,000 — — 15,000 — 15,000 Unit-based compensation — 20,766 — — 20,766 — 20,766 Series D Preferred Unit accretion — (18,085) — — (18,085) 18,085 — Other — (444) — — (444) (142) (586)
Balance as of December 31, 2019 756,301 1,087,805 — (67,896) 1,776,210 581,935 2,358,145 Net income (loss) 64,134 (323,865) — — (259,731) 60,748 (198,983) Other comprehensive loss — — — (28,760) (28,760) — (28,760) Distributions to partners:Series A, B and C preferred (64,134) — — — (64,134) — (64,134) Common ($1.80 per unit) — (196,203) — — (196,203) — (196,203) Series D preferred — — — — — (60,748) (60,748)
Unit-based compensation — 22,219 — — 22,219 — 22,219 Series D Preferred Unit accretion — (17,626) — — (17,626) 17,626 — Other — (16) — — (16) (19) (35)
Balance as of December 31, 2020 $ 756,301 $ 572,314 $ — $ (96,656) $ 1,231,959 $ 599,542 $ 1,831,501
See Notes to Consolidated Financial Statements.
Table of Contents
60
NUSTAR ENERGY L.P. AND SUBSIDIARIESNOTES TO CONSOLIDATED FINANCIAL STATEMENTS
Years Ended December 31, 2020, 2019 and 2018
1. ORGANIZATION AND OPERATIONS
OrganizationNuStar Energy L.P. (NYSE: NS) is engaged in the transportation of petroleum products and anhydrous ammonia, and the terminalling, storage and marketing of petroleum products. Unless otherwise indicated, the terms “NuStar Energy,” “NS,” “the Partnership,” “we,” “our” and “us” are used in this report to refer to NuStar Energy L.P., to one or more of our consolidated subsidiaries or to all of them taken as a whole. Our business is managed under the direction of the board of directors of NuStar GP, LLC, the general partner of our general partner, Riverwalk Logistics, L.P., both of which are wholly owned subsidiaries of NuStar GP Holdings, LLC (Holdings), which became a wholly owned subsidiary of ours on July 20, 2018.
Recent DevelopmentsCOVID-19 and OPEC+ Actions. The coronavirus, or COVID-19, has had a severe negative impact on global economic activity, as government authorities instituted stay-home orders, business closures and other measures to reduce the spread of the virus, and people around the world ceased or altered their usual day-to-day activities. The scale of this decrease in economic activity has significantly reduced demand for petroleum products. In March 2020, the negative economic impact of the COVID-19 pandemic and demand deterioration was exacerbated by disputes among the Organization of Petroleum Exporting Countries and other oil-producing nations (OPEC+) regarding their agreed production rates that contributed to a significant over-supply in crude oil, resulting in a sharp decline in, and increase in the volatility of, crude oil prices. Beginning with the second quarter of 2020, crude oil prices stabilized somewhat, and although lower compared to recent years, crude oil prices began to increase in the fourth quarter of 2020.
In March 2020, the negative impact of the COVID-19 pandemic, combined with actions by OPEC+, also drove significant declines in stock prices and market capitalization of companies across the energy industry, including NuStar’s. As a result, we recorded a goodwill impairment charge of $225.0 million associated with our crude oil pipelines in the first quarter of 2020. Please refer to Note 11 for additional information.
Although the continuing impact of the COVID-19 pandemic and actions by OPEC+ have depressed global economic activity, which has had a negative impact on our results of operations, particularly during the second quarter of 2020, we began to see some initial signs of recovery and rebound in June, which improved our results of operations for the remainder of 2020. Ongoing uncertainty surrounding the COVID-19 pandemic, including its duration and lingering impacts to the economy, as well as uncertainty surrounding future production decisions by OPEC+, continue to cause volatility and could have a significant impact on management’s estimates and assumptions in 2021 and beyond.
Sale of Texas City Terminals. On December 7, 2020, we sold the equity interests in our wholly owned subsidiaries that owned two terminals in Texas City, Texas for $106.0 million, subject to adjustment. We recorded a non-cash loss of $34.7 million and utilized the sales proceeds to improve our debt metrics. Please refer to Note 4 for further discussion.
Senior Notes. On September 14, 2020, NuStar Logistics issued $600.0 million of 5.75% senior notes due October 1, 2025 and $600.0 million of 6.375% senior notes due October 1, 2030. We received proceeds of $1,182.0 million, net of issuance costs of $18.0 million, which we used to repay outstanding borrowings under the Term Loan, as defined below, as well as outstanding borrowings under our revolving credit agreement. On September 1, 2020, we repaid our $450.0 million of 4.80% senior notes at maturity with borrowings under our revolving credit agreement. Please refer to Note 13 for further discussion.
Term Loan Credit Agreement. On April 19, 2020, NuStar Energy and NuStar Logistics entered into an unsecured term loan credit agreement with certain lenders and Oaktree Fund Administration, LLC, as administrative agent for the lenders (the Term Loan). The Term Loan provided for an aggregate commitment of up to $750.0 million pursuant to a three-year unsecured term loan credit facility. On April 21, 2020 we drew $500.0 million, which we repaid on September 16, 2020. The repayment required certain contractual premiums, and we recognized a loss of $137.9 million in the third quarter of 2020. On February 16, 2021, we terminated the Term Loan. Please refer to Note 13 for further discussion about the Term Loan.
Table of Contents
61
Other EventsSelby Terminal Fire. On October 15, 2019, our terminal facility in Selby, California experienced a fire that destroyed two storage tanks and temporarily shut down the terminal. The property damage was isolated, and in the fourth quarter of 2019, we incurred losses of $5.4 million, which represent the aggregate amount of our deductibles under various insurance policies. For the year ended December 31, 2020, we received insurance proceeds of $35.0 million, of which $6.7 million was for business interruption and is included in “Operating expenses” in the consolidated statement of loss. Insurance proceeds relate to cleanup costs and business interruption and are therefore included in “Cash flows from operating activities” in the consolidated statement of cash flows. In addition, we received $20.5 million of insurance proceeds in January and February of 2021. We believe we have adequate insurance to offset additional costs.
Sale of St. Eustatius and European Operations. On July 29, 2019, we sold our St. Eustatius terminal and bunkering operations (the St. Eustatius Operations) for net proceeds of approximately $230.0 million (the St. Eustatius Disposition). In 2019, we recorded long-lived asset and goodwill impairment charges totaling $336.8 million related to the St. Eustatius Operations in “(Loss) income from discontinued operations, net of tax” on our consolidated statement of loss. In the second quarter of 2019, we determined the St. Eustatius Operations and the European operations, as discussed below, met the requirements to be reported as discontinued operations, and as a result, we reclassified certain balances to assets and liabilities held for sale and certain revenues and expenses to discontinued operations for all applicable periods presented.
On November 30, 2018, we sold our European operations for approximately $270.0 million (the European Disposition). The operations sold included six liquids storage terminals in the United Kingdom and one facility in Amsterdam with total storage capacity of approximately 9.5 million barrels (the European Operations). We recognized a non-cash loss of $43.4 million related to the sale in “(Loss) income from discontinued operations, net of tax” on our consolidated statement of income for the year ended December 31, 2018. Please refer to Note 4 for further discussion.
Merger. On July 20, 2018, we completed the merger of Holdings with a subsidiary of NS. Under the terms of the merger agreement, Holdings unitholders received 0.55 of a common unit representing a limited partner interest in NS in exchange for each Holdings unit owned at the effective time of the merger. Please refer to Note 5 for further discussion of the merger.
Hurricane Activity. In the third quarter of 2017, several of our facilities were affected by the hurricanes in the Caribbean and Gulf of Mexico, including the St. Eustatius terminal, which experienced the most damage and was temporarily shut down. In 2018, we received the remaining insurance proceeds of $87.5 million in settlement of our property damage claim for the St. Eustatius terminal, of which $9.1 million related to business interruption. Proceeds from business interruption insurance are included in “Cash flows from operating activities” in the consolidated statements of cash flows. We recorded a $78.8 million gain in the consolidated statement of income in 2018 for the amount by which the insurance proceeds exceeded our expenses incurred during the period. The insurance proceeds related to business interruption and the gain are included in “(Loss) income from discontinued operations, net of tax” in the consolidated statements of (loss) income.
OperationsWe conduct our operations through our subsidiaries, primarily NuStar Logistics, L.P. (NuStar Logistics) and NuStar Pipeline Operating Partnership L.P. (NuPOP). We have three business segments: pipeline, storage and fuels marketing.
Pipeline. We own 3,205 miles of refined product pipelines and 2,205 miles of crude oil pipelines, as well as 5.6 million barrels of crude oil storage capacity, which comprise our Central West System. In addition, we own 2,500 miles of refined product pipelines, consisting of the East and North Pipelines, and a 2,000-mile ammonia pipeline, which comprise our Central East System. The East and North Pipelines have storage capacity of 7.4 million barrels. We charge tariffs on a per barrel basis for transporting refined products, crude oil and other feedstocks in our refined product and crude oil pipelines and on a per ton basis for transporting anhydrous ammonia in the Ammonia Pipeline.
Storage. We own terminal and storage facilities in the United States, Canada and Mexico, with 59.0 million barrels of storage capacity. Our terminal and storage facilities provide storage, handling and other services on a fee basis for petroleum products, crude oil, specialty chemicals and other liquids.
Fuels Marketing. The fuels marketing segment includes our bunkering operations in the Gulf Coast, as well as certain of our blending operations associated with our Central East System.
Table of ContentsNUSTAR ENERGY L.P. AND SUBSIDIARIES
NOTES TO CONSOLIDATED FINANCIAL STATEMENTS – (Continued)
62
2. SUMMARY OF SIGNIFICANT ACCOUNTING POLICIES
ConsolidationThe accompanying consolidated financial statements represent the consolidated operations of the Partnership and our subsidiaries. Inter-partnership balances and transactions have been eliminated in consolidation. The operations of certain pipelines and terminals in which we own an undivided interest are proportionately consolidated in the accompanying consolidated financial statements.
Use of EstimatesThe preparation of consolidated financial statements in conformity with U.S. generally accepted accounting principles (GAAP) requires management to make estimates and assumptions that affect the amounts reported in the consolidated financial statements and accompanying notes. Actual results could differ from those estimates. On an ongoing basis, management reviews its estimates based on currently available information. Management may revise estimates due to changes in facts and circumstances.
Cash and Cash EquivalentsCash equivalents are all highly liquid investments with an original maturity of three months or less when acquired.
Accounts ReceivableOn January 1, 2020, we adopted new guidance from the Financial Accounting Standards Board (FASB) on credit losses, as discussed in Note 3. Trade receivables are carried at amortized cost, net of a valuation allowance for current expected credit losses. We extend credit to certain customers after review of various credit indicators, including the customer’s credit rating, and obtain letters of credit, guarantees or collateral as deemed necessary. We monitor our ongoing credit exposure through active review of customer balances against contract terms and due dates and pool customer receivables based upon days outstanding, which is our primary credit risk indicator. Our review activities include timely account reconciliations, dispute resolution and payment confirmations. Prior to adoption of the new guidance, outstanding customer receivable balances were regularly reviewed for possible non-payment indicators and allowances for doubtful accounts were recorded based upon management’s estimate of collectability at the time of its review.
InventoriesInventories consist of petroleum products, materials and supplies. Inventories are valued at the lower of cost or net realizable value. Cost is determined using the weighted-average cost method. Our inventory, other than materials and supplies, consists of one end-product category, petroleum products, which we include in the fuels marketing segment. Accordingly, we determine lower of cost or net realizable value adjustments on an aggregate basis. Materials and supplies are valued at the lower of average cost or net realizable value.
Restricted CashAs of December 31, 2020 and 2019, we have restricted cash representing legally restricted funds that are unavailable for general use totaling $8.8 million, which is included in “Other long-term assets, net” on the consolidated balance sheet.
Property, Plant and EquipmentWe record additions to property, plant and equipment, including reliability and strategic capital expenditures, at cost. Repair and maintenance costs associated with existing assets that are minor in nature and do not extend the useful life of existing assets are charged to operating expenses as incurred. Depreciation of property, plant and equipment is recorded on a straight-line basis over the estimated useful lives of the related assets. When property or equipment is retired, sold or otherwise disposed of, the difference between the carrying value and the net proceeds is recognized in “Other (expense) income, net” or “(Loss) income from discontinued operations, net of tax” in the consolidated statements of (loss) income in the year of disposition. We capitalize overhead costs and interest costs incurred on funds used to construct property, plant and equipment while the asset is under construction. The overhead costs and capitalized interest are recorded as part of the asset to which they relate and are amortized over the asset’s estimated useful life as a component of depreciation expense.
GoodwillWe assess goodwill for impairment annually on October 1, or more frequently if events or changes in circumstances indicate it might be impaired. We have the option to first assess qualitative factors to determine whether it is necessary to perform a quantitative goodwill impairment test. We elected to bypass the qualitative assessment for all reporting units as of October 1, 2020 and performed a quantitative assessment. We performed a qualitative assessment as of October 1, 2019 and determined that goodwill was not impaired.
Table of ContentsNUSTAR ENERGY L.P. AND SUBSIDIARIES
NOTES TO CONSOLIDATED FINANCIAL STATEMENTS – (Continued)
63
We adopted amended accounting guidance in the first quarter of 2019 to measure goodwill impairment as the excess of each reporting unit’s carrying value over its fair value, not to exceed the carrying amount of goodwill for that reporting unit. The carrying value of each reporting unit equals the total identified assets (including goodwill) less the sum of each reporting unit’s identified liabilities. We used reasonable and supportable methods to assign the assets and liabilities to the appropriate reporting units in a consistent manner.
As of December 31, 2020 and 2019, our reporting units to which goodwill has been allocated consisted of the following:• crude oil pipelines;• refined product pipelines; and• terminals, excluding our Point Tupper facility and our refinery crude storage tanks.
As discussed in Note 11, in the first quarter of 2020, we recognized a goodwill impairment charge of $225.0 million associated with the crude oil pipelines reporting unit. In the first quarter of 2019, we recognized a goodwill impairment charge of $31.1 million for the goodwill associated with the Statia Bunkering reporting unit, which consisted of our bunkering operations at the St. Eustatius terminal facility.
We recognize an impairment of goodwill if the carrying value of a reporting unit that contains goodwill exceeds its estimated fair value. In order to estimate the fair value of the reporting unit, including goodwill, management must make certain estimates and assumptions that affect the total fair value of the reporting unit including, among other things, an assessment of market conditions, projected cash flows, discount rates and growth rates. Management’s estimates of projected cash flows related to the reporting unit include, but are not limited to, future earnings of the reporting unit, assumptions about the use or disposition of the asset, estimated remaining life of the asset, and future expenditures necessary to maintain the asset’s existing service potential. We calculate the estimated fair value of each of our reporting units using a weighted-average of values calculated using an income approach and a market approach. The income approach involves estimating the fair value of each reporting unit by discounting its estimated future cash flows using a discount rate that would be consistent with a market participant’s assumption. The market approach bases the fair value measurement on information obtained from observed stock prices of public companies and recent merger and acquisition transaction data of comparable entities.
Although we determined that no impairment charges resulted from our October 1, 2020 impairment assessment, the fair value of the crude oil pipelines reporting unit, which is included in the pipeline reporting segment, exceeded its carrying value by approximately 4%. The goodwill associated with the crude oil pipelines reporting unit totaled $308.6 million as of December 31, 2020. Our estimate of the fair value of the crude oil pipelines reporting unit is sensitive to typical valuation assumptions, particularly our estimates for the weighted-average cost of capital (WACC) used for the income approach and the guideline public company (GPC) multiple used for the market approach. Considering that the carrying value of the reporting unit was written down to its fair value with the first quarter of 2020 impairment charge, as further discussed in Note 11, changes to the WACC or GPC multiple used in our estimate could cause the fair value to be less than the carrying value of the crude oil pipelines reporting unit, resulting in an impairment. The fair values of the refined product pipelines and terminals reporting units substantially exceed their carrying values.
Management’s estimates are based on numerous assumptions about future operations and market conditions, which we believe to be reasonable but are inherently uncertain. The uncertainties underlying our assumptions and estimates could differ significantly from actual results, including with respect to the duration and severity of the COVID-19 pandemic, the extent of travel restrictions, business closures and other efforts to control the spread of COVID-19 and the impact of actions by OPEC+, which could lead to a different determination of the fair value of our assets. We will continue to monitor the business and consider additional interim analysis of goodwill as appropriate.
Impairment of Long-Lived AssetsWe review long-lived assets, including property, plant and equipment, for impairment whenever events or changes in circumstances indicate that the carrying amount may not be recoverable. We evaluate recoverability using undiscounted estimated net cash flows generated by the related asset or asset group. If the results of that evaluation indicate that the undiscounted cash flows are less than the carrying amount of the asset (i.e., the asset is not recoverable) we perform an impairment analysis. If our intent is to hold the asset for continued use, we determine the amount of impairment as the amount by which the net carrying value exceeds its fair value. If our intent is to sell the asset, and the criteria required to classify an asset as held for sale are met, we determine the amount of impairment as the amount by which the net carrying amount exceeds its fair value less costs to sell. As discussed in Note 4, we recognized long-lived asset impairment charges of $305.7 million in 2019 related to the St. Eustatius terminal facility. We believe that the carrying amounts of our long-lived assets as of December 31, 2020 are recoverable.
Table of ContentsNUSTAR ENERGY L.P. AND SUBSIDIARIES
NOTES TO CONSOLIDATED FINANCIAL STATEMENTS – (Continued)
64
Income TaxesWe are a limited partnership and generally are not subject to federal or state income taxes. Accordingly, our taxable income or loss, which may vary substantially from income or loss reported for financial reporting purposes, is generally included in the federal and state income tax returns of our partners. For transfers of publicly held common units subsequent to our initial public offering, we have made an election permitted by Section 754 of the Internal Revenue Code (the Code) to adjust the common unit purchaser’s tax basis in our underlying assets to reflect the purchase price of the units. This results in an allocation of taxable income and expenses to the purchaser of the common units, including depreciation deductions and gains and losses on sales of assets, based upon the new unitholder’s purchase price for the common units.
We conduct certain of our operations through taxable wholly owned corporate subsidiaries. We account for income taxes related to our taxable subsidiaries using the asset and liability method. Under this method, we recognize deferred tax assets and liabilities for the future tax consequences attributable to differences between the financial statement carrying amounts of existing assets and liabilities and their respective tax bases. We measure deferred taxes using enacted tax rates expected to apply to taxable income in the year those temporary differences are expected to be recovered or settled.
We recognize a tax position if it is more likely than not that the tax position will be sustained, based on the technical merits of the position, upon examination. We record uncertain tax positions in the financial statements at the largest amount of benefit that is more likely than not to be realized. We had no unrecognized tax benefits as of December 31, 2020 and 2019. NuStar Energy and certain of its subsidiaries file income tax returns in the U.S. federal jurisdiction and various state and foreign jurisdictions. For U.S. federal and state purposes, as well as for our major non-U.S. jurisdictions, tax years subject to examination are 2016 through 2019, according to standard statute of limitations.
Asset Retirement ObligationsWe record a liability for asset retirement obligations at the fair value of the estimated costs to retire a tangible long-lived asset at the time we incur that liability, which is generally when the asset is purchased, constructed or leased, when we have a legal obligation to incur costs to retire the asset and when a reasonable estimate of the fair value of the obligation can be made. If a reasonable estimate cannot be made at the time the liability is incurred, we record the liability when sufficient information is available to estimate the fair value.
We have asset retirement obligations with respect to certain of our assets due to various legal obligations to clean and/or dispose of those assets at the time they are retired. However, these assets can be used for an extended and indeterminate period of time as long as they are properly maintained and/or upgraded. It is our practice and current intent to maintain our assets and continue making improvements to those assets based on technological advances. As a result, we believe that our assets have indeterminate lives for purposes of estimating asset retirement obligations because dates or ranges of dates upon which we would retire these assets cannot reasonably be estimated at this time. When a date or range of dates can reasonably be estimated for the retirement of any asset, we estimate the costs of performing the retirement activities and record a liability for the fair value of these costs.
We also have legal obligations in the form of leases and right-of-way agreements, which require us to remove certain of our assets upon termination of the agreement. However, these lease or right-of-way agreements generally contain automatic renewal provisions that extend our rights indefinitely or we have other legal means available to extend our rights. Liabilities for conditional asset retirement obligations related to the retirement of terminal assets with lease and right-of-way agreements were not material as of December 31, 2020 and 2019.
Environmental Remediation CostsEnvironmental remediation costs are expensed and an associated accrual established when site restoration and environmental remediation and cleanup obligations are either known or considered probable and can be reasonably estimated. These environmental obligations are based on estimates of probable undiscounted future costs using currently available technology and applying current regulations, as well as our own internal environmental policies. The environmental liabilities have not been reduced by possible recoveries from third parties. Environmental costs include initial site surveys, costs for remediation and restoration and ongoing monitoring costs, as well as fines, damages and other costs, when applicable and estimable. Adjustments to initial estimates are recorded, from time to time, to reflect changing circumstances and estimates based upon additional information developed in subsequent periods.
Table of ContentsNUSTAR ENERGY L.P. AND SUBSIDIARIES
NOTES TO CONSOLIDATED FINANCIAL STATEMENTS – (Continued)
65
Revenue RecognitionRevenue-Generating Activities. Revenues for the pipeline segment are derived from interstate and intrastate pipeline transportation of refined products, crude oil and anhydrous ammonia and the applicable pipeline tariff.
Revenues for the storage segment include fees for tank storage agreements, whereby a customer agrees to pay for a certain amount of storage in a tank over a period of time (storage terminal revenues), and throughput agreements, whereby a customer pays a fee per barrel for volumes moving through our terminals (throughput terminal revenues). Our terminals also provide blending, additive injections, handling and filtering services for which we charge additional fees, and certain of our facilities charge fees to provide marine services such as pilotage, tug assistance, line handling, launch service, emergency response services and other ship services (all of which are considered optional services).
Revenues for the fuels marketing segment are derived from the sale of petroleum products.
Within our pipeline and storage segments, we provide services on uninterruptible and interruptible bases. Uninterruptible services within our pipeline segment typically result from contracts that contain take-or-pay minimum volume commitments (MVCs) from the customer. Contracts with MVCs obligate the customer to pay for that minimum amount. If a customer fails to meet its MVC for the applicable service period, the customer is obligated to pay a deficiency fee based upon the shortfall between the actual volumes transported or stored and the MVC for that service period (deficiency payments). In exchange, those contracts with MVCs obligate us to stand ready to transport volumes up to the customer’s MVC.
Within our storage segment, uninterruptible services arise from contracts containing a fixed monthly fee for the portion of storage capacity reserved by the customer. These contracts require that the customer pay the fixed monthly fee, regardless of whether or not it uses our storage facility (i.e., take-or-pay obligation), and that we stand ready to store that volume. Interruptible services within our pipeline and storage segments are generally provided when and to the extent we determine the requested capacity is available. The customer typically pays a per-unit rate for the actual quantities of services it receives.
For the majority of our contracts, we recognize revenue in the amount to which we have a right to invoice. Generally, payment terms do not exceed 30 days.
Performance Obligations. The majority of our contracts contain a single performance obligation. For our pipeline segment, the single performance obligation encompasses multiple activities necessary to deliver our customers’ products to their destinations. Typically, we satisfy this performance obligation over time as the product volume is delivered in or out of the pipelines. Certain of our pipeline segment customer contracts include an incentive pricing structure, which provides a discounted rate for the remainder of the contract once the customer exceeds a cumulative volume. The ability to receive discounted future services represents a material right to the customer, which results in a second performance obligation in those contracts.
The performance obligation for our storage segment consists of multiple activities necessary to receive, store and deliver our customers’ products. We typically satisfy this performance obligation over time as the product volume is delivered in or out of the tanks (for throughput terminal revenues) or with the passage of time (for storage terminal revenues).
Product sales contracts associated with our fuels marketing segment generally include a single performance obligation to deliver specified volumes of a commodity, which we satisfy at a point in time, when the product is delivered and the customer obtains control of the commodity.
Optional services described in our contracts do not provide a material right to the customer, and are not considered a separate performance obligation in the contract. If and when a customer elects an optional service, and the terms of the contract are otherwise met, those services become part of the existing performance obligation.
Transaction Price. For uninterruptible services, we determine the transaction price at contract inception based on the guaranteed minimum amount of revenue over the term of the contract. For interruptible services and optional services, we determine the transaction price based on our right to invoice the customer for the value of services provided to the customer for the applicable period.
In certain instances, our customers reimburse us for capital projects, in arrangements referred to as contributions in aid of construction, or CIAC. Typically, in these instances, we receive upfront payments for future services, which are included in the transaction price of the underlying service contract.
Table of ContentsNUSTAR ENERGY L.P. AND SUBSIDIARIES
NOTES TO CONSOLIDATED FINANCIAL STATEMENTS – (Continued)
66
We collect taxes on certain revenue transactions to be remitted to governmental authorities, which may include sales, use, value-added and some excise taxes. These taxes are not included in the transaction price and are, therefore, excluded from revenues.
Allocation of Transaction Price. We allocate the transaction price to the single performance obligation that exists in the vast majority of our contracts with customers. For the few contracts that have a second performance obligation, such as those that include an incentive pricing structure, we calculate an average rate based on the estimated total volumes to be delivered over the term of the contract and the resulting estimated total revenue to be billed using the applicable rates in the contract. We allocate the transaction price to the two performance obligations by applying the average rate to product volumes as they are delivered to the customer over the term of the contract. Determining the timing and amount of volumes subject to these incentive pricing contracts requires judgment that can impact the amount of revenue allocated to the two separate performance obligations. We base our estimates on our analysis of expected future production information available from our customers or other sources, which we update at least quarterly.
Some of our MVC contracts include provisions that allow the customer to apply deficiency payments to future service periods (the carryforward period). In those instances, we have not satisfied our performance obligation as we still have the obligation to perform those services, subject to contractual and/or capacity constraints, at the customer’s request. At least quarterly, we assess the customer’s ability to utilize any deficiency payments during the carryforward period. If we receive a deficiency payment from a customer that we expect the customer to utilize during the carryforward period, we defer that amount as a contract liability. We will consider the performance obligation satisfied and allocate any deferred deficiency payments to our performance obligation when the customer utilizes the deficiency payment, the carryforward period ends or we determine the customer cannot or will not utilize the deficiency payment (i.e. breakage). If our contract does not allow the customer to apply deficiency payments to future service periods, we allocate the deficiency payment to the already satisfied portion of the performance obligation.
Income AllocationOur partnership agreement contains provisions for the allocation of net income to the unitholders and, prior to the merger with our general partner, to the general partner. Our net income for each quarterly reporting period is first allocated to the preferred limited partner unitholders in an amount equal to the earned distributions for the respective reporting period and, prior to the merger, then to the general partner in an amount equal to the general partner’s incentive distribution calculated based upon the declared distribution for the respective reporting period. We allocate the remaining net income or loss among the common unitholders. Prior to the merger, we allocated the remaining net income or loss among the common unitholders (98%) and general partner (2%). See Note 5 for further discussion of the merger.
Basic and Diluted Net (Loss) Income Per Common UnitBasic and diluted net (loss) income per common unit are determined pursuant to the two-class method. Under this method, all earnings are allocated to our limited partners and participating securities based on their respective rights to receive distributions earned during the period. Participating securities include restricted units awarded under our long-term incentive plans and, prior to the merger with our general partner, included our general partner’s interest.
We compute basic net (loss) income per common unit by dividing net (loss) income attributable to our common limited partners by the weighted-average number of common units outstanding during the period. We compute diluted net (loss) income per common unit by dividing net (loss) income attributable to our common limited partners by the sum of (i) the weighted-average number of common units outstanding during the period and (ii) the effect of dilutive potential common units outstanding during the period. Dilutive potential common units include contingently issuable performance units awarded and the Series D Preferred Units. See Note 23 for additional information on our performance units, Note 18 for additional information on our Series D Preferred Units and Note 20 for the calculation of basic and diluted net (loss) income per common unit.
Derivative Financial InstrumentsWhen we apply hedge accounting, we formally document all relationships between hedging instruments and hedged items. This process includes identification of the hedging instrument and the hedged transaction, the nature of the risk being hedged and how the hedging instrument’s effectiveness will be assessed. To qualify for hedge accounting, at inception of the hedge we assess whether the derivative instruments that are used in our hedging transactions are expected to be highly effective in offsetting changes in cash flows. Throughout the designated hedge period and at least quarterly, we assess whether the derivative instruments are highly effective and continue to qualify for hedge accounting.
Table of ContentsNUSTAR ENERGY L.P. AND SUBSIDIARIES
NOTES TO CONSOLIDATED FINANCIAL STATEMENTS – (Continued)
67
We enter into the forward-starting swaps in order to hedge the risk of changes in the interest payments attributable to changes in the benchmark interest rate during the period from the effective date of the swap to the issuance of the forecasted debt. For forward-starting interest rate swaps designated and qualifying as cash flow hedges, we recognize the fair value of each interest rate swap in the consolidated balance sheets. We record changes in the fair value of the hedge as a component of accumulated other comprehensive income (loss) (AOCI), to the extent those cash flow hedges remain highly effective. If at any point a cash flow hedge ceases to qualify for hedge accounting, changes in the fair value of the hedge are recognized in “Interest expense, net” from that date forward. The amount accumulated in AOCI is amortized into “Interest expense, net” as the forecasted interest payments occur or if the interest payments are probable not to occur.
We classify cash flows associated with our derivative instruments as operating cash flows in the consolidated statements of cash flows, except for receipts or payments associated with terminated forward-starting interest rate swap agreements, which are included in cash flows from financing activities. See Note 17 for additional information regarding our derivative financial instruments.
Unit-based Compensation Unit-based compensation for our long-term incentive plans is recorded in our consolidated balance sheets based on the fair value of the awards granted and recognized as compensation expense primarily on a straight-line basis over the requisite service period. Forfeitures of our unit-based compensation awards are recognized as an adjustment to compensation expense when they occur. Unit-based compensation expense is included in “General and administrative expenses” on our consolidated statements of (loss) income. Most of our currently outstanding awards are classified as equity awards as we intend to settle these awards through the issuance of our common units. See Note 23 for additional information regarding our unit-based compensation.
Foreign Currency TranslationThe functional currencies of our foreign subsidiaries are the local currencies of the countries in which the subsidiaries are located. The assets and liabilities of our foreign subsidiaries with local functional currencies are translated to U.S. dollars at period-end exchange rates, and income and expense items are translated to U.S. dollars at weighted-average exchange rates in effect during the period. These translation adjustments are included in “Accumulated other comprehensive loss” in the equity section of the consolidated balance sheets. Gains and losses on foreign currency transactions are included in “Other (expense) income, net” or “(Loss) income from discontinued operations, net of tax” in the consolidated statements of (loss) income.
ReclassificationsWe have reclassified certain previously reported amounts in the consolidated financial statements and notes to conform to current-period presentation.
3. NEW ACCOUNTING PRONOUNCEMENTS
Management’s Discussion and Analysis, Selected Financial Data, and Supplementary Financial Information In November 2020, the Securities and Exchange Commission (SEC) issued final rules to modernize, simplify, and enhance certain financial disclosure requirements in Regulation S-K. Among other changes, the amended guidance eliminates the requirements to present five-year selected financial data and the two-year quarterly financial data table in the Annual Report on Form 10-K. The rule changes became effective on February 10, 2021, and we are required to apply the amended rules in our filings for the fiscal year ending on December 31, 2021. Early application by amended Regulation S-K item is permitted any time after the effective date. We elected to apply provisions related to selected financial data and quarterly financial information in our Annual Report on Form 10-K for the year ended December 31, 2020 and expect to apply the remaining provisions in our Annual Report on Form 10-K for the year ended December 31, 2021.
Accounting for Convertible Instruments and Contracts in an Entity’s Own EquityIn August 2020, the FASB issued guidance intended to simplify the accounting for convertible instruments by eliminating certain accounting models for convertible debt instruments and convertible preferred stock. In addition, the guidance amends the derivatives scope exception for contracts in an entity’s own equity, the disclosure requirements for convertible instruments, and certain earnings-per-unit guidance. The guidance is effective for annual periods beginning after December 15, 2021, and early adoption is permitted for annual periods beginning after December 15, 2020. Amendments may be applied using either a modified retrospective approach or a fully retrospective approach. We plan to adopt the amended guidance on January 1, 2022 and are currently assessing the impact of this amended guidance on our financial position, results of operations and disclosures. We plan to provide additional information about the expected impact at a future date.
Table of ContentsNUSTAR ENERGY L.P. AND SUBSIDIARIES
NOTES TO CONSOLIDATED FINANCIAL STATEMENTS – (Continued)
68
Reference Rate ReformIn March 2020, the FASB issued guidance intended to provide relief to companies impacted by reference rate reform. The amended guidance provides optional expedients and exceptions for applying GAAP to contracts, hedging relationships and other transactions affected by reference rate reform if certain criteria are met. Our variable-rate debt instruments use LIBOR as a benchmark for establishing the interest rate. In addition, the distribution rates on our Series A, B and C preferred units convert from fixed rates to floating rates based on LIBOR, beginning in December 2021, June 2022 and December 2022, respectively. The U.K. Financial Conduct Authority has announced its expectation that the publication of U.S. dollar LIBOR rates for the most common tenors will cease after publication on June 30, 2023, instead of on December 31, 2021 as previously expected. The FASB’s guidance is effective as of March 12, 2020 through December 31, 2022. We adopted the guidance on the effective date on a prospective basis. The guidance did not have an impact on our financial position, results of operations or disclosures at transition, but we will continue to evaluate its impact on contracts and hedging relationships modified on or before December 31, 2022.
Financial Disclosures about Guarantors and Issuers of Guaranteed SecuritiesIn March 2020, the SEC issued final rules regarding presentation of financial information for issuer and guarantor entities. The final rules reduce the number of periods for which issuer and guarantor financial information is required and allow presentation of summarized financial information in lieu of separate financial statements, either in Management’s Discussion and Analysis or in the Notes to the Financial Statements in the periodic reports on Form 10-K and Form 10-Q. The guidance is effective for fiscal periods ending after January 4, 2021, with early adoption permitted. We elected to early adopt the guidance and began presenting financial information related to our issuer and guarantor entities in accordance with the final rules in the “Liquidity and Capital Resources” section of Items 1., 2. and 7. “Business, Properties and Management’s Discussion and Analysis of Financial Condition and Results of Operations” of this report. The adoption resulted in a reduction of our guarantor financial statement disclosures but did not impact our financial condition or results of operations.
Simplifying the Accounting for Income TaxesIn December 2019, the FASB issued amended guidance that simplifies the accounting for income taxes, including enacted changes in tax laws in interim periods. The guidance is effective for annual and interim periods beginning after December 15, 2020, with early adoption permitted. These provisions should be applied retrospectively, prospectively, or on a modified retrospective basis depending on the area affected by the amended guidance. We adopted the amended guidance on January 1, 2021, and the guidance did not have a material impact on our financial position, results of operations or disclosures.
Cloud Computing ArrangementsIn August 2018, the FASB issued guidance addressing a customer’s accounting for implementation costs incurred in a cloud computing arrangement (CCA) that is considered a service contract. The new guidance specifies that an entity would apply the capitalization criteria for implementation costs related to internal-use software to determine which implementation costs related to a CCA that is a service contract should be capitalized and which should be expensed. The amendments also require that capitalized implementation costs be classified in the same balance sheet line item as prepayments related to the CCA and, generally, amortized on a straight-line basis over the term of the CCA. Amortization of capitalized implementation costs should be presented in the same income statement line item as CCA service fees, and cash flows for capitalized implementation costs should be presented consistently with those related to the CCA service. The guidance is effective for annual and interim periods beginning after December 15, 2019, with early adoption permitted. Prospective adoption for eligible costs incurred on or after the date of adoption or retrospective adoption is permitted. We adopted the guidance on January 1, 2020 on a prospective basis, and the guidance did not have a material impact on our financial position, results of operations or disclosures.
Disclosures for Defined Benefit PlansIn August 2018, the FASB issued amended guidance that makes minor changes to the disclosure requirements for employers that sponsor defined benefit pension and/or other postretirement benefit plans. The guidance is effective for annual periods ending after December 15, 2020, with early adoption permitted, using a retrospective approach. We adopted the amended guidance for the year ended December 31, 2020, and the guidance did not have a material impact on our disclosures.
Credit LossesIn June 2016, the FASB issued amended guidance that requires the use of a “current expected loss” model for financial assets measured at amortized cost and certain off-balance sheet credit exposures. Under this model, entities will be required to estimate the lifetime expected credit losses on such instruments based on historical experience, current conditions, and reasonable and supportable forecasts. This amended guidance also expands the disclosure requirements to enable users of financial statements to understand an entity’s assumptions, models and methods for estimating expected credit losses. The changes are effective for annual and interim periods beginning after December 15, 2019, and amendments should be applied
Table of ContentsNUSTAR ENERGY L.P. AND SUBSIDIARIES
NOTES TO CONSOLIDATED FINANCIAL STATEMENTS – (Continued)
69
using a modified retrospective approach. We adopted the amended guidance on January 1, 2020, and the amended guidance did not have a material impact on our financial position, results of operations or disclosures.
4. DISPOSITIONS AND DISCONTINUED OPERATIONS
Sale of Texas City Terminals On December 7, 2020, we sold the equity interests in our wholly owned subsidiaries that owned two terminals in Texas City, Texas for $106.0 million, subject to adjustment (the Texas City Sale). The two terminals have an aggregate storage capacity of 3.0 million barrels and were previously included in our storage segment. We recorded a non-cash loss of $34.7 million in “Other (expense) income, net” on our consolidated statement of loss for the year ended December 31, 2020 and utilized the sales proceeds to improve our debt metrics.
Sale of St. Eustatius OperationsImpairments. On January 28, 2019, the U.S. Department of the Treasury’s Office of Foreign Assets Control added Petroleos de Venezuela, S.A. (PDVSA), at the time a customer at the St. Eustatius facility, to its List of Specially Designated Nationals and Blocked Persons (the SDN List). The inclusion of PDVSA on the SDN List required us to wind down our contracts with PDVSA. Prior to winding down such contracts, PDVSA was the St. Eustatius terminal’s largest customer. The effect of the sanctions issued against PDVSA, combined with the progression in the sale negotiations that occurred during March 2019, resulted in triggering events that caused us to evaluate the long-lived assets and goodwill associated with the St. Eustatius terminal and bunkering operations for potential impairment.
With respect to the terminal operations long-lived assets, our estimates of future expected cash flows included the possibility of a near-term sale, as well as continuing to operate the terminal. The carrying value of the terminal’s long-lived assets exceeded our estimate of the total expected cash flows, indicating the long-lived assets were potentially impaired. To determine an impairment amount, we estimated the fair value of the long-lived assets for comparison to the carrying amount of those assets. Our estimate of the fair value considered the expected sales price as well as estimates generated from income and market approaches using a market participant’s assumptions. The estimated fair values resulting from the market and income approaches were consistent with the expected sales price. Therefore, we concluded that the estimated sales price, which was less than the carrying amount of the long-lived assets, represented the best estimate of fair value at March 31, 2019, and we recorded a long-lived asset impairment charge of $297.3 million in the first quarter of 2019 to reduce the carrying value of the assets to their estimated fair value. We recorded an additional impairment charge of $8.4 million in the second quarter of 2019, mainly due to additional capital expenditures incurred in the second quarter.
With respect to the goodwill in the Statia Bunkering reporting unit, which consisted of our bunkering operations at the St. Eustatius terminal facility, we estimated the fair value based on the expected sales price discussed above, which is inclusive of the bunkering operations. As a result, we concluded the goodwill was impaired. Consistent with FASB’s amended goodwill impairment guidance discussed in Note 2, which we adopted in the first quarter of 2019, we measured the goodwill impairment as the difference between the reporting unit’s carrying value and its fair value. Therefore, we recognized a goodwill impairment charge of $31.1 million in the first quarter of 2019 to reduce the goodwill to $0 for the Statia Bunkering reporting unit.
The impairment charges are included in “(Loss) income from discontinued operations, net of tax” on the consolidated statement of loss.
Discontinued Operations. During the second quarter of 2019, we determined the assets and liabilities associated with the St. Eustatius Operations met the criteria to be classified as held for sale. We determined the St. Eustatius Operations and the European Operations, discussed below, met the requirements to be reported as discontinued operations since the St. Eustatius Disposition and the European Disposition together represented a strategic shift that will have a major impact on our operations and financial results. These sales were part of our plan to improve our debt metrics and partially fund capital projects to grow our core business in North America. Accordingly, the consolidated balance sheet reflects the assets and liabilities associated with the St. Eustatius Operations as held for sale as of December 31, 2018, and the consolidated statements of (loss) income reflect the St. Eustatius Operations and the European Operations as discontinued operations for all applicable periods presented.
On July 29, 2019, we sold the St. Eustatius Operations for net proceeds of approximately $230.0 million. The St. Eustatius Disposition included a 14.3 million barrel storage and terminalling facility and related assets on the island of St. Eustatius in the Caribbean Netherlands. We previously reported the terminal operations in our storage segment and the bunkering operations in our fuels marketing segment. We recognized a non-cash loss on the sale of $3.9 million in “(Loss) income from discontinued operations, net of tax” on the consolidated statement of loss in 2019.
Table of ContentsNUSTAR ENERGY L.P. AND SUBSIDIARIES
NOTES TO CONSOLIDATED FINANCIAL STATEMENTS – (Continued)
70
On November 30, 2018, we sold our European Operations for approximately $270.0 million. The European Operations were previously reported in our storage segment. In association with the European Disposition, we recognized a non-cash loss of $43.4 million in “(Loss) income from discontinued operations, net of tax” on the consolidated statement of income for the year ended December 31, 2018.
The following is a reconciliation of the major classes of line items included in “(Loss) income from discontinued operations, net of tax” on the consolidated statements of (loss) income:
Year Ended December 31, 2019 2018
(Thousands of Dollars)
Revenues $ 248,981 $ 441,495 Costs and expenses:
Cost of revenues 220,595 407,256 Impairment losses 336,838 — General and administrative expenses (excluding depreciation and amortization expense) 1,231 6,133 Other depreciation and amortization expense — 271
Total costs and expenses 558,664 413,660 Operating (loss) income (309,683) 27,835
Interest income (expense), net 32 (1,839) Other (expense) income, net (2,775) 34,674
(Loss) income from discontinued operations before income tax expense (312,426) 60,670 Income tax expense 101 1,251
(Loss) income from discontinued operations, net of tax $ (312,527) $ 59,419
The consolidated statements of cash flows have not been adjusted to separately disclose cash flows related to discontinued operations. The following table presents selected cash flow information associated with our discontinued operations:
Year Ended December 31, 2019 2018
(Thousands of Dollars)
Capital expenditures $ (27,954) $ (114,811)
Significant noncash operating activities and other adjustments:Depreciation and amortization expense $ 8,536 $ 41,982 Asset impairment losses $ 305,715 $ — Goodwill impairment loss $ 31,123 $ — Loss from sale of the St. Eustatius Operations $ 3,942 $ — Loss from sale of the European Operations $ — $ 43,366 Gain from insurance recoveries $ — $ (78,756)
5. MERGER AND RELATED PARTY AGREEMENTS
On July 20, 2018, we completed the merger of Holdings with a subsidiary of NuStar Energy (the Merger). Pursuant to the Merger agreement and at the effective time of the Merger, NuStar Energy’s partnership agreement was amended and restated to, among other things, (i) cancel the incentive distribution rights held by our general partner, (ii) convert the 2% general partner interest in NuStar Energy held by our general partner into a non-economic management interest and (iii) provide the holders of our common units with voting rights in the election of the members of the board of directors of NuStar GP, LLC, beginning at the annual meeting in 2019.
At the effective time of the Merger, each outstanding Holdings common unit was converted into the right to receive 0.55 of a NuStar Energy common unit and all Holdings common units ceased to be outstanding. As a result of the Merger, we issued
Table of ContentsNUSTAR ENERGY L.P. AND SUBSIDIARIES
NOTES TO CONSOLIDATED FINANCIAL STATEMENTS – (Continued)
71
approximately 23.6 million NuStar Energy common units and cancelled the 10.2 million NuStar Energy common units owned by subsidiaries of Holdings, resulting in approximately 13.4 million incremental NuStar Energy common units outstanding after the Merger. In addition, we repaid Holdings’ debt with borrowings under our revolving credit agreement and incurred transaction costs for aggregate cash consideration of approximately $68.0 million.
Also at the effective time of the Merger, each outstanding award of Holdings restricted units was converted, on the same terms and conditions as were applicable to the awards immediately prior to the Merger, into an award of NuStar Energy restricted units. The number of NuStar Energy restricted units subject to the converted awards was determined pursuant to the 0.55 exchange ratio provided in the Merger Agreement.
Following the completion of the Merger, the NuStar GP, LLC board of directors consists of nine members, currently composed of the six members of the NuStar GP, LLC board of directors prior to the Merger and the three independent directors who served prior to the Merger on Holdings’ board of directors.
We accounted for the Merger as an equity transaction similar to a redemption or induced conversion of preferred stock. The excess of (x) the fair value of the consideration transferred in exchange for the outstanding Holdings units over (y) the carrying value of the general partner interest in the Partnership was subtracted from net income available to common unitholders in the calculation of net loss per common unit attributable to the Merger as follows (in thousands of dollars, except unit and per unit data):
Consideration transferred:Fair value of incremental NS common units issued $ 335,106 Holdings debt and assumed net current liabilities 52,075 Transaction costs 15,897 Total consideration 403,078
Carrying value of general partner interest 25,999 Loss to common unitholders attributable to the Merger $ (377,079)
For the year ended December 31, 2018:Basic weighted-average common units outstanding 99,490,495 Loss per common unit attributable to the Merger $ (3.79)
Related Party Agreements with HoldingsGP Services Agreement. Prior to the Merger, we were a party to an Amended and Restated Services Agreement with NuStar GP, LLC, effective March 1, 2016 (the Amended GP Services Agreement), which provided that we furnish administrative services necessary to conduct the business of Holdings, and Holdings compensated us for these services for an annual fee of $1.0 million, subject to adjustment based on the annual merit increase percentage applicable to our employees for the most recently completed fiscal year and for changes in level of service. We terminated the Amended GP Services Agreement in conjunction with the Merger.
Non-Compete Agreement. Prior to the Merger, we were a party to a non-compete agreement with Holdings, Riverwalk Logistics, L.P. and NuStar GP, LLC, effective on December 22, 2006 (the Non-Compete Agreement). Under the Non-Compete Agreement, we had the right of first refusal with respect to the potential acquisition of assets related to the transportation, storage or terminalling of crude oil, feedstocks or refined products (including petrochemicals) in the United States and internationally. Holdings had a right of first refusal with respect to the potential acquisition of general partner and other equity interests in publicly traded partnerships under common ownership with the general partner interest. As a result of the Merger, the Non-Compete Agreement was terminated, effective July 20, 2018.
Table of ContentsNUSTAR ENERGY L.P. AND SUBSIDIARIES
NOTES TO CONSOLIDATED FINANCIAL STATEMENTS – (Continued)
72
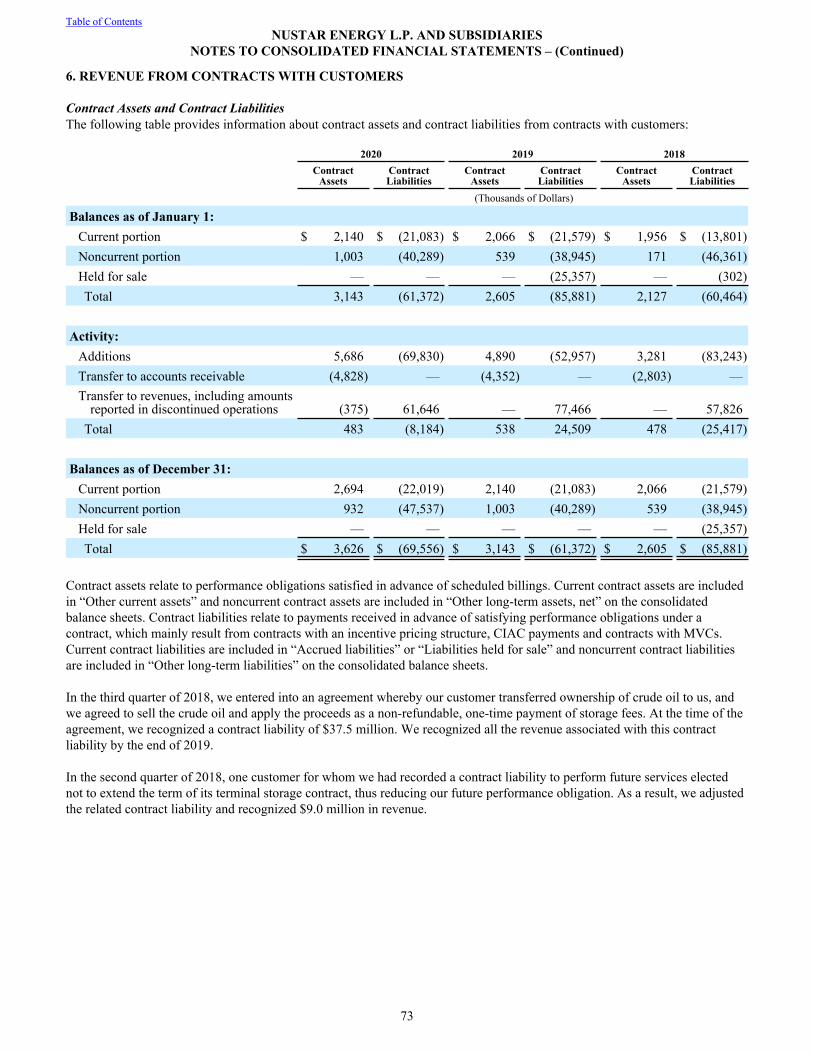
6. REVENUE FROM CONTRACTS WITH CUSTOMERS
Contract Assets and Contract LiabilitiesThe following table provides information about contract assets and contract liabilities from contracts with customers:
2020 2019 2018Contract
AssetsContract Liabilities
Contract Assets
Contract Liabilities
Contract Assets
Contract Liabilities
(Thousands of Dollars)
Balances as of January 1:Current portion $ 2,140 $ (21,083) $ 2,066 $ (21,579) $ 1,956 $ (13,801) Noncurrent portion 1,003 (40,289) 539 (38,945) 171 (46,361) Held for sale — — — (25,357) — (302) Total 3,143 (61,372) 2,605 (85,881) 2,127 (60,464)
Activity:Additions 5,686 (69,830) 4,890 (52,957) 3,281 (83,243) Transfer to accounts receivable (4,828) — (4,352) — (2,803) — Transfer to revenues, including amounts
reported in discontinued operations (375) 61,646 — 77,466 — 57,826 Total 483 (8,184) 538 24,509 478 (25,417)
Balances as of December 31:Current portion 2,694 (22,019) 2,140 (21,083) 2,066 (21,579) Noncurrent portion 932 (47,537) 1,003 (40,289) 539 (38,945) Held for sale — — — — — (25,357) Total $ 3,626 $ (69,556) $ 3,143 $ (61,372) $ 2,605 $ (85,881)
Contract assets relate to performance obligations satisfied in advance of scheduled billings. Current contract assets are included in “Other current assets” and noncurrent contract assets are included in “Other long-term assets, net” on the consolidated balance sheets. Contract liabilities relate to payments received in advance of satisfying performance obligations under a contract, which mainly result from contracts with an incentive pricing structure, CIAC payments and contracts with MVCs. Current contract liabilities are included in “Accrued liabilities” or “Liabilities held for sale” and noncurrent contract liabilities are included in “Other long-term liabilities” on the consolidated balance sheets.
In the third quarter of 2018, we entered into an agreement whereby our customer transferred ownership of crude oil to us, and we agreed to sell the crude oil and apply the proceeds as a non-refundable, one-time payment of storage fees. At the time of the agreement, we recognized a contract liability of $37.5 million. We recognized all the revenue associated with this contract liability by the end of 2019.
In the second quarter of 2018, one customer for whom we had recorded a contract liability to perform future services elected not to extend the term of its terminal storage contract, thus reducing our future performance obligation. As a result, we adjusted the related contract liability and recognized $9.0 million in revenue.
Table of ContentsNUSTAR ENERGY L.P. AND SUBSIDIARIES
NOTES TO CONSOLIDATED FINANCIAL STATEMENTS – (Continued)
73
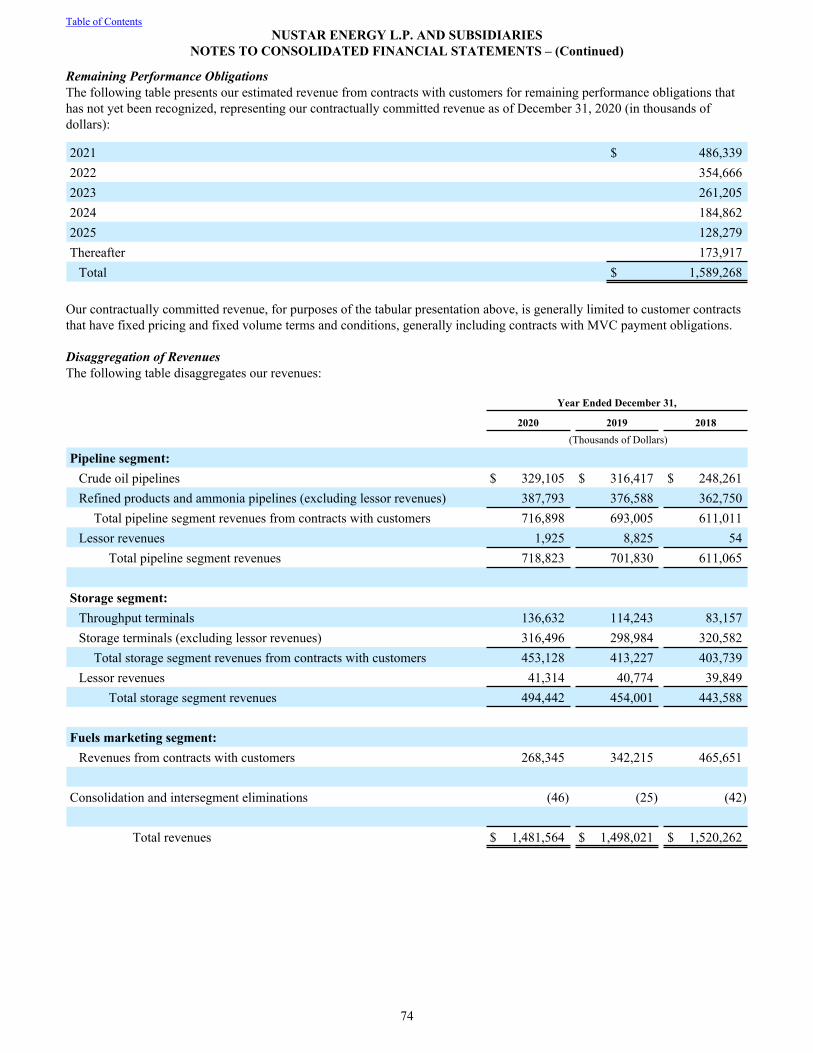
Remaining Performance ObligationsThe following table presents our estimated revenue from contracts with customers for remaining performance obligations that has not yet been recognized, representing our contractually committed revenue as of December 31, 2020 (in thousands of dollars):
2021 $ 486,339 2022 354,666 2023 261,205 2024 184,862 2025 128,279 Thereafter 173,917
Total $ 1,589,268
Our contractually committed revenue, for purposes of the tabular presentation above, is generally limited to customer contracts that have fixed pricing and fixed volume terms and conditions, generally including contracts with MVC payment obligations.
Disaggregation of RevenuesThe following table disaggregates our revenues:
Year Ended December 31,
2020 2019 2018(Thousands of Dollars)
Pipeline segment:Crude oil pipelines $ 329,105 $ 316,417 $ 248,261 Refined products and ammonia pipelines (excluding lessor revenues) 387,793 376,588 362,750
Total pipeline segment revenues from contracts with customers 716,898 693,005 611,011 Lessor revenues 1,925 8,825 54
Total pipeline segment revenues 718,823 701,830 611,065
Storage segment:Throughput terminals 136,632 114,243 83,157 Storage terminals (excluding lessor revenues) 316,496 298,984 320,582
Total storage segment revenues from contracts with customers 453,128 413,227 403,739 Lessor revenues 41,314 40,774 39,849
Total storage segment revenues 494,442 454,001 443,588
Fuels marketing segment:Revenues from contracts with customers 268,345 342,215 465,651
Consolidation and intersegment eliminations (46) (25) (42)
Total revenues $ 1,481,564 $ 1,498,021 $ 1,520,262
Table of ContentsNUSTAR ENERGY L.P. AND SUBSIDIARIES
NOTES TO CONSOLIDATED FINANCIAL STATEMENTS – (Continued)
74
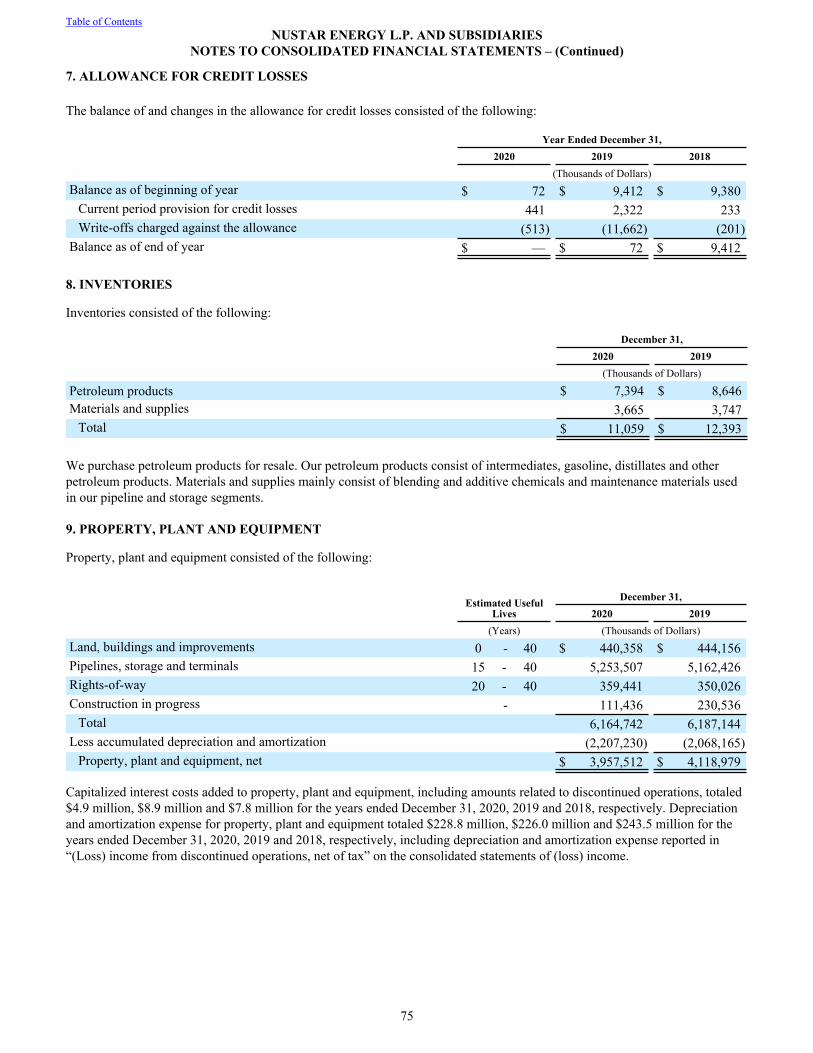
7. ALLOWANCE FOR CREDIT LOSSES
The balance of and changes in the allowance for credit losses consisted of the following:
Year Ended December 31, 2020 2019 2018 (Thousands of Dollars)Balance as of beginning of year $ 72 $ 9,412 $ 9,380
Current period provision for credit losses 441 2,322 233 Write-offs charged against the allowance (513) (11,662) (201)
Balance as of end of year $ — $ 72 $ 9,412
8. INVENTORIES
Inventories consisted of the following:
December 31, 2020 2019 (Thousands of Dollars)
Petroleum products $ 7,394 $ 8,646 Materials and supplies 3,665 3,747
Total $ 11,059 $ 12,393
We purchase petroleum products for resale. Our petroleum products consist of intermediates, gasoline, distillates and other petroleum products. Materials and supplies mainly consist of blending and additive chemicals and maintenance materials used in our pipeline and storage segments.
9. PROPERTY, PLANT AND EQUIPMENT
Property, plant and equipment consisted of the following:
Estimated Useful Lives
December 31, 2020 2019 (Years) (Thousands of Dollars)Land, buildings and improvements 0 - 40 $ 440,358 $ 444,156 Pipelines, storage and terminals 15 - 40 5,253,507 5,162,426 Rights-of-way 20 - 40 359,441 350,026 Construction in progress - 111,436 230,536
Total 6,164,742 6,187,144 Less accumulated depreciation and amortization (2,207,230) (2,068,165)
Property, plant and equipment, net $ 3,957,512 $ 4,118,979
Capitalized interest costs added to property, plant and equipment, including amounts related to discontinued operations, totaled $4.9 million, $8.9 million and $7.8 million for the years ended December 31, 2020, 2019 and 2018, respectively. Depreciation and amortization expense for property, plant and equipment totaled $228.8 million, $226.0 million and $243.5 million for the years ended December 31, 2020, 2019 and 2018, respectively, including depreciation and amortization expense reported in “(Loss) income from discontinued operations, net of tax” on the consolidated statements of (loss) income.
Table of ContentsNUSTAR ENERGY L.P. AND SUBSIDIARIES
NOTES TO CONSOLIDATED FINANCIAL STATEMENTS – (Continued)
75
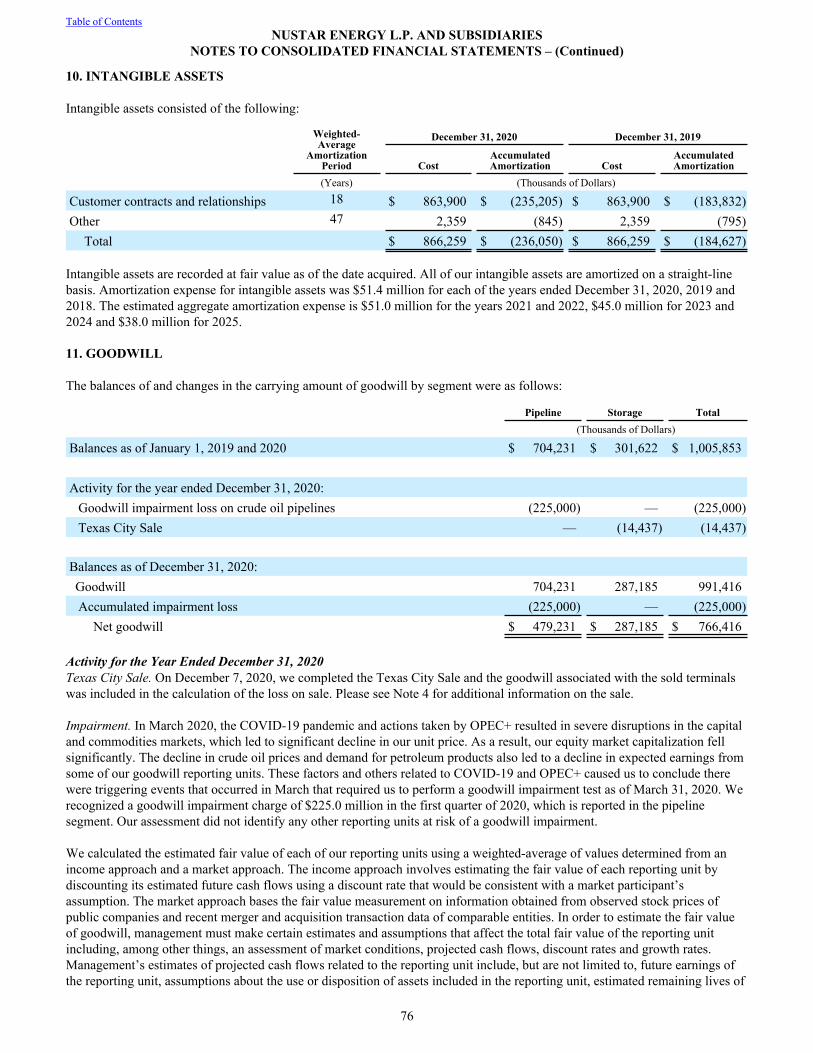
10. INTANGIBLE ASSETS
Intangible assets consisted of the following:
Weighted-Average
Amortization Period
December 31, 2020 December 31, 2019
CostAccumulatedAmortization Cost
AccumulatedAmortization
(Years) (Thousands of Dollars)
Customer contracts and relationships 18 $ 863,900 $ (235,205) $ 863,900 $ (183,832) Other 47 2,359 (845) 2,359 (795)
Total $ 866,259 $ (236,050) $ 866,259 $ (184,627)
Intangible assets are recorded at fair value as of the date acquired. All of our intangible assets are amortized on a straight-line basis. Amortization expense for intangible assets was $51.4 million for each of the years ended December 31, 2020, 2019 and 2018. The estimated aggregate amortization expense is $51.0 million for the years 2021 and 2022, $45.0 million for 2023 and 2024 and $38.0 million for 2025.
11. GOODWILL
The balances of and changes in the carrying amount of goodwill by segment were as follows:
Pipeline Storage Total (Thousands of Dollars)
Balances as of January 1, 2019 and 2020 $ 704,231 $ 301,622 $ 1,005,853
Activity for the year ended December 31, 2020:Goodwill impairment loss on crude oil pipelines (225,000) — (225,000) Texas City Sale — (14,437) (14,437)
Balances as of December 31, 2020:Goodwill 704,231 287,185 991,416 Accumulated impairment loss (225,000) — (225,000)
Net goodwill $ 479,231 $ 287,185 $ 766,416
Activity for the Year Ended December 31, 2020Texas City Sale. On December 7, 2020, we completed the Texas City Sale and the goodwill associated with the sold terminals was included in the calculation of the loss on sale. Please see Note 4 for additional information on the sale.
Impairment. In March 2020, the COVID-19 pandemic and actions taken by OPEC+ resulted in severe disruptions in the capital and commodities markets, which led to significant decline in our unit price. As a result, our equity market capitalization fell significantly. The decline in crude oil prices and demand for petroleum products also led to a decline in expected earnings from some of our goodwill reporting units. These factors and others related to COVID-19 and OPEC+ caused us to conclude there were triggering events that occurred in March that required us to perform a goodwill impairment test as of March 31, 2020. We recognized a goodwill impairment charge of $225.0 million in the first quarter of 2020, which is reported in the pipeline segment. Our assessment did not identify any other reporting units at risk of a goodwill impairment.
We calculated the estimated fair value of each of our reporting units using a weighted-average of values determined from an income approach and a market approach. The income approach involves estimating the fair value of each reporting unit by discounting its estimated future cash flows using a discount rate that would be consistent with a market participant’s assumption. The market approach bases the fair value measurement on information obtained from observed stock prices of public companies and recent merger and acquisition transaction data of comparable entities. In order to estimate the fair value of goodwill, management must make certain estimates and assumptions that affect the total fair value of the reporting unit including, among other things, an assessment of market conditions, projected cash flows, discount rates and growth rates. Management’s estimates of projected cash flows related to the reporting unit include, but are not limited to, future earnings of the reporting unit, assumptions about the use or disposition of assets included in the reporting unit, estimated remaining lives of
Table of ContentsNUSTAR ENERGY L.P. AND SUBSIDIARIES
NOTES TO CONSOLIDATED FINANCIAL STATEMENTS – (Continued)
76
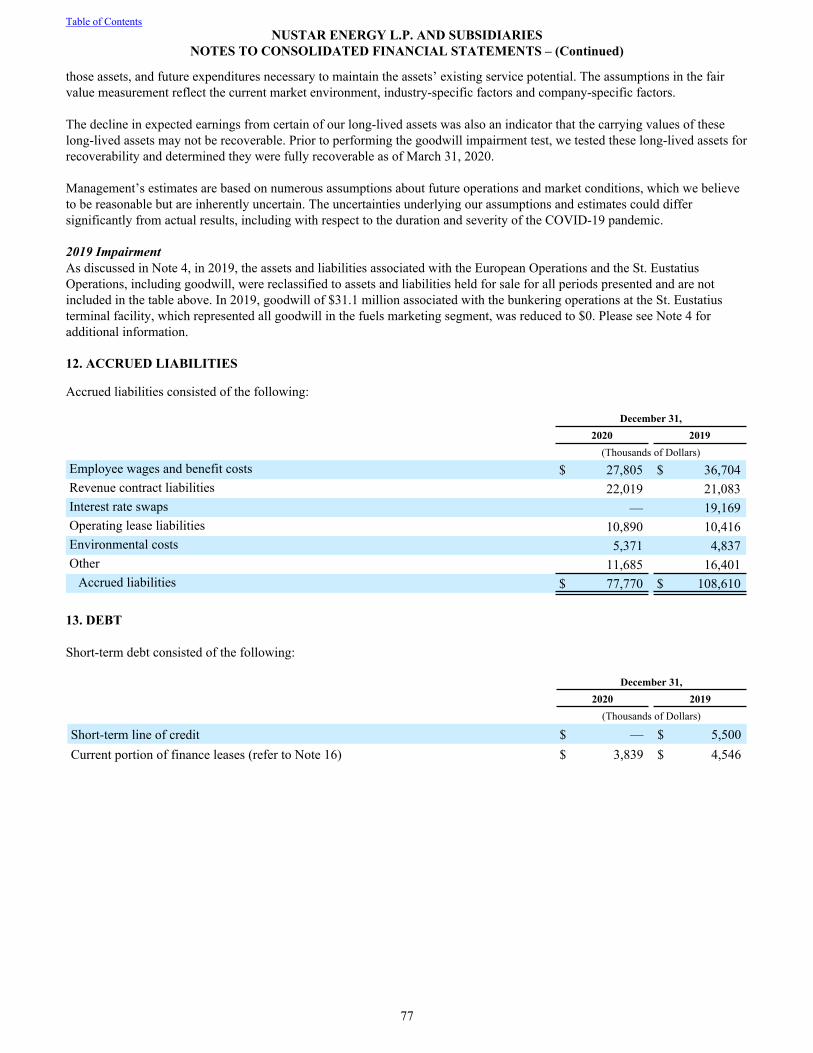
those assets, and future expenditures necessary to maintain the assets’ existing service potential. The assumptions in the fair value measurement reflect the current market environment, industry-specific factors and company-specific factors.
The decline in expected earnings from certain of our long-lived assets was also an indicator that the carrying values of these long-lived assets may not be recoverable. Prior to performing the goodwill impairment test, we tested these long-lived assets for recoverability and determined they were fully recoverable as of March 31, 2020.
Management’s estimates are based on numerous assumptions about future operations and market conditions, which we believe to be reasonable but are inherently uncertain. The uncertainties underlying our assumptions and estimates could differ significantly from actual results, including with respect to the duration and severity of the COVID-19 pandemic.
2019 ImpairmentAs discussed in Note 4, in 2019, the assets and liabilities associated with the European Operations and the St. Eustatius Operations, including goodwill, were reclassified to assets and liabilities held for sale for all periods presented and are not included in the table above. In 2019, goodwill of $31.1 million associated with the bunkering operations at the St. Eustatius terminal facility, which represented all goodwill in the fuels marketing segment, was reduced to $0. Please see Note 4 for additional information.
12. ACCRUED LIABILITIES
Accrued liabilities consisted of the following:
December 31, 2020 2019 (Thousands of Dollars)Employee wages and benefit costs $ 27,805 $ 36,704 Revenue contract liabilities 22,019 21,083 Interest rate swaps — 19,169 Operating lease liabilities 10,890 10,416 Environmental costs 5,371 4,837 Other 11,685 16,401
Accrued liabilities $ 77,770 $ 108,610
13. DEBT
Short-term debt consisted of the following:
December 31,2020 2019
(Thousands of Dollars)
Short-term line of credit $ — $ 5,500 Current portion of finance leases (refer to Note 16) $ 3,839 $ 4,546
Table of ContentsNUSTAR ENERGY L.P. AND SUBSIDIARIES
NOTES TO CONSOLIDATED FINANCIAL STATEMENTS – (Continued)
77
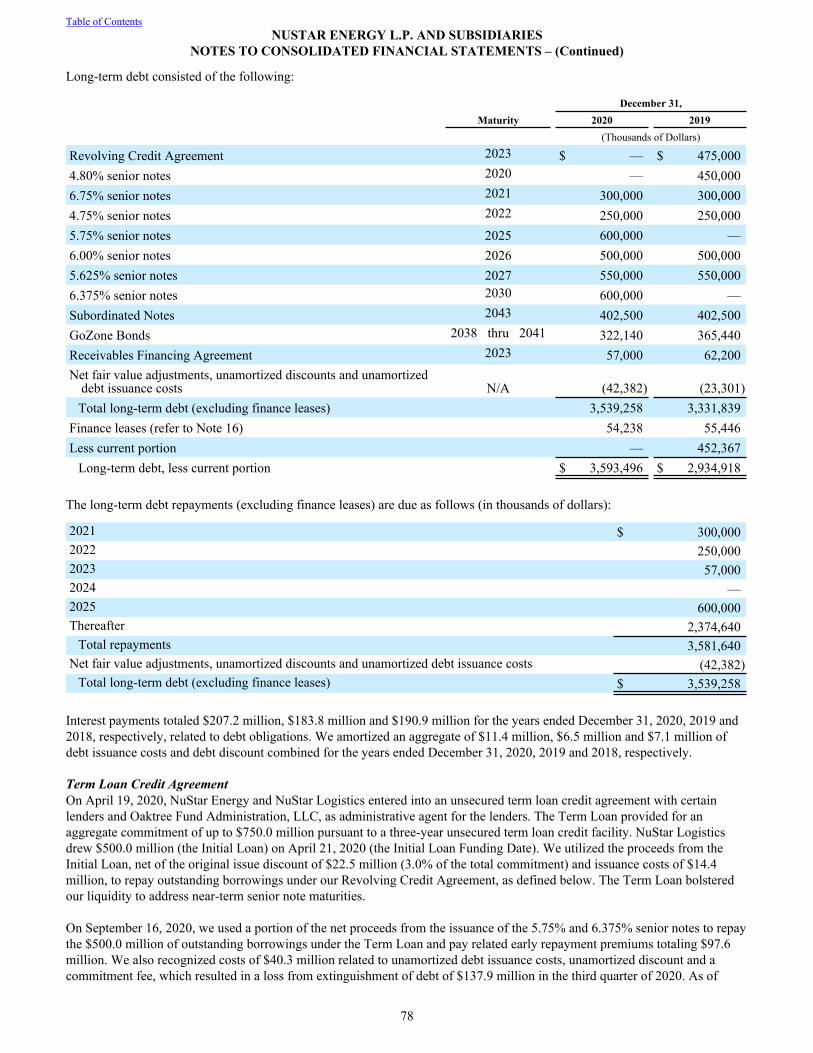
Long-term debt consisted of the following:
December 31, Maturity 2020 2019 (Thousands of Dollars)
Revolving Credit Agreement 2023 $ — $ 475,000 4.80% senior notes 2020 — 450,000 6.75% senior notes 2021 300,000 300,000 4.75% senior notes 2022 250,000 250,000 5.75% senior notes 2025 600,000 — 6.00% senior notes 2026 500,000 500,000 5.625% senior notes 2027 550,000 550,000 6.375% senior notes 2030 600,000 — Subordinated Notes 2043 402,500 402,500 GoZone Bonds 2038 thru 2041 322,140 365,440 Receivables Financing Agreement 2023 57,000 62,200 Net fair value adjustments, unamortized discounts and unamortized
debt issuance costs N/A (42,382) (23,301) Total long-term debt (excluding finance leases) 3,539,258 3,331,839
Finance leases (refer to Note 16) 54,238 55,446 Less current portion — 452,367
Long-term debt, less current portion $ 3,593,496 $ 2,934,918
The long-term debt repayments (excluding finance leases) are due as follows (in thousands of dollars):
2021 $ 300,000 2022 250,000 2023 57,000 2024 — 2025 600,000 Thereafter 2,374,640
Total repayments 3,581,640 Net fair value adjustments, unamortized discounts and unamortized debt issuance costs (42,382)
Total long-term debt (excluding finance leases) $ 3,539,258
Interest payments totaled $207.2 million, $183.8 million and $190.9 million for the years ended December 31, 2020, 2019 and 2018, respectively, related to debt obligations. We amortized an aggregate of $11.4 million, $6.5 million and $7.1 million of debt issuance costs and debt discount combined for the years ended December 31, 2020, 2019 and 2018, respectively.
Term Loan Credit AgreementOn April 19, 2020, NuStar Energy and NuStar Logistics entered into an unsecured term loan credit agreement with certain lenders and Oaktree Fund Administration, LLC, as administrative agent for the lenders. The Term Loan provided for an aggregate commitment of up to $750.0 million pursuant to a three-year unsecured term loan credit facility. NuStar Logistics drew $500.0 million (the Initial Loan) on April 21, 2020 (the Initial Loan Funding Date). We utilized the proceeds from the Initial Loan, net of the original issue discount of $22.5 million (3.0% of the total commitment) and issuance costs of $14.4 million, to repay outstanding borrowings under our Revolving Credit Agreement, as defined below. The Term Loan bolstered our liquidity to address near-term senior note maturities.
On September 16, 2020, we used a portion of the net proceeds from the issuance of the 5.75% and 6.375% senior notes to repay the $500.0 million of outstanding borrowings under the Term Loan and pay related early repayment premiums totaling $97.6 million. We also recognized costs of $40.3 million related to unamortized debt issuance costs, unamortized discount and a commitment fee, which resulted in a loss from extinguishment of debt of $137.9 million in the third quarter of 2020. As of
Table of ContentsNUSTAR ENERGY L.P. AND SUBSIDIARIES
NOTES TO CONSOLIDATED FINANCIAL STATEMENTS – (Continued)
78
December 31, 2020, an aggregate principal amount of $250.0 million remained available to be drawn. On February 16, 2021, we terminated the Term Loan.
Outstanding borrowings bore interest at an aggregate rate of 12.0% per annum, and the Term Loan was subject to a commitment fee in the amount of 5.0% per annum on the average daily undrawn amount of $250.0 million until April 19, 2021. Upon issuance of the $1.2 billion of senior notes in September 2020, we were required to repay outstanding borrowings under the Term Loan and pay a make-whole premium for liquidated damages and compensation for the costs of making funds available. From the Initial Loan Funding Date through the 18-month anniversary of the Initial Loan Funding Date, such premium was the sum of (i) the make-whole amount and (ii) 6.25% of the aggregate principal amount of borrowings then paid.
Revolving Credit AgreementOn March 6, 2020, NuStar Logistics amended its revolving credit agreement (the Revolving Credit Agreement) to, among other things, extend the maturity date from October 29, 2021 to October 27, 2023, reduce the total amount available for borrowing from $1.2 billion to $1.0 billion and increase the rates included in the definition of Applicable Rate contained in the Revolving Credit Agreement. On April 6, 2020, NuStar Logistics amended the Revolving Credit Agreement to allow for certain transactions related to the GoZone Bonds discussed below. On February 16, 2021, NuStar Logistics amended the Revolving Credit Agreement to, among other things, expand certain adjustments related to our maximum consolidated debt coverage ratio and minimum consolidated interest coverage ratio.
The Revolving Credit Agreement is subject to maximum consolidated debt coverage ratio and minimum consolidated interest coverage ratio requirements, which may limit the amount we can borrow to an amount less than the total amount available for borrowing. For the rolling period ending December 31, 2020, the maximum allowed consolidated debt coverage ratio (as defined in the Revolving Credit Agreement) may not exceed 5.00-to-1.00 and the minimum consolidated interest coverage ratio (as defined in the Revolving Credit Agreement), must not be less than 1.75-to-1.00. If we complete one or more acquisitions for aggregate net consideration of at least $50.0 million, our maximum consolidated debt coverage ratio will increase to 5.50-to-1.00 for two rolling periods. The Revolving Credit Agreement also contains customary restrictive covenants, such as limitations on indebtedness, liens, mergers, asset transfers and certain investing activities. As of December 31, 2020, we believe that we are in compliance with the covenants in the Revolving Credit Agreement.
As of December 31, 2020, we had $994.8 million available for borrowing and no borrowings outstanding. Letters of credit issued under the Revolving Credit Agreement totaled $5.2 million as of December 31, 2020. Letters of credit are limited to $400.0 million and also may restrict the amount we can borrow under the Revolving Credit Agreement. Obligations under the Revolving Credit Agreement are guaranteed by NuStar Energy and NuPOP.
The Revolving Credit Agreement bears interest, at our option, based on an alternative base rate or a LIBOR-based rate. The interest rate on the Revolving Credit Agreement is subject to adjustment if our debt rating is downgraded (or upgraded) by certain credit rating agencies. In August of 2020, Moody’s Investor Service Inc. downgraded our credit rating from Ba2 to Ba3. This rating downgrade caused the interest rate on our Revolving Credit Agreement to increase by 0.25% effective August 2020. The Revolving Credit Agreement is the only debt arrangement with an interest rate that is subject to adjustment if our debt rating is downgraded (or upgraded) by certain credit rating agencies. During the year ended December 31, 2020, the weighted-average interest rate related to borrowings under the Revolving Credit Agreement was 3.3%.
NotesNuStar Logistics Senior Notes. On September 14, 2020, NuStar Logistics issued $600.0 million of 5.75% senior notes due October 1, 2025 and $600.0 million of 6.375% senior notes due October 1, 2030. We received proceeds of $1,182.0 million, net of issuance costs of $18.0 million, which we used to repay outstanding borrowings under the Term Loan, along with early repayment premiums, as well as borrowings under our Revolving Credit Agreement. The issuance of the 5.75% and 6.375% senior notes bolstered our liquidity to address our senior note maturities in early 2021 and 2022. The interest on the 5.75% and 6.375% senior notes is payable semi-annually in arrears on April 1 and October 1 of each year, beginning on April 1, 2021.
We repaid our $450.0 million of 4.8% senior notes due September 1, 2020 with borrowings under our Revolving Credit Agreement.
Table of ContentsNUSTAR ENERGY L.P. AND SUBSIDIARIES
NOTES TO CONSOLIDATED FINANCIAL STATEMENTS – (Continued)
79
On May 22, 2019, NuStar Logistics issued $500.0 million of 6.0% senior notes due June 1, 2026. We received net proceeds of $491.6 million, which we used to repay outstanding borrowings under our Revolving Credit Agreement. The interest on the 6.0% senior notes is payable semi-annually in arrears on June 1 and December 1 of each year, beginning on December 1, 2019.
We repaid the $350.0 million of 7.65% senior notes on April 15, 2018 with borrowings under our Revolving Credit Agreement.
Interest is payable semi-annually in arrears for the $300.0 million of 6.75% senior notes, $250.0 million of 4.75% senior notes, $600.0 million of 5.75% senior notes, $500.0 million of 6.0% senior notes, $550.0 million of 5.625% senior notes and $600.0 million of 6.375% senior notes (collectively, the NuStar Logistics Senior Notes).
The NuStar Logistics Senior Notes do not have sinking fund requirements. These notes rank equally with existing senior unsecured indebtedness and senior to existing subordinated indebtedness of NuStar Logistics and contain restrictions on NuStar Logistics’ ability to incur secured indebtedness unless the same security is also provided for the benefit of holders of the NuStar Logistics Senior Notes. In addition, the NuStar Logistics Senior Notes limit the ability of NuStar Logistics and its subsidiaries to, among other things, incur indebtedness secured by certain liens, engage in certain sale-leaseback transactions and engage in certain consolidations, mergers or asset sales. At the option of NuStar Logistics, the NuStar Logistics Senior Notes may be redeemed in whole or in part at any time at a redemption price, plus accrued and unpaid interest to the redemption date. If we undergo a change of control, as defined in the supplemental indentures for the 6.75% senior notes, the 5.75% senior notes, the 6.0% senior notes, the 5.625% senior notes or the 6.375% senior notes, each holder of the applicable senior notes may require us to repurchase all or a portion of its notes at a price equal to 101% of the principal amount of the notes repurchased, plus any accrued and unpaid interest to the date of repurchase. The NuStar Logistics Senior Notes are fully and unconditionally guaranteed by NuStar Energy and NuPOP.
We repaid our $300.0 million of 6.75% senior notes due February 1, 2021 with borrowings under our Revolving Credit Agreement; the senior notes are therefore classified as long-term debt as of December 31, 2020.
NuStar Logistics Subordinated Notes. NuStar Logistics’ $402.5 million of fixed-to-floating rate subordinated notes are due January 15, 2043 (the Subordinated Notes). The Subordinated Notes are fully and unconditionally guaranteed on an unsecured and subordinated basis by NuStar Energy and NuPOP. Effective January 15, 2018, the interest rate on the Subordinated Notes switched from a fixed annual rate of 7.625%, payable quarterly in arrears, to an annual rate equal to the sum of the three-month LIBOR for the related quarterly interest period, plus 6.734% payable quarterly, commencing April 15, 2018, unless payment is deferred in accordance with the terms of the notes. NuStar Logistics may elect to defer interest payments on the Subordinated Notes on one or more occasions for up to five consecutive years. Deferred interest will accumulate additional interest at a rate equal to the interest rate then applicable to the Subordinated Notes until paid. If NuStar Logistics elects to defer interest payments, NuStar Energy cannot declare or make cash distributions to its unitholders during the period that interest payments are deferred. As of December 31, 2020, the interest rate was 7.0%.
The Subordinated Notes do not have sinking fund requirements and are subordinated to existing senior unsecured indebtedness of NuStar Logistics and NuPOP. The Subordinated Notes do not contain restrictions on NuStar Logistics’ ability to incur additional indebtedness, including debt that ranks senior in priority of payment to the notes. In addition, the Subordinated Notes do not limit NuStar Logistics’ ability to incur indebtedness secured by liens or to engage in certain sale-leaseback transactions. Effective January 15, 2018, we may redeem the Subordinated Notes in whole or in part at a redemption price equal to 100% of the principal amount plus accrued and unpaid interest to the redemption date.
Gulf Opportunity Zone Revenue BondsIn 2008, 2010 and 2011, the Parish of St. James, Louisiana issued Revenue Bonds Series 2008, Series 2010, Series 2010A, Series 2010B and Series 2011 associated with our St. James terminal expansions pursuant to the Gulf Opportunity Zone Act of 2005 for an aggregate $365.4 million (collectively, the GoZone Bonds). Following the issuances, the proceeds were deposited with a trustee and were disbursed to us upon our request for reimbursement of expenditures related to our St. James terminal. We did not receive any proceeds from the trustee for the years ended December 31, 2019 and 2020. On March 4, 2020, NuStar Logistics repaid $43.3 million of GoZone Bonds with unused funds, which had been held in trust. NuStar Logistics is obligated to make payments in amounts sufficient to pay the principal of, premium, if any, interest and certain other payments on, the GoZone Bonds.
On June 3, 2020, NuStar Logistics completed the reoffering and conversion of the GoZone Bonds through supplements to the original indentures governing the GoZone Bonds and supplements to the original agreements between NuStar Logistics and the Parish of St. James, which, among other things, converted the interest rate from a weekly rate to a long-term rate. In connection with the reoffering and conversion, we terminated the letters of credit previously issued by various individual banks on our
Table of ContentsNUSTAR ENERGY L.P. AND SUBSIDIARIES
NOTES TO CONSOLIDATED FINANCIAL STATEMENTS – (Continued)
80
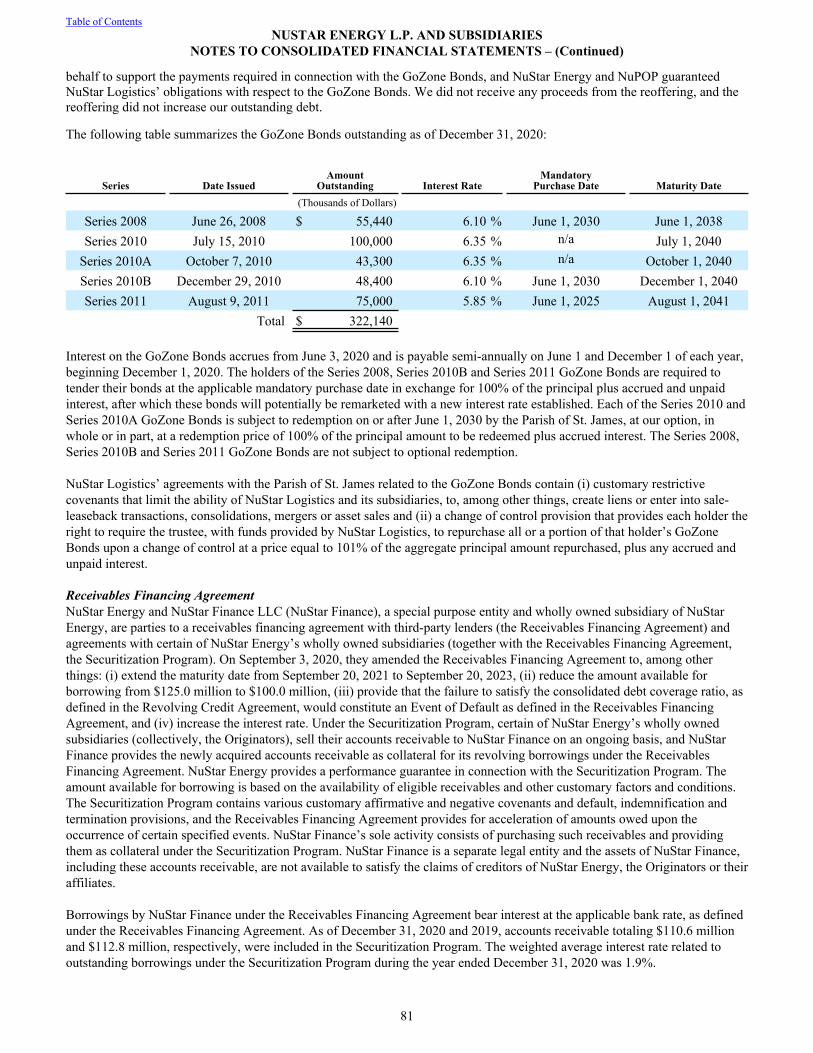
behalf to support the payments required in connection with the GoZone Bonds, and NuStar Energy and NuPOP guaranteed NuStar Logistics’ obligations with respect to the GoZone Bonds. We did not receive any proceeds from the reoffering, and the reoffering did not increase our outstanding debt.
The following table summarizes the GoZone Bonds outstanding as of December 31, 2020:
Series Date IssuedAmount
Outstanding Interest RateMandatory
Purchase Date Maturity Date (Thousands of Dollars)
Series 2008 June 26, 2008 $ 55,440 6.10 % June 1, 2030 June 1, 2038Series 2010 July 15, 2010 100,000 6.35 % n/a July 1, 2040
Series 2010A October 7, 2010 43,300 6.35 % n/a October 1, 2040Series 2010B December 29, 2010 48,400 6.10 % June 1, 2030 December 1, 2040Series 2011 August 9, 2011 75,000 5.85 % June 1, 2025 August 1, 2041
Total $ 322,140
Interest on the GoZone Bonds accrues from June 3, 2020 and is payable semi-annually on June 1 and December 1 of each year, beginning December 1, 2020. The holders of the Series 2008, Series 2010B and Series 2011 GoZone Bonds are required to tender their bonds at the applicable mandatory purchase date in exchange for 100% of the principal plus accrued and unpaid interest, after which these bonds will potentially be remarketed with a new interest rate established. Each of the Series 2010 and Series 2010A GoZone Bonds is subject to redemption on or after June 1, 2030 by the Parish of St. James, at our option, in whole or in part, at a redemption price of 100% of the principal amount to be redeemed plus accrued interest. The Series 2008, Series 2010B and Series 2011 GoZone Bonds are not subject to optional redemption.
NuStar Logistics’ agreements with the Parish of St. James related to the GoZone Bonds contain (i) customary restrictive covenants that limit the ability of NuStar Logistics and its subsidiaries, to, among other things, create liens or enter into sale-leaseback transactions, consolidations, mergers or asset sales and (ii) a change of control provision that provides each holder the right to require the trustee, with funds provided by NuStar Logistics, to repurchase all or a portion of that holder’s GoZone Bonds upon a change of control at a price equal to 101% of the aggregate principal amount repurchased, plus any accrued and unpaid interest.
Receivables Financing AgreementNuStar Energy and NuStar Finance LLC (NuStar Finance), a special purpose entity and wholly owned subsidiary of NuStar Energy, are parties to a receivables financing agreement with third-party lenders (the Receivables Financing Agreement) and agreements with certain of NuStar Energy’s wholly owned subsidiaries (together with the Receivables Financing Agreement, the Securitization Program). On September 3, 2020, they amended the Receivables Financing Agreement to, among other things: (i) extend the maturity date from September 20, 2021 to September 20, 2023, (ii) reduce the amount available for borrowing from $125.0 million to $100.0 million, (iii) provide that the failure to satisfy the consolidated debt coverage ratio, as defined in the Revolving Credit Agreement, would constitute an Event of Default as defined in the Receivables Financing Agreement, and (iv) increase the interest rate. Under the Securitization Program, certain of NuStar Energy’s wholly owned subsidiaries (collectively, the Originators), sell their accounts receivable to NuStar Finance on an ongoing basis, and NuStar Finance provides the newly acquired accounts receivable as collateral for its revolving borrowings under the Receivables Financing Agreement. NuStar Energy provides a performance guarantee in connection with the Securitization Program. The amount available for borrowing is based on the availability of eligible receivables and other customary factors and conditions. The Securitization Program contains various customary affirmative and negative covenants and default, indemnification and termination provisions, and the Receivables Financing Agreement provides for acceleration of amounts owed upon the occurrence of certain specified events. NuStar Finance’s sole activity consists of purchasing such receivables and providing them as collateral under the Securitization Program. NuStar Finance is a separate legal entity and the assets of NuStar Finance, including these accounts receivable, are not available to satisfy the claims of creditors of NuStar Energy, the Originators or their affiliates.
Borrowings by NuStar Finance under the Receivables Financing Agreement bear interest at the applicable bank rate, as defined under the Receivables Financing Agreement. As of December 31, 2020 and 2019, accounts receivable totaling $110.6 million and $112.8 million, respectively, were included in the Securitization Program. The weighted average interest rate related to outstanding borrowings under the Securitization Program during the year ended December 31, 2020 was 1.9%.
Table of ContentsNUSTAR ENERGY L.P. AND SUBSIDIARIES
NOTES TO CONSOLIDATED FINANCIAL STATEMENTS – (Continued)
81
14. HEALTH, SAFETY AND ENVIRONMENTAL MATTERS
Our operations are subject to extensive international, federal, state and local environmental laws and regulations, in the U.S. and in the other countries in which we operate, including those relating to the discharge of materials into the environment, waste management, remediation, the characteristics and composition of fuels, climate change and greenhouse gases. Our operations are also subject to extensive health, safety and security laws and regulations, including those relating to worker and pipeline safety, pipeline and storage tank integrity and operations security. The principal environmental, health, safety and security risks associated with our operations relate to unauthorized emissions into the air, releases into soil, surface water or groundwater, personal injury and property damage. We have adopted policies, practices, systems and procedures designed to comply with the laws and regulations and to help minimize and mitigate these risks, limit the liability that could result from such events, prevent material environmental or other damage, ensure the safety of our employees and the public and secure our pipelines, terminals and operations. Compliance with environmental, health, safety and security laws, regulations and related permits increases our capital expenditures and operating expenses, and violation of these laws, regulations or permits could result in significant civil and criminal liabilities, injunctions or other penalties. Future governmental action and regulatory initiatives could necessitate changes to expected operating permits and procedures, additional remedial actions or increased capital expenditures and operating costs. Risks of additional costs and liabilities are inherent to government-regulated industries, including midstream energy, and there can be no assurances that significant costs and liabilities will not be incurred in the future.
Most of our pipelines are subject to federal regulation by one or more of the following governmental agencies: The Federal Energy Regulatory Commission (the FERC), the Surface Transportation Board (the STB), the Department of Transportation (DOT), the Environmental Protection Agency (EPA) and the Department of Homeland Security. Additionally, the operations and integrity of the pipelines are subject to the respective jurisdictions of the states those lines traverse.
Environmental and safety exposures and liabilities are difficult to assess and estimate due to unknown factors such as the timing and extent of remediation, the determination of our liability in proportion to other parties, improvements in cleanup technologies and the extent to which environmental and safety laws and regulations may change in the future. Although environmental and safety costs may have a significant impact on the results of operations for any single period, we believe that such costs will not have a material adverse effect on our financial position.
The balance of and changes in the accruals for environmental matters were as follows:
Year Ended December 31, 2020 2019 (Thousands of Dollars)Balance as of the beginning of year $ 7,938 $ 7,753
Additions to accrual 3,692 3,700 Payments (3,257) (3,515)
Balance as of the end of year $ 8,373 $ 7,938 Accruals for environmental matters are included in the consolidated balance sheets as follows:
December 31, 2020 2019 (Thousands of Dollars)Accrued liabilities $ 5,371 $ 4,837 Other long-term liabilities 3,002 3,101
Accruals for environmental matters $ 8,373 $ 7,938
Table of ContentsNUSTAR ENERGY L.P. AND SUBSIDIARIES
NOTES TO CONSOLIDATED FINANCIAL STATEMENTS – (Continued)
82
15. COMMITMENTS AND CONTINGENCIES
CommitmentsFuture minimum rental payments applicable to all noncancellable purchase obligations as of December 31, 2020 are as follows:
Payments Due by Period
2021 2022 2023 2024 2025There-after Total
(Thousands of Dollars)Purchase obligations $ 9,980 $ 7,647 $ 2,039 $ 1,025 $ 483 $ 4,520 $ 25,694
Our purchase obligations primarily consist of an eleven-year chemical supply agreement related to our pipelines that terminates in 2022 and various service agreements with information technology providers.
Contingencies We have contingent liabilities resulting from various litigation, claims and commitments. We record accruals for loss contingencies when losses are considered probable and can be reasonably estimated. Legal fees associated with defending the Partnership in legal matters are expensed as incurred. We accrued $2.6 million and $3.7 million for contingent losses as of December 31, 2020 and 2019, respectively. The amount that will ultimately be paid related to such matters may differ from the recorded accruals, and the timing of such payments is uncertain. We evaluate each contingent loss at least quarterly, and more frequently as each matter progresses and develops over time, and we do not believe that the resolution of any particular claim or proceeding, or all matters in the aggregate, would have a material adverse effect on our results of operations, financial position or liquidity.
16. LEASE ASSETS AND LIABILITIES
TransitionOn January 1, 2019, we adopted Accounting Standards Codification Topic 842, “Leases” (ASC Topic 842) using the modified retrospective method. Results for reporting periods beginning after January 1, 2019 are presented under ASC Topic 842. In accordance with the modified retrospective approach, prior period amounts were not adjusted and are reported under ASC Topic 840, “Leases.” As a result of the adoption of ASC Topic 842, we recorded right-of-use assets and lease liabilities of approximately $207.0 million and $192.0 million, respectively, as of January 1, 2019. The adoption of ASC Topic 842 had an immaterial impact on our results of operations and cash flows at adoption.
We elected the following practical expedients permitted under the transition guidance within the new standard:• the package of practical expedients, which, among other things, allowed us to carry forward historical lease
classification; • the practical expedient specifically related to land easements, which, among other things, allowed us to carry forward
our historical accounting treatment for existing land easement agreements;• the lessee practical expedient to combine lease and non-lease components for all of our asset classes except the other
pipeline and terminal equipment asset class; and • the lessor practical expedient to combine lease and non-lease components and to account for the transaction based on
the predominant component (i.e., ASC Topic 842 or ASC Topic 606, “Revenue from Contracts with Customers”). We apply this expedient to certain contracts in which we agree to provide both storage capacity and optional services to customers.
We record all leases on our consolidated balance sheet except for those leases with an initial term of 12 months or less, which are expensed on a straight-line basis over the lease term. We use judgment in determining the reasonably certain lease term and consider factors such as the nature and utility of the leased asset, as well as the importance of the leased asset to our operations. We calculate the present value of our lease liabilities based upon our incremental borrowing rate unless the rate implicit in the lease is readily determinable.
Lessee ArrangementsOur operating leases consist primarily of land and dock leases at various terminal facilities. As of December 31, 2020, land and dock leases have remaining terms generally of up to five years and include options to extend, some up to twenty years, which we are reasonably certain to exercise. During 2020, we modified three leases for marine vessels at our Point Tupper terminal facility in order to extend their lease terms by five years. The modifications and related remeasurements resulted in additional lease liabilities and right-of-use assets totaling $20.1 million.
Table of ContentsNUSTAR ENERGY L.P. AND SUBSIDIARIES
NOTES TO CONSOLIDATED FINANCIAL STATEMENTS – (Continued)
83
The primary component of our finance lease portfolio is a dock at a terminal facility, which includes a commitment for minimum dockage and wharfage throughput volumes. The dock lease has a remaining initial term of less than one year and four additional five-year renewal periods, all of which we are reasonably certain to exercise. We historically accounted for the dock lease under legacy build-to-suit accounting guidance, which was eliminated by ASC Topic 842.
Certain of our leases are subject to variable payment arrangements, the most notable of which include:• dockage and wharfage charges, which are based on volumes moved over leased docks and are included in our
calculation of our lease payments based on minimum throughput volume requirements. We recognize charges on excess throughput volumes in profit or loss in the period in which the obligation for those payments is incurred; and
• consumer price index adjustments, which are measured and included in the calculation of our lease payments based on the consumer price index at the adoption date or, after adoption, at the commencement date. We recognize changes in lease payments as a result of changes in the consumer price index in profit or loss in the period in which those payments are made.
Right-of-use assets and lease liabilities included in our consolidated balance sheet were as follows:
December 31,Balance Sheet Location 2020 2019
(Thousands of Dollars)
Right-of-Use Assets:Operating Other long-term assets, net $ 87,443 $ 81,219
FinanceProperty, plant and equipment, net of accumulated
amortization of $8,444 and $3,748 $ 73,319 $ 74,953
Lease Liabilities:Operating:
Current Accrued liabilities $ 10,890 $ 10,416 Noncurrent Other long-term liabilities 74,899 70,083 Total operating lease liabilities $ 85,789 $ 80,499
Finance:Current Current portion of debt and finance lease obligations $ 3,839 $ 4,546 Noncurrent Long-term debt, less current portion 54,238 55,446 Total finance lease liabilities $ 58,077 $ 59,992
As of December 31, 2020, maturities of our operating and finance lease liabilities were as follows:
Operating Leases Finance Leases(Thousands of Dollars)
2021 $ 13,137 $ 5,907 2022 12,419 5,231 2023 11,170 5,102 2024 10,294 4,622 2025 8,154 3,898 Thereafter 53,288 56,079
Total lease payments $ 108,462 $ 80,839 Less: Interest 22,673 22,762
Present value of lease liabilities $ 85,789 $ 58,077
Table of ContentsNUSTAR ENERGY L.P. AND SUBSIDIARIES
NOTES TO CONSOLIDATED FINANCIAL STATEMENTS – (Continued)
84
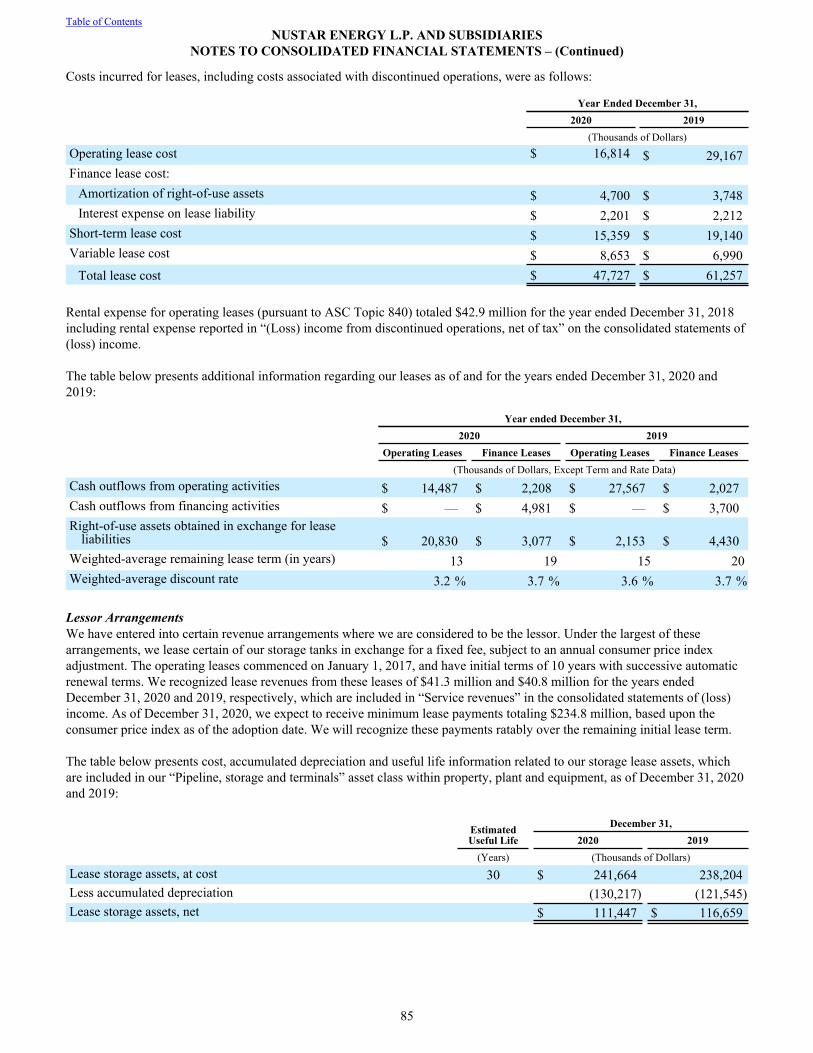
Costs incurred for leases, including costs associated with discontinued operations, were as follows:
Year Ended December 31,2020 2019
(Thousands of Dollars)Operating lease cost $ 16,814 $ 29,167 Finance lease cost:
Amortization of right-of-use assets $ 4,700 $ 3,748 Interest expense on lease liability $ 2,201 $ 2,212
Short-term lease cost $ 15,359 $ 19,140 Variable lease cost $ 8,653 $ 6,990
Total lease cost $ 47,727 $ 61,257
Rental expense for operating leases (pursuant to ASC Topic 840) totaled $42.9 million for the year ended December 31, 2018 including rental expense reported in “(Loss) income from discontinued operations, net of tax” on the consolidated statements of (loss) income.
The table below presents additional information regarding our leases as of and for the years ended December 31, 2020 and 2019:
Year ended December 31,2020 2019
Operating Leases Finance Leases Operating Leases Finance Leases(Thousands of Dollars, Except Term and Rate Data)
Cash outflows from operating activities $ 14,487 $ 2,208 $ 27,567 $ 2,027 Cash outflows from financing activities $ — $ 4,981 $ — $ 3,700 Right-of-use assets obtained in exchange for lease
liabilities $ 20,830 $ 3,077 $ 2,153 $ 4,430 Weighted-average remaining lease term (in years) 13 19 15 20Weighted-average discount rate 3.2 % 3.7 % 3.6 % 3.7 %
Lessor ArrangementsWe have entered into certain revenue arrangements where we are considered to be the lessor. Under the largest of these arrangements, we lease certain of our storage tanks in exchange for a fixed fee, subject to an annual consumer price index adjustment. The operating leases commenced on January 1, 2017, and have initial terms of 10 years with successive automatic renewal terms. We recognized lease revenues from these leases of $41.3 million and $40.8 million for the years ended December 31, 2020 and 2019, respectively, which are included in “Service revenues” in the consolidated statements of (loss) income. As of December 31, 2020, we expect to receive minimum lease payments totaling $234.8 million, based upon the consumer price index as of the adoption date. We will recognize these payments ratably over the remaining initial lease term.
The table below presents cost, accumulated depreciation and useful life information related to our storage lease assets, which are included in our “Pipeline, storage and terminals” asset class within property, plant and equipment, as of December 31, 2020 and 2019:
Estimated Useful Life
December 31, 2020 2019 (Years) (Thousands of Dollars)Lease storage assets, at cost 30 $ 241,664 238,204 Less accumulated depreciation (130,217) (121,545) Lease storage assets, net $ 111,447 $ 116,659
Table of ContentsNUSTAR ENERGY L.P. AND SUBSIDIARIES
NOTES TO CONSOLIDATED FINANCIAL STATEMENTS – (Continued)
85
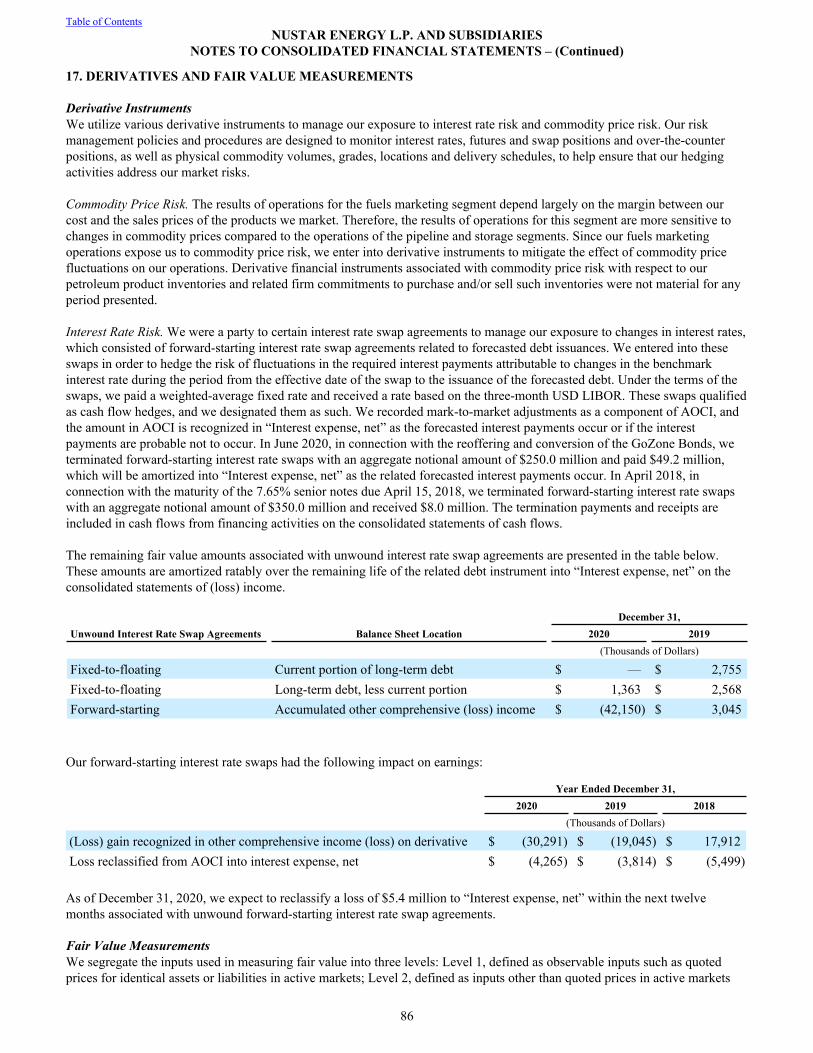
17. DERIVATIVES AND FAIR VALUE MEASUREMENTS
Derivative InstrumentsWe utilize various derivative instruments to manage our exposure to interest rate risk and commodity price risk. Our risk management policies and procedures are designed to monitor interest rates, futures and swap positions and over-the-counter positions, as well as physical commodity volumes, grades, locations and delivery schedules, to help ensure that our hedging activities address our market risks.
Commodity Price Risk. The results of operations for the fuels marketing segment depend largely on the margin between our cost and the sales prices of the products we market. Therefore, the results of operations for this segment are more sensitive to changes in commodity prices compared to the operations of the pipeline and storage segments. Since our fuels marketing operations expose us to commodity price risk, we enter into derivative instruments to mitigate the effect of commodity price fluctuations on our operations. Derivative financial instruments associated with commodity price risk with respect to our petroleum product inventories and related firm commitments to purchase and/or sell such inventories were not material for any period presented.
Interest Rate Risk. We were a party to certain interest rate swap agreements to manage our exposure to changes in interest rates, which consisted of forward-starting interest rate swap agreements related to forecasted debt issuances. We entered into these swaps in order to hedge the risk of fluctuations in the required interest payments attributable to changes in the benchmark interest rate during the period from the effective date of the swap to the issuance of the forecasted debt. Under the terms of the swaps, we paid a weighted-average fixed rate and received a rate based on the three-month USD LIBOR. These swaps qualified as cash flow hedges, and we designated them as such. We recorded mark-to-market adjustments as a component of AOCI, and the amount in AOCI is recognized in “Interest expense, net” as the forecasted interest payments occur or if the interest payments are probable not to occur. In June 2020, in connection with the reoffering and conversion of the GoZone Bonds, we terminated forward-starting interest rate swaps with an aggregate notional amount of $250.0 million and paid $49.2 million, which will be amortized into “Interest expense, net” as the related forecasted interest payments occur. In April 2018, in connection with the maturity of the 7.65% senior notes due April 15, 2018, we terminated forward-starting interest rate swaps with an aggregate notional amount of $350.0 million and received $8.0 million. The termination payments and receipts are included in cash flows from financing activities on the consolidated statements of cash flows.
The remaining fair value amounts associated with unwound interest rate swap agreements are presented in the table below. These amounts are amortized ratably over the remaining life of the related debt instrument into “Interest expense, net” on the consolidated statements of (loss) income.
December 31,Unwound Interest Rate Swap Agreements Balance Sheet Location 2020 2019
(Thousands of Dollars)
Fixed-to-floating Current portion of long-term debt $ — $ 2,755 Fixed-to-floating Long-term debt, less current portion $ 1,363 $ 2,568 Forward-starting Accumulated other comprehensive (loss) income $ (42,150) $ 3,045
Our forward-starting interest rate swaps had the following impact on earnings:
Year Ended December 31,2020 2019 2018
(Thousands of Dollars)
(Loss) gain recognized in other comprehensive income (loss) on derivative $ (30,291) $ (19,045) $ 17,912 Loss reclassified from AOCI into interest expense, net $ (4,265) $ (3,814) $ (5,499)
As of December 31, 2020, we expect to reclassify a loss of $5.4 million to “Interest expense, net” within the next twelve months associated with unwound forward-starting interest rate swap agreements.
Fair Value MeasurementsWe segregate the inputs used in measuring fair value into three levels: Level 1, defined as observable inputs such as quoted prices for identical assets or liabilities in active markets; Level 2, defined as inputs other than quoted prices in active markets
Table of ContentsNUSTAR ENERGY L.P. AND SUBSIDIARIES
NOTES TO CONSOLIDATED FINANCIAL STATEMENTS – (Continued)
86
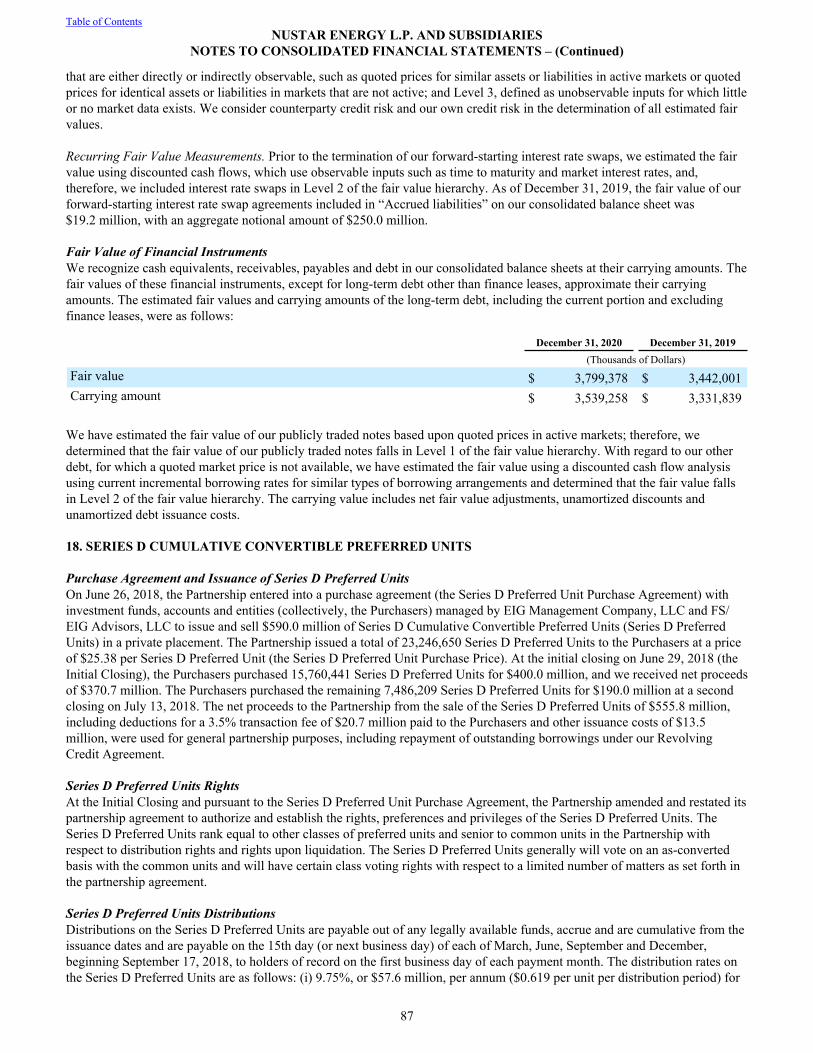
that are either directly or indirectly observable, such as quoted prices for similar assets or liabilities in active markets or quoted prices for identical assets or liabilities in markets that are not active; and Level 3, defined as unobservable inputs for which little or no market data exists. We consider counterparty credit risk and our own credit risk in the determination of all estimated fair values.
Recurring Fair Value Measurements. Prior to the termination of our forward-starting interest rate swaps, we estimated the fair value using discounted cash flows, which use observable inputs such as time to maturity and market interest rates, and, therefore, we included interest rate swaps in Level 2 of the fair value hierarchy. As of December 31, 2019, the fair value of our forward-starting interest rate swap agreements included in “Accrued liabilities” on our consolidated balance sheet was $19.2 million, with an aggregate notional amount of $250.0 million.
Fair Value of Financial InstrumentsWe recognize cash equivalents, receivables, payables and debt in our consolidated balance sheets at their carrying amounts. The fair values of these financial instruments, except for long-term debt other than finance leases, approximate their carrying amounts. The estimated fair values and carrying amounts of the long-term debt, including the current portion and excluding finance leases, were as follows:
December 31, 2020 December 31, 2019 (Thousands of Dollars)Fair value $ 3,799,378 $ 3,442,001 Carrying amount $ 3,539,258 $ 3,331,839
We have estimated the fair value of our publicly traded notes based upon quoted prices in active markets; therefore, we determined that the fair value of our publicly traded notes falls in Level 1 of the fair value hierarchy. With regard to our other debt, for which a quoted market price is not available, we have estimated the fair value using a discounted cash flow analysis using current incremental borrowing rates for similar types of borrowing arrangements and determined that the fair value falls in Level 2 of the fair value hierarchy. The carrying value includes net fair value adjustments, unamortized discounts and unamortized debt issuance costs.
18. SERIES D CUMULATIVE CONVERTIBLE PREFERRED UNITS
Purchase Agreement and Issuance of Series D Preferred UnitsOn June 26, 2018, the Partnership entered into a purchase agreement (the Series D Preferred Unit Purchase Agreement) with investment funds, accounts and entities (collectively, the Purchasers) managed by EIG Management Company, LLC and FS/EIG Advisors, LLC to issue and sell $590.0 million of Series D Cumulative Convertible Preferred Units (Series D Preferred Units) in a private placement. The Partnership issued a total of 23,246,650 Series D Preferred Units to the Purchasers at a price of $25.38 per Series D Preferred Unit (the Series D Preferred Unit Purchase Price). At the initial closing on June 29, 2018 (the Initial Closing), the Purchasers purchased 15,760,441 Series D Preferred Units for $400.0 million, and we received net proceeds of $370.7 million. The Purchasers purchased the remaining 7,486,209 Series D Preferred Units for $190.0 million at a second closing on July 13, 2018. The net proceeds to the Partnership from the sale of the Series D Preferred Units of $555.8 million, including deductions for a 3.5% transaction fee of $20.7 million paid to the Purchasers and other issuance costs of $13.5 million, were used for general partnership purposes, including repayment of outstanding borrowings under our Revolving Credit Agreement.
Series D Preferred Units RightsAt the Initial Closing and pursuant to the Series D Preferred Unit Purchase Agreement, the Partnership amended and restated its partnership agreement to authorize and establish the rights, preferences and privileges of the Series D Preferred Units. The Series D Preferred Units rank equal to other classes of preferred units and senior to common units in the Partnership with respect to distribution rights and rights upon liquidation. The Series D Preferred Units generally will vote on an as-converted basis with the common units and will have certain class voting rights with respect to a limited number of matters as set forth in the partnership agreement.
Series D Preferred Units DistributionsDistributions on the Series D Preferred Units are payable out of any legally available funds, accrue and are cumulative from the issuance dates and are payable on the 15th day (or next business day) of each of March, June, September and December, beginning September 17, 2018, to holders of record on the first business day of each payment month. The distribution rates on the Series D Preferred Units are as follows: (i) 9.75%, or $57.6 million, per annum ($0.619 per unit per distribution period) for
Table of ContentsNUSTAR ENERGY L.P. AND SUBSIDIARIES
NOTES TO CONSOLIDATED FINANCIAL STATEMENTS – (Continued)
87
the first two years; (ii) 10.75%, or $63.4 million, per annum ($0.682 per unit per distribution period) for years three through five; and (iii) the greater of 13.75%, or $81.1 million, per annum ($0.872 per unit per distribution period) or the distribution per common unit thereafter. While the Series D Preferred Units are outstanding, the Partnership will be prohibited from paying distributions on any junior securities, including the common units, unless full cumulative distributions on the Series D Preferred Units (and any parity securities) have been, or contemporaneously are being, paid or set aside for payment through the most recent Series D Preferred Unit distribution payment date. Any Series D Preferred Unit distributions in excess of $0.635 per unit may be paid, in the Partnership’s sole discretion, in additional Series D Preferred Units, with the remainder paid in cash.
If we fail to pay in full any Series D Preferred Unit distribution amount, then, until we pay such distributions in full, the applicable distribution rate for each of those distribution periods shall be increased by $0.048 per Series D Preferred Unit. In addition, if we fail to pay in full any Series D Preferred Unit distribution amount for three consecutive distribution periods, then until we pay such distributions in full: (i) each holder of the Series D Preferred Units may elect to convert its Series D Preferred Units into common units on a one-for-one basis, plus any unpaid Series D distributions, (ii) one person selected by the holders holding a majority of the outstanding Series D Preferred Units shall become an additional member of our board of directors and (iii) we will not be permitted to incur any indebtedness (as defined in the Revolving Credit Agreement) or engage in any acquisitions or asset sales in excess of $50.0 million without the consent of the holders holding a majority of the outstanding Series D Preferred Units. In addition, we will permanently lose the ability to pay any part of the distributions on the Series D Preferred Units in the form of additional Series D Preferred Units.
In January 2021, our board of directors declared a distribution of $0.682 per Series D Preferred Unit to be paid on March 15, 2021.
Series D Preferred Units Conversion and Redemption FeaturesOn or after June 29, 2020, each holder of Series D Preferred Units may convert all or any portion of its Series D Preferred Units into common units on a one-for-one basis (plus any unpaid Series D distributions), subject to anti-dilution adjustments, at any time, but not more than once per quarter, so long as any conversion is for at least $50.0 million based on the Series D Preferred Unit Purchase Price (or such lesser amount representing all of a holder’s Series D Preferred Units).
The Partnership may redeem all or any portion of the Series D Preferred Units, in an amount not less than $50.0 million for cash at a redemption price equal to, as applicable: (i) $31.73 per Series D Preferred Unit at any time on or after June 29, 2023 but prior to June 29, 2024; (ii) $30.46 per Series D Preferred Unit at any time on or after June 29, 2024 but prior to June 29, 2025; (iii) $29.19 per Series D Preferred Unit at any time on or after June 29, 2025; plus, in each case, the sum of any unpaid distributions on the applicable Series D Preferred Unit plus the distributions prorated for the number of days elapsed (not to exceed 90) in the period of redemption (Series D Partial Period Distributions). The holders have the option to convert the units prior to such redemption as discussed above.
Additionally, at any time on or after June 29, 2028, each holder of Series D Preferred Units will have the right to require the Partnership to redeem all of the Series D Preferred Units held by such holder at a redemption price equal to $29.19 per Series D Preferred Unit plus any unpaid Series D distributions plus the Series D Partial Period Distributions. If a holder of Series D Preferred Units exercises its redemption right, the Partnership may elect to pay up to 50% of such amount in common units (which shall be valued at 93% of a volume-weighted average trading price of the common units); provided, that the common units to be issued do not, in the aggregate, exceed 15% of NuStar Energy’s common equity market capitalization at the time.
Series D Preferred Units Change of ControlUpon certain events involving a change of control, each holder of the Series D Preferred Units may elect to: (i) convert its Series D Preferred Units into common units on a one-for-one basis, plus any unpaid Series D distributions; (ii) require the Partnership to redeem its Series D Preferred Units for an amount equal to the sum of (a) $29.82 per Series D Preferred Unit plus (b) any unpaid Series D distributions plus (c) the applicable distribution amount for the distribution periods ending after the change of control event and prior to (but including) the fourth anniversary of the Initial Closing; (iii) if the Partnership is the surviving entity and its common units continue to be listed, continue to hold its Series D Preferred Units; or (iv) if the Partnership will not be the surviving entity, or it will be the surviving entity but its common units will cease to be listed, require the Partnership to use its commercially reasonable efforts to deliver a security in the surviving entity that has substantially similar terms as the Series D Preferred Units; however, if the Partnership is unable to deliver a mirror security, each holder is still entitled to option (i) or (ii) above.
Table of ContentsNUSTAR ENERGY L.P. AND SUBSIDIARIES
NOTES TO CONSOLIDATED FINANCIAL STATEMENTS – (Continued)
88
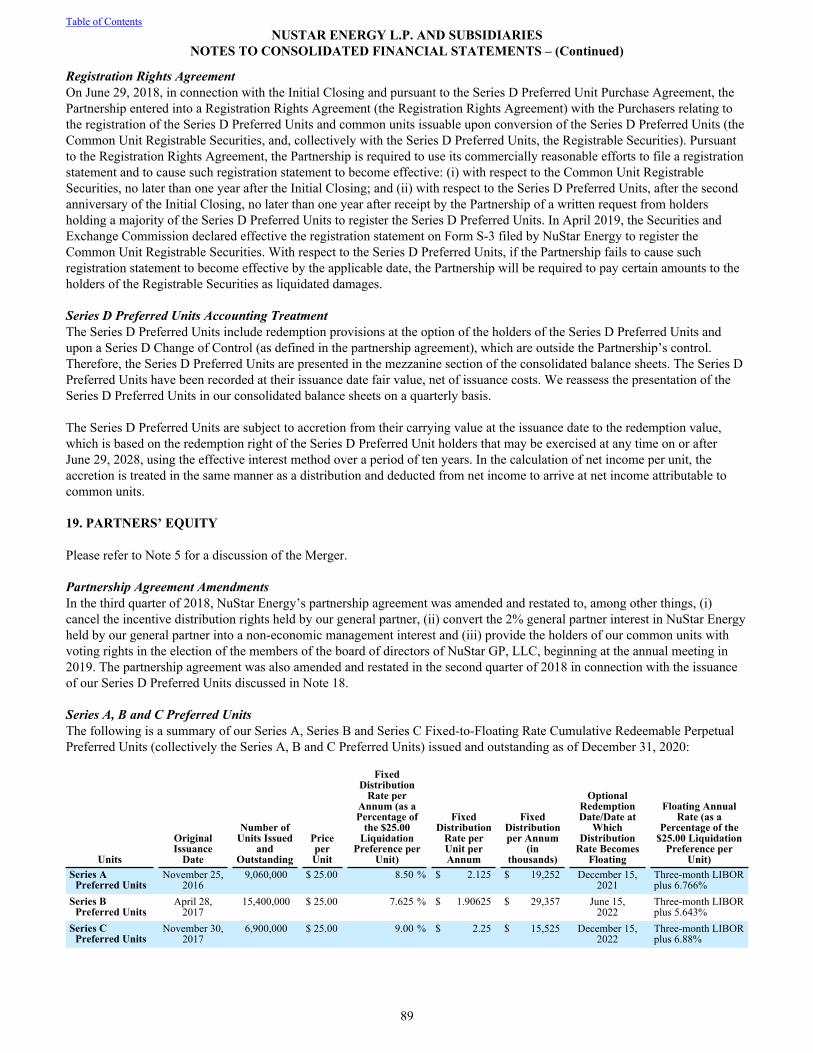
Registration Rights Agreement On June 29, 2018, in connection with the Initial Closing and pursuant to the Series D Preferred Unit Purchase Agreement, the Partnership entered into a Registration Rights Agreement (the Registration Rights Agreement) with the Purchasers relating to the registration of the Series D Preferred Units and common units issuable upon conversion of the Series D Preferred Units (the Common Unit Registrable Securities, and, collectively with the Series D Preferred Units, the Registrable Securities). Pursuant to the Registration Rights Agreement, the Partnership is required to use its commercially reasonable efforts to file a registration statement and to cause such registration statement to become effective: (i) with respect to the Common Unit Registrable Securities, no later than one year after the Initial Closing; and (ii) with respect to the Series D Preferred Units, after the second anniversary of the Initial Closing, no later than one year after receipt by the Partnership of a written request from holders holding a majority of the Series D Preferred Units to register the Series D Preferred Units. In April 2019, the Securities and Exchange Commission declared effective the registration statement on Form S-3 filed by NuStar Energy to register the Common Unit Registrable Securities. With respect to the Series D Preferred Units, if the Partnership fails to cause such registration statement to become effective by the applicable date, the Partnership will be required to pay certain amounts to the holders of the Registrable Securities as liquidated damages.
Series D Preferred Units Accounting TreatmentThe Series D Preferred Units include redemption provisions at the option of the holders of the Series D Preferred Units and upon a Series D Change of Control (as defined in the partnership agreement), which are outside the Partnership’s control. Therefore, the Series D Preferred Units are presented in the mezzanine section of the consolidated balance sheets. The Series D Preferred Units have been recorded at their issuance date fair value, net of issuance costs. We reassess the presentation of the Series D Preferred Units in our consolidated balance sheets on a quarterly basis.
The Series D Preferred Units are subject to accretion from their carrying value at the issuance date to the redemption value, which is based on the redemption right of the Series D Preferred Unit holders that may be exercised at any time on or after June 29, 2028, using the effective interest method over a period of ten years. In the calculation of net income per unit, the accretion is treated in the same manner as a distribution and deducted from net income to arrive at net income attributable to common units.
19. PARTNERS’ EQUITY
Please refer to Note 5 for a discussion of the Merger.
Partnership Agreement AmendmentsIn the third quarter of 2018, NuStar Energy’s partnership agreement was amended and restated to, among other things, (i) cancel the incentive distribution rights held by our general partner, (ii) convert the 2% general partner interest in NuStar Energy held by our general partner into a non-economic management interest and (iii) provide the holders of our common units with voting rights in the election of the members of the board of directors of NuStar GP, LLC, beginning at the annual meeting in 2019. The partnership agreement was also amended and restated in the second quarter of 2018 in connection with the issuance of our Series D Preferred Units discussed in Note 18.
Series A, B and C Preferred UnitsThe following is a summary of our Series A, Series B and Series C Fixed-to-Floating Rate Cumulative Redeemable Perpetual Preferred Units (collectively the Series A, B and C Preferred Units) issued and outstanding as of December 31, 2020:
Units
Original Issuance
Date
Number of Units Issued
and Outstanding
Price per Unit
Fixed Distribution
Rate per Annum (as a Percentage of
the $25.00 Liquidation
Preference per Unit)
Fixed Distribution
Rate per Unit per Annum
Fixed Distribution per Annum
(in thousands)
Optional Redemption Date/Date at
Which Distribution
Rate Becomes Floating
Floating Annual Rate (as a
Percentage of the $25.00 Liquidation
Preference per Unit)
Series A Preferred Units
November 25,2016
9,060,000 $ 25.00 8.50 % $ 2.125 $ 19,252 December 15, 2021
Three-month LIBOR plus 6.766%
Series B Preferred Units
April 28, 2017
15,400,000 $ 25.00 7.625 % $ 1.90625 $ 29,357 June 15,2022
Three-month LIBOR plus 5.643%
Series C Preferred Units
November 30, 2017
6,900,000 $ 25.00 9.00 % $ 2.25 $ 15,525 December 15, 2022
Three-month LIBOR plus 6.88%
Table of ContentsNUSTAR ENERGY L.P. AND SUBSIDIARIES
NOTES TO CONSOLIDATED FINANCIAL STATEMENTS – (Continued)
89
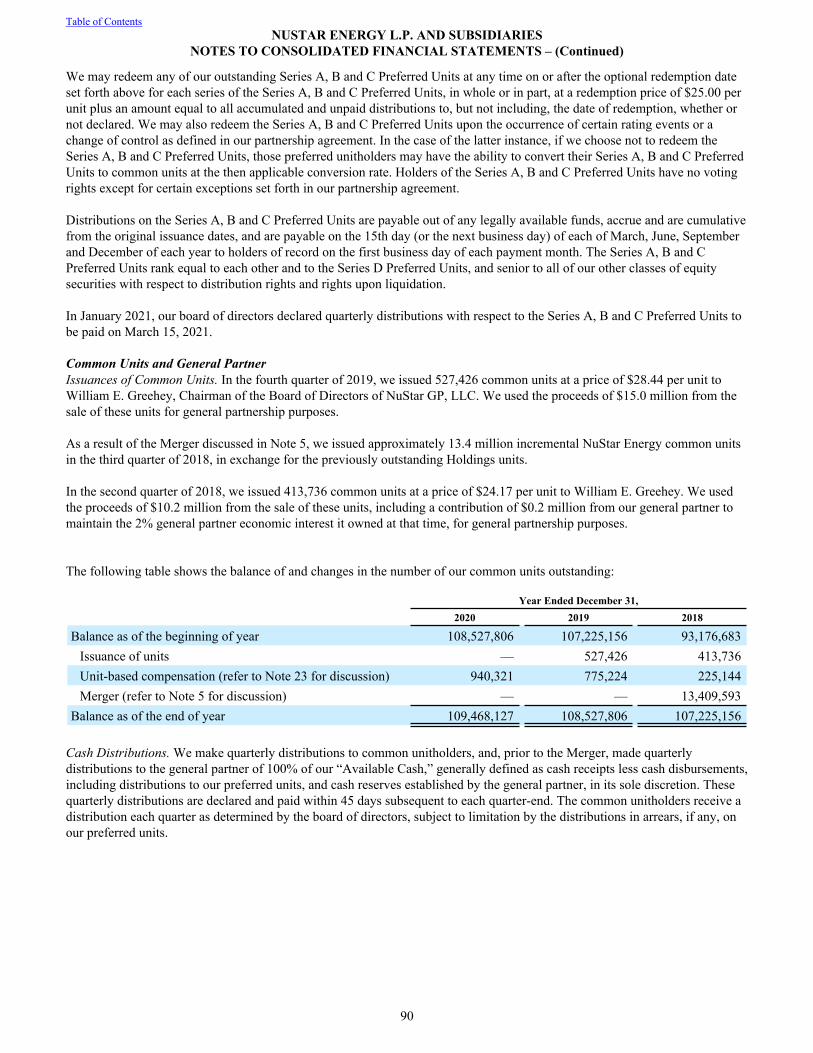
We may redeem any of our outstanding Series A, B and C Preferred Units at any time on or after the optional redemption date set forth above for each series of the Series A, B and C Preferred Units, in whole or in part, at a redemption price of $25.00 per unit plus an amount equal to all accumulated and unpaid distributions to, but not including, the date of redemption, whether or not declared. We may also redeem the Series A, B and C Preferred Units upon the occurrence of certain rating events or a change of control as defined in our partnership agreement. In the case of the latter instance, if we choose not to redeem the Series A, B and C Preferred Units, those preferred unitholders may have the ability to convert their Series A, B and C Preferred Units to common units at the then applicable conversion rate. Holders of the Series A, B and C Preferred Units have no voting rights except for certain exceptions set forth in our partnership agreement.
Distributions on the Series A, B and C Preferred Units are payable out of any legally available funds, accrue and are cumulative from the original issuance dates, and are payable on the 15th day (or the next business day) of each of March, June, September and December of each year to holders of record on the first business day of each payment month. The Series A, B and C Preferred Units rank equal to each other and to the Series D Preferred Units, and senior to all of our other classes of equity securities with respect to distribution rights and rights upon liquidation.
In January 2021, our board of directors declared quarterly distributions with respect to the Series A, B and C Preferred Units to be paid on March 15, 2021.
Common Units and General PartnerIssuances of Common Units. In the fourth quarter of 2019, we issued 527,426 common units at a price of $28.44 per unit to William E. Greehey, Chairman of the Board of Directors of NuStar GP, LLC. We used the proceeds of $15.0 million from the sale of these units for general partnership purposes.
As a result of the Merger discussed in Note 5, we issued approximately 13.4 million incremental NuStar Energy common units in the third quarter of 2018, in exchange for the previously outstanding Holdings units.
In the second quarter of 2018, we issued 413,736 common units at a price of $24.17 per unit to William E. Greehey. We used the proceeds of $10.2 million from the sale of these units, including a contribution of $0.2 million from our general partner to maintain the 2% general partner economic interest it owned at that time, for general partnership purposes.
The following table shows the balance of and changes in the number of our common units outstanding:
Year Ended December 31,2020 2019 2018
Balance as of the beginning of year 108,527,806 107,225,156 93,176,683 Issuance of units — 527,426 413,736 Unit-based compensation (refer to Note 23 for discussion) 940,321 775,224 225,144 Merger (refer to Note 5 for discussion) — — 13,409,593
Balance as of the end of year 109,468,127 108,527,806 107,225,156
Cash Distributions. We make quarterly distributions to common unitholders, and, prior to the Merger, made quarterly distributions to the general partner of 100% of our “Available Cash,” generally defined as cash receipts less cash disbursements, including distributions to our preferred units, and cash reserves established by the general partner, in its sole discretion. These quarterly distributions are declared and paid within 45 days subsequent to each quarter-end. The common unitholders receive a distribution each quarter as determined by the board of directors, subject to limitation by the distributions in arrears, if any, on our preferred units.
Table of ContentsNUSTAR ENERGY L.P. AND SUBSIDIARIES
NOTES TO CONSOLIDATED FINANCIAL STATEMENTS – (Continued)
90
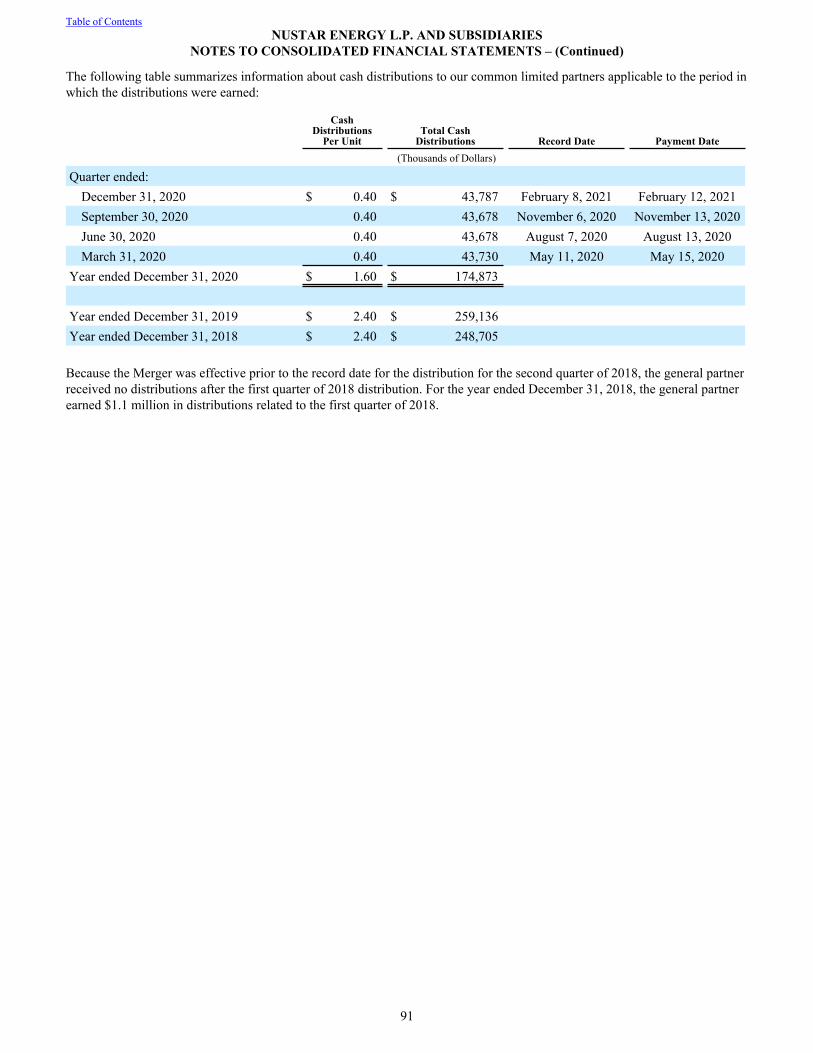
The following table summarizes information about cash distributions to our common limited partners applicable to the period in which the distributions were earned:
Cash Distributions
Per UnitTotal Cash
Distributions Record Date Payment Date(Thousands of Dollars)
Quarter ended:December 31, 2020 $ 0.40 $ 43,787 February 8, 2021 February 12, 2021September 30, 2020 0.40 43,678 November 6, 2020 November 13, 2020June 30, 2020 0.40 43,678 August 7, 2020 August 13, 2020March 31, 2020 0.40 43,730 May 11, 2020 May 15, 2020
Year ended December 31, 2020 $ 1.60 $ 174,873
Year ended December 31, 2019 $ 2.40 $ 259,136 Year ended December 31, 2018 $ 2.40 $ 248,705
Because the Merger was effective prior to the record date for the distribution for the second quarter of 2018, the general partner received no distributions after the first quarter of 2018 distribution. For the year ended December 31, 2018, the general partner earned $1.1 million in distributions related to the first quarter of 2018.
Table of ContentsNUSTAR ENERGY L.P. AND SUBSIDIARIES
NOTES TO CONSOLIDATED FINANCIAL STATEMENTS – (Continued)
91
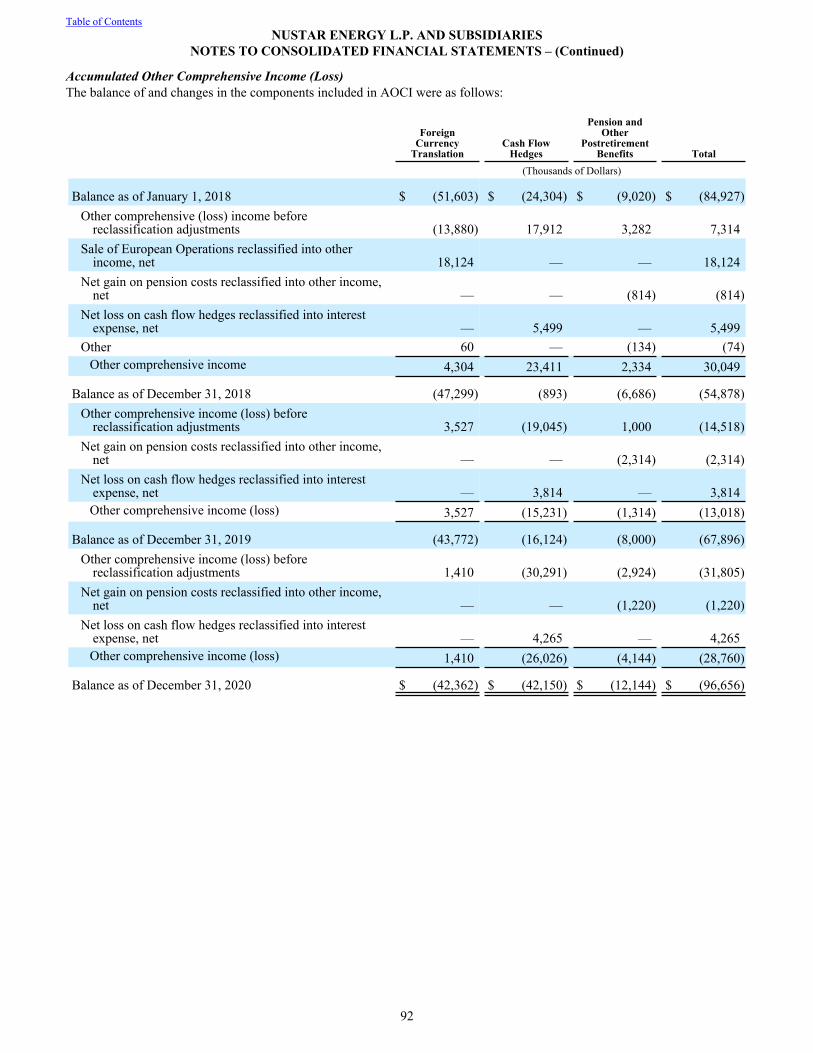
Accumulated Other Comprehensive Income (Loss)The balance of and changes in the components included in AOCI were as follows:
ForeignCurrency
TranslationCash Flow
Hedges
Pension andOther
PostretirementBenefits Total
(Thousands of Dollars)
Balance as of January 1, 2018 $ (51,603) $ (24,304) $ (9,020) $ (84,927) Other comprehensive (loss) income before
reclassification adjustments (13,880) 17,912 3,282 7,314 Sale of European Operations reclassified into other
income, net 18,124 — — 18,124 Net gain on pension costs reclassified into other income,
net — — (814) (814) Net loss on cash flow hedges reclassified into interest
expense, net — 5,499 — 5,499 Other 60 — (134) (74)
Other comprehensive income 4,304 23,411 2,334 30,049
Balance as of December 31, 2018 (47,299) (893) (6,686) (54,878) Other comprehensive income (loss) before
reclassification adjustments 3,527 (19,045) 1,000 (14,518) Net gain on pension costs reclassified into other income,
net — — (2,314) (2,314) Net loss on cash flow hedges reclassified into interest
expense, net — 3,814 — 3,814 Other comprehensive income (loss) 3,527 (15,231) (1,314) (13,018)
Balance as of December 31, 2019 (43,772) (16,124) (8,000) (67,896) Other comprehensive income (loss) before
reclassification adjustments 1,410 (30,291) (2,924) (31,805) Net gain on pension costs reclassified into other income,
net — — (1,220) (1,220) Net loss on cash flow hedges reclassified into interest
expense, net — 4,265 — 4,265 Other comprehensive income (loss) 1,410 (26,026) (4,144) (28,760)
Balance as of December 31, 2020 $ (42,362) $ (42,150) $ (12,144) $ (96,656)
Table of ContentsNUSTAR ENERGY L.P. AND SUBSIDIARIES
NOTES TO CONSOLIDATED FINANCIAL STATEMENTS – (Continued)
92
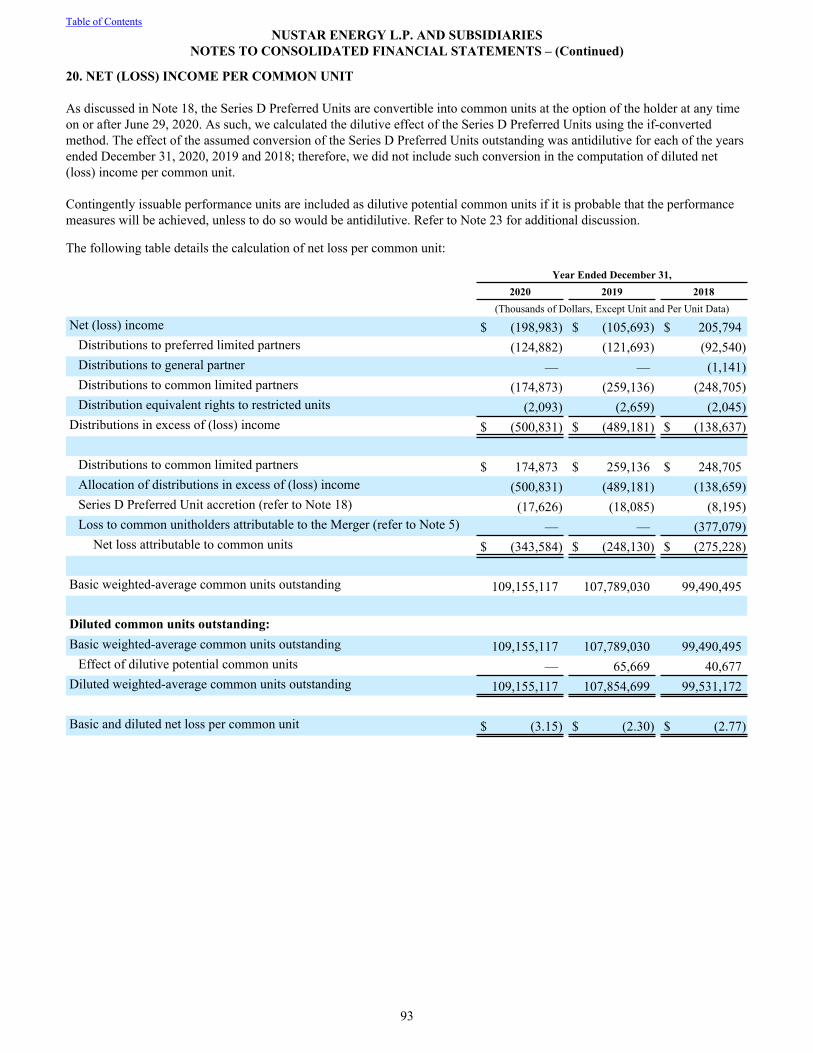
20. NET (LOSS) INCOME PER COMMON UNIT
As discussed in Note 18, the Series D Preferred Units are convertible into common units at the option of the holder at any time on or after June 29, 2020. As such, we calculated the dilutive effect of the Series D Preferred Units using the if-converted method. The effect of the assumed conversion of the Series D Preferred Units outstanding was antidilutive for each of the years ended December 31, 2020, 2019 and 2018; therefore, we did not include such conversion in the computation of diluted net (loss) income per common unit.
Contingently issuable performance units are included as dilutive potential common units if it is probable that the performance measures will be achieved, unless to do so would be antidilutive. Refer to Note 23 for additional discussion.
The following table details the calculation of net loss per common unit:
Year Ended December 31, 2020 2019 2018 (Thousands of Dollars, Except Unit and Per Unit Data)Net (loss) income $ (198,983) $ (105,693) $ 205,794
Distributions to preferred limited partners (124,882) (121,693) (92,540) Distributions to general partner — — (1,141) Distributions to common limited partners (174,873) (259,136) (248,705) Distribution equivalent rights to restricted units (2,093) (2,659) (2,045)
Distributions in excess of (loss) income $ (500,831) $ (489,181) $ (138,637)
Distributions to common limited partners $ 174,873 $ 259,136 $ 248,705 Allocation of distributions in excess of (loss) income (500,831) (489,181) (138,659) Series D Preferred Unit accretion (refer to Note 18) (17,626) (18,085) (8,195) Loss to common unitholders attributable to the Merger (refer to Note 5) — — (377,079)
Net loss attributable to common units $ (343,584) $ (248,130) $ (275,228)
Basic weighted-average common units outstanding 109,155,117 107,789,030 99,490,495
Diluted common units outstanding:Basic weighted-average common units outstanding 109,155,117 107,789,030 99,490,495
Effect of dilutive potential common units — 65,669 40,677 Diluted weighted-average common units outstanding 109,155,117 107,854,699 99,531,172
Basic and diluted net loss per common unit $ (3.15) $ (2.30) $ (2.77)
Table of ContentsNUSTAR ENERGY L.P. AND SUBSIDIARIES
NOTES TO CONSOLIDATED FINANCIAL STATEMENTS – (Continued)
93
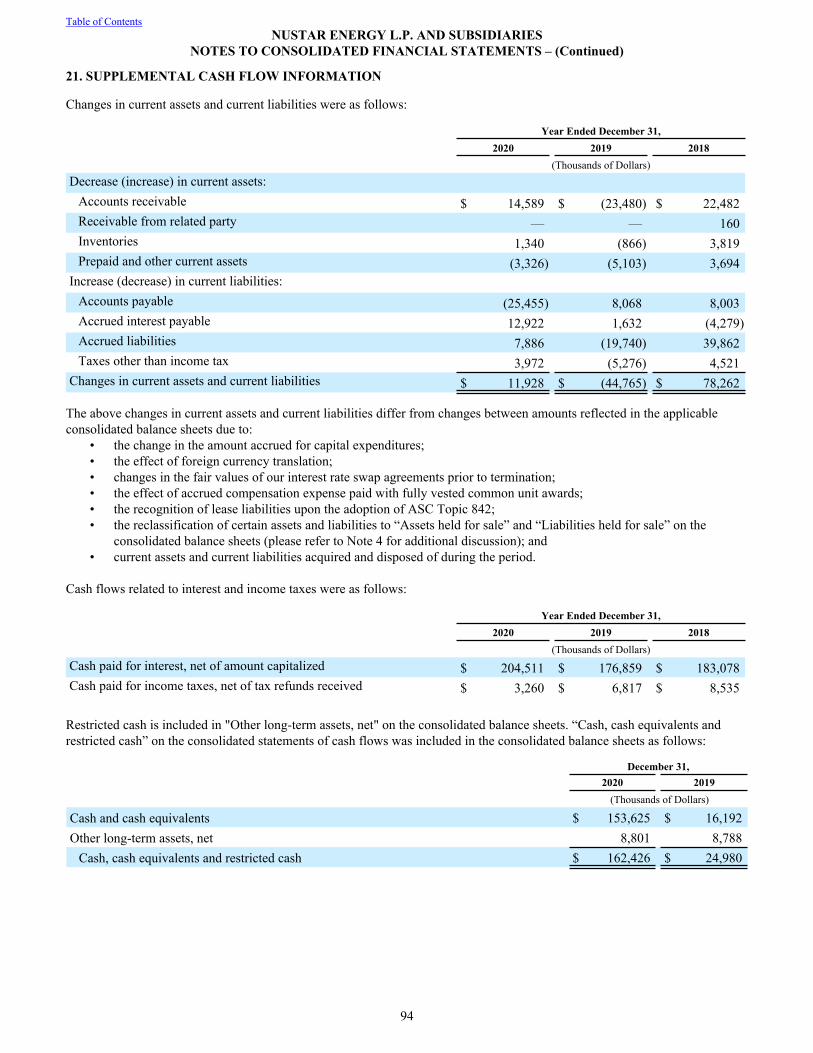
21. SUPPLEMENTAL CASH FLOW INFORMATION
Changes in current assets and current liabilities were as follows:
Year Ended December 31, 2020 2019 2018 (Thousands of Dollars)Decrease (increase) in current assets:
Accounts receivable $ 14,589 $ (23,480) $ 22,482 Receivable from related party — — 160 Inventories 1,340 (866) 3,819 Prepaid and other current assets (3,326) (5,103) 3,694
Increase (decrease) in current liabilities:Accounts payable (25,455) 8,068 8,003 Accrued interest payable 12,922 1,632 (4,279) Accrued liabilities 7,886 (19,740) 39,862 Taxes other than income tax 3,972 (5,276) 4,521
Changes in current assets and current liabilities $ 11,928 $ (44,765) $ 78,262
The above changes in current assets and current liabilities differ from changes between amounts reflected in the applicable consolidated balance sheets due to:
• the change in the amount accrued for capital expenditures;• the effect of foreign currency translation; • changes in the fair values of our interest rate swap agreements prior to termination;• the effect of accrued compensation expense paid with fully vested common unit awards;• the recognition of lease liabilities upon the adoption of ASC Topic 842;• the reclassification of certain assets and liabilities to “Assets held for sale” and “Liabilities held for sale” on the
consolidated balance sheets (please refer to Note 4 for additional discussion); and• current assets and current liabilities acquired and disposed of during the period.
Cash flows related to interest and income taxes were as follows:
Year Ended December 31, 2020 2019 2018 (Thousands of Dollars)Cash paid for interest, net of amount capitalized $ 204,511 $ 176,859 $ 183,078 Cash paid for income taxes, net of tax refunds received $ 3,260 $ 6,817 $ 8,535
Restricted cash is included in "Other long-term assets, net" on the consolidated balance sheets. “Cash, cash equivalents and restricted cash” on the consolidated statements of cash flows was included in the consolidated balance sheets as follows:
December 31,2020 2019
(Thousands of Dollars)
Cash and cash equivalents $ 153,625 $ 16,192 Other long-term assets, net 8,801 8,788
Cash, cash equivalents and restricted cash $ 162,426 $ 24,980
Table of ContentsNUSTAR ENERGY L.P. AND SUBSIDIARIES
NOTES TO CONSOLIDATED FINANCIAL STATEMENTS – (Continued)
94
22. EMPLOYEE BENEFIT PLANS
Thrift PlansThe NuStar Thrift Plan (the Thrift Plan) is a qualified defined contribution plan that became effective June 26, 2006. Participation in the Thrift Plan is voluntary and open to substantially all our domestic employees upon their dates of hire. Thrift Plan participants can contribute from 1% up to 30% of their total annual compensation to the Thrift Plan in the form of pre-tax and/or after tax employee contributions. We make matching contributions in an amount equal to 100% of each participant’s employee contributions up to a maximum of 6% of the participant’s total annual compensation. The matching contributions to the Thrift Plan for the years ended December 31, 2020, 2019 and 2018 totaled $7.8 million, $7.6 million and $7.4 million, respectively.
The NuStar Excess Thrift Plan (the Excess Thrift Plan) is a nonqualified deferred compensation plan that became effective July 1, 2006. The Excess Thrift Plan provides benefits to those employees whose compensation and/or annual contributions under the Thrift Plan are subject to the limitations applicable to qualified retirement plans under the Code.
We also maintain other defined contribution plans for certain international employees located in Canada. We maintained plans for international employees in the Caribbean Netherlands, United Kingdom and Netherlands prior to the St. Eustatius Disposition and the European Disposition on July 29, 2019 and November 30, 2018, respectively. For the years ended December 31, 2020, 2019 and 2018, our costs for these plans totaled $0.5 million, $0.9 million and $2.5 million, respectively.
Pension and Other Postretirement Benefits The NuStar Pension Plan (the Pension Plan) is a qualified non-contributory defined benefit pension plan that provides eligible U.S. employees with retirement income as calculated under a cash balance formula. Under the cash balance formula, benefits are determined based on age, years of vesting service and interest credits, and employees become fully vested in their benefits upon attaining three years of vesting service. Prior to January 1, 2014, eligible employees were covered under either a cash balance formula or a final average pay formula (FAP). Effective January 1, 2014, the Pension Plan was amended to freeze the FAP benefits as of December 31, 2013, and going forward, all eligible employees are covered under the cash balance formula discussed above.
We also maintain an excess pension plan (the Excess Pension Plan), which is a nonqualified deferred compensation plan that provides benefits to a select group of management or other highly compensated employees. Neither the Excess Thrift Plan nor the Excess Pension Plan is intended to constitute either a qualified plan under the provisions of Section 401 of the Code or a funded plan subject to the Employee Retirement Income Security Act.
The Pension Plan and Excess Pension Plan are collectively referred to as the Pension Plans in the tables and discussion below. Our other postretirement benefit plans include a contributory medical benefits plan for U.S. employees who retired prior to April 1, 2014 and, for employees who retire on or after April 1, 2014, a partial reimbursement for eligible third-party health care premiums. We use December 31 as the measurement date for our pension and other postretirement plans.
Table of ContentsNUSTAR ENERGY L.P. AND SUBSIDIARIES
NOTES TO CONSOLIDATED FINANCIAL STATEMENTS – (Continued)
95
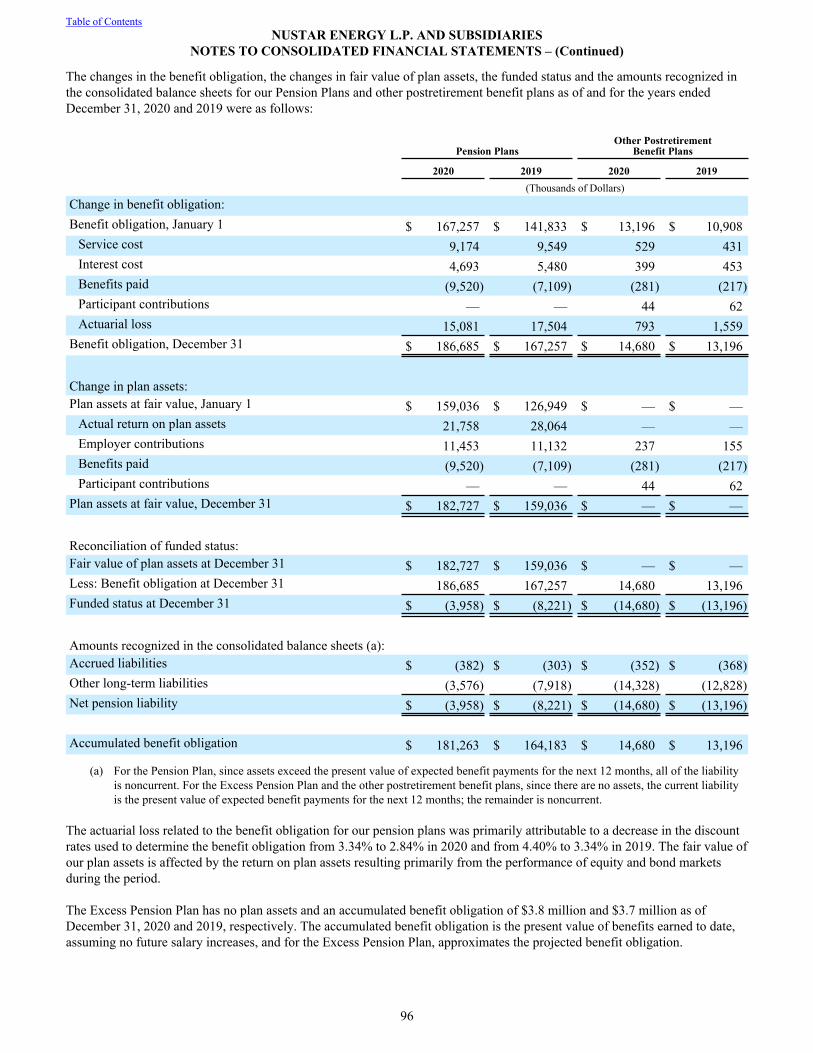
The changes in the benefit obligation, the changes in fair value of plan assets, the funded status and the amounts recognized in the consolidated balance sheets for our Pension Plans and other postretirement benefit plans as of and for the years ended December 31, 2020 and 2019 were as follows:
Pension PlansOther Postretirement
Benefit Plans
2020 2019 2020 2019(Thousands of Dollars)
Change in benefit obligation:Benefit obligation, January 1 $ 167,257 $ 141,833 $ 13,196 $ 10,908
Service cost 9,174 9,549 529 431 Interest cost 4,693 5,480 399 453 Benefits paid (9,520) (7,109) (281) (217) Participant contributions — — 44 62 Actuarial loss 15,081 17,504 793 1,559
Benefit obligation, December 31 $ 186,685 $ 167,257 $ 14,680 $ 13,196
Change in plan assets:Plan assets at fair value, January 1 $ 159,036 $ 126,949 $ — $ —
Actual return on plan assets 21,758 28,064 — — Employer contributions 11,453 11,132 237 155 Benefits paid (9,520) (7,109) (281) (217) Participant contributions — — 44 62
Plan assets at fair value, December 31 $ 182,727 $ 159,036 $ — $ —
Reconciliation of funded status:Fair value of plan assets at December 31 $ 182,727 $ 159,036 $ — $ — Less: Benefit obligation at December 31 186,685 167,257 14,680 13,196 Funded status at December 31 $ (3,958) $ (8,221) $ (14,680) $ (13,196)
Amounts recognized in the consolidated balance sheets (a):Accrued liabilities $ (382) $ (303) $ (352) $ (368) Other long-term liabilities (3,576) (7,918) (14,328) (12,828) Net pension liability $ (3,958) $ (8,221) $ (14,680) $ (13,196)
Accumulated benefit obligation $ 181,263 $ 164,183 $ 14,680 $ 13,196
(a) For the Pension Plan, since assets exceed the present value of expected benefit payments for the next 12 months, all of the liability is noncurrent. For the Excess Pension Plan and the other postretirement benefit plans, since there are no assets, the current liability is the present value of expected benefit payments for the next 12 months; the remainder is noncurrent.
The actuarial loss related to the benefit obligation for our pension plans was primarily attributable to a decrease in the discount rates used to determine the benefit obligation from 3.34% to 2.84% in 2020 and from 4.40% to 3.34% in 2019. The fair value of our plan assets is affected by the return on plan assets resulting primarily from the performance of equity and bond markets during the period.
The Excess Pension Plan has no plan assets and an accumulated benefit obligation of $3.8 million and $3.7 million as of December 31, 2020 and 2019, respectively. The accumulated benefit obligation is the present value of benefits earned to date, assuming no future salary increases, and for the Excess Pension Plan, approximates the projected benefit obligation.
Table of ContentsNUSTAR ENERGY L.P. AND SUBSIDIARIES
NOTES TO CONSOLIDATED FINANCIAL STATEMENTS – (Continued)
96
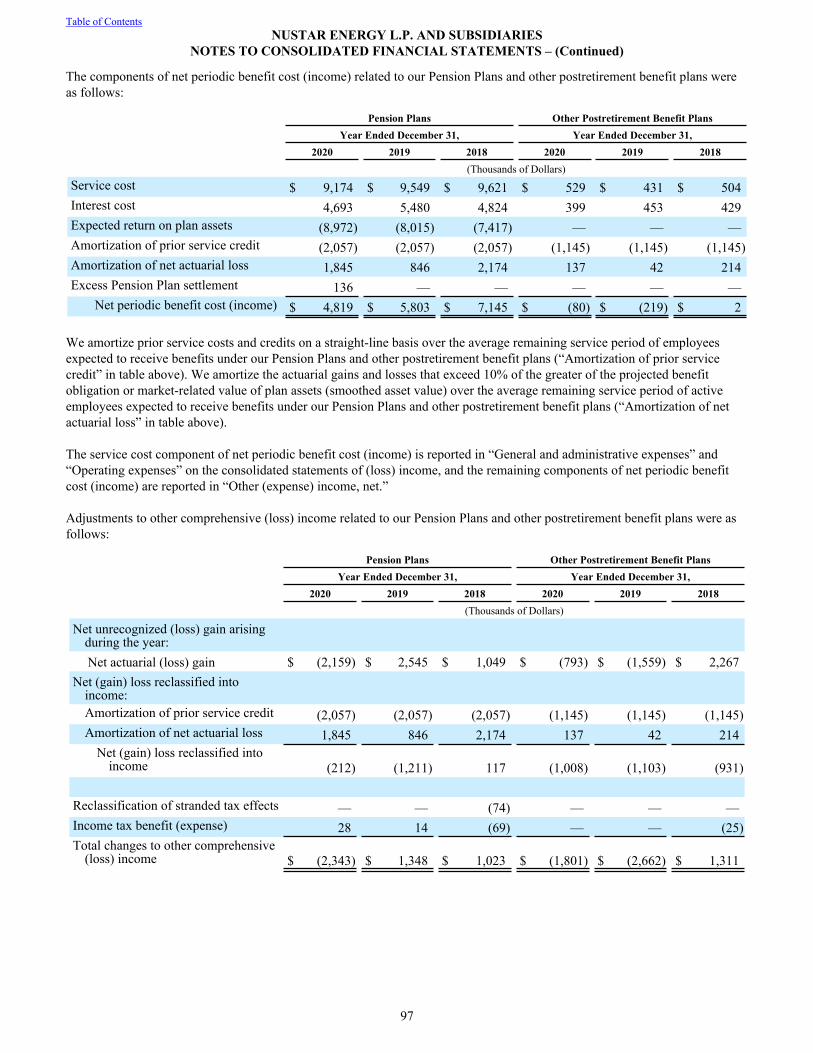
The components of net periodic benefit cost (income) related to our Pension Plans and other postretirement benefit plans were as follows:
Pension Plans Other Postretirement Benefit PlansYear Ended December 31, Year Ended December 31,
2020 2019 2018 2020 2019 2018 (Thousands of Dollars)Service cost $ 9,174 $ 9,549 $ 9,621 $ 529 $ 431 $ 504 Interest cost 4,693 5,480 4,824 399 453 429 Expected return on plan assets (8,972) (8,015) (7,417) — — — Amortization of prior service credit (2,057) (2,057) (2,057) (1,145) (1,145) (1,145) Amortization of net actuarial loss 1,845 846 2,174 137 42 214 Excess Pension Plan settlement 136 — — — — —
Net periodic benefit cost (income) $ 4,819 $ 5,803 $ 7,145 $ (80) $ (219) $ 2
We amortize prior service costs and credits on a straight-line basis over the average remaining service period of employees expected to receive benefits under our Pension Plans and other postretirement benefit plans (“Amortization of prior service credit” in table above). We amortize the actuarial gains and losses that exceed 10% of the greater of the projected benefit obligation or market-related value of plan assets (smoothed asset value) over the average remaining service period of active employees expected to receive benefits under our Pension Plans and other postretirement benefit plans (“Amortization of net actuarial loss” in table above).
The service cost component of net periodic benefit cost (income) is reported in “General and administrative expenses” and “Operating expenses” on the consolidated statements of (loss) income, and the remaining components of net periodic benefit cost (income) are reported in “Other (expense) income, net.”
Adjustments to other comprehensive (loss) income related to our Pension Plans and other postretirement benefit plans were as follows:
Pension Plans Other Postretirement Benefit PlansYear Ended December 31, Year Ended December 31,
2020 2019 2018 2020 2019 2018 (Thousands of Dollars)
Net unrecognized (loss) gain arising during the year:Net actuarial (loss) gain $ (2,159) $ 2,545 $ 1,049 $ (793) $ (1,559) $ 2,267
Net (gain) loss reclassified into income:Amortization of prior service credit (2,057) (2,057) (2,057) (1,145) (1,145) (1,145) Amortization of net actuarial loss 1,845 846 2,174 137 42 214
Net (gain) loss reclassified into income (212) (1,211) 117 (1,008) (1,103) (931)
Reclassification of stranded tax effects — — (74) — — — Income tax benefit (expense) 28 14 (69) — — (25) Total changes to other comprehensive
(loss) income $ (2,343) $ 1,348 $ 1,023 $ (1,801) $ (2,662) $ 1,311
Table of ContentsNUSTAR ENERGY L.P. AND SUBSIDIARIES
NOTES TO CONSOLIDATED FINANCIAL STATEMENTS – (Continued)
97
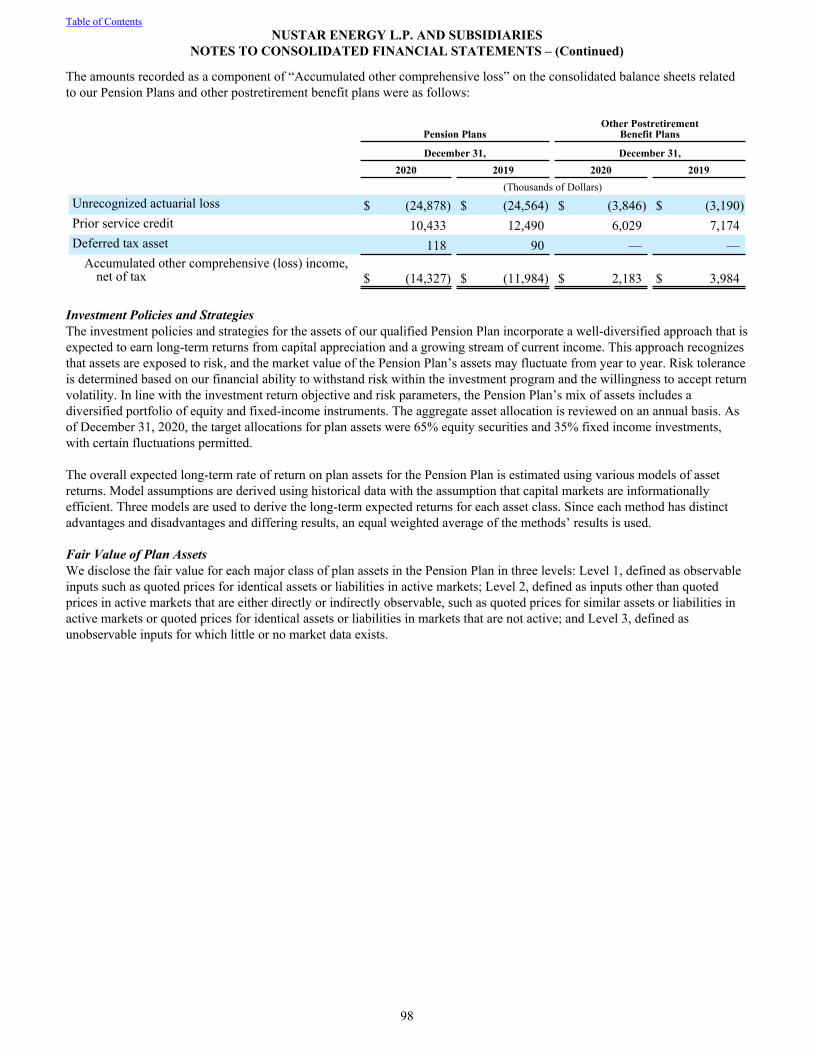
The amounts recorded as a component of “Accumulated other comprehensive loss” on the consolidated balance sheets related to our Pension Plans and other postretirement benefit plans were as follows:
Pension PlansOther Postretirement
Benefit Plans
December 31, December 31, 2020 2019 2020 2019 (Thousands of Dollars)Unrecognized actuarial loss $ (24,878) $ (24,564) $ (3,846) $ (3,190) Prior service credit 10,433 12,490 6,029 7,174 Deferred tax asset 118 90 — —
Accumulated other comprehensive (loss) income, net of tax $ (14,327) $ (11,984) $ 2,183 $ 3,984
Investment Policies and StrategiesThe investment policies and strategies for the assets of our qualified Pension Plan incorporate a well-diversified approach that is expected to earn long-term returns from capital appreciation and a growing stream of current income. This approach recognizes that assets are exposed to risk, and the market value of the Pension Plan’s assets may fluctuate from year to year. Risk tolerance is determined based on our financial ability to withstand risk within the investment program and the willingness to accept return volatility. In line with the investment return objective and risk parameters, the Pension Plan’s mix of assets includes a diversified portfolio of equity and fixed-income instruments. The aggregate asset allocation is reviewed on an annual basis. As of December 31, 2020, the target allocations for plan assets were 65% equity securities and 35% fixed income investments, with certain fluctuations permitted.
The overall expected long-term rate of return on plan assets for the Pension Plan is estimated using various models of asset returns. Model assumptions are derived using historical data with the assumption that capital markets are informationally efficient. Three models are used to derive the long-term expected returns for each asset class. Since each method has distinct advantages and disadvantages and differing results, an equal weighted average of the methods’ results is used.
Fair Value of Plan AssetsWe disclose the fair value for each major class of plan assets in the Pension Plan in three levels: Level 1, defined as observable inputs such as quoted prices for identical assets or liabilities in active markets; Level 2, defined as inputs other than quoted prices in active markets that are either directly or indirectly observable, such as quoted prices for similar assets or liabilities in active markets or quoted prices for identical assets or liabilities in markets that are not active; and Level 3, defined as unobservable inputs for which little or no market data exists.
Table of ContentsNUSTAR ENERGY L.P. AND SUBSIDIARIES
NOTES TO CONSOLIDATED FINANCIAL STATEMENTS – (Continued)
98
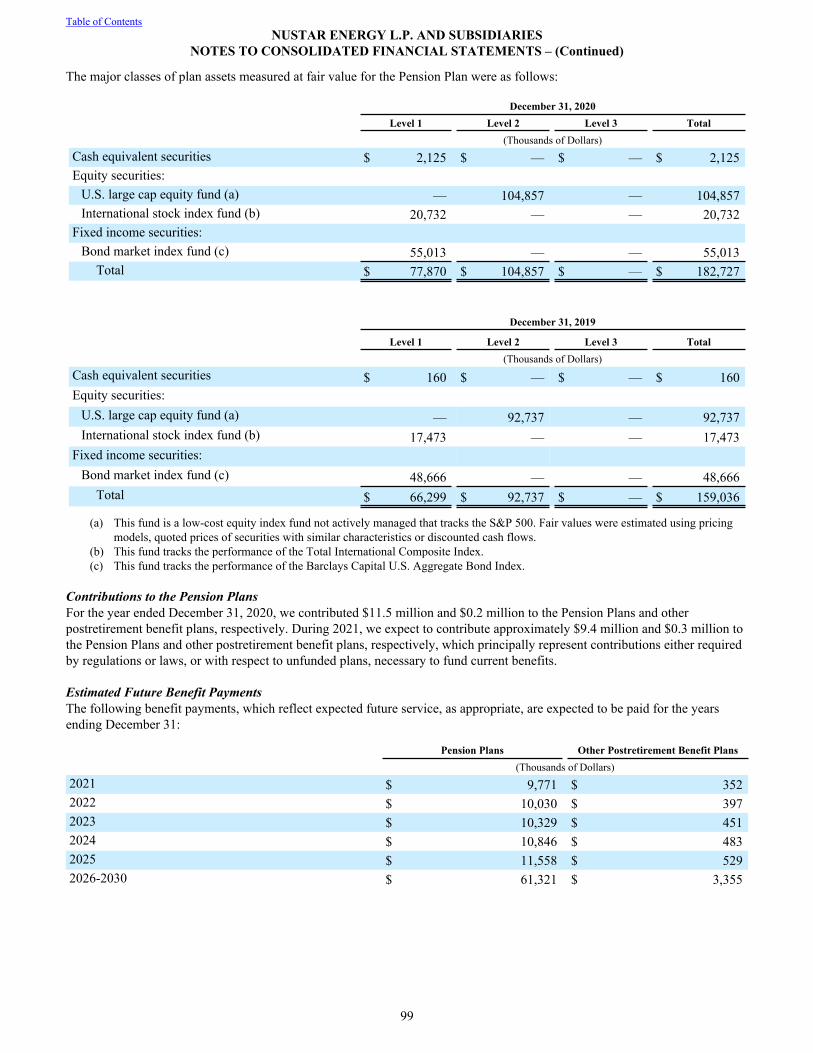
The major classes of plan assets measured at fair value for the Pension Plan were as follows:
December 31, 2020 Level 1 Level 2 Level 3 Total (Thousands of Dollars)Cash equivalent securities $ 2,125 $ — $ — $ 2,125 Equity securities:
U.S. large cap equity fund (a) — 104,857 — 104,857 International stock index fund (b) 20,732 — — 20,732
Fixed income securities:Bond market index fund (c) 55,013 — — 55,013
Total $ 77,870 $ 104,857 $ — $ 182,727
December 31, 2019
Level 1 Level 2 Level 3 Total(Thousands of Dollars)
Cash equivalent securities $ 160 $ — $ — $ 160 Equity securities:
U.S. large cap equity fund (a) — 92,737 — 92,737 International stock index fund (b) 17,473 — — 17,473
Fixed income securities:Bond market index fund (c) 48,666 — — 48,666
Total $ 66,299 $ 92,737 $ — $ 159,036
(a) This fund is a low-cost equity index fund not actively managed that tracks the S&P 500. Fair values were estimated using pricing models, quoted prices of securities with similar characteristics or discounted cash flows.
(b) This fund tracks the performance of the Total International Composite Index.(c) This fund tracks the performance of the Barclays Capital U.S. Aggregate Bond Index.
Contributions to the Pension PlansFor the year ended December 31, 2020, we contributed $11.5 million and $0.2 million to the Pension Plans and other postretirement benefit plans, respectively. During 2021, we expect to contribute approximately $9.4 million and $0.3 million to the Pension Plans and other postretirement benefit plans, respectively, which principally represent contributions either required by regulations or laws, or with respect to unfunded plans, necessary to fund current benefits.
Estimated Future Benefit PaymentsThe following benefit payments, which reflect expected future service, as appropriate, are expected to be paid for the years ending December 31:
Pension Plans Other Postretirement Benefit Plans (Thousands of Dollars)2021 $ 9,771 $ 352 2022 $ 10,030 $ 397 2023 $ 10,329 $ 451 2024 $ 10,846 $ 483 2025 $ 11,558 $ 529 2026-2030 $ 61,321 $ 3,355
Table of ContentsNUSTAR ENERGY L.P. AND SUBSIDIARIES
NOTES TO CONSOLIDATED FINANCIAL STATEMENTS – (Continued)
99
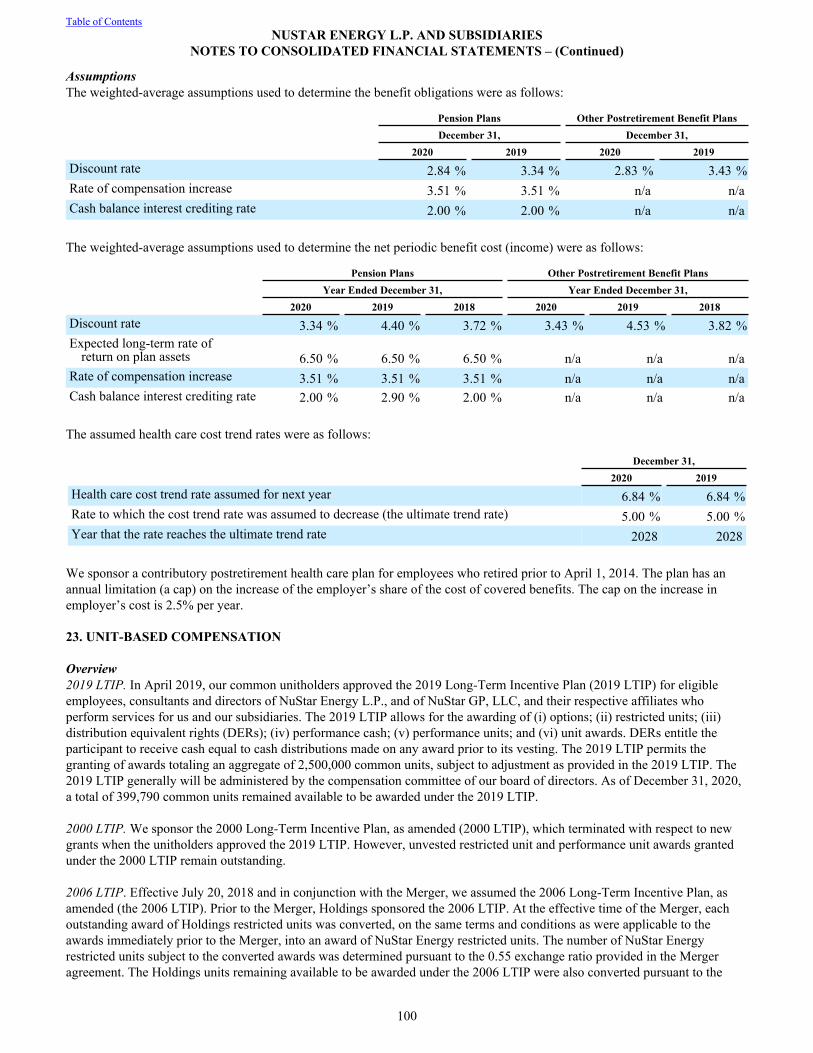
AssumptionsThe weighted-average assumptions used to determine the benefit obligations were as follows:
Pension Plans Other Postretirement Benefit PlansDecember 31, December 31,
2020 2019 2020 2019Discount rate 2.84 % 3.34 % 2.83 % 3.43 %Rate of compensation increase 3.51 % 3.51 % n/a n/aCash balance interest crediting rate 2.00 % 2.00 % n/a n/a
The weighted-average assumptions used to determine the net periodic benefit cost (income) were as follows:
Pension Plans Other Postretirement Benefit PlansYear Ended December 31, Year Ended December 31,
2020 2019 2018 2020 2019 2018Discount rate 3.34 % 4.40 % 3.72 % 3.43 % 4.53 % 3.82 %Expected long-term rate of
return on plan assets 6.50 % 6.50 % 6.50 % n/a n/a n/aRate of compensation increase 3.51 % 3.51 % 3.51 % n/a n/a n/aCash balance interest crediting rate 2.00 % 2.90 % 2.00 % n/a n/a n/a
The assumed health care cost trend rates were as follows:
December 31, 2020 2019Health care cost trend rate assumed for next year 6.84 % 6.84 %Rate to which the cost trend rate was assumed to decrease (the ultimate trend rate) 5.00 % 5.00 %Year that the rate reaches the ultimate trend rate 2028 2028
We sponsor a contributory postretirement health care plan for employees who retired prior to April 1, 2014. The plan has an annual limitation (a cap) on the increase of the employer’s share of the cost of covered benefits. The cap on the increase in employer’s cost is 2.5% per year.
23. UNIT-BASED COMPENSATION
Overview2019 LTIP. In April 2019, our common unitholders approved the 2019 Long-Term Incentive Plan (2019 LTIP) for eligible employees, consultants and directors of NuStar Energy L.P., and of NuStar GP, LLC, and their respective affiliates who perform services for us and our subsidiaries. The 2019 LTIP allows for the awarding of (i) options; (ii) restricted units; (iii) distribution equivalent rights (DERs); (iv) performance cash; (v) performance units; and (vi) unit awards. DERs entitle the participant to receive cash equal to cash distributions made on any award prior to its vesting. The 2019 LTIP permits the granting of awards totaling an aggregate of 2,500,000 common units, subject to adjustment as provided in the 2019 LTIP. The 2019 LTIP generally will be administered by the compensation committee of our board of directors. As of December 31, 2020, a total of 399,790 common units remained available to be awarded under the 2019 LTIP.
2000 LTIP. We sponsor the 2000 Long-Term Incentive Plan, as amended (2000 LTIP), which terminated with respect to new grants when the unitholders approved the 2019 LTIP. However, unvested restricted unit and performance unit awards granted under the 2000 LTIP remain outstanding.
2006 LTIP. Effective July 20, 2018 and in conjunction with the Merger, we assumed the 2006 Long-Term Incentive Plan, as amended (the 2006 LTIP). Prior to the Merger, Holdings sponsored the 2006 LTIP. At the effective time of the Merger, each outstanding award of Holdings restricted units was converted, on the same terms and conditions as were applicable to the awards immediately prior to the Merger, into an award of NuStar Energy restricted units. The number of NuStar Energy restricted units subject to the converted awards was determined pursuant to the 0.55 exchange ratio provided in the Merger agreement. The Holdings units remaining available to be awarded under the 2006 LTIP were also converted pursuant to the
Table of ContentsNUSTAR ENERGY L.P. AND SUBSIDIARIES
NOTES TO CONSOLIDATED FINANCIAL STATEMENTS – (Continued)
100
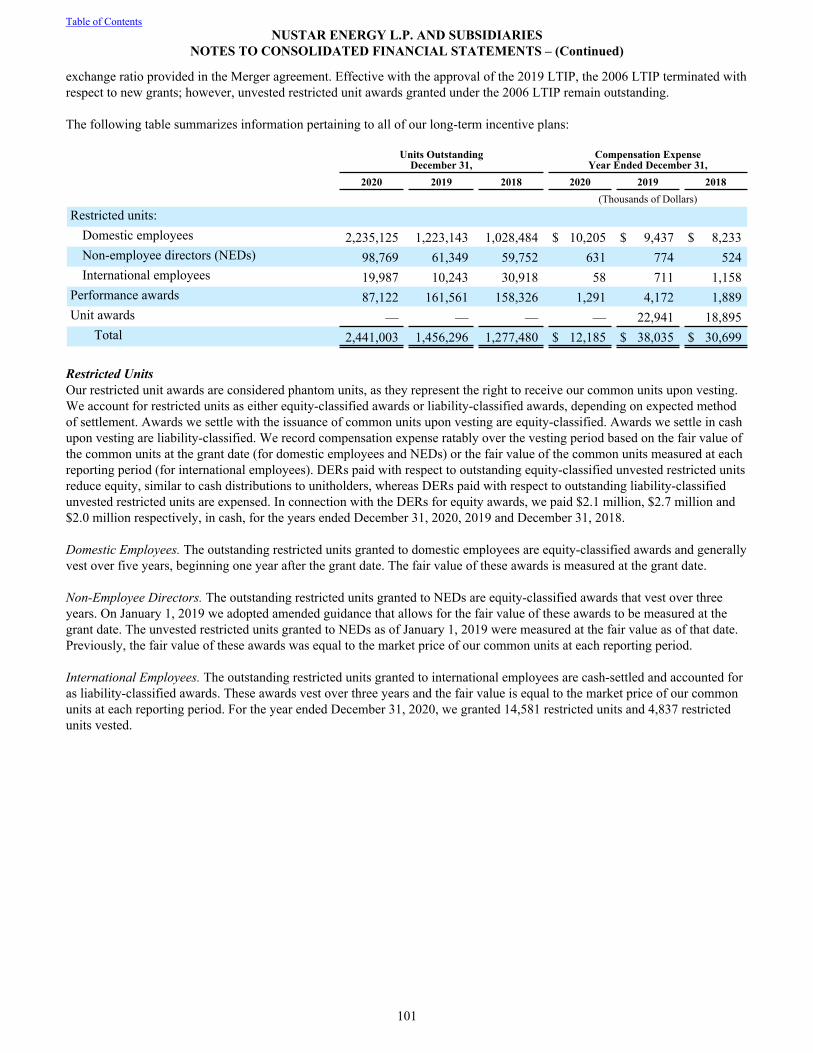
exchange ratio provided in the Merger agreement. Effective with the approval of the 2019 LTIP, the 2006 LTIP terminated with respect to new grants; however, unvested restricted unit awards granted under the 2006 LTIP remain outstanding.
The following table summarizes information pertaining to all of our long-term incentive plans:
Units OutstandingDecember 31,
Compensation ExpenseYear Ended December 31,
2020 2019 2018 2020 2019 2018(Thousands of Dollars)
Restricted units:Domestic employees 2,235,125 1,223,143 1,028,484 $ 10,205 $ 9,437 $ 8,233 Non-employee directors (NEDs) 98,769 61,349 59,752 631 774 524 International employees 19,987 10,243 30,918 58 711 1,158
Performance awards 87,122 161,561 158,326 1,291 4,172 1,889 Unit awards — — — — 22,941 18,895
Total 2,441,003 1,456,296 1,277,480 $ 12,185 $ 38,035 $ 30,699
Restricted Units Our restricted unit awards are considered phantom units, as they represent the right to receive our common units upon vesting. We account for restricted units as either equity-classified awards or liability-classified awards, depending on expected method of settlement. Awards we settle with the issuance of common units upon vesting are equity-classified. Awards we settle in cash upon vesting are liability-classified. We record compensation expense ratably over the vesting period based on the fair value of the common units at the grant date (for domestic employees and NEDs) or the fair value of the common units measured at each reporting period (for international employees). DERs paid with respect to outstanding equity-classified unvested restricted units reduce equity, similar to cash distributions to unitholders, whereas DERs paid with respect to outstanding liability-classified unvested restricted units are expensed. In connection with the DERs for equity awards, we paid $2.1 million, $2.7 million and $2.0 million respectively, in cash, for the years ended December 31, 2020, 2019 and December 31, 2018.
Domestic Employees. The outstanding restricted units granted to domestic employees are equity-classified awards and generally vest over five years, beginning one year after the grant date. The fair value of these awards is measured at the grant date.
Non-Employee Directors. The outstanding restricted units granted to NEDs are equity-classified awards that vest over three years. On January 1, 2019 we adopted amended guidance that allows for the fair value of these awards to be measured at the grant date. The unvested restricted units granted to NEDs as of January 1, 2019 were measured at the fair value as of that date. Previously, the fair value of these awards was equal to the market price of our common units at each reporting period.
International Employees. The outstanding restricted units granted to international employees are cash-settled and accounted for as liability-classified awards. These awards vest over three years and the fair value is equal to the market price of our common units at each reporting period. For the year ended December 31, 2020, we granted 14,581 restricted units and 4,837 restricted units vested.
Table of ContentsNUSTAR ENERGY L.P. AND SUBSIDIARIES
NOTES TO CONSOLIDATED FINANCIAL STATEMENTS – (Continued)
101
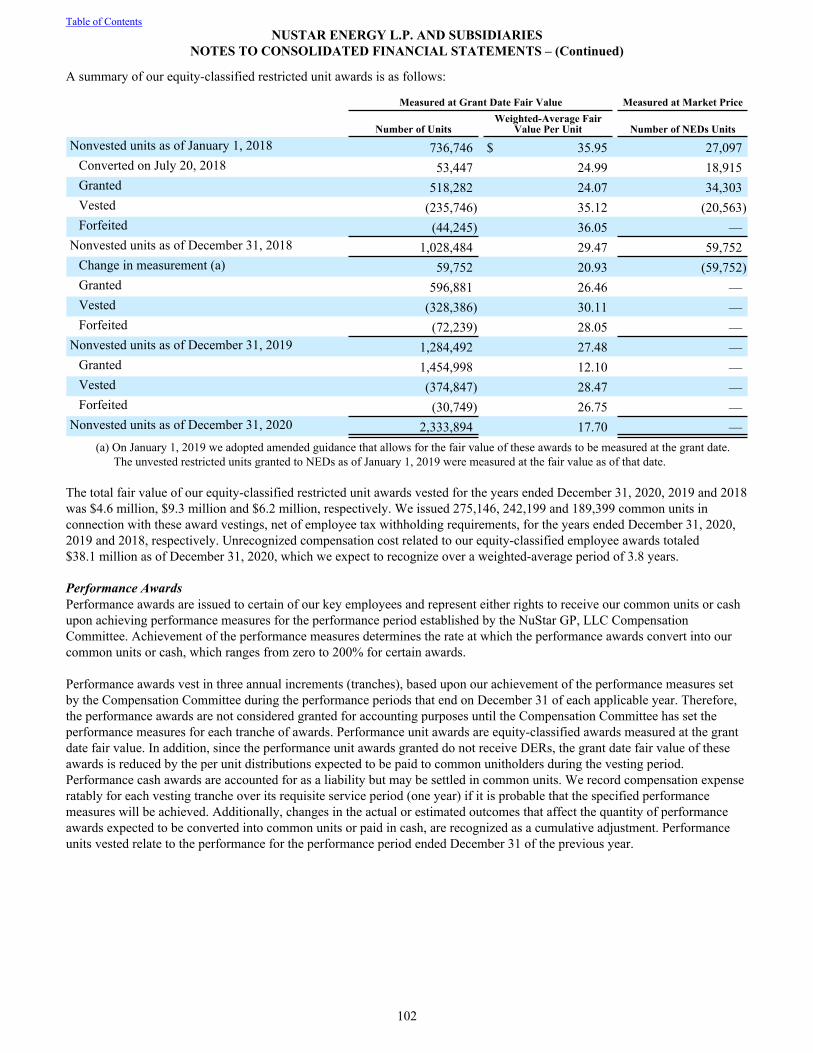
A summary of our equity-classified restricted unit awards is as follows:
Measured at Grant Date Fair Value Measured at Market Price
Number of UnitsWeighted-Average Fair
Value Per Unit Number of NEDs UnitsNonvested units as of January 1, 2018 736,746 $ 35.95 27,097
Converted on July 20, 2018 53,447 24.99 18,915 Granted 518,282 24.07 34,303 Vested (235,746) 35.12 (20,563) Forfeited (44,245) 36.05 —
Nonvested units as of December 31, 2018 1,028,484 29.47 59,752 Change in measurement (a) 59,752 20.93 (59,752) Granted 596,881 26.46 — Vested (328,386) 30.11 — Forfeited (72,239) 28.05 —
Nonvested units as of December 31, 2019 1,284,492 27.48 — Granted 1,454,998 12.10 — Vested (374,847) 28.47 — Forfeited (30,749) 26.75 —
Nonvested units as of December 31, 2020 2,333,894 17.70 — (a) On January 1, 2019 we adopted amended guidance that allows for the fair value of these awards to be measured at the grant date.
The unvested restricted units granted to NEDs as of January 1, 2019 were measured at the fair value as of that date.
The total fair value of our equity-classified restricted unit awards vested for the years ended December 31, 2020, 2019 and 2018 was $4.6 million, $9.3 million and $6.2 million, respectively. We issued 275,146, 242,199 and 189,399 common units in connection with these award vestings, net of employee tax withholding requirements, for the years ended December 31, 2020, 2019 and 2018, respectively. Unrecognized compensation cost related to our equity-classified employee awards totaled $38.1 million as of December 31, 2020, which we expect to recognize over a weighted-average period of 3.8 years.
Performance AwardsPerformance awards are issued to certain of our key employees and represent either rights to receive our common units or cash upon achieving performance measures for the performance period established by the NuStar GP, LLC Compensation Committee. Achievement of the performance measures determines the rate at which the performance awards convert into our common units or cash, which ranges from zero to 200% for certain awards.
Performance awards vest in three annual increments (tranches), based upon our achievement of the performance measures set by the Compensation Committee during the performance periods that end on December 31 of each applicable year. Therefore, the performance awards are not considered granted for accounting purposes until the Compensation Committee has set the performance measures for each tranche of awards. Performance unit awards are equity-classified awards measured at the grant date fair value. In addition, since the performance unit awards granted do not receive DERs, the grant date fair value of these awards is reduced by the per unit distributions expected to be paid to common unitholders during the vesting period. Performance cash awards are accounted for as a liability but may be settled in common units. We record compensation expense ratably for each vesting tranche over its requisite service period (one year) if it is probable that the specified performance measures will be achieved. Additionally, changes in the actual or estimated outcomes that affect the quantity of performance awards expected to be converted into common units or paid in cash, are recognized as a cumulative adjustment. Performance units vested relate to the performance for the performance period ended December 31 of the previous year.
Table of ContentsNUSTAR ENERGY L.P. AND SUBSIDIARIES
NOTES TO CONSOLIDATED FINANCIAL STATEMENTS – (Continued)
102
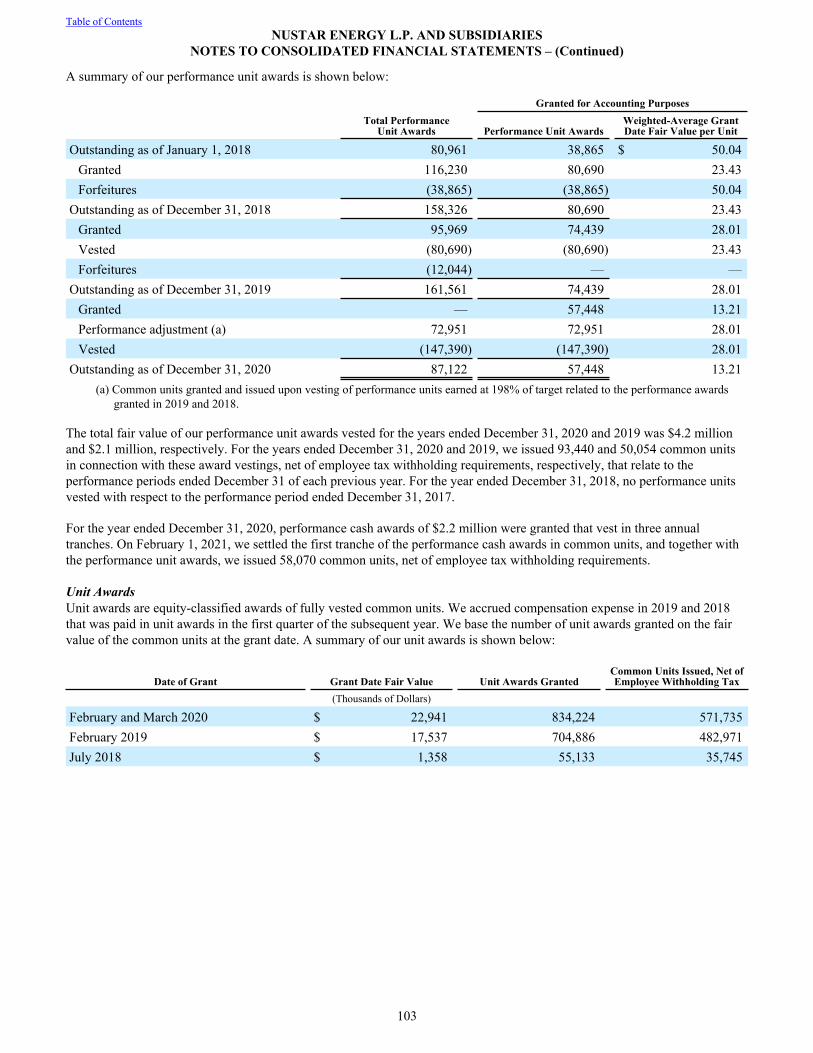
A summary of our performance unit awards is shown below:
Granted for Accounting PurposesTotal Performance
Unit Awards Performance Unit AwardsWeighted-Average Grant Date Fair Value per Unit
Outstanding as of January 1, 2018 80,961 38,865 $ 50.04 Granted 116,230 80,690 23.43 Forfeitures (38,865) (38,865) 50.04
Outstanding as of December 31, 2018 158,326 80,690 23.43 Granted 95,969 74,439 28.01 Vested (80,690) (80,690) 23.43 Forfeitures (12,044) — —
Outstanding as of December 31, 2019 161,561 74,439 28.01 Granted — 57,448 13.21 Performance adjustment (a) 72,951 72,951 28.01 Vested (147,390) (147,390) 28.01
Outstanding as of December 31, 2020 87,122 57,448 13.21 (a) Common units granted and issued upon vesting of performance units earned at 198% of target related to the performance awards
granted in 2019 and 2018.
The total fair value of our performance unit awards vested for the years ended December 31, 2020 and 2019 was $4.2 million and $2.1 million, respectively. For the years ended December 31, 2020 and 2019, we issued 93,440 and 50,054 common units in connection with these award vestings, net of employee tax withholding requirements, respectively, that relate to the performance periods ended December 31 of each previous year. For the year ended December 31, 2018, no performance units vested with respect to the performance period ended December 31, 2017.
For the year ended December 31, 2020, performance cash awards of $2.2 million were granted that vest in three annual tranches. On February 1, 2021, we settled the first tranche of the performance cash awards in common units, and together with the performance unit awards, we issued 58,070 common units, net of employee tax withholding requirements.
Unit AwardsUnit awards are equity-classified awards of fully vested common units. We accrued compensation expense in 2019 and 2018 that was paid in unit awards in the first quarter of the subsequent year. We base the number of unit awards granted on the fair value of the common units at the grant date. A summary of our unit awards is shown below:
Date of Grant Grant Date Fair Value Unit Awards GrantedCommon Units Issued, Net of Employee Withholding Tax
(Thousands of Dollars)
February and March 2020 $ 22,941 834,224 571,735 February 2019 $ 17,537 704,886 482,971 July 2018 $ 1,358 55,133 35,745
Table of ContentsNUSTAR ENERGY L.P. AND SUBSIDIARIES
NOTES TO CONSOLIDATED FINANCIAL STATEMENTS – (Continued)
103
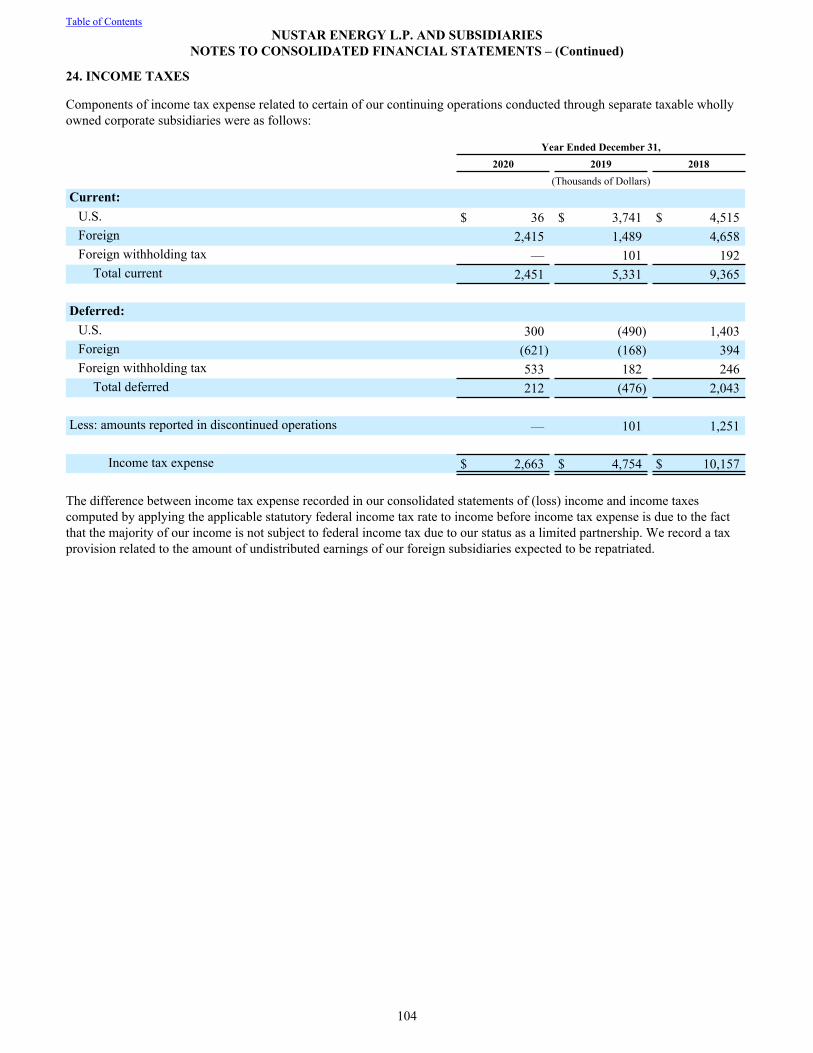
24. INCOME TAXES
Components of income tax expense related to certain of our continuing operations conducted through separate taxable wholly owned corporate subsidiaries were as follows:
Year Ended December 31, 2020 2019 2018 (Thousands of Dollars)Current:
U.S. $ 36 $ 3,741 $ 4,515 Foreign 2,415 1,489 4,658 Foreign withholding tax — 101 192
Total current 2,451 5,331 9,365
Deferred:U.S. 300 (490) 1,403 Foreign (621) (168) 394 Foreign withholding tax 533 182 246
Total deferred 212 (476) 2,043
Less: amounts reported in discontinued operations — 101 1,251
Income tax expense $ 2,663 $ 4,754 $ 10,157
The difference between income tax expense recorded in our consolidated statements of (loss) income and income taxes computed by applying the applicable statutory federal income tax rate to income before income tax expense is due to the fact that the majority of our income is not subject to federal income tax due to our status as a limited partnership. We record a tax provision related to the amount of undistributed earnings of our foreign subsidiaries expected to be repatriated.
Table of ContentsNUSTAR ENERGY L.P. AND SUBSIDIARIES
NOTES TO CONSOLIDATED FINANCIAL STATEMENTS – (Continued)
104
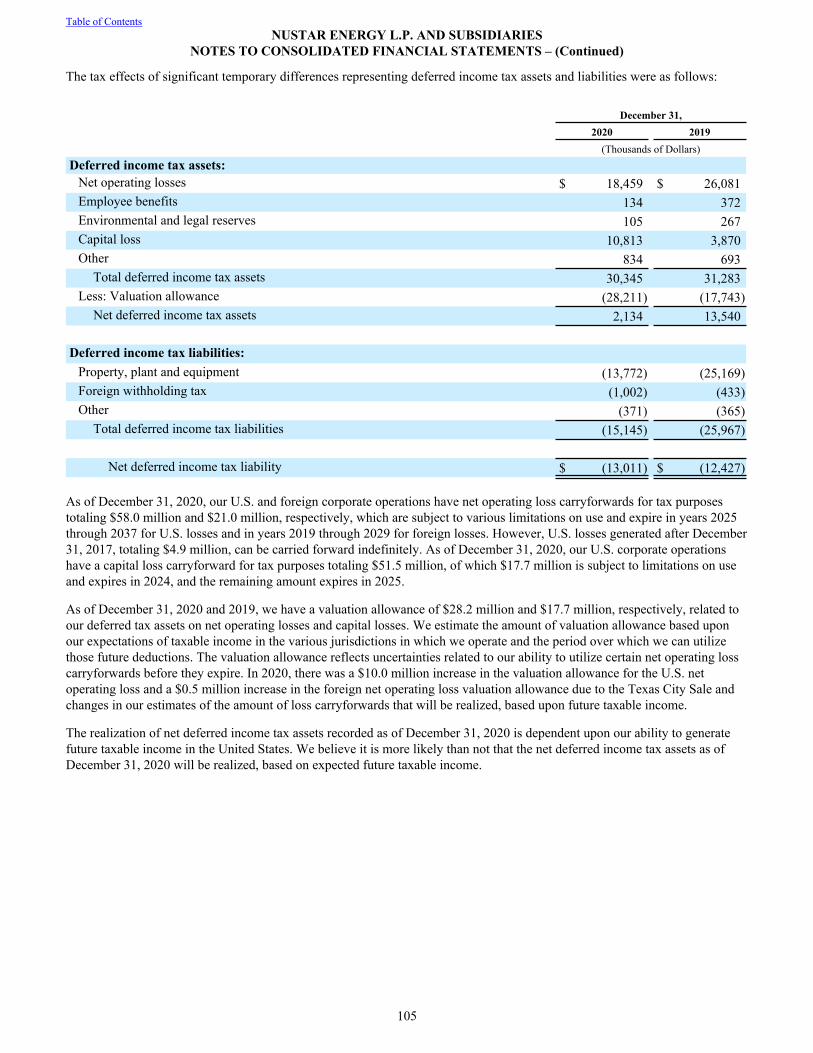
The tax effects of significant temporary differences representing deferred income tax assets and liabilities were as follows:
December 31, 2020 2019 (Thousands of Dollars)Deferred income tax assets:
Net operating losses $ 18,459 $ 26,081 Employee benefits 134 372 Environmental and legal reserves 105 267 Capital loss 10,813 3,870 Other 834 693
Total deferred income tax assets 30,345 31,283 Less: Valuation allowance (28,211) (17,743)
Net deferred income tax assets 2,134 13,540
Deferred income tax liabilities:Property, plant and equipment (13,772) (25,169) Foreign withholding tax (1,002) (433) Other (371) (365)
Total deferred income tax liabilities (15,145) (25,967)
Net deferred income tax liability $ (13,011) $ (12,427) As of December 31, 2020, our U.S. and foreign corporate operations have net operating loss carryforwards for tax purposes totaling $58.0 million and $21.0 million, respectively, which are subject to various limitations on use and expire in years 2025 through 2037 for U.S. losses and in years 2019 through 2029 for foreign losses. However, U.S. losses generated after December 31, 2017, totaling $4.9 million, can be carried forward indefinitely. As of December 31, 2020, our U.S. corporate operations have a capital loss carryforward for tax purposes totaling $51.5 million, of which $17.7 million is subject to limitations on use and expires in 2024, and the remaining amount expires in 2025.
As of December 31, 2020 and 2019, we have a valuation allowance of $28.2 million and $17.7 million, respectively, related to our deferred tax assets on net operating losses and capital losses. We estimate the amount of valuation allowance based upon our expectations of taxable income in the various jurisdictions in which we operate and the period over which we can utilize those future deductions. The valuation allowance reflects uncertainties related to our ability to utilize certain net operating loss carryforwards before they expire. In 2020, there was a $10.0 million increase in the valuation allowance for the U.S. net operating loss and a $0.5 million increase in the foreign net operating loss valuation allowance due to the Texas City Sale and changes in our estimates of the amount of loss carryforwards that will be realized, based upon future taxable income.
The realization of net deferred income tax assets recorded as of December 31, 2020 is dependent upon our ability to generate future taxable income in the United States. We believe it is more likely than not that the net deferred income tax assets as of December 31, 2020 will be realized, based on expected future taxable income.
Table of ContentsNUSTAR ENERGY L.P. AND SUBSIDIARIES
NOTES TO CONSOLIDATED FINANCIAL STATEMENTS – (Continued)
105
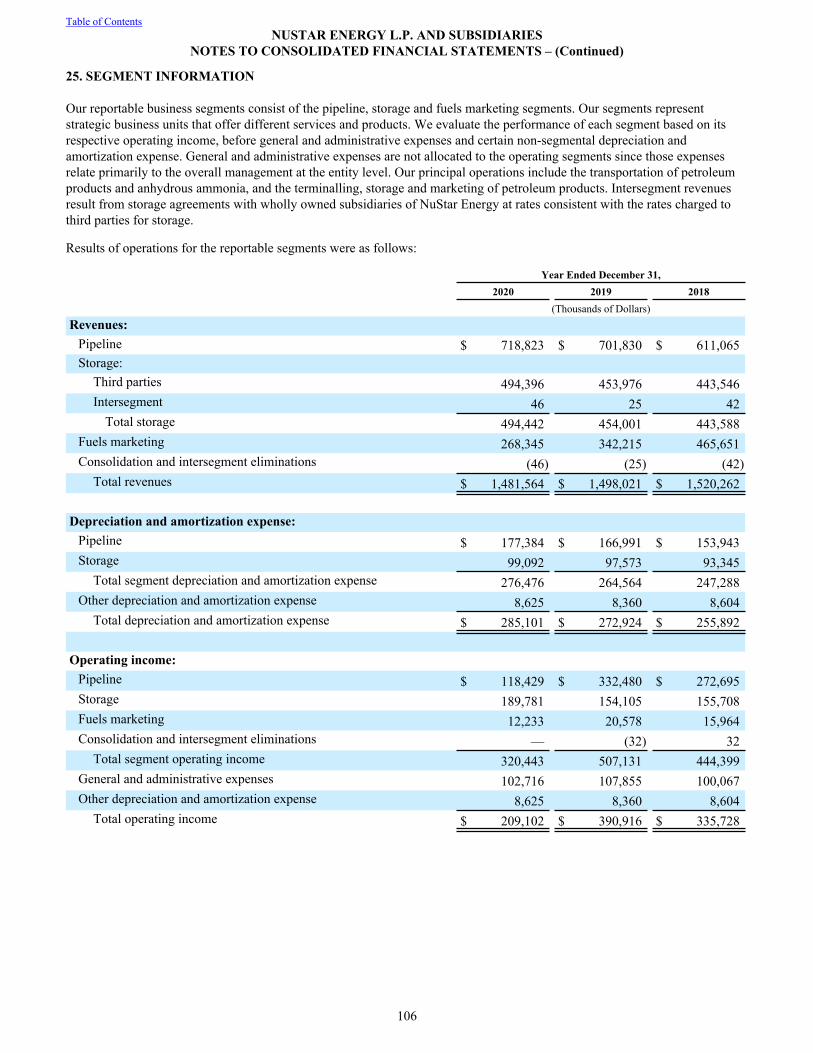
25. SEGMENT INFORMATION
Our reportable business segments consist of the pipeline, storage and fuels marketing segments. Our segments represent strategic business units that offer different services and products. We evaluate the performance of each segment based on its respective operating income, before general and administrative expenses and certain non-segmental depreciation and amortization expense. General and administrative expenses are not allocated to the operating segments since those expenses relate primarily to the overall management at the entity level. Our principal operations include the transportation of petroleum products and anhydrous ammonia, and the terminalling, storage and marketing of petroleum products. Intersegment revenues result from storage agreements with wholly owned subsidiaries of NuStar Energy at rates consistent with the rates charged to third parties for storage.
Results of operations for the reportable segments were as follows:
Year Ended December 31, 2020 2019 2018 (Thousands of Dollars)Revenues:
Pipeline $ 718,823 $ 701,830 $ 611,065 Storage:
Third parties 494,396 453,976 443,546 Intersegment 46 25 42
Total storage 494,442 454,001 443,588 Fuels marketing 268,345 342,215 465,651 Consolidation and intersegment eliminations (46) (25) (42)
Total revenues $ 1,481,564 $ 1,498,021 $ 1,520,262
Depreciation and amortization expense:Pipeline $ 177,384 $ 166,991 $ 153,943 Storage 99,092 97,573 93,345
Total segment depreciation and amortization expense 276,476 264,564 247,288 Other depreciation and amortization expense 8,625 8,360 8,604
Total depreciation and amortization expense $ 285,101 $ 272,924 $ 255,892
Operating income:Pipeline $ 118,429 $ 332,480 $ 272,695 Storage 189,781 154,105 155,708 Fuels marketing 12,233 20,578 15,964 Consolidation and intersegment eliminations — (32) 32
Total segment operating income 320,443 507,131 444,399 General and administrative expenses 102,716 107,855 100,067 Other depreciation and amortization expense 8,625 8,360 8,604
Total operating income $ 209,102 $ 390,916 $ 335,728
Table of ContentsNUSTAR ENERGY L.P. AND SUBSIDIARIES
NOTES TO CONSOLIDATED FINANCIAL STATEMENTS – (Continued)
106
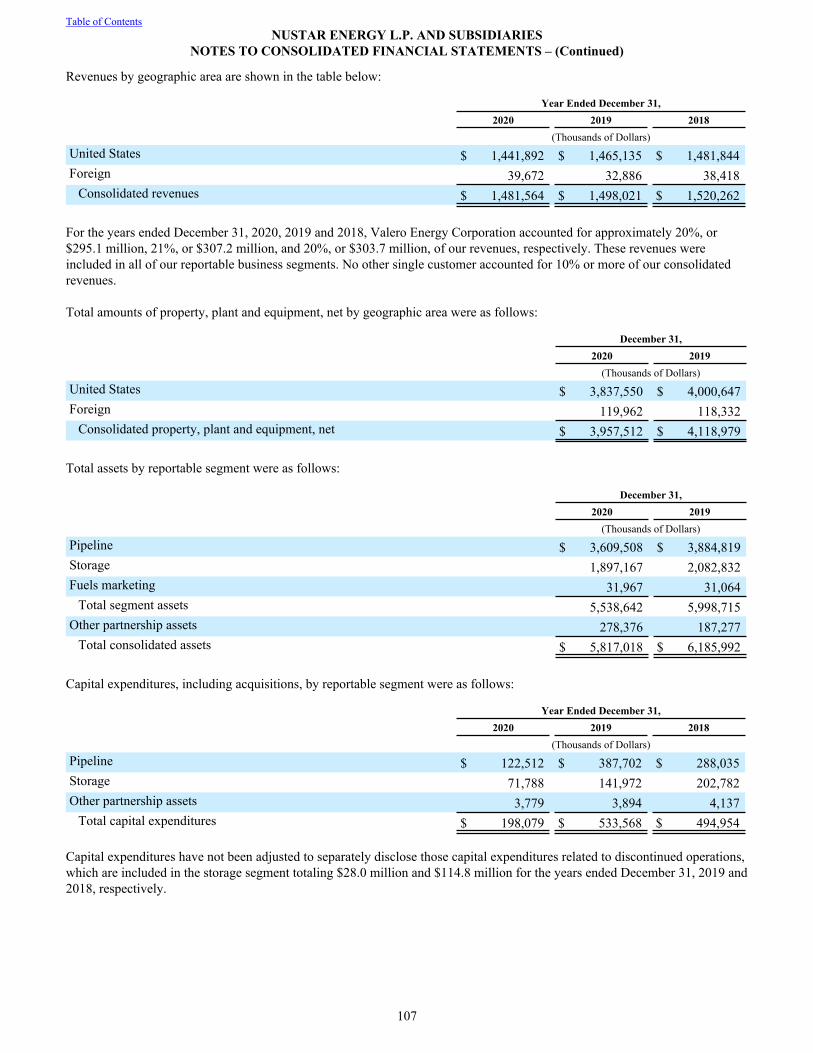
Revenues by geographic area are shown in the table below:
Year Ended December 31, 2020 2019 2018 (Thousands of Dollars)United States $ 1,441,892 $ 1,465,135 $ 1,481,844 Foreign 39,672 32,886 38,418
Consolidated revenues $ 1,481,564 $ 1,498,021 $ 1,520,262
For the years ended December 31, 2020, 2019 and 2018, Valero Energy Corporation accounted for approximately 20%, or $295.1 million, 21%, or $307.2 million, and 20%, or $303.7 million, of our revenues, respectively. These revenues were included in all of our reportable business segments. No other single customer accounted for 10% or more of our consolidated revenues.
Total amounts of property, plant and equipment, net by geographic area were as follows:
December 31, 2020 2019 (Thousands of Dollars)United States $ 3,837,550 $ 4,000,647 Foreign 119,962 118,332
Consolidated property, plant and equipment, net $ 3,957,512 $ 4,118,979
Total assets by reportable segment were as follows:
December 31, 2020 2019 (Thousands of Dollars)Pipeline $ 3,609,508 $ 3,884,819 Storage 1,897,167 2,082,832 Fuels marketing 31,967 31,064
Total segment assets 5,538,642 5,998,715 Other partnership assets 278,376 187,277
Total consolidated assets $ 5,817,018 $ 6,185,992
Capital expenditures, including acquisitions, by reportable segment were as follows:
Year Ended December 31, 2020 2019 2018 (Thousands of Dollars)Pipeline $ 122,512 $ 387,702 $ 288,035 Storage 71,788 141,972 202,782 Other partnership assets 3,779 3,894 4,137
Total capital expenditures $ 198,079 $ 533,568 $ 494,954 Capital expenditures have not been adjusted to separately disclose those capital expenditures related to discontinued operations, which are included in the storage segment totaling $28.0 million and $114.8 million for the years ended December 31, 2019 and 2018, respectively.
Table of ContentsNUSTAR ENERGY L.P. AND SUBSIDIARIES
NOTES TO CONSOLIDATED FINANCIAL STATEMENTS – (Continued)
107
ITEM 9. CHANGES IN AND DISAGREEMENTS WITH ACCOUNTANTS ON ACCOUNTING AND FINANCIAL DISCLOSURE
None. ITEM 9A. CONTROLS AND PROCEDURES
DISCLOSURE CONTROLS AND PROCEDURES
Our management has evaluated, with the participation of the principal executive officer and principal financial officer of NuStar GP, LLC, the effectiveness of our disclosure controls and procedures (as defined in Rule 13a-15(e) under the Securities Exchange Act of 1934) as of the end of the period covered by this report, and has concluded that our disclosure controls and procedures were effective as of December 31, 2020.
INTERNAL CONTROL OVER FINANCIAL REPORTING(a) Management’s Report on Internal Control over Financial Reporting.
Management’s report on NuStar Energy L.P.’s internal control over financial reporting appears in Item 8. of this Form 10-K, and is incorporated herein by reference.
(b) Attestation Report of the Registered Public Accounting Firm.
The report of KPMG LLP on NuStar Energy L.P.’s internal control over financial reporting appears in Item 8. of this Form 10-K, and is incorporated herein by reference.
(c) Changes in Internal Control over Financial Reporting.
There has been no change in our internal control over financial reporting that occurred during our last fiscal quarter that has materially affected, or is reasonably likely to materially affect, our internal control over financial reporting. ITEM 9B. OTHER INFORMATION
None.
Table of Contents
108
PART III
ITEM 10. DIRECTORS, EXECUTIVE OFFICERS AND CORPORATE GOVERNANCE
Information required to be disclosed under this Item 10 is incorporated by reference to the following sections of our Proxy Statement for the 2021 annual meeting of unitholders, which is expected to be filed within 120 days after the end of the fiscal year covered by this Form 10-K (Proxy Statement): “Corporate Governance-Leadership and Governance,” “Corporate Governance-Committees of the Board,” “Corporate Governance-Governance Documents and Codes of Ethics,” “Corporate Governance-Communications with the Board of Directors,” “Delinquent Section 16(a) Reports,” “Proposal No. 1 Election of Directors” and “Information About Our Executive Officers.”
ITEM 11. EXECUTIVE COMPENSATION
Information required to be disclosed under this Item 11 is incorporated by reference to the following sections of our Proxy Statement: “Corporate Governance-Compensation Committee Interlocks and Insider Participation,” “Compensation Committee Report,” “Compensation Discussion and Analysis,” “Evaluation of Compensation Risk,” “Summary Compensation Table,” “Pay Ratio,” “Grants of Plan-Based Awards During the Year Ended December 31, 2020,” “Outstanding Equity Awards at December 31, 2020,” “Option Exercises and Units Vested During the Year Ended December 31, 2020,” “Pension Benefits for the Year Ended December 31, 2020,” “Nonqualified Deferred Compensation for the Year Ended December 31, 2020,” “Potential Payments Upon Termination or Change of Control” and “Director Compensation.”
ITEM 12. SECURITY OWNERSHIP OF CERTAIN BENEFICIAL OWNERS AND MANAGEMENT AND RELATED UNITHOLDER MATTERS
Information required to be disclosed under this Item 12 is incorporated by reference to the following sections of our Proxy Statement: “Security Ownership-Security Ownership of Management and Directors,” “Security Ownership-Security Ownership of Certain Beneficial Owners” and “Security Ownership-Equity Compensation Plan Information.”
ITEM 13. CERTAIN RELATIONSHIPS AND RELATED TRANSACTIONS AND DIRECTOR INDEPENDENCE
Information required to be disclosed under this Item 13 is incorporated by reference to the following sections of our Proxy Statement: “Corporate Governance-Director Independence,” “Corporate Governance-Board Leadership and Governance” and “Certain Relationships and Related Party Transactions.”
ITEM 14. PRINCIPAL ACCOUNTANT FEES AND SERVICES
Information required to be disclosed under this Item 14 is incorporated by reference to the following sections of our Proxy Statement: “KPMG Fees” and “Audit Committee Pre-Approval Policy.”
Table of Contents
109
PART IV
ITEM 15. EXHIBITS AND FINANCIAL STATEMENT SCHEDULES
(a) (1) Financial Statements. The following consolidated financial statements of NuStar Energy L.P. and its subsidiaries are included in Part II, Item 8 of this Form 10-K:Management’s Report on Internal Control over Financial ReportingReports of Independent Registered Public Accounting Firm (KPMG LLP)Consolidated Balance Sheets as of December 31, 2020 and 2019Consolidated Statements of (Loss) Income for the Years Ended December 31, 2020, 2019 and 2018 Consolidated Statements of Comprehensive (Loss) Income for the Years Ended December 31, 2020, 2019 and 2018Consolidated Statements of Cash Flows for the Years Ended December 31, 2020, 2019 and 2018Consolidated Statements of Partners’ Equity and Mezzanine Equity for the Years Ended December 31, 2020, 2019 and 2018Notes to Consolidated Financial Statements
(2) Financial Statement Schedules and Other Financial Information. No financial statement schedules are submitted because either they are inapplicable or because the required information is included in the consolidated financial statements or notes thereto.
(3) Exhibits.The following are filed or furnished, as applicable, as part of this Form 10-K:
ExhibitNumber Description
Incorporated by Referenceto the Following Document
3.01 Amended and Restated Certificate of Limited Partnership of Shamrock Logistics, L.P. (n/k/a NuStar Energy L.P.), effective January 1, 2002
NuStar Energy L.P.’s Annual Report on Form 10-K for year ended December 31, 2001 (File No. 001-16417), Exhibit 3.3
3.02 Amendment to Certificate of Limited Partnership of Valero L.P. (n/k/a NuStar Energy L.P.), dated March 21, 2007 and effective April 1, 2007
NuStar Energy L.P.’s Current Report on Form 8-K filed March 27, 2007 (File No. 001-16417), Exhibit 3.01
3.03 Eighth Amended and Restated Agreement of Limited Partnership of NuStar Energy L.P., dated as of July 20, 2018
NuStar Energy L.P.’s Current Report on Form 8-K filed July 20, 2018 (File No. 001-16417), Exhibit 3.1
3.04 Amended and Restated Certificate of Limited Partnership of Shamrock Logistics Operations, L.P. (n/k/a NuStar Logistics, L.P.), dated as of January 7, 2002 and effective January 8, 2002
NuStar Energy L.P.’s Annual Report on Form 10-K for year ended December 31, 2001 (File No. 001-16417), Exhibit 3.8
3.05 Certificate of Amendment to Certificate of Limited Partnership of Valero Logistics Operations, L.P. (n/k/a NuStar Logistics, L.P.), dated March 21, 2007 and effective April 1, 2007
NuStar Energy L.P.’s Quarterly Report on Form 10-Q for quarter ended March 31, 2007 (File No. 001-16417), Exhibit 3.03
3.06 Certificate of Amendment to Certificate of Limited Partnership of NuStar Logistics, L.P., dated and effective as of March 18, 2014
NuStar Energy L.P.’s Annual Report on Form 10-K for year ended December 31, 2014 (File No. 001-16417), Exhibit 3.09
3.07 Second Amended and Restated Agreement of Limited Partnership of Shamrock Logistics Operations, L.P. (n/k/a NuStar Logistics, L.P.), dated as of April 16, 2001
NuStar Energy L.P.’s Annual Report on Form 10-K for year ended December 31, 2001 (File No. 001-16417), Exhibit 3.9
3.08 First Amendment to Second Amended and Restated Agreement of Limited Partnership of Shamrock Logistics Operations, L.P. (n/k/a NuStar Logistics, L.P.), effective as of April 16, 2001
NuStar Energy L.P.’s Quarterly Report on Form 10-Q for quarter ended June 30, 2001 (File No. 001-16417), Exhibit 4.1
3.09 Second Amendment to Second Amended and Restated Agreement of Limited Partnership of Shamrock Logistics Operations, L.P. (n/k/a NuStar Logistics, L.P.), dated as of January 7, 2002
NuStar Energy L.P.’s Annual Report on Form 10-K for year ended December 31, 2001 (File No. 001-16417), Exhibit 3.10
Table of Contents
110
ExhibitNumber Description
Incorporated by Referenceto the Following Document
3.10 Certificate of Limited Partnership of Riverwalk Logistics, L.P., dated as of June 5, 2000
NuStar Energy L.P.’s Registration Statement on Form S-1 filed August 14, 2000 (File No. 333-43668), Exhibit 3.7
3.11 First Amended and Restated Limited Partnership Agreement of Riverwalk Logistics, L.P., dated as of April 16, 2001
NuStar Energy L.P.’s Annual Report on Form 10-K for year ended December 31, 2001 (File No. 001-16417), Exhibit 3.16
3.12 Certificate of Formation of Shamrock Logistics GP, LLC (n/k/a NuStar GP, LLC), dated as of December 7, 1999
NuStar Energy L.P.’s Registration Statement on Form S-1 filed August 14, 2000 (File No. 333-43668), Exhibit 3.9
3.13 Certificate of Amendment to Certificate of Formation of Shamrock Logistics GP, LLC (n/k/a NuStar GP, LLC), dated as of December 31, 2001
NuStar Energy L.P.’s Annual Report on Form 10-K for year ended December 31, 2001 (File No. 001-16417), Exhibit 3.14
3.14 Certificate of Amendment to Certificate of Formation of Valero GP, LLC (n/k/a NuStar GP, LLC), dated March 21, 2007 and effective April 1, 2007
NuStar Energy L.P.’s Quarterly Report on Form 10-Q for quarter ended March 31, 2007 (File No. 001-16417), Exhibit 3.02
3.15 Second Amended and Restated Limited Liability Company Agreement of NuStar GP, LLC, dated as of July 20, 2018
NuStar Energy L.P.’s Current Report on Form 8-K filed July 20, 2018 (File No. 001-16417), Exhibit 3.2
4.01 Description of Securities *
4.02 Indenture, dated as of July 15, 2002, among Valero Logistics Operations, L.P., as Issuer, Valero L.P., as Guarantor, and The Bank of New York, as Trustee, relating to Senior Debt Securities
NuStar Energy L.P.’s Current Report on Form 8-K filed July 15, 2002 (File No. 001-16417), Exhibit 4.1
4.03 Third Supplemental Indenture, dated as of July 1, 2005, to Indenture dated as of July 15, 2002, as amended and supplemented, among Valero Logistics Operations, L.P., Valero L.P., Kaneb Pipe Line Operating Partnership, L.P., and The Bank of New York Trust Company, N.A.
NuStar Energy L.P.’s Quarterly Report on Form 10-Q for quarter ended June 30, 2005 (File No. 001-16417), Exhibit 4.02
4.04 Instrument of Resignation, Appointment and Acceptance, dated March 31, 2008, among NuStar Logistics, L.P., NuStar Energy L.P., Kaneb Pipeline Operating Partnership, L.P., The Bank of New York Trust Company N.A., and Wells Fargo Bank, National Association
NuStar Energy L.P.’s Annual Report on Form 10-K for year ended December 31, 2008 (File No. 001-16417), Exhibit 4.05
4.05 Sixth Supplemental Indenture, dated as of February 2, 2012, to Indenture dated as of July 15, 2002, among NuStar Logistics, L.P., as Issuer, NuStar Energy L.P., as Guarantor, NuStar Pipeline Operating Partnership L.P., as Affiliate Guarantor, and Wells Fargo Bank, National Association, as Successor Trustee
NuStar Energy L.P.’s Current Report on Form 8-K filed February 7, 2012 (File No. 001-16417), Exhibit 4.3
4.06 Eighth Supplemental Indenture, dated as of April 28, 2017, among NuStar Logistics, L.P., as Issuer, NuStar Energy L.P., as Guarantor, NuStar Pipeline Operating Partnership L.P., as Affiliate Guarantor, and Wells Fargo Bank, National Association, as Successor Trustee
NuStar Energy L.P.’s Current Report on Form 8-K filed April 28, 2017 (File No. 001-16417), Exhibit 4.4
Table of Contents
111
ExhibitNumber Description
Incorporated by Referenceto the Following Document
4.07 Ninth Supplemental Indenture, dated as of May 22, 2019, among NuStar Logistics, L.P., as Issuer, NuStar Energy L.P., as Guarantor, NuStar Pipeline Operating Partnership L.P., as Affiliate Guarantor, and Wells Fargo Bank, National Association, as Successor Trustee
NuStar Energy L.P.’s Current Report on Form 8-K filed May 22, 2019 (File No. 001-16417), Exhibit 4.3
4.08 Tenth Supplemental Indenture, dated as of September 14, 2020, among NuStar Logistics, L.P., as Issuer, NuStar Energy L.P., as Guarantor, NuStar Pipeline Operating Partnership L.P., as Affiliate Guarantor, and Wells Fargo Bank, National Association, as Successor Trustee
NuStar Energy L.P.’s Current Report on Form 8-K filed September 14, 2020 (File No. 001-16417), Exhibit 4.3
4.09 Indenture, dated as of January 22, 2013, among NuStar Logistics, L.P., as Issuer, NuStar Energy L.P., as Guarantor, and Wells Fargo Bank, National Association, as Trustee, relating to Subordinated Debt Securities
NuStar Energy L.P.’s Current Report on Form 8-K filed January 22, 2013 (File No. 001-16417), Exhibit 4.1
4.10 First Supplemental Indenture, dated as of January 22, 2013, among NuStar Logistics, L.P., as Issuer, NuStar Energy L.P., as Parent Guarantor, NuStar Pipeline Operating Partnership L.P., as Affiliate Guarantor, and Wells Fargo Bank, National Association, as Trustee
NuStar Energy L.P.’s Current Report on Form 8-K filed January 22, 2013 (File No. 001-16417), Exhibit 4.2
4.11 Registration Rights Agreement, dated as of June 29, 2018, by and among NuStar Energy L.P. and the Purchasers party thereto
NuStar Energy L.P.’s Current Report on Form 8-K filed June 29, 2018 (File No. 001-16417), Exhibit 4.2
10.01 Amended and Restated 5-Year Revolving Credit Agreement, dated as of October 29, 2014, among NuStar Logistics, L.P., NuStar Energy L.P., the Lenders party thereto and JPMorgan Chase Bank, N.A., as Administrative Agent, SunTrust Bank and Mizuho Bank, Ltd., as Co-Syndication Agents, Wells Fargo Bank, National Association and PNC Bank, National Association, as Co-Documentation Agents, and J.P. Morgan Securities LLC, SunTrust Robinson Humphrey, Inc., Mizuho Bank, Ltd., Wells Fargo Securities, LLC and PNC Capital Markets LLC, as Joint Bookrunners and Joint Lead Arrangers
NuStar Energy L.P.’s Current Report on Form 8-K filed October 31, 2014 (File No. 001-16417), Exhibit 10.1
10.02 First Amendment to Amended and Restated 5-Year Revolving Credit Agreement, dated as of March 19, 2015, among NuStar Logistics, L.P., NuStar Energy L.P., JPMorgan Chase Bank, N.A., as Administrative Agent, and the Lenders party thereto
NuStar Energy L.P.’s Quarterly Report on Form 10-Q for quarter ended June 30, 2015 (File No. 001-16417), Exhibit 10.01
10.03 Second Amendment to Amended and Restated 5-Year Revolving Credit Agreement, dated as of August 22, 2017, among NuStar Logistics, L.P., NuStar Energy L.P., JPMorgan Chase Bank, N.A., as Administrative Agent, and the Lenders party thereto
NuStar Energy L.P.’s Current Report on Form 8-K filed August 22, 2017 (File No. 001-16417), Exhibit 10.01
Table of Contents
112
ExhibitNumber Description
Incorporated by Referenceto the Following Document
10.04 Third Amendment to Amended and Restated 5-Year Revolving Credit Agreement, dated as of November 22, 2017, among NuStar Logistics, L.P., NuStar Energy L.P., JPMorgan Chase Bank, N.A., as Administrative Agent, and the Lenders party thereto
NuStar Energy L.P.’s Current Report on Form 8-K filed November 22, 2017 (File No. 001-16417), Exhibit 10.01
10.05 Fourth Amendment to Amended and Restated 5-Year Revolving Credit Agreement, dated as of March 28, 2018, among NuStar Logistics, L.P., NuStar Energy L.P., JPMorgan Chase Bank, N.A., as Administrative Agent, and the Lenders party thereto
NuStar Energy L.P.’s Current Report on Form 8-K filed March 28, 2018 (File No. 001-16417), Exhibit 10.02
10.06 Fifth Amendment to Amended and Restated 5-Year Revolving Credit Agreement, dated as of June 29, 2018, among NuStar Logistics, L.P., NuStar Energy L.P., JPMorgan Chase Bank, N.A., as Administrative Agent, and the Lenders party thereto
NuStar Energy L.P.’s Current Report on Form 8-K filed June 29, 2018 (File No. 001-16417), Exhibit 10.3
10.07 Sixth Amendment to Amended and Restated 5-Year Revolving Credit Agreement, dated as of September 12, 2019, among NuStar Logistics, L.P., NuStar Energy L.P., JPMorgan Chase Bank, N.A., as Administrative Agent, and the Lenders party thereto
NuStar Energy L.P.’s Current Report on Form 8-K filed September 12, 2019 (File No. 001-16417), Exhibit 10.01
10.08 Seventh Amendment to Amended and Restated 5-Year Revolving Credit Agreement, dated as of March 6, 2020, among NuStar Logistics, L.P., NuStar Energy L.P., JPMorgan Chase Bank, N.A., as Administrative Agent, and the Lenders party thereto
NuStar Energy L.P.’s Current Report on Form 8-K filed March 6, 2020 (File No. 001-16417), Exhibit 10.01
10.09 Eighth Amendment to Amended and Restated 5-Year Revolving Credit Agreement, dated as of April 6, 2020, among NuStar Logistics, L.P., NuStar Energy L.P., JPMorgan Chase Bank, N.A., as Administrative Agent, and the Lenders party thereto
NuStar Energy L.P.’s Current Report on Form 8-K filed April 7, 2020 (File No. 001-16417), Exhibit 10.01
10.10 Ninth Amendment to Amended and Restated 5-Year Revolving Credit Agreement, dated as of February 16, 2021, among NuStar Logistics, L.P., NuStar Energy L.P., JPMorgan Chase Bank, N.A., as Administrative Agent, and the Lenders party thereto
NuStar Energy L.P.’s Current Report on Form 8-K filed February 18, 2021 (File No. 001-16417), Exhibit 10.01
10.11 Lease Agreement between the Parish of St. James, State of Louisiana and NuStar Logistics, L.P. dated as of June 1, 2008
NuStar Energy L.P.’s Current Report on Form 8-K filed June 5, 2020 (File No. 001-16417), Exhibit 10.1
10.12 First Supplement and Amendment to Lease Agreement (Series 2008), dated June 1, 2020, among the Parish of St. James, State of Louisiana, NuStar Logistics, L.P., NuStar Energy L.P. and NuStar Pipeline Operating Partnership L.P.
NuStar Energy L.P.’s Current Report on Form 8-K filed June 5, 2020 (File No. 001-16417), Exhibit 10.2
10.13 Lease Agreement Between Parish of St. James, State of Louisiana and NuStar Logistics, L.P. dated as of July 1, 2010
NuStar Energy L.P.’s Current Report on Form 8-K filed July 21, 2010 (File No. 001-16417), Exhibit 10.01
10.14 First Supplement and Amendment to Lease Agreement (Series 2010), dated June 1, 2020, among the Parish of St. James, State of Louisiana, NuStar Logistics, L.P., NuStar Energy L.P. and NuStar Pipeline Operating Partnership L.P.
NuStar Energy L.P.’s Current Report on Form 8-K filed June 5, 2020 (File No. 001-16417), Exhibit 10.4
Table of Contents
113
ExhibitNumber Description
Incorporated by Referenceto the Following Document
10.15 Lease Agreement between the Parish of St. James, State of Louisiana and NuStar Logistics, L.P. dated as of October 1, 2010
NuStar Energy L.P.’s Current Report on Form 8-K filed June 5, 2020 (File No. 001-16417), Exhibit 10.5
10.16 First Supplement and Amendment to Lease Agreement (Series 2010A), dated June 1, 2020, among the Parish of St. James, State of Louisiana, NuStar Logistics, L.P., NuStar Energy L.P. and NuStar Pipeline Operating Partnership L.P.
NuStar Energy L.P.’s Current Report on Form 8-K filed June 5, 2020 (File No. 001-16417), Exhibit 10.6
10.17 Lease Agreement between Parish of St. James, State of Louisiana and NuStar Logistics, L.P. dated as of December 1, 2010
NuStar Energy L.P.’s Current Report on Form 8-K filed December 30, 2010 (File No. 001-16417), Exhibit 10.01
10.18 First Supplement and Amendment to Lease Agreement (Series 2010B), dated June 1, 2020, among the Parish of St. James, State of Louisiana, NuStar Logistics, L.P., NuStar Energy L.P. and NuStar Pipeline Operating Partnership L.P.
NuStar Energy L.P.’s Current Report on Form 8-K filed June 5, 2020 (File No. 001-16417), Exhibit 10.8
10.19 Lease Agreement between Parish of St. James, State of Louisiana and NuStar Logistics, L.P. dated as of August 1, 2011
NuStar Energy L.P.’s Current Report on Form 8-K filed August 10, 2011 (File No. 001-16417), Exhibit 10.01
10.20 First Supplement and Amendment to Lease Agreement (Series 2011), dated June 1, 2020, among the Parish of St. James, State of Louisiana, NuStar Logistics, L.P., NuStar Energy L.P. and NuStar Pipeline Operating Partnership L.P.
NuStar Energy L.P.’s Current Report on Form 8-K filed June 5, 2020 (File No. 001-16417), Exhibit 10.10
10.21 Purchase and Sale Agreement, dated as of June 15, 2015, among NuStar Energy Services, Inc., NuStar Logistics, L.P., NuStar Pipeline Operating Partnership L.P. and NuStar Supply & Trading LLC, as Originators, NuStar Energy L.P., as Servicer, and NuStar Finance LLC, as Buyer
NuStar Energy L.P.'s Current Report on Form 8-K filed June 19, 2015 (File No. 001-16417), Exhibit 10.1
10.22 Receivables Financing Agreement, dated as of June 15, 2015, by and among NuStar Finance LLC, as Borrower, the persons from time to time party thereto as Lenders and Group Agents, PNC Bank, National Association, as Administrative Agent, and NuStar Energy L.P., as initial Servicer
NuStar Energy L.P.'s Current Report on Form 8-K filed June 19, 2015 (File No. 001-16417), Exhibit 10.2
10.23 Omnibus Amendment, dated as of January 15, 2016, which is the First Amendment to the Purchase and Sale Agreement referenced above and the First Amendment to the Receivables Financing Agreement referenced above among the respective parties thereto
NuStar Energy L.P.’s Annual Report on Form 10-K for year ended December 31, 2015 (File No. 001-16417), Exhibit 10.26
10.24 Second Amendment to Purchase and Sale Agreement, dated as of September 20, 2017, by and among the Originators listed therein, NuStar Energy L.P., NuStar Finance LLC, Mizuho Bank, Ltd. and PNC Bank, National Association
NuStar Energy L.P.’s Current Report on Form 8-K filed September 20, 2017 (File No. 001-16417), Exhibit 10.01
10.25 Second Amendment to Receivables Financing Agreement, dated as of September 20, 2017, by and among NuStar Finance, LLC, as Borrower, NuStar Energy L.P., as initial Servicer, Mizuho Bank, Ltd. and PNC Bank, National Association
NuStar Energy L.P.’s Current Report on Form 8-K filed September 20, 2017 (File No. 001-16417), Exhibit 10.02
Table of Contents
114
ExhibitNumber Description
Incorporated by Referenceto the Following Document
10.26 Third Amendment to Receivables Financing Agreement, dated as of March 28, 2018, by and among NuStar Finance, LLC, as Borrower, NuStar Energy L.P., as initial Servicer, Mizuho Bank, Ltd. and PNC Bank, National Association
NuStar Energy L.P.’s Current Report on Form 8-K filed March 28, 2018 (File No. 001-16417), Exhibit 10.01
10.27 Fourth Amendment to Receivables Financing Agreement, dated as of April 29, 2019, by and among NuStar Finance, LLC, as Borrower, NuStar Energy L.P., as initial Servicer, Mizuho Bank, Ltd. and PNC Bank, National Association
NuStar Energy L.P.’s Current Report on Form 8-K filed April 29, 2019 (File No. 001-16417), Exhibit 10.1
10.28 Fifth Amendment to Receivables Financing Agreement, dated as of September 3, 2020, by and among NuStar Finance, LLC, as Borrower, NuStar Energy L.P., as initial Servicer, and PNC Bank, National Association
NuStar Energy L.P.’s Current Report on Form 8-K filed September 3, 2020 (File No. 001-16417), Exhibit 10.01
+10.29 NuStar GP, LLC Fifth Amended and Restated 2000 Long-Term Incentive Plan, amended and restated as of January 28, 2016
NuStar Energy L.P.’s Annual Report on Form 10-K for year ended December 31, 2017 (File No. 001-16417), Exhibit 10.30
+10.30 First Amendment to the NuStar GP, LLC Fifth Amended and Restated 2000 Long-Term Incentive Plan, dated as of February 7, 2018
NuStar Energy L.P.’s Annual Report on Form 10-K for year ended December 31, 2017 (File No. 001-16417), Exhibit 10.31
+10.31 Form of Restricted Unit Award Agreement under the NuStar GP, LLC Fifth Amended and Restated 2000 Long-Term Incentive Plan
NuStar Energy L.P.’s Annual Report on Form 10-K for year ended December 31, 2016 (File No. 001-16417), Exhibit 10.28
+10.32 Form of 2018 Performance Unit Award Agreement under the NuStar GP, LLC Fifth Amended and Restated 2000 Long-Term Incentive Plan
NuStar Energy L.P.’s Current Report on Form 8-K filed July 25, 2018 (File No. 001-16417), Exhibit 10.1
+10.33 Form of 2018 Non-employee Director Restricted Unit Award Agreement under the NuStar GP, LLC Fifth Amended and Restated 2000 Long-Term Incentive Plan
NuStar Energy L.P.’s Quarterly Report on Form 10-Q for quarter ended September 30, 2018 (File No. 001-16417), Exhibit 10.08
+10.34 NuStar GP Holdings, LLC Long-Term Incentive Plan, amended and restated as of April 1, 2007
NuStar GP Holdings, LLC’s Quarterly Report on Form 10-Q for quarter ended June 30, 2007 (File No. 001-32040), Exhibit 10.04
+10.35 First Amendment to the NuStar GP Holdings, LLC Long-Term Incentive Plan, dated as of February 7, 2018
NuStar GP Holdings, LLC’s Annual Report on Form 10-K for year ended December 31, 2017 (File No. 001-32040), Exhibit 10.46
+10.36 Form of Converted Award Agreement under the NuStar GP Holdings, LLC Amended and Restated Long-Term Incentive Plan
NuStar Energy L.P.’s Current Report on Form 8-K filed July 20, 2018 (File No. 001-16417), Exhibit 10.1
+10.37 Form of Restricted Unit Award Agreement under the NuStar GP Holdings, LLC Amended and Restated Long-Term Incentive Plan
NuStar Energy L.P.’s Quarterly Report on Form 10-Q for quarter ended September 30, 2018 (File No. 001-16417), Exhibit 10.06
+10.38 NuStar Energy L.P. 2019 Long-Term Incentive Plan
NuStar Energy L.P.’s Current Report on Form 8-K filed April 23, 2019 (File No. 001-16417), Exhibit 10.1
+10.39 Form of Restricted Unit Award Agreement under the NuStar Energy L.P. 2019 Long-Term Incentive Plan
NuStar Energy L.P.’s Current Report on Form 8-K filed April 23, 2019 (File No. 001-16417), Exhibit 10.2
+10.40 Form of Non-employee Director Restricted Unit Award Agreement under the NuStar Energy L.P. 2019 Long-Term Incentive Plan
NuStar Energy L.P.’s Current Report on Form 8-K filed April 23, 2019 (File No. 001-16417), Exhibit 10.3
+10.41 Form of 2019 Performance Unit Award Agreement under the NuStar Energy L.P. 2019 Long-Term Incentive Plan
NuStar Energy L.P.’s Quarterly Report on Form 10-Q for quarter ended June 30, 2019 (File No. 001-16417), Exhibit 10.07
Table of Contents
115
ExhibitNumber Description
Incorporated by Referenceto the Following Document
+10.42 Form of 2020 Performance Cash Award Agreement under the NuStar Energy L.P. 2019 Long-Term Incentive Plan
NuStar Energy L.P.’s Quarterly Report on Form 10-Q for quarter ended June 30, 2020 (File No. 001-16417), Exhibit 10.11
+10.43 Form of 2020 Restricted Unit Award Agreement under the NuStar Energy L.P. 2019 Long-Term Incentive Plan
*
+10.44 NuStar Energy L.P. Annual Bonus Plan NuStar Energy L.P.’s Annual Report on Form 10-K for year ended December 31, 2006 (File No. 001-16417), Exhibit 10.18
+10.45 Form of NuStar Energy L.P. Amended and Restated Change of Control Severance Agreement
NuStar Energy L.P.’s Current Report on Form 8-K filed August 4, 2016 (File No. 001-16417), Exhibit 10.1
+10.46 NuStar Excess Pension Plan, amended and restated effective as of January 1, 2014
NuStar Energy L.P.’s Annual Report on Form 10-K for year ended December 31, 2015 (File No. 001-16417), Exhibit 10.45
+10.47 Amendment to NuStar Excess Pension Plan, effective October 9, 2018
NuStar Energy L.P.’s Quarterly Report on Form 10-Q for quarter ended September 30, 2018 (File No. 001-16417), Exhibit 10.04
+10.48 NuStar Excess Thrift Plan, amended and restated effective as of January 1, 2008
NuStar Energy L.P.’s Annual Report on Form 10-K for year ended December 31, 2008 (File No. 001-16417), Exhibit 10.30
+10.49 Amendment to NuStar Excess Thrift Plan, effective as of January 1, 2017
NuStar Energy L.P.’s Quarterly Report on Form 10-Q for quarter ended March 31, 2017 (File No. 001-16417), Exhibit 10.02
+10.50 Amendment No. 2 to NuStar Excess Thrift Plan, effective October 9, 2018
NuStar Energy L.P.’s Quarterly Report on Form 10-Q for quarter ended September 30, 2018 (File No. 001-16417), Exhibit 10.05
10.51 Amended and Restated Aircraft Time Sharing Agreement, dated as of September 4, 2009, between NuStar Logistics, L.P. and William E. Greehey
NuStar Energy L.P.’s Annual Report on Form 10-K for year ended December 31, 2009 (File No. 001-16417), Exhibit 10.24
10.52 First Amendment to Amended and Restated Aircraft Time Sharing Agreement, dated as of August 18, 2017, between NuStar Logistics, L.P. and William E. Greehey
NuStar Energy L.P.’s Quarterly Report on Form 10-Q for quarter ended September 30, 2017 (File No. 001-16417), Exhibit 10.02
21.01 List of subsidiaries of NuStar Energy L.P. *
22.01 Subsidiary Guarantors and Issuers of Guaranteed Securities
*
23.01 Consent of KPMG LLP dated February 25, 2021 *
24.01 Powers of Attorney (included in signature page of this Form 10-K)
*
31.01 Rule 13a-14(a) Certification (under Section 302 of the Sarbanes-Oxley Act of 2002) of principal executive officer
*
31.02 Rule 13a-14(a) Certification (under Section 302 of the Sarbanes-Oxley Act of 2002) of principal financial officer
*
Table of Contents
116
ExhibitNumber Description
Incorporated by Referenceto the Following Document
32.01 Section 1350 Certification (under Section 906 of the Sarbanes-Oxley Act of 2002) of principal executive officer
**
32.02 Section 1350 Certification (under Section 906 of the Sarbanes-Oxley Act of 2002) of principal financial officer
**
101.INS Inline XBRL Instance Document - The instance document does not appear in the Interactive Data File because its XBRL tags are embedded within the Inline XBRL document.
*
101.SCH Inline XBRL Taxonomy Extension Schema Document
*
101.CAL Inline XBRL Taxonomy Extension Calculation Linkbase Document
*
101.DEF Inline XBRL Taxonomy Extension Definition Linkbase Document
*
101.LAB Inline XBRL Taxonomy Extension Label Linkbase Document
*
101.PRE Inline XBRL Taxonomy Extension Presentation Linkbase Document
*
104 Cover page Interactive Data File - Formatted in Inline XBRL and contained in Exhibit 101
*
* Filed herewith.
** Furnished herewith.
+ Identifies management contracts or compensatory plans or arrangements required to be filed as an exhibit hereto pursuant to Item 15 of Form 10-K.
An electronic copy of this Form 10-K is available on our website, free of charge, at http://www.nustarenergy.com (select the “Investors” link, then the “SEC Filings” link). A paper copy of the Form 10-K also is available without charge to unitholders upon written request at the address below. Copies of exhibits filed as a part of this Form 10-K may be obtained by unitholders of record at a charge of $0.15 per page, minimum $5.00 each request. Direct inquiries to Corporate Secretary, NuStar Energy L.P., 19003 IH-10 West, San Antonio, Texas 78257 [email protected].
ITEM 16. FORM 10-K SUMMARY
Not applicable.
Table of Contents
117
SIGNATURES
Pursuant to the requirements of Section 13 or 15(d) of the Exchange Act, the registrant has duly caused this report to be signed on its behalf by the undersigned, thereunto duly authorized.
NUSTAR ENERGY L.P.(Registrant)
By: Riverwalk Logistics, L.P., its general partnerBy: NuStar GP, LLC, its general partner
By: /s/ Bradley C. BarronBradley C. BarronPresident and Chief Executive OfficerFebruary 25, 2021
By: /s/ Thomas R. ShoafThomas R. ShoafExecutive Vice President and Chief Financial OfficerFebruary 25, 2021
By: /s/ Jorge A. del AlamoJorge A. del AlamoSenior Vice President and ControllerFebruary 25, 2021
Table of Contents
118
POWER OF ATTORNEY
KNOW ALL MEN BY THESE PRESENTS, that each person whose signature appears below hereby constitutes and appoints Bradley C. Barron, Thomas R. Shoaf and Amy L. Perry, or any of them, each with power to act without the other, his or her true and lawful attorney-in-fact and agent, with full power of substitution and resubstitution, for him or her and in his or her name, place and stead, in any and all capacities, to sign any or all subsequent amendments and supplements to this Annual Report on Form 10-K, and to file the same, or cause to be filed the same, with all exhibits thereto, and other documents in connection therewith, with the Securities and Exchange Commission, granting unto each said attorney-in-fact and agent full power to do and perform each and every act and thing requisite and necessary to be done in and about the premises, as fully to all intents and purposes as he or she might or could do in person, hereby qualifying and confirming all that said attorney-in-fact and agent or his or her substitute or substitutes may lawfully do or cause to be done by virtue hereof.
Pursuant to the requirements of the Securities Exchange Act of 1934, this report has been signed below by the following persons on behalf of the registrant and in the capacities and on the dates indicated.
Signature Title Date
/s/ William E. Greehey Chairman of the Board February 25, 2021William E. Greehey
/s/ Bradley C. Barron President, Chief Executive February 25, 2021Bradley C. Barron Officer and Director
(Principal Executive Officer)
/s/ Thomas R. Shoaf Executive Vice President February 25, 2021Thomas R. Shoaf and Chief Financial Officer
(Principal Financial Officer)
/s/ Jorge A. del Alamo Senior Vice President and Controller February 25, 2021Jorge A. del Alamo (Principal Accounting Officer)
/s/ J. Dan Bates Director February 25, 2021J. Dan Bates
/s/ William B. Burnett Director February 25, 2021William B. Burnett
/s/ James F. Clingman, Jr. Director February 25, 2021James F. Clingman, Jr.
/s/ Dan J. Hill Director February 25, 2021Dan J. Hill
/s/ Jelynne LeBlanc-Burley Director February 25, 2021Jelynne LeBlanc-Burley
/s/ Robert J. Munch Director February 25, 2021Robert J. Munch
/s/ W. Grady Rosier Director February 25, 2021W. Grady Rosier
Table of Contents
119


![NuStar Logistics, L.P....Danny Oliver [W] Executive Senior Vice President NuStar Logistics, L.P. 19003 IH-10 West San Antonio, TX 78257 Compiled by: Adam Cummins Director – FERC](https://img.pdfslide.us/doc/110x75/5fe55750b61c0e365125ad0d/nustar-logistics-lp-danny-oliver-w-executive-senior-vice-president-nustar.jpg)