Embed Size (px)
DESCRIPTION
Â
Citation preview

EVALUATION OF PAP TESTS COLLECTED BY NURSES IN VICTORIA DURING 2008
Victorian Cervical Cytology Registry

Produced by: Cathryn Wharton Data Manager Victorian Cervical Cytology Registry PO Box 161 Carlton South Vic 3053 Telephone: 03 9250 0390 Fax: 03 9349 1818 E-mail: [email protected]
March 2009

Table of Contents
1. Number of Pap Tests Collected by Nurses ......................................................................1
2. Post-Hysterectomy Tests .................................................................................................2
3. Type of Practice for Nurses..............................................................................................2
4. Location and Volume of Practice......................................................................................3
5. Location of Women Screened ..........................................................................................4
6. Age Distribution of Women Screened ..............................................................................4
7. Proportion of Pap Tests Collected by Nurses by DHS Region.........................................5
8. Endocervical Status..........................................................................................................6
9. Profile of Pap Test Reports for Women with a Cervix ......................................................6
10. Time Since Previous Screening for Women with a Cervix ...............................................7
11. Conclusion........................................................................................................................7
12. References .......................................................................................................................8

Tables and Figures Table 1.1 Number of Pap tests collected by nurses in Victoria ………..……………… 1 Figure 1.1 Proportion of Pap tests collected by nurses in Victoria…………………….. 1 Table 3.1 Number of Pap tests collected by nurses in 2008 by practice type……….. 2 Figure 3.1 Proportion of Pap tests collected by nurses by practice type……………… 2 Table 4.1 Nurse location and volume of Pap tests by ARIA classification…………… 3 Table 5.1 Location of women by ARIA classification for Pap tests collected by
nurses…………………………………………………………………………….
4 Table 6.1 Age distribution of women screened in 2008……………………………… 4 Table 7.1 Pap tests for women with a cervix collected by nurses by Department of
Human Services region…………………………………………………………
5 Figure 7.1 Proportion of Pap tests collected by nurses in 2008 by Victorian DHS
region……………………………………………………………………………..
5 Figure 8.1 Proportion of Victorian Pap tests with an endocervical component for
nurses and other practitioner types……………………………………………
6 Table 9.1 Profile of Pap test reports collected in 2008 for women with a cervix…….. 6 Table 10.1 Time since previous Pap test for women with a cervix……………………... 7

1
1. Number of Pap Tests Collected by Nurses As known to the Victorian Cervical Cytology Registry (VCCR), a total of 21,668 Pap tests were collected by nurses during 2008 (with 21,417 being from women with a cervix). This is out of a total of 564,565 Victorian Pap tests for 2008 (with 554,738 being from women with a cervix). The number of tests collected by nurses represents 3.8% of all Victorian Pap tests collected in 2008. The following table shows comparison figures for earlier years. Over the last ten years, the number and proportion of Pap tests collected by nurses has more than doubled.
Table 1.1 Number of Pap tests collected by nurses in Victoria
Year
Number of Pap tests collected by nurses
% of all Victorian Pap tests
2008 21,668 3.8%
2007 18,651 3.2%
2006 16,035 2.8%
2005 14,375 2.5%
2004 13,100 2.2%
2003 11,494 2.0%
2002 10,635 1.8%
2001 11,017 1.9%
2000 9,628 1.7%
1999 9,922 1.6%
0.0%
0.5%
1.0%
1.5%
2.0%
2.5%
3.0%
3.5%
4.0%
1999 2000 2001 2002 2003 2004 2005 2006 2007 2008
Year
Perc
enta
ge
Figure 1.1 Proportion of Pap tests collected by nurses in Victoria

2
2. Post-Hysterectomy Tests Two hundred and fifty one Pap tests collected by nurses during 2008 were taken from women whose records indicate they have had a hysterectomy. This represents 1.2% of tests collected by nurses during 2008 (which is the similar to the proportion for 2007 which was 1.3%). When excluding nurses 1.8% of all Victorian Pap tests collected in 2008 were from women who have had a hysterectomy and this is comparable with previous years.
3. Type of Practice for Nurses Of the Pap tests collected by nurses in 2008, the majority were conducted in General Practice or a Community Health setting. The combined proportion of Pap tests collected in General Practice or a Community Health setting increased from 76.8% in 2007 (data not shown) to 80.6% in 2008.
Table 3.1 Number of Pap tests collected by nurses in 2008 by practice type
Practice type Number of practices
Number of nurses at each practice type1
Number of smears taken in 2008 by nurses
% of smears by practice
type
General Practice 134 113 10,551 48.7%
Community Health Setting 118 95 6,908 31.9%
Women’s Health Service 10 7 758 3.5%
Sexual Health2 49 37 1,072 4.9%
Other eg: hospital and dysplasia clinics 65 33 2,379 11.0%
Total 376 285 21,668 100%
1 The most common practice type used for nurses who worked at multiple practices. 2 Sexual Health includes Melbourne Sexual Health Centre and Family Planning, Action Centre.
0%
10%
20%
30%
40%
50%
60%
General Practice
CommunityHealth Setting
Women’sHealthService
Sexual Health Other eg:hospital &dysplasia
clinicsPractice Type
Perc
enta
ge
Figure 3.1 Proportion of Pap tests collected by nurses by practice type

3
4. Location and Volume of Practice During 2008, the Registry recorded 285 nurses as having collected Pap tests. The Registry is unable to include data on Pap tests taken by nurses if the nurse has not indicated to the pathology laboratory that they collected the test. It is thought this practice occurs infrequently in Victoria. The volume of Pap tests collected by nurses in 2008, sub-classified by the practice location, is shown in the table below according to ARIA – the Accessibility/Remoteness Index of Australia. ARIA measures the remoteness of a location from service centres such as large towns and is considered to have a number of advantages compared with RRMA. ARIA has 5 classifications:
1. Highly Accessible – relatively unrestricted access to a wide range of goods and services and opportunities for social interaction.
2. Accessible – some restrictions to a wide range of goods and services and opportunities for social interaction.
3. Moderately Accessible – significantly restricted accessibility of goods, services and opportunities for social interaction.
4. Remote – very restricted accessibility of goods, services and opportunities for social interaction.
5. Very Remote – very little accessibility of goods, services and opportunities for social interaction.
Nurses who collected Pap tests in Victoria in 2008 have practice locations which belong to the first three categories. In the table below the areas of Accessible and Moderately Accessible are merged as these numbers are smaller.
Table 4.1 Nurse location and volume of Pap tests by ARIA classification
Number of Pap tests collected in 2008
Number of nurses located in Highly Accessible areas
(n= 224)
Number of nurses located in Accessible or Moderately Accessible areas
(n= 61)
>200 tests 23 (10.3%) 5 (8.2%) 100-199 tests 36 (16.1%) 11 (18.0%) 50-99 tests 31 (13.8%) 8 (13.1%) 20-49 tests 52 (23.2%) 5 (8.2%) 10-19 tests 46 (20.5%) 14 (23.0%) 1-9 tests 36 (16.1%) 18 (29.5%)
The median number of tests collected during 2008 by a nurse in a Highly Accessible area was 37 tests (range 1 - 496). For nurses working in other areas, the median number was 58 tests (range 1 - 777). Compared with 2007 the median is the same for Highly Accessible areas and up from 31 in other areas.

4
5. Location of Women Screened The location of residence of women whose Pap tests were collected by nurses in 2008 is shown in the following table. The ARIA classification of remoteness is also used for this data. The proportion of women who had a Pap test in 2008 in a Highly Accessible area was very similar to that of 2007 (73.5% in 2008 compared with 73.2% in 2007).
Table 5.1 Location of women by ARIA classification for Pap tests collected by nurses
Location by ARIA classification Number (%) of women screened
Highly Accessible 15,929 (73.5%)
Accessible 3,933 (18.2%)
Moderately Accessible 1,779 (8.2%)
Remote 1 (<0.1%)
Not able to be determined3 26 (0.1%)
Total 21,668 (100%)
6. Age Distribution of Women Screened The age distribution of the women whose Pap tests were collected by nurses is shown in the following table. A comparison of the age distribution for Victorian Pap tests collected by other provider types during 2008 is provided. The table shows that the proportion of Pap tests collected by nurses for women over the age of 50 years is greater than for tests collected by other provider types (38.1% compared with 29.9%).
Table 6.1 Age distribution of women screened in 2008
Age group % of Pap tests collected by nurses
% of Pap tests collected by other provider types
<20 yrs 2.4% 2.1%
20-29 yrs 16.2% 19.5%
30-39 yrs 19.9% 25.1%
40-49 yrs 23.4% 23.4%
50-59 yrs 20.8% 17.9%
60-69 yrs 15.6% 10.5%
70+ yrs 1.7% 1.5%
Total 100% 100%
3 Address for woman unavailable.
5
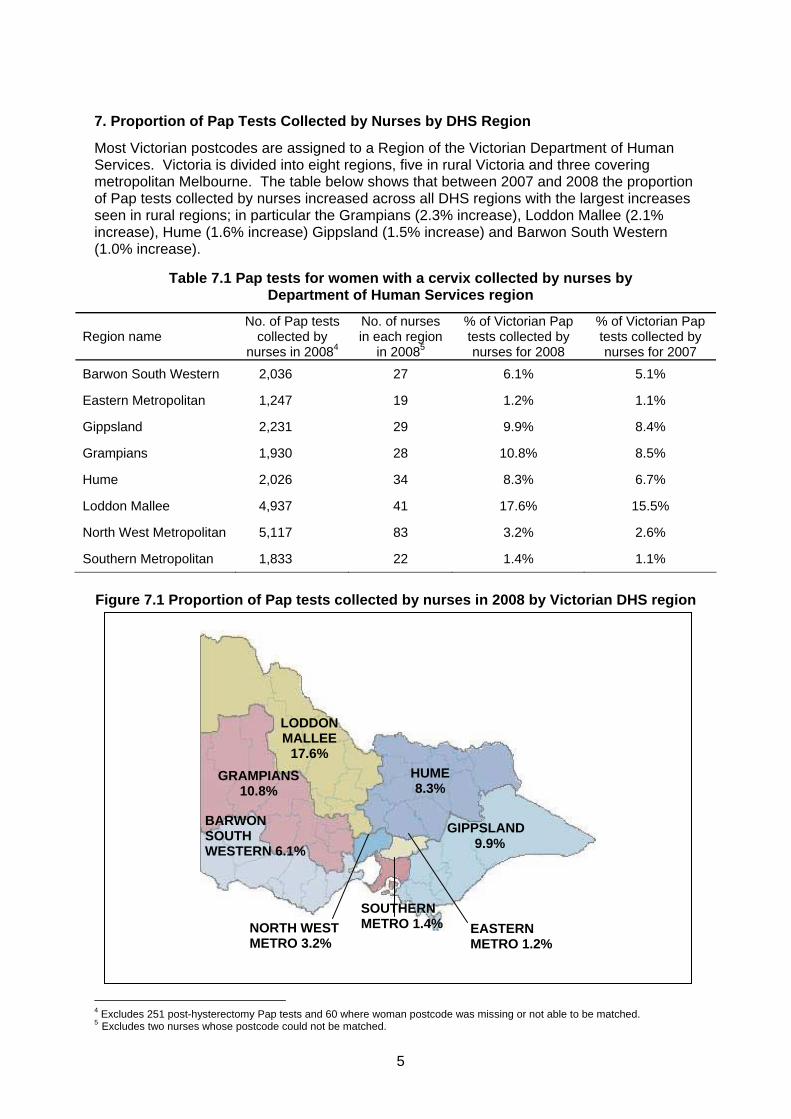
7. Proportion of Pap Tests Collected by Nurses by DHS Region
Most Victorian postcodes are assigned to a Region of the Victorian Department of Human Services. Victoria is divided into eight regions, five in rural Victoria and three covering metropolitan Melbourne. The table below shows that between 2007 and 2008 the proportion of Pap tests collected by nurses increased across all DHS regions with the largest increases seen in rural regions; in particular the Grampians (2.3% increase), Loddon Mallee (2.1% increase), Hume (1.6% increase) Gippsland (1.5% increase) and Barwon South Western (1.0% increase).
Table 7.1 Pap tests for women with a cervix collected by nurses by Department of Human Services region
Region name No. of Pap tests
collected by nurses in 20084
No. of nurses in each region
in 20085
% of Victorian Pap tests collected by nurses for 2008
% of Victorian Pap tests collected by nurses for 2007
Barwon South Western 2,036 27 6.1% 5.1%
Eastern Metropolitan 1,247 19 1.2% 1.1%
Gippsland 2,231 29 9.9% 8.4%
Grampians 1,930 28 10.8% 8.5%
Hume 2,026 34 8.3% 6.7%
Loddon Mallee 4,937 41 17.6% 15.5%
North West Metropolitan 5,117 83 3.2% 2.6%
Southern Metropolitan 1,833 22 1.4% 1.1%
4 Excludes 251 post-hysterectomy Pap tests and 60 where woman postcode was missing or not able to be matched. 5 Excludes two nurses whose postcode could not be matched.
BARWON SOUTH WESTERN 6.1%
GRAMPIANS 10.8%
LODDON MALLEE
17.6% HUME 8.3%
GIPPSLAND 9.9%
EASTERN METRO 1.2%
NORTH WEST METRO 3.2%
SOUTHERN METRO 1.4%
Figure 7.1 Proportion of Pap tests collected by nurses in 2008 by Victorian DHS region

6
8. Endocervical Status Of the technically satisfactory Pap tests collected from women with a cervix by nurses in 2008, 77.9% were reported as including an endocervical component. During 2008, 75.8% of all technically satisfactory Pap tests taken by other practitioner types, from women with a cervix, were reported as having an endocervical components. The graph below illustrates a decline in the proportion of Pap tests with an endocervical component since 2000; however the decline is less for nurses than for other practitioner types.
9. Profile of Pap Test Reports for Women with a Cervix
The following table shows the Pap test report categories for tests collected by nurses and other practitioner types in 2008 for women with a cervix6. Compared with Victorian Pap tests collected by other provider types during 2008, nurses had a higher proportion of tests with a negative result and lower proportions for high grade, low grade and unsatisfactory tests. Compared with 2007 data (not shown), the percentage of negative result Pap tests collected by nurses increased from 92.7% to 93.2%.
Table 9.1 Profile of Pap test reports collected in 2008 for women with a cervix
Report category Number (%) of Pap tests collected by nurses
% of Victorian Pap tests collected by other
practitioner types7 High grade abnormality 125 (0.6%) 0.9%
Low grade abnormality 930 (4.3%) 5.0%
Inconclusive 143 (0.7%) 0.7%
Negative 19,964 (93.2%) 91.5%
Unsatisfactory 255 (1.2%) 1.9%
Total 21,417 (100%) 100%
6 Based only on the squamous cell code within the VCCR Cytology Code Schedule. 7 This percentage excludes nurses. This is not comparable with the percentage provided in the 2007 Nurse report where nurses
were included.
70%
72%
74%
76%
78%
80%
82%
84%
86%
88%
2000 2001 2002 2003 2004 2005 2006 2007 2008
Perc
enta
ge Nurses
Other practitionertypes
Figure 8.1 Proportion of Victorian Pap tests with an endocervical component for nurses and other practitioner types

7
10. Time Since Previous Screening for Women with a Cervix The following table shows the time since any previous Pap test, as known to the Registry, for tests collected in 2008. Compared with Pap tests collected by other Victorian provider types the proportion of tests collected by nurses was greater where the time interval since the last test was greater than 2 years.
Table 10.1 Time since previous Pap test for women with a cervix
Time since previous test Number (%) of Pap tests collected by nurses in 2008
% of Victorian Pap tests collected in 2008 by other provider types8
No previous test 2,316 (10.8%) 10.9% 4 yrs + 2,016 (9.4%) 7.2% 3.5 to <4 yrs 545 (2.5%) 2.1% 3.0 to <3.5 yrs 799 (3.7%) 3.5% 2.5 to <3 yrs 1,967 (9.2%) 7.9% 2.0 to <2.5 yrs 8,279 (38.7%) 33.2% 1.5 to <2 yrs 2,354 (11.0%) 11.8% 1.0 to <1.5 yrs 1,884 (8.8%) 12.0% 0.5 to <1 yr 838 (3.9%) 6.7% <0.5 yrs 419 (2.0%) 4.7% Total 21,417 (100%) 100%
11. Conclusion The number and proportion of Pap tests collected by nurses in Victoria continues to grow. In 2008, the number of tests collected by nurses increased to 21,668 which represents 3.8% of all Pap tests performed in Victoria that year. The proportion of post-hysterectomy Pap tests collected by nurses in 2008 was slightly less than that for other provider types. General Practice and Community Health settings remained the main types of practice where nurses collect Pap tests. As seen in previous years, for 2008 there were more nurses practising in ARIA Highly Accessible areas than in Accessible or Moderately Accessible areas. Almost three quarters of the women who had a Pap test collected by a nurse in 2008 were in a highly accessible area. Compared with Pap tests collected by other provider types in 2008, nurses collected a higher proportion of tests from women over the age of 50 years. Between 2007 and 2008 an increase in the proportion of Pap tests collected by nurses was seen for all DHS regions. This increase was greatest in rural DHS regions with the greatest increase seen in the Grampians region. As a reflection of smear quality, the proportion of tests with an endocervical component continued to be higher for nurses than other practitioner types for 2008. The data in this report highlights the increasingly important role that nurses have in the Victorian Cervical Screening Program, particularly in relation to the increasing number of Pap tests collected by nurses in recent years and the high quality of smears. 8 This percentage excludes nurses. This is not comparable with the percentage provided in the 2007 Nurse report where nurses
were included.

8
12. References Australian Institute of Health and Welfare. Rural, regional and remote health; a guide to remoteness classifications. 2004. AIHW cat .no PHE 53. Canberra: AIHW. Commonwealth Department of Health and Aged Care. Measuring Remoteness: Accessibility/Remoteness Index of Australia (ARIA) Revised Edition. October 2001. Occasional Papers: New Series Number 14.

9