Embed Size (px)
Citation preview

Engineering Science 2017; 2(1): 14-25
http://www.sciencepublishinggroup.com/j/es
doi: 10.11648/j.es.20170201.13
Numerical Study of Laminar Free Convection Heat Transfer Inside a Curvy Porous Cavity Heated from Below
Ali Maseer Gati'a1, Zena Khalifa Kadhim
1, Ahmad Kadhim Al-Shara
2
1Mechanical Department, Engineering College, Wasit University, Wasit, Iraq 2Mechanical Department, Engineering College, Misan University, Misan, Iraq
Email address:
[email protected] (A. M. Gati'a), [email protected] (Z. K. Kadhim), [email protected] (A. K. Al-Shara)
To cite this article: Ali Maseer Gati'a, Zena Khalifa Kadhim, Ahmad Kadhim Al-Shara. Numerical Study of Laminar Free Convection Heat Transfer Inside a
Curvy Porous Cavity Heated from Below. Engineering Science. Vol. 2, No. 1, 2017, pp. 14-25. doi: 10.11648/j.es.20170201.13
Received: February 20, 2017; Accepted: February 27, 2017; Published: March 24, 2017
Abstract: A numerical investigation is performed in the present study by using of ANSYS-CFX R15.0 for a laminar free
convection heat transfer inside a closed curvy porous cavity heated from below by using of Darcy-Forchheimer model with
neglecting the viscous dissipation. The porous combination is a saturated silica-sand by water. The graphical parameters which
have been tested here are involving (waving the cavity side walls in a sinusoidal shape, the phase angle, and the aspect ratio).
The most important conclusion in this research is that the sinusoidal curviness of the cavity's walls is not help to rise the rate of
heat transfer, but in contrary it decreases this rate except when the number of waves per cavity's height is equal to one (i.e.
N=1), where it is found that this value enhances the heat transfer rate inside the cavity especially when the dimensionless
amount of the wave's amplitude be equal to (0.075).
Keywords: Free Convection, Curvy Cavity, Porous Medium, Darcy-Forchheimer Model, Sand-Silica, ANSYS-CFX R15.0
1. Introduction
The enhancement process of the HT rate inside closed
cavities which filled with PM has been attracted more
attention of many studies due to its great importance in the
technological and industrial applications such as energy
storage and recovery, geothermal reservoirs, the insulation of
equipment and buildings, the storage of materials for heat-
generating such as grain and coal [1], packed-bed chemical
reactors, transpiration cooling [2], electronic cooling,
solidification of casting [3], microwave heating, gas
transport, drying and crystallization [4], and etc. Thus it is of
interest to study the effect of surface undulation in such
cavities because it is considered as a one of the expected
ways to improve the HT rate.
Kumar et al. [5] had been studied the free convection
inside a square closed porous cavity using Forchheimer
extended Darcy model and they found that the waviness in
the isothermal side wall reduces the rate of HT due to the
secondary circulation zones which appear in adjacent region
to the curvy wall. These secondary circulation zones trap the
fluid and this leads to decreasing the HT rate due to
convection. This is the same result was found by Murthy et
al. [6] but with an isothermal horizontal wavy surface. While
Khanafer et al. [7] concluded that a higher curvy amplitude
gives a higher local heat flux near the isothermal wavy
surface which means an increasing in HT rate, but the
varying in the number of the surface undulation between (0
to 3) do not show an obvious effects inside a closed porous
cavity by using of different momentum models like Darcy-
Forchheimer, Darcy-Brinkman, and the models of
generalized flow. This contradiction had been explicated by
Chen et al. [8]. They said that the increasing or diminishing
in the Nusselt number may be due to the different regimes of
flow inside the cavity and there may be an optimum wave
amplitude or aspect ratio to reach a peak for the Nusselt
number to enhance the HT rate. Bhardwaj et al. [9] studied
also the influence of wavy wall on natural convection HT
inside triangular porous enclosure. They found that the
undulation in the isothermal right-angle wall increases the
heat transfer rate but with non-uniform heating from below
and adiabatic inclined side. Bhuvaneswari et al. [10]
investigated numerically the effect of aspect ratio on
convective heat and flow in a rectangular porous enclosure.
They showed that the HT rate is decreased with increasing
the aspect ratio.
In the present study the effects of the geometrical

Engineering Science 2017; 2(1): 14-25 15
parameters on the natural convection inside a closed curvy
porous cavity heated from below by constant heat flux have
been studied numerically by using of the computational
software program ANSYS-CFX R15.0. This geometrical
parameters are including waviness of the side walls, the
phase angle, and the aspect ratio. The GNN will be the main
criterion to estimate which graphical model will give the best
rate of HT inside this cavity.
Table 1. Symbols, subscripts, and acronyms which used in the current study's text.
Symbol Description Symbol Description
Ra Modified Rayleigh number. g Gravitational acceleration (m/s2).
Nu Nusselt number. A Aspect ratio.
T Temperature. N Number of waves per height.
k Thermal conductivity (W/m. °K). a Wave's amplitude (m).
K Permeability (m2). ad Dimensionless wave's amplitude (a/H).
� Velocity component at x-axis (m/s). � Thermal diffusivity (m2/s).
� Velocity component at y-axis (m/s). Χ Stream function.
W Cavity width (m). q0 (HF) Heat flux (W/m2).
H Cavity height (m).
Subscript Description Subscript Description
eff Effective. f Fluid.
s Solid. a Ambient.
Acronym Description
PM Porous medium (media).
HT Heat transfer.
GNN Global Nusselt number.
OAHTC Overall ambient heat transfer coefficient (W/m2. °K).
2. Mathematical Model
The numerical model is a two dimensional closed cavity
with wavy sinusoidal walls as displayed in Figure 1. The
facing side walls are kept insulated to be adiabatic walls, the
top surface is exposed to outside environment, while the
bottom surface is exposed to constant heat flux. The PM is
sand-silica saturated by water where the mean diameter of
the sand particles is about (1) mm and all other needed
properties are measured or taken from competent sources as
shown in Table 2.
The assumptions that considered to solve the interest
problems have been identified to be (laminar flow, steady
state, two-dimensional flow, single phase flow,
incompressible fluid, homogeneous and isotropic medium,
constant porosity, Boussinesq's approximation is valid, local
thermal equilibrium (Ts=Tf), and finally the viscous
dissipation, effect of radiation, and the work which is done
by the pressure changes are all neglected).
Figure 1. The numerical model of the closed wavy porous cavity.
The mass, momentum, and energy equations which
governing the convection phenomena inside the PM under
the specified previous assumptions are produced as follows:
Continuity equation: The general continuity equation is
[1]:
��� �ε. ρ� � �ρ. v� � 0 (1)
But there is no changing in the rate of the fluid mass
within the total volume in this study which means that the
term (��� �ε. ρ�) will be equal to zero. This leads beside the

16 Ali Maseer Gati'a et al.: Numerical Study of Laminar Free Convection Heat Transfer Inside a Curvy
Porous Cavity Heated from Below
constancy of both the density of the fluid and the porosity to
reduce the continuity equation to the following form:
���� � ��
�� � 0 (2)
Momentum equation: The momentum equation in the
present article is formed by inserting the momentum source
term which results from the PM structure to the standard
fluid flow equation. This term consists of two parts which are
viscous loss term (Darcy's term) and inertial loss term
(Forchheimer's term) [11]. The general final form can be
written for both the x-axis and y-axis as follows [10]:
x- axis momentum equation:
ρ. �u. ���� � �. ��
��� � �ε�. ���� � ε. µ. ����
��� � ������� � ε��µ�
� . u � !√� . ρ. u. √u� � ��� (3)
y- axis momentum equation:
ρ. �u. ���� � �. ��
��� � � ε�. ���� � ε. µ. ����
��� � ������� � ε� � µ�
� . � � #$√% . ρ. �. √�� � ��� � ε�. β. ρ. g. �T � T)*� (4)
Energy equation:
�u. �+�� � �. �+
��� � α*. � ��+
��� � ��+���� (5)
Where:
Cd: Drag coefficient. (Cd = -../
√-/0 12.3�
α* � k*�ρ. Cp�
k* � ε. k � �1 � ε�k8
Table 2. Needed properties of the chosen silica-sand (some are measured experimentally).
No Property Measured value
Mean particles diameter (1) mm
Density (9) (2300) kg/m3
Porosity (ε) (0.36)
Permeability (K) (3.2e-10) m2
Thermal conductivity (k) (0.1976) W/m2.°K
Specific heat capacity (Cp) 1170 (W/kg.°K) [12].
3. Validation Process
To validate the present numerical analysis procedure and
make sure that it's results are acceptable, it is chosen a
published experimental research for this purpose which is
Prasad [13] that dealing with the same subject of the current
study. The comparison between its result and the
corresponding present result shows a good agreement and
gives a validation for the numerical part in the present study
as shown below in Figure 2 which shows the dimensionless
temperature distribution for water-glass combination as a
saturated PM with Ra=1072 and also Table 3 which shows
the percentage approach for each point of the results.
Figure 2. Dimensionless temperature distribution (A. Present study. B. Prasad.).

Engineering Science 2017; 2(1): 14-25 17
Table 3. Percentage approach of the present point to the corresponding Prasad point.
z Points
From inner to outer for R
Temp. distribution (θ)
V. Prasad results
Temp. distribution (θ)
Present results
Percentage
approach %
0.25
Point 1 0.0298874 0.0659 96.7
Point 2 0.0247896 0.0501 97.4
Point 3 0.0153102 0.0364 97.9
0.5
Point 1 0.123194 0.162966667 95.5
Point 2 0.10351 0.131133333 96.9
Point 3 0.0794539 0.106933333 97.0
0.75
Point 1 0.34622 0.373366667 95.8
Point 2 0.295924 0.3193 96.7
Point 3 0.260206 0.282533333 97.0
1
Point 1 0.860801 0.887733333 80.7
Point 2 0.793009 0.769466667 88.6
Point 3 0.684409 0.664433333 93.7
4. Results and Discussion
In the present numerical analysis there are two main lines,
in the first main line it is applied a constant heat flux from
the lower surface equals to (250) W/m2 for all models to
know which models will give a highest GNN (Nuglobal).
Where every one of these models have an own (N and a)
under the same aspect ratio which is (A=1). The chosen
model from this step is used then to study the other graphical
effects as a second main line. It is starting with one
sinusoidal wave per height of the cavity (i.e. N=1) for each
side walls and fixing this number while changing the wave's
amplitude (ad) by the following values (ad = 0, 0.025, 0.05,
0.075, 0.1, 0.15, 0.2, and 0.25). This step will be repeated
with all other numbers of (N) which are various from (1 to
10) including the following values (N= 1, 2, 3, 4, 5, 8, and
10). Therefore there will be approximately (44) models to be
studied here. The undulation effects in this searching area can
be shown under the next titles:
Flow behavior
The behavior of the flow inside the cavity is presented by
the velocity distribution, streamlines, and vectors. These
three characteristics of the flow are explained for the above
described models with the conditions (HF=250 W/m2,
Ta=300 oK, and OAHTC=10 W/m
2. °K) under the following
two items:
i. Velocity distribution
from Figure 3 it was observed that the maximum velocity
magnitude of the flow occurs within four regions. These
regions are appointed in the following points.
1. Near convex sides; where the smooth convex shape
always helps the flow to be faster.
2. Near the upper and the lower surfaces; where the flow
inverses its direction so that the region of inversion
becomes more like a narrow passages.
3. In the middle of the cavity; it is an area to collect the
flow from all sides which leads to rise its velocity.
On the other hand, the velocity magnitude of the flow
reaches zero approximately at two main regions which are:
1. Inside the concave sides; where they can be considered
as a die flow regions.
2. Around the middle of the cavity; this area represents the
cellular center where the fluid flows around.
This is exactly what is happened for all models which have
walls wave's amplitude within a range equals to (ad= 0.025 to
0.15). But out of this range there appears a change in the
velocity distribution in the middle of the cavity as displayed
in Figure 4, where it can be said that the fluid flows in a non-
uniform way with an inclined one big cellular. This inclined
big cellular is a result of the existing of small eddies (small
cellular) as will be shown later.
Figure 3. Velocity contour (velocity distribution) for (N=3 and ad=0.15).

18 Ali Maseer Gati'a et al.: Numerical Study of Laminar Free Convection Heat Transfer Inside a Curvy
Porous Cavity Heated from Below
Figure 4. Velocity contour (velocity distribution) for N=3 and ad =0.25).
ii. Streamlines and vectors
Figure 5 shows a uniform distribution for both the
streamlines which represent the flow patterns and the flow
vectors which represent the flow directions. All of the flow
patterns consist of two corresponding big cellular (bicellular)
reflected about the center line of the cavity if (ad <0.2) for all
used values of (N) but including both when (N=1) for the
entire used range of (ad) and when (N=2) at (ad =0.2). The
flow currents move from all around the bottom surface
towards the middle of the cavity then return back passing
from the upper surface and alongside the curvy side walls.
Streamlines take a curvy path when passing side by side with
curvy walls. This curvy path begins to become more close to
a linear path when rising both the number of waves and the
wave's amplitude.
Figure 5. Streamlines and vectors (uniform distribution) A. N=3 and ad=0.15 - B. N=10 and ad=0.15.

Engineering Science 2017; 2(1): 14-25 19
The other models which are out of the above specified
ranges of (ad) create a non-uniform distribution for both the
streamlines and the vectors. Where they produce a one big
cellular inside the cavity beside one or two small others
eddies as displayed in Figure 6. The direction of the flow
inside the big cellular is in the opposite direction with respect
to the direction of the flow inside the small cellular whether
it was one or two inside the cavity. The curviness shape of
the walls is the reason behind the formation of these small
cellular.
Figure 6. Streamlines and vectors (Non-uniform distribution) for A. N=3 and ad=0.25 - B. N=10 and ad=0.25.
Heat transfer rate
The variation of HT rate for each model is presented graphically in Figure 7 where it is depending on the GNN as a criterion
to estimate which one of them gives the best heat rate. Well, this leads to indicate the intended model to be at (N=1 and
ad=0.075).
Figure 7. GNN versus wall amplitude (ad) with various (N).
Figure 7 shows more than one situation which are needed
an interpretation for their behavior, where that what will be
doing in the following spots beside getting started with the
definition of the GNN:
1. GNN = Nuglobal = hglobal. H / keff
Global HT coefficient = hglobal = q0/ (Tbase – Tbulk).
Tbase= cavity base temperature.
Tbulk= total cavity volume temperature (bulk
temperature).
2. In general the wall's undulation works as a resistance to
the fluid flow inside the cavity, therefore the heat rate is
diminished with rising either the number of waves or
20 Ali Maseer Gati'a et al.: Numerical Study of Laminar Free Convection Heat Transfer Inside a Curvy
Porous Cavity Heated from Below
wave's amplitude. Except models which have one wave
per height (N=1). In these special models the undulation
acts in different way, it works to rise the HT rate until the
amplitude begins to rise more than (0.2). This may be
traced back to the fact that the undulation lets the fluid to
move more smoothly at this specific range of (N).
3. When both the number of waves and wave's amplitude
rise up to a limit where the undulation wall appears
approximately like flat wall this leads to produce the
same heat rate for these two cases. This is what occurs
at (N=10 and ad=0.025). Therefore it is expected there is
no important impression for the rising of the number of
waves more than this specified value.
4. HT rate begins to approach for all models when (N>2).
Where this can be returned back to a fact that the rate of
HT begins to reach its less possible value with rising the
number of waves.
5. The wave's amplitude almost have no effects on the HT
rate in an area restricted between (ad =0.15 to 0.2) when
(N>4) for each model individually.
6. After (ad =0.15) there is no regularity in the behavior of
the flow inside the cavity due to the appearance of small
eddies as will be shown later, therefore it could not
estimate an interpretation to the behavior of the HT rate
thorough out this area.
Isotherm lines
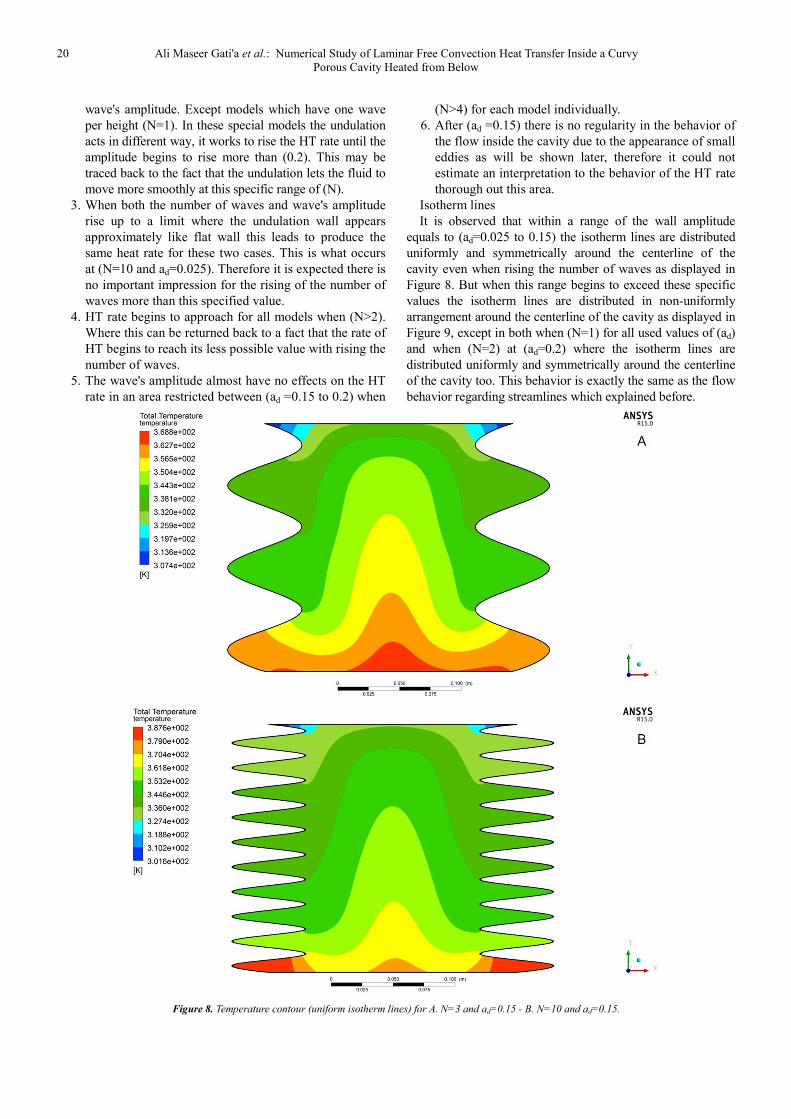
It is observed that within a range of the wall amplitude
equals to (ad=0.025 to 0.15) the isotherm lines are distributed
uniformly and symmetrically around the centerline of the
cavity even when rising the number of waves as displayed in
Figure 8. But when this range begins to exceed these specific
values the isotherm lines are distributed in non-uniformly
arrangement around the centerline of the cavity as displayed in
Figure 9, except in both when (N=1) for all used values of (ad)
and when (N=2) at (ad=0.2) where the isotherm lines are
distributed uniformly and symmetrically around the centerline
of the cavity too. This behavior is exactly the same as the flow
behavior regarding streamlines which explained before.
Figure 8. Temperature contour (uniform isotherm lines) for A. N=3 and ad=0.15 - B. N=10 and ad=0.15.

Engineering Science 2017; 2(1): 14-25 21
Figure 9. Temperature contour (non-uniform isotherm lines) for A. N=3 and ad=0.25 - B. N=10 and ad=0.25.
Figure 10. GNN versus phase angle (Φ).

22 Ali Maseer Gati'a et al.: Numerical Study of Laminar Free Convection Heat Transfer Inside a Curvy
Porous Cavity Heated from Below
Phase angle (Φ)
The phase angle has an oscillating effect on the HT rate as
displayed in Figure 10. Where the GNN has been evaluated
with seven phase angles for a model which have the following
shape characteristics (N=1, ad=0.075, and A=1) with regarding
to a specified conditions which are (HF=250 W/m2,
Ta=300 °K, and OAHTC=10 W/m2. °K). These seven phase
angles are starting from (0° to 225°) by a step equals to (45°)
beside (Φ=112.2°). At (Φ=0°) the GNN reaches its maximum
value while at (Φ=112.5°) it reaches minimum value.
Figure 10. GNN versus phase angle (Φ).
Figure 11. The shape of the cavity in different phase angles.
The HT rate is significantly associated with the fluid
movement nature inside the cavity. And at the same time, the
fluid movement nature is associated with the cavity shape.
Thus it can be concluded that there are two main graphical
changes associated with the phase angle which behind its
oscillating effect on the rate of HT. These graphical changes
are represented by both the shrinking in the middle region
and the expanding in the upper region of the cavity's side
walls. Where the increasing of the shrinking in the middle
region due to the rising in the phase angle magnitude causes
a choke in the flow. While the expanding in the upper region
which is increasing also with the rising of the phase angle
magnitude causes an expansion in the cold flow which in turn
obstructs the HT rate. These two graphical characteristics are
increasing together until reaching their maximum effect at
(Φ=112.5°) inside the closed porous cavity. Figure 11 shows
how can that happens.
Aspect ratio
The intended model which is chosen from the previous
steps is used here to study the aspect ratio effect with a set
of ten values which are (A = 1, 1.25, 1.5, 1.52, 1.625, 1.75,
2, 2.25, 2.5 and 3) under a specified conditions which are
(HF=250 W/m2, Ta=300 °K, and OAHTC=10 W/m
2. °K).
The numerical analysis of these models shows that the
change in the aspect ratio have a regular effect on the rate
of HT, although there is a point will change the path of
impact and transport it to another point in order to start
again. Figure 12 shows that the GNN continues to go down
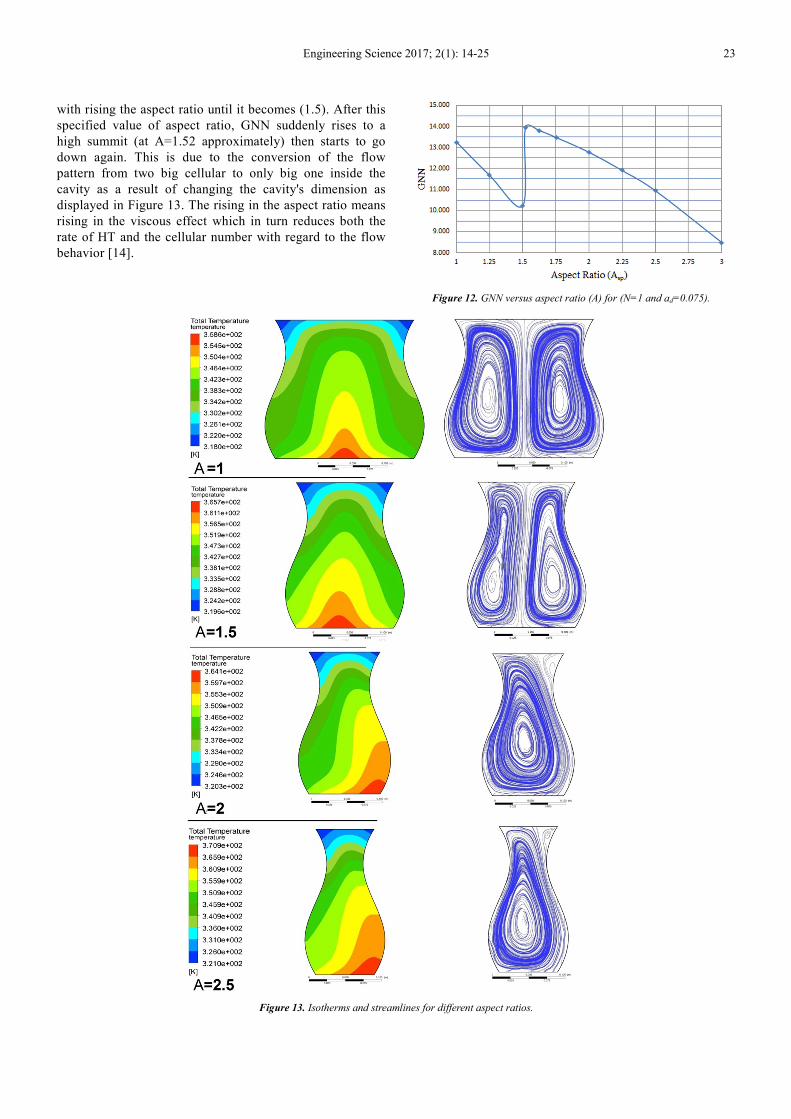
Engineering Science 2017; 2(1): 14-25 23
with rising the aspect ratio until it becomes (1.5). After this
specified value of aspect ratio, GNN suddenly rises to a
high summit (at A=1.52 approximately) then starts to go
down again. This is due to the conversion of the flow
pattern from two big cellular to only big one inside the
cavity as a result of changing the cavity's dimension as
displayed in Figure 13. The rising in the aspect ratio means
rising in the viscous effect which in turn reduces both the
rate of HT and the cellular number with regard to the flow
behavior [14].
Figure 12. GNN versus aspect ratio (A) for (N=1 and ad=0.075).
Figure 13. Isotherms and streamlines for different aspect ratios.

24 Ali Maseer Gati'a et al.: Numerical Study of Laminar Free Convection Heat Transfer Inside a Curvy
Porous Cavity Heated from Below
This situation occurs with other aspect ratio too as shown in Figure 14.
Figure 14. GNN versus aspect ratio (A) for (N=1 and ad=0.1).
5. Conclusions
There are more than (75) graphical models have been
simulated numerically thoroughly in this study to get an
exact conclusion for every situation. These conclusions are
produced briefly as follows.
1. The sinusoidal curviness is not help to rise the rate of
HT in side facing walls. But in contrary it decreases this rate.
Except when (N=1), where it is found that this value
enhances the HT rate inside the cavity, especially when the
wave's amplitude be equal to (ad=0.075).
2. The best shape to get the best rate of HT within taken
values in this study is at (N=1, ad=0.075, Φ=0, and A=1.52).
3. The isotherms and streamlines (flow patterns) uniformly
distributed about the center line of the cavity as long as the
wave's amplitude (ad) don't exceed (0.15) for any waves
number per height (N). This is also true at every value of (ad)
when (N=1) and at (ad =0.2) when (N=2).
4. In the models of uniformly distributed flow pattern the
number of big flow cellular inside the cavity has been
appointed to be one or two only under the specified
conditions in this study. This depends generally on the
amount of both the supplied heat flux from the lower surface
and the aspect ratio. Where there is a very sharp border limit
for them to change the flow pattern inside the cavity from
one to two cellular or conversely.
5. When the flow pattern converts from one big cellular to
two big cellular inside the cavity, the GNN drops down
suddenly then it returns to rise up. This situation inverts
when the flow pattern converts from two big cellular to one
big cellular.
6. In the non-uniformly distributed flow pattern models,
the direction of the flow inside the big cellular is in the
opposite direction with respect to the direction of the flow
inside the small cellular, whether it was one or two inside the
cavity. Where in such models the flow pattern consists of just
one big cellular with one or two small cellular.
7. The phase angle has an oscillating effect on the HT rate
where the maximum GNN occurs at either (Φ=0) degree
while its minimum value occurs between (Φ=112.5) degree.
References
[1] Donald A. Nield and Adrian Bejan. 'Convection in Porous Media'. Fourth edition, Springer 2013.
[2] K. Vafai and C. L. Tien. 'Boundary and inertia effects on flow and heat transfer in porous media'. Elsevier Ltd. International Journal of Heat and Mass Transfer, Volume 24, Issue 2, February 1981, Pages 195-203.
[3] C. Beckermann, R. Viskanta and S. Ramadhyani. 'A numerical study of non-darcian natural convection in a vertical enclosure filled with a porous medium'. Taylor & Francis Online Journal, Numerical Heat Transfer, Volume 10, 1986. Published online: 27 Feb 2007.
[4] Debayan Das, Pratibha Biswal, Monisha Roy, and Tanmay Basak. 'Role of the importance of ‘Forchheimer term’ for visualization of natural convection in porous enclosures of various shapes'. Elsevier Ltd. International Journal of Heat and Mass Transfer, Volume 97, June 2016, Pages 1044–1068.
[5] B. V. Rathish Kumar and Shalini. 'Free convection in a non-Darcian wavy porous enclosure'. Elsevier Ltd. International Journal of Engineering Science, Volume 41, Issue 16, September 2003, Pages 1827–1848.
[6] P. V. S. N. Murthy, B. V. Rathish Kumar, and P. Singh. 'Natural convection heat transfer from a horizontal wavy surface in a porous enclosure', Numerical Heat Transfer, Part A: Applications: An International Journal of Computation and Methodology Volume 31, Issue 2, 1997. Published online: 16 May 2007.
[7] Khalil Khanafer, Bader Al-Azmib, Alia Marafie, Ioan Pop. 'Non-Darcian effects on natural convection heat transfer in a wavy porous enclosure'. Elsevier Ltd. International Journal of Heat and Mass Transfer, Volume 52, Issues 7–8, March 2009, Pages 1887–1896.

Engineering Science 2017; 2(1): 14-25 25
[8] X. B. Chen, P. Yu, S. H. Winoto and H. T. Low. 'Free convection in a porous wavy cavity based on the Darcy-Brinkman-Forchheimer extended model'. An International Journal of Computation and Methodology, Numerical Heat Transfer, Part A: Applications: Volume 52, Issue 4, 2007.
[9] Saurabh Bhardwaj, Amaresh Dalal, and Sukumar Pati. 'Influence of wavy wall and non-uniform heating on natural convection heat transfer and entropy generation inside porous complex enclosure'. Elsevier Ltd. Energy, Volume 79, 1 January 2015, Pages 467–481.
[10] M. Bhuvaneswari, S. Sivasankaranb, and Y. J. Kima. 'Effect of aspect ratio on convection in a porous enclosure with partially active thermal walls'. Elsevier Ltd. Computers & Mathematics with Applications, Volume 62, Issue 10, November 2011, Pages 3844–3856.
[11] ANSYS Help R15.0.
[12] Dhia-Al-Deen H. Alwan, Ihsan. Y. Hussain, and Abdulhassan
A. Karamallah. 'Experimental study of natural convection heat transfer in confined porous media heated from side'. Jornal of engineering, number 8, volume 19, August 2013.
[13] V. Prasad, A. Kulacki, and M. Keyhani. ' Natural convection in porous media', Cambridge university press, Journal of Fluid Mechanics/ Volume 150/ January 1985, pp 89- 119. Published online: 01 April 2006.
[14] Yasin Varol, Hakan F. Oztop and Asaf Varol. 'Free convection in porous media filled right-angle triangular enclosures'. Elsevier Ltd. International Communications in Heat and Mass Transfer, Volume 33, Issue 10, December 2006, Pages 1190–1197.
[15] George S. Kell. 'Density, thermal expansivity, and compressibility of liquid water from 0 to 150 C: correlations and tables for atmospheric pressure and saturated reviewed and expressed on 1968 temperature scale'. journal of chemical and engineering data, Vol. 20, No. 1, 1975.