Embed Size (px)
Citation preview
University of WollongongResearch Online
Faculty of Engineering and Information Sciences -Papers Faculty of Engineering and Information Sciences
2013
Numerical solution of stone column improved softsoil considering arching, clogging and smear effectsBuddhima IndraratnaUniversity of Wollongong, [email protected]
Sudip BasackBengal Engineering and Science University
Cholachat RujikiatkamjornUniversity of Wollongong, [email protected]
Research Online is the open access institutional repository for theUniversity of Wollongong. For further information contact the UOWLibrary: [email protected]
Publication DetailsIndraratna, B., Basack, S. & Rujikiatkamjorn, C. (2013). Numerical solution of stone column improved soft soil considering arching,clogging and smear effects. Journal of Geotechnical and Geoenvironmental Engineering, 139 (3), 377-394.

Numerical solution of stone column improved soft soil consideringarching, clogging and smear effects
AbstractImprovement of soft clay deposits by the installation of stone columns is one of the most popular techniquesfollowed worldwide. The stone columns not only act as reinforcingmaterial increasing the overall strength andstiffness of the compressible soft soil, but they also promote consolidation through effective drainage. Theanalytical and numerical solutions available for ascertaining the response of column-reinforced soil have beendeveloped on the basis of the equal strain hypothesis. For typical surcharge (embankment) loading, the freestrain analysis appears to give more realistic results comparable to field data. The paper presents a novelnumericalmodel (finite-differencemethod) to analyze the response of stone column-reinforced soft soil underembankment loading, adopting the free strain approach and considering both arching and clogging effects.Apart from predicting the dissipation of excess pore water pressure and the resulting consolidation settlementwith time, the load transfer mechanismand the extent of ground improvement are some of the salient featurescaptured by the proposedmodel. The proposedmodel is validated by comparing with existingmodels and fielddata, which indicate the suitability and accuracy of the solutions. The proposed model is also appliedsuccessfully to selected case studies.
Keywordssoil, column, effects, soft, arching, considering, improved, solution, stone, clogging, smear, numerical
DisciplinesEngineering | Science and Technology Studies
Publication DetailsIndraratna, B., Basack, S. & Rujikiatkamjorn, C. (2013). Numerical solution of stone column improved softsoil considering arching, clogging and smear effects. Journal of Geotechnical and GeoenvironmentalEngineering, 139 (3), 377-394.
This journal article is available at Research Online: http://ro.uow.edu.au/eispapers/585
Numerical Solution of Stone Column–Improved Soft SoilConsidering Arching, Clogging, and Smear Effects
Buddhima Indraratna, F.ASCE1; Sudip Basack2; and Cholachat Rujikiatkamjorn3
Abstract: Improvement of soft clay deposits by the installation of stone columns is one of the most popular techniques followed worldwide. Thestone columns not only act as reinforcing material increasing the overall strength and stiffness of the compressible soft soil, but they also promoteconsolidation through effective drainage. The analytical and numerical solutions available for ascertaining the response of column-reinforced soilhave been developed on the basis of the equal strain hypothesis. For typical surcharge (embankment) loading, the free strain analysis appears togive more realistic results comparable to field data. The paper presents a novel numerical model (finite-difference method) to analyze the responseof stone column–reinforced soft soil under embankment loading, adopting the free strain approach and considering both arching and cloggingeffects. Apart from predicting the dissipation of excess pore water pressure and the resulting consolidation settlement with time, the load transfermechanismand the extent of ground improvement are someof the salient features capturedby theproposedmodel. Theproposedmodel is validatedby comparing with existingmodels and field data, which indicate the suitability and accuracy of the solutions. The proposed model is also appliedsuccessfully to selected case studies. DOI: 10.1061/(ASCE)GT.1943-5606.0000789. © 2013 American Society of Civil Engineers.
CEDatabase subject headings: Finite difference method; Foundation settlement; Numerical models; Soft soils; Soil permeability; Stonecolumns; Arches.
Author keywords: Finite-difference method; Foundation settlement; Numerical models; Soft soils; Soil permeability; Stone columns.
Introduction
Reducing long-term settlement of infrastructure and providing cost-effective foundations with sufficient load-bearing capacities are na-tional priorities for infrastructure development in most countries. Softsoil foundations can cause excessive settlement, initiating undrainedfailure of the infrastructure if proper ground improvement is notcarried out (Indraratna et al. 1992). Therefore, it is imperative to applyadequate ground improvement techniques to the existing soft soilsbefore construction to prevent unacceptable excessive and differentialsettlement and increase the bearing capacity of the foundations.
Among various methods of soft soil improvement, reinforc-ing the ground by installing stone columns is one of the well-
established and effective techniques practiced worldwide (Wang2009). As reported by Guetif et al. (2007), the stone columns notonly act as reinforcement, possessing greater strength and stiffnessin comparison with the surrounding soil, but they also speed up thetime-dependent dissipation of excess pore water pressure causedby surcharge loading due to shortening the drainage path.
Various analytical and numerical solutions have already beendeveloped for understanding the load transfer mechanism of softsoil reinforced with stone columns. Among the most significantcontributions, the studies by Alamgir et al. (1996), Wang (2009),Han and Ye (2000, 2002), Malarvizhi and Ilamparuthi (2008), Loet al. (2010), andMurugesan andRajagopal (2010) are noteworthy.All of these solutions are based on the unit cell analysis assumingthe equal strain hypothesis. Alamgir et al. (1996) carried out a freestrain analysis, but the time-dependent consolidation of soil wasnot considered. However, the equal strain assumption is strictlyvalid only when the surcharge load applied on the ground surface isof a rigid nature. Understandably, this will result in an unequaldistribution of stress induced on the soil surface. In the case ofembankment loading, the flexible nature of the applied surcharge ismost likely to induce an equal distribution of surface load resultingin uneven surface settlement or free strain, as described by Barron(1948). However, the true nature of embankment surcharge loadingis neither fully flexible nor purely rigid, but at an intermediate statebetween the free strain and equal strain conditions. Terzaghi (1943)showed that the flexibility of the granular platform depends on bothits density and thickness. In the field, it is suggested that the overallshear stiffness of the platform is to be measured for classifying theloading distribution pattern. The equal strain condition occurswhen the platform layer thickness and the soil density increase.
In the field, in the proximity of the embankment centerline, thecondition of negligible lateral displacement can be justified by theuse of the unit cell approach. In the past, Lorenzo and Bergado(2003) and Murugesan and Rajagopal (2010) successfully dem-onstrated the use of unit cell analysis to capture the behavior of soil
1Professor, School of Civil, Mining and Environmental Engineering,Faculty of Engineering, Univ. of Wollongong, Wollongong City, NSW2522, Australia; and Director, Centre for Geomechanics and RailwayEngineering, Faculty of Engineering, Univ. of Wollongong, WollongongCity, NSW 2522, Australia; and Program Leader, Australian ResearchCouncil Centre of Excellence in Geotechnical Science and Engineering,The University of Newcastle, Callaghan, NSW 2308, Australia (correspond-ing author). E-mail: [email protected]
2Associate Professor, Bengal Engineering and Science Univ., Howrah,West Bengal 711103, India; formerly, Endeavour Postdoctoral ResearchFellow of Australian Government, Centre for Geomechanics and RailwayEngineering, Univ. ofWollongong,Wollongong City, NSW 2522, Australia.
3Senior Lecturer, Centre for Geomechanics and Railway Engineering,Univ. of Wollongong, Wollongong City, NSW 2522, Australia; and Austra-lian Research Council Centre of Excellence in Geotechnical Science andEngineering, The University of Newcastle, Callaghan, NSW 2308, Australia.
Note. This manuscript was submitted on October 21, 2010; approved onJune 13, 2012; published online on August 1, 2012. Discussion period openuntil August 1, 2013; separate discussions must be submitted for individualpapers. This paper is part of the Journal of Geotechnical and Geoenviron-mental Engineering, Vol. 139, No. 3, March 1, 2013. ©ASCE, ISSN 1090-0241/2013/3-377–394/$25.00.
JOURNAL OF GEOTECHNICAL AND GEOENVIRONMENTAL ENGINEERING © ASCE / MARCH 2013 / 377
J. Geotech. Geoenviron. Eng. 2013.139:377-394.
Dow
nloa
ded
from
asc
elib
rary
.org
by
UN
IVER
SITY
OF
WO
LLO
NG
ON
G o
n 04
/15/
13. C
opyr
ight
ASC
E. F
or p
erso
nal u
se o
nly;
all
right
s res
erve
d.
improved by stone columns at the centerline of the embankment.However, the authors agree that the unit cell analysis may not suc-cessfully predict theoverall behavior in a largeprojectwherehundredsof columns are installed, and it is recognized that the analysis wouldonly be accurate at the proximity to the embankment centerline.Elsewhere, i.e., toward the embankment toe, the single columnanalysis deviates from accuracy because of the nonuniform surchargeload distribution, large strain conditions, increased lateral yield,effects of changing embankment geometry, and heave at the toe.
For a typical fill embankment, the behavior of the soil-stonecolumn system is time dependent. Initially, most of the imposedtotal stress is taken by the increased (excess) pore water pressure.Because of the dissipation of excess pore pressure, progressivesettlement of the soft clay and arching occurs, where the weight ofthe fill is expected to arch over to the stone columns, resulting in anuneven distribution of vertical stress on the ground surface. Thisphenomenon is duly supported by numerous other studies (Lowet al. 1994; Abusharar et al. 2009; Deb 2010).
Because of the migration of clay particles from soil into the poresof the column, a clogged zone may be formed within the column inthe vicinity of the soil-column interface (Adalier and Elgamal 2004).Also, as a result of installation, a smear zone is developed in the soiladjacent to this interface (Han and Ye 2002).
Numerical Analysis
The numerical model is formulated considering a steady and uni-form load intensity imposed on the ground surface caused by theself-weight of the embankment, apart from the instantaneous sur-charge load applied at the top of the embankment. The average loadintensity on the ground surface may therefore be written as
q ¼ qs þ geHe ð1Þ
where qs5 uniform surcharge load intensity on the embankmentfill, and ge and He 5 unit weight and maximum height of theembankment, respectively.
Statement of the Problem
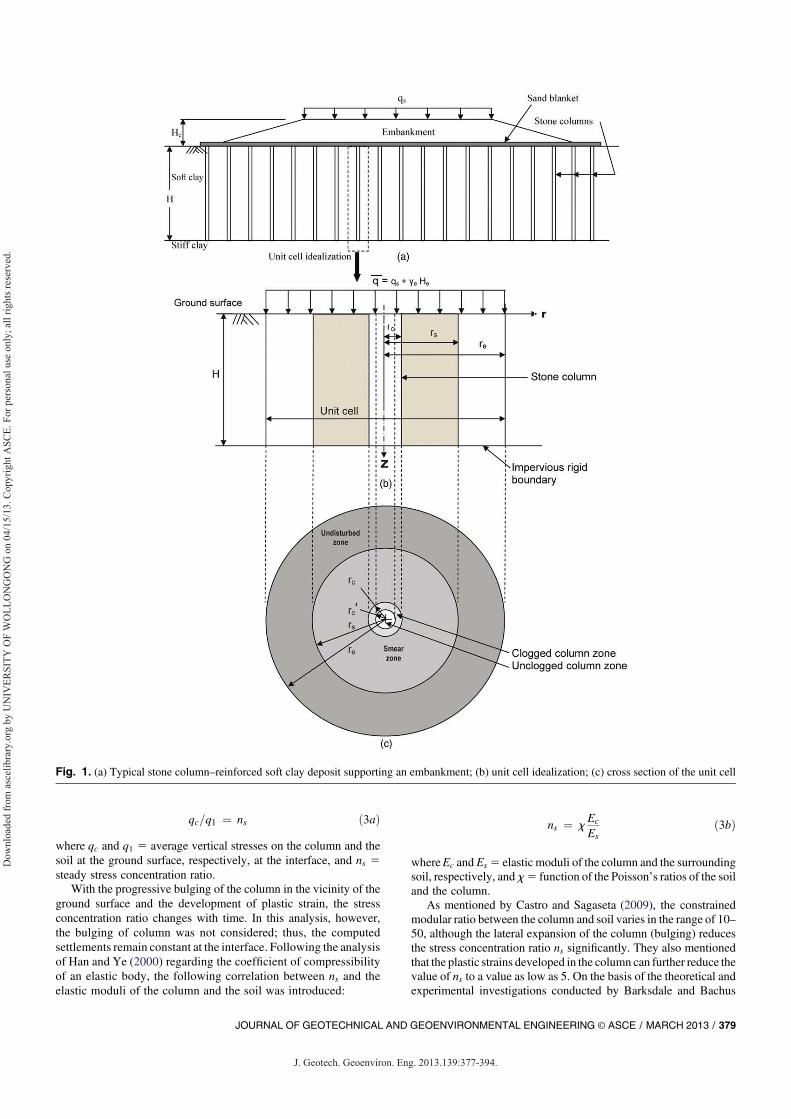
The idealized problem is depicted in Figs. 1(a and b). The soft claylayer of thickness H has been assumed to overlay on an imperviousrigid boundary and is improved by a group of stone columns havinga radius of rc each, extended to the bottom of the clay layer. The unitcell approach that adequately represents the true response of re-inforced ground (Balaam et al. 1977) is considered in the currentanalysis. As described byWang (2009), the radius of the influence ofthe unit cell is calculated by
re ¼ sgs ð2Þ
where s 5 center-to-center distance between the adjacent columns,and sg 5 geometric constant that depends on the pattern of stonecolumn installation.
The cross section of the entire zone of the unit cell is divided intofour distinct zones [Fig. 1(c)], viz., the unclogged column zone, theclogged column zone, the smear zone adjacent to the column, and theouter undisturbed soil zone. As shown in Fig. 2, the soil mass withinthe unit cell was divided both radially and vertically into (m2 1) and(n2 1) number of equal divisions, respectively;m and n are positiveintegers greater than unity, such that each of these divisions maybe expressed, respectively, as dr5 ðre2 rcÞ=ðm2 1Þ and dz5H=ðn2 1Þ. The total time interval of computation tt is divided into(p2 1) number of equal divisions, i.e., dt5 tt=ðp2 1Þ. The primary
objective of the analysis is to compute the excess pore waterpressures and the effective stresses developed at each separator at thecorresponding time and thereby compute the other time-dependentvariables such as the degree of consolidation. In this paper, theseseparators are denoted as nodes. The soil elements are under-standably ring-shaped.
The specific time tt is the desired time of computation to be chosenarbitrarily, and it is not the total time required to achieve the desireddegree of consolidation. The parameters for soil consolidation andsettlement are computed at the end of this time interval tt. If necessary,further computation can be carried out using these values as the initialinput parameters and choosing a new time interval tt.
Han and Ye (2002) stated that for a typical stone column, rs=rcvaries from 1 to 1.2 and kh=ks is usually in the order of 10, where, rs isthe radius of smear zone, and kh and ks are the horizontal permeabilityof soil in the undisturbed and smear zones, respectively. In the analysisofWang (2009), the valueof rs=rcwas assumed in the rangeof 1–2 andks=kh as 0.1. As reported by Walker and Indraratna (2006), the ratioof rs=rc usually varies between 2 and 3, and the permeability of soil inthe smear zone decreases in a parabolic pattern with radial distance.
The phenomenon of clogging is separately discussed in thesection, Effect of Clogging.
Assumptions
The analysis was carried out based on the following assumptions:1. All the compressive strains within the soil mass and the stone
column occur only in the vertical direction;2. The elastic settlements of the ground and the column are
insignificant compared with the consolidation settlement;3. The soil is fully saturated and the water is incompressible;4. Darcy’s law is valid, and the flow of water through the soil is
purely horizontal (radial toward the column). No flow of watertakes place through the cylindrical boundary and the imper-vious base of the unit cell; and
5. The coefficients of permeability and compressibility of the soilremain constant during the process of consolidation.
Arching Effect
Soil arching is a common phenomenon for stone column–reinforcedsoft soil beneath embankments. Arching initiates a reduction of thevertical stress acting on the relatively soft soil while increasing in thevertical stress on the stiffer columns (Deb 2010). As pointed out byLow et al. (1994), the arching effect induces a nonuniform distri-bution of vertical stress on the ground surface [Fig. 3(a)].
Load Transfer at the Interface between Soil and ColumnAs discussed by Han and Ye (2002), one of the major differencesbetween stone columns and drain wells is that stone columns havea higher stiffness ratio of the columns to the soil, resulting in a muchgreater stress transfer from the soil to the columns. Immediately afterthe embankment load is applied on the reinforced ground surface,both the column and the surrounding soil undergo undrained elasticsettlements. With the assumptions that the deformations take placeonly along the vertical direction and there is no differential settle-ment at the interface between the column and the surrounding soil,the ratio of vertical stresses induced at the interface betweenthe column and the soil has been found proportional to the modularratio of the reinforced soft ground (Han and Ye 2000; Castro andSagaseta 2009). Denoting the ratio of the stress on the stone columnto that on the surrounding soil as ns, the steady stress concentrationratio, the following equation was obtained:
378 / JOURNAL OF GEOTECHNICAL AND GEOENVIRONMENTAL ENGINEERING © ASCE / MARCH 2013
J. Geotech. Geoenviron. Eng. 2013.139:377-394.
Dow
nloa
ded
from
asc
elib
rary
.org
by
UN
IVER
SITY
OF
WO
LLO
NG
ON
G o
n 04
/15/
13. C
opyr
ight
ASC
E. F
or p
erso
nal u
se o
nly;
all
right
s res
erve
d.
qc=q1 ¼ ns ð3aÞwhere qc and q1 5 average vertical stresses on the column and thesoil at the ground surface, respectively, at the interface, and ns 5steady stress concentration ratio.
With the progressive bulging of the column in the vicinity of theground surface and the development of plastic strain, the stressconcentration ratio changes with time. In this analysis, however,the bulging of column was not considered; thus, the computedsettlements remain constant at the interface. Following the analysisof Han and Ye (2000) regarding the coefficient of compressibilityof an elastic body, the following correlation between ns and theelastic moduli of the column and the soil was introduced:
ns ¼ xEc
Esð3bÞ
whereEc and Es 5 elastic moduli of the column and the surroundingsoil, respectively, and x5 function of the Poisson’s ratios of the soiland the column.
As mentioned by Castro and Sagaseta (2009), the constrainedmodular ratio between the column and soil varies in the range of 10–50, although the lateral expansion of the column (bulging) reducesthe stress concentration ratio ns significantly. They also mentionedthat the plastic strains developed in the column can further reduce thevalue of ns to a value as low as 5. On the basis of the theoretical andexperimental investigations conducted by Barksdale and Bachus
Fig. 1. (a) Typical stone column–reinforced soft clay deposit supporting an embankment; (b) unit cell idealization; (c) cross section of the unit cell
JOURNAL OF GEOTECHNICAL AND GEOENVIRONMENTAL ENGINEERING © ASCE / MARCH 2013 / 379
J. Geotech. Geoenviron. Eng. 2013.139:377-394.
Dow
nloa
ded
from
asc
elib
rary
.org
by
UN
IVER
SITY
OF
WO
LLO
NG
ON
G o
n 04
/15/
13. C
opyr
ight
ASC
E. F
or p
erso
nal u
se o
nly;
all
right
s res
erve
d.

Fig. 2. Discretization of soil into elements within the unit cell
Fig. 3. (a) Vertical stress distribution on the ground surface; (b) arching effect in the embankment
380 / JOURNAL OF GEOTECHNICAL AND GEOENVIRONMENTAL ENGINEERING © ASCE / MARCH 2013
J. Geotech. Geoenviron. Eng. 2013.139:377-394.
Dow
nloa
ded
from
asc
elib
rary
.org
by
UN
IVER
SITY
OF
WO
LLO
NG
ON
G o
n 04
/15/
13. C
opyr
ight
ASC
E. F
or p
erso
nal u
se o
nly;
all
right
s res
erve
d.
(1983), the range of ns was reported as 3–10, whereas Mitchell(1981) reported this range to be 2–6 based onfield studies. As furthersuggested by Han and Ye (2002), the typical value of ns rangesbetween 2–5.
Vertical Stress Distribution on SoilFollowing the analysis of Low et al. (1994), the compatibilityequation for the element within the embankment material shown inFig. 3(b) can be written as
dsR
dRþ sR2su
Rþ ge ¼ 0 ð4Þ
where sR and su 5 stresses in the soil element along the direc-tions of the global coordinates R and u, respectively.
For limit analysis, su 5KpsR, where Kp is the coefficient ofpassive earth pressure of the embankment material. Therefore,Eq. (4) can be written as
dsR
dRþ sR
�12Kp
�R
þ ge ¼ 0 ð5Þ
Considering the value of radial stress sR along the midway betweenthe consecutive columns at R5 re as the boundary condition,i.e., sR 5 geðHe 2 reÞ1 qs at R5 re, the solution to the differentialequation [Eq. (5)] can be expressed by
sR ¼ �geðHe 2 reÞ þ qs2 gere=
�2Kp2 2
���ðR=reÞð2Kp21Þ þ geR=
�2Kp2 2
� ð6Þ
Following the analysis of Abusharar et al. (2009), the imposed loadintensity on the ground surface at r5 re may be written as
q2 ¼ gercðN2 1Þ�Kp2 1�=�Kp2 2
�þ �
qs þ geHe2�Kp2 1
�=�Kp2 2
��ð12 1=NÞðKp21Þð7Þ
where N5 re=rc.The stone columns possess higher stiffness in comparison with
the surrounding softer soil. Because of this significant column to soilstiffness ratio and the flexible nature of the embankment, the fillweight would arch over the stone columns (Lo et al. 2010) andimpose an uneven load distribution on the surface [as represented byEq. (8d)]. When the external load is applied on the unit cell, thecolumn deforms under the loading, and the surrounding soil offerspassive resistance against the outward lateral strains of the column.
Therefore, the passive state is enforced only at the soil columninterface and not anywhere else in the soft soil within the unit cellwhere theK0 state is valid. During the process of consolidation, thesoil in the unit cell remains at the K0 state, although differentialsettlement occurs at the soil surface following the free strain hy-pothesis (described in the subsection Consolidation of Soft Clay)that results in the development of vertical shear stress. Consideringa passive state to occur in thefill in the region above the stone column(Fig. 3), the value of q2 is justified.
The imposed load intensity on the soil surface at a radial distancer is hereby denoted as qðrÞ, whichwas quantified using the followingboundary conditions:1. The imposed load intensity on the ground surface over the
boundary of the unit cell is q2, i.e.,
qðreÞ ¼ q2 ð8aÞ
2. Because of the axi-symmetry of the unit cell, the value of½∂qðrÞ�=ð∂rÞdiminishes at the boundary of the unit cell; hence
dqðreÞdr
¼ 0 ð8bÞ
3. The total vertical load imposed on the surface of the unit cell isequal to the sum of the loads imposed on the soil and thatcarried by the column; thus
2pðrerc
rqðrÞdr þ qcpr2c ¼ ðqs þ geHeÞpr2e ð8cÞ
These conditions are fulfilled when the load distribution functionis expressed in the following form:
qðrÞ ¼ q2 þ ðN2 r=rcÞ2ðqs þ geHeÞN22 q2
�N2 þ ns2 1
�ðN þ 3ÞðN2 1Þ3=6 þ nsðN2 1Þ2
ð8dÞ
The average vertical stress on the soil surface of the unit cell is given by
qav ¼ qpr2e 2 qcpr2cpðr2e 2 r2c Þ
¼ qN22 qcN22 1
ð8eÞ
Consolidation of Soft Clay
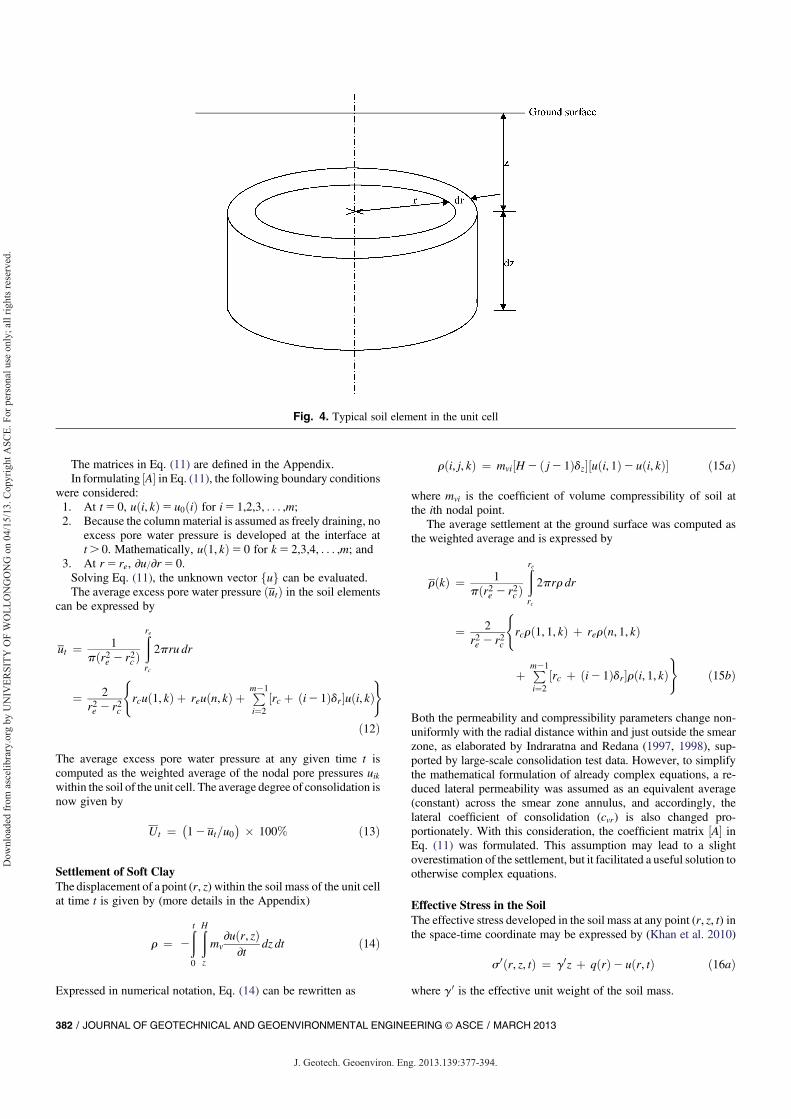
Dissipation of Excess Pore PressureConsidering a ring element of soil mass at a radial distance r, depth z,and time t (Fig. 4), the volumetric strain ɛv induced in the soil elementis given by (detailed derivation is presented in the Appendix)
∂ɛv∂t
¼ 1VdVdt
¼ 2ðkh=gwÞ�1r∂u∂r
þ ∂2u∂r2
�ð9Þ
where ɛv 5 volumetric strain in the element; V 5 volume of theelement; u 5 excess pore water pressure; and mv 5 coefficient ofvolume compressibility of the soil. It may be noted that as perAssumption 3, u is a function of the radial distance r and the time t,but not of the depth z. The excess pore pressure at any ith radial nodeand kth time instant is hereby denoted as uði, kÞ.
On the basis of Assumption 1, the rate of excess pore pressuredissipation ð∂uÞ=ð∂tÞ can then be expressed as
∂u∂t
¼ cvr
�1r∂u∂r
þ ∂2u∂r2
�ð10Þ
where cvr 5 coefficient of radial consolidation of the soil 5 kh=ðmvgwÞ.
Expressing Eq. (10) in a finite-difference form, the followingmatrix equation can be obtained:
½A�fug ¼ fbg ð11Þ
where ½A� 5 coefficient matrix of order mp3mp, fug5 unknownvector of order mp3 1 for excess pore water pressure, and fbg5augment vector of order mp3 1.
JOURNAL OF GEOTECHNICAL AND GEOENVIRONMENTAL ENGINEERING © ASCE / MARCH 2013 / 381
J. Geotech. Geoenviron. Eng. 2013.139:377-394.
Dow
nloa
ded
from
asc
elib
rary
.org
by
UN
IVER
SITY
OF
WO
LLO
NG
ON
G o
n 04
/15/
13. C
opyr
ight
ASC
E. F
or p
erso
nal u
se o
nly;
all
right
s res
erve
d.
The matrices in Eq. (11) are defined in the Appendix.In formulating ½A� in Eq. (11), the following boundary conditions
were considered:1. At t5 0, uði, kÞ5 u0ðiÞ for i5 1,2,3, . . . ,m;2. Because the columnmaterial is assumed as freely draining, no
excess pore water pressure is developed at the interface att. 0. Mathematically, uð1, kÞ5 0 for k5 2,3,4, . . . ,m; and
3. At r5 re, ∂u=∂r5 0.Solving Eq. (11), the unknown vector fug can be evaluated.The average excess pore water pressure ðutÞ in the soil elements
can be expressed by
ut ¼ 1pðr2e 2 r2c Þ
ðrerc
2pru dr
¼ 2r2e 2 r2c
(rcuð1, kÞ þ reuðn, kÞ þ Pm21
i¼2½rc þ ði2 1Þdr�uði, kÞ
)
ð12Þ
The average excess pore water pressure at any given time t iscomputed as the weighted average of the nodal pore pressures uikwithin the soil of the unit cell. The average degree of consolidation isnow given by
Ut ¼ �12 ut=u0
� � 100% ð13Þ
Settlement of Soft ClayThe displacement of a point (r, z) within the soil mass of the unit cellat time t is given by (more details in the Appendix)
r ¼ 2
ðt0
ðHz
mv∂uðr, zÞ
∂tdz dt ð14Þ
Expressed in numerical notation, Eq. (14) can be rewritten as
rði, j, kÞ ¼ mvi½H2 ð j2 1Þdz�½uði, 1Þ2 uði, kÞ� ð15aÞ
where mvi is the coefficient of volume compressibility of soil atthe ith nodal point.
The average settlement at the ground surface was computed asthe weighted average and is expressed by
rðkÞ ¼ 1pðr2e 2 r2c Þ
ðrerc
2prr dr
¼ 2r2e 2 r2c
(rcrð1, 1, kÞ þ rerðn, 1, kÞ
þ Pm21
i¼2½rc þ ði2 1Þdr�rði, 1, kÞ
)ð15bÞ
Both the permeability and compressibility parameters change non-uniformly with the radial distance within and just outside the smearzone, as elaborated by Indraratna and Redana (1997, 1998), sup-ported by large-scale consolidation test data. However, to simplifythe mathematical formulation of already complex equations, a re-duced lateral permeability was assumed as an equivalent average(constant) across the smear zone annulus, and accordingly, thelateral coefficient of consolidation (cvr) is also changed pro-portionately. With this consideration, the coefficient matrix ½A� inEq. (11) was formulated. This assumption may lead to a slightoverestimation of the settlement, but it facilitated a useful solution tootherwise complex equations.
Effective Stress in the SoilThe effective stress developed in the soil mass at any point (r, z, t) inthe space-time coordinate may be expressed by (Khan et al. 2010)
s0ðr, z, tÞ ¼ g0z þ qðrÞ2 uðr, tÞ ð16aÞwhere g 0 is the effective unit weight of the soil mass.
Fig. 4. Typical soil element in the unit cell
382 / JOURNAL OF GEOTECHNICAL AND GEOENVIRONMENTAL ENGINEERING © ASCE / MARCH 2013
J. Geotech. Geoenviron. Eng. 2013.139:377-394.
Dow
nloa
ded
from
asc
elib
rary
.org
by
UN
IVER
SITY
OF
WO
LLO
NG
ON
G o
n 04
/15/
13. C
opyr
ight
ASC
E. F
or p
erso
nal u
se o
nly;
all
right
s res
erve
d.
Expressing in numerical notation leads to
s0ði, j, kÞ ¼ g0ðj2 1Þdz þ qðiÞ2 uði, kÞ ð16bÞ
Effect of Clogging
The performance of stone columns in dissipating excess porepressure can be adversely affected by clogging. Because of thehigh hydraulic gradient at the soil-column interface, migration ofclay particles into the pores of the granular column inevitablyoccurs, resulting in a significant decrease in the column perme-ability (Adalier and Elgamalal 2004). This initiates a reduction inthe effective radius of the column in terms of drainage, as well asreducing the permeability in the clogged zone. The effective radiusof the column with clogging may be expressed by
r0c ¼ a rc ð17Þ
where a 5 nondimensional factor in the range 0,a# 1: fresh orideal stone columns with no clogging are characterized by a5 1,whereas total clogging is represented by a5 0.
Also, the coefficient of horizontal permeability in the cloggedzone may be written as
kcl ¼ akks ð18Þ
whereak 5 ratio of horizontal permeability of the clogged columnzone to that of the smear zone. Limited information (Mays 2010)available about the range of this parameter suggests that 0,ak # 1.
Along the radial direction, the entire region including the soiland the clogged zone is discretized into (m2 1) number of ele-ments such that dr 5 ðre 2 r0cÞ=ðm2 1Þ. In terms of drainage, thepermeability of the clogged zone is taken into consideration, andBoundary Condition 2 in section Consolidation of Soft Clay isaltered accordingly. The remaining analysis is similar to the casewithout clogging. The effect of clogging has been studied in termsof the nondimensional parameters a and ak, the values of whichmay be reasonably estimated by conducting rigorous experiments(Reddi et al. 2000; Hajra et al. 2002).
Improvement of Soft Clay
During consolidation, the undrained strength and stiffness of the soilincrease progressively. Umezaki et al. (1993) developed an ana-lytical model to predict such an increase in undrained shear strengthof soft clay as a function of the degree of consolidation. Followingthis analysis of the correspondence between the effective stress, voidratio, and undrained shear strength of soft clay, the undrained co-hesion at any point (i, j, k) in the space-time coordinate system maybe written as
cuði, j, kÞ ¼ cu0 þ zcð j2 1Þdz12
e02 eði, j, kÞmvið1 þ e0Þs0ði, j, kÞ
ð19Þ
where cu0 5 initial undrained cohesion of the soil at the groundsurface; zc 5 rate of increase of undrained cohesion with respectto depth, assuming the same to be linearly increasing; e0 5 initialvoid ratio of the soil; eði, j, kÞ5 reduced void ratio of the soil atpoint (i, j, k), which may be reasonably estimated from thee-s0 curve. The basis of derivation of Eq. (19) is given in theAppendix.
The undrained shear strength of clay is an important parameterfor stability analysis of the embankment. The ground improvementfactor v of the reinforced soil at any kth time instant has beendefined as the minimum value of the ratio of the instantaneous tothe initial values of the undrained cohesion in the soft soil withinthe unit cell. Thus
v ¼ min½cuði, j, kÞ=cu0� ð20Þ
Similarly, the increase in stiffness of the soft soil may be expressed asa settlement factor j that is defined herein as the ratio of the averageground settlements of the reinforced to unreinforced soils at 90%consolidation. Similarly, the increase in stiffness of the soft soil causedby reinforcement was expressed as a settlement factor j defined as
j ¼ r90ru90
ð21Þ
where r90 and ru90 5 average settlements at the ground surfaceof the reinforced and the unreinforced soil at 90% consolidation,respectively. The settlement of unreinforced soil has been computedusing Terzaghi’s one-dimensional consolidation theory. The settle-ment values at 90% consolidation are considered practical froma design aspect. Theoretically, the degree of consolidation increasesexponentially with time, and it is difficult to compute the finalsettlement of the reinforced soil at the ground surface at 100%consolidation using the present numerical model.
Computational Algorithm
Toexecute the analysis, a computer programwaswritten in FORTRAN90, using the following computational algorithms:1. Using the input data for soil and column properties, clogging
parameters, stress distribution coefficients, embankment char-acteristics, and time, the vertical stress distributions on the soilsurface and the column were calculated by Eq. (8d).
2. The nodal excess pore water pressures in the soil were com-puted using Eq. (11).
3. The average degree of consolidation, nodal and average groundsettlements, and nodal effective stresses in the soil are calcu-lated using Eqs. (12)–(16).
4. The improvement and settlement factors are computed.
Validation of the Model
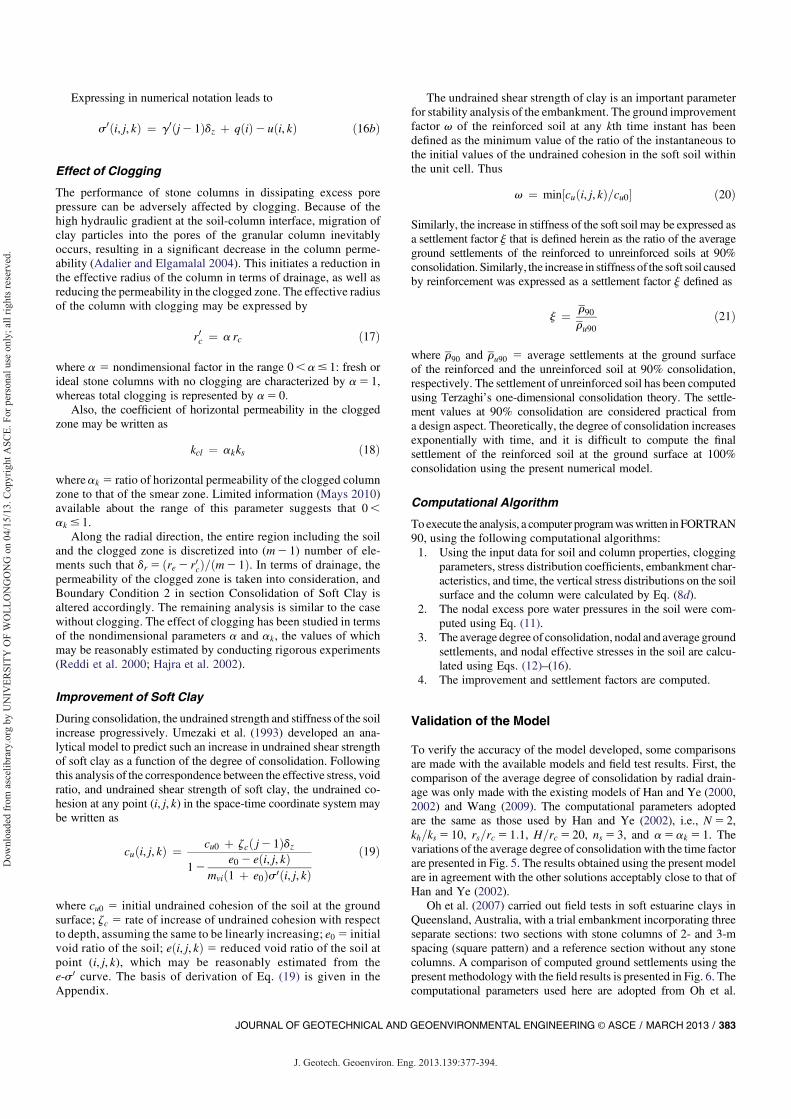
To verify the accuracy of the model developed, some comparisonsare made with the available models and field test results. First, thecomparison of the average degree of consolidation by radial drain-age was only made with the existing models of Han and Ye (2000,2002) and Wang (2009). The computational parameters adoptedare the same as those used by Han and Ye (2002), i.e., N5 2,kh=ks 5 10, rs=rc 5 1:1, H=rc 5 20, ns 5 3, and a5ak 5 1. Thevariations of the average degree of consolidation with the time factorare presented in Fig. 5. The results obtained using the present modelare in agreement with the other solutions acceptably close to that ofHan and Ye (2002).
Oh et al. (2007) carried out field tests in soft estuarine clays inQueensland, Australia, with a trial embankment incorporating threeseparate sections: two sections with stone columns of 2- and 3-mspacing (square pattern) and a reference section without any stonecolumns. A comparison of computed ground settlements using thepresent methodology with the field results is presented in Fig. 6. Thecomputational parameters used here are adopted from Oh et al.
JOURNAL OF GEOTECHNICAL AND GEOENVIRONMENTAL ENGINEERING © ASCE / MARCH 2013 / 383
J. Geotech. Geoenviron. Eng. 2013.139:377-394.
Dow
nloa
ded
from
asc
elib
rary
.org
by
UN
IVER
SITY
OF
WO
LLO
NG
ON
G o
n 04
/15/
13. C
opyr
ight
ASC
E. F
or p
erso
nal u
se o
nly;
all
right
s res
erve
d.
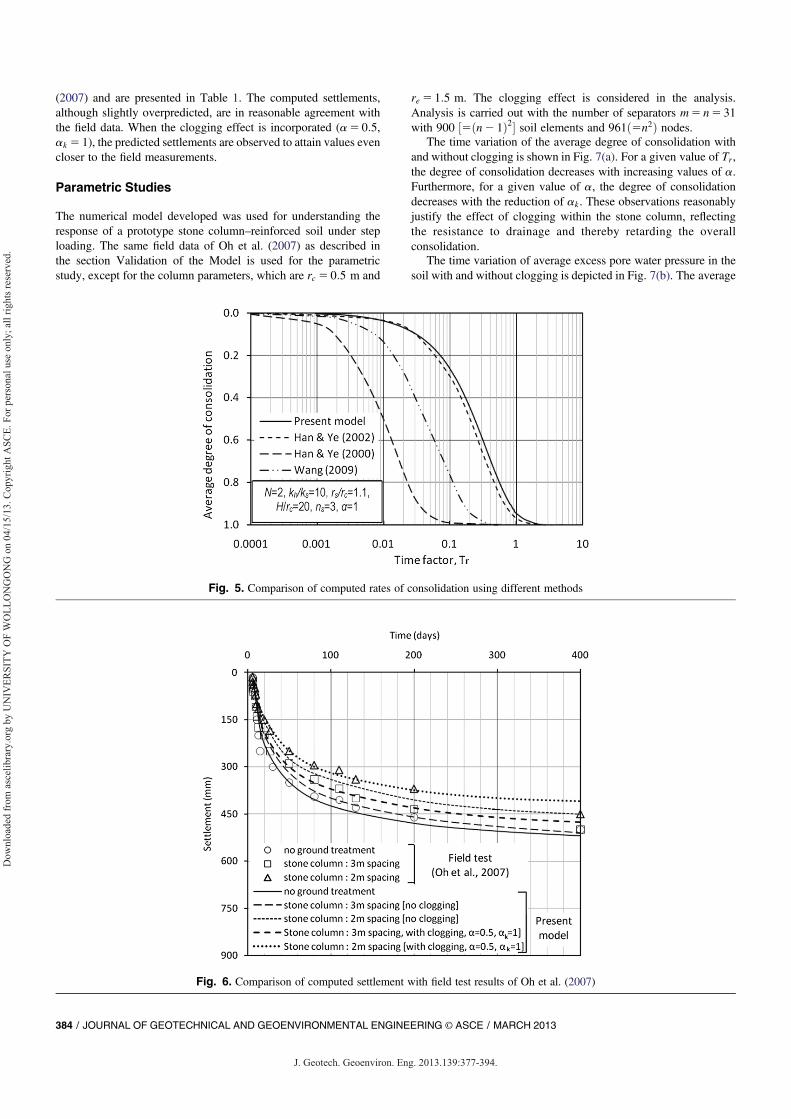
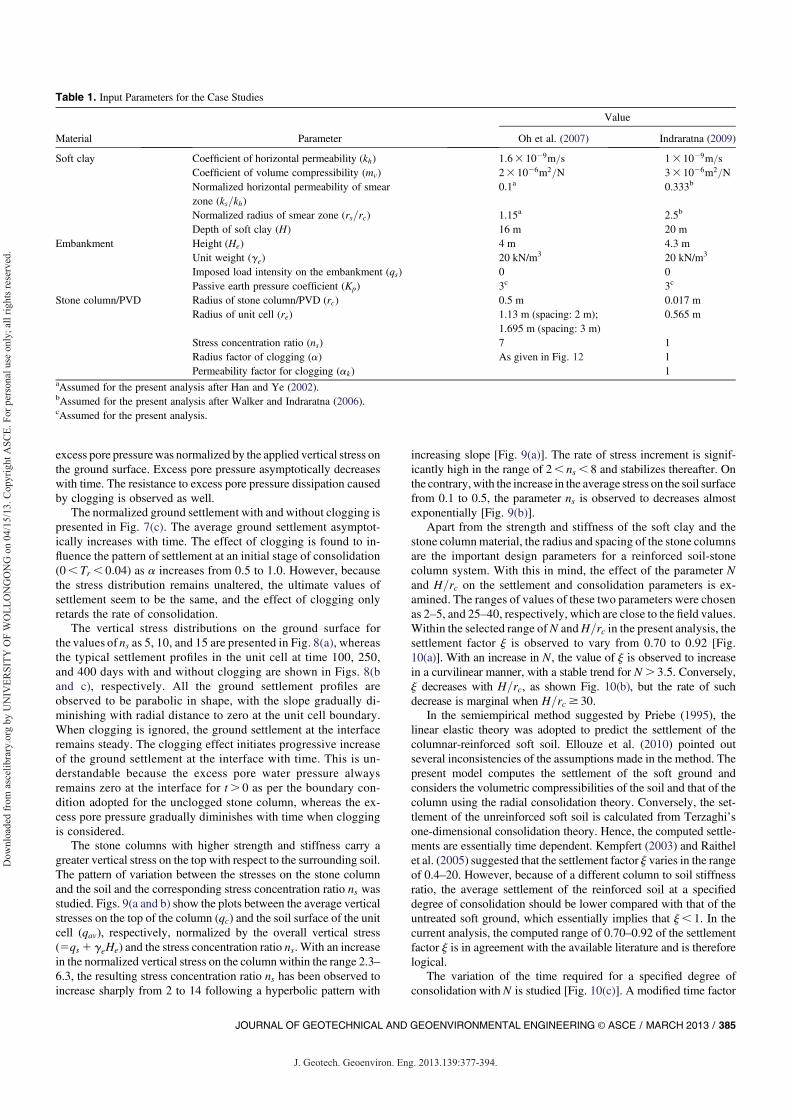
(2007) and are presented in Table 1. The computed settlements,although slightly overpredicted, are in reasonable agreement withthe field data. When the clogging effect is incorporated (a5 0:5,ak 5 1), the predicted settlements are observed to attain values evencloser to the field measurements.
Parametric Studies
The numerical model developed was used for understanding theresponse of a prototype stone column–reinforced soil under steploading. The same field data of Oh et al. (2007) as described inthe section Validation of the Model is used for the parametricstudy, except for the column parameters, which are rc 5 0:5 m and
re 5 1:5 m. The clogging effect is considered in the analysis.Analysis is carried out with the number of separators m5 n5 31with 900 ½5ðn2 1Þ2� soil elements and 961ð5n2Þ nodes.
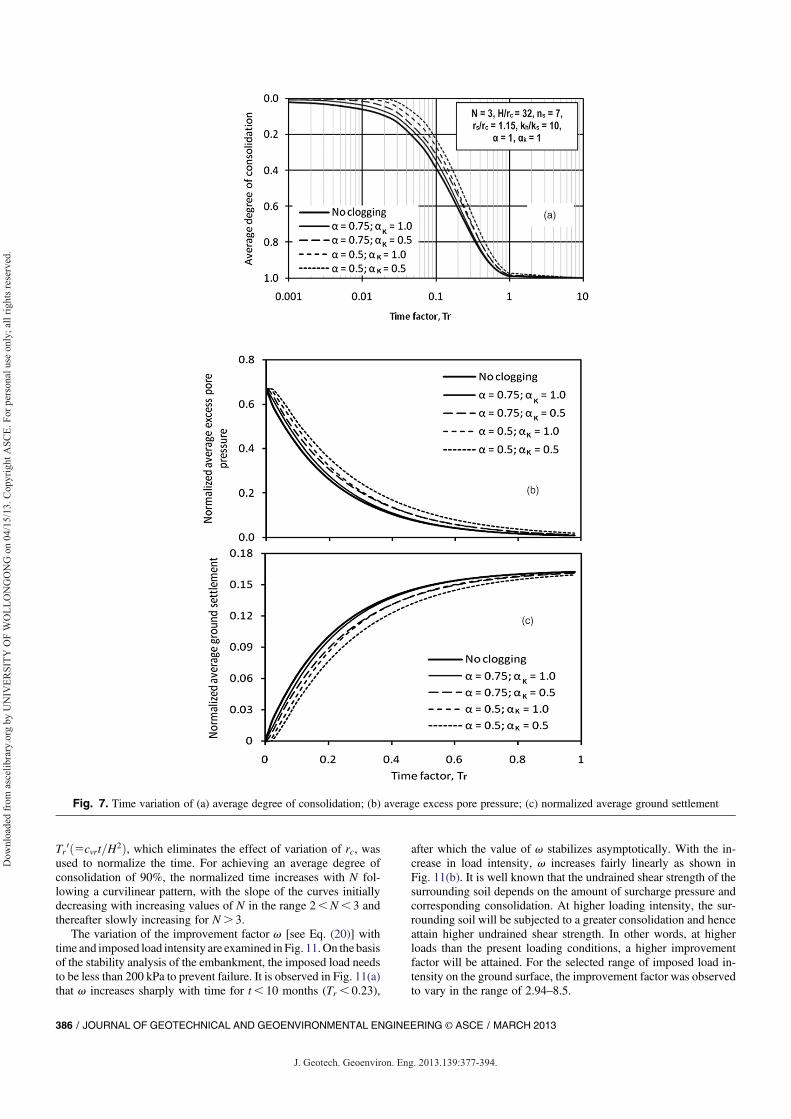
The time variation of the average degree of consolidation withand without clogging is shown in Fig. 7(a). For a given value of Tr,the degree of consolidation decreases with increasing values of a.Furthermore, for a given value of a, the degree of consolidationdecreases with the reduction of ak . These observations reasonablyjustify the effect of clogging within the stone column, reflectingthe resistance to drainage and thereby retarding the overallconsolidation.
The time variation of average excess pore water pressure in thesoil with and without clogging is depicted in Fig. 7(b). The average
Fig. 5. Comparison of computed rates of consolidation using different methods
Fig. 6. Comparison of computed settlement with field test results of Oh et al. (2007)
384 / JOURNAL OF GEOTECHNICAL AND GEOENVIRONMENTAL ENGINEERING © ASCE / MARCH 2013
J. Geotech. Geoenviron. Eng. 2013.139:377-394.
Dow
nloa
ded
from
asc
elib
rary
.org
by
UN
IVER
SITY
OF
WO
LLO
NG
ON
G o
n 04
/15/
13. C
opyr
ight
ASC
E. F
or p
erso
nal u
se o
nly;
all
right
s res
erve
d.
excess pore pressurewas normalized by the applied vertical stress onthe ground surface. Excess pore pressure asymptotically decreaseswith time. The resistance to excess pore pressure dissipation causedby clogging is observed as well.
The normalized ground settlement with and without clogging ispresented in Fig. 7(c). The average ground settlement asymptot-ically increases with time. The effect of clogging is found to in-fluence the pattern of settlement at an initial stage of consolidation(0, Tr , 0:04) as a increases from 0.5 to 1.0. However, becausethe stress distribution remains unaltered, the ultimate values ofsettlement seem to be the same, and the effect of clogging onlyretards the rate of consolidation.
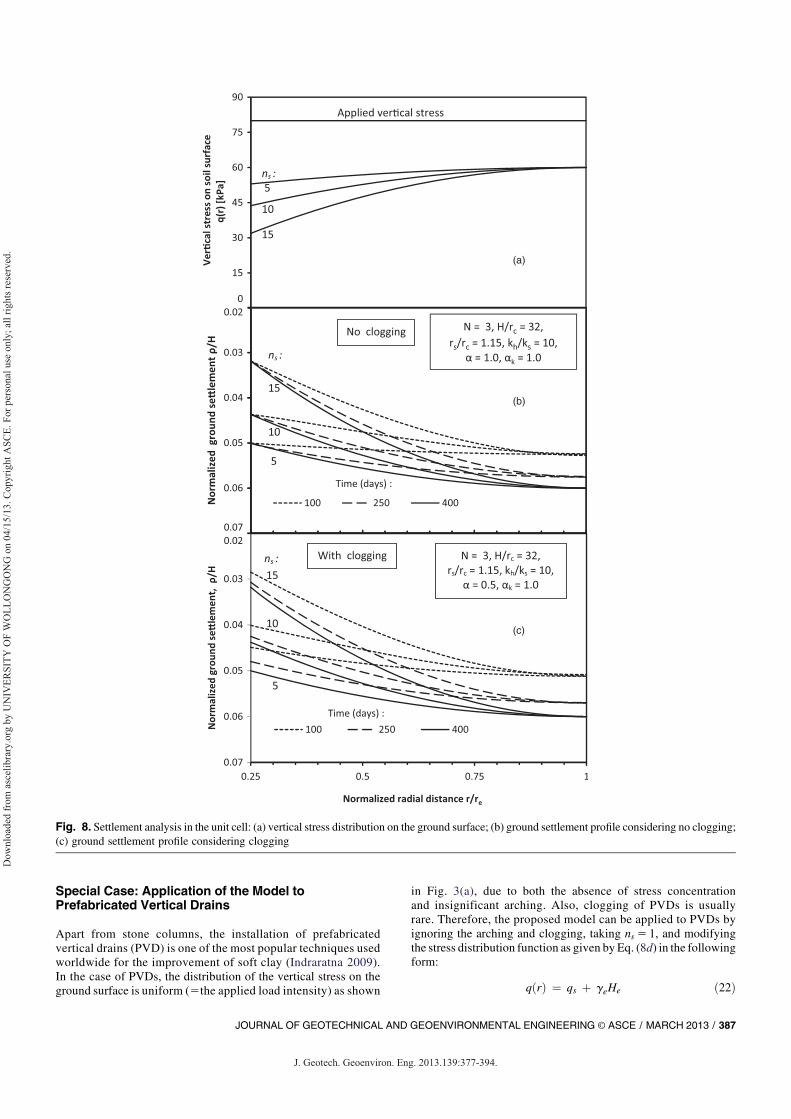
The vertical stress distributions on the ground surface forthe values of ns as 5, 10, and 15 are presented in Fig. 8(a), whereasthe typical settlement profiles in the unit cell at time 100, 250,and 400 days with and without clogging are shown in Figs. 8(band c), respectively. All the ground settlement profiles areobserved to be parabolic in shape, with the slope gradually di-minishing with radial distance to zero at the unit cell boundary.When clogging is ignored, the ground settlement at the interfaceremains steady. The clogging effect initiates progressive increaseof the ground settlement at the interface with time. This is un-derstandable because the excess pore water pressure alwaysremains zero at the interface for t. 0 as per the boundary con-dition adopted for the unclogged stone column, whereas the ex-cess pore pressure gradually diminishes with time when cloggingis considered.
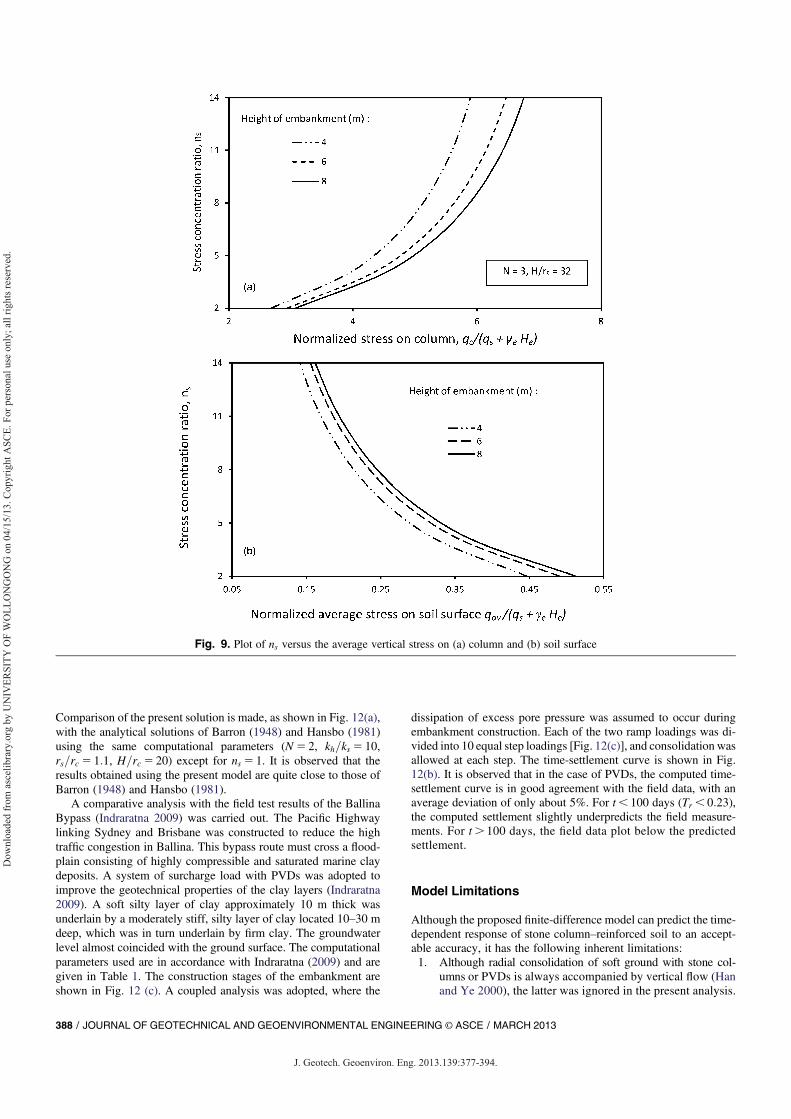
The stone columns with higher strength and stiffness carry agreater vertical stress on the top with respect to the surrounding soil.The pattern of variation between the stresses on the stone columnand the soil and the corresponding stress concentration ratio ns wasstudied. Figs. 9(a and b) show the plots between the average verticalstresses on the top of the column (qc) and the soil surface of the unitcell (qav), respectively, normalized by the overall vertical stress(5qs 1 geHe) and the stress concentration ratio ns. With an increasein the normalized vertical stress on the column within the range 2.3–6.3, the resulting stress concentration ratio ns has been observed toincrease sharply from 2 to 14 following a hyperbolic pattern with
increasing slope [Fig. 9(a)]. The rate of stress increment is signif-icantly high in the range of 2, ns , 8 and stabilizes thereafter. Onthe contrary,with the increase in the average stress on the soil surfacefrom 0.1 to 0.5, the parameter ns is observed to decreases almostexponentially [Fig. 9(b)].
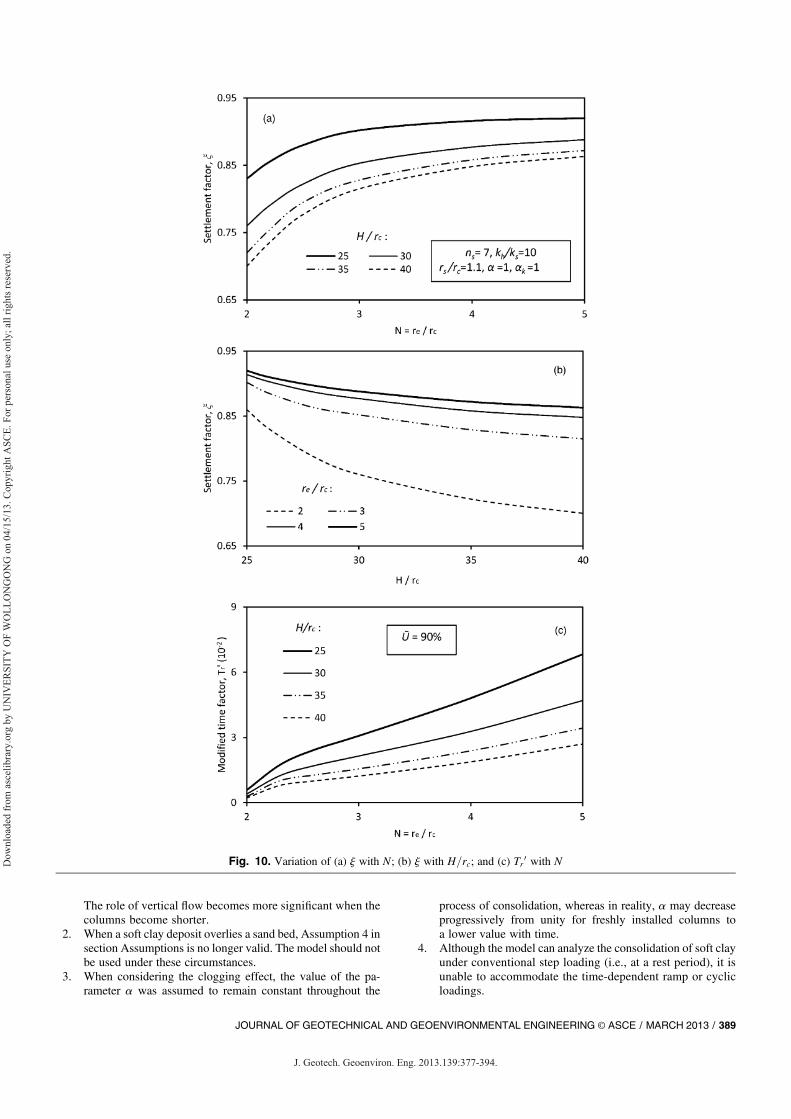
Apart from the strength and stiffness of the soft clay and thestone columnmaterial, the radius and spacing of the stone columnsare the important design parameters for a reinforced soil-stonecolumn system. With this in mind, the effect of the parameter Nand H=rc on the settlement and consolidation parameters is ex-amined. The ranges of values of these two parameters were chosenas 2–5, and 25–40, respectively, which are close to the field values.Within the selected range ofN andH=rc in the present analysis, thesettlement factor j is observed to vary from 0.70 to 0.92 [Fig.10(a)]. With an increase in N, the value of j is observed to increasein a curvilinear manner, with a stable trend for N. 3:5. Conversely,j decreases with H=rc, as shown Fig. 10(b), but the rate of suchdecrease is marginal when H=rc $ 30.
In the semiempirical method suggested by Priebe (1995), thelinear elastic theory was adopted to predict the settlement of thecolumnar-reinforced soft soil. Ellouze et al. (2010) pointed outseveral inconsistencies of the assumptions made in the method. Thepresent model computes the settlement of the soft ground andconsiders the volumetric compressibilities of the soil and that of thecolumn using the radial consolidation theory. Conversely, the set-tlement of the unreinforced soft soil is calculated from Terzaghi’sone-dimensional consolidation theory. Hence, the computed settle-ments are essentially time dependent. Kempfert (2003) and Raithelet al. (2005) suggested that the settlement factor j varies in the rangeof 0.4–20. However, because of a different column to soil stiffnessratio, the average settlement of the reinforced soil at a specifieddegree of consolidation should be lower compared with that of theuntreated soft ground, which essentially implies that j, 1. In thecurrent analysis, the computed range of 0.70–0.92 of the settlementfactor j is in agreement with the available literature and is thereforelogical.
The variation of the time required for a specified degree ofconsolidation with N is studied [Fig. 10(c)]. A modified time factor
Table 1. Input Parameters for the Case Studies
Material Parameter
Value
Oh et al. (2007) Indraratna (2009)
Soft clay Coefficient of horizontal permeability (kh) 1:63 1029m=s 13 1029m=sCoefficient of volume compressibility (mv) 23 1026m2=N 33 1026m2=NNormalized horizontal permeability of smearzone (ks=kh)
0.1a 0.333b
Normalized radius of smear zone (rs=rc) 1.15a 2.5b
Depth of soft clay (H) 16 m 20 mEmbankment Height (He) 4 m 4.3 m
Unit weight (ge) 20 kN/m3 20 kN/m3
Imposed load intensity on the embankment (qs) 0 0Passive earth pressure coefficient (Kp) 3c 3c
Stone column/PVD Radius of stone column/PVD (rc) 0.5 m 0.017 mRadius of unit cell (re) 1.13 m (spacing: 2 m);
1.695 m (spacing: 3 m)0.565 m
Stress concentration ratio (ns) 7 1Radius factor of clogging (a) As given in Fig. 12 1Permeability factor for clogging (ak) 1
aAssumed for the present analysis after Han and Ye (2002).bAssumed for the present analysis after Walker and Indraratna (2006).cAssumed for the present analysis.
JOURNAL OF GEOTECHNICAL AND GEOENVIRONMENTAL ENGINEERING © ASCE / MARCH 2013 / 385
J. Geotech. Geoenviron. Eng. 2013.139:377-394.
Dow
nloa
ded
from
asc
elib
rary
.org
by
UN
IVER
SITY
OF
WO
LLO
NG
ON
G o
n 04
/15/
13. C
opyr
ight
ASC
E. F
or p
erso
nal u
se o
nly;
all
right
s res
erve
d.
Tr 0ð5cvrt=H2Þ, which eliminates the effect of variation of rc, wasused to normalize the time. For achieving an average degree ofconsolidation of 90%, the normalized time increases with N fol-lowing a curvilinear pattern, with the slope of the curves initiallydecreasing with increasing values of N in the range 2,N, 3 andthereafter slowly increasing for N. 3.
The variation of the improvement factor v [see Eq. (20)] withtime and imposed load intensity are examined in Fig. 11.On the basisof the stability analysis of the embankment, the imposed load needsto be less than 200 kPa to prevent failure. It is observed in Fig. 11(a)that v increases sharply with time for t, 10 months (Tr , 0:23),
after which the value of v stabilizes asymptotically. With the in-crease in load intensity, v increases fairly linearly as shown inFig. 11(b). It is well known that the undrained shear strength of thesurrounding soil depends on the amount of surcharge pressure andcorresponding consolidation. At higher loading intensity, the sur-rounding soil will be subjected to a greater consolidation and henceattain higher undrained shear strength. In other words, at higherloads than the present loading conditions, a higher improvementfactor will be attained. For the selected range of imposed load in-tensity on the ground surface, the improvement factor was observedto vary in the range of 2.94–8.5.
Fig. 7. Time variation of (a) average degree of consolidation; (b) average excess pore pressure; (c) normalized average ground settlement
386 / JOURNAL OF GEOTECHNICAL AND GEOENVIRONMENTAL ENGINEERING © ASCE / MARCH 2013
J. Geotech. Geoenviron. Eng. 2013.139:377-394.
Dow
nloa
ded
from
asc
elib
rary
.org
by
UN
IVER
SITY
OF
WO
LLO
NG
ON
G o
n 04
/15/
13. C
opyr
ight
ASC
E. F
or p
erso
nal u
se o
nly;
all
right
s res
erve
d.
Special Case: Application of the Model toPrefabricated Vertical Drains
Apart from stone columns, the installation of prefabricatedvertical drains (PVD) is one of the most popular techniques usedworldwide for the improvement of soft clay (Indraratna 2009).In the case of PVDs, the distribution of the vertical stress on theground surface is uniform (5the applied load intensity) as shown
in Fig. 3(a), due to both the absence of stress concentrationand insignificant arching. Also, clogging of PVDs is usuallyrare. Therefore, the proposed model can be applied to PVDs byignoring the arching and clogging, taking ns 5 1, and modifyingthe stress distribution function as given by Eq. (8d) in the followingform:
qðrÞ ¼ qs þ geHe ð22Þ
Fig. 8. Settlement analysis in the unit cell: (a) vertical stress distribution on the ground surface; (b) ground settlement profile considering no clogging;(c) ground settlement profile considering clogging
JOURNAL OF GEOTECHNICAL AND GEOENVIRONMENTAL ENGINEERING © ASCE / MARCH 2013 / 387
J. Geotech. Geoenviron. Eng. 2013.139:377-394.
Dow
nloa
ded
from
asc
elib
rary
.org
by
UN
IVER
SITY
OF
WO
LLO
NG
ON
G o
n 04
/15/
13. C
opyr
ight
ASC
E. F
or p
erso
nal u
se o
nly;
all
right
s res
erve
d.
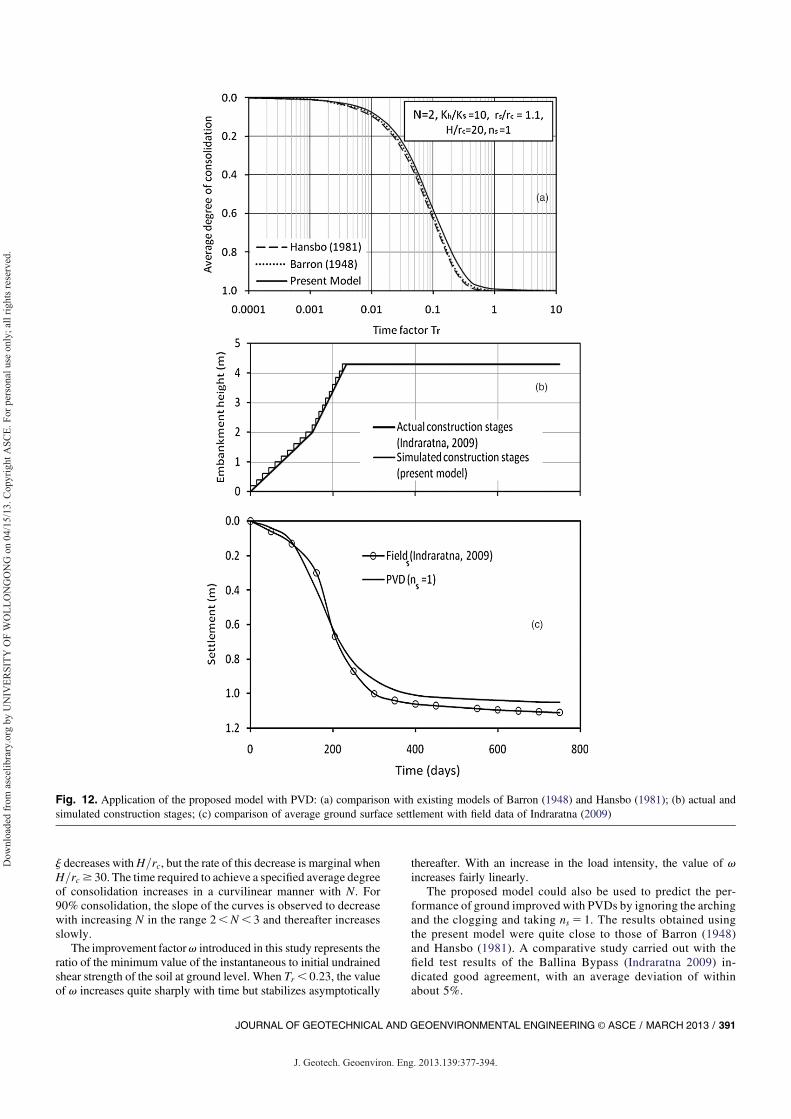
Comparison of the present solution is made, as shown in Fig. 12(a),with the analytical solutions of Barron (1948) and Hansbo (1981)using the same computational parameters (N5 2, kh=ks 5 10,rs=rc 5 1:1, H=rc 5 20) except for ns 5 1. It is observed that theresults obtained using the present model are quite close to those ofBarron (1948) and Hansbo (1981).
A comparative analysis with the field test results of the BallinaBypass (Indraratna 2009) was carried out. The Pacific Highwaylinking Sydney and Brisbane was constructed to reduce the hightraffic congestion in Ballina. This bypass route must cross a flood-plain consisting of highly compressible and saturated marine claydeposits. A system of surcharge load with PVDs was adopted toimprove the geotechnical properties of the clay layers (Indraratna2009). A soft silty layer of clay approximately 10 m thick wasunderlain by a moderately stiff, silty layer of clay located 10–30 mdeep, which was in turn underlain by firm clay. The groundwaterlevel almost coincided with the ground surface. The computationalparameters used are in accordance with Indraratna (2009) and aregiven in Table 1. The construction stages of the embankment areshown in Fig. 12 (c). A coupled analysis was adopted, where the
dissipation of excess pore pressure was assumed to occur duringembankment construction. Each of the two ramp loadings was di-vided into 10 equal step loadings [Fig. 12(c)], and consolidation wasallowed at each step. The time-settlement curve is shown in Fig.12(b). It is observed that in the case of PVDs, the computed time-settlement curve is in good agreement with the field data, with anaverage deviation of only about 5%. For t, 100 days (Tr , 0:23),the computed settlement slightly underpredicts the field measure-ments. For t. 100 days, the field data plot below the predictedsettlement.
Model Limitations
Although the proposed finite-difference model can predict the time-dependent response of stone column–reinforced soil to an accept-able accuracy, it has the following inherent limitations:1. Although radial consolidation of soft ground with stone col-
umns or PVDs is always accompanied by vertical flow (Hanand Ye 2000), the latter was ignored in the present analysis.
Fig. 9. Plot of ns versus the average vertical stress on (a) column and (b) soil surface
388 / JOURNAL OF GEOTECHNICAL AND GEOENVIRONMENTAL ENGINEERING © ASCE / MARCH 2013
J. Geotech. Geoenviron. Eng. 2013.139:377-394.
Dow
nloa
ded
from
asc
elib
rary
.org
by
UN
IVER
SITY
OF
WO
LLO
NG
ON
G o
n 04
/15/
13. C
opyr
ight
ASC
E. F
or p
erso
nal u
se o
nly;
all
right
s res
erve
d.
The role of vertical flow becomes more significant when thecolumns become shorter.
2. When a soft clay deposit overlies a sand bed, Assumption 4 insection Assumptions is no longer valid. The model should notbe used under these circumstances.
3. When considering the clogging effect, the value of the pa-rameter a was assumed to remain constant throughout the
process of consolidation, whereas in reality, a may decreaseprogressively from unity for freshly installed columns toa lower value with time.
4. Although the model can analyze the consolidation of soft clayunder conventional step loading (i.e., at a rest period), it isunable to accommodate the time-dependent ramp or cyclicloadings.
Fig. 10. Variation of (a) j with N; (b) j with H=rc; and (c) Tr 0 with N
JOURNAL OF GEOTECHNICAL AND GEOENVIRONMENTAL ENGINEERING © ASCE / MARCH 2013 / 389
J. Geotech. Geoenviron. Eng. 2013.139:377-394.
Dow
nloa
ded
from
asc
elib
rary
.org
by
UN
IVER
SITY
OF
WO
LLO
NG
ON
G o
n 04
/15/
13. C
opyr
ight
ASC
E. F
or p
erso
nal u
se o
nly;
all
right
s res
erve
d.

Conclusions
A finite-difference solution for predicting the stress distributionand consolidation response of stone column–reinforced soft groundbased on the unit cell concept was developed based on the freestrain hypothesis, considering arching, smear, and clogging effects.The comparison of the numerical results with the available fielddata and past theoretical studies justifies the validity of the pro-posed model.
The study indicates that the clogging in the stone columnretards the overall consolidation process. The average groundsettlement increases with time, the rate of which stabilizes in anasymptotic manner. The effect of clogging was found to influencethe pattern of settlement at the initial stage of consolidation(0, Tr , 0:04) as a increases from 0.5 to 1.0. Because the stressdistribution remains unaltered, the ultimate values of settlementremain the same, and the effect of clogging only retards the rate ofsettlement consolidation. The typical settlement profile is ob-served to be parabolic, with the slope gradually diminishing withthe radial distance to zero at the unit cell boundary. When
clogging is ignored, the ground settlement at the interface doesnot vary with time. Conversely, incorporation of clogging leadsto progressive increase of the ground settlement at the interfacewith time.
The vertical stress distribution acting on the column and thesoil surface of the unit cell are significantly affected by the rel-ative stiffness of the column and the soil. With an increase in thenormalized vertical stress on the column within the range 2.3–6.3,the resulting stress concentration ratio is observed to increasesharply in the range of 2# ns # 14 following a hyperbolic patternwith increasing slope. The rate of stress increment is significantlyhigh in the range of 2, ns , 8 and stabilizes thereafter. On thecontrary, with the increase in the average stress on the soil surfacefrom 0.1 to 0.5, the parameter ns is observed to decrease almostexponentially.
The magnitude of ground settlement is influenced by the varia-tion of the radius and spacing of stone columns. When the param-eters N and H=rc varied from 2 to 5 and 25 to 40, respectively, thesettlement factor j varied from 0.70 to 0.92. The value of j increaseswith N and stabilizes asymptotically when N. 3:5. Conversely,
Fig. 11. Variation of improvement factor v with (a) time and (b) imposed load intensity
390 / JOURNAL OF GEOTECHNICAL AND GEOENVIRONMENTAL ENGINEERING © ASCE / MARCH 2013
J. Geotech. Geoenviron. Eng. 2013.139:377-394.
Dow
nloa
ded
from
asc
elib
rary
.org
by
UN
IVER
SITY
OF
WO
LLO
NG
ON
G o
n 04
/15/
13. C
opyr
ight
ASC
E. F
or p
erso
nal u
se o
nly;
all
right
s res
erve
d.
j decreases withH=rc, but the rate of this decrease is marginal whenH=rc $ 30. The time required to achieve a specified average degreeof consolidation increases in a curvilinear manner with N. For90% consolidation, the slope of the curves is observed to decreasewith increasing N in the range 2,N, 3 and thereafter increasesslowly.
The improvement factorv introduced in this study represents theratio of the minimum value of the instantaneous to initial undrainedshear strength of the soil at ground level. When Tr , 0:23, the valueof v increases quite sharply with time but stabilizes asymptotically
thereafter. With an increase in the load intensity, the value of vincreases fairly linearly.
The proposed model could also be used to predict the per-formance of ground improved with PVDs by ignoring the archingand the clogging and taking ns 5 1. The results obtained usingthe present model were quite close to those of Barron (1948)and Hansbo (1981). A comparative study carried out with thefield test results of the Ballina Bypass (Indraratna 2009) in-dicated good agreement, with an average deviation of withinabout 5%.
Fig. 12. Application of the proposed model with PVD: (a) comparison with existing models of Barron (1948) and Hansbo (1981); (b) actual andsimulated construction stages; (c) comparison of average ground surface settlement with field data of Indraratna (2009)
JOURNAL OF GEOTECHNICAL AND GEOENVIRONMENTAL ENGINEERING © ASCE / MARCH 2013 / 391
J. Geotech. Geoenviron. Eng. 2013.139:377-394.
Dow
nloa
ded
from
asc
elib
rary
.org
by
UN
IVER
SITY
OF
WO
LLO
NG
ON
G o
n 04
/15/
13. C
opyr
ight
ASC
E. F
or p
erso
nal u
se o
nly;
all
right
s res
erve
d.
Appendix. Mathematical Derivations
Considering the ring element shown in Fig. 4, the volume of waterout of the soil mass through the inner vertical surface at time intervaldt is given as
Vo ¼ ðkh=gwÞ ∂u∂r 2pr dz dt ð23Þ
where gw 5 unit weight of water.Similarly, the flow of water into the soil mass through the outervertical surface is given by
Vi ¼ ðkh=gwÞ ∂∂r
�u þ ∂u
∂rdr2pðr þ drÞ dz dt ð24Þ
Therefore, the net reduction in the volume of the soil elementat time interval dt is given (neglecting the higher order term)by
dV ¼ Vo2Vi ¼ ðkh=gwÞ�1r∂u∂r
þ ∂2u∂r2
�2pr dr dz dt
¼ 2ðkh=gwÞ�1r∂u∂r
þ ∂2u∂r2
�Vdt ð25Þ
where V 5 volume of the soil mass at time t5 2pr dr dz.The matrices in Eq. (11) are described:
u� ¼
u11; u12; u13; . . . ; u1p; u21; u22; u23; . . . ; u2p; u31; u32; u33; . . . ; u3p; . . . . . . , um1; um2; um3; . . . ; ump�T
b� ¼ fu0ð1Þ,0,0, . . . ,0, u0ð2Þ,0,0, . . . ,0, u0ð3Þ,0,0, . . . ,0; . . . . . . . . . , u0ðmÞ,0,0, . . . ,0gT
½A� ¼
266666664
a11 a12 a13 .:::::: a1,mpa21 a22 a23 .:::::: a2,mpa31 a32 a33 .::::: a3,mp2
2
amp,1
2
2
amp,2
2
2
amp,3
2
2
.:::::
2
2
amp,mp
377777775. . . . . .
ð26Þ
The coefficients aij of the matrix [A] are obtained from Eq. (10) andby applying the boundary conditions given in section Consolidationof Soft Clay.The compression of the soil element (Fig. 4) in the time interval dt isgiven [using Eq. (10)] by
dr ¼ dV2prdr
¼ ðkh=gwÞ�1r∂u∂r
þ ∂2u∂r2
�dz dt ¼ 2mv
∂u∂t
dz dt
ð27Þ
The preceding expression can be integrated to compute the dis-placement of a point (r, z) within the soil mass of the unit cell at timeinstant t, and accordingly, Eq. (14) is obtained.From the e-s0 relationship of the soft clay
e02 eði, j, kÞs0ði, j, kÞ2s0
0¼ mvið1 þ e0Þ ð28Þ
where s00 is the initial effective stress in the soil at the nodal point
under consideration. Eq. (28) can be rewritten as
s0ði, j, kÞs00
¼ 1
12e02 eði, j, kÞ
mvið1 þ e0Þs0ði, j, kÞð29Þ
Following the analysis of Umezaki et al. (1993) regarding theconstant value of the undrained shear strength ratio of the soilirrespective of the consolidation time, Eq. (19) was derived usingEq. (29).
Acknowledgments
The authors gratefully acknowledge the financial support receivedin the form of an Endeavour Postdoctoral Research Fellowshipfrom the Department of Education, Environment and WorkplaceRelations (DEEWR), Australian Government, through Austrain-ing International.
Notation
The following symbols are used in this paper:½A� 5 coefficient matrix;aij 5 elements of the finite difference coefficient
matrix;fbg 5 augment vector;cu 5 undrained cohesion;cu0 5 initial undrained cohesion at ground level;cvr 5 coefficient of radial consolidation of the
soil;Ec,Es 5 elastic moduli of the column and the
surrounding soil;e 5 void ratio;e0 5 initial void ratio;H 5 thickness of the soft clay deposit;He 5 height of embankment;i 5 radial coordinate indicator;j 5 depth coordinate indicator;
Kp 5 passive earth pressure coefficient of theembankment;
k 5 time coordinate indicator;kcl 5 horizontal permeability of clogged zone;kh 5 horizontal soil permeability;ks 5 horizontal permeability of smear zone;k0 5 in situ earth pressure coefficient at rest;mv 5 soil volume compressibility;mvc 5 volumetric compressibility of the column;mvi 5 soil volume compressibility at the ith node;
392 / JOURNAL OF GEOTECHNICAL AND GEOENVIRONMENTAL ENGINEERING © ASCE / MARCH 2013
J. Geotech. Geoenviron. Eng. 2013.139:377-394.
Dow
nloa
ded
from
asc
elib
rary
.org
by
UN
IVER
SITY
OF
WO
LLO
NG
ON
G o
n 04
/15/
13. C
opyr
ight
ASC
E. F
or p
erso
nal u
se o
nly;
all
right
s res
erve
d.

m, n, p 5 number of divisions;N 5 re=rc;ns 5 ratio of the volumetric compressibility of the soil
to that of the column;q 5 average vertical stress on unit cell upper
boundary;qav 5 average vertical stress on the soil surface of the
unit cell;qc 5 average vertical stress on top of column;qs 5 surcharge load intensity on embankment surface;q1 5 vertical stress on ground surface on soil at
interface;q2 5 vertical stress on ground surface on soil at unit
cell boundary;qðrÞ 5 vertical stress on ground surface at radial
distance r;R 5 global radial coordinate;r 5 radial coordinate of unit cell;rc 5 radius of stone column;rc0 5 radius of stone column excluding the clogged
zone;re 5 radius of influence of one stone column;rs 5 radius of smear zone;Tr 5 time factor 5 cvrt=ð4re2Þ;Tr 0 5 modified time factor 5 cvrt=H2;t 5 time coordinate;tt 5 total time of consolidation;U 5 degree of consolidation;Ut 5 average degree of consolidation;u 5 excess pore water pressure;
fug 5 excess pore water pressure vector;ut 5 average excess pore water pressure at any time t;V 5 volume of soil mass;z 5 depth coordinate;a 5 radius factor for clogging;ak 5 permeability factor for clogging;g 0 5 effective unit weight of soil;ge 5 unit weight of fill;gw 5 unit weight of water;dt 5 length of an element on time axis;dr 5 length of an element on radial axis;dz 5 length of an element on depth axis;ɛ 5 vertical compressive strain in soil;ɛv 5 volumetric strain in soil;zc 5 rate of increase in undrained cohesion of
soil;u 5 global coordinate;j 5 settlement factor;r 5 vertical displacement of soil;
ru90 5 average settlement at ground surface of theunreinforced soil at 90% consolidation;
r90 5 average settlement at ground surface of thereinforced soil at 90% consolidation;
s0 5 effective stress in soil;sR 5 normal stress in soil element along
R-direction;su 5 normal stress in soil element along
u-direction;x 5 a Poisson’s ratio function for the soil and the
column; andv 5 improvement factor.
References
Abusharar, S. W., Zheng, J. J., Chen, B. B., and Yin, J. H. (2009). “Asimplified method for analysis of a piled embankment reinforced withgeosynthetics.” Geotextiles Geomembranes, 27(1), 39–52.
Adalier, K., and Elgamal, A. (2004). “Mitigation of liquefaction and as-sociated ground deformations by stone columns.” Eng. Geol., 72(3–4),275–291.
Alamgir, M., Miura, N., Poorooshasb, H. B., and Madhav, M. R. (1996).“Deformational analysis of soft ground reinforced by columnar inclu-sions.” Comput. Geotech., 18(4), 267–290.
Balaam, N. P., Poulos, H. G., and Brown, P. T. (1977). “Settlement analysisof soft clays reinforced with granular piles.” Proc., 5th Southeast AsianConf. on Soil Engineering, Sponsor Southeast Asian GeotechnicalSociety, Bangkok, Thailand, 81–92.
Barksdale, R. D., and Bachus, R. C. (1983). “Design and construction ofstone columns.” Rep. FHWA/RD-83/026, National Technical Informa-tion Service, Springfield, VA.
Barron, B. A. (1948). “Consolidation of fine grained soil by drain wells.”Trans. Am. Soc. Civ. Eng., 113(2346), 712–748.
Castro, J., and Sagaseta, C. (2009). “Consolidation around stone columns:Influence of column deformation.” Int. J. Numer. Anal. Methods Geo-mech., 33(7), 851–877.
Deb, K. (2010). “A mathematical model to study the soil arching effect instone column-supported embankment resting on soft foundation soil.”Appl. Math. Model., 34(12), 3871–3883.
Ellouze, S., Bouassida, M., Hazzar, L., and Mroueh, H. (2010). “On set-tlement of stone column foundation by Priebe’s method.” GroundImprov., 163(GI2), 101–107.
Guetif, T., Bouassida, M., and Debats, J. M. (2007). “Improved soft claycharacteristics due to stone column installation.” Comput. Geotech.,34(2), 104–111.
Hajra, M. G., Reddi, L. N., Glasgow, L. A., Xiao, M., and Lee, I. M. (2002).“Effects of ionic strength on fine particle clogging of soil filters.” J.Geotech. Geoenviron. Eng., 128(8), 631–639.
Han, J., and Ye, S. L. (2000). “Simplified method for consolidation rate ofstone column reinforced foundations.” J. Geotech. Geoenviron. Eng.,127(7), 597–603.
Han, J., and Ye, S. L. (2002). “A theoretical solution for consolidation ratesfor stone column reinforced foundations accounting for smear and wellresistance effects.” Int. J. Geomech., 2(2), 135–151.
Hansbo, S. (1981). “Consolidation by vertical drains.”Geotechnique, 31(1),45–66.
Indraratna, B. (2009). “Recent advances in the application of vertical drainsand vacuum preloading in soft clay stabilization.” Austral. Geomechan.J., 45(2), 1–44.
Indraratna, B., Balasubramaniam, A., and Balachandran, S. (1992). “Per-formance of test embankment constructed to failure on soft clay.”J. Geotech. Eng., 118(1), 12–33.
Indraratna, B., and Redana, I. W. (1997). “Plane strain modelling of smeareffects associatedwith vertical drains.” J.Geotech. Eng., 123(5), 474–478.
Indraratna, B., and Redana, I. W. (1998). “Laboratory determination of smearzone due to vertical drain installation.” J. Geotech. Eng., 125(1), 96–99.
Kempfert, H. G. (2003). “Ground improvement methods with specialemphasis on column-type techniques.” Int. Workshop on Geotechnics ofSoft Soils–Theory and Practice, Taylor & Francis Group, New York,101–112.
Khan, A. P., Madhav, M. R., and Reddy, E. S. (2010). “Consolidation of thickclay layer by radialflow—Nonlinear theory.”Geotech.Eng., 2(2), 157–160.
Lo, S. R., Zhang, R., and Mak, J. (2010). “Geosynthetic-encased stonecolumns in soft clay: A numerical study.” Geotextiles Geomembranes,28(3), 292–302.
Lorenzo, G. A., and Bergado, D. T. (2003). “New consolidation equation forsoil-cement pile improved ground.” Can. Geotech. J., 40(2), 265–275.
Low, B. K., Tang, S. K., and Choa, V. (1994). “Arching in piledembankments.” J. Geotech. Eng., 120(11), 1917–1938.
Malarvizhi, S. N., and Ilamparuthi, K. (2008). “Numerical analysis of encap-sulated stone columns.” Proc., 12th Int. Conf. of IACMAG, Centre forInfrastructure Engineering and Safety, Sydney, Australia, 3719–3726.
JOURNAL OF GEOTECHNICAL AND GEOENVIRONMENTAL ENGINEERING © ASCE / MARCH 2013 / 393
J. Geotech. Geoenviron. Eng. 2013.139:377-394.
Dow
nloa
ded
from
asc
elib
rary
.org
by
UN
IVER
SITY
OF
WO
LLO
NG
ON
G o
n 04
/15/
13. C
opyr
ight
ASC
E. F
or p
erso
nal u
se o
nly;
all
right
s res
erve
d.
Mays, D. C. (2010). “Contrasting clogging in granular media filters, soils,and dead-end membranes.” J. Environ. Eng., 136(5), 475–480.
Mitchell, J. K. (1981). “Soil improvement—State of the art report.”Proc., 10th ICSMFE, Vol. 4, Balkema, Rotterdam, Netherlands,509–565.
Murugesan, S., and Rajagopal, K. (2010). “Studies on the behavior of singleand group of geosynthetic encased stone columns.” J. Geotech. Geo-environ. Eng., 36(1), 129–139.
Oh, E. Y. N., et al. (2007). “Behaviour of a highway embankment on stonecolumn improved estuarine clay.” Proc., 16th Southeast Asian Geo-technical Conf., Vol. 1, Southeast Asian Geotechnical Society,Bangkok, Thailand, 567–572.
Priebe, H. J. (1995). “The design of vibro replacement.” Ground Eng.,28(10), 31–37.
Raithel, M., Kirchner, A., Schade, C., and Leusink, E. (2005). “Foun-dation of constructions on very soft soils with geotextile encased
columns: State of the art,” Geo-Frontiers 2005, Vol. 130–142, ASCE,Reston, VA, 1867–1877.
Reddi, L. N., Ming, X., Hajra, M. G., and Lee, I. M. (2000). “Permeabilityreduction of soil filters due to physical clogging.” J. Geotech. Geo-environ. Eng., 126(3), 236–246.
Terzaghi, K. (1943). Theoretical soil mechanics, Wiley, New York.Umezaki, T., Ochiai, H., and Hayashi, S. (1993). “Undrained shear strength
of clay during consolidation.” Proc., 11th Southeast Asian GeotechnicalConf., Southeast Asian Geotechnical Society, Bangkok, Thailand, 269–274.
Walker, R., and Indraratna, B. (2006). “Vertical drain consolidation withparabolic distribution of permeability in smear zone.” J. Geotech.Geoenviron. Eng., 132(7), 937–941.
Wang,G. (2009). “Consolidation of soft soil foundations reinforced by stonecolumns under time dependent loading.” J. Geotech. Geoenviron. Eng.,135(12), 1922–1931.
394 / JOURNAL OF GEOTECHNICAL AND GEOENVIRONMENTAL ENGINEERING © ASCE / MARCH 2013
J. Geotech. Geoenviron. Eng. 2013.139:377-394.
Dow
nloa
ded
from
asc
elib
rary
.org
by
UN
IVER
SITY
OF
WO
LLO
NG
ON
G o
n 04
/15/
13. C
opyr
ight
ASC
E. F
or p
erso
nal u
se o
nly;
all
right
s res
erve
d.