Embed Size (px)
Citation preview
Numerical simulation of sheet metal formability tests
Ricardo Martinsa
aInstituto Superior Tecnico, UniversidadedeLisboa, Lisboa, [email protected]
Abstract
One of the challenges faced by the scientific and engineering manufacturing community is the prediction of frac-ture via computational procedures. The first studies of formability defined the beginning of localization as theForming Limit Curve (FLC), nonetheless as certain materials experienced fracture without necking and inherentambiguity of the necking stage, the formability limit has been readdressed with the development of a new limitsuch as the Fracture Forming Limit (FFL). In addition, recent developments have proposed new diagrams for therepresentation of these limits such as the triaxiality plane that is less or not sensitive to the strain path.
This thesis embraces the study of necking and fracture formability limits in the triaxiality plane. For that, ex-perimental results from the aluminium alloy AA1050−H111 obtained via tensile, Nakazima, hemispherical domeand bulge tests were compared with numerical simulations of the same tests. The simulations of sheet formingconsidered normal anisotropy and ductile damage criterion to determine the fracture instant.
The numerical results obtained were first validated via the force and displacement comparison with experimentalresults, then the analysis focused the prediction of the localization and fracture by the evolutions of the strainpaths in the triaxiality plane.
The compilation of the results from all the tests defined a region of necking rather than the single instant repre-sented by the FLC. This confirmed the ambiguity aforementioned for the FLC and the justified the preference forthe FFL.
Keywords: formability limits, necking, fracture, triaxiality, sheet metal forming, numerical simulation
1. Introduction
The determination of materials’ formability is a major concern for both industry and academia. In recent years,the development and application of new materials to sheet forming and the demand of thickness reduction fromthe project design, require a careful and time consuming characterization of materials’ properties and formabilitylimits.
The materials’ formability limits define the maximum level of deformation achievable in a forming operation withoutthe occurrence of necking or fracture [1]. The representation and use of these material data is subject of divergentopinions among researchers and manufacturing experts. For example, in industry project design claim the use ofthickness reduction on failure tracking while researchers prefer the use of forming limit diagrams.
This paper emphasises the use of numerical simulation to complement the experiments previously done to charac-terize the mechanical properties and formability limits of the aluminium alloy AA1050−H111. The tests consideredare tensile, Nakazima, hemispherical dome and bulge tests because cover the strain paths from the uniaxial de-formation to biaxial expansion [2]. Ductile fracture mechanisms were also explored to model fracture and theformability results are analysed in a diagram less or not sensitive to strain path variations [3, 4]: the triaxialityplane with the effective strain.
The analysis of the strains in the sheet plane, known as Forming Limit Diagram (FLD), is widely used since 1965when the experimental procedures for measuring the strains were proposed by Keeler and Goodwin [5, 6]. Their
1
research was interested in the locus of localized deformation where the strain path starts its transition to planestrain deformation. Nowadays the overall locus for necking in the FLD is commonly designated as the FormingLimit Curve (FLC). After localization the deformation proceeds under plane strain mode until the occurrence offracture. Embury [7] superimposed the fracture instant in the FLD obtaining the Fracture Forming Limit (FFL).As fracture is a material property and therefore process independent, Atkins [8] presents a theory of constantthickness in fracture which can be represented in the FLD by a straith line with slope ’-1’.
As the FLD was proven to be dependent on the strain path, recent developments led to the representation of theforming limits into a stress based diagram that being less or not sensitive to the deformation path [9], which makesit more appropriate for the identification of fracture. This diagram represented the effective strain (ε) as a function
of the triaxiality(σm
σ
), which is the ratio of hydrostatic stress (σm = (σ1 + σ2 + σ3) /3, where σ1, σ2 and σ3 are
the principal stresses) with the effective stress (σ defined in Equation 2).
Another reason this representation is its suitable implementation in numerical analysis. Several failure models arenow available in commercial software for metal forming [10] which were calibrated with experiments by a mixtureof bulk and sheet forming data. This generalization of the formulation for both bulk and sheet is questionable asthere is a lack of experimental validation with sheet forming results.
This paper complements this analysis by the comparison of experiments with numerical results. Section 2 intro-duces the material properties determined via experiments and the procedure to analyse the results in the triaxialityplane.
2. Theoretical work
2.1. Material properties
The mechanical characterization of the aluminium AA1050−H111 was performed via tensile testing. The flow rulethat characterizes its behaviour is defined by the Ludwik-Hollomon’s equation:
σ = 140ε0.04 (1)
The effective values for stress and strain can be calculated via an appropriate yield criterion for sheet forming.The Hill 48 was selected which considers normal anisotropy and plane stress assumption (σ3 = 0). Therefore theeffective stress and strain are defined by Equations 2 and 3, respectively.
σ =
√σ2
1 + σ22 −
2r(1 + r
)σ1σ2 (2)
ε =1 + r√(1 + 2r
)√ε2
1 + ε22 +
2r(1 + r
)ε1ε2 (3)
where ε1, ε2 and ε3 are the first, second and third in-plane principal strains [1].
The formability limits of the aluminium AA1050−H111 , presented in Figure 1(a) are composed by a bell-shapedcurve (FLC) that indicates the start of localization and the fracture line (FFL) which being a straight line can bedefined by Equation 4.
ε1 + 0.68ε2 = 1.34 (4)
2.2. Transformation into triaxiality
These formability limits can be transformed into the triaxiality plane with the effective strain via a simple coordinatetransformation. To start it is necessary to define the stress ratio (α) and the strain ratio (β) by Equations 5 and 6,respectively.
α =σ2
σ1(5)
2
β =ε2
ε1=
dε2
dε1(6)
These ratios are related with each other if one uses the Hill 48. With mathematical rearrangement the stress ratiocan be expressed as a function of the strain ratio and the anisotropic coefficient as follows [11]
α =(1 + r) · β + r(1 + r) + r · β
(7)
To evaluate the stress triaxiality directly from the measurements of strains is interesting to rearrange this ratio(σm
σ
)considering plane stress assumption (σ3 = 0) which is valid for sheet forming. Then combining the triaxiality withEquation 7 comes:
σm
σ=
√1 + 2r
3·
1 + β√1 +
2r1 + r
β + β2
(8)
The effective strain determination requires to calculate the third principal strain that can be found by the conditionof volume constancy (ε1 + ε2 + ε3 = 0) and finally replaced in Equation 3. These tools are sufficient to make the
coordinate transformation from the measured points (ε2, ε1) to(σm
σ, ε
).
Applying this methodology to the FLC results in the lower full line depicted in Figure 1(b). The evolution ofthis curve show low effective strain values for lower values of triaxiality and as the triaxiality increases necking isexpected to happen at higher values of effective strain. In a limit case, for biaxial deformation modes, the localizeddeformation can occur very close to fracture or in theory failure is possible without necking [12].
Minor True Strain
Maj
or
Tru
e S
trai
n
0.0
0.4
0.8
1.2
1.6
2.0
-0.6 -0.2 0.2 0.6 1.0
FFL
FLC
(a) Pricipal strain plane [13]
Eff
ecti
ve S
trai
n
Mean Stress / Effective Stress
0.0
0.5
1.0
1.5
2.0
2.5
0.2 0.3 0.4 0.5 0.6 0.7
BiaxialUniaxial Plane strain
FFL
FLC
=0.3
3s
m s
=0.5
5s
m s
=0.6
4s
m s
(b) Triaxiality plane
Tensile Test Circular Bulge Test Elliptical Bulge Test Nakazima Test Hemispherical Dome TestFigure 1: Forming limit diagram represented in two different coordinate systems. The markers represent necking and the solid markers referto failure by fracture
The theoretical prediction of constant thickness in fracture [8] allows a different procedure to transform the FFL
into the triaxiality plane, which requires to define the effective strain as a function of triaxiality(ε = f
(σm
σ
)). Com-
bining the volume constancy condition, the strain ratio (Equation 6) and the effective strain (Equation 3) withmathematical re-arrangement of the term gives the following result:
ε
ε1=
1 + r√
1 + 2r·
√1 +
2r1 + r
β + β2 (9)
3
Also the triaxiality (Equation 8) can be re-arranged as follows:√1 +
2r1 + r
β + β2 =
√1 + 2r
3·
1 + βσm
σ
(10)
Now, combining the Equations 9 and 10 results a function valid for the fracture limit as follows:
dε =K1σm
σ
, where K1 =1 + r
3· (ε1 + ε2) (11)
This function for the fracture limit (Equation 11) represents an hyperbole and the constant value K1 can be eval-uated for three different deformation modes available: uniaxial, plane strain and biaxial (see dashed grey lines inFigure 1(b)). These lines delineates the lower and upper boundary where fracture is likely to occur. However, theFFL has a slope different than the theoretical prediction (see Equation 4) and therefore for a better fitting to theexperiments, the deformation modes aforementioned were combined to define the FFL depicted in full line. Forthe triaxiality values corresponding to unixaial, plane strain and biaxial deformation the different points markedwith a pentagon (see Figure 1(b)) were selected to model the fracture line.
This transformation in terms of stress triaxiality can now be implemented to analyse the evolution of field variablesobtained from the numerical simulations.
2.3. Modelling conditions
The modelling assumptions for each formability tests are addressed with indication of tool components, blankcharacteristics and boundary conditions imposed to model the tests’ procedure. The tests understudy formedthree distinguish groups characterized by the tools used or procedure similarities.
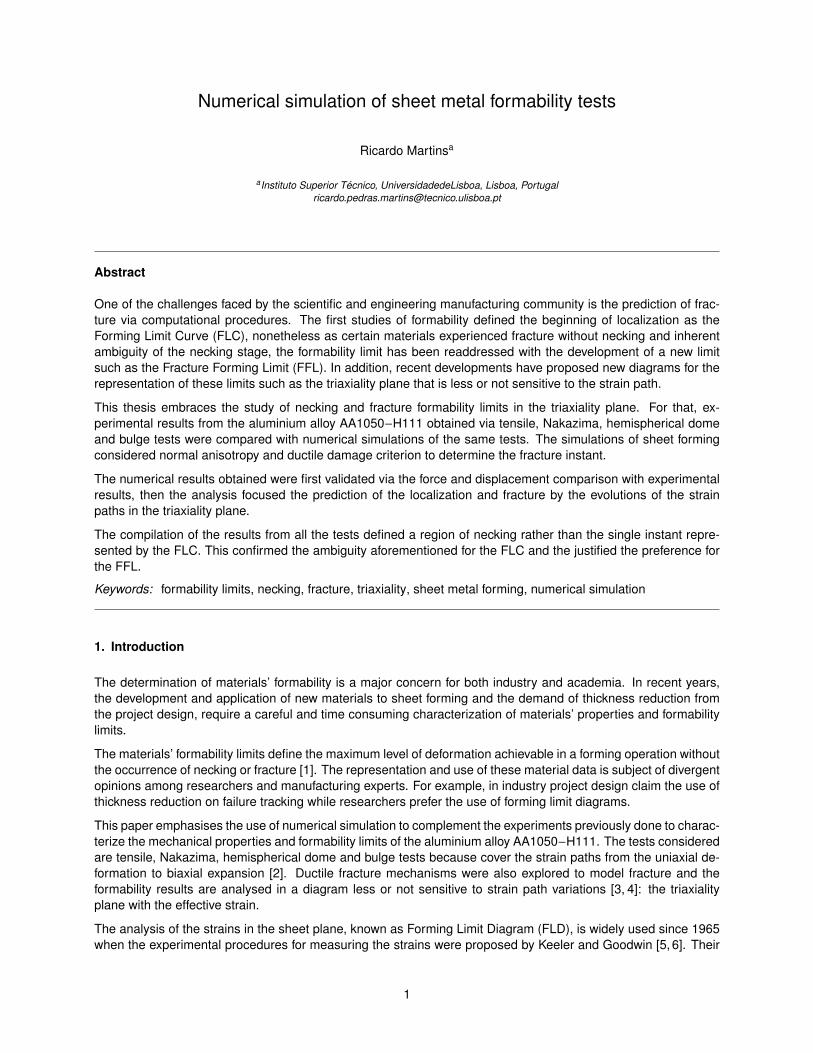
The tensile test procedure can be modelled with nodes motion, therefore there is no need to define extra tools.The specimen is represented in Figure 2 with the boundary conditions considered, namely fixed nodes in the leftgrip and velocity imposed in the right. After mesh convergence studies it was selected the blank with minimumelement length (Le) of 0.625 mm.
v
Figure 2: Boundary conditions applied to the tensile specimen. All the existent nodes inside each rectangle have the same boundary conditionsand the arrow indicates constant velocity on the right shoulder
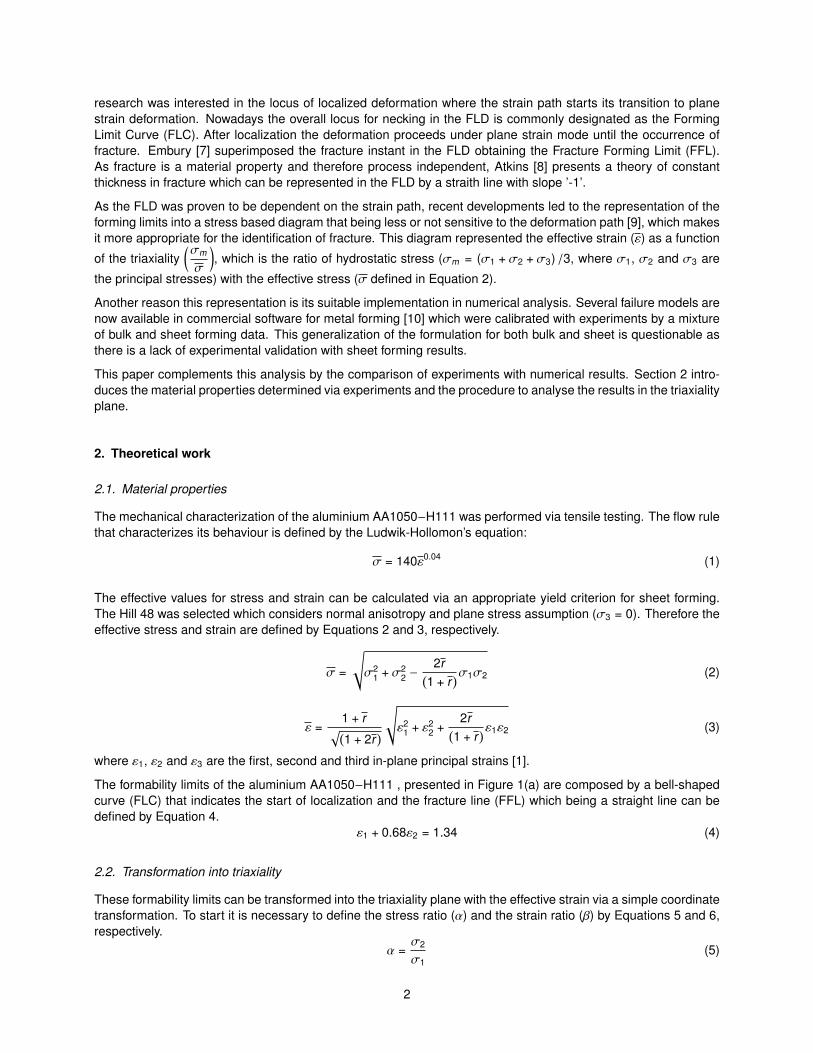
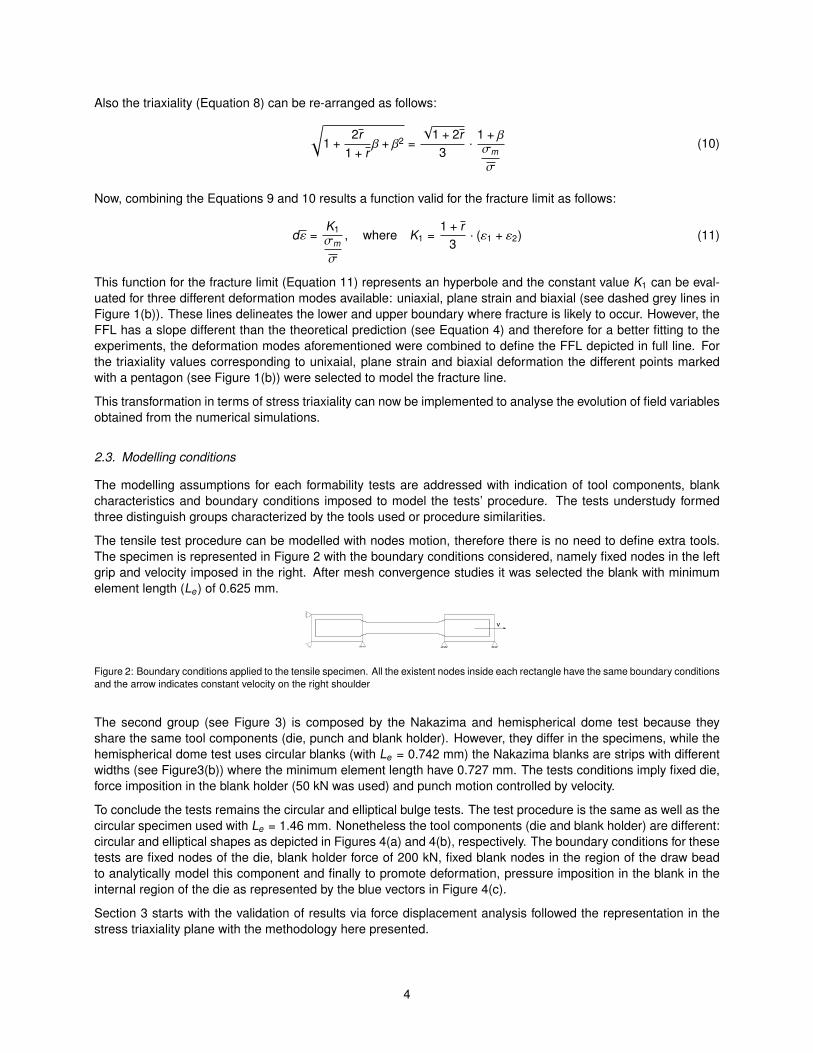
The second group (see Figure 3) is composed by the Nakazima and hemispherical dome test because theyshare the same tool components (die, punch and blank holder). However, they differ in the specimens, while thehemispherical dome test uses circular blanks (with Le = 0.742 mm) the Nakazima blanks are strips with differentwidths (see Figure3(b)) where the minimum element length have 0.727 mm. The tests conditions imply fixed die,force imposition in the blank holder (50 kN was used) and punch motion controlled by velocity.
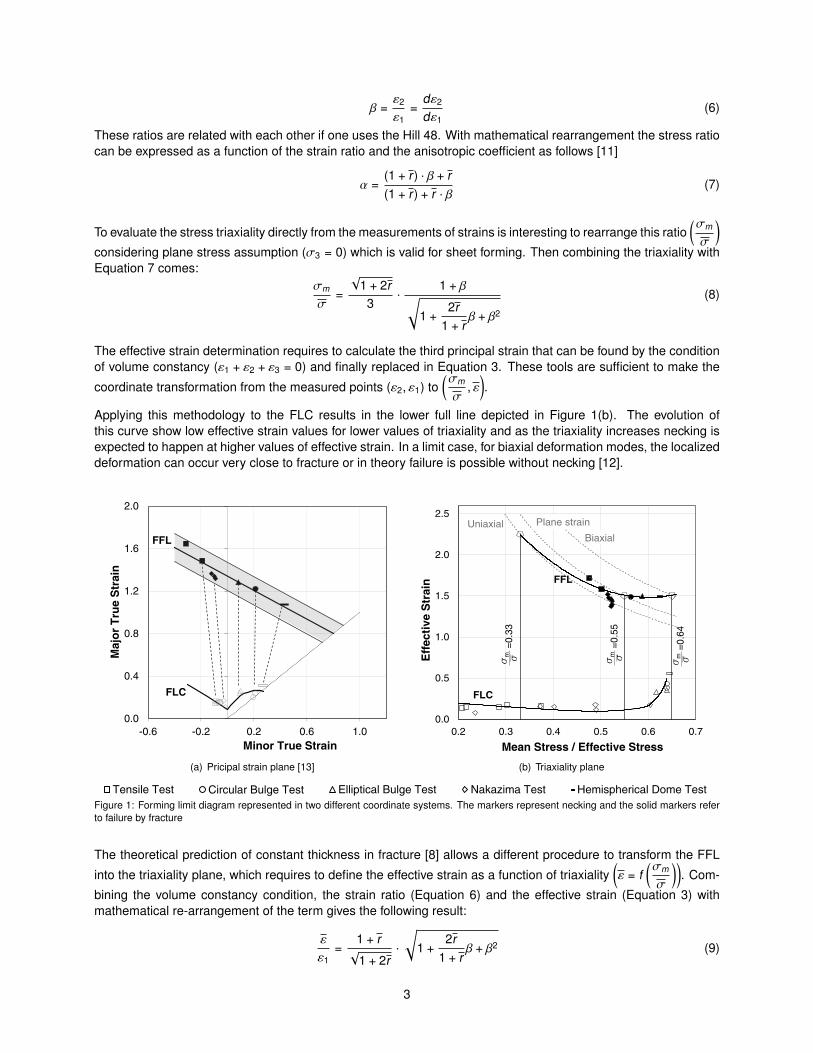
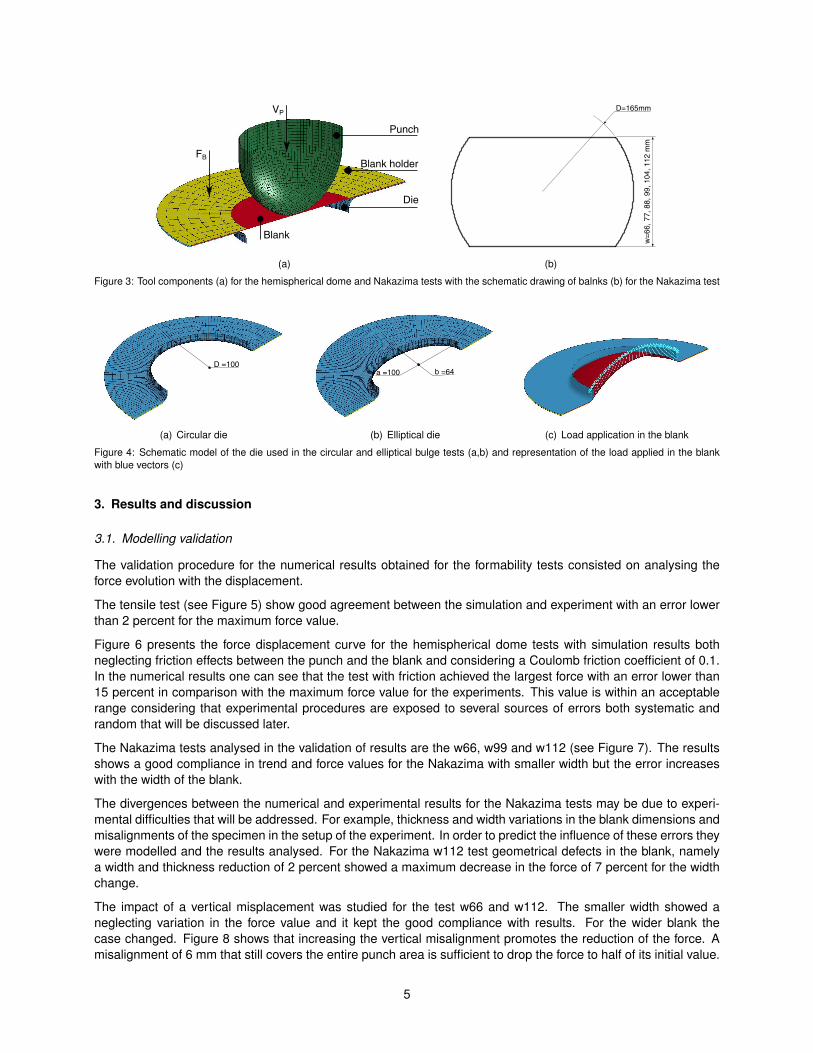
To conclude the tests remains the circular and elliptical bulge tests. The test procedure is the same as well as thecircular specimen used with Le = 1.46 mm. Nonetheless the tool components (die and blank holder) are different:circular and elliptical shapes as depicted in Figures 4(a) and 4(b), respectively. The boundary conditions for thesetests are fixed nodes of the die, blank holder force of 200 kN, fixed blank nodes in the region of the draw beadto analytically model this component and finally to promote deformation, pressure imposition in the blank in theinternal region of the die as represented by the blue vectors in Figure 4(c).
Section 3 starts with the validation of results via force displacement analysis followed the representation in thestress triaxiality plane with the methodology here presented.
4
FB
VP
Punch
Blank holder
Die
Blank
(a)
w=
66, 7
7, 8
8, 9
9, 1
04, 1
12 m
m
D=165mm
(b)
Figure 3: Tool components (a) for the hemispherical dome and Nakazima tests with the schematic drawing of balnks (b) for the Nakazima test
D =100
(a) Circular die
b =64a =100
(b) Elliptical die (c) Load application in the blank
Figure 4: Schematic model of the die used in the circular and elliptical bulge tests (a,b) and representation of the load applied in the blankwith blue vectors (c)
3. Results and discussion
3.1. Modelling validation
The validation procedure for the numerical results obtained for the formability tests consisted on analysing theforce evolution with the displacement.
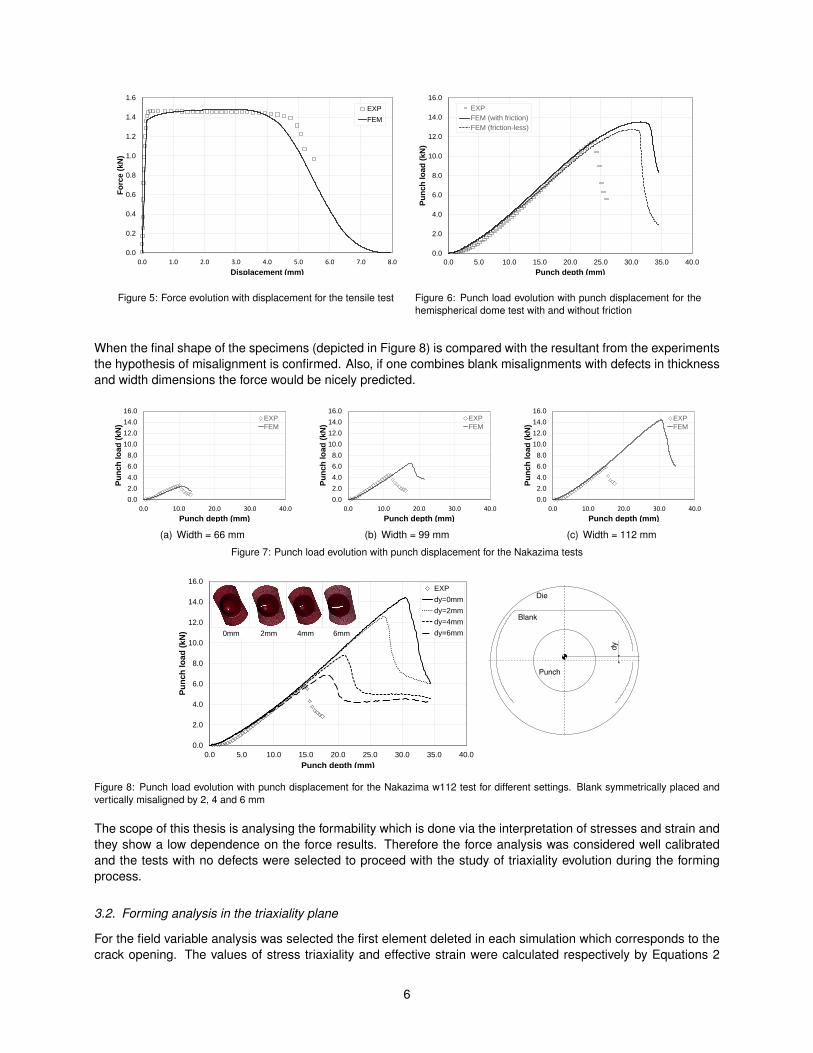
The tensile test (see Figure 5) show good agreement between the simulation and experiment with an error lowerthan 2 percent for the maximum force value.
Figure 6 presents the force displacement curve for the hemispherical dome tests with simulation results bothneglecting friction effects between the punch and the blank and considering a Coulomb friction coefficient of 0.1.In the numerical results one can see that the test with friction achieved the largest force with an error lower than15 percent in comparison with the maximum force value for the experiments. This value is within an acceptablerange considering that experimental procedures are exposed to several sources of errors both systematic andrandom that will be discussed later.
The Nakazima tests analysed in the validation of results are the w66, w99 and w112 (see Figure 7). The resultsshows a good compliance in trend and force values for the Nakazima with smaller width but the error increaseswith the width of the blank.
The divergences between the numerical and experimental results for the Nakazima tests may be due to experi-mental difficulties that will be addressed. For example, thickness and width variations in the blank dimensions andmisalignments of the specimen in the setup of the experiment. In order to predict the influence of these errors theywere modelled and the results analysed. For the Nakazima w112 test geometrical defects in the blank, namelya width and thickness reduction of 2 percent showed a maximum decrease in the force of 7 percent for the widthchange.
The impact of a vertical misplacement was studied for the test w66 and w112. The smaller width showed aneglecting variation in the force value and it kept the good compliance with results. For the wider blank thecase changed. Figure 8 shows that increasing the vertical misalignment promotes the reduction of the force. Amisalignment of 6 mm that still covers the entire punch area is sufficient to drop the force to half of its initial value.
5
0.0
0.2
0.4
0.6
0.8
1.0
1.2
1.4
1.6
0.0 1.0 2.0 3.0 4.0 5.0 6.0 7.0 8.0
Fo
rce (
kN
)
Displacement (mm)
EXP
FEM
Figure 5: Force evolution with displacement for the tensile test
0.0
2.0
4.0
6.0
8.0
10.0
12.0
14.0
16.0
0.0 5.0 10.0 15.0 20.0 25.0 30.0 35.0 40.0
Pu
nch
lo
ad
(kN
)
Punch depth (mm)
EXP
FEM (with friction)
FEM (friction-less)
Figure 6: Punch load evolution with punch displacement for thehemispherical dome test with and without friction
When the final shape of the specimens (depicted in Figure 8) is compared with the resultant from the experimentsthe hypothesis of misalignment is confirmed. Also, if one combines blank misalignments with defects in thicknessand width dimensions the force would be nicely predicted.
0.0
2.0
4.0
6.0
8.0
10.0
12.0
14.0
16.0
0.0 10.0 20.0 30.0 40.0
Pu
nch
lo
ad
(kN
)
Punch depth (mm)
EXP
FEM
(a) Width = 66 mm
0.0
2.0
4.0
6.0
8.0
10.0
12.0
14.0
16.0
0.0 10.0 20.0 30.0 40.0
Pu
nch
lo
ad
(kN
)
Punch depth (mm)
EXP
FEM
(b) Width = 99 mm
0.0
2.0
4.0
6.0
8.0
10.0
12.0
14.0
16.0
0.0 10.0 20.0 30.0 40.0
Pu
nch
lo
ad
(kN
)Punch depth (mm)
EXP
FEM
(c) Width = 112 mm
Figure 7: Punch load evolution with punch displacement for the Nakazima tests
0.0
2.0
4.0
6.0
8.0
10.0
12.0
14.0
16.0
0.0 5.0 10.0 15.0 20.0 25.0 30.0 35.0 40.0
Pu
nch
lo
ad
(k
N)
Punch depth (mm)
EXP
dy=0mm
dy=2mm
dy=4mm
dy=6mm6mm0mm 2mm 4mm
dy
Die
Blank
Punch
Figure 8: Punch load evolution with punch displacement for the Nakazima w112 test for different settings. Blank symmetrically placed andvertically misaligned by 2, 4 and 6 mm
The scope of this thesis is analysing the formability which is done via the interpretation of stresses and strain andthey show a low dependence on the force results. Therefore the force analysis was considered well calibratedand the tests with no defects were selected to proceed with the study of triaxiality evolution during the formingprocess.
3.2. Forming analysis in the triaxiality plane
For the field variable analysis was selected the first element deleted in each simulation which corresponds to thecrack opening. The values of stress triaxiality and effective strain were calculated respectively by Equations 2
6
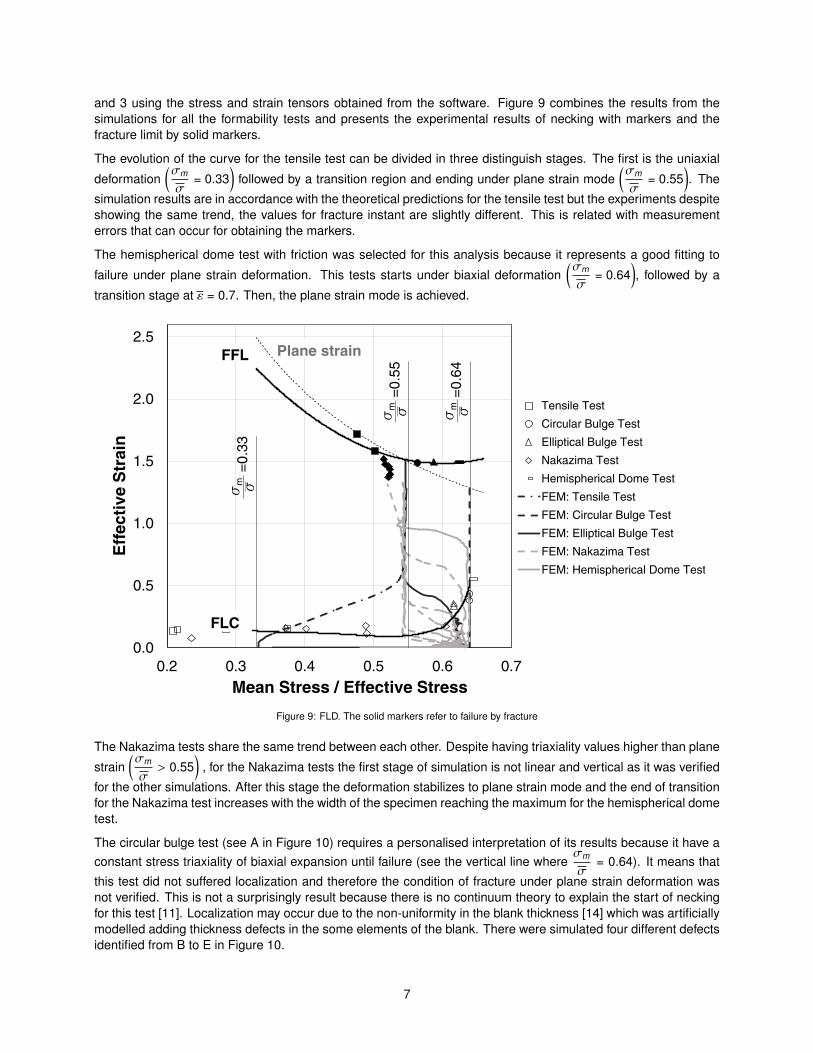
and 3 using the stress and strain tensors obtained from the software. Figure 9 combines the results from thesimulations for all the formability tests and presents the experimental results of necking with markers and thefracture limit by solid markers.
The evolution of the curve for the tensile test can be divided in three distinguish stages. The first is the uniaxial
deformation(σm
σ= 0.33
)followed by a transition region and ending under plane strain mode
(σm
σ= 0.55
). The
simulation results are in accordance with the theoretical predictions for the tensile test but the experiments despiteshowing the same trend, the values for fracture instant are slightly different. This is related with measurementerrors that can occur for obtaining the markers.
The hemispherical dome test with friction was selected for this analysis because it represents a good fitting to
failure under plane strain deformation. This tests starts under biaxial deformation(σm
σ= 0.64
), followed by a
transition stage at ε = 0.7. Then, the plane strain mode is achieved.
0.0
0.5
1.0
1.5
2.0
2.5
0.2 0.3 0.4 0.5 0.6 0.7
Eff
ecti
ve S
trai
n
Mean Stress / Effective Stress
TensileHTest
CircularHBulgeHTest
EllipticalHBulgeHTest
NakazimaHTest
HemisphericalHDomeHTest
FEM:HTensileHTest
FEM:HCircularHBulgeHTest
FEM:HEllipticalHBulgeHTest
FEM:HNakazimaHTest
FEM:HHemisphericalHDomeHTest
FFL
FLC
Plane strain
=0.
33s
m s
=0.
55s
m s
=0.
64s
m s
Figure 9: FLD. The solid markers refer to failure by fracture
The Nakazima tests share the same trend between each other. Despite having triaxiality values higher than plane
strain(σm
σ> 0.55
), for the Nakazima tests the first stage of simulation is not linear and vertical as it was verified
for the other simulations. After this stage the deformation stabilizes to plane strain mode and the end of transitionfor the Nakazima test increases with the width of the specimen reaching the maximum for the hemispherical dometest.
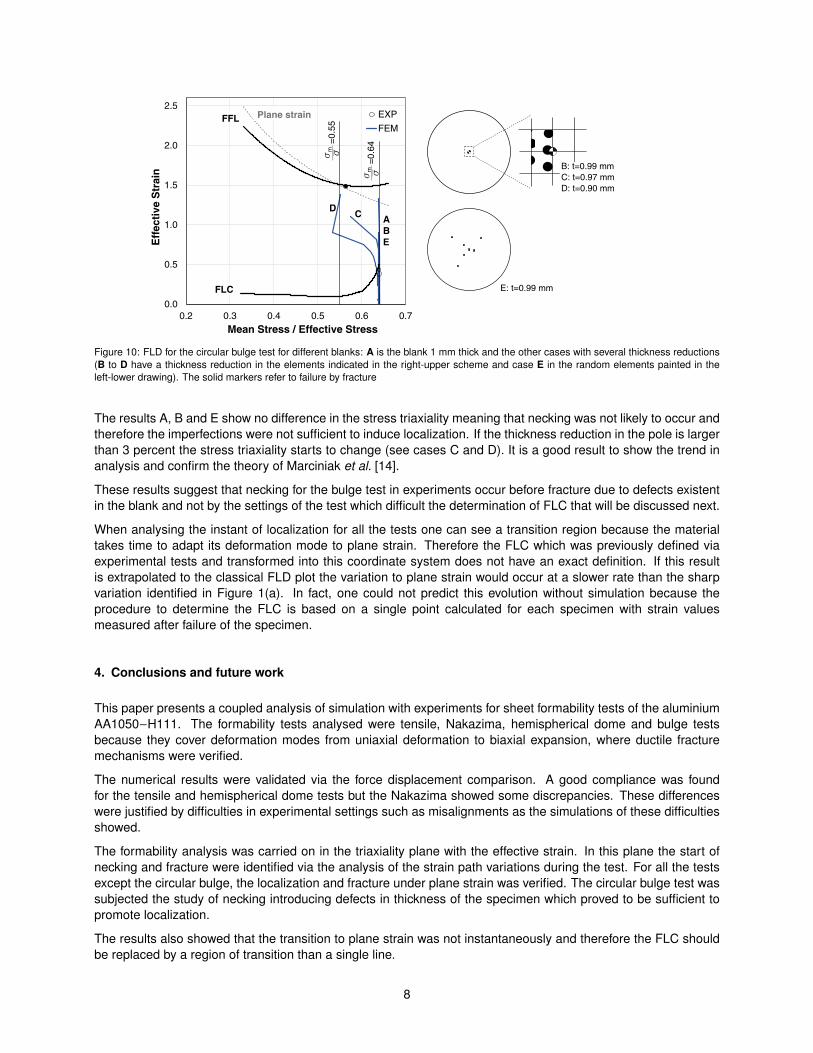
The circular bulge test (see A in Figure 10) requires a personalised interpretation of its results because it have aconstant stress triaxiality of biaxial expansion until failure (see the vertical line where
σm
σ= 0.64). It means that
this test did not suffered localization and therefore the condition of fracture under plane strain deformation wasnot verified. This is not a surprisingly result because there is no continuum theory to explain the start of neckingfor this test [11]. Localization may occur due to the non-uniformity in the blank thickness [14] which was artificiallymodelled adding thickness defects in the some elements of the blank. There were simulated four different defectsidentified from B to E in Figure 10.
7
0.0
0.5
1.0
1.5
2.0
2.5
0.2 0.3 0.4 0.5 0.6 0.7
Eff
ecti
ve S
trai
n
Mean Stress / Effective Stress
EXP
FEMFFL
FLC
Plane strain
ABE
DC
=0.
55s
m s
=0.
64s
m s
B: t=0.99 mmC: t=0.97 mmD: t=0.90 mm
E: t=0.99 mm
Figure 10: FLD for the circular bulge test for different blanks: A is the blank 1 mm thick and the other cases with several thickness reductions(B to D have a thickness reduction in the elements indicated in the right-upper scheme and case E in the random elements painted in theleft-lower drawing). The solid markers refer to failure by fracture
The results A, B and E show no difference in the stress triaxiality meaning that necking was not likely to occur andtherefore the imperfections were not sufficient to induce localization. If the thickness reduction in the pole is largerthan 3 percent the stress triaxiality starts to change (see cases C and D). It is a good result to show the trend inanalysis and confirm the theory of Marciniak et al. [14].
These results suggest that necking for the bulge test in experiments occur before fracture due to defects existentin the blank and not by the settings of the test which difficult the determination of FLC that will be discussed next.
When analysing the instant of localization for all the tests one can see a transition region because the materialtakes time to adapt its deformation mode to plane strain. Therefore the FLC which was previously defined viaexperimental tests and transformed into this coordinate system does not have an exact definition. If this resultis extrapolated to the classical FLD plot the variation to plane strain would occur at a slower rate than the sharpvariation identified in Figure 1(a). In fact, one could not predict this evolution without simulation because theprocedure to determine the FLC is based on a single point calculated for each specimen with strain valuesmeasured after failure of the specimen.
4. Conclusions and future work
This paper presents a coupled analysis of simulation with experiments for sheet formability tests of the aluminiumAA1050−H111. The formability tests analysed were tensile, Nakazima, hemispherical dome and bulge testsbecause they cover deformation modes from uniaxial deformation to biaxial expansion, where ductile fracturemechanisms were verified.
The numerical results were validated via the force displacement comparison. A good compliance was foundfor the tensile and hemispherical dome tests but the Nakazima showed some discrepancies. These differenceswere justified by difficulties in experimental settings such as misalignments as the simulations of these difficultiesshowed.
The formability analysis was carried on in the triaxiality plane with the effective strain. In this plane the start ofnecking and fracture were identified via the analysis of the strain path variations during the test. For all the testsexcept the circular bulge, the localization and fracture under plane strain was verified. The circular bulge test wassubjected the study of necking introducing defects in thickness of the specimen which proved to be sufficient topromote localization.
The results also showed that the transition to plane strain was not instantaneously and therefore the FLC shouldbe replaced by a region of transition than a single line.
8
The model used to find fracture, based on ductile damage, presents good agreement with the experimental pointsfor the range of triaxiality analysed.
This work embraced the study of the FFL which characterizes failure under mode I of fracture mechanics. Remainsto be developed the study of in-plane shear fracture (mode II) using the methodology used to transform the FFLpresented in this article, to the shear fracture forming limit (SFFL) [11].
The shear fracture can be achieved in experiments and numerically such as in-plane shear, in-plane torsion andrectangular stamping [15]. This would complete the triaxiality plane once lower values of triaxiality are achieved.
References
[1] Rodrigues, J. and Martins, P., Tecnologia mecanica: tecnologia da deformacao plastica Vol. 1, EscolarEditora, 2010.
[2] Martins, P., Montanari, L., Cristino, V., and Silva, M., Formability and simulative tests in modern sheet metalforming education, in Modern Mechanical Engineering, Materials Forming, Machining and Tribology, pages411–447, Springer Berlin Heidelberg, 2014.
[3] Kikuma, T. and Nakazima, K., Effects of deforming conditions and mechanical properties on the stretch-forming limits of steel sheets, in Iron and Steel Institute of Japan, 11, pages 827–831, 1971.
[4] Laukonis, J. and Ghosh, A., Metallurgical Transactions A 9 (1978) 1849.
[5] Keeler, S. P., Circular grid system - a valuable aid for evaluating sheet metal formability, Technical report,SAE Technical Paper, 1968.
[6] Goodwin, G. M., Application of strain analysis to sheet metal forming problems in the press shop, Technicalreport, SAE Technical Paper, 1968.
[7] Embury, J. D. and Duncan, J. L., Annual Review of Materials Science 11 (1981) 505.
[8] Atkins, A., Fracture Research in Retrospect, Balkema, Rotterdam (1997) 327.
[9] Bao, Y. and Wierzbicki, T., Journal of Engineering Materials and Technology 126 (2004) 314.
[10] Wierzbicki, T., Bao, Y., Lee, Y.-W., and Bai, Y., International Journal of Mechanical Sciences 47 (2005) 719.
[11] Martins, P., Bay, N., Tekkaya, A., and Atkins, A., International Journal of Mechanical Sciences 83 (2014) 112.
[12] Silva, M., Skjødt, M., Atkins, A., Bay, N., and Martins, P., The Journal of Strain Analysis for EngineeringDesign 43 (2008) 15.
[13] Teodora, A., Determinacao dos limites de enformabilidadede chapa metalica, Master’s thesis, InstitutoSuperior Tecnico, 2013.
[14] Marciniak, Z. and Kuczynski, K., International Journal of Mechanical Sciences 9 (1967) 609.
[15] Isik, K., Silva, M., Tekkaya, A., and Martins, P., Journal of Materials Processing Technology 214 (2014) 1557.
9