Embed Size (px)
Citation preview

www.elsevier.com/locate/tecto
Tectonophysics 382 (2004) 189–212
Numerical simulation of rifting in the northern Viking Graben:
the mutual effect of modelling parameters
W. Fjeldskaara,*, M. ter Voordeb, H. Johansenc, P. Christianssond,1,J.I. Faleided, S.A.P.L. Cloetinghb
aRF-Rogaland Research, Prof. O. Hanssens vei 15, N-4068 Stavanger, NorwaybFaculty of Earth Sciences, Vrije Universiteit, Amsterdam, The Netherlands
cVerico, Stavanger, NorwaydDepartment of Geology, University of Oslo, Oslo, Norway
Received 16 December 2002; accepted 23 January 2004
Abstract
Numerous basin modelling studies have been performed on the Viking Graben in the northern North Sea during the past
decades in order to understand the driving mechanisms for basin evolution and palaeo temperature estimations. In such
modelling, it is important to include lithospheric flexure. The values derived for the lithospheric strength by these studies vary
considerably (i.e. up to a factor of 30). In this study, which is based on new interpretation of a regional transect, we show that
both the estimated value of the effective elastic thickness and the derived b-profile are dependent on the assumed value of the
depth of necking. The use of models that implicitly set the level of necking at a depth of 0 km generally leads to an
underestimation of the lithospheric strength, and an overestimation of the thinning factors. In the northern Viking Graben, a
necking depth at intermediate crustal levels gives results comparable to the observations. Extension by faulting is modelled to
be a significant factor. In conclusion, rifting in the northern Viking Graben can be explained with various models of effective
elastic thicknesses (EET) varying from 1 km for a zero necking depth to the depth of the 450 jC isotherm for an intermediate
level of necking.
It is also shown that the development of the basin during the post-rift phase cannot be explained by pure shear/simple shear
extension. Two mechanisms are proposed here to explain the post-rift subsidence pattern, namely intra-plate stress and phase
boundary migration. The two extreme models for EET mentioned above (1 km for a zero necking depth to the depth of the 450
jC isotherm for an intermediate level of necking) give very different responses to compressional stress, the latter gives basically
no response for realistic intra-plate stress.
D 2004 Elsevier B.V. All rights reserved.
Keywords: Sedimentary basin; Geohistory; Rifting; Necking; Intra-plate stress; Phase boundary migration
0040-1951/$ - see front matter D 2004 Elsevier B.V. All rights reserved.
doi:10.1016/j.tecto.2004.01.002
* Corresponding author.
E-mail address: [email protected] (W. Fjeldskaar).1 Now at Svenska Petroleum, Stockholm, Sweden.
1. Introduction
The Viking Graben, a major Mesozoic rift basin in
the northern North Sea, has been extensively de-
scribed in the literature. Several studies have focused
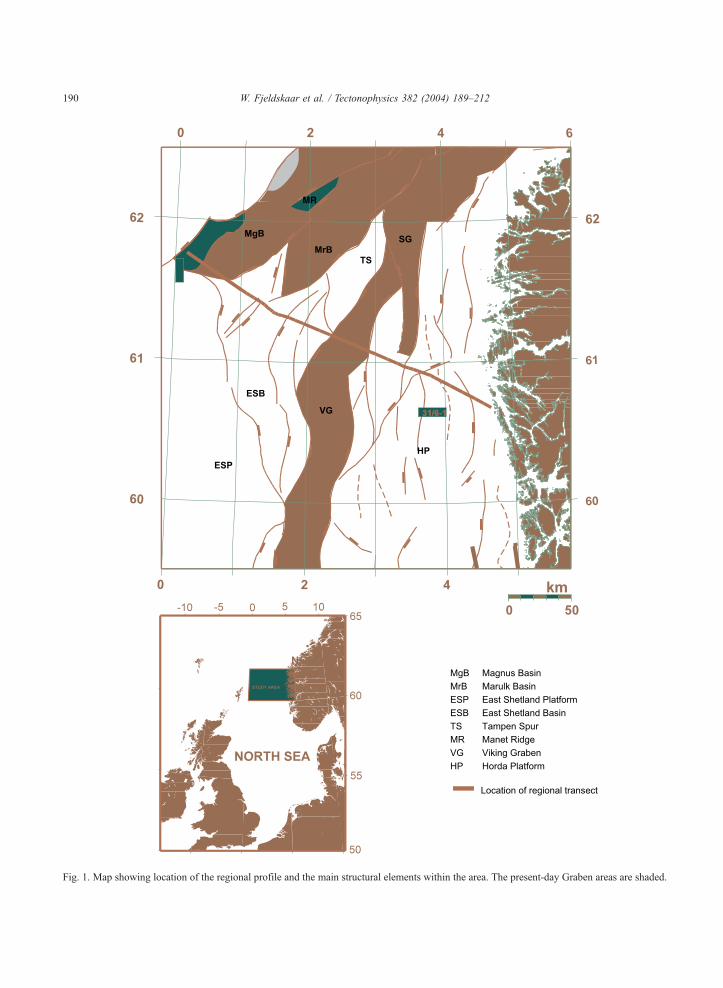
Fig. 1. Map showing location of the regional profile and the main structural elements within the area. The present-day Graben areas are shaded.
W. Fjeldskaar et al. / Tectonophysics 382 (2004) 189–212190

W. Fjeldskaar et al. / Tectonophysics 382 (2004) 189–212 191
on the deep structures in the area, as well as the crustal
and lithospheric configuration. During the last decade,
the NSDP-84 and other deep seismic reflection data
along the Norwegian coast have formed the basis for
several papers on the crustal structure and basin
evolution in the northern North Sea rift system (e.g.
Beach, 1986; Gibbs, 1987; Beach et al., 1987; Hurich
and Kristoffersen, 1988; Brun and Tron, 1993; Fær-
seth et al., 1995; Nøttvedt et al., 1995).
This study is based on re-interpretations of the
deep seismic lines NSDP84 (Figs. 1 and 2). These
lines have been post-stack reprocessed/redisplayed
and depth-converted (Christiansson et al., 2000; Kyrk-
jebø, 1999; Kyrkjebø et al., 2001; Gabrielsen et al.,
2001). The final new interpretation is supported by
high-quality conventional seismic lines, velocity data
from expanded spread profiles and a number of wells
in the area. Furthermore, the deep basin geometry is
constrained by gravity and magnetic data (Christian-
sson et al., 2000). Thus, the basement topography is
better mapped than has been possible previously,
when poor data quality, especially the low signal-to-
noise ratio has led to many imaginative and model-
driven interpretations (Christiansson et al., 2000). The
low signal-to-noise ratio in deeper seismic reflection
profiles was partly due to acquisition parameters and
partly to geophysical response to geology. The lower
crust in extensional basin areas was often void of both
continuous single reflectors and a well-defined Moho
reflection.
The combination of detailed stratigraphic informa-
tion and a relatively well known structure makes the
northern Viking Graben an ideal area for basin mod-
elling. For this reason, numerous numerical modelling
studies have already been carried out on this region
(e.g. Giltner, 1987; Marsden et al., 1990; Roberts et
al., 1993, 1995; Odinsen et al., 2000b; Ter Voorde et
al., 2000), which have further increased understanding
of the tectonic history of the Viking Graben. However,
these studies have generated new questions. Large
discrepancies exist between the modelling parameters
inferred using various models. One of the major
matters of debate is the strength of the lithosphere
as defined by effective elastic thickness (EET). The
derived value of EET ranges from 1.5 km (Roberts et
al., 1995) to 44 km (Odinsen et al., 2000b). As
pointed out by Ter Voorde et al. (2000), this discrep-
ancy might be associated with the assumption of a
‘coupled’ versus a ‘decoupled’ lithosphere rheology,
the latter of which is characterized by a very weak and
ductile lower crust. Another, perhaps more obvious
explanation is the mutual dependence of various
modelling parameters. It is also a potential danger
that the modelling results reflect the implied assump-
tions and boundary conditions, more than the geolog-
ical reality. It is thus necessary to model the various
processes by using the same system throughout the
modelling.
The purpose of this study is to get a better
understanding of the basin evolution of the northern
Viking Graben by using the most recent seismic
interpretation and available well data, and by model-
ling the most significant basin processes. The problem
of mutual dependence of various modelling parame-
ters will be handled, which include a thorough study
of the basin subsidence by compaction, simple shear/
pure shear displacements, sea level changes and
isostatic movements. We will, however, focus espe-
cially on the influence of the choice of the necking
depth on the calculated EET.
The level of necking is the level around which
crustal thinning takes place, i.e. the level that remains
horizontal in the absence of isostatic forces (Braun and
Beaumont, 1989; Kooi, 1991; Kooi et al., 1992). In the
classic McKenzie (1978) model for extensional basins,
this level is implicitly set at a depth of 0 km, but has no
importance due to the local isostatic character of the
model. We will show that the extension of this
assumption to regional isostatic models leads to an
underestimation of the lithospheric strength.
The post-rift subsidence history of the Viking
Graben seems to be rather complicated, as reported
by Gabrielsen et al. (2001). The driving mechanisms
are not known. We have subsequently looked at some
possible mechanisms for the observed subsidence, the
effect of a possible compressional force and phase
boundary migration.
2. Tectonic framework
The North Sea rift is an approximately 150–200-
km-wide zone of extended crust that separates the
East Shetland Platform in the west from the Horda
Platform in the east (Fig. 1). Structures within this
area are characterized by large rotated fault blocks

W. Fjeldskaar et al. / Tectonophysics 382 (2004) 189–212192
with sedimentary basins in asymmetric half-grabens
associated with extension and thinning of the crust, as
observed in the regional crustal transect (Fig. 2).
The failed rift system, post-dating the Caledonian
orogenic extensional collapse, was affected by two
major lithospheric extension events in Permo-Triassic
and Mid-Jurassic to earliest Cretaceous times, respec-
tively. Each rift phase was followed by a thermal
cooling stage, with subsequent thermal subsidence in
the basin areas (Ziegler, 1982; Giltner, 1987; Badley
et al., 1988; Gabrielsen et al., 1986; Gabrielsen et al.,
1990). Although the North Sea basin can be consid-
ered in broad terms as a series of elongated, linked
half-grabens assumed to have been formed by more or
less orthogonal E–W extension (Badley et al., 1988;
Bartholomew et al., 1993), the inherited basement
structure clearly influenced the geometry of most of
the Permian–Mesozoic basins and their faulted mar-
gins (Færseth, 1996).
The present crustal thickness of western Norway is
estimated to be about 35 km from seismic refraction
and reflection data (Christiansson et al., 2000). Odin-
sen et al. (2000a) suggest that the crystalline basement
Fig. 2. Transect 1, the interpreted depth-converted section used in the m
Table 1.
has thinned to 11–12 km beneath the Viking Graben,
based on observations from deep seismic reflection
data.
Syn-rift geometries (Ravnas et al., 2000) are ob-
served in units older than early Triassic in the Nor-
wegian well 31/6-1. Faulting continued in the
Øygarden Fault Zone throughout much of Triassic
times. Further west, syn-rift geometries predate Early
Triassic (in well 31/6-1; cf. Fig. 1). Syn-rift sedimen-
tary rocks with a thickness of up to 3–4 km, infill the
basement topography within the half-grabens on the
Horda Platform. The transition from syn-rift to post-
rift configuration was strongly diachronos (Gabrielsen
et al., 2001). The post-rift Cretaceous development of
the northern North Sea is discussed in detail by
Gabrielsen et al. (2001).
The presence of Paleozoic sedimentary rocks in the
northern North Sea has been discussed by Beach et al.
(1987) and more recently by Brun and Tron (1993),
and Platt (1995). Brun and Tron (1993) identified
Permo-Triassic basins beneath the Horda Platform,
overlying Caledonian metamorphic rocks, which are
in accordance with our observations of Late Paleozoic
odelling. Input parameters for the different sequences are given in

W. Fjeldskaar et al. / Tectonophysics 382 (2004) 189–212 193
faulting in the Horda platform area. Seismic data
display Triassic and older sediments with increasing
throw with depth, which show that this area was
tectonically active in the early rift phase (Roberts et
al., 1995; Odinsen et al., 2000b).
High-quality seismic reflection data constrained by
gravity and magnetic modelling show the presence of
3–4 km of Late Paleozoic rocks in the half-grabens on
the Horda Platform (Christiansson et al., 2000). The
north–south trending structures, which were domi-
nant during the early rift phase, were inherited from
earlier deformation of Precambrian basement (Færseth
et al., 1995; Færseth, 1996).
2.1. Stretching events
A Permo-Triassic rift event has been suggested by
Lervik et al. (1989), Steel (1993) and Færseth et al.
(1995). This is further supported by the dating of
Permian dykes in the SW Norwegian coastal area
(Færseth, 1978; Furnes et al., 1982) and also by
paleomagnetic dating of low-angle, reactivated exten-
sional faults of the Nordfjord-Sogn detachment (Tors-
vik et al., 1992). The Permo-Triassic rift event was
followed by a period of post-rift thermal cooling in
Early to Mid Triassic time (Steel and Ryseth, 1990).
Extension in the Jurassic resulted in a NE–SW
stepping rift axis with renewed generation of large
tilted fault-blocks which represents the main hydro-
carbon-trapping style in the northern North Sea (Gabri-
elsen et al., 1995). This second rift phase affected the
North Sea basin from late Middle Jurassic to earliest
Cretaceous. Large normal faults generated during the
Jurassic rifting are, when traced at depth into base-
ment, often rooted in older structures (Færseth et al.,
1995). These basement faults seem to be reactivated
during the two main regional rift phases. However, the
early post-Caledonian rift confined the sub-basins of
Late Paleozoic age and covered a wider area than the
narrow Mid-Jurassic to earliest Cretaceous rift event.
3. Modelling
The aim of our modelling is two-fold: (1) recon-
struct the basin evolution in a realistic way, (2)
investigate the driving mechanisms for the basin
evolution. These tasks are both covered by the
BMTk (Tectonic Modelling of Basins; cf. Lander
et al., 1994) system. This system is able to simulate:
(a) subsidence/uplift by sediment deposition, erosion
and compaction;
(b) structural deformation by vertical simple shear;
(c) the isostatic response to sediment and water
loading, erosion and fault movements;
(d) the tectonic response to lithospheric thinning;
(e) the effect of a compressional force.
Simulation of Process a and b generates a recon-
struction of the basin geometry through time. Process
(a) is carried out by a decompaction technique in
which the layers are removed one-by-one and correc-
tions are made for the present-day compacted thick-
nesses. The decompaction technique is combined with
fault-restoration (b), giving a number of 2D ‘snap-
shots’ of the basin development.
Important input data defining the reconstructed
geological section include the following.
(1) Porosity–depth functions affect our modelling
results in two ways: (a) they affect reconstructed
thicknesses which in turn affect the reconstructed
geometry of the cross-section, (b) they affect iso-
static subsidence simulations because they are
linked to the modelled sedimentary load through
time.
(2) Palaeo-water depths influence model results in
three ways: (a) they affect the geometrical
reconstruction of the cross-section, (b) they affect
the modelled isostasy resulting from the load of
water, and (c) they affect the ‘‘observed’’ tectonic
subsidence associated with rifting events.
(3) Erosion influences model results in two important
ways: (a) geometrical reconstructions of pre-
erosional ‘snapshots’ depend on the thickness
and lithological composition of the eroded sec-
tion, and (b) reconstructed and predicted present-
day porosity values are dependent on the timing
and amount of erosion. These consequences in
turn, affect the modelled distribution of porosity,
isostatic subsidence and tectonic response.
In addition, the density of the rock constituents
must be defined for the isostatic subsidence calcula-
tions in order to calculate the total load of sediments.

W. Fjeldskaar et al. / Tectonophysics 382 (2004) 189–212194
Also, the strength of the lithosphere is expressed in
terms of an effective elastic thickness (EET).
3.1. Geohistory reconstruction
To reconstruct the geometry of the basin through
time, the cross-section (showing structural and strati-
graphic components) is restored by stripping off
layers, decompacting the layers underneath and re-
storing the faults. The structural restoration is con-
ducted using simple vertical shear (Gibbs, 1983) for
the normal fault segments.
The decompaction is done according to porosity/
depth trends for each defined lithology. These are
typically given as exponential functions of the form:
/ ¼ /oexpð�czÞwhere / is porosity (fraction), /o is the surface
porosity (fraction), c is a constant in km� 1, and z is
Table 1
Sequences and lithology with age, porosity–depth trends (Sclater and Chr
matrix density
Sequence Age (Ma) Lithology
css-10 0–1 70%sh–30%ss
css-8 1–5 70%sh–30%ss
css-5 5–25 Sand
css-4.a 25–32 90%sh–10%ss
css-4.b 25–32 70%sh–30%ss
css-4.c 25–32 40%sh–60%ss
css-3.a 32–36 90%sh–10%ss
css-3.b 32–36 60%sh–40%ss
css-3.c 32–36 20%sh–80%ss
css–2.a 36–57 90%sh–10%ss
css-2.b 36–57 80%sh–20%ss
css-2.c 36–57 70%sh–30%ss
css-1.a 57–66 90%sh–10%ss
css-1.b 57–66 70%sh–30%ss
css-1.c 57–66 80%sh–20%ss
Cretaceous 66–140 Shale
Upper Jurassic 140–164 Shale
Brent Ss 164–187 Sandstone
Dunlin shales 187–200 Includes some sand
Statfjord Ss 200–212 Sandstone
Lunde 212–235 50%sh–50%ss
Lomvi 212–235a 50%sh–50%ss
Teist 235–243 50%sh–50%ss
Late Paleozoic 243–300 80%sh–20%ss
The css-sequences refer to the Cenozoic seismic sequences of Jordt et al.a Only deposited in the lower part of the time interval.
the depth in km (e.g. Sclater and Christie, 1980;
Bethke, 1985).
The restoration method is called vertical shear
because the bars remain vertical throughout the fault
restoration process (Gibbs, 1983). Our implementa-
tion of vertical shear ensures that there is no overlap
or gaps in the geologic section that could cause errors
in the temperature and maturation simulations.
3.1.1. Model input
The input geological section (Transect 1 of Chris-
tiansson et al., 2000) is shown in Fig. 2.
Lithology properties are based on analogs from the
Norwegian shelf. Each lithofacies type and its asso-
ciated properties are listed in Table 1. The lithofacies
distribution is partly based on published data (Bergs-
ager, 1985; Lervik et al., 1989; Petterson et al., 1990;
Rundberg, 1991; Olaussen et al., 1992), and partly on
unpublished industry data.
istie, 1980, /o: surface porosity, c: exponential decay constant) and
/o c Matrix density
(kg/m3)
0.59 0.44 2710
0.59 0.44 2710
0.49 0.27 2690
0.62 0.49 2720
0.59 0.44 2710
0.55 0.37 2700
0.62 0.49 2720
0.57 0.41 2710
0.52 0.32 2690
0.62 0.49 2720
0.60 0.46 2710
0.59 0.44 2710
0.62 0.49 2720
0.59 0.44 2710
0.60 0.46 2710
0.62 0.50 2720
0.62 0.50 2720
0.49 0.27 2690
0.58 0.43 2720
0.49 0.27 2690
0.56 0.39 2700
0.56 0.39 2700
0.56 0.39 2700
0.60 0.46 2710
(1995).

W. Fjeldskaar et al. / Tectonophysics 382 (2004) 189–212 195
Surfaces of non-deposition are represented in the
model where timelines have two or more depositional
ages attached to them. Notable non-deposition in the
modelled cross-section is associated with Cretaceous
surfaces that onlap onto the Base Cretaceous on the
Horda Platform (southeast), on the west side of
Tampen Spur and also in the western part of the East
Shetland Basin. Onlap also occurs west of the Magnus
Basin where timelines ranging from 57 through 200
Ma (Table 1) onlap onto basement.
A thorough study of the palaeo bathymetry has
been undertaken by Kyrkjebø et al. (2001). This
study, which is based on micropalaeontological data
combined with structural restoration, contains careful
analysis of uncertainty. Representative curves of the
input palaeo-water depths through time for the cross-
section are shown in Fig. 3.
Four erosional periods were defined in the mod-
elled cross-section, none of them of significance for
the overall subsidence pattern:
1. A Plio-Pleistocene erosion event in the east, with
removal of up to 800 m of section close to the
Norwegian coast;
2. A Mid-Cretaceous period related to the uplift of a
fault block in the Tampen Spur;
3. An Early Cretaceous period related to the uplift of
a fault block in the Tampen Spur;
Fig. 3. Palaeo-water depth development for selecte
4. An Early Cretaceous period to the east and west of
the Magnus Basin. This erosional phase is rather
poorly defined.
The information above, together with porosity–
depth functions for 24 lithology types (Table 1), was
the basis for reconstruction of the evolution of the
Viking Graben cross-section. The reconstructed geo-
history consists of 18 ‘snapshots’ of the geologic
history, of which 3 are shown n Fig. 4 (Base Triassic,
Base Cretaceous and Base Tertiary).
3.2. Process modelling
The geological history of the Viking Graben, as
generated in the previous section, is now the basis for
an analysis of the driving mechanisms for the basin’s
evolution. Subsidence analysis provides the basis for
understanding the controls on the depositional, ero-
sional, and structural evolution of the area. BMTkprovides forward models of both isostatic and tectonic
subsidence that can be used to generate overall
subsidence models for the cross-section.
The isostatic subsidence results from the load of
the sediments and seawater through time and is
associated with deposition, erosion, and faulting. It
is important to make isostatic subsidence models as
accurate as possible because the residual subsidence
d positions along the modelled cross-section.
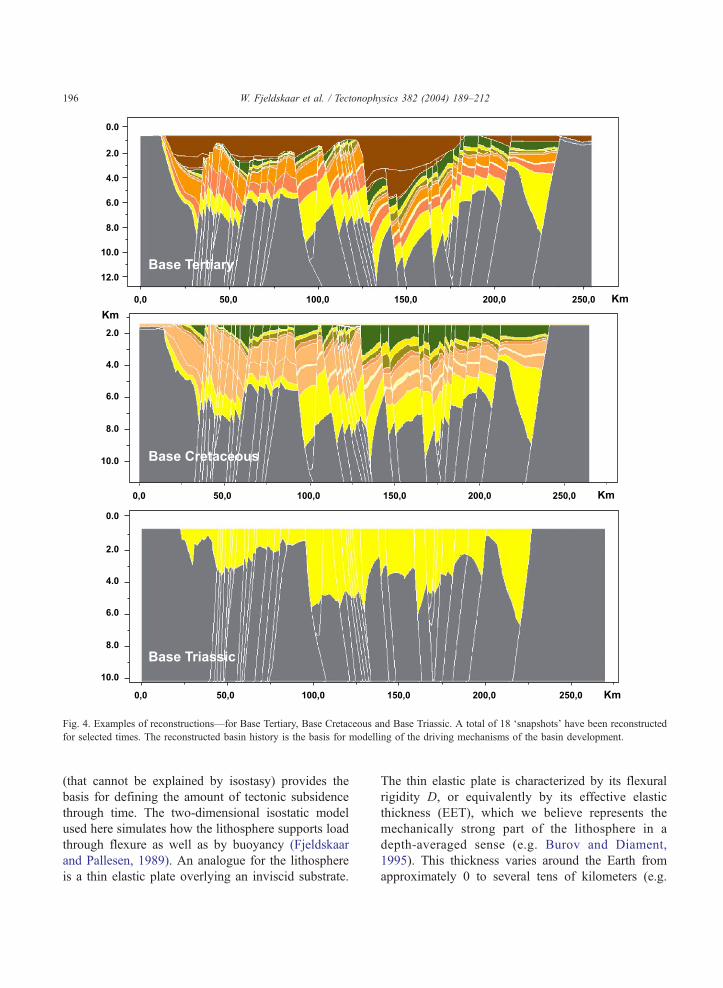
Fig. 4. Examples of reconstructions—for Base Tertiary, Base Cretaceous and Base Triassic. A total of 18 ‘snapshots’ have been reconstructed
for selected times. The reconstructed basin history is the basis for modelling of the driving mechanisms of the basin development.
W. Fjeldskaar et al. / Tectonophysics 382 (2004) 189–212196
(that cannot be explained by isostasy) provides the
basis for defining the amount of tectonic subsidence
through time. The two-dimensional isostatic model
used here simulates how the lithosphere supports load
through flexure as well as by buoyancy (Fjeldskaar
and Pallesen, 1989). An analogue for the lithosphere
is a thin elastic plate overlying an inviscid substrate.
The thin elastic plate is characterized by its flexural
rigidity D, or equivalently by its effective elastic
thickness (EET), which we believe represents the
mechanically strong part of the lithosphere in a
depth-averaged sense (e.g. Burov and Diament,
1995). This thickness varies around the Earth from
approximately 0 to several tens of kilometers (e.g.

W. Fjeldskaar et al. / Tectonophysics 382 (2004) 189–212 197
Walcott, 1970; Watts et al., 1982; Cloetingh and
Burov, 1996). The variation in elastic strength is
probably mainly caused by variations in heatflow
and age of the load (visco-elastic properties).
Studies of post-glacial uplift along the western
coast of Norway indicate EET of less than 50 km,
probably less than 20 km (Fjeldskaar, 1997). Thus,
the EET in the Viking Graben is most probably less
than 20 km. However, the present day value does
not necessarily correspond to Mesozoic or Paleozo-
ic times (e.g. Reemst and Cloetingh, 2000). Firstly,
changes in heatflow through time may have affect-
ed the elastic properties of the lithosphere. Second-
ly, the lithosphere may be visco-elastic, and thus,
the EET might depend on the age of the load
(Watts et al., 1982; Fjeldskaar and Pallesen,
1989). In the subsidence calculations in this study,
various values for the lithospheric strength have
been tested.
Finally, the density value used for the solid com-
ponent of shale-rich lithologies in all models is 2720
kg/m3, while 2690 kg/m3 has been used for sandstone-
rich lithologies (Table 1). Pores are assumed to have
water density. Water density is also used for calculat-
ing the load of seawater on the lithosphere based on
palaeo-water depths defined above. Uncertainties in
the density input parameters have little effect on the
modelled isostatic subsidence.
The tectonic subsidence is a quantification of the
effects of crustal and sub-crustal thinning, i.e. the
subsidence a basin would undergo if it was not
loaded with sediments. BMTk’s forward model for
the theoretical tectonic subsidence is a two-dimen-
sional non-uniform extensional necking model, im-
plying that the crustal thinning and the lithosphere
heating do not necessarily have a one-to-one rela-
tionship (Royden and Keen, 1980). In this study,
following area conservation, the crustal and sub-
crustal stretching is always kept the same. Jarvis
and McKenzie (1980) conclude that, for most basins
a model assuming instantaneous extension gives
reasonably accurate results of subsidence and heat
flow compared to a model with finite extension rates,
provided the duration of stretching is less than 20–
30 Ma. Accordingly, we assume instantaneous rift-
ing—which is a valid simplification when trying to
determine cumulative total crustal thinning factors in
the North Sea. The total subsidence after stretching
is only a function of the original crustal thickness,
the amount of stretching b, and the lithospheric
strength.
The forward subsidence simulations are con-
strained to match the subsidence history generated
from the geohistory reconstruction discussed above.
4. Depth of necking
The necking depth is defined as the level within the
crust that remains horizontal during thinning in the
absence of isostatic forces (Braun and Beaumont,
1989; Weissel and Karner, 1989; Kooi, 1991; Kooi
et al., 1992). This level determines the ratio between
thinning of the upper crust, where crustal material is
replaced by sediments and/or water and/or air, with
generally low densities, and thinning of the lower
lithosphere, where crustal material is replaced by
dense mantle material. In kinematic models not spe-
cifically defining the necking depth, it is mostly
implicitly set to a depth of 0 km (e.g. McKenzie,
1978), and crustal thinning occurs by uplift of the
Moho followed by an (local or regional) isostatic
response. For larger necking depths, thinning takes
place not only by uplift of the Moho but also by
subsidence of the surface. This has a major effect on
the load acting on the lithosphere and therefore on the
resulting state of flexure. It should be noted, however,
that the necking depth only has influence for a
lithosphere with finite flexural rigidity. In the case
of Airy-isostatic compensation, for which McKenzie
(1978) developed his model, it is an insignificant
parameter.
5. The depth of necking and EET: results from
synthetic modelling
In most numerical models, the necking depth is
implicitly set at a constant value. In pure shear
McKenzie-type models, this value is 0 km, in models
including faults, it is effectively the level at which
faults sole out. The effect that a change in this value
would have is generally not considered. However, the
choice of the necking depth is of major importance for
other parameters derived from the modelling (see also
Kooi et al., 1992). In order to demonstrate this, several
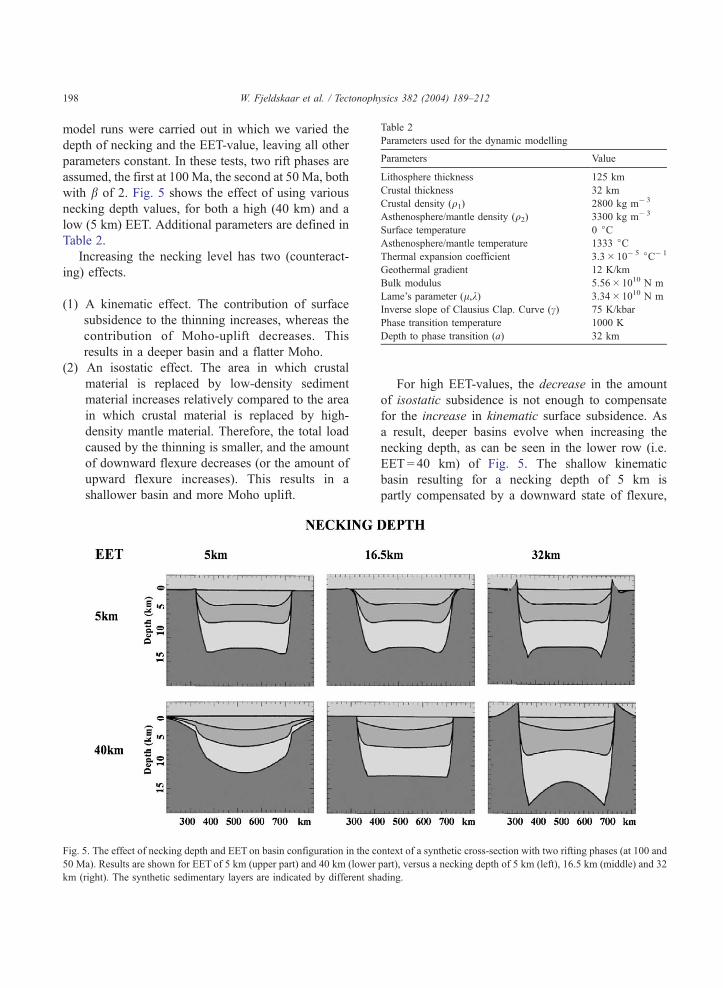
Table 2
Parameters used for the dynamic modelling
Parameters Value
Lithosphere thickness 125 km
Crustal thickness 32 km
Crustal density (q1) 2800 kg m� 3
Asthenosphere/mantle density (q2) 3300 kg m� 3
Surface temperature 0 jCAsthenosphere/mantle temperature 1333 jCThermal expansion coefficient 3.3� 10� 5 jC� 1
Geothermal gradient 12 K/km
Bulk modulus 5.56� 1010 N m
Lame’s parameter (l,k) 3.34� 1010 N m
Inverse slope of Clausius Clap. Curve (c) 75 K/kbar
Phase transition temperature 1000 K
Depth to phase transition (a) 32 km
W. Fjeldskaar et al. / Tectonophysics 382 (2004) 189–212198
model runs were carried out in which we varied the
depth of necking and the EET-value, leaving all other
parameters constant. In these tests, two rift phases are
assumed, the first at 100 Ma, the second at 50 Ma, both
with b of 2. Fig. 5 shows the effect of using various
necking depth values, for both a high (40 km) and a
low (5 km) EET. Additional parameters are defined in
Table 2.
Increasing the necking level has two (counteract-
ing) effects.
(1) A kinematic effect. The contribution of surface
subsidence to the thinning increases, whereas the
contribution of Moho-uplift decreases. This
results in a deeper basin and a flatter Moho.
(2) An isostatic effect. The area in which crustal
material is replaced by low-density sediment
material increases relatively compared to the area
in which crustal material is replaced by high-
density mantle material. Therefore, the total load
caused by the thinning is smaller, and the amount
of downward flexure decreases (or the amount of
upward flexure increases). This results in a
shallower basin and more Moho uplift.
Fig. 5. The effect of necking depth and EET on basin configuration in the c
50 Ma). Results are shown for EET of 5 km (upper part) and 40 km (lower
km (right). The synthetic sedimentary layers are indicated by different sh
For high EET-values, the decrease in the amount
of isostatic subsidence is not enough to compensate
for the increase in kinematic surface subsidence. As
a result, deeper basins evolve when increasing the
necking depth, as can be seen in the lower row (i.e.
EET= 40 km) of Fig. 5. The shallow kinematic
basin resulting for a necking depth of 5 km is
partly compensated by a downward state of flexure,
ontext of a synthetic cross-section with two rifting phases (at 100 and
part), versus a necking depth of 5 km (left), 16.5 km (middle) and 32
ading.

W. Fjeldskaar et al. / Tectonophysics 382 (2004) 189–212 199
resulting in a concave basin floor and flexurally
downwarped basin flanks. The deep kinematic basin
resulting for a necking depth of 32 km is partly
compensated by an upward state of flexure, result-
ing in a convex basin floor and flexurally supported
rift shoulders.
For low EET-values, with a high flexural amplitude
and a small flexural wavelength, the kinematic and
isostatic effects almost compensate each other, indi-
cating that the choice of the necking depth has much
less effect for low than for high EET-values (compare
EET= 5 km and EET= 40 km in Fig. 5). For the Airy-
isostatic case (EET= 0 km), the necking depth has no
influence at all.
If the necking depth is such that the negative
density contrast caused by the sediments more or less
equals the positive density contrast caused by the
mantle material, the effect of flexure is very small,
and the choice of the EET is of limited influence (see
Fig. 5, zneck = 16.5 km).
The importance of incorporating appropriate neck-
ing depths in models used for estimating thinning
factors becomes apparent from the subsequent numer-
ical tests. In these, we regarded the basin resulting
from b = 2, a necking depth of 16.5 km and an EET of
40 km (see Fig. 5) as a ‘synthetic profile’, and we
tested how the b-values should be adapted to obtain
the same basin geometry for the other considered
necking depths.
Fig. 6 shows the calculated fit (i.e. the results for
the indicated necking depth and EET, compared to the
‘reference basin’), Fig. 7 shows the b-values for boththinning phases used to obtain this fit, and Fig.
8 shows the resulting crustal structure (i.e. inclusive
Moho). As mentioned above, differences are at largest
for high EET-values.
For the case where the EET equals 40 km, using a
low necking depth of 5 km results in a downward state
of flexure and the development of downwarped basin
flanks as well as a concave basin floor (Fig. 5). To
compensate for this, an unrealistic b-distribution with
very high values at the basin flanks has to be used in
order to simulate the reference basin (Fig. 7), which,
in turn, leads to an unrealistically high amount of
Moho uplift (Fig. 8).
Alternatively, a large depth of necking (32 km)
results in a deep basin and an upward state of
flexure, yielding uplifted rift shoulders and a convex
basin floor. To compensate for the deep basin, the
average b-value should be somewhat lower than for
the reference case. To compensate for the convex
basin floor and uplifted rift shoulders, b-valuesshould be higher in the basin center than on the
flanks.
From these results, the influence of the choice of
the necking depth on estimates of b-factors is evident.Also the need to look at the entire crustal structure
instead of only at basement subsidence becomes
obvious.
Low EET-values are often obtained by models
using a necking depth of 0 km (e.g. Odinsen et al.,
2000b). This can be explained by the fact that, if the
necking depth is 0 km, basement subsidence results
only from the flexural response to the crustal thinning.
Therefore, there is no other way to obtain a topogra-
phy with short-wavelength lateral changes than by
using an extremely low EET.
In summary, we can state that the concept of a level
of necking is of major importance in basin modelling.
A variation in this level has a large influence on the
basin structure, and therefore on other derived mod-
elling parameters.
5.1. Constraints on the level of necking?
Necking as a geometrical concept is nothing
more than a method to describe thinning in a
kinematic way, and, as such, is not dependent on
the cause of this thinning. It can be used for regions
of passive rifting, which is commonly assumed to
be the mechanism that has generated the Viking
Graben, but also for regions where active rifting has
played an important role, as for example in the East
African Rift. Furthermore, the use of the necking
level as a model parameter does not exclude the
option of depth-dependent thinning (e.g. more asthe-
nosperic heating than would be expected from
crustal thinning).
In the above, the importance of the necking depth
as a model parameter has been firmly established
(see also, e.g. Kooi, 1991; Kooi et al., 1992; Spadini
et al., 1995). Its physical meaning, however, is still a
matter of debate. A good overview of the various
interpretations presented in the literature is given by
Van der Beek (1995). In general, it can be said that
the necking level represents an average process,

Fig. 6. Simulation of the basin configuration of the synthetic cross-section with various necking-depth and EET-values. Dashed lines: surface
deformation of our ‘reference basin’ of Fig. 5 (with necking depth 16.5 km and EET 40 km). Solid lines: best fit obtained with EET and necking
depth as indicated.
Fig. 7. b-values used for the simulations in Fig. 6. Dashed lines: crustal thinning. Solid lines: sub-crustal thinning.
W. Fjeldskaar et al. / Tectonophysics 382 (2004) 189–212200

Fig. 8. Crustal structure resulting from the simulations, with b-values as in Fig. 7.
W. Fjeldskaar et al. / Tectonophysics 382 (2004) 189–212 201
caused by the interlayering of weak and strong layers
in the crustal lithosphere. The difficulty to link the
necking depth directly to a measurable parameter is
illustrated by the wide range of suggestions in the
literature. From dynamical modelling, it has been
concluded that the necking level should coincide
with the strongest level in the crust (Braun and
Beaumont, 1989; Bassi et al., 1993). Others mention
that two or more strong levels are likely to exist, and
the average necking level is supposed to be in
between them and mostly coincides with a weak
layer (Van der Beek et al., 1994; Van Balen and
Cloetingh, 1994; Spadini et al., 1995). Finally, it has
been proposed that the necking level is more or less
at the same depth as the level where major faults
sole out, i.e. where local deformation along faults
makes place for the more distributed, ductile defor-
mation of the lower crust (Ter Voorde, 1996; Ter
Voorde and Cloetingh, 1996).
Cloetingh et al. (1995) compiled modelling param-
eters best fitted to describe the kinematics for a
number of rifted basin in different tectonic settings,
and made an attempt to correlate the necking depth to
various rheological parameters. They suggest that
shallower necking levels are related to higher geo-
thermal gradients, and they found a (weak) positive
empirical correlation between necking level and EET.
Agreement thus exists about a coupling between
the level of necking and rheology. This implies that its
depth could even change with time and with lateral
position, because of thermal effects and the hetero-
genity of the lithosphere. However, due to the appar-
ent uncertainties in its constraints, we think it is not
useful yet also to include this option into kinematic
models.
Nevertheless, in spite of the fact that the level of
necking does not have a unique meaning in terms of
mechanics, we argue that kinematic models including
necking depth as a modelling parameter have a
significant added value compared to models that do
not. This becomes obvious once it is realised that, due
to their nature, all kinematic models for crustal thin-
ning are using the necking concept already: If they do
not explicitly include the necking level as a modelling
parameter, it is built in an implicit way. For example,
McKenzie’s model (1978) puts it implicitly at 0 km,
and models combining simple shear deformation in an
upper layer with ductile deformation in the lower

W. Fjeldskaar et al. / Tectonophysics 382 (2004) 189–212202
lithosphere put it implicitly on the boundary in be-
tween these layers (e.g. Kusznir et al., 1991). As we
showed in the above, such an implicit assumption of a
standard necking depth might lead to considerably
biased modelling results.
6. Pure shear extension and EET
The modelling of the isostatic and tectonic pro-
cesses in the context of the Viking Graben profile was
carried out using BMTk, which has the option to
vary the necking depth. The magnitude of the stretch-
ing events was determined empirically by matching
the combined subsidence resulting from forward sub-
sidence models of the isostatic and tectonic subsi-
dence with the ‘‘observed’’ subsidence derived from
the geohistory. Parameters used for the modelling are
given in Table 2.
To obtain a good correspondence between the
‘‘observed’’ subsidence and theoretical (predicted)
subsidence, the tectonic modelling was based on the
two rifting events described above: Permo-Triassic
(modelled to take place at 260 Ma) and Mid-Jurassic
to earliest Cretaceous (modelled to take place at 142
Fig. 9. Example of observed and theoretical tectonic subsidence, for a selec
tectonic subsidence; solid line: calculated tectonic subsidence). The calcu
approximaton.
Ma). Firstly, the necking depth was set to 0 km. The
calculations were performed for 27 positions across
the profile, and for three rheological models: two
flexure models and an Airy approximation. The Airy
model assumes that isostatic compensation takes place
locally and instantaneously over geological time
scales. The two flexure models apply EET= 1 km
and EET= 2 km, respectively, assuming uniform ef-
fective elastic thickness over time and space.
An example of the fit between the observed and
theoretical tectonic subsidence for a single position
along the profile is given in Fig. 9. With the two-
rifting models mentioned above, there is a reasonably
good match, except for the post-rift interval (which
will be discussed later).
The approach used assumes that the water load is
included in the isostatic subsidence, which means that
the tectonic subsidence calculated here is actually the
subsidence a basin would undergo if it were loaded
with air, and not with water, as often is the case in
literature. We find it more appropriate to use air-
loaded tectonic subsidence. It is important to be aware
of the difference, because stretching factors calculated
by these two different methods cannot be directly
compared.
ted position (120 km) in the Viking graben (dotted line: ‘‘observed’’
lated tectonic subsidence is based on a two-rifting model and Airy
W. Fjeldskaar et al. / Tectonophysics 382 (2004) 189–212 203
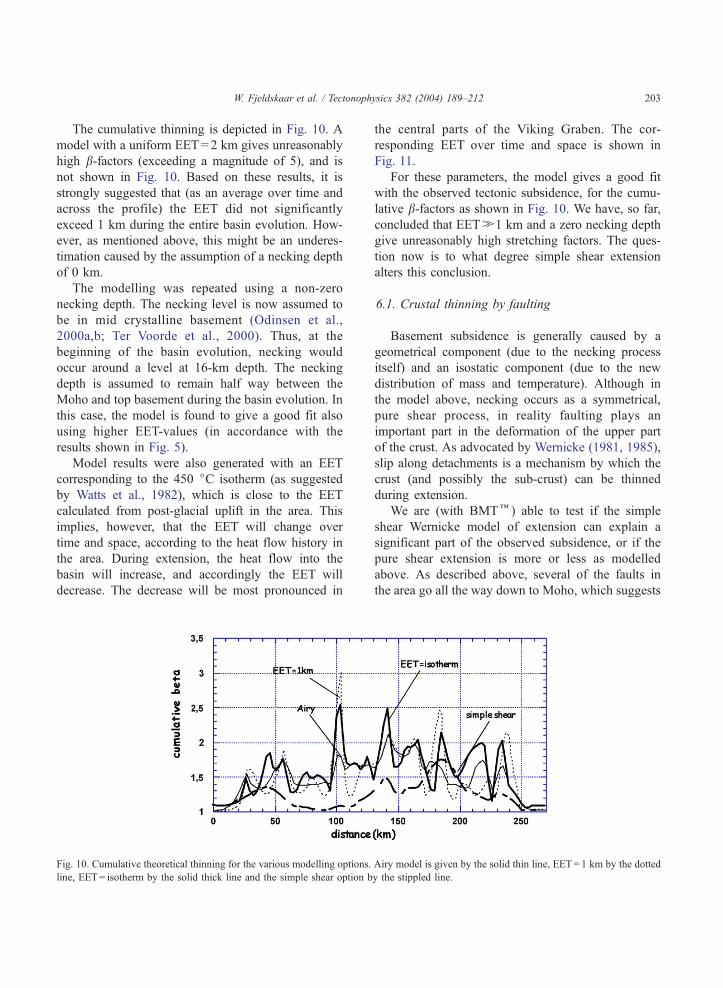
The cumulative thinning is depicted in Fig. 10. A
model with a uniform EET= 2 km gives unreasonably
high b-factors (exceeding a magnitude of 5), and is
not shown in Fig. 10. Based on these results, it is
strongly suggested that (as an average over time and
across the profile) the EET did not significantly
exceed 1 km during the entire basin evolution. How-
ever, as mentioned above, this might be an underes-
timation caused by the assumption of a necking depth
of 0 km.
The modelling was repeated using a non-zero
necking depth. The necking level is now assumed to
be in mid crystalline basement (Odinsen et al.,
2000a,b; Ter Voorde et al., 2000). Thus, at the
beginning of the basin evolution, necking would
occur around a level at 16-km depth. The necking
depth is assumed to remain half way between the
Moho and top basement during the basin evolution. In
this case, the model is found to give a good fit also
using higher EET-values (in accordance with the
results shown in Fig. 5).
Model results were also generated with an EET
corresponding to the 450 jC isotherm (as suggested
by Watts et al., 1982), which is close to the EET
calculated from post-glacial uplift in the area. This
implies, however, that the EET will change over
time and space, according to the heat flow history in
the area. During extension, the heat flow into the
basin will increase, and accordingly the EET will
decrease. The decrease will be most pronounced in
Fig. 10. Cumulative theoretical thinning for the various modelling options.
line, EET= isotherm by the solid thick line and the simple shear option b
the central parts of the Viking Graben. The cor-
responding EET over time and space is shown in
Fig. 11.
For these parameters, the model gives a good fit
with the observed tectonic subsidence, for the cumu-
lative b-factors as shown in Fig. 10. We have, so far,
concluded that EETH1 km and a zero necking depth
give unreasonably high stretching factors. The ques-
tion now is to what degree simple shear extension
alters this conclusion.
6.1. Crustal thinning by faulting
Basement subsidence is generally caused by a
geometrical component (due to the necking process
itself) and an isostatic component (due to the new
distribution of mass and temperature). Although in
the model above, necking occurs as a symmetrical,
pure shear process, in reality faulting plays an
important part in the deformation of the upper part
of the crust. As advocated by Wernicke (1981, 1985),
slip along detachments is a mechanism by which the
crust (and possibly the sub-crust) can be thinned
during extension.
We are (with BMTk) able to test if the simple
shear Wernicke model of extension can explain a
significant part of the observed subsidence, or if the
pure shear extension is more or less as modelled
above. As described above, several of the faults in
the area go all the way down to Moho, which suggests
Airy model is given by the solid thin line, EET= 1 km by the dotted
y the stippled line.

Fig. 11. Calculated EET over time and space.
W. Fjeldskaar et al. / Tectonophysics 382 (2004) 189–212204
that the stretching in the upper and lower crust is
coupled. The interpreted fault geometries for this
profile (Fig. 12) are not the only possible solutions,
but this basis gives an idea of what can be expected
from the variation of the crustal thickness over time,
as a function of the fault movements. For example, at
the transition from the Viking Graben to the Horda
Platform (located at 170 km in the figure), the
thickness of crystalline basement was reduced from
30 km at 260 Ma to 23 km at 187 Ma (Fig. 12). Note
that there is a significant extension of the profile, so
that a mass point located at 170 km at 260 Ma will be
moved at least 10 km to the east the next 100 million
years. This means that we are actually not measuring
the same mass points in the two cases, but the
thickness of the crystalline basement at the same
position.
This geometrically produced thinning will have an
amplitude which varies with the number of faults and
with the depth to detachment (Kusznir et al., 1987).
The crustal thinning indicates that the maximum
thinning takes place at 180 km—i.e. at the western
part of the Horda Platform (cf. Fig. 10). The total
cumulative thinning of the crystalline basement by
simple shear extension has a maximum of 15 km
(Fig. 10).
6.2. Cumulative thinning
With the assumption of an initial crustal thick-
ness, an ‘‘observed’’ crustal thinning profile can be
calculated from the seismic section. There are two
options for the interpretation of Moho depth across
the profile (Fig. 12; see discussion in the work of
Christiansson et al., 2000). With an assumption of
an initial crustal thickness of 32 km, the ‘‘ob-
served’’ maximum crustal thinning converted to a
b-factor is close to 3.5 for interpreted Moho
‘‘option 1’’, and close to 2.5 for ‘‘option 2’’
(Fig. 13).
The theoretical cumulative total thinning over the
profile is up to 2.2 for the Airy model, with a
maximum at position 140 km (Fig. 10). For the
uniform flexure model (EET= 1 km), the maximum
is 2.5 for the same location, but with a second
maximum of 3.0 at location 100 km. The misfit is
large for increasing flexural rigidity. For the necking
depth model, there are also two maxima, both with
a magnitude of 2.5. The curve is oscillating to a
higher degree than what is ‘‘observed’’ (Fig. 13).
The Airy approximation gives predictions of the
present crustal thickness generally significantly low-
er than the interpreted Moho suggests. A simple
shear Wernicke model can explain most of the
thinning necessary to explain the observed subsi-
dence in the area, but only for parts of the area
(easternmost part). Although this conclusion is
based on modelling of only one geometrical fault
model, the total integrated cumulative thinning is
not expected to differ significantly from the one
above when using a different fault model. Conse-
quently, we conclude that simple shear extension

Fig. 12. Crustal structure modified by vertical simple shear faults, with examples from Permian and Mid Jurassic time (the two uppermost
sections). The lowermost part of the figure shows the fault geometries and Moho relief defined for the modelling. Note the two possible
interpretations of the depth to the Moho.
W. Fjeldskaar et al. / Tectonophysics 382 (2004) 189–212 205
alone cannot significantly alter the conclusion on
pure shear extension presented above.
It has been shown that rifting in the northern
Viking Graben can be explained with various models,
the EET varying from slightly above 1 km for a zero
necking depth to the depth of the 450 jC isotherm for
an intermediate level of necking. The thinning is
shown to take place by faulting in the upper crust

Fig. 13. ‘‘Observed’’ cumulative crustal thinning over the area, for the two possible interpretation of the depth to Moho.
W. Fjeldskaar et al. / Tectonophysics 382 (2004) 189–212206
combined with a pure shear deformation at lower
levels.
7. Post-rift phase
The predicted subsidence, by pure shear/simple
shear extension, follows the ‘observed’ subsidence
fairly accurately for the syn-rift stage (Fig. 9). In the
post-rift stage, however, there are clear discrepancies,
which cannot be predicted by the models. There is
an accelerated Late Cretaceous (Cenomanian–Turo-
nian) subsidence followed by mid-Tertiary uplift
(Eocene) and subsidence (Miocene). This was again
followed by Pliocene uplift. These events are
mapped by Kyrkjebø (1999) and Gabrielsen et al.
(2001). The mechanisms for these movements are
not known; they may be associated with thermal
events or with intra-plate shortening/stress. The
amplitudes and wavelengths of the events are vari-
able (Kyrkjebø, 1999; Gabrielsen et al., 2001). The
Late Cretaceous and Paleocene subsidence phases
seem to involve the entire transect, while the Eocene
uplift event has shorter wavelengths. The Miocene
and Pliocene events also seem to have large wave-
lengths. We are probably, therefore, looking for
several driving mechanisms.
One of the simplifications made in the modelling is
that we have assumed instantaneous rifting. A model
simulating finite rifting over a period would give
similar answers regarding total cumulative crustal
thinning, but an alternative syn-rift to post-rift ratio
of the sediment infill (Ter Voorde and Bertotti, 1994;
Ter Voorde and Cloetingh, 1996). However, since
such a more realistic approach would cause a smaller
post-rift sediment thickness, it cannot be the expla-
nation for the large thickness of Late-Cretaceous
sediments.
This paper is not focusing on the post-rift stage.
However, we will just present two possible mecha-
nisms for the post-rift development. These are:
(1) intra-plate stress,
(2) phase boundary migration.
In addition, there could be other mechanisms
operating. One possible mechanism is related to
thermochemical diagenetic thinning of sandstones
undergoing quartz cementation (Walderhaug et al.,
2001). Asthenospheric diapirism (Rohrman and Van
der Beek, 1996) and magmatic underplating are other
potential mechanisms.
7.1. Intra-plate stress
There are observations indicating a significant
compressional stress field in the Northern Atlasntic
today (Golke, 1996), which is suggested to have a
magnitude of the order of 2� 1012 N m� 1 (Cloetingh
and Kooi, 1989). For EET= 1 km, this is one order of
magnitude lower than the critical buckling stress
(Turcotte and Schubert, 1982; Beekman et al., 1996;
Cloetingh and Burov, 1996) at which an elastic beam
will become unstable.

W. Fjeldskaar et al. / Tectonophysics 382 (2004) 189–212 207
It has been suggested that stress-induced subsi-
dence/uplift in rifted basins could have a significant
effect in basin formation (Lambeck, 1983, 1984;
Cloetingh and Lambeck, 1985; Karner, 1986; Cloe-
tingh and Kooi, 1989). The application of an in-plane
force to lithosphere containing a pre-existing deflec-
tion would alter the distribution of bending stresses,
which in turn would induce an additional deflection of
the lithosphere (Stephenson and Lambeck, 1985; Kooi
and Cloetingh, 1992; Karner et al., 1993).
Karner et al. (1993) have shown that the additional
deflection, caused by the in-plane force, is simply a
filtered version of the pre-existing deflection. The
additional deflection caused by the lateral force/unit
length N and the pre-existing deflection W0 in the
wave number domain (k) is:
W1ðkÞ ¼Nk2
Dq2g1þ ðDk2 � NÞk2
Dq2g
� ��1
W0ðkÞ ð3Þ
or equivalently:
W1ðkÞ ¼ UðkÞW0ðkÞ
where D is the flexural rigidity, Dq2 is the density
difference between the material underlying and over-
lying the elastic beam ( =mantle density) and g is
acceleration due to gravity. Wave number k is related
to the wavelength k by k= 2p/k.Fig. 14 shows the deflection according to this
theory. The deflection was calculated using an intra-
plate stress level of 2� 1012 N m� 1, applied in Plio-
Pleistocene time (i.e. the last 5 million years) on the
profile, for an EET of 1 km and for an EET
corresponding to 450 jC isotherm, respectively. The
plate was assumed to be horizontal prior to the Late
Paleozoic sediment deposition on the transect. Fur-
thermore, it has been assumed that the elastic beam
was overlain by water (i.e. Dq = 2300 kg/m3). The
Fig. 14. Total theoretical movements of base plate caused by the intra-plate
1 km, the dotted line for EET corresponding to the 450 jC isotherm.
resulting total deflections for EET= 1 km (Fig. 14)
show a total amplitude of several hundred metres.
However, these deflections change in direction over
the area, whereas the observed post-rift movements
are more or less uniform over the profile. For the EET
model corresponding to the 450 jC isotherm (Fig.
14), the entire basin will be uplifted, but by less than
10 m. Apparently, using the theory in which addition-
al deflections caused by intra-plate stress are only
dependent on pre-existing deflections, the post-rift
part of the basin evolution cannot be ascribed to
intra-plate stress variations.
However, as demonstrated by 3D-modelling by
Van Wees (1994), a 2D model overestimates the stress
levels required for a certain amount of additional
deformation. Furthermore, it has been shown that
not only the flexural strength, but also the permanent
pre-existing geometry of the plate should be taken into
account (Van Balen and Podladchikov, 1998; Van
Balen et al., 1998, see also Cloetingh et al., 1999).
The largest part of this pre-existing geometry is
caused by faulting in the uppermost brittle part of
the crust and ductile deformation in the underlying
parts of the lithosphere. At a basin-wide scale, this
model predicts that a compressive change of inplane
horizontal forces results in basin center subsidence
and flank uplift. Compared to all previous models,
larger additional deflections will result from the same
horizontal stress level—a difference that can be up to
300%, or even more for stresses close to lithospheric
strength.
7.2. Phase boundary migration
It has been proposed (e.g. Kennedy, 1959) that
phase transitions in the Earth’s upper layers provide a
mechanism of uplift and subsidence of the Earth’s
surface. This is based on the assumption that phase
stress of 2� 1012 N m� 1. The solid line shows the results for EET of

W. Fjeldskaar et al. / Tectonophysics 382 (2004) 189–212208
transitions at depth respond to pressure changes at the
surface. Subsidence at the surface occurs when an
increase in pressure (by sedimentation) causes the
upward migration of the phase boundary (Fig. 15).
Uplift would follow a decrease in pressure (by ero-
sion) causing downward motion of the phase bound-
ary. The mechanism has been studied by several
authors (O’Connell and Wasserburg, 1972; O’Con-
nell, 1976; Mareschal and Gangi, 1977; Mareschal
and Lee, 1983). In these works, analytical and nu-
merical approximations of the movements of the
Earth’s surface by phase boundary migration have
been established. Riis and Fjeldskaar (1992) have
proposed the phase boundary migration as a mecha-
nism for the Tertiary uplift in Fennoscandia.
There are several phase changes in the mantle. The
phase transition considered here is the transition from
gabbro to eclogite at the base of the crust, at a depth of
30–50 km. Migration of this phase boundary has been
suggested as an explanation for the formation of
Fig. 15. Schematic illustration of phase boundary migration (a), and
resulting theoretical movements over the Viking Graben profile (b).
The solid line shows the uplift caused by extension; the dotted line
shows the subsidence caused by post-rift sedimentation.
sedimentary basins (e.g. Mareschal and Lee, 1983).
Eclogitization is found to take place in deep-crustal
shear zones in Western Norway (Jamtveit et al., 1990).
We have adopted an equilibrium approximation,
since it is easily shown, using the analytical approx-
imations of O’Connell (1976), that the phase bound-
ary migration will be 90% compensated in 3 million
years and a phase transition temperature of 1000 K.
In this study, we use an analytical approximation
for the equilibrium position of a phase boundary
under the horizontally varying surface loads given
by Mareschal and Gangi (1977). Under the assump-
tions that the Earth behaves as an elastic body above
the phase boundary, that the equilibrium position does
not depend on deviatoric stress and that the two
phases have the same thermal properties, they found
that the vertical displacement of the phase boundary
due to the applied load P(k,a) is in the Fourier
domain:
SðkÞ ¼ Y ðkÞ*Pðk; aÞ
where
Y ðkÞ ¼
�cðcgq1 � dÞ
� �expð�AkaAÞ
1þ lk þ l
� �aKa
� �ka½sinh2ka� 2ka�
DðkaÞ
� �
where
DðyÞ ¼ lk þ l
� �2þ k þ 3l
k þ l
� �cosh2yþ y2
and
aKa
¼ q2 � q1
q1
cKa
� �cgq1 � d
c is the inverse slope of the Clausius–Clapeyron
curve, d is the geothermal gradient, q1 is the density
of the upper phase, q2 is the density of the lower
phase, a is the depth of the phase change, K is the bulk
modulus and k and l are Lame’s parameters.
For the modelling of this process, we have as-
sumed (a) equilibrium approximation and (b) partly
eclogitization (10%). Other parameters are given in
Table 2.

W. Fjeldskaar et al. / Tectonophysics 382 (2004) 189–212 209
The resulting movements over the Viking Graben
profile are shown in Fig. 15. We see that the wave-
length of the movements is large, spanning the entire
length of the profile. The isolated effect of the
extension could be as large as 2 km uplift (solid line).
Deposition of the sediments on the section causes a
subsidence (in addition to the pure isostasy) on the
order of 1 km (from solid to dotted line). The move-
ments caused by phase boundary migration could,
thus, be a significant factor in basin development.
8. Conclusions
We have shown that the basin evolution of northern
Viking Graben can theoretically be matched by the
sum of (1) isostatic movements caused by deposition,
erosion, sea level movements and faulting and (2) the
effect of crustal and sub-crustal thinning. The rifting
in the northern Viking Graben can be explained by
various models, the effective elastic thickness (EET)
varying from 1 km for a zero necking depth to the
depth of the 450 jC isotherm for an intermediate level
of necking.
It has also been shown that the necking depth, the
EET and the b-factors are mutually dependent param-
eters. A very shallow depth of necking often arises the
need to decrease the EET and increase the b-values. Inorder to discriminate which model is the best simula-
tion of geological reality, the entire crustal structure
should be taken into account in the study. A subsi-
dence analysis alone is not appropriate.
We conclude that the northern Viking Graben has
been thinned around a necking depth of initially 16
km (i.e. at intermediate crustal level). Zero-necking-
depth models with uniform EET higher than 1 km
give unreasonably high b-factors. With the introduc-
tion of a deeper level of necking, the EET
corresponding to 450 jC isotherm leads to a good
fit with the observed subsidence of the area. This
corresponds to a present day EET of more than 20 km
(and close to the EET calculated from post-glacial
uplift in the area).
Wernicke-type simple shear extension gives a
crustal thinning with a magnitude of up to 15 km
in the eastern central part of the basin. This is,
however, far from enough to invalidate the above
conclusions that rifting in the northern Viking Graben
can be explained with various models, the EET
varying from 1 km for a zero necking depth to the
depth of the 450 jC isotherm for an intermediate
level of necking.
The post-rift stage trends cannot be explained by
pure shear or simple shear extension. Two mecha-
nisms are proposed here to explain the post-rift
subsidence pattern, namely intra-plate stress and
phase boundary migration.
Acknowledgements
Part of this study was supported by Norwegian
Research Council through grant no. 32842/211,
project Tectonic impact on Sedimentary Processes in
the post-rift phase—Improved models. The authors
want to thank the companies participating in the
project (Amoco Norway Oil Company, Mobil Explo-
ration Norway Inc., Norsk Agip A/S, Norsk Hydro
ASA, Phillips Petroleum Company Norway, Saga
Petroleum ASA and Statoil ASA). We also thank O.
Kløvjan, G. Bertotti, J. Cartwright, J. Turner and two
anonymous referees for constructive comments of
earlier versions of this paper.
References
Badley, M.E., Price, J.D., Rambech-Dahl, C., Agdestein, T., 1988.
The structural evolution of the Northern Viking Graben and its
bearing upon extensional modes of basin formation. J. Geol.
Soc. (Lond.) 145, 455–472.
Bartholomew, I.D., Peters, J.M., Powell, C.M., 1993. Regional
structural evolution of the North Sea: oblique slip and the base-
ment lineaments. In: Parker, J.R. (Editor-in-Chief), Petroleum
Geology of the NW Europe. The Geological Society, London,
pp. 1109–1122.
Bassi, G., Keen, C.E., Potter, P., 1993. Contrasting styles of rifting:
models and examples from the eastern Canadian margin. Tec-
tonics 12, 639–655.
Beach, A., 1986. Some comments on sedimentary basin develop-
ment in northern North Sea. Scott. J. Geol. 22, 1–20.
Beach, A., Bird, T., Gibbs, A., 1987. Extensional tectonics and
crustal structure: deep seismic reflection data from the northern
North Sea Viking Graben. In: Coward, et al. (Editors-in-Chief),
Continental Extensional Tectonics. Special Publication, Geolog-
ical Society of London, vol. 28, pp. 467–476.
Beekman, F., Bull, J.M., Cloetingh, S., Scrutton, R.A., 1996. Crust-
al fault reactivation facilitating lithospheric folding/buckling in
the central Indian Ocean. In: Buchanan, P.G., Nieuwland, D.

W. Fjeldskaar et al. / Tectonophysics 382 (2004) 189–212210
(Editors-in-Chief), Modern Developments in Structural Interpre-
tation, Validation and Modelling. Spec. Publ., Geol. Soc. Lond.,
vol. 99, pp. 251–263.
Bergsager, E., 1985. Character of the North Sea. In: Bang-Ander-
sen, A., et al. (Ed.), The North Sea, A Highway of Economic
and Cultural Exchange, Character –History. Norwegian Univ.
Press, Oslo, pp. 9–26.
Bethke, C.M., 1985. A numerical model of compaction-driven
groundwater flow and heat transfer and its application to the
paleohydrology of intracratonic sedimentary basins. J. Geophys.
Res. 90, 6817–6828.
Braun, J., Beaumont, C., 1989. A physical explanation of the rela-
tion between flank uplifts and the breakup unconformity at
rifted continental margins. Geology 17, 760–764.
Brun, J.-P., Tron, V., 1993. Development of the North Viking Gra-
ben: inference from laboratory modelling. Sediment. Geol. 86,
31–51.
Burov, E.B., Diament, M., 1995. The effective elastic thickness (Te)
of continental lithosphere: what does it really mean? JGR 100,
3905–3927.
Christiansson, N.P.E., Faleide, J.I., Berge, A.M., 2000. Crustal
structure in the northern North Sea; an integrated geophysical
study. In: Nøttvedt, A., et al. (Editors-in-Chief), Dynamics of the
Norwegian Margin. Special Publication, Geological Society of
London, vol. 167, pp. 15–40.
Cloetingh, S., Burov, E., 1996. Thermomechanical structure of Eu-
ropean continental lithosphere: constraints from rheological pro-
files and EET-estimates. Geophys. J. Int. 124, 695–723.
Cloetingh, S., Kooi, H., 1989. Tectonic subsidence and sea-level
changes. In: Collinson, J. (Editor-in-Chief), Correlation in Hy-
drocarbon Exploration. Norwegian Petroleum Society, Graham
and Trotman, London, pp. 3–11.
Cloetingh, S., Mcqueen, H., Lambeck, K., 1985. On a tectonic
mechanism for regional sea level variations. Earth Planet. Sci.
Lett. 75, 157–166.
Cloetingh, S., van Wees, J.D., van der Beek, P.A., Spadini, G.,
1995. Extension in convergent regimes:constrains from
thermo-mechanical modelling of Alphine/Mediterranean basins
and intra-cratonic rifts. Marine and Petroleum Geology 12,
793–808.
Cloetingh, S., Burov, E., Poliakov, A., 1999. Lithosphere folding:
primary response to compression? (from central Asia to Paris
basin). Tectonics 18, 1064–1083.
Fjeldskaar, W., 1997. Flexural rigidity of Fennoscandia inferred
from the post-glacial uplift. Tectonics 16, 596–608.
Fjeldskaar, W., Pallesen, S., 1989. The application of a visco-elastic
lithosphere model to isostatic subsidence in backstripping. In:
Collinson, J. (Editor-in-Chief), Correlation in Hydrocarbon Ex-
ploration. Norwegian Petroleum Society. Graham and Trotman,
pp. 53–59.
Færseth, R.B., 1978. Mantle-derived lherzolite nodules and mega-
crysts from Permo-Triassic dykes, Sunnhordland, western Nor-
way. Lithos 11, 23–35.
Færseth, R.B., 1996. Interference of Permo-Triassic and Jurassic
stretching phases and associated megafault-blocks in the north-
ern North Sea. J. Geol. Soc. (Lond.) 153, 931–944.
Færseth, R.B., Gabrielsen, R.H., Hurich, C.A., 1995. Influence of
basement in structuring of the North Sea Basin offshore south-
west Norway. Nor. Geol. Tidsskr. 75, 105–119.
Furnes, H., Elvsborg, A., Malm, O.A., 1982. Lower and Middle
Jurassic alkaline magmatism in the Egersund sub-basin. North
Sea Mar. Geol. 46, 53–69.
Gabrielsen, R.H., Ekern, O.F., Edvardsen, A., 1986. Structural de-
velopment of hydrocarbon traps, Block 2/2, Norway. In: Spen-
cer, A.J., et al. (Editors-in-Chief), Habitat of Hydrocarbons of
the Norwegian Continental Shelf, 129-141, Nor. Pet. Soc., Gra-
ham and Trotman.
Gabrielsen, R.H., Færseth, R.B., Steel, R.J., Idil, S., Kløvjan, O.S.,
1990. Architectural styles of basin fill in the northern Viking
Graben. In: Blundell, D.J., Gibbs, A.D. (Editors-in-Chief), Tec-
tonic Evolution of the North Sea Rifts. Oxford Science Publi-
cations, Oxford, pp. 159–179.
Gabrielsen, R.H., Steel, R.J., Nøttvedt, A., 1995. Subtle traps in
extentional terranes with special reference to the North Sea. Pet.
Geosci. 1, 223–235.
Gabrielsen, R., Kyrkjebø, R., Faleide, J.I., Fjeldskaar, W., Kjen-
nerud, T., 2001. The Cretaceous post-rift basin configuration
of the northern North Sea. Pet. Geosci. 7, 137–154.
Gibbs, A.D., 1983. Balanced cross-section construction from seis-
mic sections in areas of extensional tectonics. J. Struct. Geol. 5,
153–160.
Gibbs, A.D., 1987. Linked tectonics of the Northern North Sea
basin. In: Beaumont, C., Tankard, A.J. (Editors-in-Chief), Sed-
imentary Basins and Basin Forming Mechanisms: Can. Soc.
Petrol. Geol. Mem. No. 12, pp. 163–171.
Giltner, J.P., 1987. Application of extensional models to the north-
ern Viking Graben. Nor. Geol. Tidsskr. 67, 339–352.
Golke, M., 1996. Patterns of stress in sedimentary basins and the
dynamics of pull-apart basin formation. Thesis. Vrije Universi-
teit Amsterdam. 167 pp.
Hurich, C., Kristoffersen, Y., 1988. Deep structure of the Caledo-
nide orogen in southern Norway: new evidence from deep ma-
rine seismic reflection profiling. Spec. Publ., Nor. Geol. Unders.
3, 96–101.
Jamtveit, B., Bucher, K., Austrheim, H., 1990. Fluid-controlled
eclogitization of granulites in deep-crustal shear zones, Ber-
gen Arcs, Western Norway. Contrib. Mineral. Petrol 104,
184–193.
Jarvis, G.T., McKenzie, D.P., 1980. Sedimentary basin formation
with finite extension rates. Earth Planet. Sci. Lett. 48, 42–52.
Jordt, H., Faleide, J.I., Bjørlykke, K., Ibrahim, M.T., 1995. Ceno-
zoic sequence stratigraphy of the central northern North Sea
Basin: tectonic development, sediment distribution and prove-
nance areas. Mar. Pet. Geol. 12 (8), 845–879.
Karner, G.D., 1986. Effects of lithospheric in-plane stress on sed-
imentary stratigraphy. Tectonics 5, 573–588.
Karner, G.D., Driscoll, N.W., Weissel, J.K., 1993. Response of the
lithosphere to in-plane force variations. Earth Planet. Sci. Lett.
114, 397–416.
Kennedy, G.C., 1959. The origin of continents, mountain ranges
and ocean basins. Am. Sci. 47, 491–504.
Kooi, H., 1991. Tectonic modelling of extensional basins, the role
of lithospheric flexure, intraplate stress and relative sealevel
change, PhD thesis. Vrije Universiteit Amsterdam. 183 pp.

W. Fjeldskaar et al. / Tectonophysics 382 (2004) 189–212 211
Kooi, H., Cloetingh, S., 1992. Intraplate stresses and the tectono-
stratigraphic evolution of the Central North Sea. AAPG Mem.
48, 541–558.
Kooi, H., Cloetingh, S., Burrus, J., 1992. Lithospheric necking and
regional isostasy At extensional basins: 1. Subsidence and grav-
ity modelling with an application to the Gulf of Lions Margin
(SE France). J. Geophys. Res. 97 (B12), 17553–17571.
Kusznir, N.J., Karner, G.D., Egan, S., 1987. Geometric, thermal and
isostatic consequences of detachment in continental lithosphere
extension and basin formation. In: Beaumont, C., Tankard, A.J.
(Editor-in-Chief), Basin-Forming Mechanisms: Can. Soc. Petro-
leum Geologists, Memoir, vol. 12, pp. 185–203.
Kusznir, N.J., Marsden, G., Egan, S.S, 1991. A flexural cantile-
ver simple-shear/pure-shear model of continental lithosphere
extension: applications to the Jeanne d’Arc Basin, Grand
Banks and Viking Graben, North Sea. In: Roberts, A.M.,
Yielding, G., Freeman, B. (Eds.), The Geometry of Normal
Faults. Geol. Soc. Spec. Publ. 56. Geological Society, Lon-
don, pp. 41–60.
Kyrkjebø, R., 1999. The Cretaceous–Tertiary of the northern North
Sea: thermal and tectonic influence in a post-rift setting. PhD
thesis. University of Bergen.
Kyrkjebø, R., Kjennerud, T., Gilmore, G.K., Faleide, J.I., Gabriel-
sen, R.H., 2001. Cretaceous–Tertiary palaeo-bathymetry in the
northern North Sea; integration of palaeo-water depth estimates
obtained by structural restoration and micropalaeontological
analysis. In: Martinsen, O., Dreyer, T. (Editors-in-Chief), Sedi-
mentary environments Offshore Norway. Norwegian Petroleum
Society (NPF) Special Publications, vol. 10, pp. 321–345.
Lambeck, K., 1983. The role of compressive forces in intracratonic
basin formation and mid-plate orogenies. Geophys. Res. Lett.
10, 845–848.
Lambeck, K., 1984. Structure and evolution of intracratonic basins
of central Australia. Geophys. J. R. Astron. Soc. 74, 843–886.
Lander, R.H., Langfeld, M., Bonnell, L., Fjeldskaar, W., 1994.
BMT User’s Guide. Rogaland Research proprietary publication,
Stavanger, Norway.
Lervik, K.S., Spencer, A.J., Warrington, G., 1989. Outline of Tri-
assic stratigraphy and structure in the central and northern North
Sea. In: Collinson, J.D. (Editor-in-Chief), Correlation in Hydro-
carbon Exploration: Norwegian Petroleum Society, Graham and
Trotman, pp. 173–189.
Mareschal, J.C., Gangi, A.F., 1977. Equilibrium position of a phase
boundary under horizontally varying surface loads. Geophys.
J. R. Astron. Soc. 49, 757–772.
Mareschal, J.C., Lee, C.K., 1983. Initiation of subsidence in a
sedimentary basin underlain by a phase change. Geophys. J. R.
Astron. Soc. 74, 689–712.
Marsden, G., Yielding, G., Roberts, A.M., Kusznir, N.J., 1990.
Application of a flexural cantilever simple shear/pure shear
model of continental lithosphere extension to the formation of
the Northern North Sea basin. In: Blundell, D.J., Gibbs, A.J.
(Editors-in-Chief), Tectonic Evolution of the North Sea Rifts.
Oxford Univ. Press, Oxford, pp. 241–261.
McKenzie, D.P., 1978. Some remarks on the development of sed-
imentary basins. Earth Planet. Sci. Lett. 40, 25–31.
Nøttvedt, A., Gabrielsen, R.H., Steel, R.J., 1995. Tectonostratigra-
phy and sedimentary architecture of rift basins, with reference to
the Northern North Sea. Mar. Pet. Geol. 12 (8), 881–901.
O’Connell, R.J., 1976. The effects of mantle phase changes on
postglacial rebound. J. Geophys. Res. 81, 971–974.
O’Connell, R.J., Wasserburg, G.J., 1972. Dynamics of submergence
and uplift of a sedimentary basin underlain by a phase change
boundary. Rev. Geophys. Space Phys. 10, 335–368.
Odinsen, T., Christiansson, P., Gabrielsen, R.H., Faleide, J.I., Berge,
A.M., 2000a. The geometries and deep structure of the northern
North Sea rift system. In: Nøttvedt, A. et al. (Editors-in-Chief).
Dynamics of the Norwegian Margin. Special Publication, Geo-
logical Society of London, vol. 167, pp. 41–57.
Odinsen, T., Reemst, P., Van der Beek, P., Faleide, J.I., Gabrielsen,
R.H., 2000b. Permo-Triassic and Jurassic extension in the north-
ern North Sea: results from tectonostratigraphic forward model-
ling. In: Nøttvedt, A., et al. (Editors-in-Chief), Dynamics of the
Norwegian Margin. Special Publication, Geological Society of
London, vol. 167, pp. 83–103.
Olaussen, S., Beck, Falt, L.M., Graue, E., Malm, O.A., South,
D., 1992. Gullfaks Field-Norway East Shetland Basin, North-
ern North Sea. In: Halbouty, M.T. (Editor-in-Chief), Giant oil
and gas fields of the decade 1978–1988: AAPG Memoir,
vol. 54, 55–83.
Petterson, A., Storli, E., Ljosland, O., Massie, I., 1990. The
Gullfaks Field: Geology and Reservoir Development. In: Bul-
ler, A.T., et al. (Editor-in-Chief), North Sea Oil and Gas
Reservoirs. II: Proceedings of the North Sea Oil and Gas
Reservoirs Conference.
Platt, N.H., 1995. Structure and tectonics of the northern North Sea:
new insights from deep penetration regional seismic data. In:
Lambiase, J.J. (Editor-in-Chief), Hydrocarbon Habitat in Rift
Basins: Special Publication, Geological Society of London,
vol. 80, pp. 103–113.
Ravnas, R., Nøttvedt, A., Steel, R., Windelstad, J., 2000. Syn-rift
sedimentary architectures in the Northern North Sea. In: Nøtt-
vedt, A., et al. (Editors-in-Chief), Dynamics of the Norwegian
Margin. Special Publication, Geological Society of London,
vol. 167, pp. 133–177.
Reemst, P., Cloetingh, S., 2000. Polyphase rift evolution of the
Vøring margin (mid-Norway): constraints from forward tecto-
nostratigraphic modeling. Tectonics 19 (2), 225–240.
Riis, F., Fjeldskaar, W., 1992. On the magnitude of the Late Tertiary
and Quaternary erosion and its significance for the uplift of
Scandinavia and the Barents Sea. In: Larsen, R.M., Brekke,
H., Larsen, B.T., Talleraas, E. (Editors-in-Chief), Structural
and tectonic modelling and its application to petroleum geology.
Norwegian Petroleum Society. Elsevier, pp. 163–185.
Roberts, A.M., Yielding, G., Kusznir, N.J., Walker, I.M., Dorn-
Lopez, D., 1995. Mesozoic extension in the North Sea: con-
straints from flexural backstripping, forward modelling and fault
population. In: Parker, J.R. (Editor-in-Chief), Petroleum Geolo-
gy of Northwest Europe: Proceedings of the 4th Conference,
Geological Society, London, pp. 1123–1136.
Roberts, A.M., Yielding, G., Kusznir, N.J., Walker, I.M., Dorn-
Lopez, D., 1995. Quantitative analysis of Triassic extension in
the northern Viking Graben. J. Geol. Soc. (Lond.) 152, 15–26.
Rohrman, M., Van der Beek, P., 1996. Cenozoic postrift domal

W. Fjeldskaar et al. / Tectonophysics 382 (2004) 189–212212
uplift of North Atlantic margins: an asthenospheric diapirism
model. Geology 24, 901–904.
Royden, L., Keen, C.E., 1980. Rifting process and thermal evolu-
tion of the continental margin of eastern Canada determined
from subsidence curves. Earth Planet. Sci. Lett. 51, 343–361.
Rundberg, Y., 1991. Tertiary sedimentary history and basin evolu-
tion of the Norwegian North Sea between 60–62 N—an inte-
grated approach. Rep. 25, Department of Geology and Mineral
Resources Engineering, NTH, Trondheim, Norway.
Sclater, J.G., Christie, P.A.F., 1980. Continental stretching: an ex-
planation of the post-mid-Cretaceous subsidence of the Central
North Sea basin. J. Geophys. Res. 85, 3711–3739.
Spadini, G., Cloetingh, S., Bertotti, G., 1995. Thermo-mechanical
modelling of the Tyrrhenian Sea: lithospheric necking and ki-
nematics of rifting. Tectonics 14, 629–644.
Steel, R.J., 1993. Triassic– Jurassic megasequence stratigraphy in
the northern North Sea: rift to post-rift evolution. In: Parker, J.R.
(Editor-in-Chief), Petroleum Geology of Northwest Europe:
Proceedings of the 4th Conference. Geological Society, London,
pp. 299–315.
Stephenson, R., Lambeck, K., 1985. Erosion-isostatic rebound
models for uplift: an application to southeastern Australia. Geo-
physical Journal of Royal Astronomical Society 82, 31–55.
Steel, R.J., Ryseth, A., 1990. The Trissic–Early Jurassic succes-
sion in the northern North Sea: mega sequence stratigraphy and
intra-Triassic tectonics. In: Hardman, R.F., Brooks, J., (Editors-
in-Chief), Tectonic Events Responsible for Britain’s Oil and
Gas Reserves: Special Publication Geological Society, London,
pp. 299–315.
Ter Voorde, M., 1996. Tectonic modelling of lithospheric extension
along faults. Implications for thermal and mechanical structure
and basin stratigraphy, PhD thesis. Vrije Universiteit Amster-
dam. 197 pp.
Ter Voorde, M., Bertotti, G., 1994. Thermal effects of normal fault-
ing during rifted basin formation: 1. A finite difference model.
Tectonophysics 240, 133–144.
Ter Voorde, M., Cloetingh, S., 1996. Numerical modelling of ex-
tension in faulted crust: effects of localized and regional defor-
mation on basin stratigraphy. In: Buchanan, P.G., Nieuwland, D.
(Editors-in-Chief), Modern developments in structural interpre-
tation, validation and modelling. Spec. Publ., Geol. Soc. Lond.,
vol. 99, 283–296.
Ter Voorde, M., Faerseth, R.B., Gabrielsen, R.H., Cloetingh,
S.A.P.L., 2000. Repeated lithosphere extension in the northern
Viking Graben: a coupled or a decoupled rheology? In: Nøtt-
vedt, A., et al. (Editors-in-Chief), Dynamics of the Norwegian
Margin. Special Publication, Geological Society of London,
vol. 67, pp. 59–83.
Torsvik, T.H., Sturt, B.A., Swensson, E., Andersen, T.B., Dewey,
J.F., 1992. Palaeomagnetic dating of fault rocks: evidence for
Permian and Mesozoicx movements and brittle deformation
along the Dalsfjord Fault, west Norway. Geophys. J. Int. 109,
565–580.
Turcotte, D.L., Schubert, G., 1982. Geodynamics: Applications of
Continuum Physics to Geological Problems. Wiley, New York.
450 pp.
Van Balen, R., Cloetingh, S., 1994. Tectonic control of the sedi-
mentary record and stress induced fluid flow: constraints from
basin modelling. In: Parnell, J. (Editor-in-Chief), Geofluids: Or-
igin, Migration and Evolution of Fluids in Sedimentary Basins:
Spec. Publ., Geol. Soc. Lond., vol. 78, pp. 9–26.
Van Balen, R.T., Podladchikov, Yu.Yu., 1998. The effect of inplane
force variations on a faulted elastic thin-plate, implications for
relative sealevel changes in sedimentary basins. Geophys. Res.
Lett. 25, 3903–3907.
Van Balen, R.T., Podladchikov, Yu.Yu., Cloetingh, S.A.P.L., 1998.
A new multi-layered model for intraplate stress-induced differ-
ential subsidence of faulted lithosphere, applied to rifted basins.
Tectonics 17, 938–954.
Van der Beek, P.A., 1995. Tectonic evolution of continental rifts,
influences from numerical modelling and fission track ther-
mochronology. PhD thesis. Vrije Universiteit, Amsterdam.
232 pp.
Van der Beek, P., Cloetingh, S., Andriessen, P., 1994. Mecha-
nisms of extensional basin formations and vertical motions
at rift flanks: constraints from tectonic modelling and fis-
sion-track thermochronology. Earth Planet. Sci. Lett. 121,
417–433.
Van Wees, J.D., 1994. Tectonic modelling of basin deformation and
inversion dynamics, the role of pre-existing faults and continen-
tal lithosphere rheology in basin evolution, PhD thesis. Vrije
Universiteit, Amsterdam, p. 164.
Walcott, R.I., 1970. Flexural rigidity, thickness, and viscosity of the
lithosphere. J. Geophys. Res. 75, 3941–3954.
Walderhaug, O., Bjørkum, P.A., Nadeau, P.H., Langnes, O., 2001.
Quantitative modelling of basin subsidence caused by tempera-
ture-driven silica dissolution and reprecipitation. Pet. Geosci. 7,
107–113.
Watts, A.B., Karner, G.D., Steckler, M.S., 1982. Lithospheric flex-
ure and the evolution of sedimentary basins. Philos. Trans. R.
Soc. Lond., A 305, 249–281.
Weissel, J.K., Karner, G.D., 1989. Flexural uplift of rift flanks due
to mechanical unloading of the lithosphere during extension.
J. Geophys. Res. 94, 13919–13950.
Wernicke, B., 1981. Low-angle normal faults in the Basin and
Range Province: nappe tectonics in an extending orogen. Nature
291, 645–648.
Wernicke, B., 1985. Uniform normal sense simple shear of the
continental lithosphere. Can. J. Earth Sci. 22, 108–125.
Ziegler, P.A., 1982. Geological Atlas of Western and Central
Europe. Shell Internationale Petroleum Maatschappij, Amster-
dam. 130 pp.