Embed Size (px)
Citation preview

HAL Id: pastel-00005602https://pastel.archives-ouvertes.fr/pastel-00005602
Submitted on 11 Jan 2010
HAL is a multi-disciplinary open accessarchive for the deposit and dissemination of sci-entific research documents, whether they are pub-lished or not. The documents may come fromteaching and research institutions in France orabroad, or from public or private research centers.
L’archive ouverte pluridisciplinaire HAL, estdestinée au dépôt et à la diffusion de documentsscientifiques de niveau recherche, publiés ou non,émanant des établissements d’enseignement et derecherche français ou étrangers, des laboratoirespublics ou privés.
Séchage par atomisation : propriétés de collage desparticules en relation avec l’agglomération
Alessandro Gianfrancesco
To cite this version:Alessandro Gianfrancesco. Séchage par atomisation : propriétés de collage des particules en rela-tion avec l’agglomération. Sciences du Vivant [q-bio]. AgroParisTech, 2009. Français. �NNT :2009AGPT0029�. �pastel-00005602�

THESE
pour obtenir le grade de
Docteur
de
l’Institut des Sciences et Industries du Vivant et de
l’Environnement
(AgroParisTech)
Spécialité : Génie des Procédés Alimentaires
présentée et soutenue publiquement par
Alessandro GIANFRANCESCO
le 19 Juin 2009
SPRAY DRYING ENGINEERING: PARTICLE STICKINESS IN RELATION WITH AGGLOMERATION
SECHAGE PAR ATOMISATION :
PROPRIETES DE COLLAGE DES PARTICULES
EN RELATION AVEC L’AGGLOMERATION
Travail réalisé à AgroParisTech, UMR GénIAl 1145, 1 av. des Olympiades, F-91300
Massy
JURY Prof. John DODDS, Professeur Emérite Rapporteur
Dr. Jean-Dominique DAUDIN, INRA Theix Rapporteur
Prof. Arsène ISAMBERT, Ecole Centrale Paris Examinateur
Prof. Elisabeth DUMOULIN, Agroparistech Massy Examinateur
Dr. Christelle TURCHIULI, Université Paris XI, IUT Orsay Examinateur
Dr. Stefan PALZER, Nestlé NRC Lausanne Examinateur


A María, senza di chi questa Tesi non sarebbe mai neanche cominciata


Acknowledgements
My biggest thanks goes to María, for her invaluable day by day moral support and advice. This work
is the first half of our common project, which was born several years ago in Toulouse. Without her,
this work would never have been written.
I wish to express my deepest thanks to my supervisor Prof. Elisabeth Dumoulin, for her guidance and
support all along this work. I am also very grateful to Dr. Christelle Turchiuli, which codirected this
thesis with competence and patience.
I am grateful to Prof. John Dodds and Dr. Jean-Dominique Daudin for accepting to examine this
thesis.
I would like to thank Dr. Stefan Palzer, for accepting to examine this work and for giving me the
opportunity to carry out part of my thesis in Nestlé PTC of Singen.
This work was done in the framework of the Marie-Curie Biopowders Research Training Network
RTN 512247. I thank all the members of the network and in particular the coordinator Prof. John
Fitzpatrick. I am grateful to the European Union Commision for financing this work.
I wish to express my gratitude to Prof. Denis Flick, for his precious help in numerical simulation and
for the interesting and human discussions.
Special thanks to Dr. Alain Sommier, for his invaluable assistance in particular for instrumentation. I
am also very grateful to Jean-Sébastien Vimont and Christophe Chipeaux for their help especially for
implementing the Labview program for data aquisition.
I also thank Prof. Fabrice Ducept, for his help in the interpretation of residence time distribution data.
I am very grateful to Amandine Berthomé and Iris Schmitz, for their contribution to my work during
their student projects. They gave me precious support both for scientific and human issues.
I would like to thank all the members of the GIA/SPAB department at Agroparistech Massy for the
technical support and the good working atmosphere. I would like to especially mention for their help
Aurélien Neveu, Robert Sawka, Monique Belgome, Pablo Granda.
I would like to express my gratitude also to all the PhD students of the GIA/SPAB departement, which
contributed to the good daily atmosphere in these three years: Camille, Emilie, Gilles, Houssem, Imen,
Juan, Marjorie, Mohammed, Nawel, Régis, Reza, Richard, Samir, Souad, Teresa, Thibaud.
I would like to thank all the people in Nestlé PTC of Singen, and in particular Dr. Helge Hulmer for
supervising my work there. Special thanks to Michael Hirt and Pierre Taymans for their technical
support.
I would like to express my gratitude to all my friends, my parents and my family that constantly
supported me even at distance.


RESUME DE THESE
Le séchage par pulvérisation est une technique très utilisée dans l’industrie chimique et
alimentaire pour la production de poudres. Une solution liquide est pulvérisée en fines
gouttelettes (10-50µm), qui sont rapidement séchées par de l’air chaud à l’intérieur d’une
chambre de séchage. Chaque goutte conduit à un grain de poudre, de taille proche de la taille
de la goutte initiale.
Pour améliorer certaines propriétés du produit final – telles que l’écoulement et les propriétés
de dissolution – une étape ultérieure d’agglomération est souvent nécessaire, pour créer des
structures plus larges et poreuses. Cette agglomération peut avoir lieu en forçant des collisions
entre particules soit à l’intérieur de la chambre de séchage, en recyclant les particules sèches
les plus petites (les « fines »), soit dans un lit fluidisé externe ou intégré. Dans tous les cas,
pour que l’agglomération puisse avoir lieu, il est nécessaire que les collisions soient suivies
par l’adhésion entre les particules, dont au moins une doit avoir une surface « collante », puis
par le séchage pour consolider la structure ainsi établie.
La caractérisation de l’état collant des gouttes au cours du séchage en fonction des paramètres
opératoires et de leur position dans la chambre doit permettre une optimisation de l’étape
d’agglomération.
L’étude bibliographique met en évidence que l’état collant de la surface de particules peut être
relié au phénomène de la transition vitreuse. Le séchage par pulvérisation étant un procédé
rapide, la substance à sécher passe de l’état liquide à celui de solide amorphe en passant par
un état caoutchouteux collant pour des températures supérieures et proches de la température
de transition vitreuse. Celles-ci dépendent fortement de la composition du matériau considéré
et de sa teneur en eau. Elles sont notamment fonction de l’activité de l’eau de la particule qui
évolue au cours du séchage. Pour prévoir les propriétés de collage des gouttes qui sèchent, il
est donc nécessaire de connaître l’évolution de leur température et de leur teneur en eau dans
la chambre de séchage. Une mesure directe est très difficile, à cause des difficultés
d’échantillonnage à l’intérieur du séchoir. Mais du fait des échanges de chaleur et de matière
entre les gouttes et l’air de séchage, l’évolution des propriétés de l’air (température et
humidité relative) au cours du séchage est aussi représentative de l’évolution du produit ; l’air
est refroidi et humidifié avec une vitesse dépendant de la vitesse d’évaporation de l’eau des
gouttes.
Cette étude a été réalisée dans un séchoir pilote co-courant (Niro Minor) équipé d’une turbine.
L’objectif de la partie expérimentale était d’obtenir une meilleure compréhension de
l’évolution des propriétés des gouttes tout au long du séchage par pulvérisation, en les reliant
à l’évolution des propriétés de l’air de séchage.
Des solutions aqueuses de maltodextrine DE12 et DE21 ont été choisies comme produits
modèles à sécher (sucres) pouvant présenter un comportement collant lors du séchage.
La chambre de séchage a été équipée de 12 thermocouples pour mesurer la température de
l’air et d’un hygromètre capacitif pour mesurer son humidité relative. A partir de ces deux
mesures, la teneur en eau de l’air à différentes positions dans la chambre a pu être calculée,
ainsi qu’un bilan massique sur l’eau dans l’air, entre l’entrée du séchoir et ces différentes
positions. Avec l’hypothèse que les particules sont entraînées par l’air en suivant la même
trajectoire, il a été possible de déduire la variation de la teneur en eau des particules en train
de sécher dans la chambre.
Des expériences avec pulvérisation d’eau pure ont permis de tester le système de mesure et de
caractériser les pertes thermiques due à l’échange de chaleur entre les parois du séchoir et l’air
ambiant.


L’effet de différents paramètres opératoires (température de l’air d’entrée, débit d’air, débit de
liquide, vitesse de rotation de la turbine) sur le comportement au séchage a été testé. Pour
toutes les conditions testées, la plupart du séchage (>90% d’eau évaporée) a lieu très
rapidement près de l’atomiseur, à cause des fortes différences initiales de température et de
tension de vapeur d’eau entre l’air et les gouttes.
Il faut noter que le capteur d’humidité utilisé était résistant aux hautes températures, mais il ne
garantissait pas une précision suffisante pour les faibles valeurs d’humidité relative. Pour une
température élevée de l’air d’entrée (200°C) et un faible débit liquide (1.8 kg.h-1
), cela se
traduit par une erreur importante sur la détermination de la teneur en eau de l’air, et donc sur
le bilan massique sur l’eau évaporée. Mais dans ces conditions opératoires, le séchage peut de
toute façon être considéré comme terminé dans la partie haute de la chambre près de
l’atomiseur. Les faibles variations de température de l’air relevées entre le haut et le bas de la
chambre sont dues aux pertes thermiques par les parois.
Pour les autres conditions opératoires (faible température de l’air en entrée (144°C), forts
débits de liquide), le séchage se déroule tout au long de la chambre conduisant à une
augmentation de la teneur en eau de l’air avec une diminution de sa température. L’humidité
relative de l’air à la sortie de la chambre est un « indicateur limite » de la teneur en eau et de
l’activité de l’eau de la poudre finale, même si l’équilibre entre l’air et le produit n’est jamais
atteint.
Le séchage des solutions de maltodextrines a été comparé au séchage de l’eau, pris comme
référence. Pour une même quantité d’eau à évaporer dans les mêmes conditions opératoires,
les températures de l’air étaient plus faibles et l’humidité relative plus élevée pendant le
séchage d’eau pure. Ceci est en accord avec le fait que l’évaporation d’eau pure est plus facile
que l’évaporation de l’eau liée en solution. Pour les deux maltodextrines séchées, les
différences dans les propriétés de l’air montrent que le comportement au séchage de la MD21
était plus proche de celui de l’eau par rapport à la MD12. Cela semble être du à la plus faible
viscosité des solutions de MD21, qui facilite la diffusion de l’eau du cœur vers la surface de la
goutte. De plus, une viscosité inférieure peut provoquer la formation d’un plus grand nombre
de gouttes de taille plus faible lors de l’atomisation, conduisant à une surface d’échange totale
des gouttes plus grande et donc à un séchage initial plus rapide. La faible variation de taille
n’a pas pu être observée lors des essais.
La teneur en eau moyenne de la poudre dans la chambre calculée à partir des bilans massiques
sur l’eau dans l’air a été combinée avec les températures de transition vitreuse Tg et les
isothermes de sorption pour le produit considéré. De cette manière, des conditions opératoires
et des positions dans la chambre pour lesquelles les particules pourraient être collantes ont été
déterminées.
Des études précédentes ont montré que les particules de maltodextrine sont considérées
comme collantes quand leur température de surface est comprise entre Tg et une température
Ts de 20 à 30°C supérieure. Dans ce domaine, le matériau atteint des valeurs de viscosités
favorables à la formation de ponts (liquides et solides) avec d’autres particules. En dessous de
la transition vitreuse, les particules sont considérées comme sèches, et au dessus de la Ts
comme liquides non collantes.
Dans toutes les conditions testées, la maltodextrine DE12 a été rapidement séchée jusqu’à
atteindre des valeurs de teneur en eau et d’activité de l’eau en-dessous de la transition
vitreuse. Le comportement collant est dans ce cas envisageable seulement tout près de
l’atomiseur. La maltodextrine DE21 présentant des températures de transition vitreuse plus
faibles à cause de son poids moléculaire inférieur, conduit à des propriétés collantes plus
longtemps au cours du séchage dans la chambre.


La simulation numérique du procédé de séchage a aussi été utilisée dans le but de prévoir le
comportement collant des gouttes. L’étude bibliographique a montré que des modèles de
dynamique des fluides numérique (CFD) sont nécessaires pour obtenir une simulation
complète du procédé. Un modèle simplifié de CFD a été appliqué pour obtenir des
informations complémentaires sur les trajectoires de l’air et des particules dans la chambre, en
mettant en évidence des zones de recirculation de l’air. L’évolution des caractéristiques des
particules a aussi pu être calculée.
Par rapport aux modèles classiques, la diffusion de l’eau dans la matrice solide n’a pas été
directement calculée. La plus faible vitesse d’évaporation de l’eau liée en solution par rapport
à l’eau pure a été prise en compte en considérant une pression de vapeur d’eau réduite pour la
goutte de solution. Un coefficient de réduction (<1) a été identifié à partir des mesures
expérimentales de la température et de l’humidité de l’air pendant le séchage d’eau libre et
d’eau liée en solution. Ce coefficient est différent pour les deux maltodextrines DE12 et
DE21. L’évolution de la teneur en eau des particules calculée est en accord avec les résultats
expérimentaux.
L’avantage principal de cette approche est qu’elle peut être appliquée directement à d’autres
produits, car la composition du liquide à sécher et la diffusion de l’eau dans la matrice ne sont
pas considérées directement. Cependant, les différences entre le cœur et la surface ne sont pas
prises en compte, et les propriétés de surface ne sont pas parfaitement décrites. En particulier,
la température de la particule est surestimée dans le calcul.
Des zones où les particules de MD12 et MD21 pourraient être collantes dans la chambre ont
été identifiées avec le modèle, et se sont avérées en accord avec les résultats expérimentaux.
La simulation CFD représente un outil efficace pour une prévision qualitative de l’effet des
paramètres du procédé sur le comportement collant des particules.
Les régions collantes ainsi localisées dans la chambre de séchage ont été exploitées pour
effectuer des tests d’agglomération par introduction de poudre. Un système d’insertion de
poudre a été spécifiquement développé pour pouvoir reinsérer une partie de la poudre produite
à différentes positions dans la chambre. Les collisions entre la poudre insérée et les particules
collantes en train de sécher (diamètres moyens < 30 µm) ont provoqué la formation d’une
fraction de particules ayant un diamètre supérieur à 100 µm, avec des propriétés de
mouillabilité et d’écoulement améliorées.
Cette augmentation de taille a permis de valider la prévision du comportement collant dans
une grande partie de la chambre pour la MD21, tandis qu’aucune agglomération n’a eu lieu
pour MD12, comme prévu.
Pour la maltodextrine MD21, il a été possible de mettre en évidence le fait qu’une plus grande
fraction de poudre agglomérée a été obtenue en introduisant la poudre non pas
immédiatement près de l’atomiseur, pratique usuelle dans l’industrie, mais plus loin dans la
chambre. Les fines sont généralement introduites prés de l’atomiseur à cause de la forte
densité de gouttes dans cette zone, avec une plus grande probabilité de collisions. Mais les
gouttes étant liquides, des collisions avec des particules de poudre à cet endroit provoquent
plutôt l’enrobage ou la coalescence, avec une faible augmentation de taille. Les particules
doivent recirculer plusieurs fois si un grossissement est demandé, avec des conséquences
négatives possibles sur la qualité du produit final.
L’insertion de poudre dans le haut de la chambre « loin » (10cm) de l’atomiseur et au milieu
de la chambre a permis d’obtenir jusqu’à 16% de poudre avec un diamètre supérieur à 100µm.
L’estimation du comportement collant des particules à partir de mesures sur l’air et des
propriétés des matériaux pourrait donc permettre d’optimiser le choix de la position
d’insertion de la poudre en fonction des propriétés recherchées pour le produit final.
Le dispositif expérimental d’insertion de poudre devrait être amélioré pour permettre une
insertion symétrique et sélective des fines particules, après séparation de la fraction déjà


agglomérée. De plus, l’insertion d’une poudre différente de celle produite pourrait être
envisagée.
La démarche expérimentale développée dans cette thèse a finalement été appliquée à un
séchoir semi-industriel équipé d’une buse bifluide de pulvérisation, d’un retour de fines et
d’un lit fluidisé interne. Les mesures sur l’air dans la chambre ont permis de mieux
comprendre l’évolution du séchage d’un hydrolysat de protéines, et les propriétés de ce
matériau (isotherme de sorption, température de transition vitreuse) ont été déterminées pour
aider à l’interprétation des résultats.
L’étude a confirmé que l’insertion des fines sèches près de l’atomiseur (gouttes liquides) avait
comme fonction principale d’améliorer le séchage en diminuant la teneur en eau initiale des
gouttes pulvérisées. L’augmentation de taille (agglomération) a plutôt lieu à l’intérieur du lit
fluidisé intégré, les particules pouvant arriver à l’équilibre avec l’air à cause du temps de
séjour élevé. En contrôlant les températures dans la chambre à différentes positions il est
possible de prévoir les propriétés de la poudre, et notamment de provoquer un état collant
favorable à l’agglomération
Cette application a mis aussi en évidence des limites qui doivent être prises en compte. En
premier lieu, la détermination exacte des débits d’air entrants est fondamentale pour la
résolution correcte des bilans massiques et thermiques. Dans notre cas seul le débit d’air de
séchage en entrée était mesuré. Il faudrait tenir compte des débits d’air secondaires tels que
l’air comprimé (froid) de retour des fines, l’air du lit fluidisé et de la buse de pulvérisation
conduisant à un débit total en sortie (non mesuré) différent du débit d’entrée.
De plus, en fonction de la géométrie du séchoir, des recirculations d’air peuvent avoir lieu
dans la chambre. La connaissance des écoulements de l’air est en particulier importante pour
choisir les positions des capteurs (T, RH) dans la chambre, et pour l’interprétation des
résultats. Des mesures de vitesse d’air à différentes positions et la simulation numérique CFD
proposée pourraient être utilisées pour calculer et prédire les trajectoires de l’air, pour une
meilleure maîtrise du séchage dans un équipement donné.
Ce travail de thèse a été réalisé sur le site de Massy de Agroparistech, financé par le 6ème
programme cadre de l’Union Européenne dans le cadre du projet Biopowders du réseau
« Marie Curie Research training network ». Les essais industriels ont été réalisés au PTC de
Nestlé à Singen (Allemagne).


TABLE OF CONTENTS
INTRODUCTION 1
PART I – BIBLIOGRAPHY 5
1. The spray drying process: from liquid to powder 1.1. Bases of spray drying
1.2. Which characteristics for powders ?
1.2.1. Powder water content and water activity
1.2.2. Density
1.2.3. Flowability and instant properties
2. Drying of liquid drops 2.1. Atomization of liquid feed in drops
2.1.1. Rotary atomizer
2.1.2. Pressure nozzle
2.1.3. Pneumatic nozzle
2.1.4. Sonic nozzle
2.2. Drying of drops in air
2.2.1. Evolution of air properties along drying (Mollier diagram)
2.2.2. Drying rate: heat and mass transfer equations
2.2.3. Evolution of drops properties along drying
2.2.4. Configuration for air/drops contact
3. Particle sticky behaviour along spray drying 3.1. The glass transition phenomenon in drying
3.2. Characterization of stickiness of powders
3.2.1. Methods using powder “in bulk”
3.2.2. Methods using drying drops or fluidized particles
4. Agglomeration and spray drying process 4.1. Agglomerates: structure and formation
4.2. Equipments for spray drying and agglomeration
4.2.1. Multistage spray drying
4.2.2. Fines return
5. Process control for spray drying 5.1. Energetic considerations in spray drying
5.2. Measurements on air and product
5.3. Control
6. Modeling of spray drying and agglomeration 6.1. Principle
6.2. CFD models of spray drying
6.2.1. Simulation of turbulence
6.2.2. Simulation of drop transport
6.2.3. Drying kinetics of drops
6.3. Simulation of agglomeration
6.3.1. Collisions between particles
6.3.2. Collision result
6.4. Conclusion on CFD simulation of spray dying and agglomeration
Conclusion


PART II – MATHERIALS AND METHODS 64
1. Products 1.1. Maltodextrin solutions
1.2. Protein hydrolysate aqueous solution
2. Equipments and instrumentation 2.1. Niro Minor spray dryer
2.2. Niro FSD 4.0 spray dryer
3. Measurements on liquid feed, air and products 3.1. Measurements on liquid feed solutions
3.2. Measurements on air
3.2.1. Air flow rate
3.2.2. Air temperature
3.2.3. Air relative humidity
3.3. Measurements on powders
3.3.1. Water content
3.3.2. Water activity
3.3.3. Powder size distribution
3.3.4. Sorption isotherms and glass transition
3.3.5. Wettability
3.3.6. Bulk and tapped density
3.3.7 SEM microscopy
3.3.8. Conductivity of solutions for DTS measurements
3.3.9. Colour
4. Conditions of spray drying trials 4.1. Trials in Niro Minor
4.2. Trials in Niro FSD 4.0.
4.3. Residence time distribution measurements in Niro Minor
PART III – Results and discussion
1. Definition of process operating conditions 85 1.1. Measurements on air without liquid atomization
1.1.1. Heating of the chamber
1.1.2. Determination of heat losses
1.2. Water spray drying
1.2.1. Time to reach steady state inside the chamber
1.2.2. Positions for air properties measurements
1.2.3. Choice of operating parameters
1.2.4. Mass and heat balances on drying air
1.2.5. Estimation of possible secondary ambient air flow rate
1.3. Operating conditions for maltodextrin solutions drying
1.3.1. Choice of maltodextrin solution flow rates
1.3.2. Residence time distribution inside Niro Minor
Conclusion
2. Drying behaviour and stickiness development for maltodextrin solutions 102 2.1. Drying of maltodextrin DE12 solutions and comparison with water
2.1.1. Considerations on drying behavior of water and maltodextrin solutions
2.1.2. Effect of process parameters on spray drying behavior of liquid solutions
2.2. Comparison between MD21, MD12 and water drying behavior
2.3. Stickiness of maltodextrin DE12 and DE21 particles along spray drying


Conclusion
3. Spray drying CFD simulation 119 3.1. The model
3.1.1. Equations for continuous phase: air
3.1.2. Equations for the discrete phase: drops/particles
3.1.3. Definition of the dryer geometry
3.1.4. Boundary conditions
3.1.5. Numerical solution
3.2. Determination of simulation parameters
3.2.1. Validation of the global heat transfer coefficient h and TIN, with water drying
3.2.2. Sensibility to inlet air turbulence intensity and grid size effect
3.2.3. Sensibility to initial drop diameter
3.2.4. Effect of drop vapour pressure Pv
3.3. Application of simulation
3.3.1. Model validation
3.3.2. Continuous phase at steady state: air
3.3.3. Discrete phase at steady state: drying particles
3.4. Determination of powder stickiness inside the chamber
3.4.1. Effect of liquid feed flow rate on particle stickiness for MD12,and MD21
3.4.2. Effect of inlet air temperature
Conclusion
4. Powder insertion inside Niro Minor to perform agglomeration 149 4.1. Theoretical considerations: factors affecting agglomeration inside spray dryer
4.1.1. Stickiness of colliding particles
4.1.2. Collision probability between drying particles and inserted particles
4.1.3. Force of the impact between particles
4.2. Powder insertion system
4.2.1. Design of powder insertion device
4.2.2. Choice of insertion positions and powder jet shape
4.2.3. Choice of operating conditions
4.3. Results of powder insertion trials
4.3.1. Discussion on obtained agglomeration
Conclusion
5. Industrial application: spray drying of protein hydrolysate 151 5.1. General conditions of trials
5.2. Water trials without fluid bed: drying behavior and measurements feasibility
5.3. Protein hydrolysate solution drying trials feasibility
5.3.1. Drying trials for TIN 180°C
5.3.2. Effect of inlet air temperature (160°C and 200°C)
5.4. Discussion about the drying behavior, the role of fines return and fluid bed during protein
hydrolysate solution spray drying
5.4.1. Spray drying behavior: air properties evolution inside the chamber
5.4.2. Position of fines return (top and bottom)
5.4.2. Role of the fluid bed (with top fines return)
CONCLUSION 178
LIST OF SYMBOLS 185
REFERENCES 187 ANNEX I Modeling of residence time distribution function in Niro Minor
ANNEX II Properties of air and water for CFD simulation
ANNEX III Articles, congresses, industrial visits


1
Introduction
Powders exist in a wide variety of industries as chemicals, pharmaceutics, cosmetics,
agriculture and food, like plastics beads, ceramic materials, detergents, fertilizers or
medecines.
In food industry powders represent stable dried products, ingredients, with a reduced
weight and volume for transport, able to be designed for easy dosage and dissolution,
while retaining nutritional and functional properties. Food powders may be added
directly to a dish in a small quantity (salt, pepper, spices, sugar, aromas), or may be
consumed or processed with other constituents in a solvent (water, milk, oil). Examples
of powders include milk and derivatives, flour, cocoa, sugar, coffee, soup, vegetables,
meat, fish, sauce mix, vending machine powders and ingredients (colourings, enzymes,
yeasts).
Depending on the desired end-use, specific properties of individual particles are required
with or without interaction with other particles (e.g. for powders mixing), or with solvent
(e.g. instant dissolution); and the whole powder should behave as a “fluid” for easy
transport and dosage. In some cases specific shape and surface of particles could be
requested for improving the aspect (coating) and the attractiveness of a commercial
product.
Several processes are used for production of powders like crystallisation, precipitation,
freeze drying, extrusion, milling, roller or spray drying. They differ mainly by the
material to transform, by the operating conditions and the energy to use (heating,
cooling, mechanical forces), and by the characteristics of the final product (size, shape,
crystallized or amorphous structure, solubility, stability...). A final drying step is often
required to control the required powder properties. For powder utilisation, one important
step will be (very often) to be disintegrated again in a solvent either in a preliminary
mixture or directly as a food substance.
Whatever the user, an industrial or a consumer, one of the main properties will be the
ability of powder to be dosed and to dissolve. Besides adapted composition, that means a
good flowability without interaction between particles (no sticking, smooth surface) and
a structure favourable to the penetration of solvent. Individual particles aggregated in
solid agglomerates have shown such properties and the spray drying process coupled
with fluidised bed was adapted to produce such agglomeration.
Spray drying is a continuous process which transforms a concentrated liquid in a powder,
limiting the possible modifications of composition during the process. The industrial
equipments are usually high towers more or less sophisticated, with high powder flow
rates and consumption of air and energy. Some are dedicated, others are flexible and
used for different products.
The principle is to atomize the liquid feed (solution, suspension or emulsion) in small
drops (10-20 µm) to increase the surface of exchange with the drying agent, usually
(constituted by) hot air. Each drop is quickly dried (by air), until obtaining a solid dry
particle, with size close to the initial liquid drop size.
The composition of the powder depends on the initial liquid composition, which may be
modified along drying. The particles obtained from a simple spray drying step are small,
with a wide size distribution. The presence of very fine particles (called “fines”) is
generally unwanted as it may represent risks for the environment (dust formation,
explosions), it can lead to product losses and could have a negative effect on physical
properties like solubility in water. These fines are usually reused either by return inside
the drying chamber to collide with the drying drops, or in a fluidised bed internal or
external to the dryer, to improve the drying process, and sometimes for further

2
3
agglomeration. That step will lead to final particles with shape, size and properties
modified according to the process used.
Finally the powder will be transported, stored in bags, in packages, avoiding if possible
any modification of properties of the dry product. Hygroscopic components should be
maintained in an atmosphere avoiding caking and variation of water content; and
mechanical resistance will be good enough to resist shocks able to destroy the structure,
producing again fines.
This study on spray drying process has for objectives to understand the evolution of drop
drying with hot air inside a pilot equipment, by linking the evolution of drops properties
(temperature, water content) to the evolution of drying air properties (temperature,
relative humidity) along the process.
The final goal should be to be able to determine process conditions that could lead to a
controlled agglomeration inside the chamber, avoiding or minimizing the production of
fines and their recirculation, leading inside the process itself to particles with desired
properties, especially size and solubility.

4

PART I
BIBLIOGRAPHIC STUDY


Part I – Bibliographic study
5
1.1. Bases of spray drying
The spray drying process transforms a pumpable liquid into a powder, i.e. individual dry solid
particles. The liquid feed is made of a solvent, usually water, and constituents which are
soluble (solution) and/or insoluble (emulsion, suspension). Soluble components correspond to
short or long chain polymers (polysaccharides, proteins,...) and to small molecules as salts.
The dry particles will be made of these dry constituents with still some traces of water (or
solvent). So, to get a powder state it is necessary to remove, to extract, to evaporate water
which is more or less strongly linked, adsorbed onto constituents, in pores, which means
using special drying conditions (Bimbenet and Dumoulin, 1999).
In spray drying, a gas, usually hot air, is used to bring to the liquid the energy for evaporation
of water and to transport the water vapour. The liquid flow (thickness) is first reduced by
forming a thin film that is then broken in small drops to increase the exchange surface and to
improve the heat and mass transfers with hot air. The transfer coefficients are also enhanced
by creating a turbulent air flow around the liquid drops.
These conditions lead to some important parameters to take into consideration:
• The time necessary to effectively realize the drying till obtaining a dry particle must
be minimized. That means an optimized air/drop contact and a limited (reduced)
quantity of water to extract: the liquid must be previously concentrated.
• The formation of a film of liquid then its breakage in drops (atomization) with a
regular size and shape to control the drying process must be facilitated: choice of the
atomization device, physical properties of the liquid feed (viscosity, surface tension).
Anyway, the size of drops must be small for easy drying but not too small to obtain
powder easy to handle and to use afterwards.
• The temperature of drying air must be high compared to the liquid one to accelerate
the initial transfer of water from drop to air; but maintaining the product at a
reasonable temperature during a short time to avoid deterioration: the spray drying
process must be a fast drying process.
Therefore, the spray drying process is a continuous process with three main operations:
• The atomization of a well formulated liquid feed, to produce a continuous spray of
drops (some microns), with a great surface of exchange with drying .
• The drying of liquid drops due to an efficient contact between drops and moving hot
air. The liquid solvent (water) is evaporated from the drop surface till obtaining a dry
particle. The circulation of air and the transport of particles need a space and
distance/time provided by the geometry of the drying chamber.
• The separation of the final dry powder from cooled and humidified air, and its
recovery with possible further processing to modify powder properties.
A possible spray drying installation is shown on Figure 1.1. (Pisecky, 1997) with the drying
chamber (1), the hot air inlet (2), the atomizer (3) connected to liquid feed, and the powder
recovery system (4), with possible cyclone separation (5) of small light particles (fines)
carried away by exhausted air. In industry recovered fines are usually returned to the drying
chamber or to a fluid bed to help to achieve drying or to form agglomerates, and to reduce
product losses.

Part I – Bibliographic study
6
1 Drying chamber
2 Hot air inlet
3 Atomizer
4 Powder recovery
5 Cyclone (fines separation)Inlet air
Liquid
feed
Air
heating
Exit air
Powder
Fines
4
5
1 Drying chamber
2 Hot air inlet
3 Atomizer
4 Powder recovery
5 Cyclone (fines separation)Inlet air
Liquid
feed
Air
heating
Exit air
Powder
Fines
Inlet air
Liquid
feed
Air
heating
Exit air
Powder
Fines
4
5
Figure 1.1. Flowsheet of a typical spray drying installation (adapted from Pisecky, 1997).
CONDITIONS OF DRYING AIR
Inlet temperature TIN
Outlet temperature TOUT
Absolute humidity YIN
Flow rate mair
DRYING EQUIPMENT
Chamber geometry
Single/multi stage dryer
CONDITIONS OF LIQUID FEED
Pretreatment
Inlet temperature
Composition
Homogenization
Total solids content
Feed viscosity µ
Feed surface tension σ
Droplet size and
size distribution
Powder water content X
and water activity aw
ATOMIZATION
Wheel speed or nozzle pressure
CONDITIONS OF DRYING AIR
Inlet temperature TIN
Outlet temperature TOUT
Absolute humidity YIN
Flow rate mair
DRYING EQUIPMENT
Chamber geometry
Single/multi stage dryer
CONDITIONS OF LIQUID FEED
Pretreatment
Inlet temperature
Composition
Homogenization
Total solids content
Feed viscosity µ
Feed surface tension σ
Droplet size and
size distribution
Powder water content X
and water activity aw
Powder water content X
and water activity aw
ATOMIZATION
Wheel speed or nozzle pressure
Figure 1.2. Factors affecting final moisture content of spray dried powders.

Part I – Bibliographic study
7
1.2. Which characteristics for powders?
The main characteristics of final spray dried powders are related to end-use properties: water
content and water activity for stability, size and size distribution for powder mixing and
handling, bulk density and flowability for transportation, and wettability and dispersibility for
instant properties (Huntington, 2004; Melcion et al., 2003; Aguilera, 2008).
The initial composition of the liquid feed has an influence on both drying and powder
rehydration, and also on the final repartition of components into particles or on the surface
(i.e. fat for flowability). Therefore the initial liquid composition is closely in relation with the
powder properties (Shrestha et al., 2008; Adhikari et al., 2004; Goula et al., 2008).
1.2.1. Powder water content and water activity Water content X is generally expressed on dry basis (kg water.kg
-1 total solids), total solids
(dry matter) being constant during drying process (if no losses). But, it may also be expressed
on wet basis Xwet as a function of total weight (evolving during drying).
Water content of a commercial product is often the most important specification for industrial
powders. It is often fixed by the maximal value allowed by the law (e.g. 3% or inferior to
3%), to avoid reduction of shelf life due to biochemical reactions and development of
bacterial activity. From an economic point of view, it is convenient to operate close to the
allowed limit, because each percent of humidity to remove could represent an important
energy cost on year basis. Spray dried powders water content is affected by several factors
including properties of liquid feed (concentration, temperature, viscosity, surface tension),
type of atomizer (nozzle or rotary), type of spray dryer and drying air characteristics (flow
rate, inlet and exit temperature, relative humidity) (Fig. 1.2).
The water contained in a substance is more or less interacting with the constituents (solutes,
hydrates…). The level of interaction of water with dry matter is expressed by the water
activity aw, defined as the ratio between the water vapour pressure of the humid product and
the saturated vapour pressure of pure water at the considered temperature.
eq. 1.1
A low water activity value will be associated with water strongly bound with dry matter (last
traces of water) or in pores, corresponding to a low water vapour pressure Pv(T). If a product
is in equilibrium with a gas atmosphere (air) in a close vessel, product and air temperatures
are the same and product aw is equal to air relative humidity. This equilibrium is characterized
by the sorption isotherms, which represent aw variation as a function of water content X of the
product for a given temperature (each point representing an equilibrium state) (Labuza, 1968;
Mathlouthi and Rogé, 2003). Sorption isotherms depend on temperature, but slightly for the
range of temperature (20 – 40°C) and for the polysaccharides used in this study. Usually they
are established by water sorption on the dry product and hysteresis exists between absorption
and desorption (Fig. 1.3). To notice that the drying process is a water desorption process, and
the equilibrium between air and product represents a limit.
(T)P
(T)Pa
sat
w
v
w =

Part I – Bibliographic study
8
Sorption
T
Desorption (drying)
T1
T2
Sorption
T
Desorption (drying)
T1
T2
Figure 1.3. Sorption and desorption isotherms.
Figure 1.4. Bacterial growth and undesired reactions rate in food powders
as a function of product water activity (from Bhandari and Hartel, 2005).

Part I – Bibliographic study
9
Sorption isotherm can be modelled with the Guggenheim-Anderson-de Boer (GAB) or the
Brunauer-Emmet-Teller (BET) equations (Bimbenet et al., 2002):
GAB equation eq. 1.2
BET equation eq. 1.3
C, D, xm and CGAB are empirical regression parameters
One of the goals of drying is to lower aw below a critical value to obtain a stable powder,
avoiding growth of micro-organisms and development of unwanted reactions (Fig. 1.4). But
water activity is also in relation with glass transition phenomena and sticky properties of
products. Stickiness during drying and/or caking during storage can occur for some powders
made of potentially sticky components (e.g. sugars), for specific conditions of temperature
and humidity (Shrestha et al., 2007a,b,c).
1.2.2. Density Powder density is generally described by the bulk density ρbulk (kg.m
-3), defined as the ratio
between the mass of many particles of the material and the total (bulk) volume they occupy.
The total volume includes individual particles volume, inter-particle voids volume and
internal pores volume. It represents an important property for powder handling, for marketing
and economics, even if the different needs can be in contrast between them. As an example, a
high bulk density is required for reducing transportation costs that depend on total volume.
But a low bulk density may correspond to a more attractive product with improved instant
properties (Pisecky, 1997).
Bulk density is not an intrinsic property of a material; it can change depending on how the
material is handled. For this reason, the bulk density of powders is usually reported both as
"freely settled" and "tapped" density. The tapped density refers to the bulk density of the
powder after a specified compaction process, usually involving controlled vibration of the
container (in relation with transportation, shocks of packages).
Bulk density depends on the density ρs of the solid composing the powder, on air volume
inside the particles (occluded and in open pores) and on the shape of the particles that
influences the amount of interstitial air between the particles. A regular spherical particle
shape minimizes the amount of interstitial air. Controlling the amount of occluded air could
lead to a higher or lower bulk density. For example, stirring of the liquid feed solution may
result in the creation of air bubbles inside the liquid, then in the drops and in final powder
particles.
A lower bulk density is usually obtained with particles agglomeration. By assembling several
small particles with solid bridges, a porous structure is formed (agglomerate) with voids
between particles, increasing the mean size, decreasing the fines proportion, and leading to
specific instant properties.
1.2.3. Flowability and instant properties Flowability is defined as the ability of a powder to exhibit a free-flow behaviour. Good
flowability of final powders is required for easy transportation in pipes (i.e. to fill packages)
and for various uses like in vending machines. Several factors affect powder flowability, like
size, shape and composition of the surface of the particles (Teunou et al., 1999; Fitzpatrick et
al., 2004). Large mean particle size, narrow particle size distribution, spherical shape and
smooth surfaces with no sticky or fat components contribute to a better flowability.
)a1)(C(1)a(1
aCxX
wGABw
wGABm
⋅−+⋅−
⋅⋅=
)a1)(C(1)a(1
aC
D
X
ww
w
⋅−+⋅−
⋅=

Part I – Bibliographic study
10
Table 1.1. Total spray exchange surface depending on drops diameter for a fixed sprayed liquid
volume of 1 m3 (Mujumdar, 1995).
Total
Volume
(m2)
Droplet
diameter
(m)
Number of
droplets
Droplet surface Adrop
(m2)
Total spray surface
Atot
(m2)
1 1.234 1 3.14 3.14
1 1 x 10⁻²
(1cm) 1.986 x 10⁶
3.14 x 10⁻⁴
623.6
1 1 x 10⁻³
(1mm) 1.986 x 10⁹ 3.14 x 10
-6 6236
1 1 x 10⁻⁴
(100µm) 1.986 x 10¹²
3.14 x 10⁻⁸
62360
1 1 x 10⁻⁵
(10µm) 1.986 x 10¹⁵
3.14 x 10⁻¹⁰
623600

Part I – Bibliographic study
11
Food powders are often reconstituted as liquid solutions (emulsions, suspensions) by adding
water (or a liquid, e.g. milk). If the result is an homogeneous liquid obtained rapidly without
unsolved lumps, the powder has a good instant behaviour. The particles size, porosity,
composition and the presence of some components (hydrophobe) on the surface will play an
important role in the behaviour of the powder during reconstitution.
The instant properties are described as sinkability, wettability, dispersibility and solubility
(Schubert, 1993; Fang et al., 2008). The sinkability expresses how particles penetrate the
liquid surface. The wettability determines the time necessary for liquid penetration in the
porous structure of powder, thanks to capillarity; it is often the rate determining step.
Wettability is measured as the wetting time of a fixed amount of powder in contact with a
water surface, till the last particles of powder penetrate the water surface. A quick wetting is
enhanced by a good porosity of powder.
Particle size is another parameter: for example, for milk powders particles diameter should be
between 200 and 300 µm, with fines (d < 100 µm) fraction lower than 20%. Too small
particles are difficult to wet due to high surface tension of liquid compared to particles weight
(Pisecky, 1997).
Dispersibility is the aptitude for the powder to be re-distributed as single particles in the
reconstituting liquid. Solubility refers to the rate and extent to which the components of the
powder particles dissolve in the liquid.
Dispersibility and solubility determine if the powder is completely dissolved or not, by
evaluation of powder residuals observed in the liquid solution after filtration. The percent of
dissolved powder compared to the total solids concentration give a dispersibility index
(Pisecky, 1997).
To improve instant properties of spray dried powders, an agglomeration step is often
performed (Buffo et al., 2002).
2. Drying of liquid drops
The atomization of liquid into drops is the first step of the spray drying process. It determines
the size and drying behavior of drops, influencing the final powder properties (Hecht and
King, 2000; Horvat et al., 2002; Wu and Liu, 2002; Walton and Mumford, 1999; Xiao et al.,
2008). The liquid feed is a solution (or emulsion, suspension), usually concentrated by
evaporation before spray drying to eliminate most of the water easily removable by an
economical operation.
The complex formulation of the liquid feed solution is studied as a function of the aptitude of
components to dry to obtain the desired composition of the final powder. The dry matter
content is limited by the possibility of pumping the solution to the atomizer (viscosity,
temperature).
2.1. Atomization of liquid feed in drops
The principle of atomization consists in giving energy to the liquid to form a thin liquid film
and to break it in a large number of drops to increase the exchange surface available for heat
and mass transfers with drying air. By decreasing the drop size from 1 mm to 10 µm, the total
spray surface is multiplied by 100 (Table 1.1).

Part I – Bibliographic study
12
Figure 1.5. Rotary atomizer with (a) straight radial vanes, with (b) curved vanes and with (c)
bushings (adapted from Pisecky, 1997).
(a) (b)(a) (b)
Figure 1.6. Spray from a rotary atomizer (a) and mechanisms
of drop formation (b) (www.niro.com; Masters, 1985).

Part I – Bibliographic study
13
The minimal energy PK needed to form the new exchange surface Atot can be expressed as PK
= Atot.σ (with σ surface tension of liquid (N.m-1
)) (Masters, 1985). Due to the energy losses,
this minimal energy is only a part of the total energy used by the atomizer.
The type of energy transferred to the liquid to break it in drops is used to classify the
atomizers: rotary atomizer with centrifugal energy, pressure nozzle with pressure energy, and
pneumatic nozzle with kinetic energy.
2.1.1. Rotary atomizer A rotary (or wheel) atomizer consists of two circular plates (top and bottom) with radial vanes
(straight or curved) or bushings between them (Fig. 1.5). The liquid feed enters in the centre,
accelerates across the vanes forming a thin film of liquid that is ejected at the wheel
peripheral speed and readily disintegrates into droplets forming a wide jet with an “umbrella”
shape; initial trajectory is almost horizontal (Fig. 1.6). Typical peripheral speed for rotary
atomizers varies from 100 to 200 m.s-1
. The rotary atomizer can be moved by compressed air
(pilot equipments) or by an electrical engine.
The characteristics of the liquid spray depend on the peripheral speed and geometry of the
rotary atomizer, on the flow rate and physical properties of liquid (King et al., 1984).
Size and size distribution of final powder depend on the initial droplets size distribution. The
Sauter mean diameter d3,2, defined as the ratio of the total droplets volume to the total droplets
surface, is often used to characterize particle and drop average size. For rotary atomizers, the
following empirical correlations are proposed (Masters, 1985; Mujumdar, 1995):
1.0
2
l
3
v
30.2
l
v
0.6
2
v
l3,2
m
Nρbσ
m
bµN
rNρbN
m0.4
r
d
⋅⋅⋅⋅
⋅⋅⋅
⋅⋅⋅⋅=
&&
& eq. 1.4
0.1
v
l
0.30.6
3,2bN
σ
2rρ
mµ
ρ
1
N
10.241d
⋅
⋅=
& eq. 1.5
0.390.21
l
0.533
3,2 (2r)mN101.62d −−− ⋅⋅⋅⋅= & eq. 1.6
d3,2 mean Sauter diameter of drops (m) = (droplets volume)/(droplets surface), lm& liquid flow rate (kg.s
-1), N
rotary speed of disk (rpm), r diameter of disk (m), b height of vanes (m), Nv number of vanes, ρ density of liquid
(kg.m-3
), σ surface tension of liquid (N.m-1
) and µ viscosity of liquid (Pa.s)
The last equation can be used when the physical properties of the liquid are not known. And
to apply these correlations to non-newtonian fluids, the dynamic viscosity must be substituted
by the apparent viscosity of the fluid.
These empirical correlations can be applied to all types of rotary atomizer to estimate the drop
size with a precision of ± 30%. To determine the drop size and size distribution for a given
atomizer - requested for example for a numerical simulation of the process – a specific
correlation may be developed or a direct measuring technique should be used.
Non-intrusive laser techniques like PDA (Phase Doppler Anemometry) could allow direct
measurement of the drop size distribution and velocity at the exit of atomizer assuming that
the droplets are spherical (Albrecht, 2003). However, use of PDA is difficult for rotary
atomizers due to the wide shape of the liquid spray. Other mechanical, electrical and optical
measuring methods are listed by Dodge (1987).

Part I – Bibliographic study
14
Figure 1.7. Pressure nozzle (adapted from Pisecky, 1997).
Liquid
feed
Liquid
feed
Air
Air
(a) (b)
Liquid
feed
Liquid
feed
Air
Air
(a) (b)
Figure 1.8. Two-fluid nozzle with (a) internal air/liquid mixing
and (b) external mixing (adapted from Pisecky, 1997).
Table 1.2. Typical droplet size, maximum liquid feed flow rate and energy consumption
of several kinds of atomizers (Mujumdar, 1995).
Atomizer
Range of
drop size
(µm)
Liquid flow
rate
(kg.h-1
)
Energy consumption
(kJ for 1000 kg.h-1
)
Rotary wheel 1-600 < 2000 25.0
Pressure nozzle 10-800 < 100 2.5
(3-5 MPa)
Pneumatic nozzle 5-300 < 1000 40.0
(air 0.3 MPa; 0.5-0.6 m3.kg
-1)
Sonic nozzle 5-1000 - -

Part I – Bibliographic study
15
By controlling the wheel velocity, it is possible to change the drops size distribution. In
comparison with other atomizing devices, the wheel atomizer is more flexible because it can
operate with different liquid flow rates without big modifications in droplets size and it is able
to operate with higher feed viscosity (or concentration) and with liquid feed containing
possibly abrasive solids. Finally, high capacities (Table 1.2) can be handled by a single rotary
atomizer.
As a disadvantage, the energetic cost is higher than for pressure nozzles. Furthermore, the
drying chamber must have a large diameter to avoid collisions between the radially ejected
drops and the walls of the chamber.
Another possible problem may appear due to the aspiration of air by the rotating wheel (like a
fan). This air can be incorporated into the droplets, and modify final properties of the powder
like density. If this effect is unwanted, it is better to use the configuration with curved vanes,
which reduces the air aspiration effect.
2.1.2. Pressure nozzle With a pressure nozzle (Fig. 1.7) the spray is created by the conversion of the pressure energy
applied to the liquid into kinetic energy giving, at the same time, a rotary motion to the thin
liquid film.
The liquid is forced through an orifice by a high pressure pump (5-7 MPa). It enters
tangentially in the nozzle and exits from the orifice (diameter = 0.4 to 4 mm) forming a cone
having an angle in the range of 40°-140°.
The pressure nozzle leads to the formation of a spray more homogeneous in terms of drop size
distribution than the one produced by a rotary atomizer. The applied pressure influences the
angle of the cone and the drops size, which can be estimated with empirical correlations like
the following (Mujumdar, 1995):
[ ]
−⋅−+−⋅= 1
AX
or3,2 3)v10(3.13v
39exp0.172)d10(2.54286d eq.1.7
d3,2 mean Sauter diameter of drops (m), d diameter of the orifice, v1 inlet air velocity (m.s-1
), vax axial air
velocity (m.s-1).
Other correlations are proposed by Masters (1985), Lefebvre (1989) and Kim and Marshall
(1971). A single pressure nozzle can atomize a liquid flow rate up to 100 kg.h-1
. For this
reason several nozzles are normally used inside industrial spray drying towers. In that case the
collisions between the drops of the different sprays formed by each nozzle can lead to
coalescence or agglomeration, with an influence on the final powder properties.
The main differences between pressure nozzle and rotary atomizers consist in the formation of
air-free droplets, in the possibility of directing the spray of different nozzles in order to obtain
or to avoid collisions between drops and in the smaller diameter of the chamber due to the
more compact shape of the spray. Furthermore, the nozzle has a lower investment cost and the
maintenance is easier due to the absence of moving parts.
As disadvantage for nozzles, varying the liquid flow rate modifies the characteristics of the
spray: a higher flow rate leads to higher velocity with formation of smaller drops. If the
viscosity of the fluid is high, the orifice can be blocked; fluid containing abrasive particles can
damage the orifice.
2.1.3. Pneumatic nozzle The pneumatic (or two-fluid) nozzle uses compressed air (or steam) to atomize the liquid.
Mixing between liquid feed and atomizing air can be internal or external (Fig. 1.8). In some
spray drying towers, the two-fluid nozzle is installed in the bottom of the chamber (Fig. 1.9)

Part I – Bibliographic study
16
Hot air
Liquid
feed
Powder
Two-fluid nozzle
Exhaust air
Atomizing air
Hot air
Liquid
feed
Powder
Two-fluid nozzle
Exhaust air
Atomizing air
Figure 1.9. Spray drying chamber with fountain two-fluid nozzle (adapted from Mujumdar, 1995).
Figure 1.10. Convective drying of a liquid drop; heat and mass transfers between drying air and drop
surface through the boundary layer.
Figure 1.11. Mollier diagram - Air temperature and relative humidity evolution during spray drying.
Drying air T air RH P v air ( T air )
Heat transfer
Mass
transfer
Boundary layer T = T s
RH = a w,s P v = P v drop (T s )
T s a w ,s P v drop (T s )
Drying air T air RH P v air ( T air )
Heat transfer
Mass
transfer
Boundary layer s
= a w,s P v P v drop (T s )
T s a w ,s P v drop (T s )
TIN
TWB
YIN
YOUT
T (°C)
Y (kg water/kg dry air)
A
C
B
C’ D
D’
H = cste
Air close to
drop surface
at t = 0
RH = 100%
RHOUT
RHIN

Part I – Bibliographic study
17
and depending on the atomizing air pressure the liquid can be sprayed at different heights
inside the chamber (“fountain” nozzle).
Pneumatic nozzles are used to produce sprays in which the drops diameter can be changed by
varying the air/liquid ratio. With two-fluid nozzles it is possible to maintain the same drop
size distribution when changing the liquid flow rate, by adjusting the compressed air flow
rate.
The main disadvantage of this kind of atomizer is the cost of compressed air (or steam). Due
to the compact shape of the spray from nozzles compared to the rotary atomizer spray, it is
easier to measure directly the drops size by laser diffraction by performing some spray
experiments outside the dryer chamber (Jimenez, 2007).
2.1.4. Sonic nozzle Some liquid feed as non-newtonian liquids or highly viscous materials can not be atomized
with rotary wheel or pressure nozzles. For this reason attention has been paid to the
development of a different atomization technique using sonic energy (Sears and Ray, 1980;
Upadhyaya, 1982). The break-up of liquid occurs in the field of high-frequency sound created
by a sonic resonance cup placed in front of the nozzle.
In conclusion, the choice of atomizer depends on the physical properties of the liquid feed
and on the wanted properties of the final powder in terms of size, size distribution, density,
agglomeration. It determines the required energy to form the spray of drops (Table 1.2), their
size and size distribution, their trajectory and their speed at the entrance in the chamber. A
narrow drop size distribution is required for a better control of the drying process (same
behavior for all the drops) and of the final powder properties.
In industry, there is no general rule, the choice depending mainly on the product, on the
know-how and equipments.
2.2. Drying of drops in air for co-current spray dryer
Spray drying is a convective drying process in which hot air provides energy for evaporation
of solvent (usually water) from liquid drops, inside the limited volume of a chamber. In co-
current dryer, just after drop formation by atomization, drops are in contact with inlet air.
Drops and air move together and exchange heat and water. The water vapor is transferred
from drop surface to surrounding air through the air boundary layer surrounding each particle
(Fig. 1.10). As a consequence, drops/particles are drying and air is cooled and humidified
while crossing the chamber.
2.2.1. Evolution of air properties along drying (Mollier diagram) The evolution of air properties (T, RH, Y) during the spray drying can be followed on a
Mollier diagram (Fig. 1.11). Drying air is taken from ambient and heated up to the desired
inlet temperature TIN, without variation in its water content YIN (A�B on Fig. 1.11). Then
during drying, air temperature decreases, while relative humidity and water content increase
(B�C on Fig. 1.11). The total amount of water evaporated from drying drops that goes into
air, can be calculated with a global mass balance of water applied either to air or to the
product between the entrance and the exit of the dryer (Bimbenet et al., 2002). Or balance
equations may be also written between entrance and any point in the dryer if we are able to
know the properties of air (Y) and particles (X) at this point.
Assuming that dry air flow rate airm& and total solids flow rate
sm& are constant, the total
evaporated water flow rate wm e
& is:

Part I – Bibliographic study
18

Part I – Bibliographic study
19
)X(X m )Y(Ymm OUTINsINOUTairew −=−= &&& eq. 1.8
The conditions of exit air (TOUT, YOUT, RHOUT) depend on the amount of evaporated water
and on the inlet air temperature and flow rate. In particular, for a fixed inlet air flow rate airm&
and temperature TIN, the exit air temperature TOUT will depend on the liquid feed flow rate.
For this reason, the exit air temperature is often the parameter used for control of liquid feed
flow rate (I.5).
In practice drying is not isenthalpic due to some heat losses. As a consequence, for the same
amount of evaporated water, outlet air temperature TOUT will be lower than for isenthalpic
drying and RHOUT will be higher (B � C’).
To simplify, in the following descriptions we will assume an isenthalpic drying.
2.2.2. Drying rate: heat and mass transfer equations The drying rate will depend on the heat and mass transfers between air and drops.
At any moment we can assume that the drop surface is in equilibrium with the air boundary
layer. In this layer air temperature is equal to the drop surface temperature Ts, and air relative
humidity is equal to the drop surface water activity aw,s. At a given temperature, from water
activity definition, the water vapour pressure at the surface of the drop can be written as:
Pvdrop
(Ts) = aw,s . Pwsat
(Ts) eq. 1.9
We assume that all the drops of the spray have the same small diameter, neglecting shrinkage
during drying (constant drop diameter) and an homogeneous temperature (surface and core,
Tdrop = Ts). For isenthalpic drying (no heat losses), the heat exchanged between air and drops
is used to evaporate water, with the general equation for one drop:
dt
dm∆H)T(TAh vsairdropC ⋅=−⋅⋅
eq.1.10
If we consider all the drops Ndrops in air at the same distance from atomizer (axial symmetry),
the general mass transfer (water) from drops surface to air can be expressed as:
))(TP)(T(P A N kN.dt
dmair
air
vs
drop
vdropdropscdrops −=
))(TPRH)(TP (aA k air
sat
ws
sat
wwc ⋅−⋅= eq.1.11
hC convective heat transfer coefficient between air and drops (W.m-2
.K-1
); Ndrops number of drops ; Adrop one
drop surface (m2) ; A total drops exchange surface (Ndrops.Adrop) (m
2); Tair, Ts air and drop surface temperature
(°C); ∆Hv water specific heat of vaporization (J.kg-1); dt
dmevaporated water mass flow rate (kg.s-1); kc mass
transfer coefficient between air and drops (s.m-1
); Pv,drop , Pv,air water vapour pressure at drop surface and in air
(Pa); Pw,sat saturated water vapour pressure (Pa); aw water activity; RH air relative humidity.
Convective heat transfer coefficient hc and mass transfer coefficient kc can be calculated
from correlations of Ranz-Marshall for drops and analogy between heat and mass transfer
(Bimbenet et al., 2002):
Nu = hc.dP / k∞ = 2 + 0.6 Re1/2
.Pr1/3
for 1 < Re < 450, Pr < 250
Sh = kc.dP/Dw = 2 + 0.6 Re1/2
.Sc1/3
for 1 < Re < 450, Sc < 250
Nu Nusselt number ; k∞ thermal conductivity of continuous phase (W.m-1.K-1) ; Sh Sherwood number ; Dw water
vapour diffusion coefficient in air (m2.s-1) ; Pr Prandtl number (cP.µair/k∞) ; Sc Schmidt number (µair/(Dw.ρair))

Part I – Bibliographic study
20
Dry
ing
rate
(k
g w
ate
r/h
)
Moisture content X (kg water/kg dry solids)
A
BC
D
E
XC = critical moisture content
Falling rate Constant rate
Xeq = equilibrium moisture content
Dry
ing
rate
(k
g w
ate
r/h
)
Moisture content X (kg water/kg dry solids)
A
BC
D
E
XC = critical moisture content
Falling rate Constant rate
Xeq = equilibrium moisture content
Figure 1.12. Evolution of drying rate of liquid drops.
Table 1.3. Time for complete evaporation of a water drop in still air as a function of
initial diameter (average temperature difference between drying air and
drop 65 °C; λ (65°C) = 0.027 W.m-1
.K-1
; ∆Hv = 2390 kJ.kg-1
)
ddrop (µm) Time for complete evaporation (s)
10 0.02
30 0.15
50 0.42
100 1.7

Part I – Bibliographic study
21
These equations show that the drying rate will depend on different parameters more or less
linked and evolving along drying:
• the initial liquid flow rate and the surface of one drop (temperature and diameter
almost constant)
• the heat and mass transfer coefficients
• the water activity of particle which is decreasing along the process
• the air relative humidity (increasing) and the air temperature (decreasing).
2.2.3. Evolution of drops properties along drying At the beginning of drying, atomized solution drops (water + dry matter) are liquid and their
surface water activity may be considered equal to 1 (free water). Close to drop surface, the
layer of air immediately in contact has a relative humidity RH = 100% (Fig. 1.11 D) and the
temperature is the wet bulb temperature (Ts = Twb; e.g. TIN = 200°C � Twb ~ 50°C). Drops are
almost instantly heated up to this temperature (AB, Fig. 1.12), and then drying occurs at
constant rate (BC, Fig 1.12).
The drying particle will then reach a critical value of moisture content for which the surface is
no longer saturated and aw,s will decrease progressively while drying occurs. Drying becomes
limited by the internal water mass transfer (diffusion from the still humid core to the surface),
which is described by the diffusion coefficient Dv (Raederer, 2001). In this phase, drop
surface temperature could increase if heat provided by drying air is bigger than the heat
needed for evaporation (Fig. 1.11 D�D’).
As a consequence there will be a reduction of gradients of temperature and gradients of water
vapor pressure gradients between drop surface and surrounding air, resulting in a decrease of
the evaporation rate (falling rate drying period, CD in Fig. 1.12).
Just after atomization, liquid drops are in contact with hot air (usually 120 to 300°C) with low
relative humidity. Due to the large exchange surface of the small drops and to the high air
temperature, air flow rate and air turbulence around the drops, heat and mass exchanges are
very quick so that most of drying could be completed in some seconds depending on the
chosen operating conditions.
Considering a spherical water drop (surface water activity remains equal to 1 until complete
evaporation) with a relative air/particle velocity close to 0, time necessary for drying
(evaporation) in still air (v = 0 m.s-1
) can be calculated as (Masters, 1985):
)dd(Tλ8
Ht 2
fin
2
in
v −⋅∆⋅⋅
⋅∆=
ρ eq. 1.12
din droplet initial diameter; dfin droplet final diameter (= 0 if complete evaporation); ∆T average temperature
difference between drying air and drop; λ average thermal conductivity of gaseous film surrounding the
evaporating droplet (W.m-1
.K-1
); ∆Hv specific heat of vaporization of water (kJ.kg-1
).
For an average drying air temperature of 65°C, drying time for complete evaporation should
be lower than 2 seconds for droplets diameter between 10 and 100 µm (Table 1.3). But in the
case of a solution, time necessary for drying will be increased due to water interaction with
solutes. Ideally the final powder particle should be in equilibrium (temperature and water activity)
with exit air (D�E in Fig. 1.12, D�D’ in Fig. 1.11) but as the process is very fast,
equilibrium between air and product is usually not reached inside the spray dryer chamber.
The particles being small (~20 µm), the temperature is homogeneous but the core is probably
more humid than the surface.

Part I – Bibliographic study
22
Inlet air
450
Powder
40
40140140
130130
120
Feed
20
Exit air
120
Inlet air
450
Powder
95 -100
250
130
400
Feed
20
Exit air
125
250
130
400
Feed
2040
130
150
170
180
Powder
95-100
Inlet air
450
Exit air
125
400
300
225
180
Powder
<125
Inlet air
450
Feed
20Exit air
125
(a) co-current
(b) counter-current (c) mixed
Inlet air
450
Powder
40
40140140
130130
120
Feed
20
Exit air
120
Inlet air
450
Powder
40
40140140
130130
120
Feed
20
Exit air
120
Inlet air
450
Powder
95 -100
250
130
400
Feed
20
Exit air
125
250
130
400
Inlet air
450
Powder
95 -100
250
130
400
Feed
20
Exit air
125
250
130
400
Feed
2040
130
150
170
180
Powder
95-100
Inlet air
450
Exit air
125
Feed
2040
130
150
170
180
Powder
95-100
Inlet air
450
Exit air
125
400
300
225
180
Powder
<125
Inlet air
450
Feed
20Exit air
125
400
300
225
180
Powder
<125
Inlet air
450
Feed
20Exit air
125
(a) co-current
(b) counter-current (c) mixed
Figure 1.13. Air/drops contact inside the spray dryer chamber with typical air temperature values:
(a) co-current, (b) counter-current and (c) mixed (Mujumdar, 1995).
Hot air
Atomizer
Air disperser
Hot air
Atomizer
Air disperser
Hot air
Atomizer
Air disperser
Hot air
Atomizer
Air disperser
Hot air
Atomizer
Air disperser
Hot air
Atomizer
Hot air
Atomizer
Air disperser
Figure 1.14. Air swirling flow due to air disperser in co-current spray dryers (Masters, 1985).

Part I – Bibliographic study
23
Removal of water may result in shrinkage of the drying material: normally, the volume
occupied by dry matter and water is decreased by an amount equal to that of evaporated water
with no porosity (Alamilla-Beltran et al., 2005). But formation of very small internal voids
could replace the volume of evaporated water, and according to the composition and fast
drying the final particle size can be similar to the initial droplet size (Raederer, 2001; Chen,
2002).
2.2.4. Configurations for air/drops contact The mode of contact between the air stream and the liquid drops strongly affects the drying
process and the final powders properties. Three configurations of the air/drops contact are
proposed (Fig.1.13):
1. Co-current contact (Fig. 1.13a), in which the drops have the same direction as air
(usually from top to the bottom of the chamber). It is the most used system for drying
of heat sensitive products. Due to the high temperature difference between air and
drops at the entrance of the chamber, water evaporation is quick. An advantage is that
the dried particles in the bottom of the chamber are in contact with an air at low
temperature whilst particles in contact with the hot entering air are at the wet bulb
temperature (aw = 1). In the example in Fig.1.13 air enters at 450°C, and dry powder
leaving the chamber is in contact with an air at 120°C.
2. Counter-current contact (Fig. 1.13b), in which hot air enters by the bottom of the
chamber where it is in contact with almost dried drops that fall down. Air exits from
the top of the chamber. This kind of contact allows a better thermal efficiency of the
process, but it is not suitable for heat sensitive products (like many food products)
because the final dry powder in the bottom of the chamber is directly in contact with
the inlet hot air (450°C in example in Fig.1.13). This configuration is used with
nozzles.
3. Mixed contact (Fig. 1.13c), used to reduce the dimension of the chamber. If product is
not heat sensitive, it is the cheapest configuration.
In each configuration, air flow inlet direction inside the chamber can be controlled by
dispersion devices that may cause a swirling flow and turbulence to enhance heat and mass
transfers (Fig.1.14).
The main consequences of the choice of the air/drops contact configuration are on:
• The trajectories and residence time of particle inside the chamber
• The maximal temperature reached by the powder
• The deposition on walls (product losses)
• The size and the geometry of the chamber.
In our study we focused on co-current spray dryers, usual in food industry.
Part I – Bibliographic study
24
Rapid drying
(spray drying)
Liquid
solution
Crystal Glass
Melt
Dissolution in
solvent
Rapid cooling
Heating
Slow cooling
Heating above
melting point
Dissolution in
solvent
Slow drying Rapid drying
(spray drying)
Liquid
solution
Crystal Glass
Melt
Dissolution in
solvent
Rapid cooling
Heating
Slow cooling
Heating above
melting point
Dissolution in
solvent
Slow drying
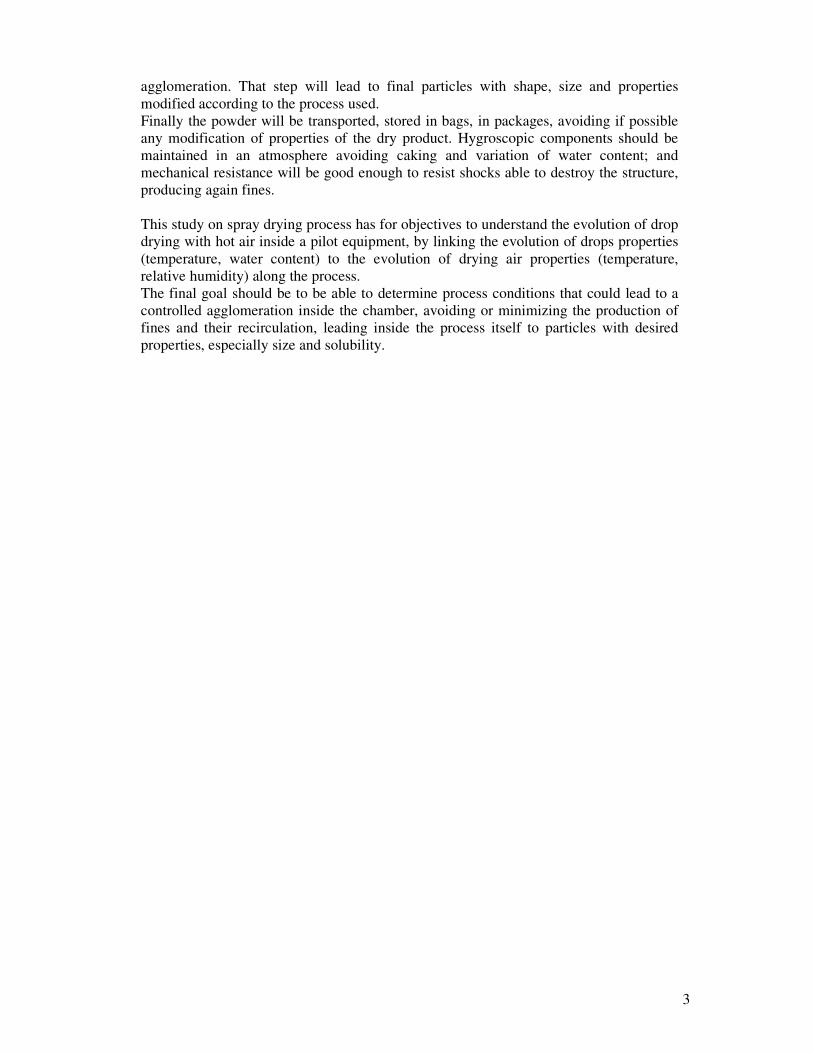
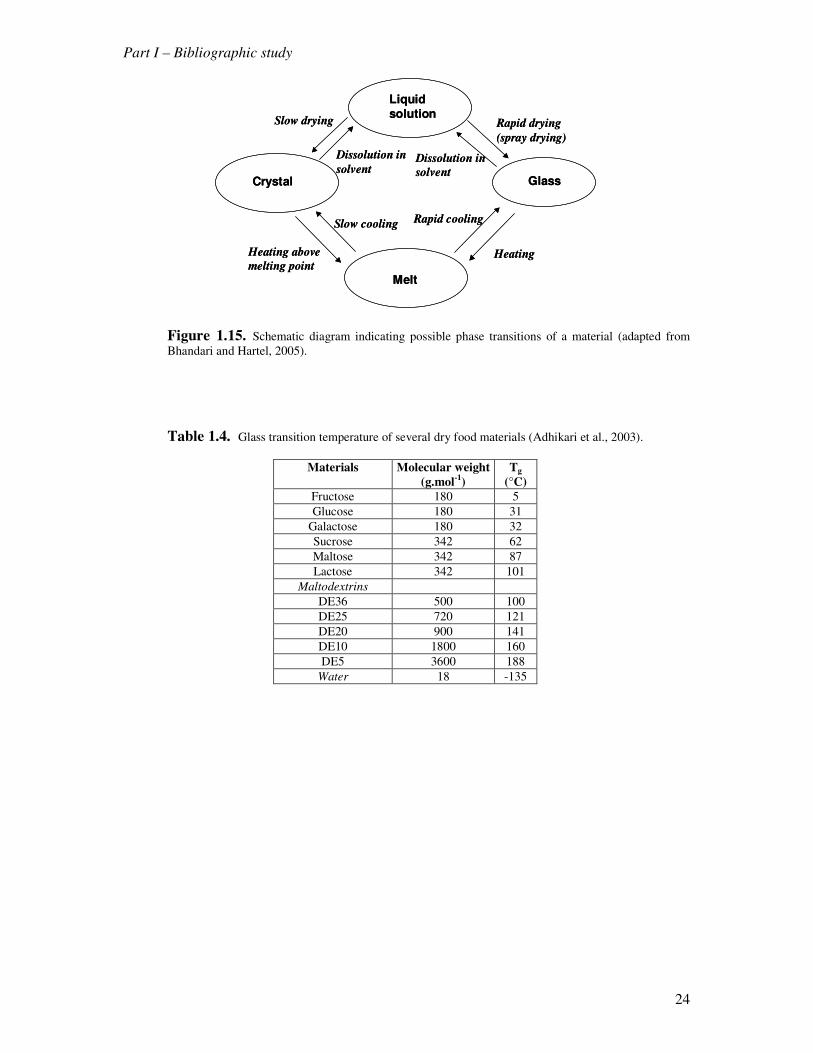
Figure 1.15. Schematic diagram indicating possible phase transitions of a material (adapted from
Bhandari and Hartel, 2005).
Table 1.4. Glass transition temperature of several dry food materials (Adhikari et al., 2003).
Materials Molecular weight
(g.mol-1
)
Tg
(°C)
Fructose 180 5
Glucose 180 31
Galactose 180 32
Sucrose 342 62
Maltose 342 87
Lactose 342 101
Maltodextrins
DE36 500 100
DE25 720 121
DE20 900 141
DE10 1800 160
DE5 3600 188
Water 18 -135
Part I – Bibliographic study
25
3. Particles sticky behaviour along spray drying
3.1. The glass transition phenomenon in drying
Drying of solutions with soluble components like salt (NaCl) will lead to crystallization.
When solutes may show an amorphous phase, the final state of dried product will depend on
the components and on the drying rate (fast or slow), with intermediate states to consider. The
slow drying of a substance like lactose solution leads normally to the formation of a
crystalline solid, when the solubility limit is reached. The corresponding values of
concentration and melting temperature Tm can be read on a state diagram of the considered
substance (Roos and Karel, 1991a; Vuataz, 2002; Schuck, 2002). The crystalline state is
energetically stable: molecules are strongly bound and form a well organized structure. But if
drying is fast enough to prevent the formation of crystals, the material reaches the solid state
keeping the liquid random structure; this configuration of “fixed liquid” is called amorphous
or glassy state, in which the high viscosity does not allow the molecules to rearrange in an
organized structure (Fig. 1.15). The passage from the liquid to the glassy state is called glass
transition, with a glass transition temperature Tg (or domain of temperature) associated to this
transition (Bhandari and Hartel, 2005). The glass transition corresponds to the modification of
several properties of the substance.
When the product is dried below Tg (Downton et al., 1982; Roos, 1995):
• The viscosity increases till about 1012
Pa.s (for Tg)
• The thermal capacity Cp decreases
• The dielectric coefficient and thermal expansion coefficient decrease
• The free volume of molecules decreases
The increase of viscosity will correspond, for a critical value, to an intermediate rubbery state
for which the substance becomes “sticky” before glass transition. The viscosity value of a
substance close to the glass transition as a function of its temperature can be calculated with
the Williams-Landel-Ferry (WLF) (1955) equation, which is valid in the range Tg –
(Tg+100°C).
eq.1.13
Tg glass transition temperature (°C); µg viscosity at Tg (1012 Pa.s); C and B empirical coefficients. The values of
constant parameters B and C used by Williams-Landel-Ferry (C = -17.4; B = 51.6) are valid for most of the
polymers.
The rubbery state is obtained for values of viscosity between 1012
Pa.s (at Tg) and 107 Pa.s,
corresponding to a sticky temperature (Tsticky), in a domain 10 to 30°C higher than Tg
depending on the considered material (Adhikari et al., 2007).
Tg is a specific property of each dry pure substance, strongly dependent on its molecular
weight. Polymers as sucrose having a low molecular weight have a low Tg. For similar
products (maltodextrins) the smaller the molecule, the lower the Tg of the substance. Glass
transition temperatures of some food substances are reported in Table 1.4.
The knowledge of the Tg of pure substances allows predicting the Tg of mixtures (water and
other components). The Tg of a mix is a non-linear function of Tg of each component. It could
be calculated with the Gordon-Taylor (eq. 1.14) and the Couchmann-Karasz equations for 2
components (eq. 1.15):
Tg)(TB
Tg)C(Tlog
g −+
−=
µ
µ

Part I – Bibliographic study
26
Tsticky ~ Tg offset ~ Tg onset + 10°C Tsticky ~ Tg offset ~ Tg onset + 10°C
Figure 1.16. Relation between onset Tg, offset Tg and sticky temperature Tsticky
(from Roos and Karel, 1991c).

Part I – Bibliographic study
27
eq. 1.14
eq. 1.15
w1 , w2 mass fraction of component 1, 2; Tg1, Tg2 glass transition temperature of pure component 1, 2; K
empirical regression coefficient; Cp1 , Cp2 specific heat of component 1, 2
These equations can be extended to mixtures having more than two components.
Tg of a product depends strongly on its water content. Actually, water has a very low glass
transition temperature of -135 °C, so that the presence of even small amounts of water
strongly decreases the Tg of foodstuffs. Water behaves as the major plasticizer for food
substances. As water content of particles evolves very quickly during spray drying, surface Tg
of the particle will vary strongly during the process.
Combining GAB equation for sorption isotherms (eq. 1.2) with Gordon-Taylor equation (eq.
1.14) for glass transition temperature, a direct relationship between glass transition
temperature and water activity could be obtained (Palzer, 2005a).
eq. 1.16
(K, B, C parameters)
This relationship is useful for food substances mixtures, in which water activity at the
equilibrium is the same for all the constituents even if they have different water contents
(Roos, 2002; Schuck et al., 2005).
The techniques to evaluate the glass transition temperature Tg of a product are based on the
measurement of the modification of the physical properties of the substance (Shrestha et al.,
2007a; Boonyai et al., 2007):
-DSC (Differential Scanning Calorimetry) to measure the variation of Cp or of enthalpy
associated to glass transition;
-NMR (Nuclear Magnetic Resonance) to measure the mobility of molecules (Ruan et al.,
1999),
-DMTA (Dynamic Mechanical Thermo Analysis), to evaluate changes in mechanical
properties.
A small amount of powder (11-15 mg) is necessary for measurements (Adhikari et al., 2001).
The phase change from amorphous to rubbery state does not occur at a fixed temperature, but
in a range of temperatures (second order thermodynamic transition). It is possible to consider
as Tg of the substance either the temperature at which properties modifications begin (onset
Tg), or the end of properties modifications (offset Tg) or the middle temperature (midset Tg).
The existence of a correlation between glass transition temperature – used in polymer science
– and sticky temperature Tsticky has been proposed for food powders by Roos and Karel
(1991a,b,c). Several studies show that the sticky domain is situated 10-30°C higher than onset
Tg, and close to the offset Tg (Fig. 1.16). But the appearance of stickiness depends also on the
time during which the product is exposed to a temperature
⋅
⋅⋅
⋅+
⋅+=
21
g22g11
gwKw
TwKTwT
2
1
21
22
1
211
w∆Cp
∆Cpw
lnTgw∆Cp
∆CplnTgw
lnTg
⋅+
⋅⋅+⋅
=
www
gwwgww
wgaCBK)a1)(C(1)a(1
TaCBKT)a1)(C(1)a(1)(aT
⋅⋅⋅+⋅−+⋅−
⋅⋅⋅⋅+⋅⋅−+⋅−=

Part I – Bibliographic study
28
solution
solutionT
emp
eratu
re(°
C)
Liquid
drop
Concentration (% solids)
aw
Crystallization Amorphous
Glass transition
temperature Tg
Slow drying
Fast drying
(spray drying)
Rubbery st
ateSticky
temperature Tsticky
Solu
bilit
y cu
rve
Crystallized
solution
solutionT
emp
eratu
re(°
C)
Liquid
drop
Concentration (% solids)
aw
Crystallization Amorphous
Glass transition
temperature Tg
Slow drying
Fast drying
(spray drying)
Rubbery st
ateSticky
temperature Tsticky
Solu
bilit
y cu
rve
Crystallized
Figure 1.17. Drying of lactose on a state diagram (adapted from Senoussi, 1994).
Water level
SamplePropeller
Stainless
steel rod
Mercury seal
Rotating
inner sleeve
Tight rubber
seal
Water level
SamplePropeller
Stainless
steel rod
Mercury seal
Rotating
inner sleeve
Tight rubber
seal
Figure 1.18. Scheme of the stirrer stickiness test for powders (from Adhikari et al., 2001).

Part I – Bibliographic study
29
higher than Tg (Roos and Karel, 1991c; Karel et al., 1994; Lloyd et al., 1996; Ozmen and
Langrish, 2002; Palzer, 2005b).
In spray drying, particles have to be dried in a way to cross rapidly the domain of stickiness
(aw, T) to get a final amorphous non-sticky powder (Bhandari and Howes, 1999; Truong et al.,
2005a,b). Drop drying could be represented on a state diagram where the glass transition
temperature evolution as a function of water content is shown (Fig. 1.17 for lactose).
The amorphous glassy state (T<Tg) is a non stable state and an amorphous powder can evolve
to the rubbery sticky state with a velocity that depends on the variation of its water content
and temperature. If the powder is exposed to temperature and/or relative humidity conditions
above its glass transition, the molecular mobility leads to the rubbery state with possible
caking/sintering. Knowledge of glass transition temperature is important in order to choose
the best storage conditions for a given powder (aw known). These concepts can represent limit
values.
Stickiness of particles in spray drying may be considered as having a negative effect on the
process (e.g. powder deposition on the walls of the drying chamber) and on the final
properties of powders (e.g. caking) (Bhandari, 2008; Woo et al., 2008). But on the other side,
the sticky state of drying particles surface may be used to perform agglomeration inside the
dryer chamber or in a fluid bed favouring collisions between sticky particles. Creation of
stable solid bridges between two colliding particles to obtain agglomerates requires that at
least one of the particles should be sticky (cf § 4).
3.2. Characterization of stickiness of powders
In addition to glass transition temperature determination, several techniques have been
developed to characterize powder sticky behaviour (Boonyai et al., 2004). The sticky
temperature (Tsticky) is obtained by measuring the effect of modifications of powder properties
like resistance to stirring or optical surface properties. Techniques can be divided into two
main categories:
• Methods using powder “in bulk”
• Methods using drying drops or fluidized particles
3.2.1. Methods using powder “in bulk” The stirrer technique (Lazar et al., 1956; Hennigs et al., 2001; Ozkan et al., 2002; Kudra,
2002) consists in placing a sample of powder with a known water content, inside an ampoule
containing a stirrer (Fig. 1.18). The ampoule is placed in a controlled heating bath, which
allows increasing slowly the temperature. Surface of particles during heating becomes viscous
and sticky, leading to aggregation between particles; when resistance to stirring increases
dramatically, the value of temperature is considered being the sticky temperature Tsticky.
This test has been used for several food powders like tomato, onion, fruit juice, milk and dairy
products and mixtures of maltodextrin/sucrose/fructose. When using a manual stirring, the
reproducibility of the measurement was difficult. Further developments allowed an automatic
stirring.
Problems associated with this technique are the formation of a hollow channel inside the
sample due to stirring, the non homogeneity of temperature inside the sample and the loss of
water during the test due to evaporation at high temperature. The powder sample size varies
between 5g (Chuy and Labuza, 1994) and 50-75g (Hennigs et al., 2001; Ozkan et al., 2002).

Part I – Bibliographic study
30
Figure 1.19. Powder stickiness test by reflectance measurements (Adhikari et al., 2001).
Air humidifying system Air heating
Air pump
FLUID BEDS
Rotameter and flow
control valve
Manometer
Electric motors
and propellers
Air humidifying system Air heating
Air pump
FLUID BEDS
Rotameter and flow
control valve
Manometer
Electric motors
and propellers
Air humidifying system Air heating
Air pump
FLUID BEDS
Rotameter and flow
control valve
Manometer
Electric motors
and propellers
Figure 1.20. Fluidization stickiness test (Dixon and Bloore, 1999, from Boonayi et al., 2004).
AirControlled
T, RH Cyclone
chamber
Powder
sample
Powder
OUT
AirControlled
T, RH Cyclone
chamber
Powder
sample
Powder
OUT
Figure 1.21. Cyclone stickiness test (adapted from Boonyai et al., 2004).
Monitor
Video
recorder
Camera
DropMoving steel bar
To scaleMonitor
Video
recorder
Camera
DropMoving steel bar
To scale
Figure 1.22. In-situ drop drying stickiness test (Adhikari and al., 2003).

Part I – Bibliographic study
31
The ampoule technique uses samples (1g) of powder with known water content in a closed
ampoule, placed in a heating bath. Temperature is progressively increased until caking of
powder (“collapse”) is observed (Tsticky). Examples of use of this technique include freeze
dried polysaccharides (Tsourouflis et al., 1976), infant dairy products (Chuy and Labuza,
1994) and maltodextrin DE 21 (Palzer, 2005b). Experimental conditions can affect the results.
A variation of the heating rate (e.g. 5°C.min-1
or 10°C.min-1
) can modify the result of the test,
and the definition of “collapse” is not clear enough to have a good accuracy and
reproducibility of measurements. It is also possible to evaluate adhesion against walls of the
ampoule, by returning the ampoule and observing if sticking against walls occurs.
An evolution of the ampoule technique has been proposed by Lockemann (1999). It consists
in measuring the variation of powder reflectance during heating thanks to an optical fiber
probe (Fig. 1.19); this technique cannot be applied to transparent materials.
Stickiness measured on dried powders in bulk is not representative of the behaviour of the
material during the drying process. During spray drying, the dynamic of drying (contact
between air and drop and possible impact with other drop or particle) strongly affects product
properties evolution, and characterization of stickiness should be better represented by tests
made in a dynamic situation closer to the reality of the considered process.
3.2.2. Methods using drying drops or fluidized particles Dixon and Bloore in 1999 (from Boonayi et al., 2004) developed a fluidization test to study
sticking between particles in fluid bed exposed to different air humidities and temperatures
(Fig. 1.20).
The air conditionned in temperature and relative humidity, passes through several fluid beds
in which equilibrium between fluidized powder and air is reached and the behaviour of the
fluidized powder is observed. Relative humidity of air is slowly increased while temperature
is kept constant and the sticky point is reached when fluidization becomes difficult. Repeating
the test for different temperatures it is possible to obtain a sticky curve giving Tsticky as a
function of air relative humidity (equal to the powder water activity at equilibrium).
In the cyclone test (Boonyai et al., 2006), like in the fluidization test, air relative humidity
and temperature are controlled. This air passes through a cyclone, in which 1g of powder is
introduced from the top and it is observed if there is adhesion on the walls or between the
particles (Fig. 1.21). Powder particles can be considered as individual particles surrounded by
a hot swirling air flow that moves them through the cyclone. Air humidity is increased for
each tested temperature until reaching a sticky state, and this allows obtaining a sticky curve
(Tsticky versus product water activity (equal to the air relative humidity at equilibrium)).
Adhikari et al. (2003, 2004, 2005, 2007) developed an in-situ drop drying test to measure the
sticky behavior of a drop surface during drying (Fig. 1.22). This device is an improvement of
the tack test of Green (1941) to verify the adhesion of ink to a surface.
The drop (diameter ~5 mm) – a solution of fructose and maltodextrin – is placed on a support
connected to a scale and immerged in a hot air flow. The drop drying is filmed with a video
camera. From weight variation, it is possible to calculate the amount of water evaporated and
so the average water content of the drop during drying.
To measure stickiness, the support of the drop is mechanically moved up until having a
contact between the drop surface and a stainless steel probe attached to a microbalance. The
contact lasts 2-4 s, and then the drop support is moved down. Stickiness is evaluated by the
tensile strength needed to separate the drop from the surface. A microthermocouple may be
inserted in the centre of the drop.

Part I – Bibliographic study
32
Atomized fluid
Solid particle
Onion Raspberry
Fines
Droplet Particle moisture at collision
Very high Low
Compact
grapeLoose
grape
Increase of powder volume
Increase of mechanical stability
Atomized fluid
Solid particle
Onion Raspberry
Fines
Droplet Particle moisture at collision
Very high Low
Compact
grapeLoose
grape
Increase of powder volume
Increase of mechanical stability
Figure 1.23. Different structures of agglomerates (adapted from Pisecky, 1997).
Part I – Bibliographic study
33
This technique simulates adhesion of a drop during drying to a wall with low speed. Inside the
spray dryer chamber the drops will probably move with the air at a higher speed.
None of these sticky tests is really representative of spray drying; either the techniques
consider development of stickiness on an already dry powder, or they consider a liquid drop
in drying conditions different from those in spray drying. But they can help to determine a
domain of temperature and relative humidity for which the powder should be sticky.
4. Agglomeration and spray drying process
In this part, the use of particle stickiness is studied to create “agglomeration” during the spray
drying process.
Particles in powder produced by simple spray drying have an average diameter smaller than
50µm, leading to bad flowability, bad instant properties and high density. To obtain better
handling and to modify final powder properties, the drying particles may be associated with
other particles at some stage of the drying process, in order to modify final powder structure
and porosity and/or to increase particle size (Knight, 2001; Pietsch, 1991; Xiao et al., 2008).
This is often realized by adding at different positions in the chamber, the dry fines collected
from cyclones.
Such “agglomeration” contributes to the drying process and results in:
• A decrease of the amount of fines (d < 50 µm), responsible of explosion problems.
• A modification of the bulk density of the final powder.
• An improvement of flowability and instant properties (wettability, dispersibility,
solubility) of the final powder.
4.1. Agglomerates: structure and formation
To create agglomeration, it is necessary to have collisions between particles followed by
adhesion/fusion of the particle surfaces at the contact point to form stable bridges or
coalescence. The way of performing the agglomeration process influences the structure of the
agglomerates, their mechanical stability and their instant properties (Pietsch, 1991; Turchiuli
et al., 2005).
Different structures may be produced (Pisecky, 1997; Graham, 1997) (Fig. 1.23):
• Agglomerates corresponding to the “fusion” of two particles in one, without the
possibility to identify initial particles, and with a low change in particle size.
• “Onion” agglomerates, with good mechanical stability but hard to dissolve. They are
created by contact of a dry particle (e.g. fine particle or different component added) with
liquid drops, so that the dry particle is covered by successive layers of liquid.
• “Raspberry” agglomerates, created by contact of still humid big particles with a large
amount of fine particles. They may have a poor dispersibility.
These last two structures rather correspond to coating mechanism.
• “Grape” agglomerates, when the different initial particles may be identified with space in
between. They give the best instant properties. Depending on the agglomeration process
conditions a compact grape or a loose grape structure can be obtained, with a big
difference on bulk density of the powder due to the different amount of interstitial air. A
too stable powder may have a low dispersibility, while a dispersible one may be too
brittle (problems in transport and storage).
For instant powders, structures between the compact and loose grape structure will be
preferred, to have at the same time mechanical stability and dispersibility.

Part I – Bibliographic study
34
PRIMARY AGGLOMERATION
SECONDARY AGGLOMERATION
A) SPONTANEOUS B) FORCED
C) SPONTANEOUS D) FORCED
Liquid spray
Fines return
Liquid spray
Exit air
with fines
Liquid spray
from two nozzlesLiquid spray
from rotary wheel
PRIMARY AGGLOMERATION
SECONDARY AGGLOMERATION
A) SPONTANEOUS B) FORCED
C) SPONTANEOUS D) FORCED
Liquid spray
Fines return
Liquid spray
Exit air
with fines
Liquid spray
from two nozzlesLiquid spray
from rotary wheel
Figure 1.24. Different types of possible agglomeration inside the spray drying chamber
(adapted from Pisecky, 1997).
dryingdrying
Figure 1.25. Liquid and solid bridges between particles leading to grape agglomerate.

Part I – Bibliographic study
35
Agglomeration of spray dried powders can be obtained either outside the chamber (in a
fluidised bed) or inside the chamber. In this work we are interested in agglomeration inside
the spray dryer chamber. Collisions between particles of similar diameter, could be
spontaneous (due to drop/particle trajectories inside the chamber) or forced (thanks to the
orientation of nozzles or to fines return/powder addition) (Fig. 1.24).
Several kinds of collisions are possible inside the chamber:
1. between two liquid drops, leading to a coalescence.
2. between a liquid drop and an added dry particle with formation of an onion structure,
in which the solid dry particle will be more or less covered by the liquid. If it is realized in the
external fluid bed, with liquid pulverization, the agglomerates may have a grape structure.
3. between two dry particles, leading to rebound without adhesion.
4. between a dry particle and a sticky (on surface) particle. For example, dry fine
particles are returned inside the chamber where they may collide with particles that are
drying. If these particles surface are in the sticky/rubbery state, the collision results in the
formation of semi-liquid bridges that are further dried leading to stable solid bridges (Fig.
1.25). Agglomerates with a grape structure might be obtained, having good instant properties.
The force of the collision (direction, intensity) could also influence the structure of the formed
agglomerates (more or less compact) and the stability of the bridges. It depends on particles
relative speed and mass (pressure at collision).
4.2. Equipments for spray drying and agglomeration
4.2.1. Multistage spray drying Simple spray drying is not often used in food industry due to the small resulting particle size
and the difficulty to reach desired powder properties, especially instant properties.
A multistage drying layout is preferred, in which after the first stage the spray dried powder
has a water content higher than the desired value for the final product. The last percents of
water are dried in an internal or external fluid bed, in which an additional air flow rate enters
through a perforated plate, fluidizes and dries the powder. Due to higher residence time in the
fluid bed, low air temperature can be used for this second drying step (typically lower than
150°C). The multistage layout allows then working with lower air temperature for the first
spray drying step, by this improving thermal efficiency of the process.
The fluid bed may help to develop collisions between particles with still humid surfaces,
leading to agglomeration. To improve it, water or a water-based solution (additional
component) can be sprayed on the surface of the powder in the fluid bed.
At the beginning, fluid beds were always external to the spray dryer chamber (Fig 1.26), but
from 1980, fluid beds were also integrated inside the drying tower (Fig. 1.27). In this
configuration the powder falls in the bed after a first drying in the tower. Depending on the
height of the fluid bed, some fluidized particles can also be reinserted inside the chamber
where contact with drying drops could lead to agglomeration. The presence of fluid bed in
the bottom of the tower also limits the possibility of contact between humid particles and
bottom walls, avoiding sticking problems on walls. In industry spray dryers with integrated
fluid beds can be of Compact Drying (CD) type or of Multi-Stage Drying type (MSD). The
figure 1.27 illustrates both configurations; the fluid bed has (a) an annular shape for Compact
Drying and (b) a ring shape for MSD.
For three stages drying, a further external fluid bed can be added to improve the drying
process and/or for further agglomeration and/or coating (Mounir and Allaf, 2008).

Part I – Bibliographic study
36
Inlet air
Feed IN
Compressed air
for fines transportFluid bed
Fluid bed inlet
air
Air heating
Air + fines
Drying
chamber
Final product
Powder
Fines
Exit air
+ fines
Cyclone
(air/fines
separation)
Exit air
Inlet air
Feed IN
Compressed air
for fines transportFluid bed
Fluid bed inlet
air
Air heating
Air + fines
Drying
chamber
Final product
Powder
Fines
Exit air
+ fines
Cyclone
(air/fines
separation)
Exit air
Figure 1.26. Two stage spray dryer with external fluid bed (adapted from Pisecky, 1997).
Final
productFluid bed
inlet air
Inlet
air
Feed IN
Feed IN
Compressed
air(a) (b)
Exit air
+ fines
Internal
fluid bed
Inlet
air fines Final
product
Fluid bed
inlet air
Final
productFluid bed
inlet air
Inlet
air
Feed IN
Feed IN
Compressed
air(a) (b)
Exit air
+ fines
Internal
fluid bed
Inlet
air fines Final
product
Fluid bed
inlet air
Figure 1.27. Two stage spray dryer with internal fluid bed: (a) compact dryer CD with annular fluid
bed and (b) Multi Stage Dryer MSD with circular fluid bed (adapted from Pisecky, 1997).
Figure 1.28. NIRO Filtermat spray dryer with integrated conveyor belt (Pisecky, 1997).

Part I – Bibliographic study
37
A special multi stage spray dryer equipped with an integrated belt dryer (Filtermat) (Fig. 1.28)
was developed by Niro Company (Pisecky, 1997; www.niro.com). The primary dryer
chamber is cylindrical without conical part, by this avoiding contact between still humid
particles and chamber walls. Humid powder falls on a horizontal conveyor belt where it could
be dried at low temperatures by secondary air coming downwards (section 2, 3 and 4 in Fig.
1.28). The moist powder layer acts like a filter, so that a limited amount of fines is recovered
from the exhaust air. At the end of the belt, the powder layer brakes and final product is
collected. This dryer is suitable for gentle drying of sticky, hydroscopic and thermoplastic
products. It produces non-dusty, agglomerated, easy-to-use powders.
4.2.2. Fines return Agglomeration inside the chamber can occur spontaneously by collisions between drops and
particles due to air turbulence, and/or it can be forced. When using nozzles for atomization,
collisions between spray drops can be achieved by directing clouds of two or more nozzles
towards each other. That results mainly in coalescence between liquid drops.
Another way to perform agglomeration is the reintroduction of the smallest powder particles,
called fines. Lighter fines particles are transported by air and separated in a cyclone (or bag
filter). Then, they are reinserted inside the spray dryer (or in the fluid bed), where collisions
with drying drops or sticky particles could lead to adhesion. Fines can be transported by
gravity, pneumatic conveying systems, vibrating conveyors. Particles are continuously
returned to the chamber until when they reach a critical size and weight for which they are no
more transported by exit air and they are collected in the final powder. Fines return is used in
all the multistage drying configurations, except the Filtermat in which no or very low amount
of fines is produced.
The important factors to obtain a controlled agglomeration are the amount of recycled fines
(usually unknown and/or not controlled in industrial practice) and the place of introduction
inside the chamber (forced secondary agglomeration). The amount of returned fines is not
known precisely: it corresponds to a stable state for the drying process, leading to a final
powder respecting the specifications for the used drying parameters (flow rates and
temperatures for air and product).
Fines are usually returned next to the atomization cloud, where the drop density is the highest,
to have a high collision probability. Attention has to be paid to the fact that close to the
atomizer fines can be in contact with hot drying air (co-current drying), with risks of thermal
degradation of the product (e.g. Maillard reactions) and of fire explosions. For this reason,
cold air is often used in fines transport lines.
Insertion techniques depend on the kind of spray dryer and atomizer. Often, industrials found
easier to return fines close to nozzle atomizers, due to the more compact shape of the liquid
spray compared to rotary atomizer (industrial contacts Sofivo, Bionov, Techniprocess).
With a rotary atomizer, the fines can be introduced below (Fig. 1.29a) or above (Fig. 1.29b)
the spray cloud. NIRO has developed a system allowing fines introduction above the rotary
wheel thanks to an air disperser, in which cold air circulates to protect fines from the hot air
(FRAD Fines Return Air Disperser, Fig. 1.30). Fines enter by four pipes equipped with an
adjustable deflector at the exit, so that insertion position can be changed. Distance between
rotary wheel and fines insertion could affect the shape and kind of agglomerates formed. A
previous model of the FRAD (Pisecky and Hansen, 1990) also allowed varying the vertical
insertion position thanks to telescopic fines insertion pipes.
Petersen and Gude (1973) proposed a spray dryer with rotary atomizer equipped with a
cyclone inside the dryer chamber (Fig. 1.31). Cold humid air containing fines in the bottom of
the chamber is sucked into the cyclone through some rotating blades. Fines are separated and
exit from the cyclone close to the atomizer wheel, while air is sucked by a fan and released to

Part I – Bibliographic study
38
fines
Liquid
spray
finesfines
(a)(b)fines
Liquid
spray
finesfines
(a)(b)
Figure 1.29. Fines return to rotary atomizer; (a) below spray (b) above spray (Pisecky, 1997).
fines
fines
Cooling air
feed
fines
fines
Cooling air
feed
Figure 1.30. FRAD fines return system to rotary atomizer (www.niro.com, 2008).
Drying air
Liquid feed Exit air
Powder
Air +
fines
Air
fines
Drying air
Liquid feed Exit air
Powder
Air +
fines
Air
fines
Figure 1.31. Spray dryer with internal cyclone (adapted from Petersen and Gude, 1973).

Part I – Bibliographic study
39
the atmosphere. A further pipe allows introduction of compressed air or steam. This
configuration led to formation of “onion-type” agglomerates.
In spray dryers equipped with nozzles, fines can be inserted around one nozzle (Fig. 1.32a), in
between two or more nozzles (Fig. 1.32b) or in a swirl air flow between several nozzles (Fig.
1.32c).
Normally the inserted fines are dry and not sticky, but they also can be heated up and
humified to be in a sticky state when returning inside the chamber. In the process proposed by
Schulz (1966) (Fig. 1.33), fines are returned close to the atomizer (a wheel or a nozzle) and
put in contact with a steam jet. Direction of the steam allows changing fines contact point
with the liquid spray.
In some spray dryers fines return is performed in an integrated fluid bed in the bottom of the
tower. The fluidization air brings the small particles inside the chamber where they can
collide with particles that are still drying. The size of returned particles and the height of
introduction can be varied controlling the pressure drop inside the fluid bed.
In conclusion, various systems are used to reinsert fine particles in spray dryers. This is done
mainly in order to regulate the drying process, avoiding in the same time the loss of product in
industrial practice. It is not easy to know the percent of recycled powder, but it seems to be
very high, maybe superior to 50%.
On the point of view of product quality, these small particles will circulate a longer time
inside the chamber (not controlled). This may be source of degradation. A better
understanding of this process could be useful to imagine some other possibility to improve
drying and /or to induce agglomeration inside the chamber, with or without fines return.

Part I – Bibliographic study
40
Figure 1.32. Fines return to nozzle atomizer (adapted from Pisecky, 1997).
1 Air inlet
2 Air exit
3 Atomizer
4 Fines insertion
5 Steam
6 Orientation of steam jet
7 Powder exit
8 After treatement
1 Air inlet
2 Air exit
3 Atomizer
4 Fines insertion
5 Steam
6 Orientation of steam jet
7 Powder exit
8 After treatement
Figure 1.33. Spray dryer with fines return close to atomizer and steam (general flow sheet and
different orientations of fines insertion position with steam jet) (adapted from Schulz, 1966).
TIN2 > TIN1
IN1
amb1
1
IN2
amb2
2YY
HH MEC
YY
HH MEC
−
−=<
−
−=
Figure 1.34. Evaluation from Mollier diagram of mass heat energetic consumption MEC for
isenthalpic drying at two different inlet air temperatures.
YIN
Y1
Y2
T
TIN1
TIN2
Tamb
Y
H2
H1
RH

Part I – Bibliographic study
41
5. Process control for spray drying
5.1. Energetic considerations in spray drying
Spray drying allows continuous production of high tonnage of powders, with typical
evaporative capacities varying from 500 to 4000 kg water.h-1
. Heat consumption is high, up to
6000 kJ per kg of evaporated water (Schuck et al., 1998). This is mainly due to the need to
remove rapidly the last water molecules adsorbed on particles (bound water). The main part
of free water is normally removed before spray drying by classical evaporation process, to
increase the liquid feed concentration. A higher feed concentration allows increasing the
liquid feed flow rate and leads to reduced heat consumption, keeping the feed viscosity in a
range compatible with pumping (Table 1.5).
Energetic consumption is mainly related to the cost of air heating. The Mass Energetic
Consumption MEC can be expressed as:
)Y(Y
)H(H
)Y(Y m
)H(H m
waterevaporated kg
heatingair for kJMEC
INOUT
ambIN
INOUTair
ambINair
−
−=
−⋅
−⋅==
&
& eq. 1.17
On a Mollier diagram it could be seen that for reaching the same final air relative humidity
(� same final product water activity and water content if equilibrium is approached) it would
be energetically more efficient to perform spray drying with an higher inlet air temperature
TIN (Fig. 1.34). Considering two different temperatures TIN2 > TIN1 we have:
IN1
amb1
1
IN2
amb2
2YY
HH MEC
YY
HH MEC
−
−=<
−
−= eq. 1.18
Increasing the differences between inlet and outlet air temperature also increases the thermal
efficiency of the spray drying operation, which can be expressed as (Mujumdar, 1995):
ambIN
OUTINthermal
TT
TT η
−
−=
Multistage drying with fines return improves thermal efficiency of the process (Schuck et al.,
1998; Pisecky, 1997). However the air inlet and outlet temperatures are limited by the
temperature that can be afforded by the drying particles without degradation, and by the
wanted final powder water content. For the same inlet air temperature TIN, lower exit air
temperature TOUT (with higher relative humidity) can be reached at the exit of the spray dryer
chamber. In that case the product leaving the spray dryer still contains quite high moisture
content (> 6%), and the last percent of water are removed in the external or integrated fluid
bed.
5.2. Measurements on air and product
In spray dryers measurements are usually performed mainly at the entrance and at the exit
(Nath and Satpathy, 1998; Woo et al., 2007). Usually air flow rate and temperature are
measured at the entrance and/or at the exit of the chamber. But these measurements are not
sufficient to determine product properties evolution during drying that could affect final
In situ stickiness test.

Part I – Bibliographic study
42
Table 1.5. Heat consumption for various liquid feed concentrations
for production of 1 kg of powder (Mujumdar, 1995).
Feed concentration
(%)
Approximate heat consumption
(kJ.kg-1
powder)
10 23.65 x 10³
20 10.46 x 10³
30 6.17 x 10³
40 3.97 x 10³
50 2.68 x 10³

Part I – Bibliographic study
43
powder quality. Schuck et al. (2005a, 2008) put in evidence the interest of measuring also air
relative humidity at the exit of the chamber to optimize the process while achieving desired
powder properties. They found that exit air relative humidity is a good indicator of the final
product water content. Actually, for different spray drying conditions, the same exit air
relative humidity led to powders having the same water content.
To characterize product evolution during drying, direct powder sampling inside the chamber
was performed. Zbicinski et al.(2002) used a sampler with the shape of a rectangular plate in a
co-current spray dryer (nozzle atomizer, cylindrical chamber 6 m height, 0.5 m diameter). The
sampler was inserted inside the chamber at different heights through holes in glass control
windows. This enabled measurement of average moisture content of the material at specified
distances from the atomizer. Roustapour et al. (2006) performed the same kind of
measurements at different heights and longitudinal distances in a co-current spray dryer
(height 1.85 m; diameter 1.25 m) equipped with a rotary atomizer. The results showed a very
fast decrease in moisture content (more than 80% of water evaporated 25 cm below chamber
roof).
However several questions are associated to this measurement technique. First the sampler
should remain inside the chamber for several minutes to collect enough powder to analyze, so
that properties of the collected powder may be modified during sampling time. Furthermore
liquid and/or sticky particle will stick on the sampler and, when extracting the sampler,
particles coming from other positions (with different properties) may also be collected.
Finally the technique is invasive and not easy to apply to different spray dryers.
We have seen (chapter 1.2) that the evolution of air properties (T, RH) was linked to product
properties evolution along drying (water evaporation), so that measurement of air temperature
and relative humidity in the chamber may give useful information about drying (drying rate,
average moisture content) of drops/particles.
Temperatures inside spray dryers were measured by several authors (Zbicinscki et al., 2002;
Bandhari, 1992; Frydman, 1998). A big decrease in air temperature was observed close to
atomization, indicating that most of drying occurred in the first part of the chamber, where the
temperature gradient between air and drops is the biggest. King et al. (1984) observed that in
small-scale spray dryers the atomization zone could take up the whole chamber with uniform
temperatures inside the chamber.
But a very little number of studies are reported until now with measurements of air relative
humidity (Kieviet and Kerkhof, 1996; Kieviet et al., 1997) inside the chamber, probably
because of the difficult feasibility and representativity of the measurements. Such a
measurement coupled with air temperature could allow determining the air water content, then
the amount of water evaporated at several positions inside the chamber, and thus estimating
product average water content evolution.
Another important parameter to determine on spray drying process is the particle residence
time distribution. This provides information about the product flow pattern inside the
equipment according to the operating conditions (Villermaux, 1993). It is a statistical
representation of the residence time of the product in the spray dryer and it is a key
characteristic since it determines the time during which particles stay in contact with drying
air (Kieviet and Kerkhof, 1995) thus affecting final powder properties. However, few studies
exist on determination of particle residence time in spray dryers.
It is often assumed that the residence time distribution of the particle is the same as that of the
drying air (Masters, 1985). Zbicinski et al. (2002) used Laser Doppler Anemometry to
measure particles velocity at several heights inside a simple co-current spray dryer chamber
(nozzle atomizer, 6 m height, 0.5 m diameter). Average air residence time varied from 4 to 6s,
and calculated particle residence time was of the same order of magnitude.
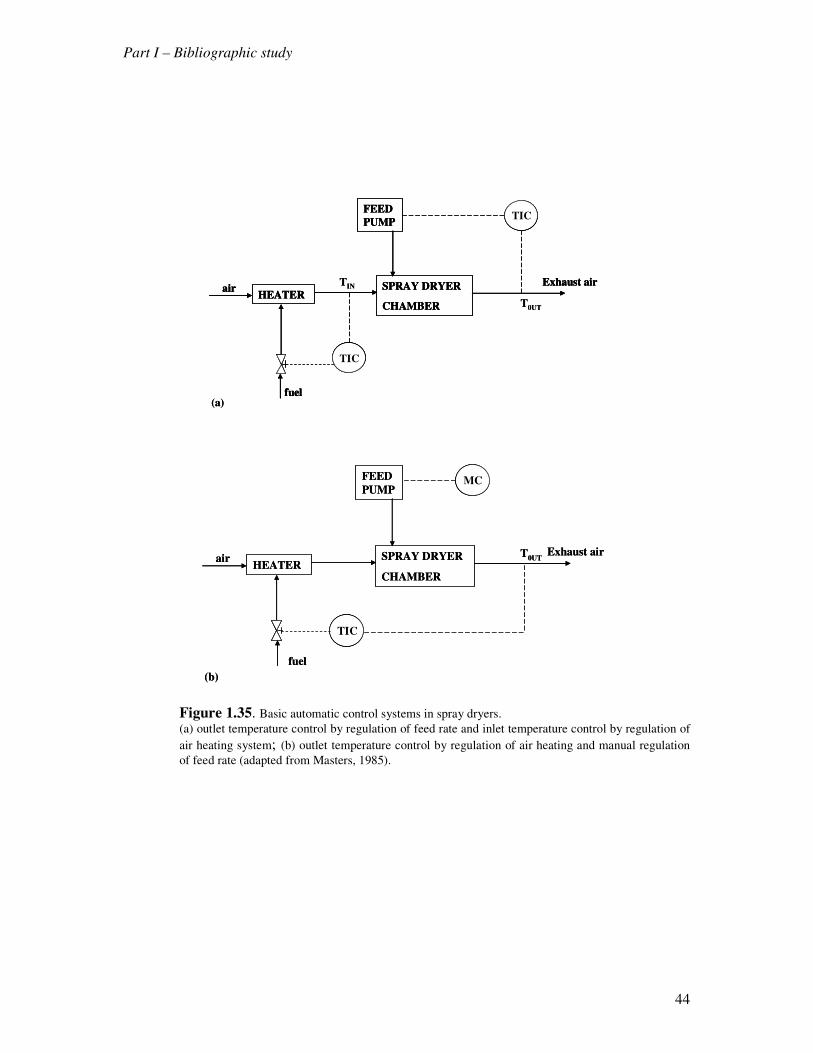
Part I – Bibliographic study
44
HEATERSPRAY DRYER
CHAMBER
FEED
PUMP
TIC
TIC
Exhaust airair
fuel(a)
T0UT
TIN
HEATERSPRAY DRYER
CHAMBER
FEED
PUMP
TIC
TIC
Exhaust airair
fuel
HEATERSPRAY DRYER
CHAMBER
FEED
PUMP
TICTIC
TICTIC
Exhaust airair
fuel(a)
T0UT
TIN
HEATERSPRAY DRYER
CHAMBER
FEED
PUMP
TIC
MC
Exhaust airair
fuel
(b)
T0UT
HEATERSPRAY DRYER
CHAMBER
FEED
PUMP
TICTIC
MCMC
Exhaust airair
fuel
(b)
T0UT
Figure 1.35. Basic automatic control systems in spray dryers.
(a) outlet temperature control by regulation of feed rate and inlet temperature control by regulation of
air heating system; (b) outlet temperature control by regulation of air heating and manual regulation
of feed rate (adapted from Masters, 1985).

Part I – Bibliographic study
45
Residence time distribution is usually determined by adding a tracer in the feed and by
measuring the response in product stream. Kieviet and Kerkhof (1995) injected Rhodamine
as a tracer in the form of a short pulse (1s) during spray drying of an aqueous solution of
maltodextrin in a co-current pilot spray dryer equipped with a rotary atomizer (height 2m;
diameter 2.2 m). Concentration of Rhodamine in dried powder was then determined by
dissolving the powder in water and measuring the absorbance of the solution (related to
Rhodamine concentration). Average particle residence time inside the tower was of about 2
minutes, while air average residence time was approximately 30s. According to the authors,
longer particle residence time compared to air may be due to the inertia of particles that
cannot follow the air, and/or to the fact that some particles could hit the chamber walls and
remain stuck for some time.
Jeantet et al. (2008) used NaCl as a tracer during spray drying of a skim milk solution in a
three stage spray dryer tower (nozzle atomizer, 3.9 m height, 2.1 m diameter) equipped with
an internal fluid bed and a fines return system. Particles average residence time varied from
9.5 to 12 minutes. In this case, fines return and internal fluid bed are probably responsible for
the higher particle residence time compared to simple spray dryer, as particles can recirculate
several times before being collected.
5.3. Control
The aim of spray dryer control system is to maintain the production of powder with desired
quality, especially water content, taking into account the possible variations of process
parameters.
Spray dryers can be controlled either manually (MCS – Manual Control System) or
automatically (ACS – Automatic Control System). Manual control is used only for laboratory
or small pilot plants.
The outlet air temperature is the parameter that is normally controlled since it represents the
quality of final powder. For a given air flow rate and air inlet temperature, it corresponds to
an air relative humidity in close relation with the powder water content and temperature.
Furthermore safety requirements due to explosion risks often limit the maximum outlet air
temperature (co-current configurations).
Two basic types of control systems are commonly employed (Fig. 1.35) (Masters, 1985). The
first system (a) is composed by two circuits, one controlling the outlet air temperature by feed
rate regulation and a second one controlling the inlet air temperature by air heaters regulation.
Air temperature in the exhaust pipe is assigned, measured and transmitted to a temperature
indicating controller (TIC). Deviations from the desired set point are counteracted by varying
the feed rate without affecting inlet air temperature. If a failure in the feed system occurs (e.g.
pump damage, atomizer blockage), a safety system can shut down air heating if exit air
temperature rises above a security level. In these cases also a fire prevention system can start,
stopping liquid feed and spraying cold water inside the chamber.
In the second system (b) exit air temperature is controlled by regulation of inlet air heating. In
this case the liquid feed rate is kept constant, so that no modification in production rate
occurs. This system is mainly used with nozzle dryers, in which feed rate should be constant
not to modify initial droplet size distribution. From a practical point of view, this second
system has an operational disadvantage due to the long response time of the heater control
circuit when deviation in exit air temperature is detected.

Part I – Bibliographic study
46

Part I – Bibliographic study
47
6. Modeling of spray drying and agglomeration
6.1. Principle
Due to the high industrial diffusion of the spray drying process and to its complexity, a lot of
studies have been made on spray drying simulation (Birchal et al., 2006). Several aspects of
the physics of the process must be considered (Oakley, 2004):
• Atomization. The droplets size and size distribution (kind of atomizer, composition,
viscosity) affect the drying rate and the residence time of particles inside the chamber
and so the final product characteristics (size and size distribution of particles, water
content, shape…). Simplified theoretical models are available for drops size
distribution from atomization under ideal conditions, but currently the method of
prediction for real spray dryers is the use of empirical correlations relating mean drop
size to the operating parameters of the atomizer and properties of the feed (section
2.1). The low precision of these correlations can affect the result of simulation.
• Gas flow and particle motion. The liquid drops will move through the chamber
under the influence of the turbulent gas flow. Thus simulation of gas motion is
important to determine total residence time of particles inside the chamber and to
simulate their trajectories. Calculation of humidity and temperature of the gas allows
correctly simulating heat and mass transfer between the two phases (gas/particle). A
complexity factor is the fact that the air flow is turbulent inside the chamber.
• Drying behavior. At the beginning of drying – when the droplet still has a liquid
surface – drying rate will be governed by mass (water) transfer through the boundary
layer between the drop surface and the drying air. But as drying continues the drop
surface becomes more viscous, its temperature increases and drying rate will be
determined by moisture transport through the particle itself. Moisture transport
through a solid particle is highly material dependent, and modeling requires
experimental data to provide model parameters. Furthermore, changes in particle
morphology during drying should also be taken into account in a complete spray
drying model.
The proposed spray drying models can be classified in three categories (3 levels) depending
on their complexity (Kemp and Oakley, 2002).
First level models are based on heat and mass balances, with short calculation time. They
require knowledge of the product sorption isotherm (solid-vapor equilibrium). They allow
estimating exit air properties and final product water content assuming that equilibrium
between air and particles is reached. They can be used for a preliminary spray dryer design.
Second level models take into account the drying kinetics and the particle residence time
inside the chamber. These models are used to predict the effect of the modification of
operating parameters on final powder (without modeling flow patterns inside the chamber).
Particle residence time can be considered as equal to the average gas residence time or it can
be experimentally determined for the considered dryer.
To design a new spray dryer or to study problems of sticking on walls or of agglomeration
during spray drying a full simulation of gas and particle flow patterns is required: third level
models. From the end of 80’s, the introduction of Computational Fluid Dynamics (CFD)
allowed obtaining a numerical solution of the fluid transport equations and so calculating gas
and particle motion inside the chamber. In 1994, Oakley showed the increasing industrial
interest for CFD simulation for process scale-up. The main applications in food industry
should be the study of aroma losses and thermal degradation of the product, the minimization
of product losses due to sticking on walls and the study of agglomeration.

Part I – Bibliographic study
48
Figure 1.36. Factors to consider in spray drying CFD simulation.
Physical problems
• turbulence modeling
• drops transport
• drying kinetics
• drop size, size distribution
Numerical problems (calculation time,
memory)
• 2D or 3D model, steady or transient
• calculation grid
• required accuracy
-) drop size, size distribution
Experimental validation

Part I – Bibliographic study
49
As our goal is to understand sticking and agglomeration during spray drying, we will look
more in detail at these models.
6.2. CFD models of spray drying
CFD models of spray drying use a mixed Eulerian-Lagrangian approach for respectively the
continuous (gas) phase and the discrete phase (drops/particles). CFD operates with the
discrete volumes method where the studied global volume is divided in a large number of
small volumes. The gas flow pattern inside the chamber is calculated solving the Navier-
Stokes equations of mass and momentum conservation. The Gauss theorem is applied to
transform the conservation differential equations in algebric equations with the hypothesis
that, for example, air pressure, velocity and temperature are uniform in each discrete volume.
Calculation starts from defined initial and boundary conditions and it is iterated until
convergence is reached. Once the gas flow pattern is simulated, particle motion is calculated
considering drag and gravity forces acting on the particle. The common approach is the
“Particle in Source Model”, used for the first time by Crowe (Langrish and Fletcher, 2001), in
which a discrete number of liquid drops is chosen as being representative of the size
distribution of the atomized liquid. The sum of the flow rates of drops of each size class is
equal to the total liquid flow rate. It is also possible to consider coupling between gas and
liquid phase, taking into account the effect of particle motion on gas flow pattern.
This kind of simulation is possible by using commercial softwares like CFX, PHOENICS,
FIDAP, STAR-CD or FLUENT with high computer calculation power. However, a 3D non-
steady simulation of an industrial spray dryer may require very long calculation times (more
than one week. For this reason some simplifications are usually adopted looking for the best
balance between calculation time and desired result accuracy depending on the considered
application. The complexity of modeling is also due to the non-linearity of the process
(Kerkhof, 1994). Some examples of this non-linearity are the saturated vapor pressure
variation as a function of temperature, the sorption isotherms and the evolution of transport
properties as the water diffusion coefficient during drying. The main complexity factors that
affect a spray drying CFD simulation are summarized in Figure 1.36.
The simulation results are reliable if they do not depend on the chosen computational grid and
on the number of particles used as representative of the discrete phase. If independence is
verified, it is then possible to adopt a coarser grid resulting in reduced calculation time.
Choice between a transient or a steady state simulation depends on the considered application.
For a new problem a transient model should be chosen, but for simulating normal operating
conditions a steady state simulation can be performed resulting in a simplification of the
model (Truong et al., 2005a,b).
6.2.1. Simulation of turbulence The air flow inside the chamber is usually turbulent, and a good simulation of turbulence is
important for a correct flow pattern calculation. The k-epsilon turbulence model is the most
used model due to its robustness, even if more accurate results can be obtained with other
models like RSM (Reynolds Stress Model). The principle of k-epsilon model consists in
introducing inside the averaged Navier-Stokes equations (also called Reynolds equations) a
turbulent viscosity to model Reynolds stress and a turbulent diffusivity to represent mass and
heat turbulent fluxes. This viscosity is calculated with the turbulent energy per mass unit k
and the dissipation per mass unit (epsilon). These two parameters are obtained solving a
transport equation for each one. Huang et al. (2004) compared the results of four different
turbulence models in a steady 3D simulation of a spray dryer equipped with a rotary atomizer.
They found that k-epsilon model modified with a different definition of turbulent viscosity

Part I – Bibliographic study
50

Part I – Bibliographic study
51
gave the best agreement between calculated results and experimental measurement. A major
limit for a complete validation of turbulence simulation is the lack of experimental data on
gas flow patterns inside the chamber.
The kind of atomizer used also affects the air behavior. Most of simulation studies considered
spray dryers equipped with nozzles; use of a rotary wheel results in the creation of a sucking
effect that modifies the air flow pattern introducing a further instability source (Huang et al.,
2006). Due to the local nature of these instabilities, a 3D simulation would be better than a 2D
geometry simplification because simulation results show that the gas flow pattern is often
asymmetric inside the chamber.
6.2.2. Simulation of drop transport Calculation of drop trajectories can cause numerical problems if a transient state simulation is
required. In the steady state simulation, only the droplet source term in the continuity
equations need to be stored. However, in the transient state, for each time step some new
drops are injected at the entrance and the position and state (temperature, velocity, moisture
content…) of each particle at each time step must be stored. Furthermore in transient state a
large time is necessary before the first dry particles exit from the chamber, and so the
calculation time must be long enough to reach a semi-steady state.
The drop behavior is also an important aspect to consider for scale-up problems from a pilot
to an industrial spray dryer. Most of the studies simulate pilot equipments, and to extrapolate
the results to bigger spray dryers a complete dynamic similitude must be obtained (Oakley,
1994). If the geometry of the spray dryers and the air inlet conditions are the same, the air
flow pattern will be similar; but the similitude between drops trajectories is more difficult to
obtain. This will depend on the drops Reynolds number. To have the same Reynolds value in
two different spray dryers the same inlet drop velocity and size distribution should be
obtained by atomization: a so high accuracy in atomization control is not available.
6.2.3. Drying kinetics of drops From a physical point of view the most difficult part of a CFD model of spray drying is the
modeling of the drying kinetics of drops. The goal is to calculate temperature and water
content of drops during drying. The knowledge of their evolution inside the chamber is
fundamental to predict adhesion phenomena of particle (between them or on the walls). As in
these phenomena the surface properties of the drop/particle are involved, this means that a
complete model should be able to predict spatial variation of temperature and especially of
moisture content inside the particle. Interactions between water and dry matter make more
difficult the use of a universal model, because water diffusion depends on the nature of the
considered material and on the water content inside the particle.
In the first step of drying, the drop can be considered as liquid and the drying rate is
calculated from heat and mass balances between the liquid surface and the surrounding air:
the two phases are in equilibrium at wet bulb temperature (aw = 1). When the surface begins
to dry (aw < 1), the evaporation velocity decreases more or less depending on the substance.
The drying kinetics modeling approaches in literature can be divided in two main classes:
simplified models (characteristic drying curve) and models that simulate diffusion.
In the simplified approaches only the average particle moisture content is considered. In the
Characteristic Drying Curve Model (CDC), the drying ratelew,m& (kg.s
-1) of a liquid drop
(water solution containing dissolved solids) is related to the drying rate of a pure water drop
ewm& by the definition of a relative drying velocity f = lew,m& /ewm& . For a given substance, f is a
function of only one parameter, the characteristic moisture content Φ defined as (Langrish and
Kockel, 2001):

Part I – Bibliographic study
52

Part I – Bibliographic study
53
XeqXc
XeqXΦ
−
−= eq. 1.19
X average particle moisture content, Xeq moisture content at equilibrium, Xc critical moisture content, for which
the particle surface is no more completely liquid (aw <1) and drying rate decreases (Figure 1.12).
When Φ ≥ 1 the drying rate is equal to the liquid drop drying rate at the wet bulb temperature,
and so f = 1. For Φ < 1 (Xeq < X < Xcr) the drying rate is reduced lew,m& = f . ewm& .
The curve f as a function of Φ is unique for each material and independent from temperature,
humidity and velocity of the drying gas. The shape of this curve is determined experimentally
by studying the drying kinetics of one drop of the considered material. Langrish and Kockel
(2001) have analysed several studies reported in literature, and they found that for many
materials the correlation between f and Φ can be considered as linear.
It must be noticed that the experimental trials for drying kinetics are performed with drops
having a diameter of some millimetres in order to have measurable weight losses during
drying. In the spray drying process drying drops are smaller (about 100µm) and their drying
kinetics might be different.
The simplified CDC models have the big advantage that they can be implemented in a CFD
simulation. On the other side these models are based on an average particle moisture content
and do not allow to calculate the surface characteristics. Langrish and Kockel (2001) noticed
that due to the small drops diameters in spray drying moisture content gradients inside the
particles will probably be very small. Adhikari et al. (2005) showed that the mass Biot
number (which depends on water diffusion coefficient and is an index of the importance of
internal diffusive forces) shows variations inside the drop due to moisture content gradients
for sticky products.
Diffusive models consider that water evaporation from the surface is at one moment governed
by water diffusion from the particle humid core to the surface. These models take into account
water content gradient inside the drop while, due to the small diameter, temperature is
assumed as uniform.
In these models a diffusion equation is added to the mass and heat transfer equations between
gas and surface (Straatsma et al., 1999a,b). To solve it, experimental data must be obtained to
calculate the diffusion coefficient Dw of water inside the particle (Raederer et al., 2002; Frias
et al., 2001). Adhikari et al. (2005) used an effective diffusivity calculated from the drying
kinetics of a maltodextrin/sucrose solution.
Verdurmen et al. (2004) determined the drying kinetics of a single drop using an acoustic
levitator described by Yarin et al. (1999). A diffusive model allows simulating surface
properties of particles during drying, which may be used to determine their sticky behaviour.
In any case the determination of the diffusion coefficient, the implementation of these models
in a CFD code and their validation are complex, especially for 3D transient simulations. A
further problem is the possible particle shape modification along drying. Numerical models
are normally based on ideal shrinkage behaviour during water evaporation, considering that
the particle remains spherical. All the authors agree that a lot of work must still be done to
correctly calculate spatial variation of moisture content inside particle during drying.
6.3. Simulation of agglomeration
Agglomeration during spray drying can occur due to spontaneous collisions between particles
caused by air turbulence or it can be forced for example by fines return inside the chamber.
This results in a modification of the size distribution of the final powder compared to the

Part I – Bibliographic study
54
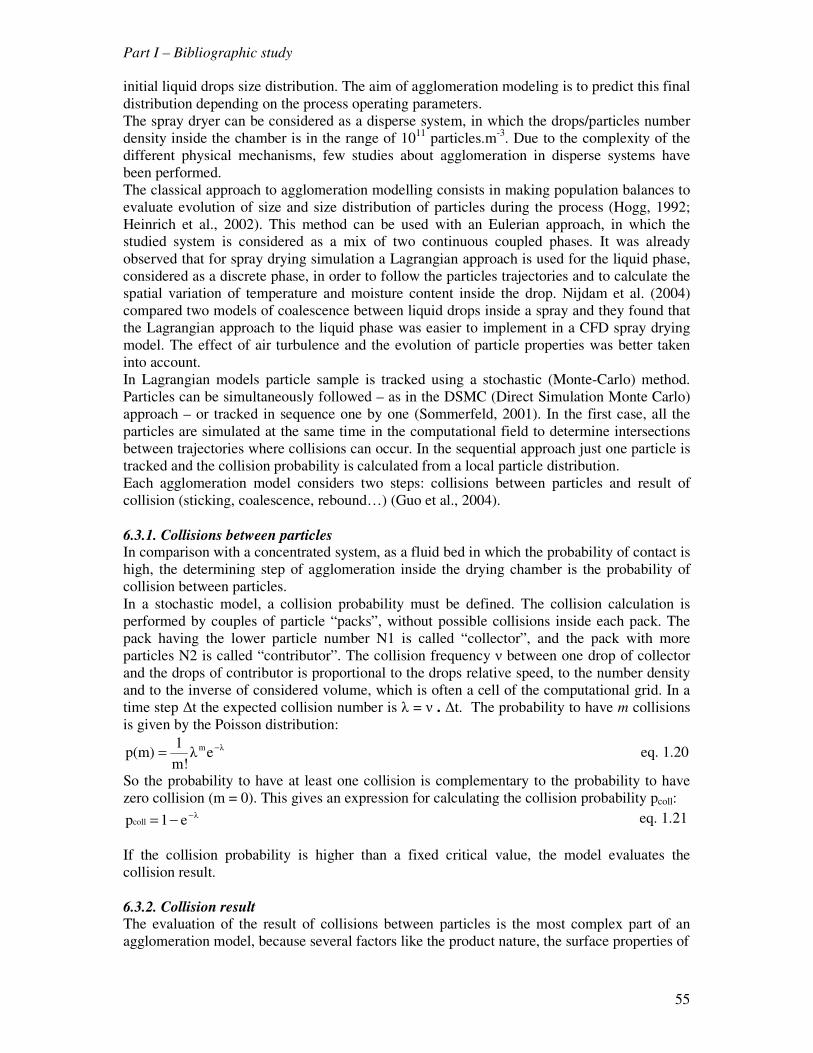
Part I – Bibliographic study
55
initial liquid drops size distribution. The aim of agglomeration modeling is to predict this final
distribution depending on the process operating parameters.
The spray dryer can be considered as a disperse system, in which the drops/particles number
density inside the chamber is in the range of 1011
particles.m-3
. Due to the complexity of the
different physical mechanisms, few studies about agglomeration in disperse systems have
been performed.
The classical approach to agglomeration modelling consists in making population balances to
evaluate evolution of size and size distribution of particles during the process (Hogg, 1992;
Heinrich et al., 2002). This method can be used with an Eulerian approach, in which the
studied system is considered as a mix of two continuous coupled phases. It was already
observed that for spray drying simulation a Lagrangian approach is used for the liquid phase,
considered as a discrete phase, in order to follow the particles trajectories and to calculate the
spatial variation of temperature and moisture content inside the drop. Nijdam et al. (2004)
compared two models of coalescence between liquid drops inside a spray and they found that
the Lagrangian approach to the liquid phase was easier to implement in a CFD spray drying
model. The effect of air turbulence and the evolution of particle properties was better taken
into account.
In Lagrangian models particle sample is tracked using a stochastic (Monte-Carlo) method.
Particles can be simultaneously followed – as in the DSMC (Direct Simulation Monte Carlo)
approach – or tracked in sequence one by one (Sommerfeld, 2001). In the first case, all the
particles are simulated at the same time in the computational field to determine intersections
between trajectories where collisions can occur. In the sequential approach just one particle is
tracked and the collision probability is calculated from a local particle distribution.
Each agglomeration model considers two steps: collisions between particles and result of
collision (sticking, coalescence, rebound…) (Guo et al., 2004).
6.3.1. Collisions between particles In comparison with a concentrated system, as a fluid bed in which the probability of contact is
high, the determining step of agglomeration inside the drying chamber is the probability of
collision between particles.
In a stochastic model, a collision probability must be defined. The collision calculation is
performed by couples of particle “packs”, without possible collisions inside each pack. The
pack having the lower particle number N1 is called “collector”, and the pack with more
particles N2 is called “contributor”. The collision frequency ν between one drop of collector
and the drops of contributor is proportional to the drops relative speed, to the number density
and to the inverse of considered volume, which is often a cell of the computational grid. In a
time step ∆t the expected collision number is λ = ν . ∆t. The probability to have m collisions
is given by the Poisson distribution:
λmeλm!
1p(m) −= eq. 1.20
So the probability to have at least one collision is complementary to the probability to have
zero collision (m = 0). This gives an expression for calculating the collision probability pcoll: λ
coll e1p −−= eq. 1.21
If the collision probability is higher than a fixed critical value, the model evaluates the
collision result.
6.3.2. Collision result The evaluation of the result of collisions between particles is the most complex part of an
agglomeration model, because several factors like the product nature, the surface properties of

Part I – Bibliographic study
56

Part I – Bibliographic study
57
drops and the force of the impact must be considered. The model proposed by Guo et al.
(2004) and Nidjam et al. (2004) do not consider the nature of the substance and simulate
coalescence between two liquid drops. A contact angle φ is defined, and coalescence occurs if
φ value is higher than a critical value. This value is related to the relative speed and the
distance between particles; the new particle size is calculated from the volume conservation d3
= d13 + d2
3.
A more complete model should include the effect of material properties on the particle
behaviour. Agglomeration can occur only if the surface of at least one particle is sticky. The
main properties affecting the sticky state of the particle are the surface tension and the
dynamic viscosity of the surface. The dynamic viscosity is strongly modified during drying,
and based on this property the particles can be classified in three categories (Verdurmen et al.,
2004):
• Surface tension dominated particles (STD): liquid drops in the first part of drying
• Viscous forces dominated (VD) particles: particles during further steps of drying
• Dry particles
The glass transition concept is used to distinguish between viscous particles (sticky) and dry
particles (Adhikari et al., 2003). If the surface temperature of the particle is lower than the
sticky temperature Tsticky, the particle is considered as dry (this approach is valid for
amorphous constituents). Based on this particle classification, four kinds of collisions can be
identified:
• Collisions between liquid drops (STD particles)
• Collisions between a STD drop and a viscous or dry particle
• Collisions between two viscous particles
• Collisions between two dry particles
Each type of collision is calculated with a sub-model. Collisions between liquid drops can
give coalescence, and collisions between dry particles do not modify particle size. The
simulation of collisions where at least one particle is viscous is based on a force balance, in
which the more viscous particle penetrate in the less viscous particle; if penetration is higher
than 50% of the particle diameter, the result of collision is seen as coalescence, if not as
agglomeration. The validation of an agglomeration model is usually performed by comparison
of measured and simulated average final particles diameter and/or size distribution.
6.4. Conclusion on CFD simulation of spray drying and agglomeration
CFD is a potential tool to simulate spray drying process and to better understand phenomena
difficult to study with other modelling techniques, like sticking on walls and agglomeration.
The main advantages of CFD consist in the prediction of flow pattern inside the drying
chamber and of the evolution of product properties during drying, without limitation in the
dryer geometry.
But the complexity of the process and the numerical calculation limit the validity of obtained
results. Especially the transient state simulation still requires too high calculation time and
memory. For this reason, most of published studies are based on steady state simulation. That
may be used to study the behaviour of a spray dryer in normal operating conditions, but it is
not sufficient for new plants design purpose. The simulation approach for the discrete phase
(liquid drops) is normally Lagrangian, and this allows calculating particles trajectories and
simulating temperature and moisture content evolution during drying. Due to turbulent
fluctuations a 3D simulation seems to be necessary to correctly follow particles motion inside
the chamber. To characterize with a good accuracy the evolution of temperature and water
content of the particle during drying, the drying model should include water diffusion

Part I – Bibliographic study
58

Part I – Bibliographic study
59
equation. The main difficulty is to collect experimental data to estimate the internal diffusion
coefficient.
Concerning agglomeration modelling, most of existing models are based on population
balance solutions, which cannot be easily used with a Lagrangian approach for discrete phase
(CFD). Stochastic models that can be integrated in a CFD spray drying simulation have been
developed to simulate agglomeration in dispersed systems; but most of the studies just
consider possible coalescence between liquid drops. Further work must be done to write and
to validate agglomeration models taking into account the different possible collisions inside
the drying chamber. To do this, a better comprehension of mechanisms that lead to
cohesion/adhesion is necessary. To extend CFD use to industrial scale, experimental data
must be obtained for validation.
Conclusion
In spray drying, liquid drops are quickly dried into solid dry particles. In the case of polymers
solutions evolving from an initial liquid state to a final amorphous solid state, particles could
pass through an intermediate sticky/rubbery state, depending on their composition,
temperature and water content.
The bibliographic study put in evidence how the knowledge of conditions for which particle
surface is in a sticky/rubbery state is important on one hand to avoid unwanted product
deposition on chamber walls, and on the other hand to perform agglomeration promoting
collisions between sticky particles.
Agglomeration is often required in industrial practice to reduce dust formation, to improve
flowability and instant properties of the final powder, by increasing particle size and by
creating new structures.
To have controlled agglomeration inside the drying chamber, collisions between two or more
particles should occur to form a new particle with a shape depending on the state of the
colliding particles surface (liquid, sticky, dry solid) and on the force of the impact. Adhesion
to form solid bridges between particles is possible only if the surface of at least one of the
particles is in the “sticky” state at the moment of collision. If the surface is too liquid,
coalescence or covering of the particle will occur; if the surface is too dry, collisions will
result in rebound.
Almost all the industrial spray dryers configurations involve the reinsertion of the smallest
particles (fines) inside the chamber, to improve drying and/or to perform agglomeration.
Fines are usually inserted close to the atomizer where liquid drops density is maximal, but in
this position drops are more likely to be still liquid. A better comprehension of drops drying
behaviour could lead to determination of positions where the drying drops surface is in the
sticky state, more favourable for size enlargement.
Several techniques have been developed to characterize stickiness of particles, but most of
them are based on measurements performed on already dry powder or during drying of single
liquid drops in conditions not totally representative of the fast spray drying process. Stickiness
of the particle surface can be associated to the glass transition temperature of the considered
material. During drying, the viscosity of the drop increases until reaching a critical value for
which the particle surface can be considered as sticky. This critical value occurs for a domain
of temperatures between the glass transition temperature and the sticky temperature some

Part I – Bibliographic study
60

Part I – Bibliographic study
61
degrees higher than glass transition. The glass transition temperature depends strongly on the
water activity/water content, which varies all along drying. The knowledge of particle water
content evolution becomes necessary to estimate particle stickiness, but a direct measurement
is difficult to perform.
Some authors tried to perform powder sampling inside pilot spray dryer chambers to analyze
evolution of particle properties during drying; however sampling techniques are invasive and
difficult to apply in bigger spray dryers.
The evolution of air properties (temperature, relative humidity) could be considered as
representative of the drying process: the water evaporated from product goes into air lowering
its temperature and increasing its water content and relative humidity. Measurements of air
temperature and relative humidity inside the chamber could allow estimating air water content
and thus the amount of evaporated water at different positions by mass balances. In that way
the evaporation rate and average particle water content could be calculated, as a function of
process parameters.
The simulation of the spray drying process should be a useful tool to optimize process
operation, evaluating the effect of operating parameters on final product properties, on energy
consumption. Furthermore a validated simulation should allow calculating the evolution of
product properties along drying, to predict stickiness inside the drying chamber, useful to
avoid product losses due to sticking on walls, and to perform controlled agglomeration.
This study of the spray drying process was conducted on a pilot equipment with a rotary
atomizer. Model materials were selected as able to exhibit stickiness behaviour during drying:
two different maltodextrins were chosen.
The air properties (temperature, relative humidity) were determined in different chosen
positions in the dryer. They will be used to calculate and follow the transformation of drops
into dry particles (temperature, water content, water activity). From knowledge of drying
material (sorption isotherms, glass transition temperature), it will be possible to determine
operating conditions and positions in the dryer for which the particles may be sticky.
Application of CFD modelling will give another approach.
To verify the sticky conditions, experiments will be done with defined local powder insertion
during spray drying and the resulting powder analyzed (size and shape).
Semi-industrial drying trials will be performed and interpreted by using this methodology.


PART II
MATERIALS AND METHODS


Part II – Materials and methods
65

Part II – Materials and methods
66
Table 2.1. Properties of maltodextrins used for preparation of aqueous solutions (data Roquette)
Glucidex 12 Glucidex 21
DE 11-14 20-23
Glucose (%) 1 3
Maltose (%) 2 7
Oligo and Polysaccharides (%) 97 90
Tg dry powder (°C) 180 140

Part II – Materials and methods
67
1. Products
1.1. Maltodextrin solutions
Maltodextrins are mixtures of poly and oligosaccharides, generated from starch syrup by
enzymatic or acid hydrolysis (Zapsalis and Beck, 1985). The more advanced the hydrolysis,
the higher the dextrose equivalent (DE) number, representing reducing sugars in relation to
glucose (DEglucose = 100). The average molecular weight of maltodextrin is inversely
proportional to the DE number.
Two maltodextrin powders DE12 and DE21 (Glucidex, Roquette, Fr) were used in our study.
The maltodextrin DE12 has a higher molecular weight and a longer glucose chain,
corresponding to higher glass transition temperatures (Table 2.1).
Initial maltodextrin powder, with a water content of ~ 5%, was dried during at least 24 h in
oven at 100°C before preparation of aqueous solutions for spray drying.
Aqueous solutions (40% w/w dry matter) were prepared the day before the trial, by dissolving
progressively the maltodextrin powder in desionised water at ambient temperature, under
mechanical stirring. Preparation time was of about 1 hour. The solution protected with a
plastic film was kept one night at ambient temperature to get a solution where maltodextrin
was completely dissolved. Density of aqueous solutions was of about 1200 kg.m-3
.
For residence time distribution trials, two 40% dry matter w/w aqueous solutions were
prepared, one containing 50% maltodextrin DE12 and 50% NaCl, and the other one
containing only maltodextrin DE12 colored with some drops of eosine.
1.2. Protein hydrolysate aqueous solution
Spray drying of an aqueous solution of a protein hydrolysate produced by a fermentation
process was performed in Nestlé PTC of Singen (Germany). Due to biological reactions
during production, the composition of the raw liquid solution could slightly vary from one
batch to another. For this reason, all the trials were performed with the same liquid batch
(stored at ambient temperature in a closed vessel – 2 months – stability was not verified).
The average water content of the liquid solution was 63.50 ± 0.46% w/w corresponding to
36.5% dry matter w/w, with 50% of the dry matter composed by salt (Nestlé data).
2. Equipments and instrumentation
Spray drying trials were performed in two pilot plants. A NIRO Minor was used in
Agroparistech Massy (France) for testing maltodextrin solutions behavior during drying and
the feasibility of measurements of air properties. A NIRO FSD 4.0 was used for protein
hydrolysate solution drying (Nestlé PTC, Singen, Germany) to apply the methodology to a
different equipment.
2.1. NIRO Minor spray dryer
The NIRO Minor pilot spray dryer (NIRO, Copenhagen, Dk) is a one-stage co-current spray
dryer, equipped with a rotary atomizer. The water evaporative capacity is of 1 to 4 kg.h-1
according to operating conditions (Fig. 2.1).

Part II – Materials and methods
68
+
+
+
+
+
+
+
+
* B
+ TOUT
+
height (cm)
-10
0
27
80
49
Liquid feed
Hot Air
*
100
60
80 cm
A+
(c)
+
+
+
+
+
+
+
+
* B
+ TOUT
+
height (cm)
-10
0
27
80
49
Liquid feed
Hot Air
*
100
60
80 cm
A+
+
+
+
+
+
+
+
+
* B
+ TOUT
+
height (cm)
-10
0
27
80
49
Liquid feed
Hot Air
*
100
60
80 cm
A+
(c)
Figure 2.1. Flowsheet of Niro Minor pilot spray dryer plant (a); (b) Details of rotary atomizer and air
disperser; (c) Positions of thermocouples (+) and hygrometer (*) inside the chamber.
Table 2.2. Dimensions and volumes of NIRO Minor pilot spray dryer components.
Dimensions Volume (m3)
Chamber d = 80 cm
hcylinder = 75 cm
hcone = 60 cm
1/3 π r2 hcone + π r2 hcylinder = 0.4773 m3
Cyclone d = 13.5 cm
hcone = 35 cm
hcylinder = 13.5 cm
1/3 π r2 hcone + π r
2 hcylinder = 0.009395 m
3
Pipes between
chamber and cyclone
d = 5 cm
l = 2 m
π r2 l = 0.003925 m3
24 cm
8 cm
2 cm
14 cm
8 cm
5 cm
8 cm
Hot air
Compressed air Liquid feed
Air disperserTIN
(b)
24 cm
8 cm
2 cm
14 cm
8 cm
5 cm
8 cm
Hot air
Compressed air Liquid feed
Air disperserTIN
(b)
0.6
m
Fan
Liquid
feed
electrical heating
Powder exit
Air exit
Peristaltic
pump
humid air
+ dry product exit
Cyclone
Plexiglass
window
Rotary
atomizer
Compressed air
Air
disperser
Air inlet
TT
TOUT
Pitot tube
TIC0.8 m
0.75
m
airm&
(a)
0.6
m
Fan
Liquid
feed
electrical heating
Powder exit
Air exit
Peristaltic
pump
humid air
+ dry product exit
Cyclone
Plexiglass
window
Rotary
atomizer
Compressed air
Air
disperser
Air inlet
TT
TOUT
Pitot tube
TIC0.8 m
0.75
m
airm&
(a)
TIN

Part II – Materials and methods
69
The drying chamber (V ~ 0.5 m3) is a cylinder with a conical base (d = 0.8 cm, h = 1.2 m,
cone angle ~60°). A vibrating automatic hammer is used to periodically remove powder stuck
on chamber walls.
The liquid feed (water or maltodextrin aqueous solutions) was pumped at ambient
temperature (peristaltic pump Masterflex 77201, Fr; 5 to 280 mL.min-1
). The solution tank
was placed on a scale (IB12 Sartorius, Ge; accuracy ± 0.1g) to measure the feed mass flow
rate.
Liquid was atomized by a rotary wheel atomizer (dwheel = 5 cm, with 24 rectangular holes (6
mm height x 3.5 mm wide). The speed was controlled by compressed air pressure (4 to 6 bar,
corresponding to 22500 to 30000 rpm).
Drying air was sucked from ambient by a fan placed after the cyclone at the exit, so that
pressure inside the chamber was inferior to atmospheric pressure. Air flow rate could be
varied by changing the fan rotation frequency (25 to 45 Hz).
Before entering the dryer chamber, air was heated by three electrical resistances (0.7 – 1.5 – 2
kW; temperature < 350°C). A temperature probe placed just after the resistances was linked to
a PID regulator. The air entered into the drying chamber close to the atomizer (co-current
drying) with a swirl imposed by an air disperser (Fig. 2.1b). A thermocouple (K-type; d 1.5
mm; ± 1.5°C) placed inside the air disperser gave the air temperature at the entrance of the
chamber (TIN).
Humid air and dry powder exit from the bottom of the chamber, where a platinum probe
measured air temperature TOUT. The humid air flow rate was measured after the fan with an
Annubar probe (Pitot tube) connected to a water column (∆P). Air flow rate was calculated
with the following formula:
HumidAirm& = 0.0125.Sf.d2
pipe.ρair0.5
.(∆P)0.5
eq. 2.1
HumidAirm& air flow rate (kg.h-1); Sf flowrate coefficient (0.638 for 35 mm pipe diameter); dpipe pipe internal
diameter (35 mm); ρair air density (= f(T)) (kg.m-3
); ∆P height difference of water column (mm of water)
Air temperature and wet bulb temperature were also measured after the Annubar probe to
estimate the air water content, so that the dry air flow rate could be calculated as:
exit
HumidAir
airY1
m m
+=
&& eq. 2.2
airm& dry air flow rate (kg.h-1
) ; Yexit exit air water content (kg water.kg-1
dry air)
Humid air and powder were transported in pipes (d 0.05 m, l 2 m) then separated in a cyclone
(V~ 0.009 m3). After the fan the air was released to the atmosphere. The powder was
regularly collected in glass jars at the bottom of the cyclone (changed every 5 to 10 minutes).
Powder temperature was measured with a thermometer when changing jar.
2.2. NIRO FSD 4.0 spray dryer
The NIRO-FSD 4.0 (NIRO, Copenhagen, Dk) pilot spray dryer is a two-stage co-current
spray dryer, equipped with bi-fluid nozzle atomizer, internal fluid bed and fines return (Fig.
2.2). Its water evaporative capacity is between 15 and 20 kg.h-1
.
The drying chamber is composed by a cylinder with a conical base (d = 1.2 m, h = 2 m, cone
angle 40°). It is equipped with two automatic hammers to remove powder from the walls.

Part II – Materials and methods
70
a
Figure 2.2. (a) Flowsheet of the pilot spray dryer NIRO-FSD 4.0; (b) bifluid nozzle with fines return and
scheme of the top of the spray drying chamber; (c) air circulation scheme inside the chamber; (d) position of
probes for measurements of air properties (+: thermocouples, R: hygrometer).
secondary
primary
Fluid
bed
T
Liquid feed + scale
Ambient inlet air
(350 kg.h-1
)
Ambient inlet air
(100 kg.h-1
)
Powder
OUT
Nozzle compressed air
Exhaust air
Exit air
36 kW
7.5 kW
7.5 kW
T
TIN ∆P
Compressed
air (fines return)
Fan
Fan
Fan
+ T5 + T4
+ T3
+ T2
+
Fines
return
∆P
2 m
+ T1
TOUT
TFB
Fines return
+ compressed air
Compressed
cooling air
Liquid feed +
compressed air
Hot drying
air
Fines return
+ compressed air
Compressed
cooling air
Liquid feed +
compressed air
Hot drying
air
Air IN
Liquid feed
Fines return
Air OUT
Fluid bed
Air IN
Air IN
Liquid feed
Fines return
Air OUT
Fluid bed
Air INc
Fluid
bed Powder OUT
Exit air
TOUT
TFB
+ T5, R
+ T4
+ T3
+ T2
+
2 m
+ T1, R
Fluid
bed Powder OUT
Exit air
TOUTTOUT
TFBTFB
+ T5, R
+ T4
+ T3
+ T2
+
2 m
+ T1, R
d
Liquid feed + compressed air
Fines return + compressed air
Compressed
Cooling air Hot air inlet
Air exit
b

Part II – Materials and methods
71
Drying air is sucked from ambient by a fan placed at the exit, so that pressure in the chamber
was inferior to atmospheric pressure.
The liquid feed at ambient temperature was pumped (pump ViscoTec 2RB10-KF) from a tank
to the atomizer (minimum flow rate 12 kg.h-1
). It could be heated up to 80°C by electrical
resistances. The tank was installed on a scale to measure mass flow rate. The liquid feed flow
rate was controlled as a function of the exit air temperature TOUT.
The atomization device is a two-fluid nozzle, in which liquid feed is mixed with compressed
air (Fig. 2.2b). Compressed air pressure could be varied between 0.5 and 6 bars. Additional
compressed air is used for nozzle cooling.
Inlet air for drying tower was taken from ambient, filtered and heated by a 36 kW electrical
resistance that allowed setting air inlet temperature up to 300°C. For safety reasons heating is
limited to 230°C. Inlet air flow rate was measured at the entrance with a Venturi flow meter
(∆P) and inlet temperature TIN was measured with an on-line thermocouple. At the top of the
chamber, the air passed through an air disperser providing a swirled air flow inlet around the
nozzle so that the drying was co-current.
In the bottom of the chamber an integrated fluid bed, with additional hot air, allowed further
treatment (drying, agglomeration) of the powder. The installation was adapted to perform
trials with or without the fluid bed. Additional air for fluid bed, when used, was supplied by a
fan and split in two different streams. Primary fluidization air entered through the bottom of
the fluid bed, while secondary air entered on the side. An equal flow rate was assumed for
both streams. Each stream may be heated by a 7.5 kW electrical resistance up to 140°C. Total
additional air flow rate may be varied between 50 and 150 kg.h-1
. Usual flow rate was 100
kg.h-1
. Air temperature inside the fluid bed was measured in the upper part of the fluid bed
(position not well defined).
Air exited from the drying chamber by two holes in the top of the chamber (Fig. 2.2b). Exit
air temperature TOUT was measured by an on-line thermocouple. Fine particles dragged by
exit air were separated in a cyclone and totally reinserted in the chamber with pneumatic
system (uncontrolled compressed air flow rate). The pneumatic fines return system allowed
insertion either near the nozzle or in the cone in the bottom part of the chamber (dashed line
Fig.2.2a). Exhaust air was further cleaned by a water scrubber and then released to
atmosphere.
Powder was recovered at the bottom of fluid bed in a closed tank. The tank capacity was
sufficient to collect powder produced during the whole trial (~1 h) without opening.
The exit air flow rate resulted from the different air inlets: drying air, fluidized bed air,
compressed air for fines return, bi-fluid nozzle air and nozzle cooling air (the last three flow
rates were not evaluated) with possible mixing of these different air streams in the chamber
(Fig. 2.2c).
The two equipments used in this study are co-current spray dryers. They differ by the size
(factor 2), the kind of atomizer (rotary and bi-fluid) and the configuration. The NIRO FSD 4.0
has a more complex configuration with fines return and possible fluid bed, a higher
evaporative capacity (x 5).

Part II – Materials and methods
72
Figure 2.3. Measurements performed on liquid feed, air and powders in NIRO Minor.
0
20
40
60
80
100
120
0 500 1000 1500 2000 2500 3000 3500
γc (s-1
)
τ (
Pa
)
MD 12 + salt
µ = 0.017 Pa.s
MD 21 + salt
µ = 0.01 Pa.s
MD 12
µ = 0.065 Pa.s
MD 21
µ = 0.028 Pa.s
20°C
0
20
40
60
80
100
120
0 500 1000 1500 2000 2500 3000 3500γc (s
-1)
τ (
Pa
)
MD 12
µ = 0.032 Pa.s
MD 21
µ = 0.014 Pa.s
MD 12 + salt
µ = 0.01 Pa.s
MD 21 + salt
µ = 0.006 Pa.s
40°C
Figure 2.4. Viscosity of aqueous solution (40% w/w) of maltodextrin DE12 and DE 21 with and without NaCl
(50% of total solids) at 20°C and 40°C.
Figure 2.5. Measurements of air flow rate in NIRO Minor.
(a) at the exit of the plant (b) at the air entrance inside the chamber.
Drying air inside the chamber - Temperature (up to 12 points) - RH (up to 3 points)
Inlet air - RH (%) - Temperature (°C)
Exhaust air - RH (%) - Flow rate (kg.h
- 1 )
- Temperature (°C)
Liquid feed - Flow rate (kg.h
- 1 )
- Temperature (°C) - Viscosity (Pa.s)
Collected powder - Water activity aw - Water content X (g water.g-1 dry matter) - Size distribution - Flowability, wettability
- Temperature (°C)
8 cm
8 cm
Air flow
Propeller
flowmeter
Side view Top view
(b)
Air exit
Cyclone
v
Fan
35 mm
∆P
Annubar
Velocicalc
(a)
8 cm
8 cm
Air flow
Propeller
flowmeter
Side view Top view
(b)
8 cm8 cm
8 cm
Air flow
Propeller
flowmeter
Side view Top view
(b)
Air exit
Cyclone
v
Fan
35 mm
∆P
Annubar
Velocicalc
(a)
Air exit
Cyclone
v
Fan
35 mm
∆P
Annubar
Velocicalc
35 mm
∆P
Annubar
Velocicalc
(a)

Part II – Materials and methods
73
3. Measurements on liquid feed, air and products
The measurements performed on liquid feed, air and products in Niro Minor are summarized
in Fig. 2.3.
3.1. Measurements on liquid feed solutions The viscosity µ (Pa.s) of maltodextrin aqueous solutions was measured at 20 and 40°C with a
rotational viscometer (Rheomat R180, Lamy, France). The liquid sample was put in the gap
between two coaxial cylinders (R1/R2 = 0.95). The external cylinder was fixed (stator) while
the internal rotated (rotor) at the set velocity. The cylinders with the liquid sample were
placed in a thermostatic bath and liquid temperature was measured with a thermocouple.
Relationship between shear stress τ (Pa) and shear velocity gradient γc (s-1
) was obtained
directly by imposing different shear velocity gradient (from 1 to 3000 s-1
) to the liquid sample
and measuring the corresponding shear stress.
All the maltodextrin solutions tested showed a newtonian behavior (Fig. 2.4): viscosity µ was
independent from shear velocity gradient and a linear relationship exists between shear stress
and shear velocity gradient τ = µ.γc
3.2. Measurements on air
3.2.1. Air flow rate As air was sucked from the exit, the spray dryer chambers were under depression. Pressure
inside the chamber of NIRO Minor was measured with a water column. ∆P was equal to ~ -
340 Pa (35 ± 1 mm H2O) for a fan frequency of 45 Hz, and to ~ -230 Pa (23.5 ± 1 mm H2O)
for a fan frequency of 35 Hz.
To check total air flow rate obtained with the Annubar probe at the exit of the chamber after
the fan, air flow rate in NIRO Minor was also measured with two velocimeters with hot wire
(Velocicalc, TSI, USA) and with propeller (Hontzsch Instruments, Ge). Measurements were
made at two positions, the active sensor component being placed perpendicular to the air
flow:
a) On inlet air, at the end of the inlet air pipe (d = 0.08 m) inside the chamber (without the air
disperser) (Fig. 2.5b). But no reliable results could be obtained from these measurements
because in this position air flow was not stable (transition zone from pipe to the chamber) and
measurements were not possible.
b) On exit air, in the straight exhaust air pipe (d = 0.035 m), 80 cm after the fan just after the
Annubar probe (Fig. 2.5a.; only Velocicalc). From measured air velocity vair (m.s-1
) it was
possible to calculate the air mass flow rateHumidAirm& (kg.h
-1) with the following equation:
airairairpipeairHumidAir ρVρAvm ⋅=⋅⋅= && eq. 2.3
Apipe pipe section (m2); ρair air density (kg.m
-3), depending on air temperature (1.29 kg.m
-3 at 0°C)
(ρair = 1.29 . (273/(273+T))
Measurements were done without liquid atomization, for the fan frequencies (35 and 45 Hz)
and the inlet air temperatures used in spray drying trials (TIN 144 and 200°C).

Part II – Materials and methods
74
Table 2.3. Air flow rate at the exit of pilot spray dryer calculated from measurements with the Annubar
probe and Velocicalc velocimeter (TIN: 14 – 144 – 200°C; ffan : 35 – 45 Hz )
Annubar Velocicalc
ffan
(Hz) TIN (°C)
Texit (°C)
∆P (mm
H2O)
airm&
(kg.h-1
) airV&
(m3.h-1)
vair
(m.s-1
) airm&
(kg.h-1
) airV&
(m3.h-1)
45 14 16.5 118±2 117±1 96±1 30.3±0.3 123±4 105±1
45 144 50.0 115±2 110±1 101±1 30.0±0.3 113±4 104±1
45 200 65.0 109±2 105±1 101±1 27.7±0.3 107±4 103±1
35 14 16.5 60±2 81±1 66±1 18.7±0.3 78±3 65±1
Table 2.4. Methods used for air relative humidity measurements.
Method Measured
Variable
Position Provider Specifications
Psychrometry
Twb, Tair Ambient air
Exit air (Niro Minor)
Jules Richard
thermometers
Capacitive hygrometer
Tair, RH Inside chamber
Ambient air (Minor)
Hygroclip Rotronic
RS 1367
Radiospares
Range: 1-100% RH ±1%; -50°C to 200°C ±1°C
Range: 1-100% RH ±3%; -20° to 70°C ±1%
Dew point hygrometer
Tdp, Tair Inside chamber
(Niro Minor)
SIM-12H, General
Eastern
Range: -10°C – 75°C ±0.2°C

Part II – Materials and methods
75
The calculated air mass flow rates were in agreement between the two probes (Table 2.3). For
a given fan frequency, the total volumetric air flow rate was the same whatever the inlet air
temperature tested, while mass flow rate decreased slightly when increasing temperature. It
was however about 110 kg.h-1
for a fan frequency of 45 Hz and hot inlet air, and 80 kg.h-1
for
fan frequency of 35 Hz.
3.2.2. Air temperature Thermometers were used to measure ambient air temperature and exit air temperature. For air
temperature measurements inside the chambers 5 to 12 thermocouples (K-type, d =1mm,
±1.5°C) were implemented. They were calibrated at 0°C (ice bath) and 100°C (boiling water)
and installed inside the chamber. In the upper cylindrical part of the chamber, two
thermocouples were placed on the same radius to measure possible radial differences.
In NIRO Minor (Fig. 2.1c) they were fixed on an iron support at different positions (accuracy
± 2 cm). Thermocouples connection wires were connected (through plexiglass window) to a
computer for data acquisition and temperatures were recorded through a Labview program
(National Instruments, USA).
To avoid powder sticking on thermocouples head when drying liquid solutions, a protecting
hat has been used with some of the thermocouples. Measured temperatures were the same
with and without the protection, so that further trials were performed without protection.
In NIRO FSD 4.0. 5 thermocouples were fixed to a long inox bar that entered from the
cleaning-in-place hole in the chamber top. Temperatures values were read on a transducer
(not recorded) (Fig. 2.2d).
3.2.3. Air relative humidity Methods used for air relative humidity measurements are summarized in Table 2.4.
The psychrometry method was used to measure humidity of ambient air and exit air in the
case of NIRO Minor. For ambient air, a psychrometer Jules Richard was used. It is composed
by two thermometers, one for the “dry” temperature Tair, the other one covered by a humid
gaze (RH 100%) for the “wet bulb” temperature Twb. A small fan forces ambient air to flow
on the two thermometers. Those two temperatures allow reading on a Mollier diagram the air
relative humidity (RH) and absolute humidity Y (Fig 2.6).
For exit air humidity measurement, two thermometers (“dry temperature” and “wet bulb
temperature”) were placed in the air exit pipe after the fan, inside the exit air flow. One of the
thermometers was covered by a gaze humidified just before measurement.
A capacitive thermohygrometer (Hygroflex, Rotronic, Switzerland) was used to measure air
humidity inside the dryer chambers. It is equipped with a probe Hygroclip (range: 1-100%
RH; -50 + 200°C; accuracy ± 1% RH; ± 0.2°C at 23°C) protected from powder with a
metallic filter. The sensitive element is an hygroscopic polymer absorbing water from
surrounding air until equilibrium is reached. The dielectric constant and thus the capacity of
the condenser are modified depending on air relative humidity at the measured temperature.
The thermohygrometer equipment indicated the air temperature and relative humidity.
The capacitive hygrometer was calibrated in a RH controlled atmosphere with saturated salt
solution at two temperatures (NaNO3: 75% RH at 20°C; 63% RH at 80°C) (Table 2.5). The
sensor placed inside the spray dryer chamber during a water atomization trial once the steady
state was reached, gave a stabilized value after 10 min.

Part II – Materials and methods
76
Table 2.5. Temperature and relative humidity measured by the Rotronic thermohygrometer in
controlled atmospheres (20 and 80°C with 63 and 75% of relative humidity).
Figure 2.6. Mollier diagram with different approaches to measure air relative humidity RH and water
content Y (Twb: wet bulb temperature; Tdp: dew point temperature).
Air temperature
imposed (°C)
Air temperature
measured (°C)
RH saturated salt solution
NaNO3 (%)
RH measured
(%)
80.0 78.3 63 % 64.5 %
20.0 21.2 75 % 73 %
Twb
Tdp
Tair, RH
isenthalp
T (°C)
Y (kg water.kg-1 dry air)
Saturation (RH 100%)
RH 60%
RH 30%
RH 10%
Y
Tair

Part II – Materials and methods
77
In NIRO Minor, air relative humidity was measured inside the chamber at steady state at two
different positions A (top) and B (bottom) (Fig. 2.1c) by moving the hygrometer from
position A to B once the steady state was reached. Values were recorded on a PC using a
Labview program. A second thermohygrometer (RS 1367, Radiospare, France) was used to
check RH values measured by psychrometry on ambient and exit air.
In NIRO FSD the Rotronic thermohygrometer was fixed on a stainless steel bar that could be
moved from bottom to top of the chamber (Fig.2.2).
A dew point hygrometer (SIM-12, General Eastern, USA) was used in some trials in NIRO
Minor to measure and check air relative humidity in the upper part of the chamber. The air to
analyze was sucked from the chamber with a vacuum pump and flow above a mirror cooled
by Peltier effect. Equilibrium between air and mirror surface occurred. Temperature of the
mirror was progressively lowered, till the formation of the first condensation drop, detected
by an optoelectronic system. The temperature for which this condensation occurred was the
air dew point temperature Tdp. From this temperature and temperature of air inside the
chamber (measured by a thermocouple fixed on the hygrometer air sampling pipe) air
properties were determined (Fig. 2.6). To avoid condensation before detection on the mirror,
the sampling pipe was heated up to 60°C. These off-line measurements were in agreement
with those given in-situ by capacitive hygrometer.
3.3. Measurements on powders
3.3.1. Water content Water content X (g water.g
-1 dry matter) was measured on powders by oven drying. A powder
sample (2-3 g) was weighted (mi) and oven dried (at 105°C for maltodextrin powders and at
70°C under vacuum for protein hydrolysate) until constant weight (cheked every 24 h).
Constant weight was usually obtained after 48 h drying; it corresponded to the dry matter
weight ms. Water content was calculated as X = (mi – ms)/ ms
Average value for three samples was considered.
3.3.2. Water activity Water activity aw of powders was measured with aw-meter (TH2, Novasina, Switzerland) at
20°C. About 2 g of powder were placed in a sample holder in a small cell in which
equilibrium was reached between powder and the above air layer. Relative humidity of air
was continuously measured by a conductimeter probe, and at equilibrium its value
corresponded to the water activity of the sample.
3.3.3. Powder size distribution Particle size and size distribution was measured by laser granulometry using dry mode
(Mastersizer 2000, Malvern, France; range 0.02 – 2000 µm; accuracy ± 1%). Powder sample
was put on a vibrating plate and then conveyed to the laser beam by compressed air.
Compressed air pressure was set to 0.5 bar, the lowest possible value to avoid breakage of
particles during transport.
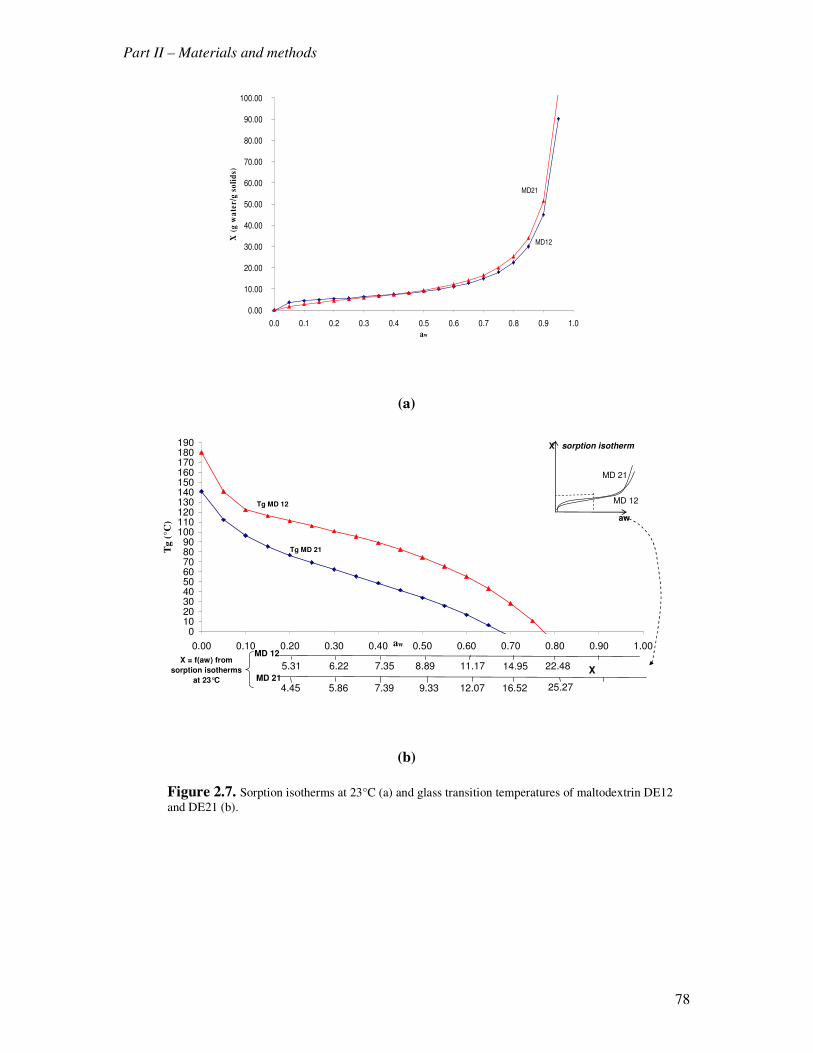
Part II – Materials and methods
78
0.00
10.00
20.00
30.00
40.00
50.00
60.00
70.00
80.00
90.00
100.00
0.0 0.1 0.2 0.3 0.4 0.5 0.6 0.7 0.8 0.9 1.0
aw
X (
g w
ate
r/g
so
lid
s)
MD21
MD12
(a)
0102030405060708090
100110120130140150160170180190
0.00 0.10 0.20 0.30 0.40 0.50 0.60 0.70 0.80 0.90 1.00
Tg
(°C
)
25.2716.5212.079.337.395.864.45
22.4814.9511.178.897.356.225.31
MD 12
Tg MD 21
X = f(aw) from
sorption isotherms
at 23°C MD 21
aw
Tg MD 12
X sorption isotherm
aw
MD 12
MD 21
X
(b)
Figure 2.7. Sorption isotherms at 23°C (a) and glass transition temperatures of maltodextrin DE12
and DE21 (b).

Part II – Materials and methods
79
From the laser diffraction spectrum, the volumetric fraction of particle in each size class was
calculated: the smallest particles have bigger diffraction angles than the biggest particles.
From volume size distribution, several diameters could be calculated:
-d50: Median diameter; 50% of particles have a smaller diameter
-d10 , d90 : 10 and 90% respectively of the particles have a smaller diameter
-d3,2: Volume-surface mean diameter (Sauter). The Sauter diameter is the diameter of a
sphere having the same surface-to-volume ratio that the entire powder sample
(assuming spherical particles)
-d4,3: Volume mean diameter.
3.3.4. Sorption isotherms and glass transition temperatures Sorption isotherms of maltodextrin powders were determined by equilibrating during three
months powder samples (2-3 g) at 23°C in different RH-controlled atmospheres (saturated salt
solutions of LiCl (11% RH), CH3COOK (23% RH), MgCl2 (33% RH), K2CO3 (43% RH),
Mg(NO3)2 (53% RH), NH4NO3 (62% RH) and NaCl (75% RH)). Water content of powder at
equilibrium was then determined (weighting and oven drying). The Brunauer-Emmett-Teller
(BET) equation was used to model sorption isotherms (Fig. 2.7a). Fitting parameters CBET and
xm were found to be respectively 64.2 and 4.51 for MD12 and 35.18 and 4.85 for MD21 at
23°C (equation 1.3). Sorption isotherms for both maltodextrins are very close. For low aw we
can observe that MD21 is above MD12, and the contrary for high aw.
Glass transition temperatures (Tg) of equilibrated powders were determined by Differential
Scanning Calorimetry (DSC Q100, Texas instrument, USA); Tg was determined after the
second heating (heating rate 5°C.min-1
) as the midpoint temperature. Gordon-Taylor equation
Tg = f(aw) was used to model glass transition curves (Fig. 2.7b). Fitting parameter K was
found to be 6.93 for MD12 and 6.8 for MD21 (eq. 1.14).
Data for protein hydrolysate powders were provided by Nestlé.
3.3.5. Wettability Wettability of powders was evaluated at ambient temperature. 10 g of powder were placed in
a funnel (d 90 mm (superior) and 40 mm(inferior)) closed with a plug, 10 cm above a beaker
(d 70mm; h 135 mm) containing 100 ml of water. The plug was then removed and powder fell
on water surface. A chronometer was used to measure time necessary for all the powder to be
wetted by water. Wettability was taken as the time for which the last particle of powder
sample penetrated into water. Average of three measurements was considered.
3.3.6. Bulk and tapped density Bulk density ρbulk (kg.m
-3) was measured by weighing 100 ml of powder in a graduated
cylinder. Tapped density ρtap was determined by reading the volume of 50 g of powder in a
tapping machine after 10, 100 and 500 tappings (value of ρtap was considered good if no
variation was observed between 100 and 500 tappings).
3.3.7. SEM microscopy Powder particles were observed by Scanning Electron Microscopy (JSN - 5200, Jeol, Japan).
In SEM microscopy a succession of lenses produces a finely focused electron spot on the
specimen, resulting in an electron emission signal which is collected and amplified. Thanks to
a cathode ray tube, images are generated. Before observation, the powder sample (some mg)
is covered under vacuum with a small gold layer to increase sample conductivity (340 s, 10
mA).

Part II – Materials and methods
80
y = 0.7642x
R2 = 0.9992
0
5
10
15
20
25
30
35
40
45
0 10 20 30 40 50 60
NaCl concentration (% w/w)
Co
nd
ucti
vit
y (
mS
/cm
)
Figure 2.8. Conductivity of aqueous solutions of maltodextrin and NaCl as a function of salt
concentration in total solids.
Table 2.6. Operating parameters tested for spray drying of water in NIRO Minor.
Table 2.7. Operating parameters tested for spray drying of aqueous solutions (40% w/w) of
maltodextrin in NIRO Minor.
Air TIN
(°C)
Air flow rate
airm& (kg.h-1)
Water flow rate
wm& (kg.h-1
)
Rotary atomizer speed
(rpm)
144 110 1.08 – 2.16 – 3.24 30000
144 – 174 - 200 110 2.16 25000
200 80 – 110 2.16 25000
200 110 1.08 – 2.16 – 3.24 25000
200 110 2.16 20000 – 25000 – 30000
Air T
(°C)
Air flow rate
(kg.h-1)
Liquid flow rate
(kg.h-1)
Corresponding
water flow rate
(kg.h-1)
Rotary atomizer
speed
(rpm)
Maltodextrin
(DE)
144 110 1.8 – 3.6 – 5.4 1.08 – 2.16 – 3.24 30000 12 -21
144 – 174 – 200 110 3.6 2.16 30000 12
200 80 – 110 3.6 2.16 25000 12
200 110 1.8 – 3.6 – 5.4 1.08 – 2.16 – 3.24 25000 12
200 110 3.6 2.16 20000 – 25000 –
30000
12
Part II – Materials and methods
81
3.3.8. Conductivity of solutions for DTS measurements To measure the salt (NaCl) concentration in spray dried powders collected along DTS
experiments, samples were redissolved in water. Conductivity measurements were performed
with a conductimeter (LF 197, WTW, Germany) equipped with a TetraCon 325 probe (range:
1 µS.cm-1
– 2 S.cm-1
).
2 g of powder were dissolved in 40 g of water, and the conductimeter probe was placed in the
solution at ambient temperature. The calibration curve built for salt concentration
corresponding to 0 and 50% of total solids is given in Fig. 2.8.
3.3.9. Colour A colorimeter (CR-200, Minolta, Fr) was used to measure colour of maltodextrin powder
samples containing eosine collected during residence time distribution trials. The sample
holder was filled with powder, and the colorimeter measured the three chromatic cordinates L,
a and b of the sample. L expresses the luminance and it could vary between 0 (dark) and 100
(white). a and b represent the chromaticity of the sample, varying from –60 to +60 (switch
from green to red for a, from blue to green for b). From these measurements, the colour
saturation index C (chroma) was calculated as:
22b a C += eq. 2.4
4. Conditions of spray drying trials 4.1. Trials in NIRO Minor
Three sets of spray drying trials were performed; with water and with the two aqueous
solutions of maltodextrin DE12 and DE21 (40% w/w).
Studied parameters (Table 2.6 and 2.7) included inlet air temperature TIN (144 – 174 – 200
°C), air flow rate (80 – 110 kg.h-1
), rotary atomizer rotation velocity (22500 – 25000 – 30000
rpm, corresponding to a pressure of 4 – 5 – 6 bar) and sprayed liquid flow rate (from 1.08 to
3.24 kg.h-1
for water trials and from 1.8 to 5.4 kg.h-1
for 40% w/w aqueous maltodextrin
solutions trials). The liquid flow rates for maltodextrin trials were chosen in order to have the
same amount of water to evaporate as for water drying trials. Each condition was repeated
three times to verify reproducibility of the results.
The procedure for a complete spray drying trial was the following:
1. The day before the trial, liquid solution was prepared and all parts of pilot were
assembled. Thermocouples and thermohygrometer were installed inside the chamber
and connected to PC for data recording.
2. Inlet air was heated up to the imposed temperature TIN (~30 min); 2h were waited to
heat up the chamber before starting the liquid atomization.
3. Water was sprayed until reaching steady state for air temperatures and humidity
measured inside the chamber (~1 h).
4. Maltodextrin solution was spray dried with a flow rate for which the total amount of
water to evaporate was the same as the previously sprayed water flow rate.
5. Powder was collected during all the trial (~ 1 h), changing the glass jar every 5 to 15
minutes depending on the feed flow rate. Once the steady state for air temperatures
was reached (~ 30/40 min) powder samples were used for analysis.
6. At steady state, thermohygrometer was moved to measure air humidity in different
positions.

Part II – Materials and methods
82
Table 2.8. Operating parameters tested for spray drying of protein hydrolysate solutions
in NIRO FSD 4.0.
Sprayed liquid TIN (°C) Fluid bed Fines return TOUT (°C)
Water 180 No Bottom 65 – 75
No 160
Yes Top 70-75
Top 75-80-88 No
Bottom 80-88
top 65-75 180
Yes Bottom 75-85
Top 88 No
Bottom 97
Protein hydrolysate
solution
200
Yes Top 80-88

Part II – Materials and methods
83
7. If a different operating condition had to be tested in the same spray drying session,
desired parameters were changed and water was spray dried intermediately until no
more powder was collected (~30 min) before spraying again the maltodextrin solution.
8. At the end of the trial, air heating was stopped and water was sprayed to cool down the
chamber more quickly before shutdown. The spray dryer was then dismounted and
cleaned (~2 h).
4.2. Trials in NIRO FSD 4.0
Studied parameters (Table 2.8) for protein hydrolysate solutions drying included inlet air
temperature TIN (160 – 180 – 200°C), exit air temperature TOUT (65 to 90°C, corresponding to
a liquid flow rate from 12 to 20 kg.h-1
), use of internal fluid bed and position of fines return
(top-bottom).
The initial solution (or water) was heated up to 70°C. The sprayed liquid flow rate was
controlled to obtain the desired outlet air temperature: the higher the exit air temperature, the
lower the sprayed liquid flow rate. For safety reasons, the exit air temperature should not be
higher than 90°C.
The following procedure was followed:
1. Heating up of inlet air (for drying and fluid bed if necessary) until desired drying air
temperature, then 20 minutes of running without liquid atomization.
2. Spray drying of water during 20 minutes.
3. Spray drying of liquid solution. Once the steady state (stable exit air temperature) was
reached (~10 min), powder was collected during about 30 minutes. Samples for
analyses were taken from the total collected powder (except powder recovered during
the first 10 minutes not used for analysis).
4. If a drying parameter had to be changed during a trial, pure water was sprayed in
between to “clean” the chamber until no more powder exit from the chamber and no
more fines recirculation was observed (~15 min).
5. Shutdown of pilot and cleaning in place (~1 h).
4.3. Residence time distribution measurements in NIRO Minor Trials were performed by spraying first a 40% w/w aqueous solution of maltodextrin DE12
couloured with eosine. Then, a 40% w/w aqueous solution with 50% maltodextrin DE12 and
50% NaCl in total solids was sprayed. The high salt concentration was chosen for analytical
reasons and also to test the drying behavior of a maltodextrin solution having a salt content
similar to the one in the protein hydrolysate solution. Inlet air temperature TIN was set to 200
°C, to have fast drying avoiding sticking on walls (product losses) and liquid solution flow
rate was chosen as 3.6 kg.h-1
to have powder flow rate high enough to regularly collect
powder (~24 g.min-1
of dry matter). The operating procedure was the following:
1. Heating-up of drying air and of the chamber.
2. Spraying of water (2.16 kg.h-1
) until reaching steady state (constant air temperatures
inside the chamber).
3. Spraying of the 40% w/w MD12 coloured solution (3.6 kg.h-1
) collecting regularly
powder samples until reaching steady state (constant air temperatures).
4. Spraying of the 40% w/w MD12 solution containing NaCl (50%) to have an “output
step” for colour and an “input step” for salt concentration. Initial time t = 0 was taken
once the non coloured solution arrived at the atomizer entrance. Powder samples were

Part II – Materials and methods
84

Part II – Materials and methods
85
ollected every minute during the first 5 minutes, then every 2 minutes (7, 9 and 11
minutes) and then after 15, 20, 25, 35, 45 minutes.
5. After 55 minutes of running with the solution containing salt, an output step for salt
concentration was performed by switching back to the 40% w/w MD12 coloured
solution. This led simultaneously to an input step for color (t = 0 was taken when
colored solution arrived at the atomizer entrance). During the first 3 minutes, powder
samples were collected every 30 seconds, then after 4, 5, 7, 10, 16 and 25 minutes.
6. Spraying of water and stop of air heating to shut down the pilot.
Responses to salt and colour steps were obtained respectively by conductivity and
colorimetry measurements on sampled powders.

Part II – Materials and methods
86

PART III
RESULTS AND DISCUSSION


Part III – Results and discussion
87
The objective of the first part of the study was to characterize the pilot spray dryer NIRO
Minor and to choose the operating conditions that will be used for investigation of spray
drying behavior of liquid solutions: process parameters, air properties measurement positions.
In the second part air properties measurements were used to investigate the effect of process
parameters on drying behavior of water and maltodextrin solutions: inlet air temperature and
flow rate, liquid feed flow rate, rotary atomizer wheel speed. Particles average water content
evolution along drying was calculated from water mass balances on air between inlet and
different positions in the chamber. Then the particle properties (average water content,
temperature) and the glass transition temperatures of the considered material were used to
define possible operating conditions and positions for which particles could exhibit a sticky
behavior favorable for agglomeration inside the chamber.
In the third part a computational fluid dynamics CFD model was developed to calculate air
and drops/particles properties evolution during drying and to predict sticky conditions for
particles inside the chamber.
In the fourth part the determined sticky conditions were tested by inserting powder inside the
chamber, to obtain agglomeration and to study the influence of powder insertion position on
size enlargement.
Finally the experimental approach to study product drying behavior from air properties
measurement was extended to a semi-industrial spray dryer NIRO FSD 4.0 for drying of a
protein hydrolysate solution.

Part III – Results and discussion
88
0
20
40
60
80
100
120
140
160
180
200
0 1000 2000 3000 4000 5000 6000 7000
t (s)
Ta
ir (
°C)
TIN = 180°C T5, T6
T1, T2, T3,T4
TIN = 170°C∆T = 35°C
30 minutes 50 minutes
Figure 3.1.1. Time to reach steady state from air temperature measurements inside the NIRO Minor (no
liquid atomization, TIN : 170 – 180 °C, air flow rate: 110 kg.h-1).
+ 164.3
+ 176.0
+ 168.0
+ 166.4
+ 168.1
+ 182.0 + 200
+ 154.4
+ 172.3
height (cm)
-10
0
27
80
49
Hot Air
110 kg.h-1
100
60
80 cm
+ 168.0
+ 171.5
+ 116.4
+ 125.0
+ 119.4
+ 118.9
+ 119.3
+ 131.6 + 144
+ 110.3
+ 122.0
height (cm)
-10
0
27
80
49
Hot Air
110 kg.h-1
100
60
80 cm
+ 120.1
+ 121.6
Figure 3.1.2. Air temperatures inside the NIRO Minor at steady state (no liquid atomization; hot air 144 and
200°C, total air flow rate 110 kg.h-1
).
Table 3.1.1. Calculation of heat losses lossesQ& and global heat exchange coefficient h without liquid
atomization (air TIN 144 and 200°C, airm& 110 kg.h
-1, Tamb 18°C; S 3.37m
2, CP,air = cste = 1 kJ.kg
-1).
TIN
(°C)
Twall
(°C)
TOUT
(°C) lossesQ&
(W)
h
(W.m-2
.K-1
)
144 122 110 1039 2.96
200 172 154 1405 2.71
Part III – Results and discussion
89
1. Definition of process operating conditions
Before studying the spray drying behavior of maltodextrin solutions, the feasibility of air
properties measurements (temperature T, relative humidity RH) had to be tested.
Measurements on air without liquid atomization were performed in order to estimate the time
necessary to heat up the chamber and to evaluate heat losses due to heat exchanges through
the chamber walls.
Then, water spray drying trials were performed in order to determine time necessary to reach
steady state inside the chamber (stable T and RH) and to choose positions for air properties
measurements (T, RH) in order to get representative data for the studied process.
The process operating parameters (inlet air temperature and flow rate, rotary atomizer speed,
water flow rate) were chosen for further use in solution drying trials.
Then maltodextrin solutions were dried in order to choose the liquid flow rates for
comparison with water drying trials and to determine the time necessary for collecting dry
powder samples.
1.1. Measurements on air without liquid atomization
1.1.1. Heating of the chamber
Time necessary to reach steady state (constant air temperature) inside the chamber was first
evaluated without liquid atomization with four temperature measurements in the upper part of
the chamber (Fig. 3.1.1). Two thermocouples (T5 and T6) were also placed inside the inlet air
pipe, to verify the imposed air inlet temperature TIN and to determine time necessary to heat
up air at the beginning of a trial.
About 30 minutes were necessary for air temperature at the entrance of the chamber to reach
the imposed value of 170°C and to be stable. After 55 minutes of running (without liquid
atomization) the steady state for air temperatures in the upper part of the chamber
(thermocouples T1 to T4) was not yet reached. Temperature of inlet air was then increased to
180°C, and after more than one hour air temperatures inside the chamber were stable at about
145°C. This put in evidence the long initial time to heat up the pilot spray dryer due to
thermal inertia and possible heat losses.
1.1.2. Determination of heat losses
In order to calculate heat losses due to exchanges between hot air inside the chamber and
surrounding ambient air through the chamber walls, trials without liquid atomization were
performed for two inlet air temperatures TIN that will be used in spray drying trials, 144°C and
200°C.
Measured air temperatures inside the chamber at steady state are shown in Fig. 3.1.2.
Temperatures inside the chamber were 30 to 40°C lower than inlet air temperature TIN. As no
liquid was dried, this temperature difference should be due to heat losses by walls.
The ambient air had a low water content YIN of ~ 0.005 kg water.kg-1
dry air, so that the water
vapour enthalpy in air may be neglected. Assuming that air specific heat CP,air is constant, the
heat losses and the heat transfer coefficient through the walls can be calculated as:
)T - T(Cm Q OUTINairP,airlosses ⋅⋅= && eq. 3.1.1
)T-(TS
Q h )T-(TSh Q
ambwall
lossesambwalllosses
⋅=⇒⋅⋅=
&& eq. 3.1.2
S surface of dryer chamber (3.37m2). Twall internal wall temperature in chamber (°C)

Part III – Results and discussion
90
0
20
40
60
80
100
120
140
160
0 3600 7200 10800
t (s)
Tair
(°C
)
0
0.5
1
1.5
2
2.5
3
3.5
4
4.5
5
RH
(%
)
water
0.9 kg.h-1
steady state
RH 1.94 %
water
1.5 kg.h-1
RH 3.3 %
T air
RH air
Figure 3.1.3. Time necessary to reach steady state from air temperature and relative humidity measurements
at point A during spray drying of water when changing the sprayed liquid flow rate: 0.9 and 1.5 kg.h-1
of water
(TIN 180 °C, air flow rate 110 kg.h-1).
+
+
+
+
+
+
+
+
* B
+
+
height (cm)
-10
0
27
80
49
Liquid feed
Hot Air
*
*
*
100
60
80 cm
A1
A
A2
+
Figure 3.1.4. Position of K-type thermocouples (+) and positions for air relative humidity measurements (*).

Part III – Results and discussion
91
From the trails performed, the heat transfer coefficient through the walls h was calculated as 3
W.m-2
.K-1
(Table 3.1.1).
1.2. Water spray drying
1.2.1. Time to reach steady state inside the chamber Water spray drying was performed in order to evaluate the time necessary to reach stable air
temperatures and relative humidity inside the chamber.
Drying was performed at 144°C, and water flow rate was increased from 0.9 kg.h-1
(15
ml.min-1
) to 1.5 kg.h-1
(25 ml.min-1
). Measured air temperatures and relative humidity in the
upper part of the chamber are shown on Figure 3.1.3.
More than 30 minutes were necessary to reach steady state when changing liquid flow rate.
From these results we decided the usual running up of a spray drying trial: air heating of the
chamber for two hours; spraying of water during one hour before measurements and/or
spraying the solution to dry; and intermediate spray of water during 30 minutes when
changing the operating conditions.
1.2.2. Positions for air properties measurements
Trials with an inlet air temperature TIN of 150°C were performed for different water flow rates
wm& of 1.08, 2.16 and 3.24 kg.h-1
in order to verify the feasibility of air properties
measurements and to choose the positions for probes (Fig. 3.1.4).
Up to 12 thermocouples were placed inside the chamber to measure air temperatures. In the
upper cylindrical part of the chamber, two thermocouples were placed on the same radius to
measure possible differences in radial temperatures.
From temperature measurements during water spray drying, the chamber could be divided in
two zones (Fig. 3.1.5). A first zone was in the upper part of the chamber surrounding the
atomizer, where a high temperature decrease (∆T = 50°C to 100°C) was observed (Zone I). A
second zone was represented by the rest of the chamber, with low temperature decrease (∆T
= 4 to 5°C) from top to bottom (Zone II). This is in agreement with observations made by
several authors (King et al., 1984; Zbicinski et al., 2002; Frydman, 1998).
No radial difference in air temperatures was observed, so that one thermocouple for each
different height should be sufficient for further trials.
Air relative humidities RH (capacitive hygrometer) were measured at several points (A, A1,
A2, B). Values measured at points A, A1 and A2 (top of Zone II) were similar, so that the air
water content in these three points was the same (similar temperatures). At point B higher RH
were measured corresponding to higher air water content (Fig. 3.1.5).
For further spray drying trials we chose the two positions A and B to perform RH
measurements. Position A was chosen as representative of the upper part of the chamber
around the atomizer (limit of Zone I), and position B was in the bottom of the chamber,
representative of the limit of Zone II and of air leaving the dryer chamber. During spray
drying, the thermohygrometer was moved from position A to B once the steady state was
reached. Response time was evaluated, and it took up to 10 minutes to measure a stable value
of air RH when moving the probe.

Part III – Results and discussion
92
* 2.0% (99.8 °C)
* 2.4% (96 °C)
* 2.1% (99.0 °C)
+
98
+ 98
+
101
+ 99
+ 98
+
99
+
100
+
100
* 3.2% (95 °C)
+
95
+ 102 150
Water: 1.08 kg.h-1; 20 °C
a
+
54
+
54
+
53
+
55
+
53
+
56
+
54
+
54
* 51% (52 °C)
+
51
+ 52
* 44% (53 °C)
* 45% (54 °C)
150
b
* 44% (52 °C)
Ambient air 110 kg.h-1; 19.5 °C RH: 49%
Water: 3.24 kg.h-1
; 20 °C
Ambient air 110 kg.h-1; 19.5 °C RH: 49%
Zone I
Zone II
A A
B B
Figure 3.1.5. Air temperature and relative humidity at steady state during spray drying of water
(TIN 150°C, air flow rate 110 kg.h-1
; water flow rate 1.08 kg.h-1
(a) and 3.24 kg.h-1
(b)).
Table 3.1.2. Water spray drying: measured air temperatures, relative humidity and water content at
point A and B at steady state.
Water
TIN (°C) 200 174 144
airm& (kg.h-1) 110 80 110 110
vwheel (rpm x 103) 22.5 25 30 25 25 25
liquidm& (kg.h-1) 3.24 1.08 2.16 3.24 2.16 2.16 2.16 1.08 2.16 3.24
A 110 124 110 85 110 98 91 92 70 52
B 104 117 104 81 104 92 86 88 68 50
Tair (°C) OUT 104 117 104 81 104 92 86 88 67 50
IN 0.1 0.1 0.1 0.1 0.1 0.1 0.2 0.4 0.4 0.4
A 3.6 1.1 3.5 12.9 3.7 6.7 7.3 4.0 16.9 58.9
RH air
(%) B 4.1 1.2 4.1 13.7 4.1 7.7 8.6 4.5 17.6 61.1
IN 12 10 10 11 12 12 10 10 10 11
A 30 29 30 41 30 32 31 20 30 41 Yair
(g water/
kg dry air) B 30 19 30 41 30 32 31 20 30 41
Hot air 110 kg.h-1
(ambient 19.5 °C RH : 49%)
Hot air 110 kg.h-1
(ambient 19.5 °C RH : 49%)

Part III – Results and discussion
93
1.2.3. Choice of operating parameters Water drying trials were used to verify the feasibility of air measurements in chosen
conditions and to choose the operating parameters that will be tested for solution drying.
Measured air properties (T, RH) will be also used to compare drying behavior of water with
maltodextrin solutions.
Process conditions should allow getting dry powders from solutions drying, in closed relation
with air temperature and relative humidity variations between inlet and oulet. Tested
parameters and measured air temperatures and relative humidity at points A and B are
reported on Table 3.1.2.
Water flow rate wm& was limited by the evaporative capacity of the spray dryer, thus it should
be lower than 4 kg.h-1
. We chose a maximum of 3.24 kg.h-1
, considering that increasing the
water flow rate could lead to very low values of exit air temperature TOUT and high relative
humidity RH, and so to possible sticking problems when drying a product solution due to a
final powder with high water content.
The minimal flow rate of 1.08 kg.h-1
was chosen considering that a lower flow rate could lead
to a too low powder flow rate when drying product solutions.
According to the chosen liquid flow rates, a minimal inlet air temperature TIN of 144°C was
used so that drying could be completed inside the chamber. For the highest water flow rate of
3.24 kg.h-1
, a high air relative humidity of 61% and low air temperature of 50°C were
measured in the bottom of the chamber. We considered these conditions as a limit for drying
of product solutions. An inlet air temperature TIN of 200°C led for any tested conditions to
low relative humidities inside the chamber (inferior to 14% for the highest water flow rate,
and inferior to 5% for most of the tested parameters), so that drying of product solutions
should be easy. For this reason, we chose 200°C as maximal inlet air temperature.
Air flow rate airm& was fixed by the fan frequency, which could be varied from 25 to 45 Hz.
Most of trials were performed with the maximal fan frequency (45 Hz) leading to an air flow
rate airm& = 110 kg.h
-1. In that case, for a liquid flow rate of 2.16 kg.h
-1, the air relative
humidity at point B varied from 17.6 (144°C) to 8.6 (174°C) and 4.1 (200°C). For a lower air
flow rate 80 kg.h-1
(35 Hz), it was 7.7 at 200°C. For low inlet air temperature TIN, a low air
flow rate might lead to insufficient drying at the exit of chamber.
Finally, the rotary wheel velocity wheelv was varied by changing the compressed air pressure
from 6 to 5 and 4 bar (30000, 25000 and 22500 rpm). This should affect the initial droplet
size and thus the exchange surface with air and the final powder size.
The effect of process parameters on drying behavior will be discussed in chapter 2, together
with maltodextrin solution drying.
1.2.4. Mass and heat balances on drying air From measured air temperature T and relative humidity RH inside the chamber, air water
content Y at different positions was determined (Mollier diagram). And it was used to
calculate the evaporated water flow rate at each position from a mass balance on water in air
between the entrance of the dryer and any point (*) inside the chamber:
)Y(Ymm IN
*
airew −⋅= && eq. 3.1.3
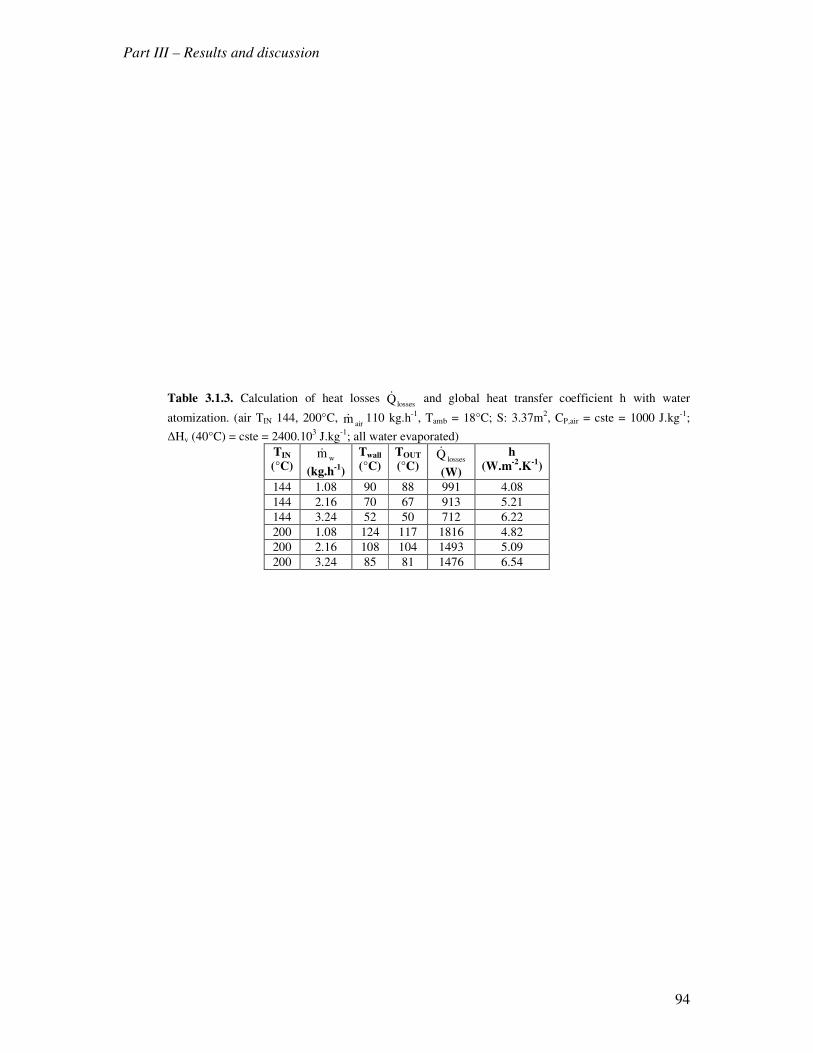
Part III – Results and discussion
94
Table 3.1.3. Calculation of heat losses
lossesQ& and global heat transfer coefficient h with water
atomization. (air TIN 144, 200°C, airm& 110 kg.h-1, Tamb = 18°C; S: 3.37m2, CP,air = cste = 1000 J.kg-1;
∆Hv (40°C) = cste = 2400.103 J.kg
-1; all water evaporated)
TIN
(°C) wm&
(kg.h-1
)
Twall
(°C) TOUT
(°C) lossesQ&
(W)
h (W.m
-2.K
-1)
144 1.08 90 88 991 4.08
144 2.16 70 67 913 5.21
144 3.24 52 50 712 6.22
200 1.08 124 117 1816 4.82
200 2.16 108 104 1493 5.09
200 3.24 85 81 1476 6.54

Part III – Results and discussion
95
For the tested conditions (Table 3.1.2) during water spray drying, air water content did not
vary from position A to B, and from the mass balance we could calculate that 100% of water
was already evaporated at point A in the upper part of the chamber. Drying was then
completed, and further temperature decrease from top to bottom was due to heat losses.
Assuming that the temperature decrease for air between the chamber inlet and the exit
corresponds to water evaporation and heat losses, the heat balance on air allows calculating
heat losses:
mH )T - T(Cm Q ewvOUTINairP,airlosses&&& ⋅∆−⋅⋅= eq. 3.1.4
Water evaporation was assumed to occur at the air wet bulb temperature Twb (in the range 40 -
45°C for air temperatures between 140 and 200°C). And air specific heat CP,air and water
latent heat of vaporization ∆Hv (Twb) can be considered as constant.
Knowing that all the sprayed water was evaporated inside the chamber:
wINOUTairew m)YY(mm &&& =−⋅= eq. 3.1.5
As we could expect, heat losses lowered when increasing the water flow rate because this led
to lower air temperature inside the chamber and thus to a lower temperature difference
between ambient air and air inside the chamber. And, for the same water flow rate, heat losses
were higher for higher air inlet temperature, leading to higher temperature difference between
chamber and ambient (Table 3.1.3)
However, values of the global heat exchange coefficient h obtained (eq. 3.1.2) from the heat
losses calculated during water spray drying (between 4 and 6.54 W.m-2
.K-1
) were not in
agreement with the value of 3 W.m-2
.K-1
determined from measurements on air without
atomization. And, whilst h was expected to be almost insensitive to the atomized liquid flow
rate the values obtained increased with the liquid flow rate. This could suggest that a part of
the air temperature decrease was due to some secondary ambient air entrance (remember that
dryer is under depression), resulting in air mixing leading to lower temperatures inside the
chamber. This part of temperature decrease would be independent from the liquid flow rate.
However a secondary ambient air entrance would not modify mass balance on air if the total
air flow rate airm& taken into account is effectively the sum of both hot inlet air (ambient air
heated up to TIN) and secondary ambient air flow rates, as both airs have the same water
content YIN. This requires to measure the total air flow rate at the exit of the chamber.
As heat losses, a secondary ambient air entrance would result in a non-isenthalpic drying.
1.2.5. Estimation of possible secondary ambient air flow rate
In order to confirm the hypothesis of secondary ambient air entrance and to quantify its flow
rate, a theoretical value for h was estimated from the nature and thickness of the dryer
chamber wall :

Part III – Results and discussion
96
Table 3.1.4. Calculation of the secondary ambient air entrance flow rate AMBairm& and of the air
mixture temperature Tmix (TIN 144 and 200°C, airm& 110 kg.h-1, Tamb = 18°C, h =2 W.m-2.K-1).
TIN
(°C) wm&
(kg.h-1)
HOTairm&
(kg.h-1)
AMBairm&
(kg.h-1)
%
secondary air
Tmix
(°C)
144 0 98.03 11.97 10.88 130.29
144 1.08 97.29 12.71 11.55 129.45
144 2.16 96.55 13.45 12.22 128.60
144 3.24 95.81 14.19 12.90 127.75
200 0 94.43 15.57 14.16 174.23
200 1.08 93.18 16.82 15.29 172.17
200 2.16 94.88 15.12 13.75 174.98
200 3.24 95.10 14.90 13.54 175.35
Figure 3.1.6. Comparison of air temperature and RH measured at point A for water and
maltodextrin DE12 solution drying (liquid flow rates: 15 and 25 ml.min-1 corresponding to 0.9 and 1.5
kg.h-1
for water; 25 ml.min-1
corresponding to 1.8 kg.h-1
for maltodextrin solution ; TIN 180°C; air flow
rate 110 kg.h-1
).

Part III – Results and discussion
97
hwall
hext Tamb Twall
Heat losses
∆x
x
h
1
h
1
h
1
h
1
extwallext
3.1.6 eq. λ
∆+=+=
∆x wall thickness (m); λ wall thermal conductivity (W. m-1
.K-1
); Twall ~ Tair inside the chamber
Heat exchanges between ambient air and external wall are due to natural convection, for
which a typical value is hext = 10 W.m-2
.K-1
.
Thermal conductivity of chamber wall (inox + insulant) was assumed to be ~ 0.040 W.m-1
.K-1
(data from Niro), and wall thickness ∆x was about 1.8 cm so that hwall = 2.2 W.m-2
.K-1
.
The theoretical value obtained for h was about 2 W.m-2
.K-1
. This value is lower than the one
calculated from air heat losses, confirming that the temperature decrease in the chamber is
probably not only due to heat exchanges through the chamber walls.
In order to take into account a secondary air entrance, the heat balance on air (eq. 3.1.4) must
be modified considering that:
AMBairHOTairair mm m &&& += = total dry air flow rate eq .3.1.7
airm& total dry air flow rate leaving the dryer (kg.s-1); AMBairHOTair mm && hot dry air flow rate, secondary ambient
dry air flow rate (kg.s-1
)
Assuming that Twall = TOUT, and that the quantity of water in inlet air can be neglected, the
simplified heat balance on air between chamber inlet and exit at steady state becomes:
)T(TShmH TCm TC m TC m ambOUTewvOUTairP,airambairP,AMBairINairP,HOTair −⋅⋅+⋅∆+⋅⋅=⋅+⋅ &&&& eq. 3.1.8
from which
)T-T(C
)T(TShmH )T-T(C m m
ambINairP,
ambOUTewvambOUTairP,air
HOTair⋅
−⋅⋅+⋅∆+⋅=
&&& eq. 3.1.9
Equations and 3.1.7 allow the calculation of the amount of hot and secondary air (Table
3.1.4). An average of 12-13% of total air flow rate appeared to be due to secondary air
entrance. Assuming that this secondary ambient air enters in the chamber from the roof close
to atomizer and is immediately mixed with hot air entering in the chamber, temperature of the
mixture Tmix can be calculated as:
amb
air
AMBair
IN
air
HOTair
mix Tm
mT
m
m T
&
&
&
&+= eq. 3.1.10
This suggests that due to the secondary ambient air entrance, the temperature of the drying air
entering in contact with sprayed drops could be Tmix instead of TIN. The calculated Tmix
without liquid atomization was in agreement with the temperature measured close to the
atomizer between air disperser and rotary wheel (Fig. 3.1.2). When TIN was 144°C, we
measured 132°C and for TIN 200°C we measured 182°C.

Part III – Results and discussion
98
0
10
20
30
40
50
60
0 5 10 15 20 25 30 35 40 45 50 55 60 65 70 75
t (min)
Na
Cl
co
nce
ntr
ati
on
(%
w/w
)
Input
step
Output
40% w /w MD12 solution,
colored, w ith 50% NaCl
40% w /w MD12 solution,
w ithout salt
Figure 3.1.7. Evolution of salt concentration in collected powder as a function of time (Input step: 40% w/w
MD12 solution containing 50% of NaCl in dry matter; Output step: 40% w/w MD12 aqueous solution without
salt; TIN 200°C, air flow rate 110 kg.h-1
, liquid flow rate 3.6 kg.h-1
).
0.00
2.00
4.00
6.00
8.00
10.00
12.00
0 2 4 6 8 10 12 14 16 18 20 22 24 26 28 30 32 34 36 38 40 42 44 46 48 50 52 54
t (min)
(a²+
b²)
^1/2
0
10
20
30
40
50
60
NaC
l co
ncen
tra
tio
n (
% w
/w)
Colour saturation index
Salt concentration
Figure 3.1.8. Evolution of salt concentration and of color saturation index in collected powder as a function
of time during the input step (40% w/w MD12 solution containing 50% of NaCl in dry matter, colored with pink
colouring; TIN 200°C, air flow rate 110 kg.h-1
, liquid flow rate 3.6 kg.h-1
).

Part III – Results and discussion
99
However, it was not possible to put in evidence experimentally some secondary air entry
inside the chamber. The lower air temperature measured close to atomizer could then also be
due to some air recirculation inside the chamber. Air pattern was investigated by numerical
simulation of the process (III.3).
1.3. Operating conditions for maltodextrin solutions drying
1.3.1. Choice of maltodextrin solution flow rates In order to compare water drying behavior to that of maltodextrin solutions, the feed flow
rates had to be defined.
First trials were performed with the same total volumetric flow rate (25 ml.min-1
) for water
and maltodextrin DE12 40% w/w solution (corresponding to 1.5 kg.h-1
for water and 1.8kg.h-1
for MD12 solutions). When switching from water drying to MD12 solution drying, air
temperature increased and relative humidity decreased (Fig. 3.1.6). This could be due to a
different drying behavior between free water and maltodextrin solutions, and to the fact that
for the same volumetric flow rate the amount of water to evaporate was different: 1.5 kg.h-1
in
the case of water drying, and only 1.08 kg.h-1
in 1.8 kg.h-1
of 40% w/w MD12 solution.
Therefore, we decided for further trials to work with flow rates for MD solutions and water
corresponding to the same amount of water to evaporate. This led to three solution flow rates
of 1.8, 3.6 and 5.4 kg.h-1
, corresponding to the three chosen water flow rates of 1.08, 2.16 and
3.24 kg.h-1
.
1.3.2. Residence time distribution inside Niro Minor Residence time distribution of particles in the dryer was estimated to determine time
necessary between two drying conditions to collect a representative powder sample and to
verify if powder recirculation could occur inside the spray dryer chamber.
Particles residence time distribution (RTD) was evaluated by studying the response curve to a
step input and output of solution (40% w/w) containing 50% maltodextrin and 50% NaCl as
tracer. Powder samples were collected regularly along the trial at the powder outlet (after
cyclone). Conductivity measurements on collected samples allowed evaluating salt
concentration evolution with time (Fig. 3.1.7). For the output step, also colour of collected
sample was measured. The two measurements were in agreement (Fig. 3.1.8).
The concentration of salt tracer C(t) at the outlet was normalized to the initial tracer
concentration C0 to obtain the non-dimensional response F(t) (varying from 0 to 1) (Fig.
3.1.9):
0
)()(
C
tCtF =
Some observations could be done:
• The shape of the F(t) = f(t) curve was similar for both input and output steps. After a
fast increase a decrease in salt concentration was observed after about 6-8 minutes
before increasing again more slowly. This decrease could be due to detachment of
powder stuck on walls, to powder recirculations inside the chamber or in the cyclone,
or to some experimental error.
• 50% of the sprayed solution salt concentration C0 was reached after 2-3 minutes of
running. This average powder residence time can be compared to the average air
residence time calculated assuming plug flow inside the chamber, in the exit pipes and
in the cyclone:

Part III – Results and discussion
100
0,00
0,10
0,20
0,30
0,40
0,50
0,60
0,70
0,80
0,90
1,00
0 5 10 15 20 25 30 35 40 45 50 55
t (min)
C/C
0
Output step
Input step
τ
Figure 3.1.9. RTD response curve to input and output steps; (Input step: 40% w/w MD12 solution containing
50% of NaCl in dry matter; Output step: 40% w/w MD12 solution without salt; TIN 200°C, air flow rate 110
kg.h-1
, liquid flow rate 3.6 kg.h-1
).

Part III – Results and discussion
101
s8.16h.m 105
m 49.0
V
VV Vτ
1-3
3
air
cyclone pipeschamber
air ==++
=&
eq. 3.1.11
airV& air volumetric flow rate (exit air T: 60°C; mass flow rate: 110 kg.h-1
; ρair(60°C): 1.05 kg.m-3
)
Mean particles residence time was superior to average air residence time, as observed
by Kieviet and Kerkhof (1995). This could suggest either that air flow pattern was not
plug flow inside the chamber (cf. III.3) or that powder particles did not follow air
during drying because of their inertia; some powder recirculations are likely to occur.
Also possible collisions with chamber walls could increase the measured particle
residence time.
• More than 20 minutes were necessary to reach the sprayed solution salt concentration
(C0) in collected powder. This means that when drying parameters are changed during
a trial, at least 20 minutes are necessary to collect a powder representative of the new
drying conditions. For this reason, in further trials, when operating conditions must be
changed, samples will be collected after 30 minutes.
A possible modelling of residence time distribution is reported in Annex I, noting that more
experiments are necessary for a complete interpretation.
Conclusion
Measurements on air temperature inside the Niro Minor pilot without liquid atomization put
in evidence the long time (> 1h) necessary to heat up the chamber and the presence of heat
losses, due to exchange between hot air and ambient air through chamber walls.
Water spray drying trials confirmed that drying was not isenthalpic. The heat and mass
balance on water in air between entrance and exit put in evidence that the measured
temperature decrease was due not only to losses by walls but probably also to some secondary
ambient air entrance. However, mass balance on air to estimate the evaporated water flow rate
may be used with total air flow rate measured at the exit of the equipment.
Air temperature and relative humidity can be measured inside the chamber during water or
solutions spray drying. With water drying, we could determine that more than 40 minutes
were necessary to reach stable values (steady state) when starting atomization. At steady state,
temperatures evolved along chamber height, with no radial variations. Two positions were
chosen for air relative humidity measurements: one (A) in the upper part of the chamber (limit
of Zone I) and one (B) in the conical part representative of air leaving the dryer chamber.
Process operating parameters for liquid solution drying were chosen taking into account the
dryer evaporative capacity and the expected effect on drying behaviour. In order to compare
drying behaviour of water with drying behaviour of maltodextrin solutions, we chose to
compare trials for which the water to evaporate flow rate was the same.
Injection of a coloured saline solution permitted to calculate a particle average residence time
of 2 minutes, and indicated that more than 20 minutes have to be waited at steady state before
collecting the powder representative of one drying condition. The wide residence time
distribution may suggest that some particles are recirculating inside the chamber and/or stay,
at some moment, stuck on walls.

Part III – Results and discussion
102
Table 3.2.1. Effect of liquid flow rate and rotary atomizer velocity on calculated Sauter diameter of water and
maltodextrin DE12 (40 % w/w) drops (ATOT: total spray exchange surface).
Table 3.2.2. Example of temperature and water vapour pressure differences (∆T, ∆P) between air and drop
surface of water and maltodextrin solution at the beginning of drying (Period I) and at the beginning of the
falling rate drying period for maltodextrin (Period II) (TIN 144°C, 2.16 kg.h-1 of water and 3.6 kg.h-1 MD).
* 16.9% (70 °C)
+
66
+
68
+
67
+ 67
+
68
+
68
* 17.6% (66 °C)
+
66
+
68 144
Water 2.16 kg.h-1
; 20 °C
a
MD12 40% w/w: 3.6 kg.h-1
; 20 °C
+ 73
+
75
+
74
+
74
+
75
+
76 +
75
+
73
* 10.8% (76 °C)
144
b
Ambient air
110 kg.h-1
; 19.5 °C RH: 49%
* 15% (73 °C)
Ambient air
110 kg.h-1; 19.5 °C RH: 49%
Zone I
Zone II
Figure 3.2.1. Air temperature and relative humidity measured at steady state for (a) water and (b) solution of
maltodextrin DE12 with the same amount of water to evaporate (TIN: 144°C, air flow rate: 110 kg.h-1
, liquid flow
rate: 2.16 kg.h-1 (a) and 3.6 kg.h-1 (b)).
Liquid flow rate Liquid feed
(ml.min-1) (L.h-1)
)m( m wl&&
(kg.h-1
)
vwheel
(rpm) d3,2
(µm) ATOT
(m2.s
-1)
Water 36 2.16 2.16 25000 14 0.248
MD12 50 3 3.6 (2.16) 25000 34 0.147
Water 36 2.16 2.16 30000 13 0.277
MD12 50 3 3.6 (2.16) 30000 30 0.166
MD12 25 1.5 1.8 (1.08) 25000 30 0.084
MD12 50 3 3.6 (2.16) 25000 34 0.147
MD12 75 4.5 5.4 (3.24) 25000 37 0.204
Water 18 1.08 1.08 25000 13 0.143
Water 36 2.16 2.16 25000 14 0.248
Water 54 3.24 3.24 25000 16 0.344
Air properties Drop properties
Period T
(°C)
RHair
%
Pwsat(T)
(mbar) Pv
air(T) (mbar)
Ts
(°C)
aw Pwsat(Ts)
(mbar)
Pvdrop(Ts)
(mbar)
∆P
(mbar)
∆T
(°C)
I (t=0) 144 0.1 430 4.3 40 1 73.8 73.8 69.5 104
II (water) 68 14 312 44 40 1 73.8 73.8 29.8 30
II (MD) 75 14 350 44 50 0.5 120 60.0 60.0 20
Hot air 110 kg.h-1
(ambient 19.5 °C RH : 49%)
Hot air 110 kg.h-1
(ambient 19.5 °C RH : 49%)
Part III – Results and discussion
103
2. Drying behavior and stickiness development for maltodextrin
solutions
The objective was to link the evolution of air properties (temperature, relative humidity)
inside the dryer chamber to the drying behavior of water and maltodextrin DE12 and DE21
aqueous solutions that will be compared.
For maltodextrin solutions, the effect of several process parameters on the evolution of water
content of drying drops and on final powder properties (water content, water activity, size)
was investigated: inlet air temperature, flow rate, liquid flow rate and rotary atomizer speed.
Maltodextrins chosen as model products are able to exhibit a sticky behavior along drying.
From knowledge on the evolution of product properties and from glass transition
temperatures, possible conditions and positions for which particles could be sticky inside the
chamber were determined.
2.1. Drying of maltodextrin DE12 solutions and comparison with water
To compare drying behavior for maltodextrin solution and water, we choose to operate with
the same flow rate of water to evaporate which means different volumetric liquid flow rates in
relation with the density of the liquid sprayed (1200 kg.m-3
to 1000 kg.m-3
for water)
(Table 3.2.1).
2.1.1. Considerations on drying behavior of water and of maltodextrin solutions Compared to water, the maltodextrin solutions have higher viscosity and surface tension, and
the total sprayed flow rate was higher (to have the same amount of water to evaporate).That
leads to a higher calculated Sauter diameter (eq. 1.4) of maltodextrin drops, for the same
wheel velocity (Table 3.2.1).
Assuming no size distribution in the spray, total exchange surface of the spray can be
calculated as:
dropl
l2drop3
dropl
ldrop
drop
TOTdropdropsTOT
d ρ
md π
d (π ρ
m 6A
V
V A N A
&& 6
)=⋅==⋅= eq. 3.2.1
Then, with drops diameter between 30 and 37µm compared to 13 and 16µm for water (wheel
velocity 25000 rpm), with the same water flow rate, the total exchange surface for
maltodextrin spray should be 60% of the exchange surface in a water spray (Table 3.2.1). This
should lead to an initial evaporation rate (atomizer exit) lower when drying maltodextrin
solutions.
Furthermore, water activity of water drops is equal to 1 during the whole drying process, and
Pv (Ts) = Pwsat
(Ts). The drops surface temperature Ts is equal to the air wet bulb temperature
Twb varying in the range 40 to 45°C for air inlet tempertaure varying between 140 and 200°C.
For maltodextrin drops, surface water activity is equal to 1 only in the first period of drying
(free water). But quickly the drop surface is no more saturated, and drying is controlled by
water diffusion from particle core to surface (2nd
period of drying) with a surface water
activity inferior to 1 and a reduced vapour pressure at the drop surface:
Pv drop
(Ts) = aw Pwsat
(Ts). and Pvair
= RH. Pwsat
(T) eq. 3.2.2

Part III – Results and discussion
104
Table 3.2.3. Water spray drying: air temperatures, relative humidity and water content
at point A and B at steady state.
Table 3.2.4. Spray drying of 40% w/w maltodextrin DE12 solutions: air temperatures,
relative humidity and water content at point A and B at steady state; final powder properties
and calculated water content in A and B.
Water
TIN (°C) 200 174 144
airm& (kg.h-1) 110 80 110 110
vwheel (rpm x 103) 22.5 25 30 25 25 25
liquidm& (kg.h-1) 3.24 1.08 2.16 3.24 2.16 2.16 2.16 1.08 2.16 3.24
A 110 124 110 85 110 98 91 92 70 52
B 104 117 104 81 104 92 86 88 68 50
Tair (°C) OUT 104 117 104 81 104 92 86 88 67 50
IN 0.1 0.1 0.1 0.1 0.1 0.1 0.2 0.4 0.4 0.4
A 3.6 1.1 3.5 12.9 3.7 6.7 7.3 4.0 16.9 58.9
RH air
(%) B 4.1 1.2 4.1 13.7 4.1 7.7 8.6 4.5 17.6 61.1
IN 12 10 10 11 12 12 10 10 10 11
A 30 29 30 41 30 32 31 20 30 41 Yair
(g water/
kg dry air) B 30 19 30 41 30 32 31 20 30 41
Maltodextrin DE12
TIN (°C) 200 174 144
airm& (kg.h-1) 110 80 110 110
vwheel (rpm x 103) 22.5 25 30 25 25 25
liquidm& (kg.h-1) 3.6 1.8 3.6 5.4 3.6 3.6 3.6 1.8 3.6 5.4
A 118 139 117 95 116 103 101 94 76 58
B 110 130 110 91 110 97 97 90 72 55
Tair (°C) OUT 110 130 110 91 110 97 97 90 72 55
IN <0.5 <0.5 <0.5 <0.5 <0.5 <0.5 <0.5 <0.5 <0.5 <0.5 A 2.3 0.9 2.8 6.7 2.4 4.9 6.1 3.3 10.8 33.5
RH air
(%) B 3.0 1.1 3.1 8.2 3.3 5.7 7.1 4.3 13.2 39.0
IN 12 10 10 11 12 12 10 10 10 11
A 26 19 29 37 27 32 27 17 28 38 Yair
(g water/
kg dry air) B 26 19 29 39 27 32 28 19.5 29 40
X A calculated // // // // // // // 10.0 11.5 12.5
X B calculated // // // // // // // 4.8 4.8 8.0
X (g water/100g solids) 1.6 1.2 1.6 3.4 1.8 2.7 3.6 2.9 4.8 8.8
aw 0.05 0.05 0.05 0.12 0.05 0.10 0.13 0.10 0.18 0.39
d50 (µm) 25 26 26 30 21 25 24 22 23 26
d3,2 (µm) 20 17 20 20 16 19 17 16 16 16
d4,3 (µm) 36 28 36 43 28 35 28 32 28 38
d0,1 (µm) 13 12 13 12 11 12 12 10 11 11
d0,9 (µm) 52 49 53 50 43 53 50 50 46 62

Part III – Results and discussion
105
The surface temperature will increase, reducing temperature difference between air and drop.
The driving force (water vapor pressure difference) for mass transfer is then lower than when
drying water. Example is given in Table 3.2.2 for aw decreasing to 0.5. That leads to lower
evaporation rates when drying maltodextrin solutions and so to higher air temperatures and
lower air water content inside the chamber compared to water drying.
These considerations were verified during experiments on water and maltodextrin DE12
solutions, using the following operating parameters: inlet air temperature TIN 144 – 174 –
200°C, air flow rate airm& 80 – 110 kg.h
-1, rotary atomizer velocity vwheel 22500 – 25000 –
30000 rpm, liquid flow rate lm& 1.8 – 3.6 – 5.4 kg.h
-1 with 1.08 – 2.16 – 3.24 kg.h
-1 of water to
evaporate.
The measured air temperatures (up to 12 points) and RH (points A and B) (Table 3.2.3, 3.2.4)
gave cartographies at steady state. An example is given in Figure 3.2.1 for drying of water
and maltodextrin DE12 solution at 144°C. Some observations can be made :
• For the same water flow rate to evaporate, temperatures inside the chamber when
drying maltodextrin solutions were superior to temperatures measured during water
drying; RH were lower, with a lower air water content Y (calculated from T and RH
values) at any point of the chamber.
• A big decrease of air temperature was observed in the upper part of the chamber close
to atomizer (Zone I). In this zone, temperature decrease varied from 50 to 100°C
depending on process parameters. Below this zone just a slight temperature decrease
(~4 to 7°C) was observed between point A and the exit of the chamber (point B).
• Air water content Y, increased strongly from inlet to point A, and then small (or no)
variations were observed from A to B.
This means that most of drying occurred in the upper part of the chamber around the atomizer
exit (Zone I). However, for maltodextrin, drying was not completed in all cases in Zone I, as
it was for water drying.
2.1.2. Effect of process parameters on spray drying behavior of maltodextrin solutions
Measured air and product properties for the tested conditions are reported in Table 3.2.4.
In the co-current spray dryer used, we assumed that drying particles follow the air flow
pattern in the chamber and that the dry air flow rate is the total dry air flow rate measured at
the exit.
Drying particles average water content X* inside the chamber was then calculated from water
balances on product and air, between entrance and any point (*) inside the chamber.
The air water content Y* was deduced from Tair and RH (Mollier diagramme) and the
average water content X* of the particles during drying was calculated as :
s
IN
*
airw
s
*
eww*
m
))Y(Ym(m
m
mmX
&
&&
&
&& −−=
−=
⋅ eq. 3.2.3
X* particle water content (g water.g
-1 total solids);
wm& water flow rate in liquid feed (kg.s-1
); ewm& amount of
evaporated water at considered point (kg.s-1
); sm& solids flow rate in liquid feed (constant, kg.s
-1)
.

Part III – Results and discussion
106
708090
100110120130140150160170180190200210
-20 -10 0 10 20 30 40 50 60 70 80 90 100 110
chamber height (cm)
T a
ir (
°C)
1.8 kg/h
3.6 kg/h
5.4 kg/h
139°C
0.9% RH
Inlet air
200°C, 0.1%
RH
117°C
2.8% RH
95°C
6.7% RH
112°C
3.1%
92°C
8.2%
RH
131°C
1.1%
Zone I Zone II
∆T
61°C
∆T
105°C
∆T
83°C
∆T < 8°C(a) 200°C
405060708090
100110120130140150160170180190200210
-20 -10 0 10 20 30 40 50 60 70 80 90 100 110chamber height (cm)
T a
ir (
°C)
1.8 kg/h
3.6 kg/h
5.4 kg/h
90°C
4.3% RH
72°C
13.2% RH
55°C
39.0% RH
94°C
3.3% 76°C
10.8% 58°C
33.5%
RH
Inlet air
144°C, 0.4%
point Bpoint A
Zone IZone II
∆T
50°C∆T
68°C
∆T
86°C
∆T < 5°C (b) 144°C
0.000
0.005
0.010
0.015
0.020
0.025
0.030
0.035
0.040
0.045
0.050
0 10 20 30 40 50 60 70 80 90 100chamber height (cm)
Y a
ir (
g w
ate
r/g d
ry a
ir)
1.8 kg/h
3.6 kg/h
5.4 kg/h
point A point B
~ 99% e.w.
~ 99% e.w.
~ 96% e.w.~ 99% e.w.
~ 99% e.w.
~ 99% e.w.
(a) 200°C
0.000
0.005
0.010
0.015
0.020
0.025
0.030
0.035
0.040
0.045
0.050
0 10 20 30 40 50 60 70 80 90 100
chamber height (cm)
Y a
ir (
g w
ate
r/g
dry
air
)
1.8 kg/h
3.6 kg/h
5.4 kg/hpoint A point B
~ 92% e.w.~ 96% e.w.
~ 94% e.w. ~ 97% e.w.
(b) 144°C
Figure 3.2.2. Effect of feed flow rate on measured air temperatures and relative humidities at steady state
inside the NIRO Minor as a function of chamber height for maltodextrin DE12 solutions (40% w/w) ((a) TIN
200°C (b) TIN: 144°C ; air flow rate 110 kg.h-1
; liquid flow rate 1.8 – 3.6 – 5.4 kg.h-1
; rotary atomizer velocity:
25000 rpm).
Figure 3.2.3. Effect of feed flow rate on air water content Y and percent of evaporated water at point A and B
at steady state for solution of maltodextrin DE12 40% w/w. ((a) TIN 200 °C; (b) TIN 144 °C; air flow rate 110
kg.h-1
; liquid flow rate 1.8 – 3.6 – 5.4 kg.h-1
; rotary atomizer velocity: 25000 rpm).

Part III – Results and discussion
107
Effect of liquid flow rate When increasing the atomized liquid flow rate from 1.8 to 3.6 and 5.4 kg.h
-1, lower air
temperatures and higher air relative and absolute humidities Y were observed inside the
chamber at any level for the same air inlet temperature (Fig.3.2.2 and Fig. 3.2.3).
Higher temperature decrease in Zone I can be explained by the fact that when increasing the
liquid flow rate a bigger number of larger drops was formed by atomization, leading to a
larger exchange surface at the beginning of drying (Table 3.2.1). From the initial moment,
heat exchange was enhanced and a larger amount of water was evaporated leading to higher
water contents and lower temperatures everywhere inside the chamber.
For trials at 200°C, air temperatures decreased in Zone I from 200°C to 139, 117 and 95°C
for respectively 1.8 3.6 and 5.4 kg.h-1
of total liquid flow rate. Air relative humidity inside the
chamber was lower than 3% for 1.8 and 3.6 kg.h-1
and inferior to 10% even for the highest
liquid flow rate of 5.4 kg.h-1
(8.2% at point B).
Due to the accuracy of the RH measurements (± 1%), it was not possible to solve the mass
balance on water in air to calculate average particle water content inside the chamber. At low
relative humidity, 1% of error in RH measurement could lead to more than 20% error in
determination of air water content and so in the solution of the mass balance on water in air.
But in any case we could observe that air water content did not vary from position A to B
(Fig. 3.2.3a), so that we could assume that for an inlet air temperature of 200°C drying was
already completed in Zone I; only for the highest tested liquid flow rate of 5.4 kg.h-1
drying
air water content increased slightly from A to B (from 38 to 39 g.kg-1
), meaning that drying
still continued below Zone I. Further decrease in air temperatures (3 to 8°C) was due to heat
losses; the lower the liquid flow rate, the higher the temperatures inside the chamber and so
the heat losses, leading to a more important air temperature decrease from the top to the
bottom of the chamber.
According to the very fast drying and the high temperatures inside the chamber, final powder
water content was low. For 1.8 and 3.6 kg.h-1
it was inferior to 2%, and for 5.4 kg.h-1
it was of
3.5%. Water activity was never higher than 0.12, in agreement with MD12 sorption isotherms
and inferior to the air relative humidity at the exit of the chamber.
Final powder size increased with liquid flow rate, in agreement with the bigger size of initial
atomized drops (Table 3.2.1). The biggest differences could be seen for the average
volumetric diameter d4,3 that increased from 28 to 36 and 43 µm for respectively 1.8, 3.6 and
5.4 kg.h-1
. The mean and the Sauter diameters d50 and d3,2 increased slightly with the flow rate
(from 26 to 30 µm for d50 and from 17 to 20 µm for d3,2). In any case 90% of the final powder
was smaller than 53 µm (Table 3.2.4.).
For an inlet air temperature of 144 °C (Fig. 3.2.2b and 3.2.3b), the effect of liquid flow rate
on air properties and final powder characteristics was more important. For the lowest liquid
flow rate of 1.8 kg.h-1
, air temperature decrease in Zone I was of 50°C, with a relative
humidity at point A of 3.3%. Increasing the liquid flow rate to 3.6 and 5.4 kg.h-1
, air
temperature decrease in Zone I increased to 73 and 86°C respectively, with relative humidities
increasing to 10.8 and 33.5%. For any liquid flow rate, air water content increased from point
A to B, meaning that drying still continued in Zone II. From mass balances we calculated that
powder average moisture content at point A was still higher than 10%, while final recovered
powder had a moisture content varying from 2.9 to 8.8 % (Table 3.2.4.).
The highest liquid flow rate of 5.4 kg.h-1
appeared to be a drying limit for trials at 144°C. In
this situation, air in Zone II was cold (<60°C) and humid (34-39 % RH) so that drying rate
was low and a still humid final powder (X = 8.8%) was obtained. In this case, an important

Part III – Results and discussion
108
60
70
80
90
100
110
120
130
140
150
160
170
180
190
200
210
-20 -10 0 10 20 30 40 50 60 70 80 90 100 110
chamber height (cm)
T a
ir (
°C)
200°C
144°C
174°C
200°C
0.1% RH
174°C
0.1% RH
144°C
0.1% RH
Zone I Zone II
76°C
10.8% RH
∆T
68°C
∆T
73°C
∆T
83°C
101°C
6.1% RH
117°C
2.8% RH
∆T < 7°C
110°C
3.1% RH
72°C
13.2% RH
97°C
7.1% RH
point Apoint B
Figure 3.2.4. Effect of inlet air temperature on measured air temperatures and relative humidities at steady
state inside NIRO Minor as a function of chamber height for maltodextrin DE12 solutions 40% w/w. (TIN: 144 –
174 – 200°C; air flow rate: 110 kg.h-1
; liquid flow rate: 3.6 kg.h-1
; rotary atomizer velocity: 25000 rpm).
90
100
110
120
130
140
150
160
170
180
190
200
210
-20 -10 0 10 20 30 40 50 60 70 80 90 100 110
chamber height (cm)
T a
ir (
°C)
110 kg/h
80 kg/h
117°C
2.8% RH112°C
3.1% RH103°C
4.9% RH99°C
5.7% RH
Inlet air
200°C, 0.1%
RH
∆T
83°C
∆T
97°C
Zone IIZone I
Figure 3.2.5. Effect of drying air flow rate on measured air temperatures and relative humidities at steady
state as a function of chamber height for maltodextrin DE12 solutions (TIN 200°C; air flow rate 80 – 110 kg.h-1
;
liquid flow rate 3.6 kg.h-1
; rotary atomizer velocity 25000 rpm).
Figure 3.2.6. Effect of drying air flow rate on calculated air water content Y and percent of evaporated water at
point A and B at steady state for solution of maltodextrin DE12 40% w/w (TIN 144 °C; air flow rate 110 kg.h-1
;
liquid flow rate 1.8 – 3.6 – 5.4 kg.h-1
; rotary atomizer velocity 25000 rpm).
0
0.005
0.01
0.015
0.02
0.025
0.03
0.035
0.04
0 10 20 30 40 50 60 70 80 90 100chamber height (cm)
Y a
ir (
g w
ate
r/g
dry
air
)
110 kg/h
80 kg/h
point A point B
~ 99% e.w. ~ 99% e.w.
~ 99% e.w.~ 98% e.w.

Part III – Results and discussion
109
part of product (~50%) was found stuck on the chamber walls. Collected powder water
activity was of 0.39, equal to the air relative humidity at the exit of the chamber.
As for trials at 200°C, final powder moisture content increased with the liquid flow rate
(Table 3.2.4) and powder size slightly increased. Differences could be better observed on d4,3
that increased from 28 to 32 and 38 µm, while Sauter diameter was in any case about 16µm
and median diameter d50 varied from 22 to 26 µm; 90% of powder was smaller than 62 µm.
Effect of inlet air temperature
Inlet air temperature determined the initial temperature difference ∆T between air and drops
surface and so the initial evaporation rate. For the same liquid flow rate of 3.6 kg.h-1
of MD12
solution, increasing the inlet air temperature from 144°C to 174°C and 200°C led to a faster
evaporation rate, resulting in a bigger air temperature decrease in Zone I. It was of 86°C for
TIN = 200°C compared to 73°C and 50°C for respectively 174°C and 144°C (Fig. 3.2.4).
In Zone II, between point A and the bottom of the chamber (TOUT), a small decrease in air
temperature was measured: respectively 4 and 7°C for inlet air temperature of 144 and 200°C.
For trials at 200°C, this variation was essentially due to heat losses since air water content
was constant between A and B showing that drying was completed in zone I. For inlet air
temperature of 144°C and 174°C, air water content increased slightly from 28 (A) to 29 (B)
g.kg-1
, (Table 3.2.4) showing that drying continued in Zone II.
Final powder water content depended on inlet air temperature. It varied from 1.6% for inlet air
temperature of 200°C to 3.6 and 4.8% for 174 and 144°C, for the same feed flow rate.
Effect of rotary atomizer velocity
A higher rotary atomizer speed should lead to the formation of a larger number of smaller
liquid drops for the same liquid flow rate (Table 3.2.1).
For a liquid flow rate of 3.6 kg.h-1
, final powder size was almost insensitive to an increase of
velocity from 22500 to 25000 rpm. But, when increasing velocity to 30000 rpm, d4,3 of
collected powder decreased from 36 µm to 28 µm, d50 from 26 to 21 µm and d3,2 from 20 to
16 µm. Due to the increased total exchange surface of the spray a better drying should be
expected, but no difference in air temperatures and water content could be observed with an
inlet air temperature of 200°C, as evaporation was in any case so fast that drying was already
completed in zone I. Powders with the same moisture content (1.6 ± 0.2%) were obtained for
the tested rotary wheel velocities.
Effect of air flow rate
Two different air flow rates were tested (80 and 110 kg.h-1
) at 200°C, with a maltodextrin
solution flow rate of 3.6 kg.h-1
. For a given inlet air temperature and liquid flow rate, the
initial evaporation rate (t = 0) was the same in both cases (same temperature difference
between air and drops, and same spray exchange surface).
Depending on air flow rate, we observed different air water content and air temperature
decrease (Fig. 3.2.5 and 3.2.6). The lower the air flow rate, the higher the air temperature
decrease as:
airp
vew
airmc
H mT
&
&
⋅
∆⋅=∆ eq. 3.2.4
The air water content (and thus relative humidity) for the same amount of evaporated water is
higher for lower air flow rates, according to the mass balance of water in air:
air
ew
IN
**
airewINairm
mYYYmmYm
&
&&&& +=⇒=+ eq. 3.2.5

Part III – Results and discussion
110
Table 3.2.5. Comparison between spray drying of solutions of maltodextrin DE12 and DE21. Air
temperatures, relative humidity and water content at point A and B inside the chamber at steady state;
measured final powder properties and calculated water content in A and B.
Figure 3.2.7. Air temperature and relative humidity at steady state for solution of (a) maltodextrin DE12 and
(b) DE21 (TIN 144 °C; air flow rate 110 kg.h-1
; liquid flow rate 3.6 kg.h-1
; rotary atomizer velocity 30000 rpm).
Maltodextrin DE21 DE12
TIN (°C) 144 144
airm& (kg.h-1) 110 110
vwheel (rpm) 25000 25000
liquidm& (kg.h-1) 1.8 3.6 5.4 1.8 3.6 5.4
A 93 72 // 94 76 58
B 88 70 // 90 72 55
Tair (°C) OUT 88 70 // 90 72 55
IN <0.5 <0.5 // <0.5 <0.5 <0.5
A 3.4 11.5 // 3.3 10.8 33.5
RH air
(%) B 3.9 13.1 // 4.3 13.2 39.0
IN 7 7 // 10 10 11
A 16 25 // 17 28 38 Yair
(g water/
kg dry air) B 16.5 26 // 19.5 29 40
X A calculated 9 11.5 // 10.0 12.0 12.5
X B calculated 5.0 5.5 // 4.8 4.8 8.0
X (g water/100g solids) 3.5 5.5 // 2.9 4.8 8.8
aw 0.10 0.23 // 0.10 0.18 0.39
d50 (µm) 23 23 // 22 23 26
d3,2 (µm) 16 16 // 16 16 16
d4,3 (µm) 29 30 // 32 28 38
d0,1 (µm) 11 11 // 10 11 11
d0,9 (µm) 47 48 // 50 46 62
* 10.8% (76 °C)
+
74
+
73
+
75
+
74 +
75
+
75
* 13.2% (72 °C)
+
72
+
76 144
MD12 40% w/w: 3.6 kg.h-1
; 20 °C
(a)
+
71
+
71
+
72
+
71 +
72
+
72
* 13.1% (70 °C)
+
70
+
72
* 11.5% (72 °C)
144
(b)
Hot air
110 kg.h-1
MD21 40% w/w: 3.6 kg.h-1
; 20 °C
Hot air
110 kg.h-1;
Zone I
Zone II

Part III – Results and discussion
111
For this reason, drying behavior was different. With an air flow rate of 80 kg.h-1
, water
content at point A was 32 g.kg-1
and temperature decrease was 97°C, with a relative humidity
of 4.9%. When the air flow rate was increased from 80 to 110 kg.h-1
, the air water content
calculated at point A was 29 g.kg-1
and the air temperature decrease in Zone I was 82°C, with
a relative humidity in A of 2.9%.
Due to a lower air temperature and a higher RH, drying in zone II was slower with the lower
air flow rate, leading to a more humid final powder (2.7% instead of 1.6%).
Conclusion on the effect of operating parameters
Air properties evolution (T, RH) could be measured for maltodextrin solution spray drying,
and allowed estimating the drying behavior and average water content of particles inside the
chamber.
We put in evidence how drying appeared to be very fast, and most of drying was performed
just after drops were formed. This result is in agreement with literature (King, 1984) For high
inlet air temperature and/or low liquid flow rate, we can assume that drying is completed in
the upper part of the chamber and no more variation of product water content occurs in the
bottom part.
Air relative humidity at the exit of the chamber (position B) was a good indicator of final
powder water activity as observed by Schuck (2008) but it was usually slightly higher than
final powder water activity, meaning that equilibrium between exit air and powder is not
totally reached.
Size of final powder was just slightly dependent on tested operating conditions. In all trials
the powder d50 was between 16 and 20 µm, with 90% of the powder smaller than 50 µm.
2.2. Comparison between MD21 and MD12 and water drying behavior
The influence of the nature of the dried product was studied by comparing spray drying of
solutions of maltodextrin DE12 and DE21. The chemical structure of glucose chains in these
two maltodextrins led to a different affinity for water, with consequences on drying and
sticking properties.
Drying of maltodextrin DE 21 solutions (40% w/w) was done with the same liquid flow rates
as for MD12 solutions. The inlet air temperature was fixed at 144°C, the temperature for
which the drying of MD12 solution lead to variations of air properties (RH, Y) in the chamber
when changing flow rate.
For the same atomized liquid flow rate, measurements of air properties inside the chamber
suggested that the drying behavior of MD21 and MD12 solutions was different (Table 3.2.5
and Fig. 3.2.7). For liquid flow rates of 1.8 and 3.6 kg.h-1
, measured values for temperatures,
relative humidities and air water content during drying of MD21 were between the ones
measured during water and during MD12 drying. The initial evaporation of water from drops
of MD21 solution was easier than for MD12 solution in Zone I. From water mass balance at
point A we calculated an average MD21 particle water content of 11.5%, and 12% for MD12.
In the second part of the chamber the lower air temperatures for MD21 drying led to a
reduced evaporation rate, so that final powder moisture content (and water activity) of MD21
powder was slightly higher than the one of MD12 powder (3.5 compared to 2.9% for 1.8 kg.h-
1 and 5.5% compared to 4.8% for 3.6 kg.h
-1).
When increasing the total flow rate of solution to 5.4 kg.h-1
, no more powder could be
recovered for MD21 (semi-liquid product was stuck on chamber walls), while MD12 powder
could still be obtained.

Part III – Results and discussion
112
0102030405060708090
100110120130140150160170
0.00 0.10 0.20 0.30 0.40 0.50 0.60 0.70 0.80 0.90 1.00
T (
°C)
25.2716.5212.079.337.395.864.45
22.4814.9511.178.897.356.225.31
MD 12
Tg
MD 21MD12 sticky zone
MD21 sticky zone
X = f(aw) from
sorption isotherms
at 23°C MD 21
aw
Tg
MD 12
drop 20°C, t=0
40°C powderT < 55°C
drop drying
X
Figure 3.2.8. Sticky zones for maltodextrin DE12 and DE21.
0102030405060708090
100110120130140150160170
0.00 0.10 0.20 0.30 0.40 0.50 0.60 0.70 0.80 0.90 1.00
T (
°C)
25.2716.5212.079.337.395.864.45
22.4814.9511.178.897.356.225.31
MD 12
Tg
MD 21MD12 sticky zone
MD21 sticky zone
X = f(aw) from
sorption isotherms
at 23°C MD 21
aw
Tg
MD 12
MD 21 particle stickiness
for 40 < T < 55 °C
MD 12 particle stickiness
for 40 < T < 55 °C
drop 20°C, t=0
40°C powderT < 55°C
X sorption isotherm
aw
MD 12
MD 21
drop drying
X
Figure 3.2.9. Evolution of drops properties during spray drying of maltodextrin DE12 and DE21
solutions (X = f(aw) sorption isotherms at 23°C, Tsticky = Tg + 30°C ).
Table 3.2.6. Possible stickiness of particles at point A during drying of solutions of maltodextrin
DE12 and DE21 (40 % w/w) inside NIRO Minor (air inlet 144 °C, 110 kg.h-1
).
Liquid (water)
flow rate (kg.h-1)
T powder
(°C)
Twb
(°C)
∆Y A-IN
(g.kg-1)
X A
(%)
Tg A
(°C)
Sticky in A
MD12 1.8 (1.08) 55 40 0.007 10 ± 5 65-95 Too low accuracy
MD12 3.6 (2.16) 50 40 0.018 12.0 ± 0.5 53-83 NO
MD12 5.4 (3.24) 41 40 0.027 12.5 ± 0.5 43-73 NO
MD21 1.8 (1.08) 55 40 0.009 9 ± 5 30-60 Too low accuracy
MD21 3.6 (2.16) 47 40 0.018 12.0 ± 0.5 10-40 YES
MD21 5.4 (3.24) // // // // // BLOCKAGE

Part III – Results and discussion
113
Differences between drying behavior of the two maltodextrins can be explained by
considering their properties.
A first difference is the viscosity of the liquid solutions (Fig. 2.4). At 20°C the MD21 solution
(40% w/w) has a viscosity more than 50% lower than MD12 (0.028 Pa.s compared to 0.065
Pa.s). This can lead to a higher diffusivity of water in MD 21 drops and therefore faster
drying.
MD21 has smaller chains than MD12, with lower molecular weight. This leads to lower glass
transition temperatures Tg for MD21 compared to MD12 (140°C instead of 180°C for dry
powders). And for humid powder (or particle during drying), for water activity inferior to 0.8,
Tg of MD21 are always lower (~ -40°C) than MD12 ones, depending on the water activity
(linked to water content by sorption isotherms) (Fig. 3.2.8.).
As far as the particle is in conditions of temperature and water actvity (water content) above
the glass transition line, it could be considered as liquid or sticky (see bibliography). Due to
their lower glass transition temperatures, particles of MD21 will exhibit a sticky/liquid
behavior during drying till water activity (water content) values lower than for MD12
particles.
When drying 5.4 kg.h-1
of maltodextrin DE12 solution at 144°C, a powder with a final water
content of 8.8% was recovered. This value for a powder temperature of ~ 40°C (wet bulb
temperature of drying air) was already below glass transition of MD12 so that powder could
still be collected. But for MD21 the drying and exit conditions would be above or close to
glass transition temperatures (Fig. 3.2.8), and this could explain why a liquid flow rate of 5.4
kg.h-1
of maltodextrin 21 solution at 144°C could not be dried and resulted in semi-liquid feed
stuck on walls.
2.3. Stickiness of maltodextrin DE12 and DE21 particles along spray drying
The objectives were to find and control operating conditions for which drying particles may
exhibit a sticky behaviour in the chamber. These conditions could then be used for dry
powder insertion and collisions with the sticky drying particles, leading to adhesion and
formation of solid bridges to build agglomerates.
A particle becomes sticky when its surface reaches a critical viscosity value of 106 – 10
8 Pa.s.
in relation with the glass transition temperatures Tg of the considered material. This value is
obtained for a domain of temperatures (T = f(aw); sticky region) between Tg and a sticky
temperature Tsticky 10 to 30 degrees higher than Tg. For maltodextrins Tsticky is about 30°C
higher than Tg (Palzer, 2005b). Above Tsticky, particles can still be considered as liquid while
below Tg, particles surface is no more sticky and the powder is considered as stable.
.
Knowing the initial and final temperature and water content of the drop/particle, it is possible
to represent the drying pattern of a liquid solution droplet on the T-aw diagram with sticky
regions (Fig. 3.2.8 and 3.2.9). At the beginning of drying (t = 0), liquid drops are formed with
a water activity close to 1 (free water) and an initial temperature equal to the liquid solution
temperature (~ 20°C). Almost instantaneously, the surface temperature will rise up to the wet

Part III – Results and discussion
114

Part III – Results and discussion
115
bulb temperature of the drying air. For inlet air used in spray drying trials (Tair between 144
and 200°C with Y between 0.007 and 0.012 g.kg-1
), air wet bulb temperature was between 40
and 45°C.
Once the water activity of drop surface is inferior to 1 (fast initial evaporation), the surface
temperature increases until reaching final powder temperature. For most of the tested
conditions, final maltodextrin powder (DE12 and 21) was in the stable zone below glass
transition temperatures: powder temperature varying between 40 and 55°C for water content
varying between 8.5 and 1.6%.
During the drying process, during a short period of time, inside the chamber, the drop/particle
surface should cross the sticky region. For MD12 particles the sticky region is crossed for
values of water activity between 0.60 and 0.75, corresponding to water content between 11
and 20% (sorption isotherms); and for MD21 particles for a larger range of water activity
between 0.35 and 0.65, corresponding to a water content between 6 and 13 %.
For maltodextrin DE12 drying, for inlet air 200°C, drying was completed in the upper part of
the chamber. Particles in Zone I were very close to their final water content so too dry to
present a sticky behaviour below the atomization zone.
For a lower inlet air temperature of 144°C, from mass balance of water in air, at point A, the
estimated average maltodextrin particles water content varied from 10 to 13% depending on
the liquid flow rate (Table 3.2.6). But these particles properties (X, T) also correspond to a
state below the glass transition.
Considering that surface water content was probably lower than the average one (humid core),
we concluded that MD12 particle at point A was too dry to exhibit a sticky behaviour. Except
for the high liquid flow rate of 5.4 kg.h-1
, particles with an estimated average water content of
12.5%, were close to the glass transition temperature curve and could possibly be sticky in
Zone I; however these drying conditions corresponded to the limit evaporative capacity of the
dryer so that they were not considered in the following study of powder insertion.
For MD21 average calculated water content at point A was slightly lower than the one
calculated for MD12 solutions drying in the same conditions. However due to the lower glass
transition temperatures, when drying 3.6 kg.h-1
of MD21 solution, particles at point A should
still be above or inside the sticky zone (water content 11.5%). In these drying conditions
MD21 particles could have a sticky behaviour all along drying in the chamber (Zone I and II).
Conclusion
Air temperatures and relative humidities were measured inside the NIRO spray dryer during
drying of water and maltodextrin DE12 and DE21 solutions.
Air properties evolution inside the chamber was found to be representative of drying process
and allowed estimating liquid drops drying behaviour for different process parameters. In
particular, the average particle water content evolution along drying could be calculated from
a water mass balance in air. In any situation, water evaporation from drop was very fast as
soon as in contact with hot air, in the upper part of the chamber, close to the atomizer.
A high percentage of water was removed in the upper part, but for the highest flow rates and
lowest drying air temperatures, drying continued at a lower rate in the rest of the chamber.
Drying behaviour of water and maltodextrin solutions was compared for the same amount of
water to evaporate. From the different measured air temperatures and relative humidities it
was concluded that evaporation of water bound with dry matter in solution was more difficult

Part III – Results and discussion
116
Figure 3.2.10. Scheme of data, measurements and calculations used to investigate particle stickiness in spray
drying.

Part III – Results and discussion
117
than evaporation of free water, for which drying was already completed in the first zone close
to atomizer.
Final powder water activity was inferior to the air relative humidity measured at the exit of
the chamber, indicating that in our experiments, equilibrium between air and product was not
reached at the exit of the chamber.
From knowledge of glass transition temperatures and sorption isotherms of dried material, it
was possible to estimate the domain of water content and water activity (T, aw, X) for which
particle could be sticky along their drying inside the chamber. Coupling this information with
calculated particle average water content inside the chamber (from air properties), possible
conditions and positions can be determined to have maltodextrin in a sticky state.
MD12 was very quickly dried below its glass transition temperature in any tested condition,
and thus could exhibit a sticky behaviour only close to atomizer (drops formation).
MD21 drying was found to be easier than drying of MD12 in the upper part of the chamber,
but due to the lower glass transition temperatures MD21 particles might be sticky all along
drying inside the chamber (liquid flow rate 3.6 kg.h-1
; inlet air temperature 144°C).
The approach proposed to investigate particle stickiness development is based on air
properties measurements (T, RH) and product characteristics (Tg = f(aw); sorption isotherms)
(Fig.3.2.10). It can be applied for different products and dryers, but some comments must be
added:
-The air flow rate at the different positions where air properties are measured, must be known,
which is not easy because of possible air recirculations, mixing with additional air (fines
return)...
-The use of sorption isotherms at 23°C is representative of equilibrium at a fixed temperature.
We also assumed that they represent desorption (drying) at temperatures between 20 to 50°C:
for the two maltodextrins these curves are very close.
-The conditions for stickiness of particle surface were deduced from an average water content
for particle (with humid core), which could be considered because of the small size of
drops/particles.

Part III – Results and discussion
118
Part III – Results and discussion
119
3. Spray drying CFD simulation
The objective of the numerical simulation was to calculate the evolution of air and drops
properties inside the Niro spray dryer. The evolution of drop temperature and water content
during drying as a function of their position (time) could be used to identify “sticky regions”.
To simulate the spray drying process, Computational Fluid Dynamics (CFD) was used with
the software Fluent 6.3 (Ansys, USA).
Modelling is a simplified representation of the real process complexity. Simulation of spray
drying required the choice of model equations, definition of geometry, of material properties
and of boundary conditions before numerical solution (Fig. 3.3.1). Some parameters of the
process were unknown and some simplifying hypotheses were used to reduce complexity
trying to remain close to reality.
Measurements of air temperature and humidity inside the chamber were used for
identification of model parameters and for model validation.
3.1. The model
The model considered two phases: a continuous phase (drying air) and a discrete phase (liquid
drops). Besides mass and heat balances equations, CFD allowed solving the Navier-Stokes
equations for turbulent flows, using the Reynolds-Averaged Navier-Stokes equations (RANS)
with a closure model (Fluent user guide, 1998).
3.1.1. Equations for the continuous phase: air The mass conservation (continuity equation) and the momentum conservation equations were
solved to calculate air flow rate (vector intensity and direction) at any point in the chamber.
Energy equation was solved to calculate heat exchanges. Equations were solved in an
Eulerian reference frame (fixed r, z, θ coordinates). Axi-symmetry was assumed (Hypothesis
1) (dx/dθ = 0 whatever the variable x) and only steady state was simulated (Hypothesis 2).
• Continuity equation The general form of the total mass conservation equation, valid for incompressible as well as
compressible flows is:
mair
air S)u (ρ t
ρ=⋅∇+
∂
∂ rr eq. 3.3.1
ρair gas density (kg.m-3
); u fluid velocity (m.s-1
); Sm mass source term (kg.m-3
.s-1
).
The mass source term corresponds to the mass flow rate per unit volume added to the
continuous phase from the dispersed phase (e.g. evaporated water).
At steady state we have:
mair
air S)u (ρ 0t
ρ=⋅∇⇒=
∂
∂ rr eq. 3.3.2
• Momentum conservation equations Conservation of momentum in an inertial (non-accelerating) reference frame is written as:

Part III – Results and discussion
120
Figure 3.3.1. Steps for implementing a CFD model of spray drying.
Choice of model equations
Definition of spray dryer
geometry and computational grid
Definition of boundary conditions
and material properties
Numerical solution
Interpretation of results:
air flow pattern, temperature,
water content, particles
trajectories, temperature, water
content

Part III – Results and discussion
121
FgρPuuρt
uρairair
airrrrrrrr
r
++⋅∇+∇−=⋅∇+∂
∂τ eq. 3.3.3
P static air pressure (Pa); τ stress tensor; gρair
r gravitational force; F
rexternal forces (e.g. from interaction with
dispersed phase).
At steady state, the accumulation term )u(ρt
air
r
∂
∂ was zero.
The stress tensor τ is given by :
( ) Iuµ 3
2 uuµτ t
eff
rrrrrr⋅∇−∇+∇= eq. 3.3.4
µeff: gas effective viscosity (Pa.s) (depending on turbulence model being used), and the second term is the effect
of volume dilatation; µ viscosity (Pa.s); I identity matrix.
• Energy equation The energy equation has the following form:
heff
jjjeffairair S))τ(ujHT(P))E( u(E)(
t '
'' ++−∇λ⋅∇=+ρ⋅∇+ρ∂
∂∑
rvvvrv eq. 3.3.5
with
keff gas effective thermal conductivity (J.s-1
.m-1
.K-1
); 'JJr
diffusion flux of species j’(kg.m
-2.s
-1); H gas specific
enthalpy (J.kg-1
); T air temperature (K); Sh heat source term (W.m-3
).
The first three terms on the right side represent energy transfer due to conduction, species
diffusion and viscous dissipation, respectively. The heat source term Sh includes all the
volumetric heat sources (e.g. from drops heating and vaporization).
• Turbulence modelling
To take into account turbulent flow inside the spray dryer chamber, a standard k-epsilon
model has been used (Launder and Spalding, 1974) (Hypothesis 3). This is a semi-empirical
model based on model transport equations for the turbulent kinetic energy k (m2.s
-2) and its
dissipation rate ε (m2.s
-3):
Mairk
k
tair YερGk
σ
µµ)uk (ρk) (
t−−+
∇
+⋅∇=⋅∇+
∂
∂ rrrr
airρ eq. 3.3.6
k
ερCG
κ
εCε
σ
µµ)uε (ρ)(
t
2
air2K1
ε
tair −+
∇
+⋅∇=⋅∇+
∂
∂ rrrrερair eq. 3.3.7
C1 = cste = 1.44; C2 = cste = 1.92; σk = turbulent Prandtl number for k = 1.0; σε = σk = turbulent Prandtl number
for ε = 1.3; µt gas turbulent viscosity (Pa.s)
Gk represents the generation of turbulent kinetic energy due to the mean velocity gradients,
and YM represents the contribution of the fluctuating dilatation in compressible turbulence to
the overall dissipation rate.
By combining k and ε, a turbulent (or « eddy ») viscosity is calculated:
where Cµ = constant = 0.09 eq. 3.3.8
2
u
ρ
PHE
2
+−=
ε
k²Cρµ µairt =

Part III – Results and discussion
122
Figure 3.3.2. Scheme of liquid drops drying in CFD simulation.
Drying time
Inert
core
Volatile
shell

Part III – Results and discussion
123
This turbulent viscosity is added to the fluid molecular viscosity to give an effective viscosity
µeff = µ + µt that is used in the turbulent momentum conservation equations.
3.1.2. Equations for the discrete phase: drops/particles Liquid drops were considered as perfect spheres (Hypothesis 4) composed by an inert core
surrounded by a volatile component (water) without interaction (no diffusion) between them
(Hypothesis 5) (Fig. 3.3.2).
• Trajectory calculation Trajectory of a particle (or drop) was predicted by integrating the forces balance on the
particle, which is written in a Lagrangian reference frame (moving along particle trajectories).
The particle inertia is equal to the sum of forces acting on the particle (drag forces,
gravitational forces...):
F)/ρρ(ρg)uu(Fdt
udPairPPD
Prrrr
r
+−+−⋅= eq. 3.3.9
ur
air velocity (m.s-1); Pur
particle velocity (m.s-1); ρair, ρp air and particle density (kg.m-3); gr
gravity
acceleration (m.s-2
); Fr
other forces (specific situations, like Coriolis force).
)uu(F PD
rr−⋅ is the drag force per unit particle:
24
ReC
dρ
18µF D
2
PP
D ⋅⋅
= eq. 3.3.10
dP particle diameter (m), Re Reynolds number, CD drag coefficient
For laminar flow Re < 0.2, CD = 24/Re (Stokes law)
For semi-turbulent flow 0.2 < Re < 1000, CD = 0.4 + 40/Re
For turbulent flow Re > 1000, CD = 0.44
• Heat and mass transfers Without considering radiation (Hypothesis 6), particle temperature was calculated according
to a heat balance that relates the sensible heat change in the drop to the convective and latent
heat transfer between the drop and the continuous phase:
vewPairdropcP
dropP,P Hm-)T(TAhdt
dTCm ∆⋅−⋅=⋅⋅ & eq. 3.3.11
mP particle total mass (kg); CP,drop drop (water) specific heat (J.kg-1
.K-1
); Adrop drop surface (m2), hc convective
heat transfer coefficient (J.s-1
.K-1
.m-2
), ∆Hv water latent heat of vaporization (J.kg-1
), ewm& evaporation rate (kg.s-
1); TP drop temperature (assumed to be homogeneous between core and surface – Tp = Ts (Hypothesis 7)) (°C).
The evaporation rate during drying was calculated as:
ewm& = kc.Adrop.(Cw, s – Cw, b).MW eq. 3.3.12
kC mass transfer coefficient (m.s-1
); Cw, s water vapour concentration at the surface of the drop (mol.m-3
); Cw, b
bulk air vapour concentration (mol.m-3
); Mw water molecular weight (kg.mol-1
)
The convective heat transfer coefficient h and mass transfer coefficient kC are calculated from
Ranz-Marshall correlations valid for 1 < Re < 450, Pr < 250, Sc < 250:
Nu = h.dP / k∞ = 2 + 0.6 Re1/2
.Pr1/3
Sh = kc.dP/Dw = 2 + 0.6 Re1/2
.Sc1/3
Nu Nusselt number, k∞ thermal conductivity of continuous phase (W.m
-1.K
-1), Sh Sherwood number Dw water
vapour diffusion coefficient in air (m2.s
-1), Pr Prandtl number (CP.µair/k∞), Sc Schmidt number (µair/(Dw.ρair))

Part III – Results and discussion
124
(a)
(b)
(c)
Figure 3.3.3. Simplified geometry for (a) spray dryer chamber; (b) air disperser; (c) air and liquid entrance
inside the computational grid.
4 cm
3 cm
3.5 cm
3 cm
Side view Top view
Reality Model
height (cm)
-10
0
27
80
49
Liquid feed
Hot Air
100
60
80 cm
TINTIN
Reality
Model
Liquid injection in
computational grid
(8 positions) Liquid
air
Air entrance in the
computational grid
Reality

Part III – Results and discussion
125
Considering water vapour as an ideal gas (Hypothesis 8) and uniform drop temperature so
that Ts = Tp (Hypothesis 6) the surface vapour concentration is calculated as:
P
P
drop
v
sW,RT
)(T PC = eq. 3.3.13
By default the vapour pressure Pvdrop
at the drop surface is the water saturated pressure Pwsat
at
particle temperature Tp. That corresponds to a situation in which liquid shell is composed by
free water, with no interaction with the solid core.
To simulate the drying of maltodextrin solutions, we must consider the fact that water is
bound with solids and that diffusion from core to surface appears, reducing the evaporation
rate. Thus, the vapour pressure Pvdrop
at the drop surface will be reduced by multiplying Pwsat
by a coefficient x lower than 1, considered as constant (Hypothesis 9):
Pvdrop
(Tp) = x . Pwsat
(Tp) 0 < x < 1; x = constant eq. 3.3.14
This approach is similar to the definition of a coefficient f = lew,m& /ewm& used by several
authors (Langrish and Kockel, 2001) for the “Characteristic Drying Curve” Model (see
Bibliography 6.2.3)
This coefficient will be identified using experiments with the specific dried solution (see
3.2.4).
3.1.3. Definition of the dryer geometry Geometry of the drying chamber has been designed with the software GAMBIT, also used for
building the computational grid exported to Fluent. Some simplifications have been adopted:
• A 2D axisymmetric geometry has been considered to reduce the complexity of the
system and computational time (Fig. 3.3.3a). (Hypothesis 1)
• Geometry of inlet air disperser has been simplified adopting an equivalent cylindrical
section (Fig. 3.3.3b) without considering blades. (Hypothesis 10)
• Liquid drops inlet has been considered as a cylindrical section in which every grid segment of the section corresponded to a liquid injection to simulate liquid spray by
rotary wheel (Fig. 3.3.3c). (Hypothesis 11)
Two computational grids made of triangular cells were then built; a coarse grid with 11000
cells and a fine grid with 44000 cells.
3.1.4. Boundary conditions
According to the chosen equations and geometry of the chamber, boundary conditions had to
be defined to start simulation (Table 3.3.1). Product properties used in simulation are listed in
Annex II.
Boundary conditions for air Inlet air velocity was defined from the condition “mass flow inlet” of Fluent, in which initial
air mass flow (usually 110 kg.h-1
) and velocity vector direction have to be defined. The
chosen model allows considering also swirl velocity of air (2D axisymmetric swirling flow).
Considering the angle formed by air disperser blades, we estimated that the inlet swirl
component of air velocity was five times bigger than the radial component (vt = 5.vr), and that
axial component was neglectable (vx = 0) (Fig. 3.3.4). So we defined (Hypothesis 12)
airm& = 110 kg.h-1
with vx = 0 and vt/vr = 5
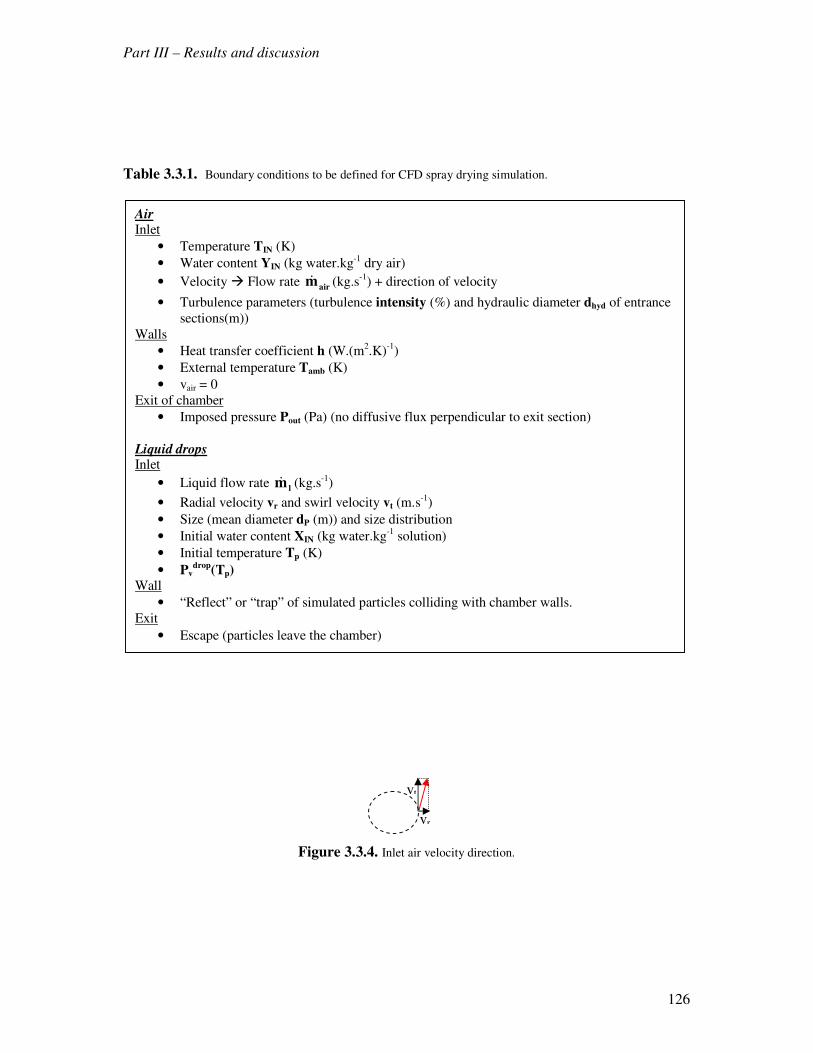
Part III – Results and discussion
126
Table 3.3.1. Boundary conditions to be defined for CFD spray drying simulation.
Figure 3.3.4. Inlet air velocity direction.
Air Inlet
• Temperature TIN (K)
• Water content YIN (kg water.kg-1 dry air)
• Velocity � Flow rate airm& (kg.s-1
) + direction of velocity
• Turbulence parameters (turbulence intensity (%) and hydraulic diameter dhyd of entrance
sections(m))
Walls
• Heat transfer coefficient h (W.(m2.K)
-1)
• External temperature Tamb (K)
• vair = 0
Exit of chamber
• Imposed pressure Pout (Pa) (no diffusive flux perpendicular to exit section)
Liquid drops Inlet
• Liquid flow rate lm& (kg.s-1)
• Radial velocity vr and swirl velocity vt (m.s-1)
• Size (mean diameter dP (m)) and size distribution
• Initial water content XIN (kg water.kg-1
solution)
• Initial temperature Tp (K)
• Pvdrop(Tp)
Wall
• “Reflect” or “trap” of simulated particles colliding with chamber walls.
Exit
• Escape (particles leave the chamber)
vt
vr

Part III – Results and discussion
127
As inlet air turbulence parameters we defined turbulence intensity and hydraulic diameter of
entrance air.
The turbulence intensity expresses velocity fluctuations with respect to air average velocity.
An initial value of 50% was chosen, assuming that air disperser caused a strong turbulence at
the entrance of the chamber. A sensibility study to verify the effect of different values of this
parameter on simulation results has been done (see 3.2.1).
The hydraulic diameter (for initial Reynolds number calculation) of the flat air conduct
formed by air disperser vanes blade is equal to two times the gap between two blades, so that
we have dhyd = 2 x 2 mm = 4 mm.
To consider the fact that air is sucked by a fan (depression), a negative pressure at air outlet (-
100Pa) was imposed (in the same order of magnitude than the measured value (-250Pa)).
The spray dryer chamber was not perfectly insulated, so that thermal losses due to heat
exchange with ambient air had to be considered. For this purpose, a global heat transfer
coefficient h was defined, as the sum of the thermal resistance of the wall (including
insulation) and the thermal resistance of the external boundary layer (see 1.1.2).
According to experimental results in chapter 1.1.2., the heat transfer coefficient was taken
equal to 2 W.m-2
.K-1, and a secondary entrance of ambient air equal to 12% of total air flow
rate was considered (Hypothesis 13). We assumed that secondary air entrance occurred close
to the atomizer, and we took it into account by proportionally lowering air inlet temperature
TIN with : TIN = 0.88Thot air + 0.12Tamb
For Tamb = 18°C and Thot air = 144°C and 200°C, TIN was129°C and 188°C respectively.
Boundary conditions for liquid drops Liquid drops were injected into the computational domain from every cell of the liquid
entrance. Liquid entrance was a “moving wall” having the same velocity than rotary wheel
(30000 rpm).
Swirl (vt) and radial (vr) velocity for inlet drops were calculated with the equations (Masters,
1985):
wheelt vd π v ⋅⋅= eq. 3.3.15
322
2
wheel
2
wheel
2
lr
nhµ
Vdvπρ0.024 v
⋅⋅
⋅⋅⋅⋅⋅=
&
eq. 3.3.16
dwheel rotary wheel diameter (0.05m); N rotary wheel velocity (500rps); ρl liquid density (kg.m-3); V& volumetric
feed rate (m3.h-1); µ liquid viscosity (water = 1 cP at 20°C, MD12 40% = 28 cP at 20°C, MD21 40% = 65 cP at
20°C); n number of rotary wheel vanes (24); h height of vanes (0.006 m).
vt was about 78.5 m.s-1
and vr varied from 0.70 to 1.5 m.s-1
depending on liquid flow rate.
The mean initial size of drops was deduced from final powder distribution, considering that
there was no size variation between initial drop and final powder (Hypothesis 14). Drops of
uniform diameter (Hypothesis 15) were considered (27 µm, median diameter measured for
maltodextrin powders). For water drying simulation, a smaller diameter of 14µm was
considered, according to empirical correlations to calculate initial diameter of water drops.
Some simulations were also performed by considering a Rosin-Rammler size distribution for
initial liquid spray.

Part III – Results and discussion
128
Table 3.3.2. Hypothesis used in CFD simulation of spray drying model. 1. 2D Axy-symmetric geometry.
2. Simulation at steady state.
3. k-epsilon model for turbulence
4. Liquid drop considered as perfect sphere.
5. No interaction (diffusion) between solid core and liquid shell of the particle.
6. No radiation.
7. Uniform drop temperature.
8. Air and water vapor considered as ideal gas.
9. Constant coefficient x, to lower vapour pressure at drop surface when feed is aqueous solution instead of
water.
10. Simplified inlet air disperser geometry (equivalent cylindrical section without blades).
11. Simplified liquid drops inlet (8 injection points).
12. Inlet air direction estimated as vt = 5.vr, with no initial axial component (vx = 0).
13. Secondary ambient air entrance equal to 12% of total air flow rate, considered close to the atomizer.
14. Initial liquid solution drop size was taken from final powder size distribution, assuming neglectable
shrinking. 15. Uniform diameter of sprayed drops.
Figure 3.3.5. Algorithm used for CFD simulation at steady state.
Geometry of the chamber
Grid definition
INLET AND BOUNDARY CONDITIONS Air: TIN, YIN, mair, direction, turbulence
Liquid drops : ml, size, velocity, XIN, T
Walls: heat transfers (+Tamb)
Continuous phase calculation (no liquid particles )
mairair S)u (ρ t
ρ=⋅∇+
∂
∂ rr
FgairρPuu
airρ
t
uairρ rrrrrrr
r
++τ⋅∇+∇−=⋅∇+∂
∂
hS)
eff)τ(u
'j'j
j'j
HTeff
(P))Eair
( u(E)air
(t
++∑−∇λ⋅∇=+ρ⋅∇+ρ∂
∂ rvvvrv
MYε
airρ
kGk
kσ
tµ
µ)uk air
(ρk) air
(t
−−+
∇
+⋅∇=⋅∇+ρ
∂
∂ rrrr
k
2εairρ
2C
KG
κ
ε1
Cε
εσ
tµ
µ)uε air
(ρ)air
(t
−+
∇
+⋅∇=⋅∇+ερ
∂
∂ rrrr
Eulerian approach
Particle injection ���� Discrete phase calculation Calculation of from previously calculated fields of air velocity, temperature, water content
Lagrangian approach
FP
)/ρairρ
P(ρg)
Puu(
DF
dt
Pud rrrrr
+−+−⋅=
vH
ewm-)
PT
air(T
dropA
ch
dt
PdT
dropP,C
Pm ∆⋅−⋅=⋅⋅ &
ewm& = kc.Adrop.(Cw, s – Cw, b).MW
Update of source terms Calculation of new heat and mass source terms Sm, Sh
Convergence?
YES
NO
END of calculation
particle trajectories, evaporation rate, temperature, water content
Air temperature, water content, velocity, turbulence

Part III – Results and discussion
129
For water drying simulation, particle reaching the walls were considered as “trapped”; in this
case evaporation continued while the particle remains in the collision position. For liquid
solution simulation, a “reflect” condition was preferred, in which particles rebound inside the
chamber after collision against wall.
The coefficient “x” to lower vapour pressure at drop surface was taken as constant and equal
to 1 for water simulation and determined from experimental data for maltodextrin solutions
(section 3.2.4 ).
3.1.5. Numerical solution With the considered hypothesis (Table 3.3.2), the chosen geometry and boundary conditions,
the model equations were solved at steady state to calculate air and particles properties
evolution (Fig. 3.3.5)
The different equations (for continuity, momentum, turbulence k-ε, heat and mass transfers)
were solved for the continuous phase with the finite elements method. Equations were
integrated on a grid divided in triangular cells (2D), which represents the modelled region. In
the Eulerian approach, every finite volume cell was crossed by fluid (air). To check that
simulation results were independent from the computational grid, a sensibility analysis was
performed by varying the number of grid cells (11000 and 44000). The finer the grid, the
more accurate the results; but computational time is strongly dependent on grid size, so that
optimum must be found between results accuracy and computational time.
After solving the continuous phase equations, discrete phase equations were solved with a
Lagrangian approach: particles were followed along their trajectory during time with implicit-
Eulerian scheme. A significant number of particles was simulated so that turbulent dispersion
and size distribution could be taken into account.
The source terms coming from the interactions between the two phases were then updated and
calculation was iterated until convergence, when residuals between variables calculated in
two iterations were lower than 10-3
.

Part III – Results and discussion
130
Table 3.3.3. Initial conditions for CFD simulations to determine simulation parameters
(RR=Rosin- Rammler size distribution).
Table 3.3.4. Simulated (NUM) and experimental (EXP) air TOUT for different water flow
rates with h = 2 W.m-².K
-1 and air TIN = 129°C (experimental: air TIN 144°C).
Parameter to test Grid size Inlet air
turbulence
intensity
h dp Correction
coefficient x
Inlet air
TIN (°C) 129 129 129 129 129
YIN (kgH2O/kg dry air) 0.005 0.005 0.005 0.005 0.005
airm& (kg.h-1
) 110 110 110 110 110
Turbulence intensity (%) 50 10-30-50 50 50 50
Hydraulic diameter (m) 0.04 0.04 0.04 0.04 0.04
Liquid feed
liquidm& (kg.h-1
) // // 0.00-1.08-
2.16-3.24
2.16-3.6 0.00-1.08-2.16-
3.24
Concentration (%water) // // 100 100-60 100
N° liquid injection // // 8 8 8
dp (µm) // // 13.5 13.5-27-34-50- 29.5 (RR)
13.5
Tp (K) // // 18 18 18
Pv = x Pwsat
// // 1 (Pv=Psat) 1 From 0.05 to 1
Boundary conditions
Tamb (K) 18 18 18 18 18
h (W/(m2.K)) 2 2 2 2 2
vwheel (rpm) 30000 30000 30000 30000 30000
Geometry
Cells (n°) 11000
44000
44000 44000 44000 44000
Numerical resolution
Order 2nd
2nd
2nd
2nd
2nd
Iterations 100 1000 1000 1000 1000
Water flow rate
(kg.h-1
)
TOUT EXP
(TIN 144°C)
(°C)
TOUT NUM (TIN 129°C)
(°C)
0 112 112.2
1.08 88 89.6
2.16 66 67.7
3.24 47 46.4

Part III – Results and discussion
131
3.2. Determination of simulation parameters
First simulations were performed to determine or validate the choice of parameters as grid
size, inlet air turbulence intensity, global heat transfer coefficient h, inlet air TIN, inlet drop
diameter dp, coefficient x. Simulation conditions are reported in Table 3.3.3.
3.2.1. Validation of the global heat transfer coefficient h and TIN with water drying Simulation of water drying for different liquid flow rates were performed to validate the
chosen global heat exchange coefficient h = 2 W.m-2
.K-1
. The inlet air temperature TIN
corresponds to air temperature at the entrance of the chamber after mixing with secondary
ambient air.
Calculated exit air temperature TOUT in simulation of water drying at different flow rates with
inlet air TIN = 129°C and h = 2 W.m-2
.K-1
was in agreement with experimental results (Table
3.3.4). These operating conditions were then applied for further simulations.
3.2.2. Sensibility to inlet air turbulence intensity and grid size effect A simulation was performed for hot air without liquid atomization to test sensibility of results
of calculated air temperature and velocity to grid size and air turbulence intensity. Two grid
sizes were tested (11000 and 44000 cells) and three turbulence intensities (10 – 30 – 50%).
The simulation performed with a four times finer grid (44000 cells), resulted in an increased
computational time (45 min for 500 iterations, compared to 5min with the first grid).
Whatever the grid size, simulation results were close to experimental values (±1.5°C) (Fig.
3.3.6). From temperature and velocity values on a radial line at 25 cm from the top of
chamber, some slight differences between the two simulations (Fig. 3.3.7) were observed
leading to choose, as a security, the finest grid (44000 cells) with a still reasonable calculation
time.
The turbulence intensity was varied from 50 to 30 and 10%. Comparing results for calculated
air temperatures and velocity on a radial line 25 cm below the top chamber, we can see that
simulations results were independent from turbulence intensity (Fig. 3.3.8).
Turbulence intensity seems to have no effect on simulation results, so we choose a value of
50%, as the air disperser geometry was more likely to produce a big turbulence (24 blades
with narrow space between them).
3.2.3. Sensibility to initial drop diameter Effect of initial liquid droplet size on simulation was tested during simulation of water drying
(Pvdrop
= Pwsat
). Initial liquid drop diameters were chosen from empirical correlations and/or
from particle size distribution of the final maltodextrin powders.
A first simulation was performed as a reference for water drying (water flow rate 2.16 kg.h-1
;
TIN: 144°C (� 129°C); air flow rate: 110 kg.h-1
), considering three different initial drop
diameters dp:
dp = cst = 13.5 µm as d3,2 of water drops (empirical correlation, Masters, 1985)
dp = cst = 27 µm as d50 of final powder obtained for maltodextrin drying
dp = cst = 50 µm as maximal particle diameter of maltodextrin powder
Higher drop diameter lead to higher air temperatures due to lower exchange surface between
air and drops. Anyway, differences in calculated air temperatures inside the chamber (Fig.
3.3.9a) between the three simulated cases were never higher than 1.5°C, except for values at
points 1 and 3 for an initial diameter of 50 µm. However, such a big diameter is unlikely to be
representative of water spray (only a small fraction of maltodextrin powder (1-4%) was
bigger than 50 µm).

Part III – Results and discussion
132
Figure 3.3.6. Air temperatures inside the chamber; comparison between calculated (red) and experimental
values (black). (a) grid size 11000 cells (b) grid size 44000 cells
(TIN: 129 °C, air flow rate: 110 kg.h-1
, no liquid atomization, 50% turbulence intensity).
0
5
10
15
20
25
30
0 0.1 0.2 0.3 0.4radial position (m)
Air
vel
oci
ty (
m/s
) AirVelocity-11000Cells
AirVelocity-44000Cells
Figure 3.3.7. Effect of grid size on calculated air temperature (a) and velocity (b) on a radial lines 25 cm
below top of chamber (TIN: 129 °C, air flow rate: 110 kg.h-1, no liquid atomization, 11000-44000 cells, 50%
turbulence intensity).
Figure 3.3.8. Effect of turbulence intensity on calculated air temperature (a) and velocity (b) on a radial line
14 cm below top of chamber (TIN: 129 °C, air flow rate: 110 kg.h-1
, no liquid atomization, 44000 cells, 10-30-
50% turbulence intensity).
+ 113
113
+ 118 117
+ 115
116
B 111-113
+ 115 115
+ 115 114
+ 144 129
+ 111-112
+ 119
118
height (cm)
-10
0
27
80
49
100
60
80 cm
A 118
117.8
+ 119
118
+ 113
112
+ 118 116
+ 115
115
B 111-112
+ 115 115
+ 115 114
+ 144 129
+ 111-111
+ 119
116
height (cm)
-10
0
27
80
49
100
60
80 cm
A 117
116
+ 119
117
110
115
120
125
130
0 0.1 0.2 0.3 0.4
radial position (m)
Air
T (
°C)
AirT-44000Cells
AirT-11000Cells
0
5
10
15
20
25
30
0 0.1 0.2 0.3 0.4 0.5
radial position (m)
v (
m/s
)
TurbIntensity10%
TurbIntensity30%
TurbIntensity50%
b
110
115
120
125
130
0 0.1 0.2 0.3 0.4 0.5
radial position (m)
T (
°C)
TurbIntensity10%
TurbIntensity30%
TurbIntensity50%
a
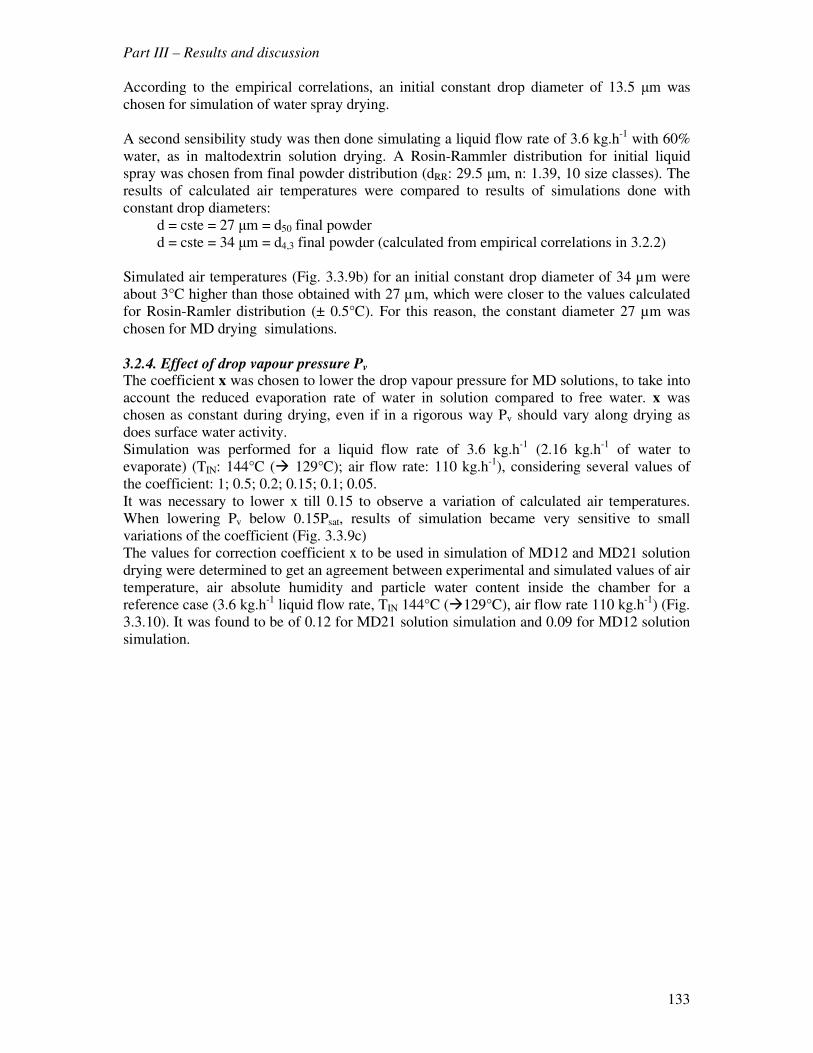
Part III – Results and discussion
133
According to the empirical correlations, an initial constant drop diameter of 13.5 µm was
chosen for simulation of water spray drying.
A second sensibility study was then done simulating a liquid flow rate of 3.6 kg.h-1
with 60%
water, as in maltodextrin solution drying. A Rosin-Rammler distribution for initial liquid
spray was chosen from final powder distribution (dRR: 29.5 µm, n: 1.39, 10 size classes). The
results of calculated air temperatures were compared to results of simulations done with
constant drop diameters:
d = cste = 27 µm = d50 final powder
d = cste = 34 µm = d4,3 final powder (calculated from empirical correlations in 3.2.2)
Simulated air temperatures (Fig. 3.3.9b) for an initial constant drop diameter of 34 µm were
about 3°C higher than those obtained with 27 µm, which were closer to the values calculated
for Rosin-Ramler distribution (± 0.5°C). For this reason, the constant diameter 27 µm was
chosen for MD drying simulations.
3.2.4. Effect of drop vapour pressure Pv The coefficient x was chosen to lower the drop vapour pressure for MD solutions, to take into
account the reduced evaporation rate of water in solution compared to free water. x was
chosen as constant during drying, even if in a rigorous way Pv should vary along drying as
does surface water activity.
Simulation was performed for a liquid flow rate of 3.6 kg.h-1
(2.16 kg.h-1
of water to
evaporate) (TIN: 144°C (� 129°C); air flow rate: 110 kg.h-1
), considering several values of
the coefficient: 1; 0.5; 0.2; 0.15; 0.1; 0.05.
It was necessary to lower x till 0.15 to observe a variation of calculated air temperatures.
When lowering Pv below 0.15Psat, results of simulation became very sensitive to small
variations of the coefficient (Fig. 3.3.9c)
The values for correction coefficient x to be used in simulation of MD12 and MD21 solution
drying were determined to get an agreement between experimental and simulated values of air
temperature, air absolute humidity and particle water content inside the chamber for a
reference case (3.6 kg.h-1
liquid flow rate, TIN 144°C (�129°C), air flow rate 110 kg.h-1
) (Fig.
3.3.10). It was found to be of 0.12 for MD21 solution simulation and 0.09 for MD12 solution
simulation.

Part III – Results and discussion
134
65
66
67
68
69
70
71
72
73
74
75
0 1 2 3 4 5 6 7 8 9 10
thermocouple N°
T (
°C)
13 micron
27 micron
50 micron
63
65
67
69
71
73
75
0 1 2 3 4 5 6 7 8 9 10
thermocouple N°
T (
°C)
34 micron
Rosin Rammler
27 micron
60
65
70
75
80
85
0 1 2 3 4 5 6 7 8 9 10
thermocouple N°
T (
°C)
Pv = 0.15 Psat
Pv = 0.10 Psat
Pv = 0.05 Psat
Pv = Psat
Figure 3.3.9. Effect on simualted air temperatures inside the chamber of (a) initial water drops diameter; (b)
initial 40% w/w solutions drops diameter; (c) surface vapour pressure for correction coefficient of 0.15 – 0.1 –
0.05 (TIN 129°C, air flow rate 110 kg.h-1; liquid flow rate 3.6 kg.h-1 (2.16 kg.h-1 of water)). (TIN 129°C, air flow
rate 110 kg.h-1
; water flow rate 2.16 kg.h-1
).
Figure 3.3.10. Comparison between calculated (red) and experimental values (black) of air temperatures and
air water content inside the chamber and of final powder water content. (a) MD12 (b) MD21
(TIN 129°C, air flow rate 110 kg.h-1
, 3.6 kg. h-1
, correction coefficient 0.12 for MD21 and 0.09 for MD12).
+ T8
+ T3
+ T6
* T9
+ T5
+ T7
+ T10
+ T1
* T4
+ T2
(a) (b)
(c)
(a) (b)
+ 71
70
+ 72 71 + 71
71
B 70 ∆YIN-B 19
69 ∆YIN-B 19
+ 72 72
+ 71 70
+ 144 129
+ 70-69
+ 72
72
height (cm)
-10
0
27
80
49
100
60
80 cm
A 72 ∆YIN-A: 18
72 - ∆YIN-A: 18
+ 72
72
XEXP = 5.5
XNUM = 5.2
+ 73
72
+ 75 75
+ 74
74
B 72 ∆YIN-B 19
72 ∆YIN-B 19
+ 75 75
+ 74 74
+ 144
129
+ 72-89
+ 76
76
height (cm)
-10
0
27
80
49
100
60
80 cm
A 76 ∆YIN-A: 18
75 - ∆YIN-A: 18
+ 75
76
XEXP = 4.8
XNUM = 5.2

Part III – Results and discussion
135
3.3. Application of simulation
The parameters defined in the last section were used to validate the model for other conditions
tested experimentally. And simulations were used to get information about the behaviour of
air (continuous phase) and drying particles (dispersed phase). 3.3.1. Model validation Chosen conditions for model validation were drying of a liquid flow rate of 1.8 kg.h
-1 with
TIN 129°C for MD12 and MD21, and of 3.6 kg.h-1
with TIN 188°C for MD12 (to compare
with 3.6 kg.h-1
and 129°C for reference) (Table 3.3.5). Validation was done by comparing the
simulated air temperatures and water contents inside the chamber and final powder water
content, with the experimental values. Results of simulations and experimental measured
values are shown in Fig. 3.3.11.
The model correctly predicted air temperature and water content inside the chamber, for the
chosen flow rates and for a higher inlet air temperature.
3.3.2. Continuous phase at steady state: air Simulation allowed obtaining the air flow pattern inside the chamber, as well as the evolution
of air properties as temperature and water content along the chamber at steady state.
Air flow inside the chamber at steady state The air flow pattern inside the chamber was the same for all the simulated cases. From air
path lines (Fig. 3.3.12.1) we could see that two main recirculation zones appear above and
below atomization. Hot air is ejected from air entrance with a high radial velocity (≈13 m.s-1
,
Fig. 3.3.12.2). When the air jet arrives close to the chamber wall it is split in two parts
resulting in air recirculations. In these zones radial and axial velocities become negative (Fig.
3.3.12.2 and 3.3.12.3b).
A third small recirculation zone could be observed close to chamber wall at the beginning of
the conical part. In this zone air recirculation in the central part of the chamber caused a
deviation of air resulting in a localized “sucking effect” that put in rotation air generating this
small recirculation.
Swirl velocity decreased with radial position from center to wall (Fig. 3.3.12.3a) putting in
evidence the centrifugal effect on air. Without friction, the air kinetic moment is constant
inside the chamber, so that when radius increased swirl velocity should decrease.
Absolute velocity magnitude inside the chamber was in the order of 2 m.s-1
.
The air turbulence intensity (Fig. 3.3.12.4a) compared the velocity fluctuations to the absolute
velocity. Inside the chamber, turbulence intensity was quite small. The highest intensity was
observed close to the air entrance (we imposed 50% as initial value) where we had the most
of turbulence kinetic energy (k) production. Production of k is related to appearance of shear
stress; zones of k production are concentrated close to the border between fast inlet air jet and
slow surrounding air. In the core of inlet air jet there was no production of k as velocity was
homogeneous. Another zone of production of k was located close to the rotary atomizer (high
shear stress); turbulence was then transported to the inlet air jet zone (Fig. 3.3.12.4b,c).
As a consequence turbulent kinetic energy was high in the upper part of the chamber close to
atomization. High turbulence results in better heat and mass transfers according to Ranz and
Marshall, so that evaporation rate will be increased in this part of the chamber.

Part III – Results and discussion
136
Table 3.3.5. Parameters used in CFD simulations of maltodextrin DE12 and DE21 solutions drying.
Figure 3.3.11. Comparison between calculated (red) and
experimental values (black) of air temperatures and water
content inside the chamber and of final powder water content.
(a) MD12 1.8 kg. h-1
, TIN 144°C (�129°C), 110 kg.h-1
;
(b) MD21 1.8 kg. h-1
, TIN 144°C (�129°C), 110 kg.h-1
;
(c) MD12 3.6 kg. h-1 , TIN 200°C (�188°C), 110 kg.h-1
MD21 MD12 MD12
Inlet air
TIN (°C) 129 129 188
YIN (kgH2O/kg dry air) 0.006 0.006 0.006
airm& (kg.h-1
) 110 110 110
Turbulence intensity (%) 50 50 50
Hydraulic diameter (m) 0.04 0.04 0.04
Liquid feed
liquidm& (kg.h-1
) 1.8-3.6-
4.23-5.4
1.8-3.6 1.8-3.6
Concentration (%water) 60 60 60
N° liquid injection 8 8 8
dp (µm) 27.0 27.0 27.0
Tliquid (°C) 18 18 18
Pvdrop
= x . Pwsat
0.09 Pwsat
0.12 Pwsat
0.12 Pwsat
Boundary conditions
Tamb (°C) 18 18 18
h (W/(m2.K)) 2 2 2
vwheel (rpm) 30000 30000 30000
Geometry
Cells (n°) 44000 44000 44000
Numerical resolution
Order 2nd
2nd
2nd
Iterations 500 500 500
+ 90
89
+ 93
93
+ 92
91
B90 ∆YIN-B 9
89 ∆YIN-B 9
+ 93
92
+ 91
90
+ 144
129
+ 90-89
+ 94
93
height (cm)
-10
0
27
80
49
100
60
80 cm
A 94 ∆YIN-A: 9
93 - ∆YIN-A: 9
+ 94
94
XEXP = 2.9
XNUM = 3.5
+ 90
89
+ 93
93
+ 92
91
B90 ∆YIN-B 9
89 ∆YIN-B 9
+ 93
92
+ 91
90
+ 144
129
+ 90-89
+ 94
93
height (cm)
-10
0
27
80
49
100
60
80 cm
A 94 ∆YIN-A: 9
93 - ∆YIN-A: 9
+ 94
94
XEXP = 2.9
XNUM = 3.5
+ 89
88
+ 92
91
+ 90
90
B90 ∆YIN-B 10
89 ∆YIN-B 10
+ 90
91
+ 89
89.5
+ 144
129
+ 88-87
+ 92
92
height (cm)
-10
0
27
80
49
100
60
80 cm
A 94 ∆YIN-A: 9
93 - ∆YIN-A: 9
+ 92
91
XEXP 2.9
XNUM 4.0
+ 89
88
+ 92
91
+ 90
90
B90 ∆YIN-B 10
89 ∆YIN-B 10
+ 90
91
+ 89
89.5
+ 144
129
+ 88-87
+ 92
92
height (cm)
-10
0
27
80
49
100
60
80 cm
A 94 ∆YIN-A: 9
93 - ∆YIN-A: 9
+ 92
91
XEXP 2.9
XNUM 4.0
+ 113
113
+ 118
118
+ 115
116
B
111 ∆YIN-B 19
112 ∆YIN-B 19
+ 115
117
+ 115
115
+ 200
178
+ 110-104
+ 117
117
height (cm)
-10
0
27
80
49
100
60
80 cm
A 117 - ∆YIN-A 19
118 - ∆YIN-A 19
+ 119
119
XEXP 1.8
XNUM 0.5
+ 113
113
+ 118
118
+ 115
116
B
111 ∆YIN-B 19
112 ∆YIN-B 19
+ 115
117
+ 115
115
+ 200
178
+ 110-104
+ 117
117
height (cm)
-10
0
27
80
49
100
60
80 cm
A 117 - ∆YIN-A 19
118 - ∆YIN-A 19
+ 119
119
XEXP 1.8
XNUM 0.5
(a) (b)
(c)

Part III – Results and discussion
137
Evolution of air properties inside the chamber Air temperatures and water contents evolution inside the chamber were in agreement with
experimental measured values (Fig. 3.3.12.5 and 3.3.12.6).
In any condition air water content increased strongly and temperatures decreased in the upper
part of the chamber due to high evaporation rate observed in this zone (Fig. 3.3.13). Just a
slight evolution of air temperatures and water content was observed in the cylindrical part of
the chamber, because air recirculations helped in homogenizing values. In the conical part, air
water content and temperatures were constant, showing that no more evaporation occured.
In the upper part of the chamber, close to atomizer, evolutions of evaporation rate were
similar for MD21 and MD12 solutions whilst for pure water evaporation rate was higher close
to the atomizer. The evaporation of free water is easier than the water from solutions (see
chapter 3.2).
Enthalpy of the inlet air was high when entering the chamber (high air temperature). Then due
to mixing with returning air, enthalpy decreased (humid air) and remained constant in the
evaporation zone (Fig. 3.3.14). Close to chamber walls, enthalpy decreased due to heat losses,
and then air returned backwards to the atomization zone. Due to the air recirculation in the
upper part of the chamber, some air mixing occurred even without liquid atomization (Fig.
3.3.15) so that temperatures close to the atomizer at steady state were lower than the inlet hot
air temperature TIN.
3.3.3. Discrete phase at steady state: drying particles 80 particles (10 for each liquid injection point) representative of the total liquid flow rate were
simulated. For each particle, trajectory, velocity, evolution of mass and of temperature were
calculated.
Atomized particles were sucked by the inlet air jet and followed air trajectories in the upper
part of the chamber (Fig. 3.3.16). Each particle coming from the same injection point had a
different trajectory due to the dispersion caused by air turbulence. Particles mass evolution in
the upper part of the chamber showed that most of drying was completed close to the air
entrance before arriving to the chamber wall. Particle residence time in this part of the
chamber was very short. In less than 0.5s, particles arrived close to chamber walls and could
be recirculated with air.
Residence time of particles inside the chamber varied between 20 and 55 s. These values are
lower than the average particle residence time of 2 minutes measured experimentally
(residence time distribution trial – III.1.). This could be due to the fact that in simulation we
applied the “rebound” conditions for particles that hit the chamber walls, while in reality
particles could remain stuck on chamber walls and detach later, by this increasing their
residence time. Furthermore, in simulation we did not take into account exit pipes and
cyclone.
Particle concentration inside the chamber was high close to the atomizer due to particle
injection and to recirculations in the upper part of the chamber (Fig. 3.3.17). A high particle
concentration could also be observed in the conical part due to the decrease of chamber
section and to air recirculation (close to the walls).
For each particle, the evolution of temperature and water content could be represented as a
function of drying time (Fig. 3.3.18).
Particles were injected at 18°C and were theoretically almost immediately (<0.05 s) heated up
to the wet bulb temperature of drying air. In the simulation of maltodextrin solutions drying,
drops temperature during drying was found to be 73°C for MD12 (Pv = 0.09Pwsat
) and 70°C
for MD21 (0.12Pwsat
) with air at 129°C. These temperatures are different from the real air wet
bulb temperature (40°C).

Part III – Results and discussion
138
-120.00-100.00
-80.00-60.00-40.00-20.00
0.0020.0040.0060.0080.00
100.00
0.00 0.20 0.40 0.60 0.80 1.00 1.20 1.40 1.60
time (s)
T (
°C)
Tg
Tsticky
Figure 3.3.18. (a) Calculated evolution of a MD21 particle temperature and water content during
drying and (b) evolution of its Tg and Tsticky.
Figure 3.3.19. Determination of time gap for which a MD21 simulated particle temperature is sticky
inside the chamber.
0.00
10.00
20.00
30.00
40.00
50.00
60.00
70.00
80.00
0.00 0.20 0.40 0.60 0.80 1.00 1.20 1.40 1.60
time (s)
pa
rtic
le T
(°C
)
0.00
0.10
0.20
0.30
0.40
0.50
0.60
0.70
Wa
ter
con
ten
t
(%)
Tp
X
-120.00-100.00
-80.00-60.00-40.00-20.00
0.0020.0040.0060.0080.00
100.00
0.00 0.20 0.40 0.60 0.80 1.00 1.20 1.40 1.60
time (s)
T (
°C)
Tg
Tsticky
Tp
Tw b = 40°C
(a) (b)

Part III – Results and discussion
139
As we assumed that the particle surface was covered by pure water until end of drying,
simulated temperature remained constant since drops are not completely dry when they reach
the chamber exit. The calculated powder water content was 4% (XOUT = 4%) in agreement
with experimental results.
The water evaporation rate was correctly predicted. However, the simulated drop temperature
was too high (70°C) since the temperature measured on final powders was never higher than
55°C whatever the drying conditions. Thus, surface properties of the particle during drying
are not totally well predicted by the model.
3.4. Determination of powder stickiness inside the chamber
From the knowledge of particle water content evolution during drying, the evolution with
time of their glass transition temperature Tg and sticky temperature Tsticky (related to aw) could
be represented (Fig 3.3.18). And the time gap for which a drying particle should be in a sticky
state ((T, aw) in the sticky zone (Tg, Tsticky, aw)) could be determined for each particle (Fig.
3.3.19).
In this context, an overestimation of particle temperature during drying should mean that the
particle should be considered as “liquid” for a longer time. As a consequence for the
calculated particle temperature of 70°C instead of 40-50°C, the moment when the liquid drop
should cross the sticky zone (before becoming no more sticky) should be delayed.
In the example on Fig.3.3.19, with the simulated particle T of 70°C stickiness occurred for
1.30 < t < 1.40 s, while considering a drop temperature of 40°C stickiness would occur for
1.20 < t < 1.30 s.
From trajectories calculations, we represented positions inside the chamber for which
particles MD21 were liquid, sticky and no more sticky (Fig. 3.3.20). In Figure 3.3.21 the
sticky positions inside the dryer chamber are represented for drying of 3.6 and 1.8 kg.h-1
at
129°C of MD12 and MD21.
MD12 particles exhibit a sticky behavior only in a small region inside the chamber located in
the upper part. Below they were too dry to be sticky, and close to atomizer particles were still
in a liquid state. Considering the delay in reaching the sticky state in simulation due to
overestimation of particle temperature, the sticky state should be reached close to the atomizer
if we consider a particle temperature of 40°C.
For MD21 with the highest flow rate (3.6 kg.h-1
), a sticky behavior of particles is expected in
a wider region extending in the whole cylindrical part of the chamber. These results were in
agreement with the determined possible sticky zones inside the chamber in chapter 2.4.
These drying conditions could then be suitable for testing agglomeration feasibility by powder
insertion trials.
For both maltodextrins DE12 and DE21, some of the particles arrived at the chamber walls
while being still in the “liquid” state, which was in agreement with some powder found stuck
on chamber walls during spray drying experiments.
3.4.1. Effect of liquid feed flow rate on particle stickiness for MD12 and MD21 The liquid feed flow rate has been changed for a given inlet air temperature TIN of 129°C to
evaluate the effect of this parameter on the possible sticky zones.
For a low liquid flow rate of 1.8 kg.h-1
, the evaporation rate was high close to atomizer and
product was almost completely dried in the upper part of the chamber. Considering that real

Part III – Results and discussion
140

Part III – Results and discussion
141
drops temperature should be of about 40°C, for both maltodextrin solutions stickiness was
likely to appear only close to atomizer (Fig. 3.3.21c,d).
For a high liquid flow rate of 5.4 kg.h-1
particles always remain above the sticky zone in the
liquid state (Fig. 3.3.22). This was in agreement with MD21 experiments when no powder
could be produced. For MD12, some powder could still be collected, but with very high final
moisture content (> 8%) and with a big part of the powder lost due to sticking on walls.
An intermediate liquid flow rate of 4.32 kg.h-1
was then simulated for MD21 drying. In this
case the possible sticky zone was larger than with a flow rate of 3.6 kg.h-1
. Stickiness seemed
possible also in the conical part of the chamber (Fig. 3.3.23a). These conditions will be used
in powder insertion trials to validate the stickiness prediction.
3.4.2. Effect of inlet air temperature Experimental conditions for drying of MD12 at 200°C were also simulated to verify the effect
of inlet air temperature TIN on stickiness prediction. TIN in simulation was lowered to 188°C
to take into account the secondary ambient air entrance. As expected, in this case particles
exhibit a sticky behavior only close to atomizer (Fig. 3.3.23b).

Part III – Results and discussion
142
1
2
3
Figure 3.3.12a. Air properties simulation when drying MD21 40% w/w solution (liquid feed: 3.6 kg.h-1, air:
129°C, 110 kg.h-1
). 1. Air pathlines inside the spray dryer chamber colored by velocity magnitude (m.s-1
); 2. (a)
Air radial velocity inside the chamber and (b) in the upper part of the chamber; 3. (a) Air swirl velocity inside
the chamber and (b) zones where axial velocity is negative (to be continued on next page)
u (m/s)u (m/s)
vr (m/s) vr (m/s)vr (m/s) vr (m/s)
vswirl (m/s) vax (m/s)
(a) (b)
vswirl (m/s) vax (m/s)
(a) (b)
(a) (b)
10
5
0
7.00
1.39
-4.22
13.70
4.76
-4.22
16.10
6.23
-4.71
0.0
-2.12
-4.71

Part III – Results and discussion
143
5
(kgwater.kg-1dry air) (kgwater.kg-1
dry air)
(a) (b)
(kgwater.kg-1dry air) (kgwater.kg-1
dry air)
(a) (b)
Figure 3.3.12b. Air properties simulation when drying MD21 40% w/w solution (liquid feed: 3.6 kg.h-1
, air:
129°C, 110 kg.h-1). 4. (a) Air turbulence intensity; (b) production of turbulent kinetic energy k and (c) turbulent
kinetic energy; 5. Air temperature inside the chamber (a) whole temperature range (b) temperatures between 47
and 77°C; 6. Air water content inside the chamber (a) whole range (b) water content between 20 and 23 g
water.kg-1
dry air.
m2/s2%
(a) (b) (c)
m2/s2%
(a) (b) (c)
(°C) (°C)
(a) (b)
(°C) (°C)
(a) (b)
4
6
852
432
12.5
30000
15000
238
5.00
2.51
0.025
129
84.2
47.7
77
62.4
47.7
0.0232
0.0146
0.0006
0.0232
0.0216
0.0200

Part III – Results and discussion
144
Figure 3.3.13. Water evaporation rate (kg.s-1
) during simulation of (a) spray drying of water, (b) of
maltodextrin DE21 40% w/w solution (water feed: 2.16 kg.h-1
liquid feed: 3.6 kg.h-1
, air: 129°C, 110 kg.h-1
).
Figure 3.3.14. Humid air enthalpy inside the chamber at steady state calculated during drying of MD21 40%
w/w solution. (liquid feed: 3.6 kg.h-1
, air: 129°C, 110 kg.h-1
). (a) whole chamber, (b) upper part of chamber.
kJ/kgkJ/kg
Figure 3.3.15. Humid air enthalpy inside the chamber at steady state calculated without liquid atomization.
(air: 129°C, 110 kg.h-1
)
kgwater/skgwater/s
(a) (b)
kgwater/skgwater/s
(a) (b)
kJ/kg kJ/kg
(a) (b)
kJ/kg kJ/kg
(a) (b)
Water MD21
3.35 10-7
1.51 10-7
1.67 10-8
6.15 10-8
3.24 10-8
3.24 10-9
1.44 105
1.24 105
1.07 105
1.44 105
1.24 105
1.07 105
1.44 105
1.27 105
1.11 105
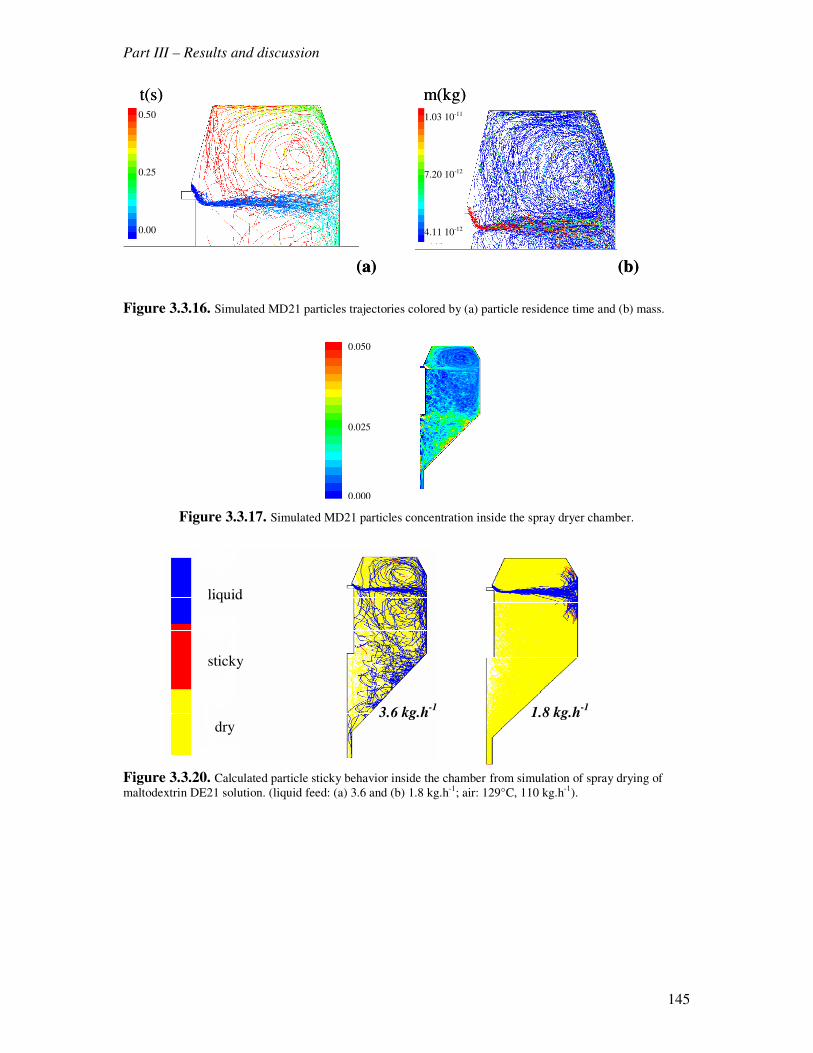
Part III – Results and discussion
145
Figure 3.3.16. Simulated MD21 particles trajectories colored by (a) particle residence time and (b) mass.
Figure 3.3.17. Simulated MD21 particles concentration inside the spray dryer chamber.
Figure 3.3.20. Calculated particle sticky behavior inside the chamber from simulation of spray drying of
maltodextrin DE21 solution. (liquid feed: (a) 3.6 and (b) 1.8 kg.h-1; air: 129°C, 110 kg.h-1).
t(s) m(kg)
(a) (b)
t(s) m(kg)
(a) (b)
liquid
sticky
dry
liquid
sticky
dry3.6 kg.h
-1 1.8 kg.h
-1
0.50
0.25
0.00
1.03 10-11
7.20 10-12
4.11 10-12
0.050
0.025
0.000

Part III – Results and discussion
146
Figure 3.3.21. Calculated sticky zones inside thechamber from simulation of spray drying of (a) maltodextrin
DE12 solution ; (b)maltodextrin DE21 solution (liquid feed: 3.6 kg.h-1); (c) maltodextrin DE12 solution; (d)
maltodextrin DE21 solution. (liquid feed: 1.8 kg.h-1
; air: 129°C, 110 kg.h-1
).
Figure 3.3.22. Calculated particle sticky behavior inside the spray dryer chamber from simulation of spray
drying of maltodextrin DE21 40% w/w solution. (liquid feed: 5.4 kg.h-1
; air: 129°C, 110 kg.h-1
).
Calculated
sticky zone
Sticky zone considering
TP=Twb
(c)
Calculated
sticky zone
Sticky zone considering
TP=Twb
(d)
Calculated
sticky zone
Sticky zone considering
TP=Twb
(c)
Calculated
sticky zone
Sticky zone considering
TP=Twb
(d)
Calculated
sticky zone
Sticky zone considering
TP=Twb
Calculated
sticky zone
(a) (b)
Calculated
sticky zone
Sticky zone considering
TP=Twb
Calculated
sticky zone
(a) (b)
liquid
sticky
dry
liquid
sticky
dry
DE12 DE2
1
3.6 kg/h
DE12 DE21
1.8 kg/h

Part III – Results and discussion
147
Figure 3.3.23. Calculated sticky zones inside the chamber from simulation of spray drying of (a)
maltodextrin DE21 solution. (liquid feed: 4.32 kg.h-1
; air: 129°C, 110 kg.h-1
) (b) of maltodextrin DE12 solution.
(liquid feed: 3.6 kg.h-1; air: 178°C, 110 kg.h-1).
Calculated
sticky
zone
Calculated
sticky
zone Sticky zoneSticky zone
DE21 DE12
178 °C
3.6 kg/h
129 °C
4.32 kg/h
(a) (b)

Part III – Results and discussion
148

Part III – Results and discussion
149
Conclusion A numerical CFD simulation of the spray drying of maltodextrin DE12 and DE21 aqueous
solutions in the NIRO spray dryer was performed at steady state.
Several hypotheses were made on the geometry of the chamber and on air and product
properties. In particular water diffusion from particle core to its surface was not taken into
account when drying solutions. But, to simulate the lower drying rate in this case compared to free water, the drop water vapour pressure was decreased by multiplying the saturating water
vapour pressure by a coefficient x. This coefficient was determined in order to adjust
calculated air temperatures values to experimental values in a reference situation.
The model was validated on different drying conditions (air inlet temperature and liquid flow
rate), and results of simulation were in agreement with experimental values for air
temperatures and relative humidity and for final powder water content.
Simulation allowed obtaining further information not acquired by direct measurements,
especially on air flow pattern and drying particles properties evolution. Air recirculations
zones were put in evidence, mainly above the atomization zone. These recirculations helped
to understand the homogenization of air temperatures.
Particle water content evolution could be followed inside the chamber, and from these results
the evolution of particle glass transition and sticky temperatures could be calculated. The time
gap and the positions for which each particle had a temperature between glass transition and
sticky temperature were determined, leading to the identification of possible sticky zones
inside the spray dryer.
It appeared that MD12 was quickly dried below glass transition in the upper part of the
chamber, while MD21 could exhibit a sticky behaviour in a wider part of the chamber
depending on the liquid flow rate. These results were in agreement with the experimental
prediction of possible sticky zones. They will be tested during powder insertion trials in the
next part.
However, particle temperature was over-estimated, probably due to the choice of the low drop
water vapour pressure. In simulation the evaporation occurred at a constant high temperature
superior to the drying air wet bulb temperature and to the measured temperature of final
powders. As a consequence, drying particles could be considered in the prediction as liquid or
sticky for a longer time compared to reality.
Furthermore we did not take into consideration the fact that liquid or sticky particles could
remain stuck on chamber walls.
In conclusion, the simplified CFD simulation approach allowed a correct calculation of air
properties evolution which could help to predict possible stickiness during drying of an
aqueous solution. Some experimental data are necessary especially for adjusting the
coefficient for vapour pressure, which is specific of the considered drying material.

Part III – Results and discussion
150

Part III – Results and discussion
151
4. Powder insertion inside NIRO Minor to perform agglomeration
The objectives were to verify predicted sticky conditions during maltodextrin DE12 and
DE21 solutions drying and to use them to obtain particles agglomeration inside the spray
dryer chamber. Agglomeration could modify some end-use properties of produced powder,
and in particular it could improve flowability and wettability.
Experiments required developing a specific powder insertion system allowing inserting
powder at different positions inside the chamber.
4.1. Theoretical considerations: factors affecting agglomeration inside spray dryer
We consider as agglomerate a structure formed by several particles bound together, in which
the single particles could still be identified.
Agglomeration inside the spray dryer chamber requires collisions between two or more
particles followed by adhesion between their surfaces. In this way, stable solid bridges
between particles are created, leading to formation of a new bigger structure (agglomerate).
Collisions between particles are forced by inserting particles inside the chamber to impact the
drying drops/particles.
The extent of agglomeration and the structure of obtained agglomerates depend on several
factors as:
• Stickiness of colliding particles: at least one of the colliding particles should have a sticky surface to have adhesion.
• Collision probability: it depends on possible collision area between inserted particles
and drying drops, and on particle/drop density in this area.
• Force of the impact: it could affect the final structure of the agglomerates (more or less compact) or lead to a result different from agglomeration as coalescence (one final
particle) or rebound.
The operating conditions, the powder insertion position and the nature of drying and inserted
particles will determine the collision efficiency and the result of collisions.
4.1.1. Stickiness of colliding particles Agglomeration requires collisions between a sticky particle and another dry or sticky particle.
A particle is considered as sticky if its surface is in the domain defined by aw , Tg, Tsticky (Fig.
3.2.9). Above Tsticky, the particle can still be considered as liquid, while below Tg it is
considered as dry and no more sticky. In our study, the sticky particles needed for agglomeration are the particles that are drying
inside the chamber, with insertion of dry (non-sticky) particles. Another possibility should be
to heat up and/or humidify the inserted particles (e.g. by use of steam) so that they could
become sticky inside the chamber.
During experimental study and CFD simulation, possible sticky conditions for maltodextrin
DE12 and DE21 solutions along drying were proposed. Maltodextrin DE12 was found to be
sticky only close to the atomizer, while maltodextrin DE21 could exhibit a sticky behaviour in
Zone I (upper part of the chamber, between atomizer and point A) or below for specific
drying conditions (air 144°C; liquid flow rate 3.6 (experiments) - 4.32 kg.h-1
(simulation)).

Part III – Results and discussion
152
Liquid drop
Returned
particles
Figure 3.4.1. Possible collision area between drying particles and inserted particles.
Figure 3.4.2. Possible collisions between a drying drop and several returned particles when ratio between
inserted powder and drying particles is high in possible collision zone.
Surface crossed by sprayed drops (Aliquid)
Aliquid = π(R22
– R12)
Surface crossed by inserted powder jet (Acollision)
Acollision = no powder insertion x (π rjet
2)
Fraction of spray in collision area
Collision area % = (Acollision/Aliquid)*100 R1
R2
Acollision
Rotary
wheel Aliquid
rjet
Part III – Results and discussion
153
We should note that if the liquid spray has a large size distribution, the smallest droplets could
be dried faster than the bigger ones, so that a fraction of the drying particles could already be
too dry to be sticky at the moment of collision. In this case, collisions between dry particles
would result in rebound without agglomeration.
On the other side, some particles could still be in the liquid state. Collisions between a liquid
particle and another liquid particle or a dry particle would result respectively more in
coalescence or covering than in agglomeration.
4.1.2. Collision probability between drying particles and inserted particles The extent of possible agglomeration inside the spray dryer is limited by the collision
probability between the inserted particles and the drying particles. In fact, only a part of the
particles inside the chamber can be reached by the inserted particles depending on insertion
device (local or symmetrical), on position and on drops/particle density.
Considering two vertical powder jet injections above the liquid spray (ejected horizontally
from rotary wheel), the possible collision area between inserted particles and drying drops
could be represented as on Figure 3.4.1.
The closer the particle injection to the rotary wheel, the bigger would be the fraction of liquid
spray that could come in contact with the inserted particles.
Collision probability depends also on particles/drops number density in the possible collision
area. Increasing the liquid feed and/or the inserted powder flow rate would result in a higher
particle number density in the collision zone, leading to a higher collision probability.
The higher the ratio between inserted particle flow rate and drying drops flow rate, the higher
is also the probability that an atomized particle could be reached by several (returned)
particles, so that a “grape” structure could be formed (one particle surrounded by more than
two other particles, Fig. 3.4.2).
Drying drops density is maximal close to atomizer, where all the liquid drops are concentrated
in a small volume fraction. Fines particles should then be inserted immediately close to the
atomizer to maximize collision probability (like usually done in industrial practice), together
with the fact that drying drops are not yet too dry to be sticky.
Agglomeration probability would also be increased by returning the same particles several
times, until reaching a critical size for which it can be considered as agglomerate. In this case,
some sieving/classification of produced powder should be necessary.
4.1.3. Force of the impact between particles The force of the impact may also affect the strength of the link created between particles, and
so the kind of structure formed.
Depending on powder insertion position, collision energy could be different. Inserted particles
have a kinetic energy EK that depends on their mass and their velocity. In pneumatic
conveying particle velocity can be assumed as equal to the velocity of the transport
compressed air vtransportAir, and independent from the insertion position inside the chamber:
Ek = ½ m v2 = ½ m (vtransportAir)
2
But the kinetic energy of drying particles inside the chamber would depend on position inside
the chamber. Their velocity would vary between a maximum value corresponding to the
rotary wheel peripheral velocity (~70 m.s-1
for a rotary speed of 30000 rpm) immediately
close to atomizer where drops are formed and a minimum value corresponding to the minimal
velocity of the particles assumed to be equal to air speed inside the chamber (~ 1 m.s-1
, in
NIRO Minor). So kinetic energy of drying particles will vary between

Part III – Results and discussion
154
Plastic pipe Inox
pipe
Flexible pipe
1.8 cm Compressed
air
Powder IN
1.8 cm
0.3 cm
Figure 3.4.3. Powder insertion device.

Part III – Results and discussion
155
Ek,max = ½ m (70)2 immediately close to atomizer
Ek,min = ½ m (1)2 inside the chamber
So that Ek,max = 4900 Ek, min
The collisions with drying particles of high kinetic energy (e.g. close to atomizer) could more
likely lead to coalescence between particles. If coalescence (or covering) occurs, the resulting
size enlargement would be small. Considering a median diameter for liquid drops of 25 µm
(� Vdrop = 8.18 10-15
m3), coalescence between two liquid drops should give a final diameter
of 31.5 µm:
Vtot = V1+V2 = 8.18 10-15
+ 8.18 10-15
= 16.36 10-15
m3
ddrop = ((6 Vtot)/π)1/3
= 31.5 µm
If the new formed particles were returned again inside the chamber with coalescence with
another liquid drop (25 µm) and so on, 75 collisions would be necessary to reach a final
diameter of 100 µm.
So coalescence of a fraction of the spray would result in a small variation of final powder size
distribution. Also instant properties would not change significantly, as powder smaller than 50
µm is usually considered as “fine”, with poor instant properties.
4.2. Powder insertion system
Taking into account the described factors affecting agglomeration, powder insertion trials
performed in NIRO Minor required:
• The development of a specific powder insertion device, to introduce powder
inside the chamber in a controlled way.
• The choice of the insertion positions inside the chamber, depending on drying particles stickiness and affecting contact efficiency.
• The choice of operating conditions, as drying parameters and inserted powder kind and flow rate. They determine possible drying drops stickiness and
particles/drops number density (collision probability).
4.2.1. Design of powder insertion device A specific powder insertion device was designed in order to introduce a desired amount of
powder in a continuous flow, inside the spray dryer chamber (Fig. 3.4.3).
Powder was manually inserted on a vibrating plate to be continuously introduced into a funnel
at the bottom of which it was transported by compressed air inside the chamber (Venturi
effect). With this system, a regular powder flow rate could be sent into the chamber. Pipes
diameter was chosen as small as possible in order to guarantee a high air velocity (better
sucking effect) but not too small in order to avoid blockage of the system by powder. Some
ambient air was introduced with powder, and the total air (cold compressed air and ambient
air) entering with powder could modify the drying behaviour of liquid drops inside the
chamber. This was taken into account by increasing inlet hot air temperature. This secondary
air (ambient + compressed) flow rate was measured and fixed between 7-10 kg.h-1
, the
minimal amount to guarantee good powder flowing.

Part III – Results and discussion
156
c
b a
powder
air
c
b a
powder
air
powder
air
Figure 3.4.4. Powder insertion positions inside the chamber of NIRO Minor
a: above spray close to atomizer in two symmetrical points;
b: above spray far from atomizer (Zone I) in two symmetrical points;
c: in the middle of the chamber in one point.
Part III – Results and discussion
157
4.2.2. Choice of insertion positions and powder jet shape Pipes for powder insertion entered into the chamber by the side window, and powder was
inserted in the chamber in three different positions (3 different experiments) (Fig. 3.4.4):
above the liquid spray close to atomizer (position a), in the upper part of the chamber (Zone I)
(position b), and in the middle of the chamber (position c). These choices were done in order
to test the effect of insertion position on final powder properties.
In position (a) drop density is high leading to a high collision probability. Atomized drops
should still be in a liquid state, and their velocity is close to the rotary wheel peripheral speed,
leading to high impact energy. In this position coalescence or covering of the inserted particle
was more likely to occur than agglomeration.
In position (b) impact energy and drying particle density would be lower. Drying particles of
maltodextrin DE21 should be in the sticky state, so that this position should be favorable for
agglomeration. Maltodextrin DE12 particles should be already too dry to be sticky, so that no
agglomeration (or small fraction) was expected.
In position (c) no agglomeration was expected when drying maltodextrin DE12, whilst
maltodextrin DE21 particles might still be sticky (high liquid flow rate).
Powder was inserted as a “cloud” obtained with a cylindrical pipe exit (cloud observed
outside the chamber). Two different diameters for insertion pipes were tested (1 and 3cm), as
the shape of powder cloud could also affect the efficiency of contact modifying the possible
contact area between inserted particle and particle inside the chamber. The smallest pipes led
to a more narrow jet of powder, with higher particle number density at the exit but with
smaller powder dispersion inside the chamber.
In positions a and b, powder was inserted in two symmetrical points to increase collision
probability. In preliminary trials we also tried to insert the powder close to the atomizer
(position a in Fig. 3.4.4), but below the rotary wheel. In this case it was more difficult to
install the powder insertion pipe inside the chamber, with a lower accuracy in determining the
powder insertion position; furthermore with this system insertion was done just in one point.
For these reasons insertion in position a below the wheel was not used in following trials.
4.2.3. Choice of operating conditions Powder insertion trials were performed during drying of maltodextrin solutions in conditions
where particles were found to have a sticky behaviour inside the chamber. Spray drying
operating parameters were:
-Liquid feed: maltodextrin DE12 and DE21 solution (40% w/w), 3.6-4.23 kg.h-1
(24-
28.8 g.min-1
of solids).
-Drying air: 110 kg.h-1
, 149°C
Air temperature was raised up to 149°C (compared to usual 144°C) to compensate the effect
of the insertion of cold air (ambient + compressed) with inserted powder. In this way air
temperatures measured inside the chamber were the same that temperatures measured during
trials without fines return (similar drying behavior).
In these drying conditions we determined that maltodextrin DE12 was sticky only
immediately close to atomizer (position a), while maltodextrin DE21 should be sticky in a
wider part of the chamber.

Part III – Results and discussion
158
0
1
2
3
4
5
6
7
8
9
0 50 100 150 200 250 300 350 400 450 500 550 600 650 700
particle size (µm)
Vo
lum
e (
%)
MD12 without powder insertion
Inserted powder
MD12 + Inserted powder
Figure 3.4.5. Evolution of particle size distribution due to powder insertion in spray dryer: MD12
before powder insertion, MD12 powder inserted (position b) and powder collected after 45 min of
powder insertion.
Table 3.4.1. Conditions for powder insertion trials with maltodextrin 40 % w/w solutions (Inlet air: 149°C,
110 kg.h-1
; secondary air: 23°C, 7 kg.h-1
; liquid feed: 3.6 and 4.23 kg.h-1
; insertion ≈ 50% of collected powder).
Insertion
position
Powder insertion
Comments
a Close
to
atomizer
-) Cylindrical pipe (d=1cm) exit, vertical
insertion � Narrow jet.
Two points for insertion
High drop density
High impact energy
Small insertion pipes � small collision area
Atomized drop still liquid
b1
Zone I -) Cylindrical pipe (d=1cm) exit, vertical
insertion � Narrow jet.
Two points for insertion
Stickiness expected for MD21; MD12
already too dry
Small insertion pipes � small collision area
b2
Zone I 7 cm
5 cm
-) Cylindrical pipe (d=3cm) exit, 45° inclination
� wide “cloud”.
Two points for insertion
Stickiness expected for MD21; MD12
already too dry
Large insertion pipes � wide collision area
c Middle
of
chamber 35 cm
60 cm
35 cm
60 cm
35 cm
60 cm
-) Oriented horizontally.
-) Cylindrical pipe exit (d=3cm) � wide “cloud”
Single point for insertion
Low particles number density
Particles already too dry to be sticky?
Collected after 45 min
Part III – Results and discussion
159
Choice of powder to insert During drying of maltodextrin DE12, insertion of a powder of the same nature that drying
solution (maltodextrin DE12) but with a different size distribution (bigger particles) was
initially performed. The resulting powder had a size distribution in between the size
distribution of inserted powder and the size distribution of powder dried without powder
introduction. It was not possible to determine if differences in measured particle size
distribution were due to agglomeration or just to powder mixing (Fig. 3.4.5).
For this reason in further trials, inserted powder was the powder produced during the drying
trial (powder recycling).
Powder was regularly collected once the collecting jar was full (usually each 5 to 10 minutes,
depending on liquid and powder flow rate), and half of the collected powder was then
reinserted inside the chamber during the next 5 to 10 minutes; the other half was used for
powder analysis. This way of operating was chosen in order to simulate continuous recycling
and led to an increasing returned powder flow rate.
Procedure for powder insertion Usual development of a powder insertion trial was the following:
• Steady state for air temperatures inside the chamber was reached with spray drying of
water and then maltodextrin solution without powder insertion but with the
introduction of compressed air of insertion device.
• Powder samples were collected once the collecting jar was full (about 5 min), and half
of each sample was returned inside the chamber during the next 5 minutes.
• Powder insertion was performed during 60 to 90 minutes.
• If drying conditions had to be changed, powder insertion was stopped and at least 30 minutes of running were performed with the new operating parameters before starting
again powder insertion.
The four tested conditions for powder insertion trials in NIRO Minor are summarized in Table
3.4.1. with some comments for each case.
4.3. Results of powder insertion trials
4.3.1. Size enlargement observations Increasing the inlet air temperature to 149°C when returning powder, instead of 144°C
without powder return, led to similar measured air temperatures inside the chamber (Fig.
3.4.6), thus it seems to allow keeping the same drying behaviour despite the cold secondary
air entrance.
As expected, when drying maltodextrin DE12 no size enlargement could be observed in any
tested condition. For maltodextrin DE21 some agglomeration could be obtained and results
are given in Table 3.4.2.
Size enlargement became observable after 15-20 minutes of powder recycling. Mean diameter
d4,3 increased until reaching a maximum stable value after 45-50 minutes of running.
For trials without powder insertion, a maximum of 3% of final powder was bigger than 100
µm, probably due to recover of powder stuck on chamber walls or to spontaneous
agglomeration due to collisions caused by air turbulence. Powder recycling led to an average
particle size increase, with a larger fraction of powder having a diameter bigger than 100 µm.
The agglomerated fraction (eg. particles > 100 µm) depended on insertion position and
liquid/powder flow rate, and it varied from 3% up to 16% of total powder volume. It was
maximal when recycling powder in Zone I using large pipes (b2), or in the middle of the
chamber with the highest atomized liquid flow rate.

Part III – Results and discussion
160
Table 3.4.2. Size of collected powder for spray drying of MD21 solutions (40% w/w) without and
with powder insertion (TIN 149°C, air flow rate 110 kg.h-1
, final sample).
Table 3.4.3. Properties of collected powder and of the fraction bigger than 100µm (MD21 solutions
(40% w/w), TIN 149°C, air flow rate 110 kg.h-1
, solution flow rate 3.60 kg.h-1
, final sample).
Position of
powder insertion lm&
(kg.h-1
)
Fraction
> 100µm
d10
(µm)
d50
(µm)
d90
(µm)
d4,3
( µm)
d3,2
( µm)
No insertion 3.60 2-3% 10 24 56 34 16
No insertion 4.23 2-3% 10 21 58 33 15
3.60 3% 11 23 54 34 16 a Close to atomizer 4.23 8% 12 25 89 42 22
3.60 5% 11 22 50 34 16 b1 Zone I 4.23 8% 11 24 85 42 17
3.60 8% 11 25 82 42 18 b2 Zone I (big pipes) 4.23 16% 11 25 120 47 17
3.60 9% 11 26 94 43 17 c Middle of the chamber 4.23 15% 12 29 133 55 20
Insertion position X
(g water.100g-1solids)
aw
Wettability
(s)
total
powder
fraction
>100 µm
total
powder
fraction
>100 µm
total
powder
fraction
>100 µm
No powder insertion 6.11 - 0.31 - 400 -
a Close to atomizer 6.06 6.08 0.30 0.29 380 instant
b1 Zone I 5.65 5.55 0.29 0.29 315 instant
b2 Zone I (big pipes) 6.05 6.10 0.31 0.30 420 instant
c Middle of the chamber 6.12 5.53 0.33 0.29 450 instant

Part III – Results and discussion
161
Due to the limited amount of agglomerated fraction in final powder, the properties of the
whole collected powder (water content, water activity, density, wettability) were similar to the
properties of powder obtained from trials without powder return (Table 3.4.3.).
After sieving, the final fraction of particles superior to 100 µm was analyzed, showing a very
good wettability (<1 s) and flowability, so that we considered this part of the powder as
“agglomerated fraction”. Non agglomerated powder had a wetting time superior to 5 minutes.
On the photos of collected powder by electron scanning microscopy (SEM), particles bigger
than 100 µm appeared to be made of several small particles forming a “grape” structure (Fig.
3.4.8).
4.3.2. Discussion on agglomeration Produced powder was continuously reinserted inside the chamber, but size enlargement for
maltodextrin DE21 began after more than 15 minutes. This long time meant that part of
collected powder had been reinserted several times inside the chamber, increasing the
probability of collisions with sticky particles, with progressive enlargement. But previous
particle residence time distribution trials (without powder insertion) showed that more than 20
minutes were necessary to see all the powder coming from previous drying conditions leaving
the chamber.
The inserted maltodextrin DE21 powder had a water content inferior to 6.5% and a
temperature of ~ 40°C which represent conditions below glass transition and thus was not
sticky (Fig. 3.2.9). The formation of an agglomerated fraction was then possible thanks to the
stickiness of drying drops surface. The observed size enlargement confirmed the predicted
stickiness of MD21 particles inside the chamber in the tested spray drying conditions. These
powder insertion trials could be seen as a specific stickiness test.
Agglomeration was not possible during drying of maltodextrin DE12, as particles were
already dried below glass transition close to the atomizer. In this case one possibility for
agglomeration should be to introduce sticky particles, for example by using steam to heat up
and humidify returned particles when entering inside the chamber.
The agglomerated fraction was in any case lower than 17% of the collected powder. A first
reason could be that a fraction of the collected powder has never been returned inside the
chamber. Furthermore powder insertion was localized in one or two points, which was
limiting for the possible collision area between inserted powder and sticky drying particles.
In trials with powder insertion in positions a and b above the rotary wheel, the shape of the
liquid spray could also limit the possible collision area. Actually,at the end of the trial some
liquid solution was stuck on the transport pipes, suggesting that liquid spray was not only
horizontally ejected from the rotary atomizer, but that it could have a wider shape with some
drops going upward and therefore not entering the collision area. This could also be due to
some dispersion caused by the drying air, which comes from below the wheel and can push
upward the liquid drops.
.
Increasing the liquid feed from 3.6 to 4.23 kg.h-1
and consequently the returned powder flow
rate, resulted in obtaining a bigger fraction of agglomerated powder for any insertion position
(Table 3.4.2.), according to the higher particle density.

Part III – Results and discussion
162
Figure 3.4.6. Comparison between measured air temperatures at steady state during drying of MD21 solution;
(a) without or (b) with powder insertion and TIN 144°C; (c) with powder insertion and TIN 149°C (air flow rate
110 kg.h-1
; liquid flow rate 3.6 kg.h-1
; secondary air flow rate 7 kg.h-1
).
+
65
+
65
+
66
+
65
+
66 144
MD21 40% w/w solution: 3.6 kg.h-1
Ambient air
(b)
Secondary air (7 kg.h-1; 23°C)
+
powder
+
69
+
69
+
70
+
68
+
70 144
(a)
Ambient air
110 kg.h-1
; 19.5°C; RH 49%
MD21 40% w/w solution: 3.6 kg.h-1
+
69
+
68
+
70
+
68
+
70 149
(c)
MD21 40% w/w solution: 3.6 kg.h-1
Ambient air
110 kg.h-1; 19.5°C; RH 49%
Secondary air (7 kg.h
-1; 23°C)
+
powder
Part III – Results and discussion
163
The powder insertion position determined the contact probability between drying particles
and inserted powder (collision area and particle number density) and the possible adhesion of
colliding particles to form stable agglomerates (particle stickiness and impact energy).
When recycling close to the atomizer (position a), no powder enlargement was observed for a
liquid flow rate of 3.6 kg.h-1
. Some size enlargement appeared only when increasing the
liquid flow rate up to 4.23 kg.h-1
(8% of powder with d > 100 µm). In this insertion position,
contact probability was high (high drops density). But atomized drops were still liquid, and
kinetic energy at the impact was high so that coalescence between returned powder particles
and drops was more likely to occur with formation of a single particle with a similar diameter
as the initial drop.
When recycling in Zone I far from atomizer (position b), a bigger size enlargement was
observed: 5 to 16% of powder had a diameter higher than 100 µm, depending on liquid flow
rate and powder insertion pipes diameter (shape of powder jet, area of contact). In this case
powder was returned in the upper part of the chamber, where drops surface could still be
sticky but where drops are no more completely liquid. As a consequence, solid bridges could
be formed at the surface of colliding particles, leading to agglomeration.
A bigger amount of agglomerated powder was obtained by using pipes with the bigger
diameter of 3 cm. This caused a wider powder cloud, so that a bigger fraction of drying
particles could be reached by the inserted powder.
When returning powder in the middle of the chamber (position c), a fraction of large particles
varying between 9 and 15% was obtained. This showed that stickiness of maltodextrin DE21
was still possible in this position in the tested drying conditions. In this case, the amount of
agglomerated powder was limited by the lower particle number density and by the fact that
powder insertion was performed only in one point. Some recirculations inside the chamber
could also help collisions with sticky drops in the upper part of the chamber. It should have
been interesting to compare the mechanical resistance of the agglomerates obtained in
different conditions.

Part III – Results and discussion
164
-1,00
0,00
1,00
2,00
3,00
4,00
5,00
6,00
7,00
8,00
9,00
0 50 100 150 200 250 300 350 400 450 500particle size (µm)
Vo
lum
e %
15min powder recycling
45min powder recycling
30min powder recycling
0min
Figure 3.4.7. Particle size distribution of MD21 powder collected after 15, 30 and 45 minutes of
powder insertion inside the chamber of NIRO Minor (return position b1: Zone I; Solution flow rate 4.23
kg.h-1
).
Figure 3.4.8. SEM photos of MD21 non agglomerated and agglomerated (> 100 µm) particles.

Part III – Results and discussion
165
Conclusion
When drying maltodextrin DE12, no size increase was observed when inserting powder. This
is in agreement with the predicted almost instant drying of MD12 solution below the sticky
region.
When drying maltodextrin DE21, reinsertion of powder led to some agglomeration. The
properties of the whole powder (water content, water activity, wettability) were not different
from the properties of powder collected during trials without powder insertion. But a fraction
up to 17% of final powder bigger than 100 µm could be obtained, with good flowability and
instant properties. In practice that means that in our case, particles may be reinserted several
times until reaching a final desired size, but this increases the residence time with possible
product degradation.
These results confirmed the predicted particle stickiness at given positions during drying of
maltodextrin DE21 aqueous solutions inside the chamber, for the tested operating parameters.
In industrial practice fines are usually inserted close to the liquid entrance, where the drops
density is maximal. But we showed that this position was not the best for inserting powder
with the objective of size increase, because the sprayed drops could still be in the liquid state.
In this case collisions are more likely to give coalescence or particle covering, with small size
enlargement.
The extent of size enlargement limited to 17% (particles bigger than 100 µm) was mainly due
to the designed insertion device, limiting the collision probability between drying drops and
returned particles. Furthermore according to the insertion position some liquid particles could already be too dry and/or some impact could result in coalescence.
Agglomeration could be certainly improved by modifying powder insertion so that a higher
fraction of the liquid spray/drying particles could be reached by returned particles. A
symmetrical regular insertion below (or above) atomizer wheel could be used. Final powder
could also be sieved in order to recycle only the not agglomerated fraction, as sometimes done
for fines return in industry.

Part III – Results and discussion
166
Table 3.5.1. Fixed parameters during spray drying of protein hydrolysate solution in NIRO FSD 4.0.
Table 3.5.2. Studied parameters during spray drying of protein hydrolysate solution in NIRO FSD 4.0.
Sprayed liquid TIN (°C) Fluid bed Fines return TOUT (°C)
Water 180 No Bottom 65 – 75
No 160
Yes Top 70-75
Top 75-80-88 No
Bottom 80-88
top 65-75 180
Yes Bottom 75-85
Top 88 No
Bottom 97
Protein hydrolysate
solution
200
Yes Top 80-88
Parameter Value
Inlet drying air flow rate airm& (kg.h-1) 350
Total fluid bed air flow rate fbair,m& (kg.h-1
) 100
Primary fluid bed inlet air temperature Tfb,1 (°C) 55
Secondary fluid bed inlet air temperature Tfb,2 (°C) 45
Nozzle compressed air pressure Pnozzle (bar) 2.5
Pneumatic fines return transport air pressure PfinesRet (bar) 2.5
Liquid feed temperature Tl (°C) 70
Part III – Results and discussion
167
5. Industrial application: spray drying of protein hydrolysate
The objectives were to investigate the spray drying feasibility of a protein hydrolysate
solution by varying several process parameters, observing the powder characteristics. The
industrial requirement was to obtain powders with final water content X inferior to 5g water
per 100g total solids and with good flowability.
To understand the drying behaviour of this new product we wanted to apply the previously
described approach: measurements (T, RH) on drying air in the chamber and relation with
product properties (X, aw, Tg) that are different from maltodextrin properties.
The two spray dryers (NIRO FSD 4.0 and NIRO Minor) are co-current dryers but they are
different for several aspects:
• Evaporative capacity multiplied by 5 (up to 20 kg.h-1
).
• Bi-fluid nozzle atomizer (instead of rotary), with vertical spray jet.
• Hot air inlet from the top of the chamber.
• Fines permanently returned, with pneumatic conveying (additional compressed air).
• Possible use of internal fluid bed (additional hot air flow rate).
• Total air exit from the top, resulting from the addition of inlet hot air, fluid bed air, compressed air (fines return, nozzle and nozzle cooling (Fig.2.2b)).
5.1. General conditions of trials
Studied parameters included drying air inlet temperature, liquid flow rate, use of internal fluid
bed, and position of fines return in the chamber (top or bottom of chamber).
The sprayed liquid flow rate was controlled by imposing the outlet air temperature: for safety
reasons, the exit air temperature should not be higher than 90°C. The higher the exit air
temperature, the lower the sprayed liquid flow rate.
The fixed and variable parameters are given in Tables 3.5.1. and 3.5.2.
Measurements of air properties (temperature, relative humidity) were performed in the
chamber, assumed to be representative of liquid drop drying.
5.2. Water drying without fluid bed: drying behavior and measurements feasibility
Two drying conditions with water were performed (without use of bottom fluid bed) to test
the feasibility of air properties measurements (T, RH) in the chamber and as a reference for
the drying conditions that will be used for solution drying.
Two liquid flow rates, 12 and 15 kg.h-1
, were tested, corresponding respectively to air exit
temperatures (TOUT) of 65 and 75°C for a drying air inlet (TIN) temperature of 180°C (Fig.
3.5.1a).
At point 4 (close to spray), the measured air temperature was of 69°C and 59°C for a water
flow rate of respectively 12 and 15 kg.h-1
. Further in the chamber (points 2 and 3), air
temperatures were 3°C lower, and at point 5 they were respectively 8°C and 13°C lower. In
the top of the chamber, close to the air exit (point 5), temperature was higher (74°C and 65°C
respectively for the two water flow rates).
The high difference between 180°C (TIN) and the mean temperature inside the chamber (69°C
and 59°C for 12 and 15 kg.h-1
) was due to the quick drying when the hot air contacts the
sprayed drops (point 4). The low temperature in the bottom of the chamber could also be due
to the introduction of cold compressed air for fines return that could not be stopped (unknown

Part III – Results and discussion
168
Figure 3.5.1. Air cartographies at steady state during water and protein hydrolysate solution drying
(a) Inlet air temperature 180°C; water flow rate 12 – 15 kg.h-1
; no fluid bed;
(b) Inlet air temperature 180°C; liquid flow rate 15 – 18 kg.h-1; no fluid bed; bottom fines return;
(c) Inlet air temperature 200°C; solution 40% w/w; liquid flow rate 15–20 kg.h-1
; + fluid bed; top fines return. flow rate, but small).
+
65
+
59
+
59
+
56
+
46
No fluid bed
Inlet air T : 180°C, 350 kg.h-1
Water flow rate: 15 kg.h-1 (Tout: 65°C)
RH: 67.5 %
RH: 24.7 %
93% water evaporated
82% water evaporated
Compressed
air
+
74
+
69
+
69
+
68
+
61
No fluid bed
Inlet air T : 180°C, 350 kg.h-1
Water flow rate: 12 kg.h-1 (Tout: 75°C)
RH: 28.3 %
RH: 10.8 %
100% water evaporated
60% water evaporated
Compressed
air
a
+
65
+
59
+
59
+
56
+
46
No fluid bed
Inlet air T : 180°C, 350 kg.h-1
Water flow rate: 15 kg.h-1 (Tout: 65°C)
RH: 67.5 %
RH: 24.7 %
93% water evaporated
82% water evaporated
Compressed
air
+
65
+
59
+
59
+
56
+
46
No fluid bed
Inlet air T : 180°C, 350 kg.h-1
Water flow rate: 15 kg.h-1 (Tout: 65°C)
RH: 67.5 %
RH: 24.7 %
93% water evaporated
82% water evaporated
Compressed
air
+
74
+
69
+
69
+
68
+
61
No fluid bed
Inlet air T : 180°C, 350 kg.h-1
Water flow rate: 12 kg.h-1 (Tout: 75°C)
RH: 28.3 %
RH: 10.8 %
100% water evaporated
60% water evaporated
Compressed
air
+
74
+
69
+
69
+
68
+
61
No fluid bed
Inlet air T : 180°C, 350 kg.h-1
Water flow rate: 12 kg.h-1 (Tout: 75°C)
RH: 28.3 %
RH: 10.8 %
100% water evaporated
60% water evaporated
Compressed
air
a
+
80
+
77
+
79
+
68
+
45
No fluid bed
Inlet air T : 180°C, 350 kg.h-1
Liquid flow rate: 18 kg.h-1 (Tout: 80°C)
RH: 16.3 %75% water evaporated
Fines
+
Compressed air
+
90
+
88
+
88
+
80
+
58
No fluid bed
Inlet air T : 180°C, 350 kg.h-1
Liquid flow rate: 15 kg.h-1 (Tout: 88°C)
RH: 7.5 %65% water evaporated
Fines
+
Compressed air
b
+
80
+
77
+
79
+
68
+
45
No fluid bed
Inlet air T : 180°C, 350 kg.h-1
Liquid flow rate: 18 kg.h-1 (Tout: 80°C)
RH: 16.3 %75% water evaporated
Fines
+
Compressed air
+
90
+
88
+
88
+
80
+
58
No fluid bed
Inlet air T : 180°C, 350 kg.h-1
Liquid flow rate: 15 kg.h-1 (Tout: 88°C)
RH: 7.5 %65% water evaporated
Fines
+
Compressed air
b
+
81
+
81
+
81
+
79
+
65
With fluid bed (air ~ 40°C, 100 kg.h-1)
Inlet air T : 200°C, 350 kg.h-1
Liquid flow rate: 20 kg.h-1 (Tout: 80°C)
RH: 24.3 %92% water evaporated
Fines +
Compressed air
c
RH: 9.5 %67% water evaporated
+
87
+
84
+
84
+
83
+
76
With fluid bed (air ~ 40°C, 100 kg.h-1)
Inlet air T : 200°C, 350 kg.h-1
Liquid flow rate: 15 kg.h-1 (Tout: 88°C)
RH: 6.9 %
77% water evaporated
Fines +
Compressed air RH: 5.7 %63% water evaporated
+
81
+
81
+
81
+
79
+
65
With fluid bed (air ~ 40°C, 100 kg.h-1)
Inlet air T : 200°C, 350 kg.h-1
Liquid flow rate: 20 kg.h-1 (Tout: 80°C)
RH: 24.3 %92% water evaporated
Fines +
Compressed air
c
RH: 9.5 %+
81
+
81
+
81
+
79
+
65
With fluid bed (air ~ 40°C, 100 kg.h-1)
Inlet air T : 200°C, 350 kg.h-1
Liquid flow rate: 20 kg.h-1 (Tout: 80°C)
RH: 24.3 %92% water evaporated
Fines +
Compressed air
c
RH: 9.5 %67% water evaporated
+
87
+
84
+
84
+
83
+
76
With fluid bed (air ~ 40°C, 100 kg.h-1)
Inlet air T : 200°C, 350 kg.h-1
Liquid flow rate: 15 kg.h-1 (Tout: 88°C)
RH: 6.9 %
77% water evaporated
Fines +
Compressed air RH: 5.7 %63% water evaporated
Fluid
bed Powder OUT
Exit air
TOUT
TFB
+ T5, R
+ T4
+ T3
+ T2
+
2 m
+ T1, R
Fluid
bed Powder OUT
Exit air
TOUTTOUT
TFBTFB
+ T5, R
+ T4
+ T3
+ T2
+
2 m
+ T1, R
Water
Solution
Part III – Results and discussion
169
The high temperature in the top, close to air exit, may be due to mixing of inlet hot air with
cold humid air coming upwards (Fig 2.2.c).
Air relative humidity was measured at points 1 and 5. As expected, an increase of the water
flow rate (12 to 15 kg.h-1
) resulted in an increase of evaporated water and therefore of the air
relative humidity: 10.8 to 24.7% for point 5 and 28.3 to 67.5% for point 1. A mass balance on
water in air showed that 93% to 100% of water was evaporated in the bottom of the chamber.
However, this calculation was done with the inlet air flow rate of 350 kg.h-1
(measured at the
entrance) not taking into account the effect of fines recycling compressed air and cooling air
of nozzle entries. Values at point 5 should be considered carefully due to mixing with inlet hot
“dry” air that could decrease the exit air total water content.
From water spray drying trial we could determine that measurements of air temperature and
relative humidity inside the chamber were possible, but positions for measurements should be
chosen carefully, taking into account air flow pattern inside the chamber that could lead to
mixing of air. Furthermore the total air flow rate should be measured at the exit of the
chamber in order to perform more accurate mass balances on water in air.
More generally, operating conditions for which we observed in the chamber low air
temperature and high relative humidity could lead locally to drying problems when a real
solution will be sprayed: sticking on walls, final powder too humid.
.
5.3. Protein hydrolysate solution drying trials feasibility
Operating conditions for all the spray drying trials of protein hydrolysate solution are reported
in Table 3.5.3, together with the properties of the collected powder (when they could be
measured).
5.3.1. Drying trials for TIN 180°C The main part of the study was performed for an inlet air temperature of 180°C, as suggested
by a preliminary feasibility study made in Nestlé PTC for the considered product. For safety
reasons, exit air temperature could not be higher than 90°C, corresponding to minimal liquid
flow rate of 15 kg.h-1
(corresponding to 9.5 kg.h-1
of water to evaporate) at this inlet air
temperature. Trials were performed with and without use of fluid bed, recycling fines at the
top or at the bottom of the chamber. The exit air temperatures were between 65 and 88°C, for
liquid flow rates between 23 and 15 kg.h-1
.
Trials without fluid bed were performed in order to characterize the powder entering the
possible fluid bed and to better understand the role of this fluid bed.
The solution flow rate was decreased from 20 to 15 kg.h-1
corresponding respectively to 12.5
and 9.5 kg.h-1
of water to evaporate and to exit air temperatures between 75 and 88°C. The
highest liquid flow rate of 20 kg.h-1
led to a “pasty” product which blocked the exit of the
chamber. Desired specifications for powder moisture content could never be reached. Even
for the lowest liquid flow rate of 15 kg.h-1
powder moisture content was about 6 g water/100 g
total solids. Use of fluid bed was then compulsory for reaching specifications.
Position of fines return affected the average size of recovered powder. Returning fines at the
bottom of the chamber instead of top, led to particles with lower median diameters: 60 – 40
µm, compared to 90 – 70 µm when fines were introduced at the top (Table 3.5.3).
When using the fluid bed, powders (X < 8 g water.100 g-1
total solids) were obtained only
when returning fines particles at the top of the chamber. Recycling fines at the bottom of the
chamber led to a blockage of the fluid bed whatever the solution flow rate between 20 and

Part III – Results and discussion
170
Table 3.5.3. Powder properties for protein hydrolysate solution spray drying in NIRO FSD 4.0
TIN
(°C)
Fluid
Bed
Fines
return
TOUT
(°C)
Liquid flow rate
(kg.h-1
)
X
(gH2O/100gTS) aw
d0,5
(µm)
ρbulk
(g.ml-1
)
ρtap
(g.ml-1
)
75 20.0 (12.5 water) 9.97 (“paste”) // // // //
80 18.0 (12.0 water) 8.6 0.36 89 0.46 0.53 Top
88 15.0 (9.5 water) 6.2 // 74 0.58 0.64
80 18.0 (12.0 water) 7.6 // 58 0.54 0.59
No
Bottom 88 15.0 (9.5 water) 6.5 0.27 41 // //
65 23.0 (15.0 water) 8.03 0.28 0.40 0.44 Top
75 20.0 (12.5 water) 5.7 0.19 126 0.52 0.58
75 20.0 (12.5 water) Fluid bed
blocked // // // //
180
Yes
Bottom
85 16.0 Fluid bed
blocked // // // //
Top 70 16.2 Fluid bed
Blocked // // // //
No Top 75 14.8 6.8 0.29 67 0.58 0.64
Top 70 16.2 6.3 0.18 93 0.53 0.59
160
Yes Top 75 14.8 5.15 0.19 96 0.51 0.57
Top 88 15.0 (9.5 water) 4.6 0.20 99 0.54 0.58 Yes
Top 80 20.0 (12.5 water) 5.1 0.21 198 0.47 0.57
Top 88 15.0 (9.5 water) Fluid bed
blocked // // // //
200
No
Bottom 97(too
high) // // // // // //
Part III – Results and discussion
171
16 kg.h-1
. When compared with trials performed without fluid bed in the same conditions
(solution flow rate 20 kg.h-1
, exit air temperature 75°C, top fines return), the use of the fluid
bed allowed decreasing the powder water content from 9.97 (“paste”) without fluid bed to 5.7
g water/100 g total solids (Fig. 3.5.2). And, without fluid bed the median particle size was
inferior to 90µm whilst with the fluid bed it increased up to 126 µm. This indicates that size
enlargement occurred with the use of the fluid bed, and SEM observations showed that
particles were agglomerated (Fig. 3.5.3)
As a conclusion, with an inlet air TIN of 180°C, the required specification for final product
moisture content (5%) could never be reached. Other inlet air temperatures (higher) and/or
solution flow rates have to be tested, or lower flow rates should be used at 180°C.
The use of fluid bed associated with top recycling of fines seemed to help decreasing final
moisture content of powders, and increasing final powder size.
Another comment is that the mean water content X and water activity aw of the “best”
powders correspond to a position above the equilibrium sorption isotherm (Fig. 3.5.4a).
Drying is a desorption process, leading to some hysteresis (curve above) compared to
adsorption.
This isotherm was measured at 23°C for a product of the same type (composition may slightly
vary). The shape of the sorption isotherm curve could suggest that some crystallization can
occur (but unknown composition) when equilibrating the powder for measuring sorption
isotherms, resulting in a lower water content for a given water activity.
Based on sorption isotherm, an average water content of 5% should correspond to a water
activity of 0.5 and to a product above glass transition at ambient temperature (Fig. 3.5.4b),
which thus should not be stable. However, the powders obtained with a measured water
activity of 0.19 and water content of 5.7% where stored at ambient temperature during several
months (Tg ~ Tamb) without observing nay caking. This could be due to a different surface
composition of particles with formation of a “crust” preventing particles from caking.
All these last comments on this complex product need some further verification/confirmation
with other trials and measurements.
5.3.2. Effect of inlet air temperature (160°C and 200°C) Use of drying air with higher inlet temperature (e.g. 200°C) should lead to lower water
content for powder. As an important part of the cost of the spray drying process is due to the
heating of air, it was interesting to test a lower inlet air temperature TIN of 160°C, and check
the powder properties.
Trials with inlet air temperature of 160°C and 200°C were performed with fines return on top
(that gave the best results during drying at 180°C), with and without the fluid bed.
For inlet air at 160°C, without using the fluid bed, even with the minimum tested liquid flow
rate (14.8 kg.h-1
, corresponding to an outlet temperature of 75°C), the collected powder was
too humid (X = 6.8 g water.100 g-1
dry matter) and increasing the atomized liquid flow rate to 16.2 kg.h
-1 resulted in the blockage of installation (powder caking at the exit of the chamber)
(Table 3.5.3).
The use of the integrated fluid bed allowed reducing final powder moisture content almost
until specification (5.1% for 14.8 kg.h-1
). The use of fluid bed also lead to higher average
particle size (from 67 to 97 µm) as already observed for air at 180°C. However the powder
median diameter was inferior to 100 µm (it was of 126 µm for 180°C with a 20 kg.h-1
solution
flow rate for the same exit air temperature (75°C)).

Part III – Results and discussion
172
0
2
4
6
8
10
12
14
16
18
0 0.1 0.2 0.3 0.4 0.5 0.6 0.7 0.8 0.9 1
aw
X w
ate
r (g
wate
r/100g
to
tal
so
lid
s)
Typical protein
hydrolysate
Sorption isotherm
at 23 °C
Final spray dried powder from
trials
0
1
2
3
4
5
6
7
8
9
10
11
13 14 15 16 17 18 19 20 21 22 23 24
Liquid flow rate (kg.h-1)
X (
g w
ate
r/ 1
00g
to
tal
so
lid
s) without fluid bed
with fluid bed
Figure 3.5.2. Final powder moisture content of protein hydrolysate powder as a function of liquid
flow rate and effect of use of fluid bed (Inlet air temperature 180°C, top fines return).
Figure 3.5.3. SEM photos of protein hydrolysate powder.
Figure 3.5.4. Typical sorption isotherm at 23°C and measured X,aw on obtained powder (a);
glass transition temperatures of protein hydrolysate powder as a function of water activity (b).
(a) (b)
Part III – Results and discussion
173
As a conclusion, with an inlet air temperature of 160°C, it was possible to obtain a dry
powder almost within required specification by limiting the solution flow rate (<15 kg.h-1
).
Even in this case, use of fluid bed was compulsory to achieve specifications (as for 180°C).
The average diameter of the powder was inferior to 100 µm (lower than for drying at 180°C).
For inlet air TIN 200°C, without fluid bed partial or complete blocking of the installation
occurred due to strong adhesion of the powder on the walls of the outlet cone. To obtain a dry
product within the required specification, the use of fluid bed was therefore necessary. In
these conditions, solution flow rates up to 20 kg.h-1
allowed getting powders with water
content close to the specification of 5 g water.100 g-1
dry matter. Higher liquid flow rates led
to larger median particles diameters up to 200 µm for 20 kg.h-1
.
5.4. Discussion about the drying behavior, the role of fines return and fluid bed during protein hydrolysate solution spray drying
5.4.1. Spray drying behavior: air properties evolution inside the chamber Air cartographies (T, RH) at steady state (after 20 minutes of drying – TIN 180°C) without
fluid bed for solution flow rates of 15 and 18 kg.h-1
are given in Figure 3.5.1b.
Most of the observations made for water drying trials are still valid (big air temperature
decrease of about 100°C due to fast water evaporation, then homogeneous temperatures (∆T ~
15°C between top and bottom) with possible air mixing inside the chamber and temperature
decrease at point 1 due to fines return compressed air inlet).
Comparing the cartographies obtained when spraying water with those for the protein
hydrolysate solution with the same water flow rate to evaporate (18 kg.h-1
liquid solution and 12 kg.h
-1 of water), we can observe that the drying behavior was different (Fig. 3.5.1a and
3.5.1b). Even if the amount of water to evaporate was the same (12 kg.h-1
), temperatures
inside the tower were almost 10°C higher (points 3-4) in the case of protein hydrolysate
solution drying, indicating that drying was slower. For hydrolysate solutions drying, only
75% of water was evaporated in the lower part of the chamber, compared to 100% for water
drying (water mass balance on air). So the drying kinetics of hydrolysate solution were slower,
due to water bound with dry matter inside the liquid droplets.
Cartographies for inlet air temperature TIN 200°C were obtained while using also the fluid bed
(Fig. 3.5.1c). This results in an additional flow rate of 100 kg.h-1
of hot dry air (T = 55°C and
45°C) that entered in the chamber from the bottom. As a consequence, measured air
temperature and relative humidity inside the chamber resulted from a mixing of hot drying air,
fluid bed drying air and secondary compressed air for fines return, nozzle air and cooling
(unknown flow rate and temperature). This means that balances on evaporated water inside
the chamber should be considered carefully, as calculated air water content comes from this
mixing of air streams (not all known).
Due to the higher air temperatures inside the chamber (compared to trials with inlet air at
160°C and 180°C), drying particles could have a higher temperature at the chamber exit. The
liquid was initially sprayed at 70°C, and it was then cooled down due to evaporation. In the
first drying phase (free water evaporation, surface water activity equal to 1) surface
temperature will be equal to the air wet bulb temperature (40-45°C for air at 160-200°C).
After constant evaporation rate phase, the particle will be heated until possibly reaching the
surrounding air temperature (upper limit). Assuming thermal equilibrium in the bottom of the
chamber between air and particle, when drying at 200°C, particles should enter the fluid bed
with a temperature of 65-75°C (compared to 45-60°C when drying at 180°C).
This different temperature could affect particle behaviour (stickiness) inside the fluid bed.

Part III – Results and discussion
174
Table 3.5.4. Powder properties at the exit of fluid bed for different inlet drying air temperatures.
Inlet air TIN
(°C)
Fines return Exit air TOUT
(°C)
Liquid flow rate
(kg.h-1
)
X (g/100g solids)
aw d50
(µm)
160 Top 75 14.8 5.15 0.19 96
180 Top 75 20.0 5.7 0.19 126
200 Top 80 20.0 5.1 0.21 198
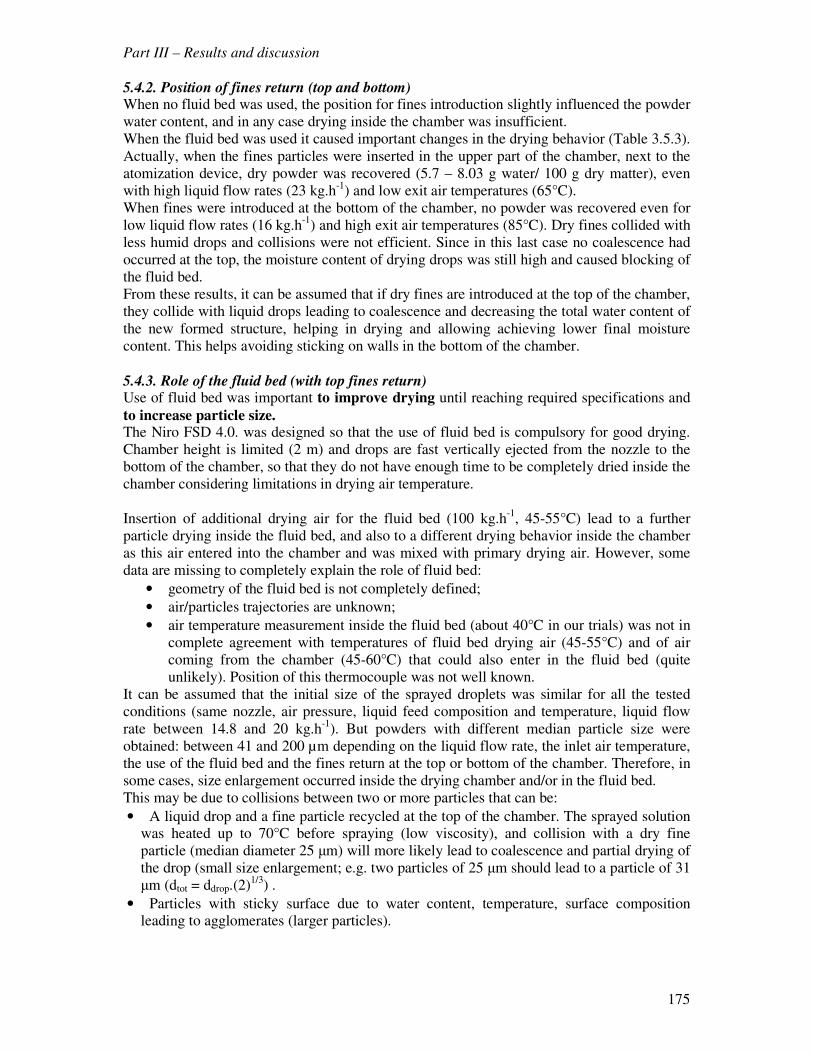
Part III – Results and discussion
175
5.4.2. Position of fines return (top and bottom) When no fluid bed was used, the position for fines introduction slightly influenced the powder
water content, and in any case drying inside the chamber was insufficient.
When the fluid bed was used it caused important changes in the drying behavior (Table 3.5.3).
Actually, when the fines particles were inserted in the upper part of the chamber, next to the
atomization device, dry powder was recovered (5.7 – 8.03 g water/ 100 g dry matter), even
with high liquid flow rates (23 kg.h-1
) and low exit air temperatures (65°C).
When fines were introduced at the bottom of the chamber, no powder was recovered even for
low liquid flow rates (16 kg.h-1
) and high exit air temperatures (85°C). Dry fines collided with
less humid drops and collisions were not efficient. Since in this last case no coalescence had
occurred at the top, the moisture content of drying drops was still high and caused blocking of
the fluid bed.
From these results, it can be assumed that if dry fines are introduced at the top of the chamber,
they collide with liquid drops leading to coalescence and decreasing the total water content of
the new formed structure, helping in drying and allowing achieving lower final moisture
content. This helps avoiding sticking on walls in the bottom of the chamber.
5.4.3. Role of the fluid bed (with top fines return) Use of fluid bed was important to improve drying until reaching required specifications and
to increase particle size. The Niro FSD 4.0. was designed so that the use of fluid bed is compulsory for good drying.
Chamber height is limited (2 m) and drops are fast vertically ejected from the nozzle to the
bottom of the chamber, so that they do not have enough time to be completely dried inside the
chamber considering limitations in drying air temperature.
Insertion of additional drying air for the fluid bed (100 kg.h-1
, 45-55°C) lead to a further
particle drying inside the fluid bed, and also to a different drying behavior inside the chamber
as this air entered into the chamber and was mixed with primary drying air. However, some
data are missing to completely explain the role of fluid bed:
• geometry of the fluid bed is not completely defined;
• air/particles trajectories are unknown;
• air temperature measurement inside the fluid bed (about 40°C in our trials) was not in
complete agreement with temperatures of fluid bed drying air (45-55°C) and of air
coming from the chamber (45-60°C) that could also enter in the fluid bed (quite
unlikely). Position of this thermocouple was not well known.
It can be assumed that the initial size of the sprayed droplets was similar for all the tested
conditions (same nozzle, air pressure, liquid feed composition and temperature, liquid flow
rate between 14.8 and 20 kg.h-1
). But powders with different median particle size were
obtained: between 41 and 200 µm depending on the liquid flow rate, the inlet air temperature,
the use of the fluid bed and the fines return at the top or bottom of the chamber. Therefore, in
some cases, size enlargement occurred inside the drying chamber and/or in the fluid bed.
This may be due to collisions between two or more particles that can be:
• A liquid drop and a fine particle recycled at the top of the chamber. The sprayed solution was heated up to 70°C before spraying (low viscosity), and collision with a dry fine
particle (median diameter 25 µm) will more likely lead to coalescence and partial drying of
the drop (small size enlargement; e.g. two particles of 25 µm should lead to a particle of 31
µm (dtot = ddrop.(2)1/3
) .
• Particles with sticky surface due to water content, temperature, surface composition leading to agglomerates (larger particles).

Part III – Results and discussion
176

Part III – Results and discussion
177
This second situation could occur when fluid bed was used, either inside the fluid bed or in
the lower part of the chamber by contact between drying drops/particles and fines particles
coming upwards from the fluid bed inside the chamber.
Assuming thermal equilibrium between particles and air inside the fluid bed, particles will
reach a temperature of about 40°C (measured in the top part of fluid bed). From glass
transition data (Fig. 3.5.4b), particles with a temperature of about 40°C could be sticky when
their surface water activity is between 0.1 and 0.25.
This is in agreement with the obtained results on final powder. For all the trials performed
with the fluid bed (whatever the inlet air temperature), powders with a water activity about 0.2
(0.18 – 0.21) had median diameters larger than 93 µm (93 – 198 µm) whilst without fluid bed
(and therefore agglomeration) particles diameters were inferior to 90 µm (46 – 89 µm).
However, for a similar average final powder water activity, median diameter was bigger in
trials with a higher inlet drying air temperature (Table 3.5.4) (96 µm for 160°C; 126 µm for
180°C; 198 µm for 200°C).
This could also be explained by the fact that particle surface could be less humid than the
average value of the particle, and so a higher surface temperature would be needed to have a
sticky behavior: for example, if surface water activity is 0.1, to be inside the sticky zone
surface temperature should be of ~50°C.
When inlet air temperature is higher, particles temperatures in the chamber are also higher
with a lower surface viscosity. Thus they could exhibit a more sticky behavior when entering
in the fluid bed, leading to a wider size enlargement.
Conclusion
The solution of protein hydrolysate was successfully dried within required specifications for
final moisture content (≈ 5% powder water content).
The approach of air properties measurement inside spray dryer chamber was successfully
applied to a different equipment to help interpretation of drying behavior of a protein
hydrolysate solution.
Comparison between air temperatures and relative humidity measured during water and
solution drying showed a different drying behavior. Air measurements inside the chamber
were then confirmed to be possible good indicators of drying behavior, but for further study
the complex air flow pattern should be determined in order to choose good positions for
probes (possible air mixing inside the chamber). Total air flow rate should be measured at the
exit, to take into account all the secondary unknown air flow rates.
The use of fluid bed (with additional hot air) and fines return on top of chamber were
necessary conditions to obtain a dry product within specification. It was assumed that there
was coalescence between sprayed drops and recycled fines close to the atomizer, participating
in decreasing drop/particle water content into the chamber; then inside or close to the fluid
bed sticking between particles was possible, as their surface reached appropriate conditions of
water activity and temperature to be in a rubbery sticky state. The inlet air temperature and
liquid flow rate determine moisture content and surface temperature of the powder entering
the fluid bed. A higher inlet air temperature led to a wider size enlargement inside the fluid
bed.
And the use of the bottom fluid bed could also help agglomeration by moving back upwards
the smallest particles inside the chamber, where they could collide with drying drops.


CONCLUSION

179
Conclusion
This study had the objective to better understand the evolution of particle properties along
spray drying in relation with measurements on air inside the chamber of a single-stage
cocurrent pilot spray dryer equipped with rotary atomizer.
Air temperature and relative humidity were successfully measured during drying of water and
maltodextrin DE12 and DE21 solutions, using thermocouples and a capacitive hygrometer.
These measurements were used for a mass balance on water in air between the entrance and
different points inside the chamber. With the assumption that particles and air were
circulating together, exchanging heat and water, it was possible to deduce the evolution of the
average particle water content along the chamber.
The effect of several process parameters (inlet air temperature, air flow rate, liquid flow rate,
rotary atomizer speed) on drops drying behavior was studied. In any conditions, most of
drying occurred very fast, close to the atomizer because of high temperature and water
pressure gradients. We must note that the tested air humidity sensor was resistant to high
temperatures but not well adapted for low air relative humidity in these conditions. At high
temperature it led to a big error in determination of low air water content and thus for the
mass balance on water in air. But that situation corresponded to high inlet air temperature
and/or low liquid flow rate, for which drying was very fast and considered as already
completed close to the atomizer. Particles already reached their final water content in the
upper part of the chamber.
For all other operating conditions (low air temperature, high liquid flow rate) for which
drying continued further inside the chamber, it was possible to follow air properties corresponding to increase of water contents and decrease of temperatures.
Air relative humidity at the exit of the chamber was found to be an indicator of final powder
water activity and water content, although equilibrium between air and product was never
reached.
The process was studied by drying water as a reference and solutions of two maltodestrins
DE12 and DE21. These two products differ in ability to dry and lead to possible sticking
conditions interesting for the final objective of agglomeration.
For the same amount of water to evaporate and for the same operating conditions, air
temperatures inside the spray dryer chamber were lower and relative humidity higher when
drying water. It was possible to show that the evaporation of free water was easier compared
to the evaporation of water bound to solute in solution. The difference in measured air
properties for the two maltodextrins solutions showed a drying behavior for MD21 closer to
water compared to MD12. It was in relation with their different domains (T, aw) of glass
transition and viscous state not favorable to easy drying.
For maltodextrin solutions drying, the average particle water content was calculated from air
water content evolution, at different positions in the chamber. In combination with glass
transition temperatures and equilibrium sorption isotherms it was possible to determine
operating conditions and positions inside the dryer for which particles could be considered as
sticky.
Due to its higher glass transition temperatures (function of aw and X), maltodextrin DE12
was, in the tested conditions, quickly “dried” until values of water content and water activity
for which the particle is below the sticky zone. Stickiness was then envisaged only close to
the atomizer.

180

181
Maltodextrin DE21 had lower glass transition temperatures, with a sticky zone corresponding
to lower values of water content and water activity, so that particles should be sticky in a
wider part of the chamber, depending on operating conditions.
Spray drying simulation was also investigated to predict stickiness. A simplified
Computational Fluid Dynamics (CFD) model was used to obtain further information on air
flow pattern, to put in evidence possible air recirculations zones and follow the evolution of
temperatures and water content of particles.
To take into account the reduced evaporation rate when drying liquid solutions compared to
free water (used in classical model), particle drying was simulated by considering a reduced
drop water vapour pressure. A different coefficient (<1) for the two maltodextrins was used
with a value for maltodextrin DE21 intermediate between water (1) and maltodextrin DE12.
Evolution of particle average water content could be correctly described. The main advantage
of this approach is that it is easily applicable to different dryer geometry and products
(coefficient to determine), as composition and diffusion are not directly considered. On the
other side, differences between core and surface were not taken into account and particle
surface properties are not accurately predicted especially temperature.
Calculated possible sticky zones for MD12 and MD21 were in agreement with the
experimental determined ones, showing that CFD could be used for a qualitative estimation of
the effect of operating parameters on particle stickiness.
The predicted sticky regions were tested by performing agglomeration of particles of
maltodextrins DE12 and DE21, inside the dryer. A special device was designed to reinsert
regularly part of the produced powder, at different positions inside the chamber. Collisions
between returned particles and drying sticky particles led to the production of a fraction of big
particles with improved flowability and wettability. This size enlargement confirmed the
predicted stickiness in a wide part of the chamber for maltodextrin DE21, whilst, as expected,
no agglomeration was obtained when drying MD12.
It was possible to put in evidence that the biggest agglomerated fraction was obtained when
inserting powder not immediately close to the atomizer, as usual in industrial practice for
fines return. This position is usually chosen because of the high liquid drops density, leading
to a big collision probability. But collisions in this position are more likely to give particle
covering or coalescence, with small size enlargement. As a consequence, particles should be
returned several times to increase size, and this could lead to product degradation.
Local insertion in the top part at a distance of the atomizer, or in the middle of the chamber,
led to a maximum of 16 % of agglomerated particles with a size superior to 100 µm. So the
estimation of particle stickiness from measurements on air and product characteristics could
allow optimizing the choice of powder insertion position depending on the desired product
properties. But powder insertion has to be improved and optimised for a regular symetrical
insertion, to return only the fines, and with possibility to insert different particles, not only the
ones produced.
The developed experimental approach was applied to a semi-industrial spray dryer equipped
with nozzle atomizer, fines return and internal fluid bed, using air measurements to better
understand the drying of a particular product, with some constraints, either for the product or
for the equipment. Properties as glass transition temperature diagram and sorption isotherms
for the studied product were used to interpret results.
This application put in evidence some limitations to take into account. First, exact
determination of air flow rate including some air entrances (e.g. air for fines return, fluid bed,
nozzle) is crucial for solving mass balances. In industrial dryers air flow rate is often

182

183
measured just at the entrance of the chamber, while a measure at the exit could be useful to
determine the total air flow rate inside the dryer. Furthermore, some air recirculations occur,
especially in relation with the geometry of the chamber. This means that air flow pattern
should be known in order to choose positions for air properties measurements that could be
representative of the drying particles properties. This flow pattern has to be estimated as in
this study (temperature measurements) or measured (velocity measurements) or predicted by
simulation.
The study with the semi-industrial spray dryer with fines return, confirmed that fines insertion
close to the atomizer had as main function to improve drying by decreasing particles water
content at the beginning of drying, while size enlargement occurred mainly inside the
integrated fluid bed. This return of fines means a high residence time for some particles which
can have a bad effect on quality, depending on their heat sensitivity. Inside or close to the
fluid bed using controlled heated air, the particles could reach equilibrium with air due to their
residence time. Controlling air temperature and relative humidity is a way to control powder
characteristics and possible stickiness, before final powder exit. In that case if no fines were
produced during this final step in fluid bed, some other particles could be introduced close to
the atomizer to participate and complete the composition of drops and to improve their drying
and agglomeration.

184

185
List of symbols
Symbol
description Units
A Total exchange surface of liquid spray m2
Adrop, Atot Drop surface, surface of Ndrops m2
Apipe Pipe section m2
aw Water activity
b Height of rotary wheel vanes m
C, CGAB BET and GAB parameters
CD Drag coefficient
CP Specific heat J.kg-1
.K-1
Cw,b Water vapour concentration in bulk air mol.m3
Cw,s Water vapour concentration at drop surface mol.m3
D BET parameter
d3,2 Sauter diameter m
ddrop Drop diameter m
dor Nozzle orifice diameter m
dp Particle diameter m
Dw Water vapour diffusion coefficient in air m2.s
-1
Ek Kinetic energy Kg.m².s-²
f Fan frequency Hz
FD Drag force N
g Gravity acceleration m.s-2
H Air mass enthalpy kJ.kg-1
h Global heat exchange coefficient W.m-2.K-1
hc Convective heat transfer coefficient between air and drops W.m-2
.K-1
J Mass diffusion flux kg.m2.s
-1
k Turbulent kinetic energy m2.s
-2
kc Mass transfer coefficient s.m-1
keff Gas effective thermal conductivity J.s-1
.m-1
.K-1
m& Mass flow rate kg.s-1
M Molecular weight g.mol-1
ewm& , dt
dm
Evaporated water mass flow rate
kg.s-1
Ndrops Number of drops
N Rotation speed rpm
P Static air pressure Pa
PfinesReturn Pressure of compressed air for fines return Pa
Pnozzle Pressure of compressed air for bifluid nozzle Pa
Pvair, Pv Water vapour pressure of air, of product Pa
Pvdrop
Water vapour pressure at drop surface Pa
Pwsat
Saturated water vapour pressure of pure water Pa
lossesQ& Heat losses flow rate kJ.s-1
RH Air relative humidity
S Surface of spray dryer chamber walls m2
Sm Mass source term kg.m-3
.s-1
Sh Heat source term W.m-3
T Temperature °C
Tdp Air dew point temperature °C
Texit Air temperature at the exit of spray dryer °C
Tfb,1 Primary fluid bed air temperature °C
Tfb,2 Secondary fluid bed air temperature °C
Tg Glass transition temperature °C
Ts Drop surface temperature °C
Tsticky Sticky temperature °C
Twall Chamber wall temperature °C
Twb Air wet bulb temperature °C

186
u Fluid velocity m.s-1
up Particle velocity m.s-1
airV& Volumetric air flow rate m3.s
-1
v Velocity m.s-1
vwheel Rotary wheel velocity rps
w Mass fraction
X Powder water content (dry basis) kg water.kg-1
total solids
Xc Critical water content kg water.kg-1
total solids
Xeq Product water content at equilibrium kg water.kg-1 total solids
Xwet Powder water content (wet basis) kg water.kg-1
powder
Y air water content kg water.kg-1
dry air
γc Shear velocity gradient s-1
∆Hv Specific heat of vaporization J.kg-1
ε Turbulent kinetic energy dissipation rate m².s-3
ηthermal Process thermal efficiency
λ Thermal conductivity W.m-1
.K-1
µ, µg Viscosity, at glass transition temperature Pa.s
µeff Gas effective viscosity Pa.s
µt Turbulent air viscosity Pa.s
ρ Density kg.m-3
ρbulk, ρtap Bulk, tapped density kg.m-3
σ Surface tension N.m-1
σ k, σε Turbulent Prandtl number
τ Mean residence time s
Subscripts
air Dry air
amb At ambient temperature
ax Axial
IN At air inlet
l Liquid
OUT At the chamber outlet
p Particle/drying drop
s Solid
vapour Water vapour
w Water

187
REFERENCES Adhikari B., Howes T., Bhandari B.R., Truong V., 2001. Stickiness in foods: a review of
mechanisms and test methods. International Journal of Food Properties, 4(1), 1-33.
Adhikari B., Howes T., Bhandari B., 2003. Surface stickiness of drops of carbohydrate and
organic acid solutions during convective drying: experiments and modeling. Drying
Technology, 21(5), 839-873.
Adhikari B., Howes T., Bhandari B.R, Truong V., 2004. Effect of addition of maltodextrin
on drying kinetics and stickiness of sugar and acid-rich foods during convective drying:
experiments and modelling. Journal of Food Engineering, 62(1), 53-68.
Adhikari B., Howes T., Lecomte D., Bhandari B.R., 2005. A glass transition temperature
approach for the prediction of the surface stickiness of a drying droplet during spray
drying. Powder Technology, 149, 168-179.
Adhikari B., Howes T., Shrestha A, Bhandari B.R., 2007. Effect of surface tension and
viscosity on the surface stickiness of carbohydrate and protein solutions. Journal of Food
Engineering, 79(4), 1136-1143.
Aguilera J.M., Lilford P.J., 2008. Food materials science – principles and practice. Springer,
New York, 620 pp.
Alamilla-Beltràn L., Chanona-Pérez J.J., Jimenez-Aparicio A.R., Gutierrez-Lopez G.F., 2005. Description of morphological changes of particles along spray drying. Journal of
Food Engineering, 67, 179-184.
Albrecht H.E., 2003. Laser Doppler and Phase Doppler Measurements Techniques. Berlin,
Heidelberg, New York, Springer-Verlag, 738pp.
Bhandari B.R., 1992. Etude du procédé de séchage par pulvérisation Leaflash pour les produits alimentaires. Thèse ENSIA, 161p.
Bhandari B.R., Howes T., 1999. Implication of glass transition for the drying and stability of
dried foods. Journal of Food Engineering, 40, 71-79.
Bhandari B.R., Hartel R.W., 2005. Phase transitions during food powder production and
powder stability. In: Encapsulated and Powdered foods. Ed. C.Onwulata, Taylor &
Francis, New York, 261-292.
Bhandari B.R., 2008. Stickiness and caking in food preservation. In: Handbook of food
preservation. Ed. M.S. Rahman, CRC Press, Taylor & Francis, New York, 17, 387-401.
Bimbenet J.J., Dumoulin E., 1999. Séchage des solutions sucrées par atomisation: théorie,
procédés industriels, exemples d’application. In: Eau, sucre et poudres alimentaires. VIIe
Colloque Cedus, Paris, 31-39.
Bimbenet J.J., Duquenoy A., Trystram G., 2002. Génie des procédés alimentaires. Dunod,
Paris, 554 pp.
Birchal V.S., Huang L.X., Mujumdar A.S., Passos M.L., 2006. Spray dryers: modelling
and simulation. Drying Technology, 24, 359-371.
Boonyai P., Bhandari B., Howes T., 2004. Stickiness measurement techniques for food
powders: a review. Powder Technology, 145, 34-46.
Boonyai P., Howes T., Bhandari B., 2006. Applications of the cyclone stickiness test for
characterization of stickiness in food powders. Drying Technology, 24(6), 703-709.
Boonyai P., Howes T., Bhandari B., 2007. Instrumentation and testing of a thermal
mechanical compression test for glass-rubber transition analysis of food powders. Journal
of Food Engineering, 78(4), 1333-1342.
Buffo R.A., Probst K., Zehentbauer G., Luo Z., Reineccius G.A., 2002. Effects of
agglomeration on the properties of spray dried encapsulated flavours. Flavour and
Fragrance Journal, 17, 292-299.
Chen X.D., 2002. Heat-mass transport and microstructural aspects of the drying of single

188
droplets containing food solids/solute- Recent development. Drying’2002, Proceedings
13th
IDS, (A) 88-95.
Chuy L.E., Labuza T.P., 1994. Caking and stickiness of dairy-based food powders as related
to glass transition. Journal of Food Science, 59(1), 43-46.
Dodge L.G., 1987. Comparison of performance of drop-sizing instruments. Applied Optics,
26, 1328-1341.
Downtown G.E., Flores-Luna J.L., King C.J., 1982. Mechanism of stickiness in
hygroscopic, amorphous powders. Industry Engineering and Chemistry Fundamentals,
21, 447 – 451.
Ducept F., Sionneau M., Vasseur J., 2002. Superheated steam dryer: simulations and
experiments on product drying. Chemical Engineering Journal, 86, 75-83.
Fang Y., Selomulya C., Chen X.D., 2008. On measurement of food powder reconstitution
properties. Drying Technology, 26(1-3), 3-14.
Filkova I., Mujumdar A.S., 1995. Industrial spray drying systems. In: Handbook of
industrial drying. Ed. A.S. Mujumdar, Marcel Dekker, New York, 9, 263-307.
Fitzpatrick J.J., Iqbal T., Delaney C., Twomey T., Keogh M.K., 2004. Effect of powder
properties and storage conditions on the flowability of milk powders with different fat
contents. Journal of Food Engineering, 64, 435-444.
Fluent, 1998. Fluent 5 User’s guide, Vol. 1 to 4.
Frias J.M., Oliveira J.C., Schittkowski K., 2001. Modeling and parameters identification of
a maltodextrin DE12 drying process in a convection oven. Applied Mathematical
Modelling, 25, 449-462.
Frydman A., 1998. Caractérisation expérimentale et modélisation d’un procédé de séchage
par pulvérisation dans la vapeur d’eau surchauffée. Thèse ENSIA, 185p.
Gong Z., Zhang M., Mujumdar A.S., Sun J., 2008. Spray drying and agglomeration of
instant bayberry powder. Drying Technology, 26(1-3), 116-121.
Goula A.M., Adamopoulos K.G., 2008. Effect of maltodextrin addition during spray drying
of tomato pulp in dehumidified air. I. Drying kinetics and product recovery. Drying
Technology, 26 (4-6), 714-725.
Graham B.A., 1997. Recent advances in agglomeration during spray drying. Food Australia,
April, 184-185.
Guo B., Fletcher D.F., Langrish T.A.G., 2004. Simulation of the agglomeration in a spray
using Lagrangian particle tracking. Applied Mathematical Modelling, 28(3), 273-290.
Hecht J.P., King C.J., 2000. Spray drying: influence of developing drop morphology on
drying rates and retention of volatile substances. Part 1&2. Ind. Eng. Chem. Res., 39,
1756-1774.
Heinrich S., Peglow M., Ihlow M., Henneberg M., Mörl L., 2002. Analysis of the start-up
process in continuous fluidized bed spray granulation by population balance modelling.
Chemical Engineering Science, 57, 4369-4390.
Hennigs C., Kockel T.K., Langrish T.A.G., 2001. New measurements of the sticky behavior
of skim milk powder. Drying Technology, 19(3-4), 471-484.
Hogg R., 1992. Agglomeration models for process design and control. Powder Technology,
69, 69-76.
Horvat A., Kaucic V., Masters K., Golob J., 2002. Influence of atomisation system on
sodium disilicate characteristics. Drying’2002, Proceedings 13th
IDS, (A), 696-703.
Huang L., Kumar K., Mujumdar A.S., 2004. Simulation of a spray dryer fitted with a
rotary disk atomizer using a three-dimensional computational fluid dynamic model.
Drying Technology, 22(6), 1489-1515.
Huang L.X., Kumar K., Mujumdar A.S., 2006. A comparative study of a spray dryer with
rotary disc atomizer and pressure nozzle using computational fluid dynamic simulations.
Chemical Engineering and Processing, 45, 461-470.

189
Huntington D.H., 2004. The influence of the spray drying process on product properties.
Drying Technology, 22(6), 1261-1287.
Jeantet R., Ducept F., Dolivet A., Méjean S., Schuck P., 2008. Residence time distribution:
a tool to improve spray-drying control. Dairy Science & Technology, 88(1), 31-43.
Jimenez Munguia M.T., 2007. Agglomération de particules par voie humide en lit fluidisé.
Thèse ENSIA, 134p.
Karel M., Anglea S., Buera P., Karmas R., Levi G. Roos Y., 1994. Stability–related
transitions of amorphous foods. Thermochimica Acta, 246(2), 249-269.
Kemp I.C., Oakley D.E., 2002. Modeling of particulate drying in theory and practice. Drying
Technology, 20(9), 1699-1750.
Kerkhof P.J.A.M., 1994. The role of theoretical and mathematical modelling in scale-up.
Drying Technology, 12(1-2), 1-46.
Kieviet F.G., Kerkhof P.J.A.M., 1995. Measurements of particle residence time
distributions in a co-current spray dryer. Drying Technology, 13(5-7), 1241-1248.
Kieviet F.G., Kerkhof P.J.A.M., 1996. Using computational fluid dynamics to model
product quality in spray drying: air flow, temperature and humidity patterns. Drying ’96,
10th
Int. Drying Symposium, (A), 259-266.
Kieviet F.G., Van Raaij J., Kerkhof P.J.A.M., 1997. A device for measuring temperature
and humidity in a spray dryer chamber. Trans. IChemE, 75(A), 329-333.
Kim K.Y., Marshall J.R., 1971. Drop-size distributions from pneumatic atomizers. AIChE
Journal, 17(3), 575-584.
King C.J., Kieckbusch T.G., Greenwald C.G., 1984. Food-quality factors in spray drying.
In: Advances in drying. Ed. A.S. Mujumdar, Hemisphere, New York, Vol. 1, 71-120.
Knight P.C., 2001. Structuring agglomerated products for improved performance. Powder
Technology, 119, 14-25.
Kudra T., 2002. Sticky region in drying - Definition and identification. The International
Conference on Energy-Saving Technologies for Drying and Hygrothermal Processing,
Moscow.
Langrish T., Fletcher D.F., 2001. Spray drying of food ingredients and applications of CFD
in spray drying. Chemical Engineering and Processing, 40, 345-354.
Langrish T., Kockel T.K., 2001. The assessment of a characteristic drying curve for milk
powder for use in computational fluid dynamics modelling. Chemical Engineering
Journal, 84, 69-74.
Lazar M.E., Brown A.H., Smith G.S., Wong F.F., Lindquist F.E., 1956. Experimental
production of tomato powder by spray drying. Food Technology, 10, 129-134.
Lefebvre A.H., 1989. Atomization and sprays. Hemisphere, New York, 421p.
Lloyd R.J., Chen X.D., Hargreaves J.B., 1996. Glass transition and caking of spray-dried
lactose. International Journal of Food Science and Technology, 31(4), 305-311.
Lockemann C.A., 1999. A New Laboratory Method to Characterize the Sticking Property of
Free Flowing Solids. Chemical Engineering Process, 38, 301-306.
Masters K., 1985. Spray Drying. Fourth edition, Longman Scientific and Technical, J. Wiley
& Sons, New York, 696 p.
Mathlouthi M., Rogé B., 2003. Water vapour sorption isotherms and the caking of food
powders. Food Chemistry, 82, 61-71.
Melcion J.P., Ilari J.L., 2003. Technologie des pulvérulents dans les IAA. Lavoisier, Paris,
814 pp.
Mounir S., Allaf K., 2008. Three-stage spray drying: new process involving instant
controlled pressure drop. Drying Technology, 26(4-6), 452-463.
Mujumdar A.S., 1995. Handbook of industrial drying. Marcel Dekker, New York, 1423pp.
Nath S., Satpathy G.R., 1998. A systematic approach for investigation of spray drying
processes. Drying Technology, 16(6), 1173-1193.

190
Nijdam J.J., Guo B., Fletcher D.F., Langrish T.A.G., 2004. Challenges of simulating
droplet coalescence within a spray. Drying Technology, 22(6), 1463-1488.
Oakley D.E., 1994. Scale-up of spray dryers with the aid of computational fluid dynamics.
Drying Technology, 12(1-2), 217-233.
Oakley D.E., 2004. Spray dryer modeling in theory and practice. Drying Technology, 22(6),
1371-1402.
Ortega-Rivas E., 2005. Handling and Processing of food powders and particulates. In:
Encapsulated and Powdered foods. Ed. C. Onwulata, Taylor & Francis, New York, 75-
144.
Ozkan N., Walisinghe N., Chen X.D., 2002. Characterization of stickiness and cake
formation in whole and skim milk powders. Journal of Food Engineering 55, 293-303.
Ozmen L., Langrish T.A.G., 2002. Comparison of glass transition temperature and sticky
point temperature for skim milk powder. Drying Technology, 20(6), 1177-1192.
Palzer S., 2005a. Contrôle de l’agglomération de polymères de dextrose par l’application du
concept de la transition vitreuse. Inustries Alimentaires et Agricoles, 122(12), 20-27.
Palzer S., 2005b. The effect of glass transition on the desired and undesired agglomeration of
amorphous food powders. Chemical Engineering Science, 60, 3959-3968.
Petersen M., Gude K.F., 1973. Improvements in and relating to spray drying devices for the
production of powder, e.g. milk powder. Patent GB 1 329 791.
Pietsch W., 1991. Size enlargement and agglomeration. Wiley, Chichester, 532p.
Písecký J., Hansen S.P., 1990. Process and spray drying apparatus for producing stable
particle agglomerates. Patent EP 0 378 498.
Písecký J., 1997. Handbook of Milk Powder Manufacture. Niro A/S, Copenhagen, 261 p.
Räederer M., 2001. Drying of viscous, shrinking products: modelling and experimental
validation. PhD Thesis, TUM Freising (Germany), 124 pp.
Räederer M., Besson A., Sommer K., 2002. A thin film dryer approach for the
determination of water diffusion coefficients in viscous products. Chemical Engineering
Journal, 86, 185-191.
Roos Y.H., Karel M., 1991a. Applying state diagrams to food processing and development.
Food Technology, 45, 66-70.
Roos Y.H., Karel M., 1991b. Phase transition of amorphous sucrose and frozen sucrose
solution. Journal of Food Science, 56(1), 266-267.
Roos Y.H., Karel M., 1991c. Plasticizing effect of water on thermal behavior and
crystallization of amorphous food models. Journal of Food Science, 56(1), 38-43.
Roos Y.H., 1995. Glass transition-related physicochemical changes in foods. Food
Technology, 10, 97-102.
Roos Y.H., 2002. Importance of glass transition and water activity to spray drying and
stability of dairy powders. Le Lait, 82, 475-484.
Roustapour O.R., Hosseinalipour M., Ghobadian B., 2006. An experimental investigation
of lime juice drying in a pilot plant spray dryer. Drying Technology, 24, 181-188.
Ruan R., Long Z., Chen P., Huang V., Almaer S., Taub I., 1999. Pulse NMR study of
glass transition in maltodextrin. Journal of Food Science, 64(1), 6-9.
Schubert H., 1993. Instantization of powdered food products. International Chemical
Engineering, 33(1), 28-45.
Schuck P., Roignant M., Brulé G., Méjean S., Bimbenet J.J., 1998. Caractérisation
énergétique d’une tour de séchage par atomisation multiple effet. Ind. Alim. Agr., 115, 9-
14.
Schuck P., 2002. Spray drying of dairy products: state of the art. Le Lait, 82, 375-382.
Schuck P., Mejean S., Dolivet A., Jeantet R., 2005a. Thermohygrometric sensor: a tool for
optimizing the spray drying process. Innovative Food Science and Emerging
Technologies, 6(1), 45-50.

191
Schuck P., Blanchard E., Dolivet A., Méjean S., Onillon E., Jeantet R., 2005b. Water
activity and glass transition in dairy ingredients. Le Lait, 85(4-5), 295-304.
Schuck P., Dolivet A., Méjean S., Jeantet R., 2008. Relative humidity of outlet air: the key
parameter to optimize moisture content and water activity of dairy powders. Dairy
Science & Technology, 88(1), 45-52.
Schulz M.E., 1966. Verfahren zum Zerstäubungstrocknen und Instantisieren von Gut. Patent
DE 1 228 567.
Sears J.T., Ray S., 1980. Acoustic spray drying of particle suspensions. Drying A,
Hemisphere, New York, 332-338.
Senoussi A., 1994. Séchage par pulvérisation de liquides alimentaires contenant des
substances labiles. Thèse ENSIA, 139p.
Shrestha A.K., Howes T., Adhikari B.P., 2007a. Effect of protein concentration on the
surface composition, water sorption and glass transition temperature of spray-dried skim
milk powders. Food Chemistry, 104(4), 1436-1444.
Shrestha A.K., Howes T., Adhikari B.P., 2007b. Water sorption and glass transition
properties of spray dried lactose hydrolysed skim milk powder. LWT - Food Science and
Technology, 40(9), 1593-1600.
Shrestha A.K., Ua-Arak T., Adhikari B.P., 2007c. Glass transition behavior of spray dried
orange juice powder measured by differential scanning calorimetry (DSC) and thermal
mechanical compression test (TMCT). International Journal of Food Properties, 10(3),
661-673.
Shrestha A.K., Howes T., Adhikari B.P., Bhandari B.R., 2008. Spray drying of skim milk
mixed with milk permeate: effect on drying behavior, physicochemical properties, and
storage stability of powder. Drying Technology, 26(1-3), 239-247.
Sommerfeld M., 2001. Validation of a stochastic Lagrangian modelling approach for inter-
particle collision in homogeneous isotropic turbulence. Int. J. Multiph. Flow, 27, 1829-
1858.
Straatsma J., Van Houwelingen G., Steenbergen A.E., De Jong P., 1999a. Spray drying of
food products: 1. Simulation model. Journal of Food Engineering, 42, 67-72.
Straatsma J., Van Houwelingen G., Steenbergen A.E., De Jong P., 1999b. Spray drying of
food products: 2. Prediction of insolubility index. Journal of Food Engineering, 42, 73-
77.
Teunou E., Fitzpatrick J.J., Synnott E.C., 1999. Characterisation of food powder
flowability. Journal of Food Engineering, 39, 31-37.
Truong V., Bhandari B.R., Howes T., 2005a. Optimization of co-current spray drying
process of sugar-rich foods. Part I. Moisture and glass transition temperature profile
during drying. Journal of Food Engineering, 71(1), 55-65.
Truong V., Bhandari B.R., Howes T., 2005b. Optimization of co-current spray drying
process for sugar-rich foods. Part II. Optimization of spray drying process based on glass
transition concept. Journal of Food Engineering, 71(1), 66-72.
Tsourouflis S., Flink J.M., Karel M., 1976. Loss of Structure in freeze Dried Carbohydrate
Solutions. Effect of Temperature, Moisture Contents and Compositions. Journal of the
Science of Food and Agriculture, 27(6), 509-519.
Turchiuli C., Eloualia Z., El Mansouri N., Dumoulin E., 2005. Fluidised bed
agglomeration: agglomerates shape and end-use properties. Powder Technology, 157,
168-175.
Upadhyaya R.L., 1982. Some progress in atomization. Drying’82, 2nd
Int. Drying
Symposium, 171-177.
Verdurmen R.E.M., Menn P., Ritzert J., Blei S., Nhumaio G.C.S., Sorensen T.S.,
Gunsing M., Straatsma J., Verschueren M., Sibeijn M., Schulte G., Fritsching U.,
Bauckhage K., Tropea C., Sommerfeld M., Watkins A.P., Yule A., Schonfeldt H.,

192
2004. Simulation of agglomeration in spray drying installations: the EDECAD project.
Drying Technology, 22(6), 1403-1461.
Villermaux J., 1993. Génie de la réaction chimique – conception et fonctionnement des
réacteurs. Lavoisier, Paris 448 p.
Vuataz G., 2002. The phase diagram of milk: a new tool for optimizing the drying process.
Le Lait, 82, 485-500.
Walton D.E., Mumford C.J., 1999. Spray dried products-Characterization of particle
morphology. Trans IChemE, 77(A), 21-38.
Woo M.W., Daud W.R.W., Tasirin S.M., Talib M.Z.M., 2007. Optimization of the spray
drying operating parameters - a quick trial-and-error method. Drying Technology, 25(10-
12), 1741-1747.
Woo M.W., Daud W.R.W., Tasirin S.M., Talib M.Z.M., 2008. Effect of wall surface
properties at different drying kinetics on the deposition problem in spray drying. Drying
Technology, 26(1-3), 15-26.
Wu Z., Liu X., 2002. Drying solution atomized in pulsating flow. Drying Technology, 20(6),
1101-1121.
Xiao Z., Xie X., Yuan Y., Liu X., 2008. Influence of atomizing parameters on droplet
properties in a pulse combustion spray dryer. Drying Technology, 26(4-6), 427-432.
Yarin A.L., Brenn G., Kastner O., Rensink D., Tropea C., 1999. Evaporation of
acoustically levitated droplets. Journal of Fluid Mechanics, 399, 151-204.
Zapsalis C, Beck R.A., 1985. Food chemistry and nutritional biochemistry. Wiley, New
York, 1219 pp.
Zbicinski I., Strumillo C., Delag A., 2002. Drying kinetics and particle residence time in
spray drying. Drying Technology, 20(9), 1751-1768.

ANNEXES


ANNEX I – Modeling of residence time distribution function in NIRO Minor
For determination of Residence Time Distribution (RTD) of particles, spray drying tower
with powder recirculation (e.g. fines return) was represented as several groups composed by a
series of Continuously Stirred Tank Reactors (CSTR) (Jeantet et al., 2008). Ducept et al.
(2002) also applied this concept to a superheated steam dryer to validate CFD simulations,
varying operating parameters.
The residence time distribution (RTD) function E(t) can be obtained by deriving the
cumulative frequency F(t):
dt
dF(t)E(t) =
For a group i of ni reactors where τi is the mean residence time in group i., the Ei(ti) function is (Villermaux, 1993):
1)!(n
)/τtnexp(t
τ
n)(tE
i
iii
1nn
i
iii
i
i
i
−
⋅−⋅⋅
=
−
Deriving the response curve F(t) = C(t)/C0 = f(t) to injection steps in Niro Minor spray dryer,
we observed 2 important peaks then two small peaks on the E(t) curve with maxima at
approximately 2, 4, 9 and 15 min (Fig. I.1). Our system (without fines return) was then
represented by 3 groups of CSTR reactors (Fig. II.2), each group being characterized by the
number of CSTR reactors ni, the fraction of particles ai (%) passing through the group and an
average residence time τi. We assumed that all the powder passed trough the first group of
reactors (1) (main particle residence time), and then just a fraction passed trough the other two
groups of reactors (2 and 3), which expressed powder recirculations inside the chamber.
After the first two CSTR reactors (1 + 2), the RTD function is
Ea(t) = (1-a2) E1(t) + a2 E1(t)*E2(t)
Then, adding the other CSTR reactor, the total residence time distribution curve Etot(t) is:
Etot(t) = (1-a3) Ea(t) + a3 Ea(t)*E3(t)
where symbol * represents the convolution product of two functions. Actually, E(t) is the
response to a unit-pulse x(t) = δ(t). For a complex pulse x(t) ≠ δ(t), the response curve is the
sum of the contributions of all the components of x(t) expressed as the convolution product of
x(t) by E(t):
∫ −=∗2t
0112121 )dtt)E(tx(t)E(t)x(t
Parameters of the model (ni, τi, ai) were adjusted in order to get the best fit between
experimental and theoretical E(t) = f(t) curves (Fig. I.1 and I.2). The number of experimental
points was not sufficient to have a good adjustment.
In the studied conditions residence time of 70% of the powder inside the pilot spray dryer was
of about 1.2 min, but about 30% of the powder stayed inside the pilot for an average time of
about 15 min. This fraction could represent recirculation of particles and/or particles stuck on
walls which detach at one moment during the experiment leading to a delay of about 15 min
in powder recovery. But these results neither allow to determine where recirculation occurred,
nor to evaluate the influence of the cyclone.
This part of experimental study should be repeated and improved in order to verify the
proposed model.
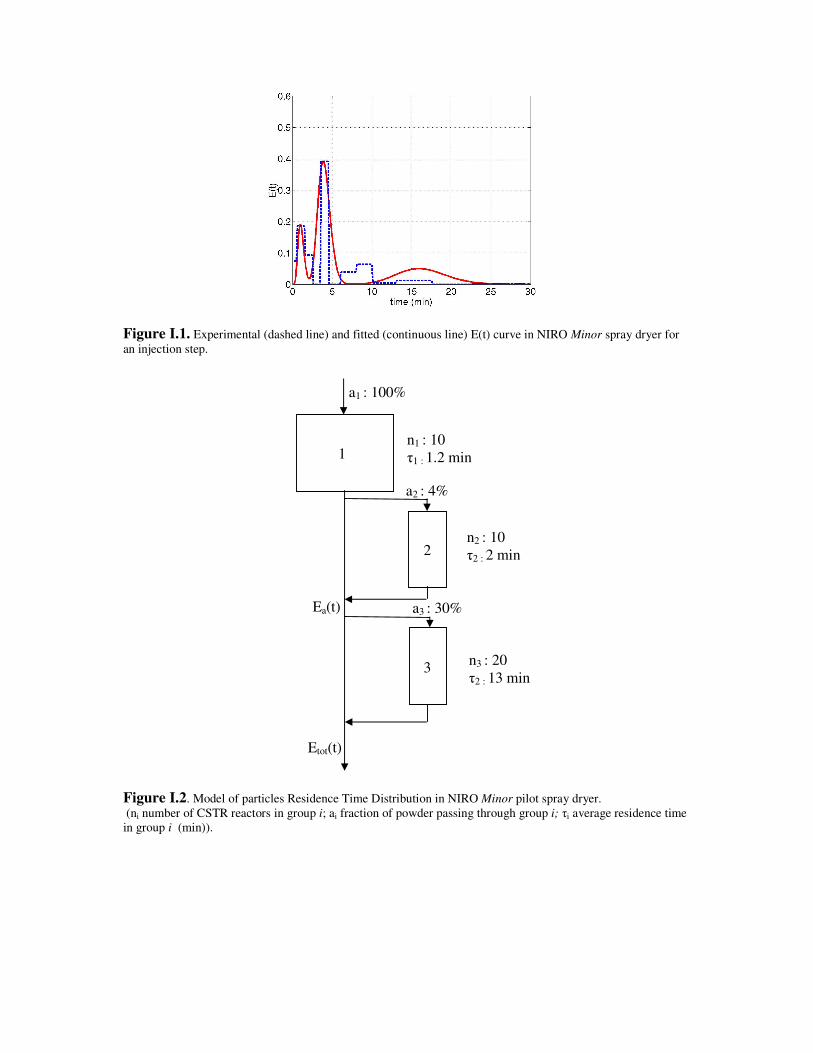
Figure I.1. Experimental (dashed line) and fitted (continuous line) E(t) curve in NIRO Minor spray dryer for
an injection step.
Figure I.2. Model of particles Residence Time Distribution in NIRO Minor pilot spray dryer.
(ni number of CSTR reactors in group i; ai fraction of powder passing through group i; τi average residence time
in group i (min)).
1
2
3
n1 : 10
τ1 : 1.2 min
n2 : 10
τ2 : 2 min
n3 : 20
τ2 : 13 min
a1 : 100%
a2 : 4%
a3 : 30% Ea(t)
Etot(t)

Annex II – Air and water properties for CFD simulation
Air (continuous phase) was a mixture of air and water vapour assumed to be an ideal gas. Gas
density, viscosity, thermal conductivity and specific heat were calculated from ideal gas
mixing. Specific heat, thermal conductivity and viscosity of dry air and water vapour were assumed to be constant during simulation (figures are from software data base):
Dry Air (0°C)
Cp,air: 1006 J.kg
-1.K
-1
Thermal conductivity : 0.0242 W.m-1
.K-1
Viscosity : 1.79 10-5
Pa.s
Water vapour
Cp,vapour: 2014 J.kg-1
.K-1
Thermal conductivity: 0.0261 W.m-1
.K-1
Viscosity: 1.34 10-5
Pa.s
Discrete phase
Properties of “volatile” fraction are that of liquid water properties and assumed to be constant
during simulation (20°C).
ρwater : 998.2 kg.m-3
CP: 4182 J.kg-1
.K-1
∆Hv: 2.5 106
J.kg-1
Dw,a (diffusivity of water vapour in air): 3 10-5
m2.s
-1 (40°C)
The saturated water vapour pressure was defined with a polynomial expression as a function
of particle temperature:
Pwsat
(T) = 0.18709 T3 – 167.29 T
2 + 50095.97 T – 5020436 (T in K)


ANNEX III - Articles, congresses, industrial visits/contacts
• Articles and International Congresses
Gianfrancesco A., Turchiuli C., Dumoulin E., 2008. Powder agglomeration during the spray drying process:
measurements of air properties, Dairy Sci. Technol. 88, 53-64.
Gianfrancesco A., Turchiuli C., Palzer S., Dumoulin E., 2008. Prediction of powder agglomeration during the
spray drying process; oral presentation in RELPOWFLOW congress, Tromso (Norway), 10-12 June.
Article accepted for publication in Particulate Science and Technology.
Gianfrancesco A., Turchiuli C., Dumoulin E., 2007. Evolution of air properties in spray drying chamber in
relation with controlled powder agglomeration; oral presentation in AFSIA (French association of drying in
food industry) Congress, Biarritz (France), 24-25 May.
Gianfrancesco A., Turchiuli C., Dumoulin E., 2007. Powder agglomeration during the spray drying process;
oral presentation in PARTEC 07, Particle Technology International Conference, Nuremberg (Germany), 27-29
March.
Gianfrancesco A., Turchiuli C., Dumoulin E., 2007. Powder agglomeration during the spray drying process:
measurements of air properties; oral presentation in “3rd
International Spray Dried Milk Conference”, San
Francisco (USA), 25-28 February.
• Oral presentations in the Biopowders network meetings
29 June 2006: Controlled powder agglomeration during the spray drying process, SIK Research Center,
Gothenburg (Sweden).
10 March 2006: Research proposal: powder agglomeration during the spray drying process, Delft University
(The Netherlands).
18 September 2008: Powder stickiness during spray drying process in relation with agglomeration, Final
Biopowders Workshop, Agroparistech Massy (France).
• Other presentation (invited) 26 May 2008: Powder stickiness during spray drying process in relation with agglomeration. 2
nd European
Workshop on Food Engineering and Technology, EFFOsT, Agroparistech Massy (France).
• Industrial visits/contacts
Company Date
SOFIVO INGREDIENTS 14-10-05
INRA-AGROCAMPUS RENNES 20-10-05
DIANA-NATURALS 14-11-05
ARMOR-PROTEINES 14-11-05
SOCIETE LAITIERE DE MAYENNE 15-11-05
TECHNI-PROCESS 08-12-05
CD-ADAPCO 10-01-06
DSM 07-03-06
NESTLE PTC Singen 11-04-06
NESTLE NRC Lausanne 17-12-07


ABSTRACT
Food instant powders like milk, soups, juices, coffee, are usually produced by spray drying followed by a further
step of agglomeration to get larger particles (from 50-100 µm to 250-500 µm) with a narrow size distribution and
modified structure (porosity) to obtain good handling and instant properties (wettability, dispersability,
solubility). Agglomeration of spray dried powders is performed either outside or inside the drying chamber in a
fluid bed, or by return of dry fines into the chamber.
Agglomeration of particles requires collisions and adhesion to create links between particles. Stickiness of
particle surface will depend on the presence of components able to develop such property. For carbohydrates,
stickiness is related to the glass transition appearing when varying water content, water activity and temperature,
three parameters representative of drying.
A methodology was developed to associate the evolution of drying air properties to drops drying along the
chamber. Measurements of air temperature and relative humidity allowed to calculate the drops water content at
any position in the dryer, and to deduce the possible sticky conditions and positions.
Spray drying of aqueous solution of a model product able to stick (maltodextrin DE12 and DE21) was
performed in a co-current pilot spray dryer equipped with a rotary atomizer. Studied process parameters included
liquid feed flow rate (1 to 3.2 kg.h-1
evaporated water), inlet air temperature (144 to 200°C), air flow rate (80-
110 kg.h-1), rotary atomizer velocity (22500 to 30000 rpm).
Maltodextrin DE12 drops were quickly dried below the glass transition temperature, and stickiness seemed
possible only next to the atomizer. Maltodextrin DE21 might present a sticky behaviour in a wider part of the
chamber due to conditions corresponding to lower glass transition temperatures, especially for high liquid flow
rate and low inlet air temperature. Computational Fluid Dynamics was used to simulate the drying of solutions,
and to predict possible sticky conditions and positions. These conditions were tested and validated by performing
agglomeration trials introducing powder at different positions inside the chamber. Finally, this experimental
approach using air properties measurements was applied to interpret the drying behaviour of a different product
(protein hydrolyzate) in a pilot spray dryer at higher scale, equipped with fines return and internal fluid bed.
Keywords: spray drying, agglomeration, stickiness, glass transition, CFD modelling
RESUME Les poudres alimentaires instantanées (lait, soupe, jus, café) sont habituellement produites par séchage par
pulvérisation, suivi d’une étape ultérieure d’agglomération pour augmenter la taille des particules (de 50-100 µm
à 250-500 µm) avec une distribution de taille étroite et une structure modifiée (porosité), pour améliorer la
manutention et les propriétés instantanées (mouillabilité, dispersibilité, solubilité). L’agglomération est réalisée
dans un lit fluidisé intérieur ou extérieur à la chambre de séchage, ou par réinsertion des fines (sèches) dans la
chambre. L’agglomération de particules passe par les contacts et l’adhésion entre particules pour créer des
liaisons entre elles. Les propriétés collantes de la surface d’une particule dépendent de la présence de
constituants capables de développer un comportement collant. Pour les polysaccharides le collage est lié à la
transition vitreuse, en relation avec la teneur en eau, l’activité de l’eau et la température, paramètres
représentatifs du séchage.
Une méthode est développée pour relier l’évolution des propriétés de l’air de séchage au séchage des particules
dans la chambre. Les mesures de la température de l’air et de son humidité relative ont permis de calculer
l’évolution de la teneur en eau des gouttes dans la chambre, et d’en déduire des conditions opératoires et
positions où les particules seraient collantes.
Des solutions aqueuses de produits modèles (collants) (maltodextrine DE12 et DE21) ont été séchées dans un
séchoir pilote en co-courant, avec turbine de pulvérisation. L’effet de différents paramètres ont été étudiés : le
débit liquide (1 à 3,2 kg.h-1
d’eau évaporée), la température d’entrée de l’air (144 à 200°C), le débit d’air (80 –
110 kg.h-1
) et la vitesse de rotation de la turbine (22500 à 30000 rpm).
Les particules de maltodextrine DE12 sont rapidement séchées en dessous de la température de transition
vitreuse, et le collage est envisagé seulement près de l’atomiseur. La maltodextrine DE21 montre un
comportement collant dans une large partie de la chambre, dû à de plus faibles températures de transition
vitreuse, en particulier pour des forts débits de liquide et des faibles températures de l’air de séchage.
La mécanique des fluides numérique (CFD) est aussi utilisée pour simuler le séchage de solutions, et pour
prédire l’existence de conditions collantes. Ces conditions ont été testées et validées par des essais
d’agglomération réalisés en introduisant de la poudre à différents endroits dans la chambre. Enfin, cette approche
expérimentale basée sur la mesure des propriétés de l’air a été appliquée pour interpréter le comportement au
séchage d’un produit différent (hydrolysat de protéines) dans un séchoir pilote à plus grande échelle, équipé d’un
retour de fines et d’un lit fluidisé interne.
Mot clés : séchage par pulvérisation, agglomération, collage, transition vitreuse, simulation CFD