Embed Size (px)
Citation preview

Composite Structures 97 (2013) 387–400
Contents lists available at SciVerse ScienceDirect
Composite Structures
journal homepage: www.elsevier .com/locate /compstruct
Numerical simulation of Lamb wave propagation in metallic foam sandwichstructures: a parametric study
Seyed Mohammad Hossein Hosseini a,⇑, Abdolreza Kharaghani b, Christoph Kirsch c, Ulrich Gabbert a
a Institute of Mechanics, Department of Numerical Mechanics, Otto-von-Guericke-University Magdeburg, Universitätsplatz 2, 39016 Magdeburg, Germanyb Institute of Process Engineering, Department of Thermal Process Engineering, Otto-von-Guericke-University Magdeburg, Universitätsplatz 2, 39016 Magdeburg, Germanyc Institute of Computational Physics, Zurich University of Applied Sciences, Wildbachstrasse 21, 8401 Winterthur, Switzerland
a r t i c l e i n f o a b s t r a c t
Article history:Available online 9 November 2012
Keywords:Lamb wave propagationMetallic foam structureFinite element methodParametric study
0263-8223/$ - see front matter � 2012 Elsevier Ltd. Ahttp://dx.doi.org/10.1016/j.compstruct.2012.10.039
⇑ Corresponding author.E-mail addresses: [email protected] (S.M.H. Hoss
ovgu.de (A. Kharaghani), [email protected]@ovgu.de (U. Gabbert).
The propagation of guided Lamb waves in metallic foam sandwich panels is described in this paper andanalyzed numerically with a three-dimensional finite element simulation. The influence of geometricalproperties of the foam sandwich plates (such as the irregularity of the foam structure, the relative densityor the cover plate thickness) on the wave propagation is investigated in a parametric study. Open-cell andclosed-cell structures are found to exhibit similar wave propagation behavior. In addition to the finite ele-ment model with fully resolved microstructure, a simplified, computationally cheaper model is also con-sidered – there the porous core of the sandwich panel is approximated by a homogenized effectivemedium. The limitations of this homogenization approach are briefly pointed out.
� 2012 Elsevier Ltd. All rights reserved.
1. Introduction
The use of Lamb waves in structural health monitoring (SHM) ofcomposite structures is a novel technology in modern industriessuch as aviation and transportation. Piezoelectric actuators andsensors are used to trigger and receive Lamb waves in modern mi-cro-structured composite materials [1,2]. Compared to otherrecent SHM approaches used to detect damage in composite struc-tures, the benefits of the SHM technique based on Lamb waves arethe low cost of the required equipment, the possibility of onlinemonitoring, as well as its high sensitivity [1].
Among the novel light-weight structures, metallic foam sand-wich plates can also be subject to SHM using Lamb waves. Metallicfoams are cellular materials which have been studied since the1970s [3,4]. An excellent stiffness-to-weight ratio has been re-ported for steel foams under flexural load [5]. It has been shownthat foam panels have a higher bending stiffness than solid steelsheets of the same weight [6]. The benefits of metallic foams com-pared to conventional materials are in the weight, stiffness, energydissipation, mechanical damping, and vibration frequency, andthese materials are used in the mechanical, aerospace, and auto-motive industry [7–11]. Based on their pore structure, solid foamsare classified into closed-cell and open-cell foams – see Fig. 1 for anillustration.
ll rights reserved.
eini), abdolreza.kharaghani@(C. Kirsch), ulrich.Gabbert
The application of ultrasonic wave propagation in SHM of foamsandwich plates has been addressed in several recent publications.An experimental study of ultrasonic wave propagation in water-saturated cellular aluminum foams using the pulse transmissionmethod was presented in [13]. The fast and slow longitudinalwaves were identified and it has been shown that the measuredpropagation velocities agree with the predictions of Biot’s theory.Ultrasonic guided waves were used to detect sub-interface damagein foam core sandwich structures [14].
In another study, nonlinear elastic wave spectroscopy was usedto detect damage in an aircraft foam sandwich panel [15]. Due tothe nonlinear material behavior caused by the presence of damage,harmonics and sidebands are generated from the interaction be-tween a low-frequency and a high-frequency harmonic excitationsignal. By monitoring these harmonics and sidebands, one can de-tect structural changes in the material. The capability of the pro-posed method to detect impact damage was demonstrated.
SHM based on Lamb wave propagation is a relatively new meth-od for foam sandwich structures and has been studied only in asmall number of research publications: damage detection wasachieved using anti-symmetric low-frequency Lamb waves gener-ated by thin piezoelectric discs bonded on the skins of a foam sand-wich plate with glass fiber skins [16]. In addition to theexperimental test, finite element modeling was used to optimizethe identification procedure. Furthermore, an experimental testusing a non-contact laser doppler vibrometer (LDV) was performedto scan the panel while exciting it with a surface-bonded piezo-electric actuator [17]. The capability of Lamb waves to detect dam-age was confirmed by the reflected wave fringe pattern obtained
5 mm5 mm
(a) (b)Fig. 1. Digital photos of cellular aluminum foam structures with: (a) closed-cellsand (b) open-cells [12].
388 S.M.H. Hosseini et al. / Composite Structures 97 (2013) 387–400
from the LDV scan. The experimental study was supported by the-oretical evaluation.
In the present paper, the propagation of Lamb waves in foamsandwich panels is investigated in a parametric simulation study– a fundamental understanding of this phenomenon is essentialfor the design of efficient SHM systems [18]. The dependence ofthe wave propagation behavior on different geometrical propertiesof the foam sandwich panels, such as the cover plate thickness,irregularity of the foam cell distribution, and relative density isinvestigated. The influence of the sandwich plate thickness andof the loading frequency on the wave propagation behavior is alsoshown. In addition to a fully resolved finite element model of theporous microstructure a computationally cheaper, homogenizedmodel (involving effective mechanical properties) of the porouslayer is also employed, and the quality of this approximation isassessed.
2. Finite element modeling
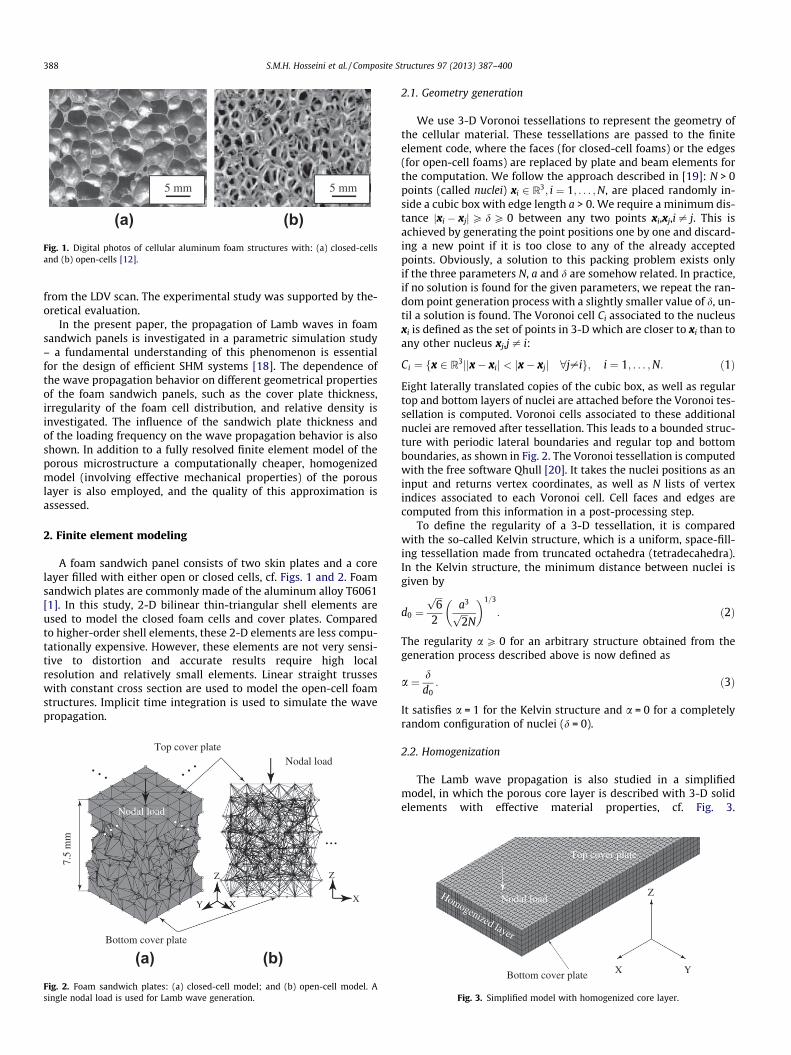
A foam sandwich panel consists of two skin plates and a corelayer filled with either open or closed cells, cf. Figs. 1 and 2. Foamsandwich plates are commonly made of the aluminum alloy T6061[1]. In this study, 2-D bilinear thin-triangular shell elements areused to model the closed foam cells and cover plates. Comparedto higher-order shell elements, these 2-D elements are less compu-tationally expensive. However, these elements are not very sensi-tive to distortion and accurate results require high localresolution and relatively small elements. Linear straight trusseswith constant cross section are used to model the open-cell foamstructures. Implicit time integration is used to simulate the wavepropagation.
X
Z
Y X
Z
Top cover plate
Bottom cover plate
Nodal load
Nodal load
7.5
mm
(a) (b)Fig. 2. Foam sandwich plates: (a) closed-cell model; and (b) open-cell model. Asingle nodal load is used for Lamb wave generation.
2.1. Geometry generation
We use 3-D Voronoi tessellations to represent the geometry ofthe cellular material. These tessellations are passed to the finiteelement code, where the faces (for closed-cell foams) or the edges(for open-cell foams) are replaced by plate and beam elements forthe computation. We follow the approach described in [19]: N > 0points (called nuclei) xi 2 R3; i ¼ 1; . . . ;N, are placed randomly in-side a cubic box with edge length a > 0. We require a minimum dis-tance jxi � xjjP d P 0 between any two points xi,xj,i – j. This isachieved by generating the point positions one by one and discard-ing a new point if it is too close to any of the already acceptedpoints. Obviously, a solution to this packing problem exists onlyif the three parameters N, a and d are somehow related. In practice,if no solution is found for the given parameters, we repeat the ran-dom point generation process with a slightly smaller value of d, un-til a solution is found. The Voronoi cell Ci associated to the nucleusxi is defined as the set of points in 3-D which are closer to xi than toany other nucleus xj,j – i:
Ci ¼ fx 2 R3jjx� xij < jx� xjj 8j–ig; i ¼ 1; . . . ;N: ð1Þ
Eight laterally translated copies of the cubic box, as well as regulartop and bottom layers of nuclei are attached before the Voronoi tes-sellation is computed. Voronoi cells associated to these additionalnuclei are removed after tessellation. This leads to a bounded struc-ture with periodic lateral boundaries and regular top and bottomboundaries, as shown in Fig. 2. The Voronoi tessellation is computedwith the free software Qhull [20]. It takes the nuclei positions as aninput and returns vertex coordinates, as well as N lists of vertexindices associated to each Voronoi cell. Cell faces and edges arecomputed from this information in a post-processing step.
To define the regularity of a 3-D tessellation, it is comparedwith the so-called Kelvin structure, which is a uniform, space-fill-ing tessellation made from truncated octahedra (tetradecahedra).In the Kelvin structure, the minimum distance between nuclei isgiven by
d0 ¼ffiffiffi6p
2a3ffiffiffi2p
N
� �1=3
: ð2Þ
The regularity a P 0 for an arbitrary structure obtained from thegeneration process described above is now defined as
a ¼ dd0: ð3Þ
It satisfies a = 1 for the Kelvin structure and a = 0 for a completelyrandom configuration of nuclei (d = 0).
2.2. Homogenization
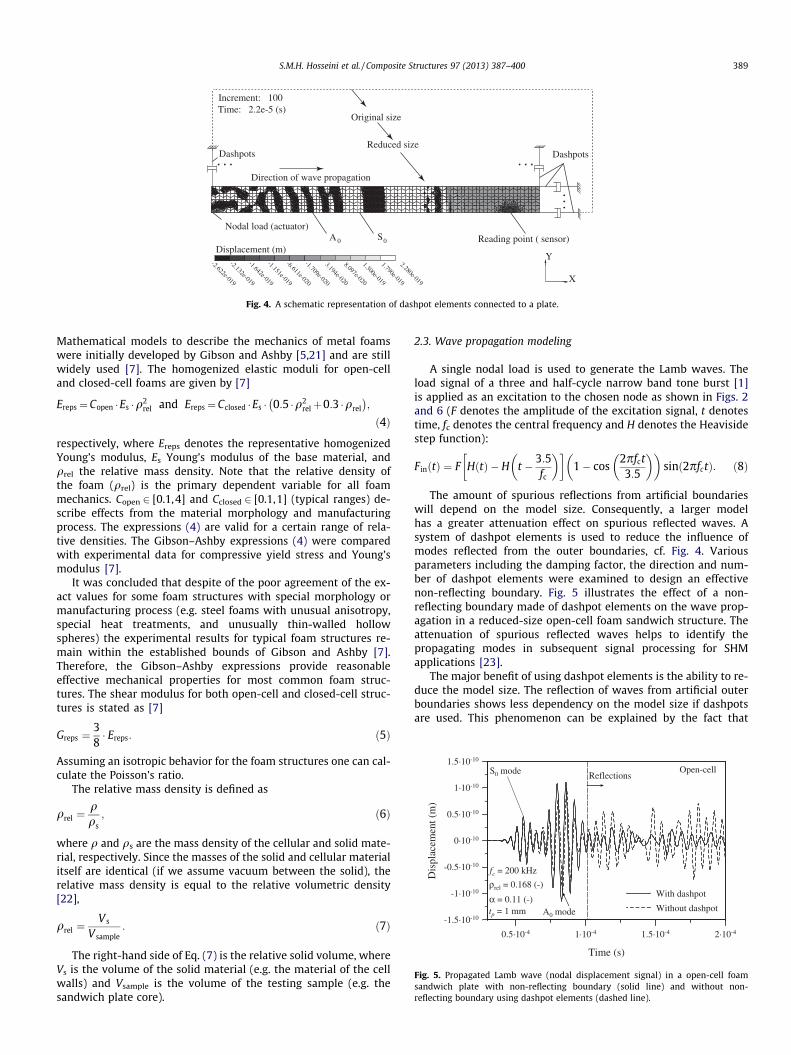
The Lamb wave propagation is also studied in a simplifiedmodel, in which the porous core layer is described with 3-D solidelements with effective material properties, cf. Fig. 3.
X Y
Z
Top cover plate
Homogenized layer
Bottom cover plate
Nodal load
Fig. 3. Simplified model with homogenized core layer.
-2.622e-019
-2.132e-019
-1.642e-019
-1.151e-019
-6.611e-020
-1.709e-020
3.194e-020
8.097e-020
1.300e-019
1.790e-019
2.280e-019
Increment: 100
X
Y
A 0 S Reading point ( sensor)Nodal load (actuator)
Direction of wave propagation
Reduced size
Original size
0
Dashpots Dashpots
Time: 2.2e-5 (s)
Displacement (m)
Fig. 4. A schematic representation of dashpot elements connected to a plate.
-1.5·10-10
-1·10-10
-0.5·10-10
0·10-10
0.5·10-10
1·10-10
1.5·10-10
Dis
plac
emen
t (m
)
0.5·10-4 1·10-4 1.5·10-4 2·10-4
Time (s)
S0 mode
A0 mode
Reflections
With dashpot
Without dashpot
ρrel = 0.168 (-)
α = 0.11 (-)
Open-cell
tp = 1 mm
fc = 200 kHz
Fig. 5. Propagated Lamb wave (nodal displacement signal) in a open-cell foamsandwich plate with non-reflecting boundary (solid line) and without non-reflecting boundary using dashpot elements (dashed line).
S.M.H. Hosseini et al. / Composite Structures 97 (2013) 387–400 389
Mathematical models to describe the mechanics of metal foamswere initially developed by Gibson and Ashby [5,21] and are stillwidely used [7]. The homogenized elastic moduli for open-celland closed-cell foams are given by [7]
Ereps¼Copen �Es �q2rel and Ereps¼Cclosed �Es � 0:5 �q2
relþ0:3 �qrel
� �;
ð4Þ
respectively, where Ereps denotes the representative homogenizedYoung’s modulus, Es Young’s modulus of the base material, andqrel the relative mass density. Note that the relative density ofthe foam (qrel) is the primary dependent variable for all foammechanics. Copen 2 [0.1,4] and Cclosed 2 [0.1,1] (typical ranges) de-scribe effects from the material morphology and manufacturingprocess. The expressions (4) are valid for a certain range of rela-tive densities. The Gibson–Ashby expressions (4) were comparedwith experimental data for compressive yield stress and Young’smodulus [7].
It was concluded that despite of the poor agreement of the ex-act values for some foam structures with special morphology ormanufacturing process (e.g. steel foams with unusual anisotropy,special heat treatments, and unusually thin-walled hollowspheres) the experimental results for typical foam structures re-main within the established bounds of Gibson and Ashby [7].Therefore, the Gibson–Ashby expressions provide reasonableeffective mechanical properties for most common foam struc-tures. The shear modulus for both open-cell and closed-cell struc-tures is stated as [7]
Greps ¼38� Ereps: ð5Þ
Assuming an isotropic behavior for the foam structures one can cal-culate the Poisson’s ratio.
The relative mass density is defined as
qrel ¼qqs; ð6Þ
where q and qs are the mass density of the cellular and solid mate-rial, respectively. Since the masses of the solid and cellular materialitself are identical (if we assume vacuum between the solid), therelative mass density is equal to the relative volumetric density[22],
qrel ¼V s
V sample: ð7Þ
The right-hand side of Eq. (7) is the relative solid volume, whereVs is the volume of the solid material (e.g. the material of the cellwalls) and Vsample is the volume of the testing sample (e.g. thesandwich plate core).
2.3. Wave propagation modeling
A single nodal load is used to generate the Lamb waves. Theload signal of a three and half-cycle narrow band tone burst [1]is applied as an excitation to the chosen node as shown in Figs. 2and 6 (F denotes the amplitude of the excitation signal, t denotestime, fc denotes the central frequency and H denotes the Heavisidestep function):
F inðtÞ ¼ F HðtÞ � H t � 3:5fc
� �� �1� cos
2pfct3:5
� �� �sinð2pfctÞ: ð8Þ
The amount of spurious reflections from artificial boundarieswill depend on the model size. Consequently, a larger modelhas a greater attenuation effect on spurious reflected waves. Asystem of dashpot elements is used to reduce the influence ofmodes reflected from the outer boundaries, cf. Fig. 4. Variousparameters including the damping factor, the direction and num-ber of dashpot elements were examined to design an effectivenon-reflecting boundary. Fig. 5 illustrates the effect of a non-reflecting boundary made of dashpot elements on the wave prop-agation in a reduced-size open-cell foam sandwich structure. Theattenuation of spurious reflected waves helps to identify thepropagating modes in subsequent signal processing for SHMapplications [23].
The major benefit of using dashpot elements is the ability to re-duce the model size. The reflection of waves from artificial outerboundaries shows less dependency on the model size if dashpotsare used. This phenomenon can be explained by the fact that
0
20
40
60
80
100
120
Ave
rgae
val
ue o
f (F
res(
t)/F
iner
tia(t
)) (
%)
0 250 500 750 1000 1250 1500 1750 2000
Total number of time steps (-)
The chosen value
fc = 200 kHz
tp = 1 mmα = 0.11 (-)
Closed-cell
ρrel = 0.175 (-)Total time: 0.22 ms
Fig. 7. Results of time step refinement analysis.
Z
X Y
Nodal load(actuator)
Increment: 50Time: 1.1e-005 (s)Displacement (m)Reading point
(sensor)
Bottom surface
Top Surface
(b) (c)
(a)
-6·10-9
-5·10-9
-4·10-9
-3·10-9
-2·10-9
-1·10-9
0·10-9
1·10-9
2·10-9
3·10-9
Dis
plac
emen
t(m
)
0.00 0.02 0.04 0.06 0.08 0.10 0.12 0.14 0.16
Arc length (m)
-6.0e-09
-5.1e-09
-4.2e-09
-3.3e-09
-2.4e-09
-1.5e-09
-6.0e-10
3.0e-10
1.2e-09
2.1e-09
3.0e-09
Fig. 6. (a) Wave propagation in an open-cell structure with 0.11 ms delay after the signal is excited – actuating and measuring points are also indicated; (b) magnification ofthe nodal load at the actuating point and (c) the displacements of the nodes located along the dashed line on the top surface (qrel = 0.168, tp = 1 mm, a = 0.108, fc = 200 kHz).
390 S.M.H. Hosseini et al. / Composite Structures 97 (2013) 387–400
by decreasing the model size in Y direction, Fig. 4, the number ofdashpot elements in the direction of wave propagation, X, doesnot effectively change. Therefore, the attenuation of reflectedwaves would not change effectively.
The simulation results presented here were obtained by usingthe commercial finite element package ANSYS� 11.0.
2.4. Model validation
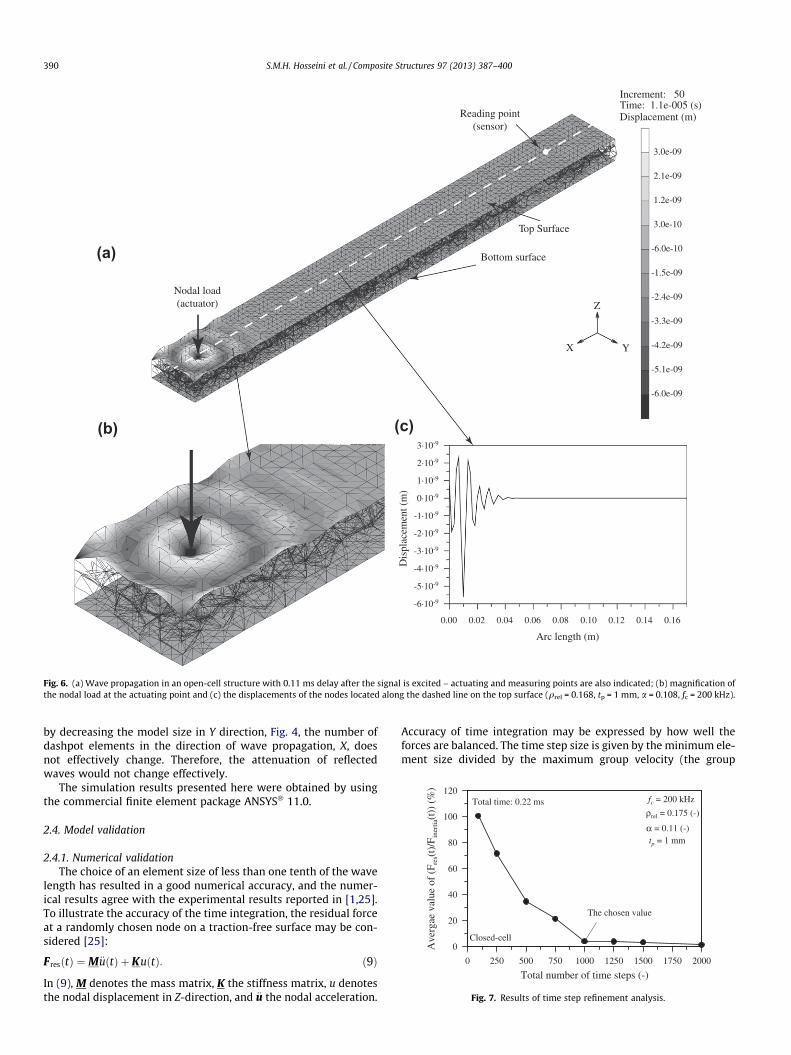
2.4.1. Numerical validationThe choice of an element size of less than one tenth of the wave
length has resulted in a good numerical accuracy, and the numer-ical results agree with the experimental results reported in [1,25].To illustrate the accuracy of the time integration, the residual forceat a randomly chosen node on a traction-free surface may be con-sidered [25]:
FresðtÞ ¼M€uðtÞ þ KuðtÞ: ð9Þ
In (9), M denotes the mass matrix, K the stiffness matrix, u denotesthe nodal displacement in Z-direction, and €u the nodal acceleration.
Accuracy of time integration may be expressed by how well theforces are balanced. The time step size is given by the minimum ele-ment size divided by the maximum group velocity (the group
X
Y
(a) (b)
Top cover plateTruss elements Solid elements
Bottom cover plate
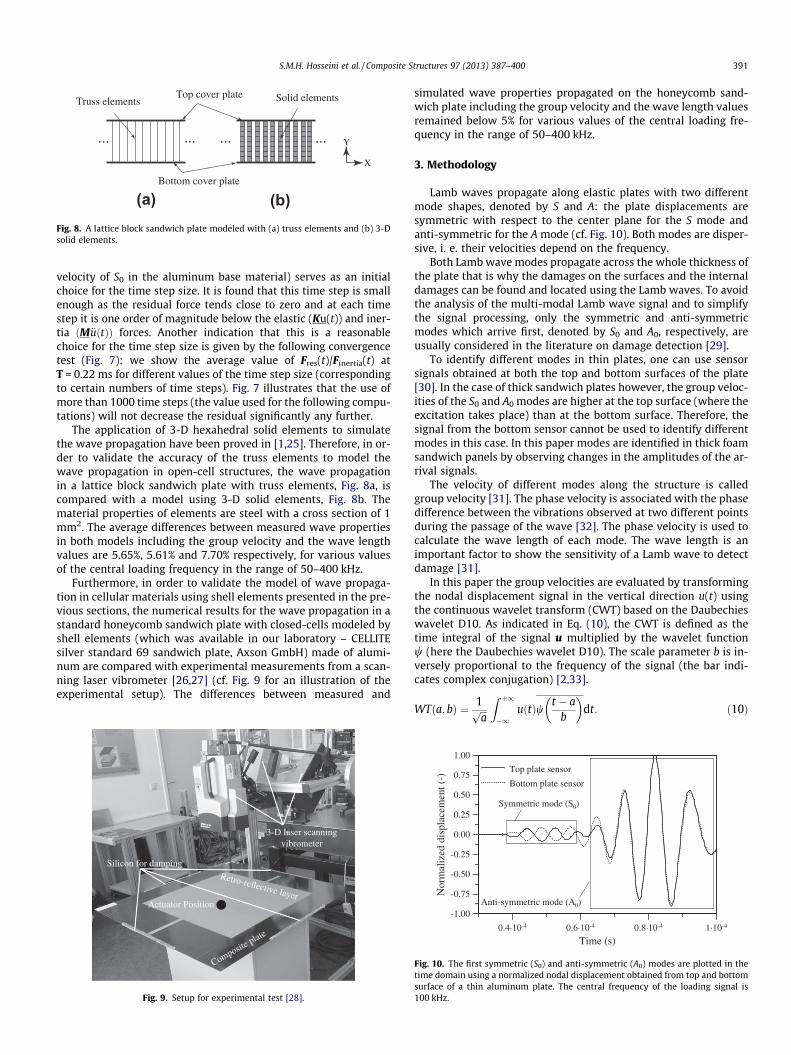
Fig. 8. A lattice block sandwich plate modeled with (a) truss elements and (b) 3-Dsolid elements.
S.M.H. Hosseini et al. / Composite Structures 97 (2013) 387–400 391
velocity of S0 in the aluminum base material) serves as an initialchoice for the time step size. It is found that this time step is smallenough as the residual force tends close to zero and at each timestep it is one order of magnitude below the elastic (Ku(t)) and iner-tia ðM€uðtÞÞ forces. Another indication that this is a reasonablechoice for the time step size is given by the following convergencetest (Fig. 7): we show the average value of Fres(t)/Finertia(t) atT = 0.22 ms for different values of the time step size (correspondingto certain numbers of time steps). Fig. 7 illustrates that the use ofmore than 1000 time steps (the value used for the following compu-tations) will not decrease the residual significantly any further.
The application of 3-D hexahedral solid elements to simulatethe wave propagation have been proved in [1,25]. Therefore, in or-der to validate the accuracy of the truss elements to model thewave propagation in open-cell structures, the wave propagationin a lattice block sandwich plate with truss elements, Fig. 8a, iscompared with a model using 3-D solid elements, Fig. 8b. Thematerial properties of elements are steel with a cross section of 1mm2. The average differences between measured wave propertiesin both models including the group velocity and the wave lengthvalues are 5.65%, 5.61% and 7.70% respectively, for various valuesof the central loading frequency in the range of 50–400 kHz.
Furthermore, in order to validate the model of wave propaga-tion in cellular materials using shell elements presented in the pre-vious sections, the numerical results for the wave propagation in astandard honeycomb sandwich plate with closed-cells modeled byshell elements (which was available in our laboratory – CELLITEsilver standard 69 sandwich plate, Axson GmbH) made of alumi-num are compared with experimental measurements from a scan-ning laser vibrometer [26,27] (cf. Fig. 9 for an illustration of theexperimental setup). The differences between measured and
noitisoProtautcA
3-D laser scanningvibrometer
Retro-reflective layer
Composite plate
gnipmadrofnociliS
Fig. 9. Setup for experimental test [28].
simulated wave properties propagated on the honeycomb sand-wich plate including the group velocity and the wave length valuesremained below 5% for various values of the central loading fre-quency in the range of 50–400 kHz.
3. Methodology
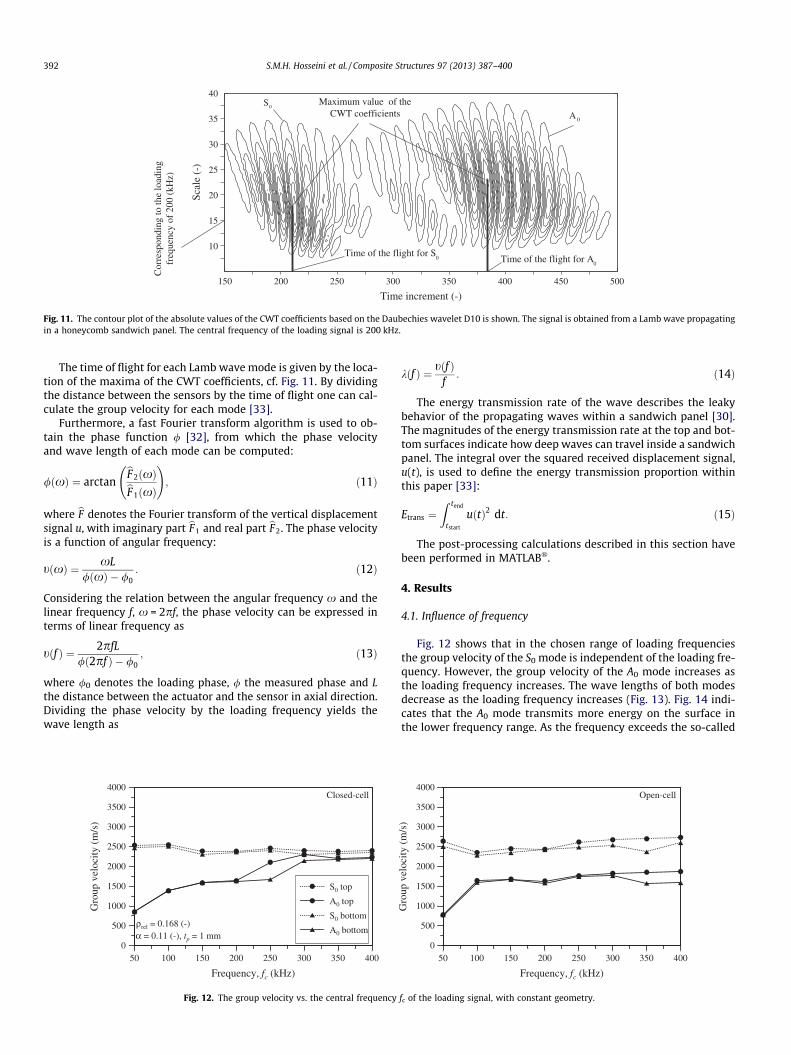
Lamb waves propagate along elastic plates with two differentmode shapes, denoted by S and A: the plate displacements aresymmetric with respect to the center plane for the S mode andanti-symmetric for the A mode (cf. Fig. 10). Both modes are disper-sive, i. e. their velocities depend on the frequency.
Both Lamb wave modes propagate across the whole thickness ofthe plate that is why the damages on the surfaces and the internaldamages can be found and located using the Lamb waves. To avoidthe analysis of the multi-modal Lamb wave signal and to simplifythe signal processing, only the symmetric and anti-symmetricmodes which arrive first, denoted by S0 and A0, respectively, areusually considered in the literature on damage detection [29].
To identify different modes in thin plates, one can use sensorsignals obtained at both the top and bottom surfaces of the plate[30]. In the case of thick sandwich plates however, the group veloc-ities of the S0 and A0 modes are higher at the top surface (where theexcitation takes place) than at the bottom surface. Therefore, thesignal from the bottom sensor cannot be used to identify differentmodes in this case. In this paper modes are identified in thick foamsandwich panels by observing changes in the amplitudes of the ar-rival signals.
The velocity of different modes along the structure is calledgroup velocity [31]. The phase velocity is associated with the phasedifference between the vibrations observed at two different pointsduring the passage of the wave [32]. The phase velocity is used tocalculate the wave length of each mode. The wave length is animportant factor to show the sensitivity of a Lamb wave to detectdamage [31].
In this paper the group velocities are evaluated by transformingthe nodal displacement signal in the vertical direction u(t) usingthe continuous wavelet transform (CWT) based on the Daubechieswavelet D10. As indicated in Eq. (10), the CWT is defined as thetime integral of the signal u multiplied by the wavelet functionw (here the Daubechies wavelet D10). The scale parameter b is in-versely proportional to the frequency of the signal (the bar indi-cates complex conjugation) [2,33].
WTða; bÞ ¼ 1ffiffiffiap
Z þ1
�1uðtÞw t � a
b
� �dt: ð10Þ
-1.00
-0.75
-0.50
-0.25
0.00
0.25
0.50
0.75
1.00
Nor
mal
ized
dis
plac
emen
t (-)
0.4·10-4 0.6·10-4 0.8·10-4 1·10-4
Time (s)
Top plate sensor
Bottom plate sensor
Symmetric mode (S0)
Anti-symmetric mode (A0)
Fig. 10. The first symmetric (S0) and anti-symmetric (A0) modes are plotted in thetime domain using a normalized nodal displacement obtained from top and bottomsurface of a thin aluminum plate. The central frequency of the loading signal is100 kHz.
Time increment (-)
Scal
e (-
)
150 200 250 300 350 400 450 500
10
15
20
25
30
35
40S0
A0
Time of the flight for A0Time of the flight for S
0
Cor
resp
ondi
ng to
the
load
ing
fr
eque
ncy
of 2
00 (
kHz)
Maximum value of the CWT coefficients
Fig. 11. The contour plot of the absolute values of the CWT coefficients based on the Daubechies wavelet D10 is shown. The signal is obtained from a Lamb wave propagatingin a honeycomb sandwich panel. The central frequency of the loading signal is 200 kHz.
392 S.M.H. Hosseini et al. / Composite Structures 97 (2013) 387–400
The time of flight for each Lamb wave mode is given by the loca-tion of the maxima of the CWT coefficients, cf. Fig. 11. By dividingthe distance between the sensors by the time of flight one can cal-culate the group velocity for each mode [33].
Furthermore, a fast Fourier transform algorithm is used to ob-tain the phase function / [32], from which the phase velocityand wave length of each mode can be computed:
/ðxÞ ¼ arctanbF 2ðxÞbF 1ðxÞ
!; ð11Þ
where bF denotes the Fourier transform of the vertical displacementsignal u, with imaginary part bF 1 and real part bF 2. The phase velocityis a function of angular frequency:
tðxÞ ¼ xL/ðxÞ � /0
: ð12Þ
Considering the relation between the angular frequency x and thelinear frequency f, x = 2pf, the phase velocity can be expressed interms of linear frequency as
tðf Þ ¼ 2pfL/ð2pf Þ � /0
; ð13Þ
where /0 denotes the loading phase, / the measured phase and Lthe distance between the actuator and the sensor in axial direction.Dividing the phase velocity by the loading frequency yields thewave length as
0
500
1000
1500
2000
2500
3000
3500
4000
Gro
up v
eloc
ity (
m/s
)
50 100 150 200 250 300 350 400
Frequency, fc (kHz)
S0 top
A0 top
S0 bottom
A0 bottomρrel = 0.168 (-)α = 0.11 (-), tp = 1 mm
Closed-cell
Fig. 12. The group velocity vs. the central frequency
kðf Þ ¼ tðf Þf: ð14Þ
The energy transmission rate of the wave describes the leakybehavior of the propagating waves within a sandwich panel [30].The magnitudes of the energy transmission rate at the top and bot-tom surfaces indicate how deep waves can travel inside a sandwichpanel. The integral over the squared received displacement signal,u(t), is used to define the energy transmission proportion withinthis paper [33]:
Etrans ¼Z tend
tstart
uðtÞ2 dt: ð15Þ
The post-processing calculations described in this section havebeen performed in MATLAB�.
4. Results
4.1. Influence of frequency
Fig. 12 shows that in the chosen range of loading frequenciesthe group velocity of the S0 mode is independent of the loading fre-quency. However, the group velocity of the A0 mode increases asthe loading frequency increases. The wave lengths of both modesdecrease as the loading frequency increases (Fig. 13). Fig. 14 indi-cates that the A0 mode transmits more energy on the surface inthe lower frequency range. As the frequency exceeds the so-called
0
500
1000
1500
2000
2500
3000
3500
4000
Gro
up v
eloc
ity (
m/s
)
50 100 150 200 250 300 350 400
Frequency, fc (kHz)
Open-cell
fc of the loading signal, with constant geometry.

0
0.01
0.02
0.03
0.04
0.05
0.06
0.07
Wav
e le
ngth
(m
)
50 100 150 200 250 300 350 400
Frequency, fc (kHz)
S0 top
A0 top
S0 bottom
A0 bottom
ρrel = 0.168 (-)
α = 0.11 (-), tp = 1 mm
Closed-cell
0
0.01
0.02
0.03
0.04
0.05
0.06
0.07
Wav
e le
ngth
(m
)
50 100 150 200 250 300 350 400
Frequency, fc (kHz)
Open-cell
Fig. 13. The wave length vs. the central frequency fc of the loading signal, with constant geometry.
0
500
1000
1500
2000
2500
3000
Gro
up v
eloc
ity (
m/s
)
0.14 0.16 0.18 0.20 0.22 0.24
Relative density, ρrel (-)
S0 top
A0 top
S0 bottom
A0 bottom
Closed-cell
0
500
1000
1500
2000
2500
3000
Gro
up v
eloc
ity (
m/s
)
0.12 0.14 0.16 0.18 0.20 0.22
Relative density, ρrel (-)
Open-cell
fc = 200 kHz
tp = 1 mmα = 0.11 (-)
Fig. 15. The group velocity vs. the relative density qrel, where tp, a and fc are constant.
10-40
10-37
10-34
10-31
10-28
10-25
Ene
rgy
tran
smis
sion
pro
port
ion
(J.m
/N)
50 100 150 200 250 300 350 400
Frequency, fc (kHz)
S0 top
A0 top
S0 bottom
A0 bottom
ρrel = 0.168 (-)
α = 0.11 (-)
Closed-cell
tp = 1 mm10-40
10-37
10-34
10-31
10-28
10-25
Ene
rgy
tran
smis
sion
pro
port
ion
(J.m
/N)
50 100 150 200 250 300 350 400
Frequency, fc (kHz)
Open-cell
Fig. 14. The energy transmission vs. the central frequency fc of the loading signal, with constant geometry. A logarithmic scale has been used here.
S.M.H. Hosseini et al. / Composite Structures 97 (2013) 387–400 393
critical frequency (which is �300 kHz in this case) the S0 modetransmits the same amount of energy as the A0 mode.
4.2. Influence of geometrical properties
4.2.1. Relative densityFigs. 15 and 16 indicate that the relative density does not play a
significant role for the group velocity and wave length values.However, Fig. 17 shows that the energy transmission values de-crease as the relative density increases. This indicates that more
damping occurs as the thickness of the solid structure increases.A similar behavior is observed for open-cell and closed-cellstructures.
4.2.2. IrregularityFigs. 18–20 show that the irregularity factor does not influence
the wave propagation properties in open-cell and closed-cell foamsandwich panels. These results also imply that the wave propaga-tion in the panels is independent of the grain size d0 in the rangeconsidered here (since the irregularity factor is proportional to
S0 top
A0 top
S0 bottom
A0 bottom
Closed-cell
0
0.002
0.004
0.006
0.008
0.01
0.012
0.014
0.016
0.018
Wav
e le
ngth
(m
)
0.12 0.14 0.16 0.18 0.20 0.22
Relative density, ρrel (-)
Open-cell
0
0.002
0.004
0.006
0.008
0.01
0.012
0.014
0.016
0.018W
ave
leng
th (
m)
0.14 0.16 0.18 0.20 0.22 0.24
Relative density, ρrel (-)
fc = 200 kHz
tp = 1 mmα = 0.11 (-)
Fig. 16. The wave length vs. the relative density qrel, where tp, a and fc are constant.
10-40
10-37
10-34
10-31
10-28
10-25
Ene
rgy
tran
smis
sion
pro
port
ion
(J.m
/N)
0.12 0.14 0.16 0.18 0.20 0.22
Relative density, ρrel (-)
Open-cell
10-40
10-37
10-34
10-31
10-28
10-25
Ene
rgy
tran
smis
sion
pro
port
ion
(J.m
/N)
0.14 0.16 0.18 0.20 0.22 0.24
Relative density, ρrel (-)
fc = 200 kHz
S0 top
A0 top
S0 bottom
A0 bottomtp = 1 mmα = 0.11 (-)
Closed-cell
Fig. 17. The energy transmission vs. the relative density qrel, where tp, a and fc are constant. A logarithmic scale has been used here.
0
500
1000
1500
2000
2500
3000
Gro
up v
eloc
ity (
m/s
)
0.2 0.4 0.6 0.8
Irregularity factor, α (-)
S0 top
A0 top
S0 bottom
A0 bottom
Closed-cell
0
500
1000
1500
2000
2500
3000
Gro
up v
eloc
ity (
m/s
)
0.2 0.4 0.6 0.8
Irregularity factor, α (-)
Open-cell
fc = 200 kHz
ρrel = 0.17 (-)
tp = 1.00 mm
Fig. 18. The group velocity is plotted over the irregularity factor a, where tp, qrel and fc are constant.
394 S.M.H. Hosseini et al. / Composite Structures 97 (2013) 387–400
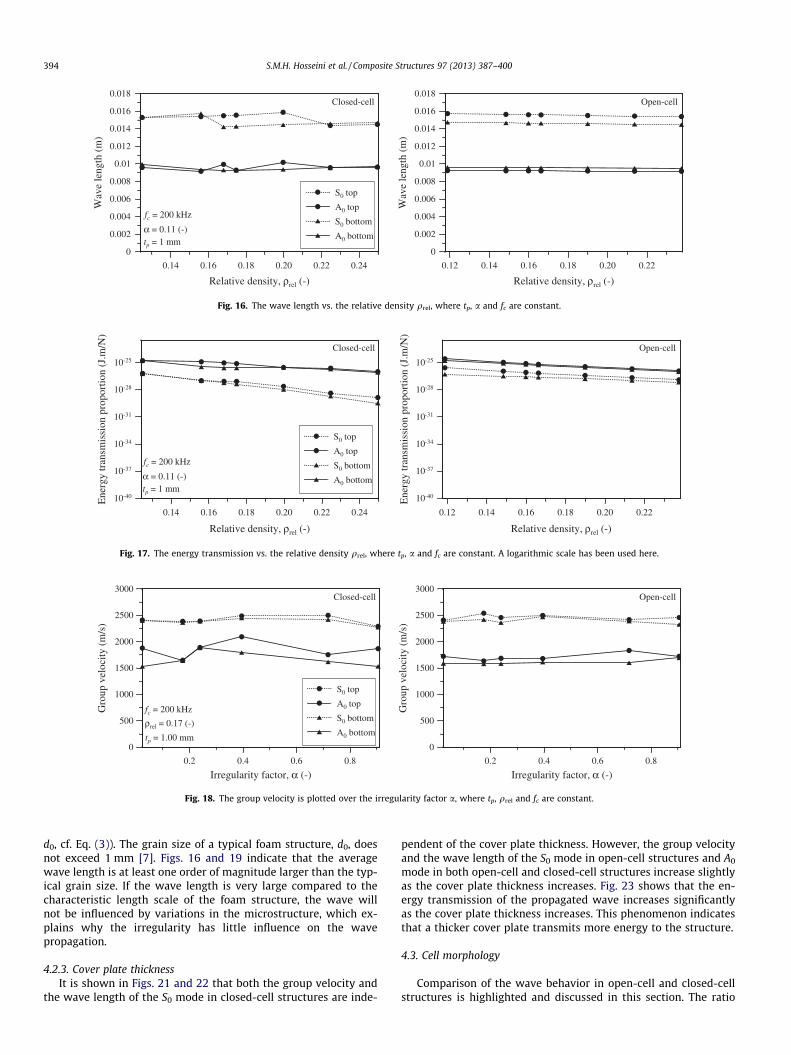
d0, cf. Eq. (3)). The grain size of a typical foam structure, d0, doesnot exceed 1 mm [7]. Figs. 16 and 19 indicate that the averagewave length is at least one order of magnitude larger than the typ-ical grain size. If the wave length is very large compared to thecharacteristic length scale of the foam structure, the wave willnot be influenced by variations in the microstructure, which ex-plains why the irregularity has little influence on the wavepropagation.
4.2.3. Cover plate thicknessIt is shown in Figs. 21 and 22 that both the group velocity and
the wave length of the S0 mode in closed-cell structures are inde-
pendent of the cover plate thickness. However, the group velocityand the wave length of the S0 mode in open-cell structures and A0
mode in both open-cell and closed-cell structures increase slightlyas the cover plate thickness increases. Fig. 23 shows that the en-ergy transmission of the propagated wave increases significantlyas the cover plate thickness increases. This phenomenon indicatesthat a thicker cover plate transmits more energy to the structure.
4.3. Cell morphology
Comparison of the wave behavior in open-cell and closed-cellstructures is highlighted and discussed in this section. The ratio
0
0.002
0.004
0.006
0.008
0.01
0.012
0.014
0.016
0.018
Wav
e le
ngth
(m
)
0.2 0.4 0.6 0.8
Irregularity factor, α (-)
S0 top
A0 top
S0 bottom
A0 bottom
Closed-cell
0
0.002
0.004
0.006
0.008
0.01
0.012
0.014
0.016
0.018
Wav
e le
ngth
(m
)
0.2 0.4 0.6 0.8
Irregularity factor, α (-)
Open-cell
fc = 200 kHz
ρrel = 0.17 (-)
tp = 1.00 mm
Fig. 19. The wave length is plotted over the irregularity factor a, where tp, qrel and fc are constant.
0
500
1000
1500
2000
2500
3000
3500
4000
Gro
up v
eloc
ity (
m/s
)
0.50 0.75 1.00 1.25 1.50 1.75 2.00 2.25 2.50
Cover plate thickness, tp (mm)
S0 top
A0 top
S0 bottom
A0 bottom
Closed-cell
Open cell0
500
1000
1500
2000
2500
3000
3500
4000
Gro
up v
eloc
ity (
m/s
)
0.50 0.75 1.00 1.25 1.50 1.75 2.00 2.25 2.50
Cover plate thickness, tp (mm)
Open-cell
fc = 200 kHz
ρrel = 0.168 (-)
α = 0.11 (-)
Fig. 21. The group velocity vs. the thickness of the cover plate tp, where a, qrel and fc are constant.
10-40
10-37
10-34
10-31
10-28
10-25
Ene
rgy
tran
smis
sion
pro
port
ion
(J.m
/N)
0.2 0.4 0.6 0.8
Irregularity factor, α (-)
fc = 200 kHz
S0 top
A0 top
S0 bottom
A0 bottomρrel = 0.17 (-)
Closed-cell
tp = 1.00 mm10-40
10-37
10-34
10-31
10-28
10-25
Ene
rgy
tran
smis
sion
pro
port
ion
(J.m
/N)
0.2 0.4 0.6 0.8
Irregularity factor, α (-)
Open-cell
Fig. 20. The energy transmission is plotted over the irregularity factor a, where tp, qrel and fc are constant. A logarithmic scale has been used here.
S.M.H. Hosseini et al. / Composite Structures 97 (2013) 387–400 395
between different wave properties, Vclosed/Vopen, of the A0 mode atthe top surface of the open-cell and closed-cell foam sandwich pa-nel plotted over the loading frequency, cf. Fig. 24, and geometricalproperties, cf. Figs. 25–27. Vopen denotes the value obtained fromthe open-cell model and Vclosed denotes the value obtained fromthe closed-cell model (logarithmic values are used to compare
energy transmission results). It is shown in Fig. 24 that the devia-tion between the wave properties in open-cell and closed-cellstructures is minimal if the loading frequency is in the range of150–200 kHz. However, Figs. 25–27 show that the geometricalproperties have only a minor effect on the deviation between thewave properties in open and closed cell structures.
0
0.002
0.004
0.006
0.008
0.01
0.012
0.014
0.016
0.018W
ave
leng
th (
m)
0.50 0.75 1.00 1.25 1.50 1.75 2.00 2.25 2.50
Cover plate thickness, tp (mm)
S0 top
A0 top
S0 bottom
A0 bottom
Closed-cell
0
0.002
0.004
0.006
0.008
0.01
0.012
0.014
0.016
0.018
Wav
e le
ngth
(m
)
0.50 0.75 1.00 1.25 1.50 1.75 2.00 2.25 2.50
Cover plate thickness, tp (mm)
Open-cell
fc = 200 kHz
ρrel = 0.168 (-)
α = 0.11 (-)
Fig. 22. The wave length vs. the thickness of the cover plate tp, where a, qrel and fc are constant.
10-40
10-37
10-34
10-31
10-28
10-25
Ene
rgy
tran
smis
sion
pro
port
ion
(J.m
/N)
0.50 0.75 1.00 1.25 1.50 1.75 2.00 2.25 2.50
Cover plate thickness, tp (mm)
fc = 200 kHz
S0 top
A0 top
S0 bottom
A0 bottomρrel = 0.168 (-)
α = 0.11 (-)
Closed-cell
10-40
10-37
10-34
10-31
10-28
10-25
Ene
rgy
tran
smis
sion
pro
port
ion
(J.m
/N)
0.50 0.75 1.00 1.25 1.50 1.75 2.00 2.25 2.50
Cover plate thickness, tp (mm)
Open-cell
Fig. 23. The energy transmission vs. the thickness of the cover plate tp, where a, qrel and fc are constant. A logarithmic scale has been used here.
396 S.M.H. Hosseini et al. / Composite Structures 97 (2013) 387–400
4.4. Homogenization
Using a homogenized model is much cheaper computationallythan the fully resolved model described in Section 2. As an exam-ple, an open-cell structure with a = 11 and qrel = 0.168 is consid-ered. The size of the homogenized model is 2.6 times smallerthan the fully resolved foam structure model and the computation
0.7
0.8
0.9
1
1.1
1.2
1.3
Vcl
osed
/Vop
en (
-)
50 100 150 200 250 300 350 400
Frequency, fc (kHz)
ρrel = 0.168 (-)
α = 0.11 (-), tp = 1 mm
top surfaceAnti-symmetric mode
Group velocity
Wave length Energy transmission
Fig. 24. The ratio between wave propagation properties in open-cell and closed-cellstructures vs. the central frequency. The results are plotted using Splineapproximation.
time is 1.4 times faster. The relative difference (in %) between thewave propagation properties obtained from the homogenizedmodel and from the numerical simulation test with the foam sand-wich plate have been calculated using (16) and plotted vs. the cen-tral frequency of the loading signal. Vhomogenized stands for the valueobtained from the homogenized model and Vfoam stands for the va-lue obtained by numerical simulation of the wave propagation in
0.7
0.8
0.9
1
1.1
1.2
1.3
Vcl
osed
/Vop
en (
-)
0.14 0.16 0.18 0.20 0.22 0.24
Relative density, ρrel (-)
α = 0.11 (-)
tp = 1 mm
top surfaceAnti-symmetric mode
Group velocity
Wave length Energy transmission
fc = 200 kHz
Fig. 25. The ratio between wave propagation properties in open and closed-cellstructures vs. the central frequency. The results are plotted using Splineapproximation.
0.7
0.8
0.9
1
1.1
1.2
1.3V
clos
ed/V
open
(-)
0.2 0.4 0.6 0.8Irregularity factor, α (-)
ρrel = 0.168 (-)
tp = 1 mm
top surfaceAnti-symmetric mode
Group velocity
Wave length Energy transmission
fc = 200 kHz
Fig. 26. The ratio between wave propagation properties in open and closed-cellstructures vs. the central frequency. The results are plotted using Splineapproximation.
0.7
0.8
0.9
1
1.1
1.2
1.3
V clo
sed/V
open
(-)
0.50 0.75 1.00 1.25 1.50 1.75 2.00 2.25 2.50
Cover plate thickness, tp (mm)
ρrel = 0.168 (-)
α = 0.11 (-)
top surfaceAnti-symmetric mode
Group velocity
Wave length Energy transmission
fc = 200 kHz
Fig. 27. The ratio between wave propagation properties in open and closed-cellstructures vs. the central frequency. The results are plotted using Splineapproximation.
S.M.H. Hosseini et al. / Composite Structures 97 (2013) 387–400 397
the fully resolved foam sandwich plate (logarithmic values areused to compare the energy transmission results). A clear similar-ity can be observed for the group velocity and the energy transmis-sion values for both open and closed cell structures in Figs. 28, 29,32 and 33, respectively. However, despite the agreement in thelow-frequency range, a clear difference in the computed wavelengths can be seen for higher frequencies in both open-cell and
-100
-75
-50
-25
0
25
50
75
100
Dif
fere
nce
(%)
50 100 150 200 250 300 350 400
Frequency, fc (kHz)
S0 top
A0 top
ρrel = 0.168 (-)
α = 0.11 (-)
Closed-cell
tp = 1 mm
top surfaceGroup velocity
Fig. 28. Relative error of the group velocity obtained from the homogenized model comfrequency of the loading signal.
-100
-75
-50
-25
0
25
50
75
100
Dif
fere
nce
(%)
50 100 150 200 250 300 350 400
Frequency, fc (kHz)
S0 top
A0 top
ρrel = 0.168 (-)
α = 0.11 (-)
Open-cell
tp = 1 mm
top surfaceGroup velocity
Fig. 29. Relative error of the group velocity obtained from the homogenized model comfrequency of the loading signal.
closed-cell foam structures (Figs. 30 and 31). Further studies mustbe done to develop a more efficient simplification approach for abetter comparison of wave length values
rel: error ¼ 100 � Vhomogenized � V foam
Vhomogenized: ð16Þ
bottom surface
S0 bottom
A0 bottom
-100
-75
-50
-25
0
25
50
75
100
Dif
fere
nce
(%)
50 100 150 200 250 300 350 400
Frequency, fc (kHz)
pared with the closed foam structure model. The values are plotted vs. the central
bottom surface
S0 bottom
A0 bottom
-100
-75
-50
-25
0
25
50
75
100
Dif
fere
nce
(%)
50 100 150 200 250 300 350 400
Frequency, fc (kHz)
pared with the open foam structure model. The values are plotted vs. the central
-100
-75
-50
-25
0
25
50
75
100D
iffe
renc
e (%
)
50 100 150 200 250 300 350 400
Frequency, fc (kHz)
S0 top
A0 top
ρrel = 0.168 (-)
α = 0.11 (-)
Closed-cell
tp = 1 mm
top surfaceWave length bottom surface
S0 bottom
A0 bottom
-100
-75
-50
-25
0
25
50
75
100
Dif
fere
nce
(%)
50 100 150 200 250 300 350 400
Frequency, fc (kHz)
Fig. 30. Relative error of the wave length obtained from the homogenized model compared with the closed foam structure model. The values are plotted vs. the centralfrequency of the loading signal.
-100
-75
-50
-25
0
25
50
75
100
Dif
fere
nce
(%)
50 100 150 200 250 300 350 400
Frequency, fc (kHz)
S0 top
A0 top
ρrel = 0.168 (-)
α = 0.11 (-)
Closed-cell
tp = 1 mm
top surfaceEnergy transmission bottom surface
S0 bottom
A0 bottom
-100
-75
-50
-25
0
25
50
75
100
Dif
fere
nce
(%)
50 100 150 200 250 300 350 400
Frequency, fc (kHz)
Fig. 32. Relative error of the energy transmission values obtained from the homogenized model compared with the closed foam structure model. The values are plotted vs.the central frequency of the loading signal.
bottom surface
S0 bottom
A0 bottom
-100
-75
-50
-25
0
25
50
75
100
Dif
fere
nce
(%)
50 100 150 200 250 300 350 400
Frequency, fc (kHz)
-100
-75
-50
-25
0
25
50
75
100
Dif
fere
nce
(%)
50 100 150 200 250 300 350 400
Frequency, fc (kHz)
S0 top
A0 top
ρrel = 0.168 (-)
α = 0.11 (-)
Open-cell
tp = 1 mm
top surfaceWave length
Fig. 31. Relative error of the wave length obtained from the homogenized model compared with the open foam structure model. The values are plotted vs. the centralfrequency of the loading signal.
398 S.M.H. Hosseini et al. / Composite Structures 97 (2013) 387–400
Eq. (4) with Cclosed = 0.5 and Copen = 2.05 is used in this part. Avariation of Cclosed and Copen within the typical range (cf. Section2.2) had little effect on the wave propagation in the homogenizedmodel.
4.5. Conclusion & outlook
The Lamb wave propagation behavior depending on the loadingfrequency and geometrical properties (i.e. the relative density, the
-100
-75
-50
-25
0
25
50
75
100
Dif
fere
nce
(%)
50 100 150 200 250 300 350 400
Frequency, fc (kHz)
S0 top
A0 top
ρrel = 0.168 (-)
α = 0.11 (-)
Open-cell
tp = 1 mm
top surfaceEnergy transmission bottom surface
S0 bottom
A0 bottom
-100
-75
-50
-25
0
25
50
75
100
Dif
fere
nce
(%)
50 100 150 200 250 300 350 400
Frequency, fc (kHz)
Fig. 33. Relative error of the energy transmission values obtained from the homogenized model compared with the open foam structure model. The values are plotted vs. thecentral frequency of the loading signal.
Table 1Summary of results showing the dependency of the wave propagation under variations of the loading frequency and geometrical parameters of the foam sandwich plate. ‘‘"’’indicates an increase, ‘‘–’’ indicates no change or slight changes and ‘‘;’’ indicates there is a decrease in the respective values.
Group velocity Wave length Energy transmission
Central loading frequency S0: – ; Below critical frequency: S0", A0;fc" A0: " Above critical frequency: ;Relative density qrel" – – ;Irregularity a" – – –Cover plate thickness " " "tp" (Closed-cell, S0: –) (Closed-cell, S0: –)
S.M.H. Hosseini et al. / Composite Structures 97 (2013) 387–400 399
structural irregularity (grain size) and the cover plate thickness) ofa foam sandwich plate has been studied via numerical simulation.The results are summarized in Table 1. A similar behavior of thewave propagation in closed-cell and open-cell structures has beenobserved. In order to reduce the computational effort a simplifiedhomogenized model was used where the micro-structured foamnetwork has been replaced by brick elements with effective mate-rial properties. It has been shown that the group velocity and theenergy transmission by the Lamb waves are equal in the simplifiedand in the fully resolved model, whereas the wave lengths ob-tained for the S0 and A0 modes did not correspond. Further studiesmust be carried out in order to develop a better simplification ap-proach. In addition, there are still some open questions on SHMbased on Lamb waves for foam sandwich structures, e.g. findingthe appropriate loading signal for SHM applications [24] as wellas the determination of possible damage which can be detectedby the propagating wave at the signal-processing level [31]. Fur-thermore, more studies must be carried out to prove the usefulnessof Lamb waves in detecting invisible damage experimentally inlight-weight cellular sandwich structures, including foam sand-wich plates.
Acknowledgment
The authors acknowledge the German Research Foundation(DFG) for the financial support of this research (GA 480/13).
References
[1] Song F, Huang GL, Hudson k. Guided wave propagation in honeycombsandwich structures using a piezoelectric actuator/sensor system. SmartMater Struct 2009;18:125007–15.
[2] Ungethuem A, Lammering R. Impact and damage localization on carbon-fibre-reinforced plastic plates. In: Casciati MGF, editor. Proceedings 5th Europeanworkshop on structural health monitoring. Italy: Sorrento; 2010.
[3] Brayl H. Eng Mater Des 1972;16:19.[4] Barton R, Carter FWS, Roberts TA. Chem Eng 1974;291:708.[5] Ashby MF, Evans AG, Fleck NA, Gibson LJ, Hutchinson JW, Wadley HNG. Metal
foams: a design guide. Butterworth Hamilton; 2000.[6] Banhart J, Seeliger H. Aluminium foam sandwich panels: manufacture,
metallurgy and applications. Adv Eng Mater 2008;10:793–802.[7] Smith BH, Szyniszewski S, Hajjar JF, Schafer BW, Arwade SR. Steel foam for
structures: a review of applications, manufacturing and material properties. JConstr Steel Res 2012;71:1–10.
[8] Hamer J. Honeycomb structure and its application to the concorde rudder.Composites 1971;2:242–5.
[9] Wilson S. A new face of aerospace honeycomb. Mater Des 1990;11:323–6.[10] Vijayakumar S. Parametric based design of cfrp honeycomb sandwich cylinder
for a spacecraft. Compos Struct 2004;65:7–12.[11] Gibson LJ, Ashby MF. Cellular solids. structure and properties, 2nd ed.
Cambridge; 1999. ISBN-10: 0521499119.[12] Curran D. Metal foam pictures <http://ookaboo.com/o/pictures/
topic.bigphoto/13504941/Metal_foam>.[13] Ji Q, Le LH, Filipow LJ, Jackson SA. Ultrasonic wave propagation in water-
saturated aluminum foams. Ultrasonics 1998;36:759–65.[14] Terrien N, Osmont D. Damage detection in foam core sandwich structures
using guided waves. In: Leger MDA, editor. Ultrasonic wave propagation innon homogeneous media. Springer proceedings in physics, vol. 128. BerlinHeidelberg: Springer; 2009. p. 251–60.
[15] Zumpano G, Meo M. Damage detection in an aircraft foam sandwich panelusing nonlinear elastic wave spectroscopy. Comput Struct 2008;86:483490.
[16] Osmont D, Devillers D, Taillade F. Health monitoring of sandwich plates basedon the analysis of the interaction of lamb waves with damages. In: Davis LP,editor. Smart structures and materials 2001: smart structures and integratedsystems, vol. 4327; 2001. p. 290–301.
[17] Chakraborty N, Mahapatra DR, Srinivasan G. Ultrasonic guided wavecharacterization and damage detection in foam-core sandwich panel usingpwas and ldv. In: Health monitoring of structural and biological systems. SanDiego, California, USA; 2012.
[18] Wang L, Yuan F. Group velocity and characteristic wave curves of lamb wavesin composites: modeling and experiments. Compos Sci Tech2007;67:1370–84.
[19] Zhu HX, Hobdell JR, Windle AH. Acta Mater 2000;48:4893.[20] Information <http://www.qhull.org>.[21] Gibson MF, Ashby LJ. Cellular solids: structure & properties. Oxfordshire Press;
1997.[22] Öchsner A, Hosseini S, Merkel M. Numerical simulation of the mechanical
properties of sintered and bonded perforated hollow sphere structures (phss).J Mater Sci Technol 2010;26:730–6.

400 S.M.H. Hosseini et al. / Composite Structures 97 (2013) 387–400
[23] Hosseini SMH, Gabbert U. Analysis of guided lamb wave propagation (GW) inhoneycomb sandwich panels. In: PAMM, vol. 1; 2010. p. 11–4.
[24] Mustapha S, Ye L, Wang D, Lu Y. Assessment of debonding in sandwich CF/EPcomposite beams using A0 lamb. Compos Struct 2011;93:483–91.
[25] Weber R. Numerical simulation of the guided lamb wave propagation inparticle reinforced composites excited by piezoelectric patch actuators.Master’s thesis. Institut für Mechanik, Fakultät für Maschinenbau, Otto-von-Guericke-Universität Magdeburg, Germany; 2011.
[26] Pohl J, Mook G, Szewieczek A, Hillger W, Schmidt D. Determination of lambwave dispersion data for SHM. In: 5th European workshop of structural healthmonitoring; 2010.
[27] Köhler B. Dispersion relations in plate structures studied with a scanning laservibrometer. In: ECNDT. Berlin; 2006.
[28] Willberg C, Mook G, Gabbert U, Pohl J. The phenomenon of continuous modeconversion of lamb waves in CFRP plates. Key Eng Mat 2012;518:364–74.
[29] Ahmad ZAB. Numerical simulations of lamb waves in plates using a semi-analytical finite element method. Ph.D. thesis, Institut für Mechanik, Fakultätfür Maschinenbau, Otto-von-Guericke-Universität Magdeburg, Germany;2011.
[30] Weber R, Hosseini SMH, Gabbert U. Numerical simulation of the guided lambwave propagation in particle reinforced composites. Compos Struct2012;94(10):3064–71.
[31] Paget CA. Active health monitoring of aerospace composite structures byembedded piezoceramic transducers. Ph.D. thesis, Department of AeronauticsRoyal Institute of Technology, Stockholm, Sweden; 2001.
[32] Sachse W, Pao Y. On the determination of phase and group velocities ofdispersive waves in solids. J Appl Phys 1978;8:4320–7.
[33] Song F, Huang G, Kim J, Haran S. On the study of surface wave propagation inconcrete structures using a piezoelectric actuator/sensor system. Smart MaterStruct 2008;17:055024–32.