Embed Size (px)
Citation preview
Numerical Simulation of Heat
Transfer by Natural Convection in
Horizontal Finned Channels Gabriel Gonçalves da Silva Ferreira, Luiz Fernando Lopes Rodrigues Silva
Escola de Química, UFRJ
Paulo L. C. Lage (*), Fábio Pereira dos Santos
Laboratório de Termofluidodinâmica,
Programa de Engenharia Química, COPPE/UFRJ
1) Company Overview
LTFD research lines:
- Theoretical modeling and experimental measurements in
multiphase flows
- CFD simulation of multiphase flows and applied CFD
(ANSYS CFX, FLUENT, OpenFOAM)
- Population balance
- Numerical Methods
- Parallel Computing
Infrastructure:
Clusters: 128 core Opteron 2356 based cluster (almost 1
TeraFLOPs) and a beowulf cluster based on Intel Q6600
2) Problem Description
2.1) Mixed Convection
Heat transfer mechanisms: conduction, convection, radiation
Two limiting types in convection:
Forced Convection: flow patterns are determined by external forces.
Free Convection (Natural Convection): flow patterns are determined by
buoyant forces in the heated fluid.
In general:
Mixed convection – both effects must be taken account.
2) Problem Description
2.2) Fins
Maximization of heat transfer hate.
Under Natural/Mixed convection regimes in channel flows:
- hconv is low.
- hconv is easily modified with changes in fin geometry.
Optimum geometry design:
- Experimental investigation.
- CFD simulations (need to validate the models!)
2.3) Objective
Develop and validate a model for natural and mixed convection in a
horizontal finned channel.
3) Methodology
Comparison of experimental results obtained by Dogan & Sivrioglu1 with
CFD results.
Experiments measured the effect of size and spacing of fins in hconv for
different Tbase values.
Software ANSYS 12.1 for CFD simulations:
Design Modeler for geometry.
ICEM CFD for hexahedral meshes.
1 M. Dogan, M. Sivrioglu,Experimental investigation of mixed convection heat
transfer from longitudinal fins in a horizontal rectangular channel: In natural
convection dominated flow regimes, Energy Conversion and Management 50
(2009) 2513-2521.
3) Methodology
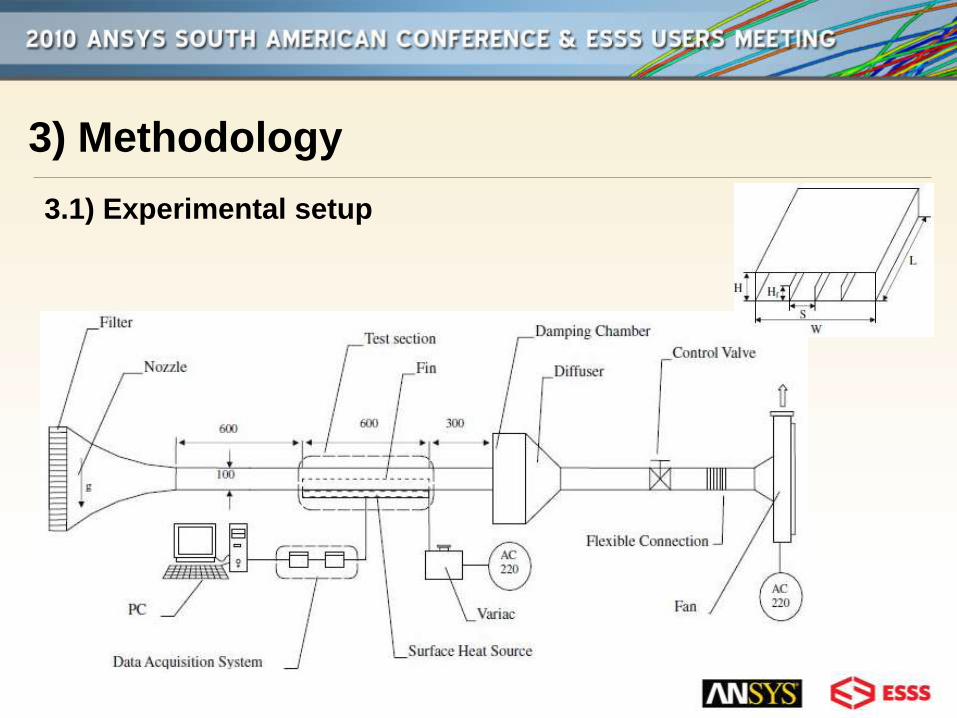
3.1) Experimental setup
3) Methodology
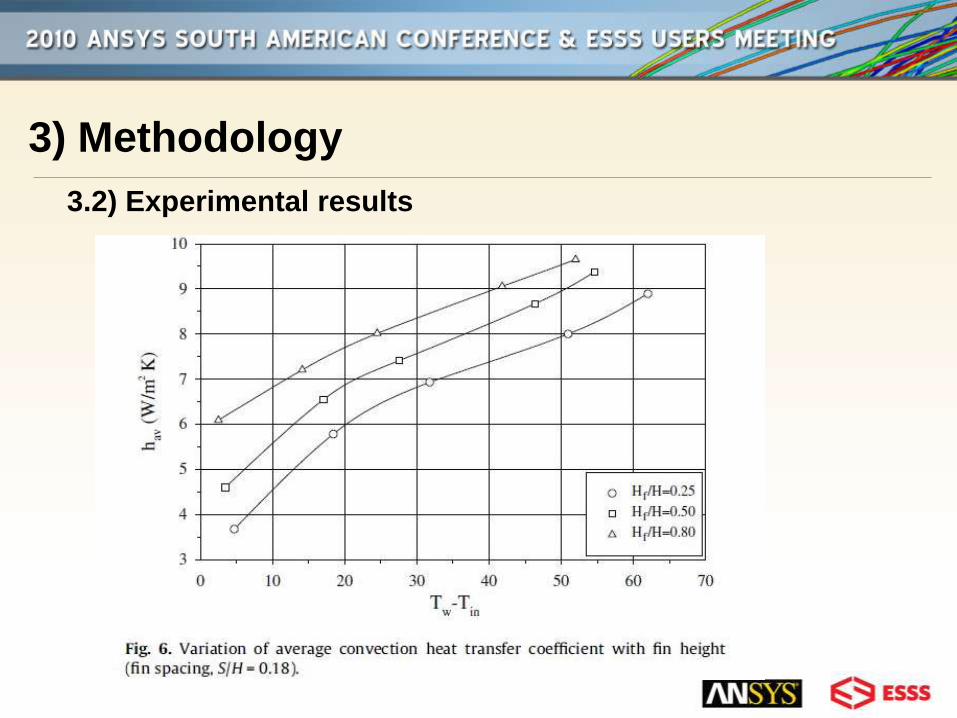
3.2) Experimental results
3) Methodology
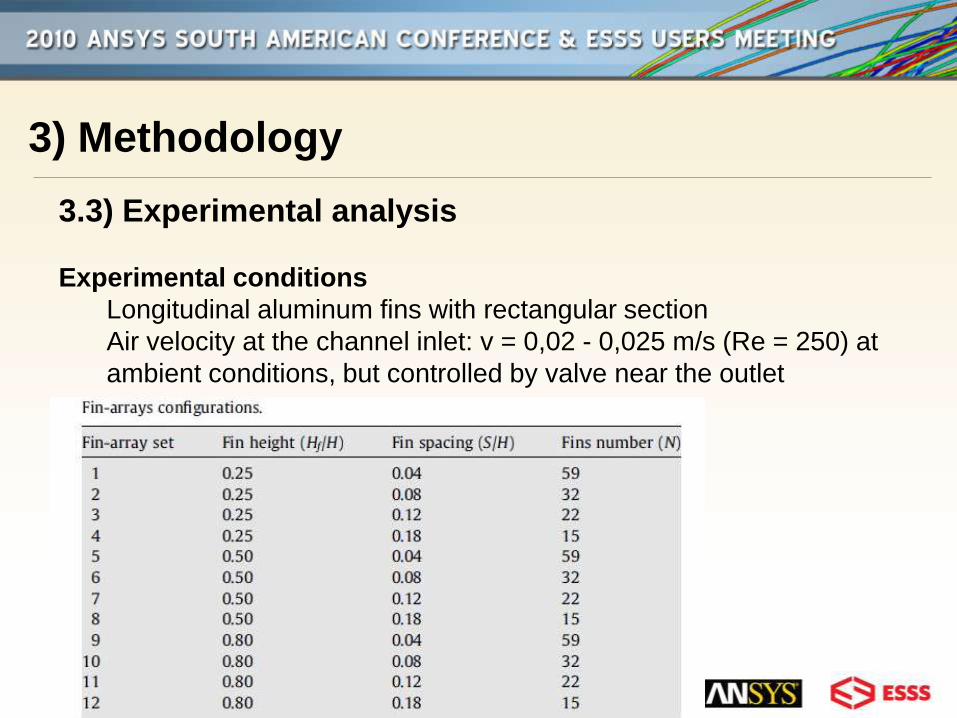
3.3) Experimental analysis
Experimental conditions
Longitudinal aluminum fins with rectangular section
Air velocity at the channel inlet: v = 0,02 - 0,025 m/s (Re = 250) at
ambient conditions, but controlled by valve near the outlet
3) Methodology
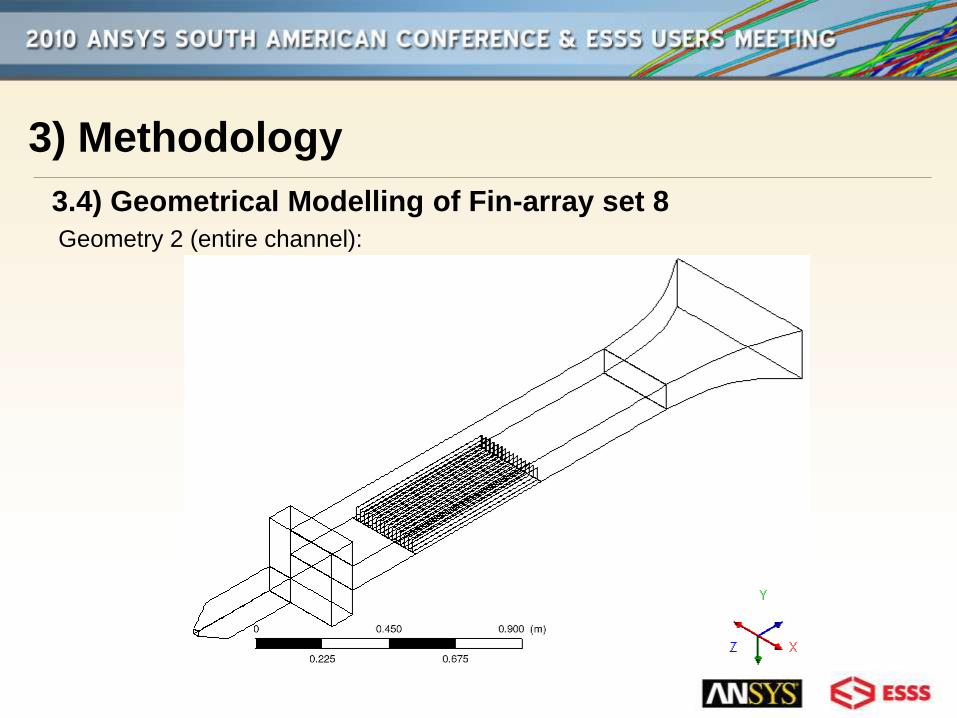
3.4) Geometrical Modelling of Fin-array set 8
Geometry 2 (entire channel):
3) Methodology
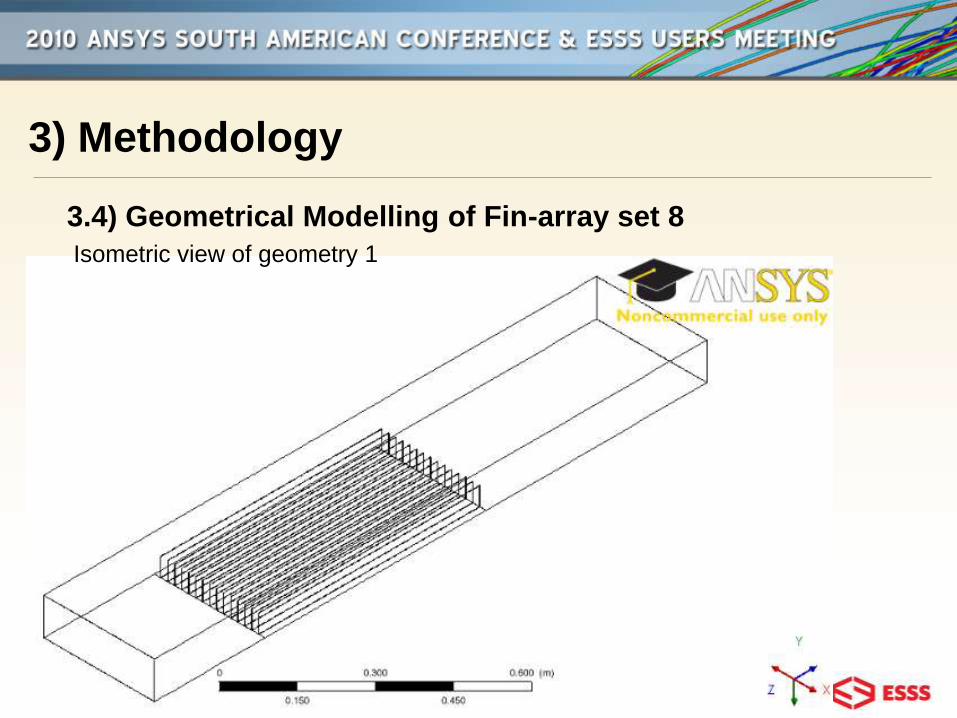
3.4) Geometrical Modelling of Fin-array set 8
Isometric view of geometry 1
3) Methodology
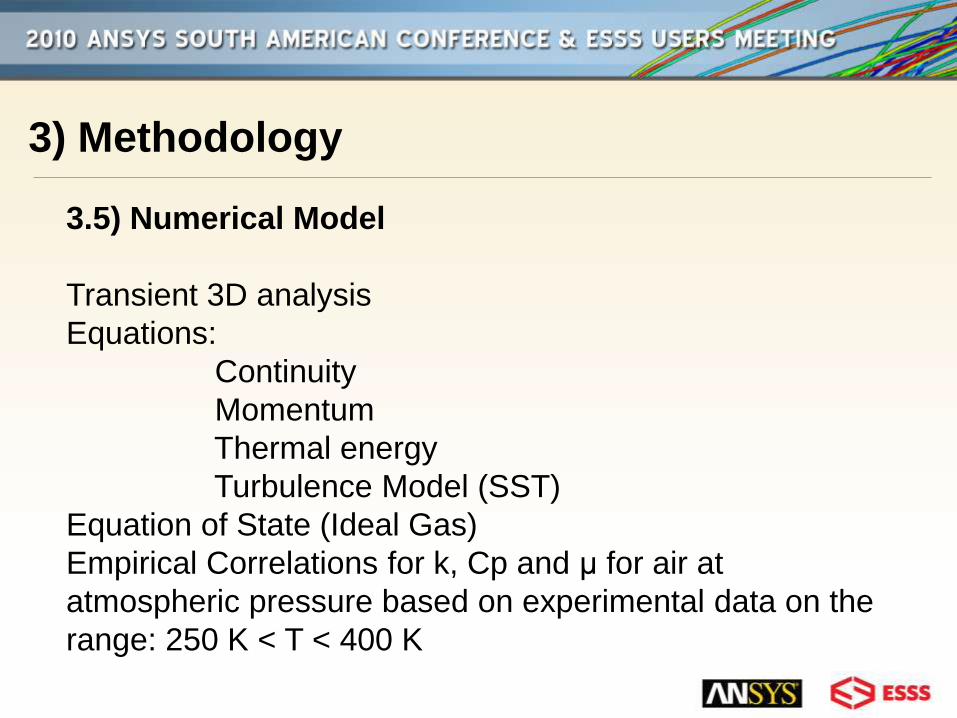
3.5) Numerical Model
Transient 3D analysis
Equations:
Continuity
Momentum
Thermal energy
Turbulence Model (SST)
Equation of State (Ideal Gas)
Empirical Correlations for k, Cp and μ for air at
atmospheric pressure based on experimental data on the
range: 250 K < T < 400 K
3) Methodology
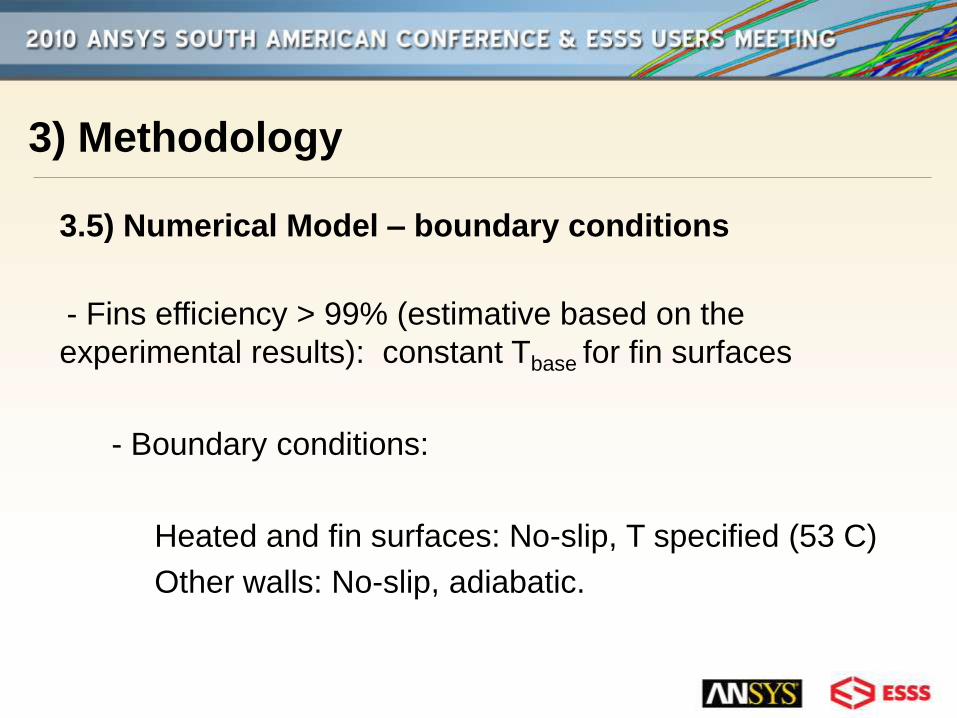
3.5) Numerical Model – boundary conditions
- Fins efficiency > 99% (estimative based on the
experimental results): constant Tbase for fin surfaces
- Boundary conditions:
Heated and fin surfaces: No-slip, T specified (53 C)
Other walls: No-slip, adiabatic.
3) Methodology
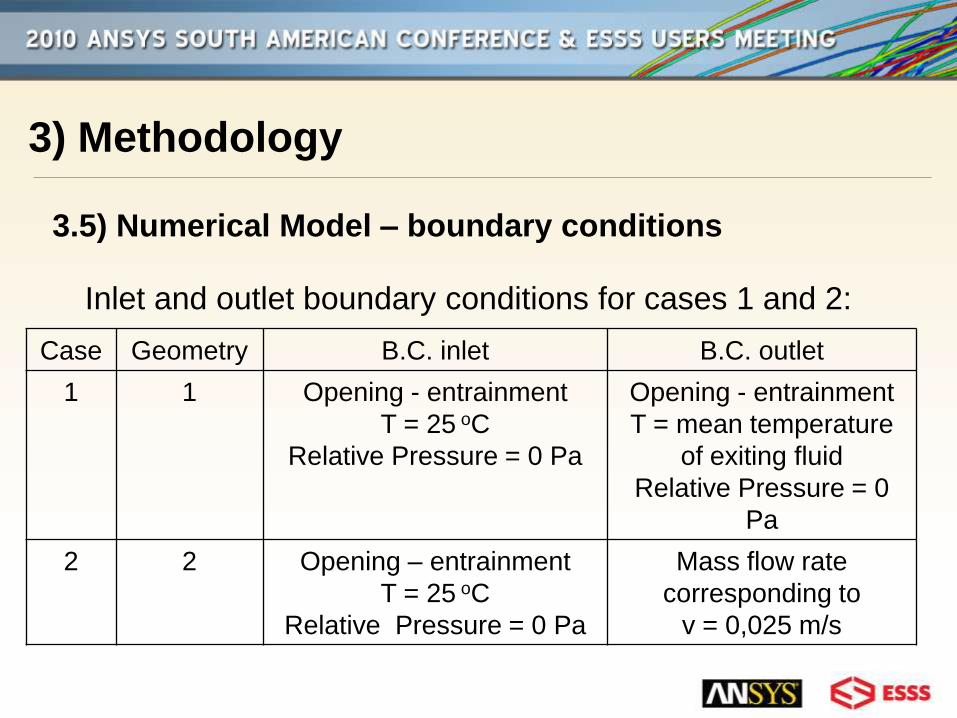
3.5) Numerical Model – boundary conditions
Inlet and outlet boundary conditions for cases 1 and 2:
Case Geometry B.C. inlet B.C. outlet
1 1 Opening - entrainment
T = 25 oC
Relative Pressure = 0 Pa
Opening - entrainment
T = mean temperature
of exiting fluid
Relative Pressure = 0
Pa
2 2 Opening – entrainment
T = 25 oC
Relative Pressure = 0 Pa
Mass flow rate
corresponding to
v = 0,025 m/s
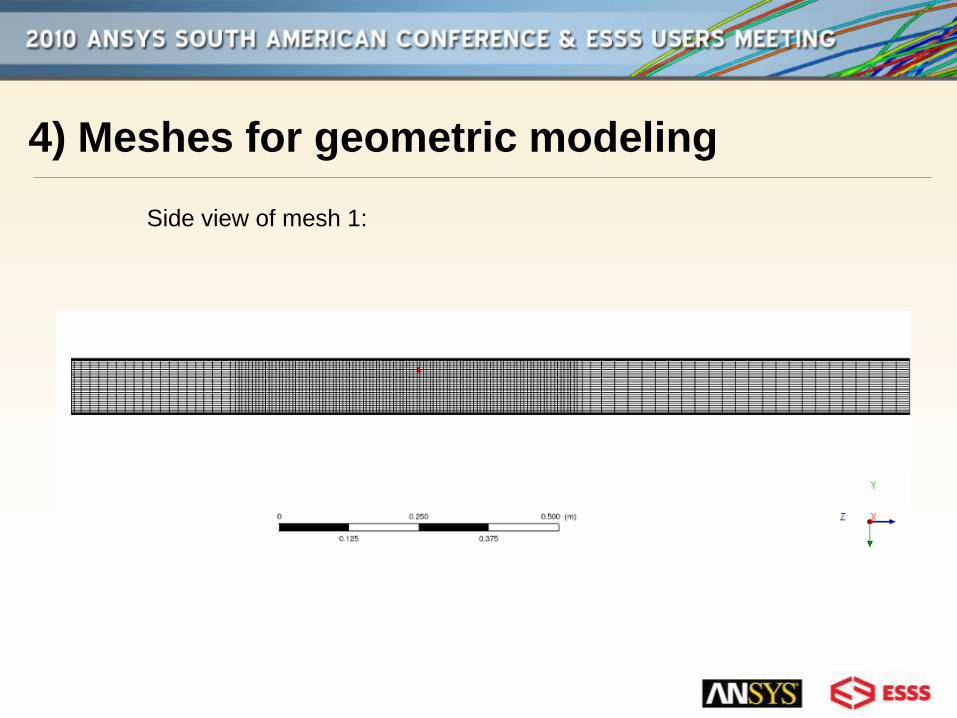
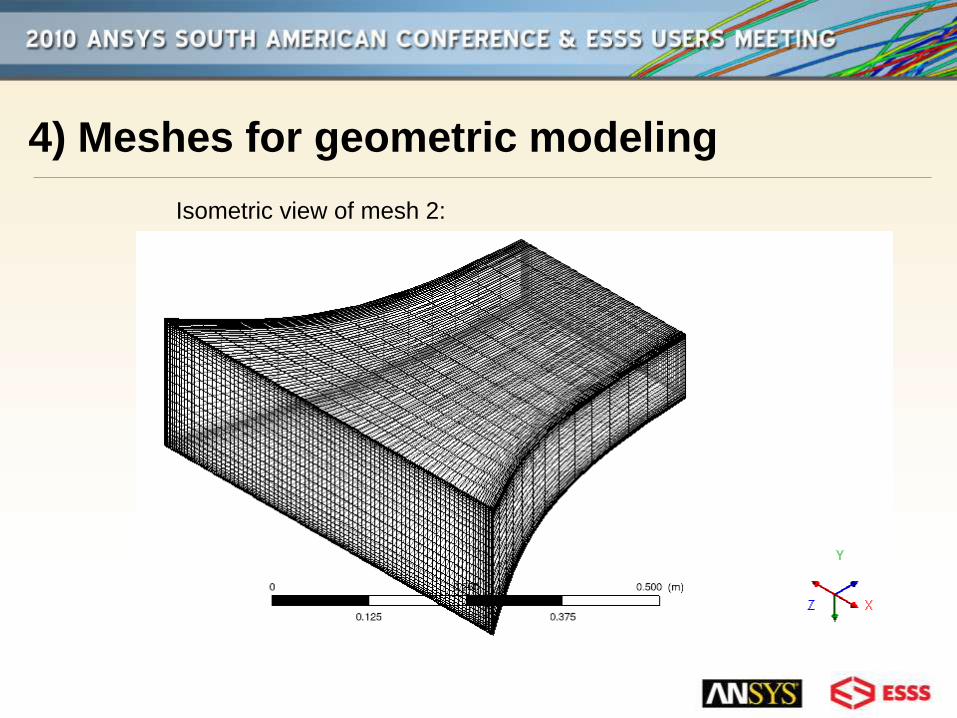
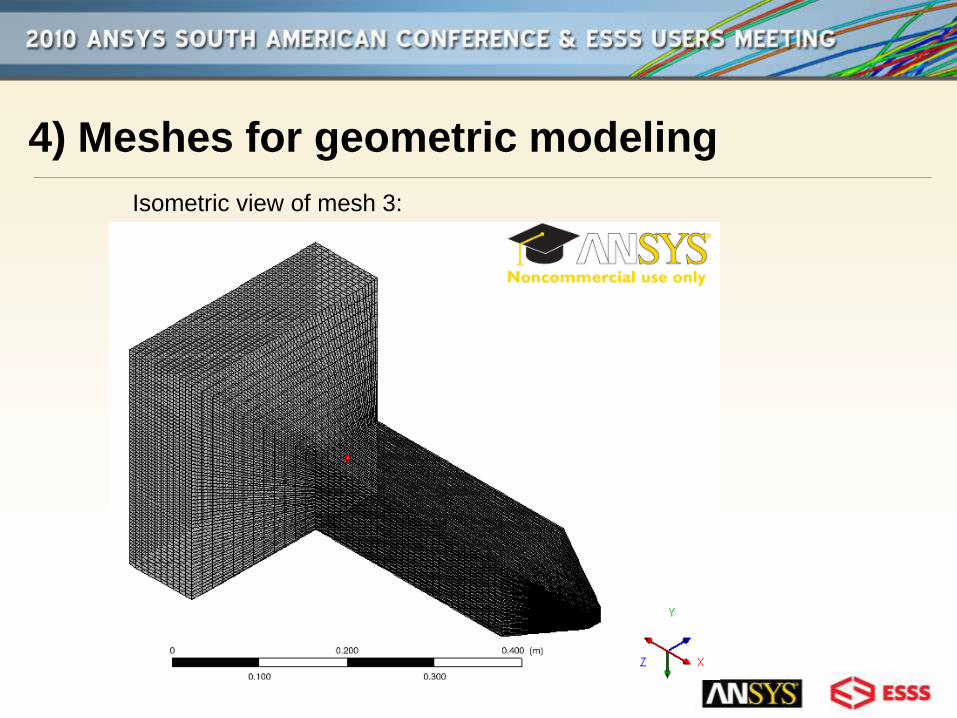
4) Meshes for geometric modeling
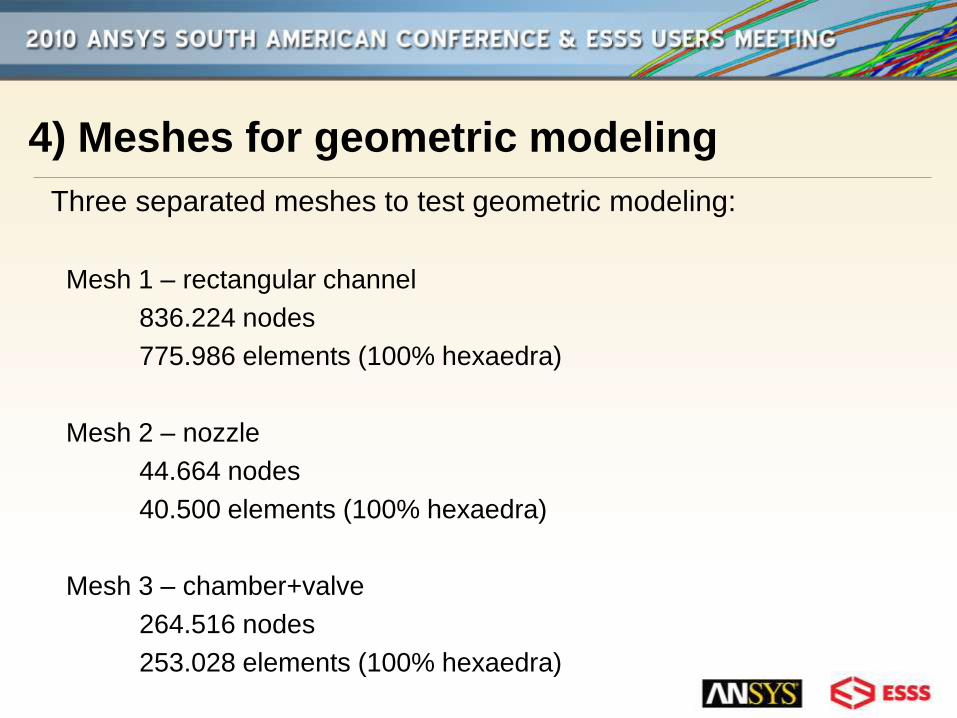
Three separated meshes to test geometric modeling:
Mesh 1 – rectangular channel
836.224 nodes
775.986 elements (100% hexaedra)
Mesh 2 – nozzle
44.664 nodes
40.500 elements (100% hexaedra)
Mesh 3 – chamber+valve
264.516 nodes
253.028 elements (100% hexaedra)
4) Meshes for geometric modeling
Side view of mesh 1:
4) Meshes for geometric modeling
Isometric view of mesh 2:
4) Meshes for geometric modeling
Isometric view of mesh 3:
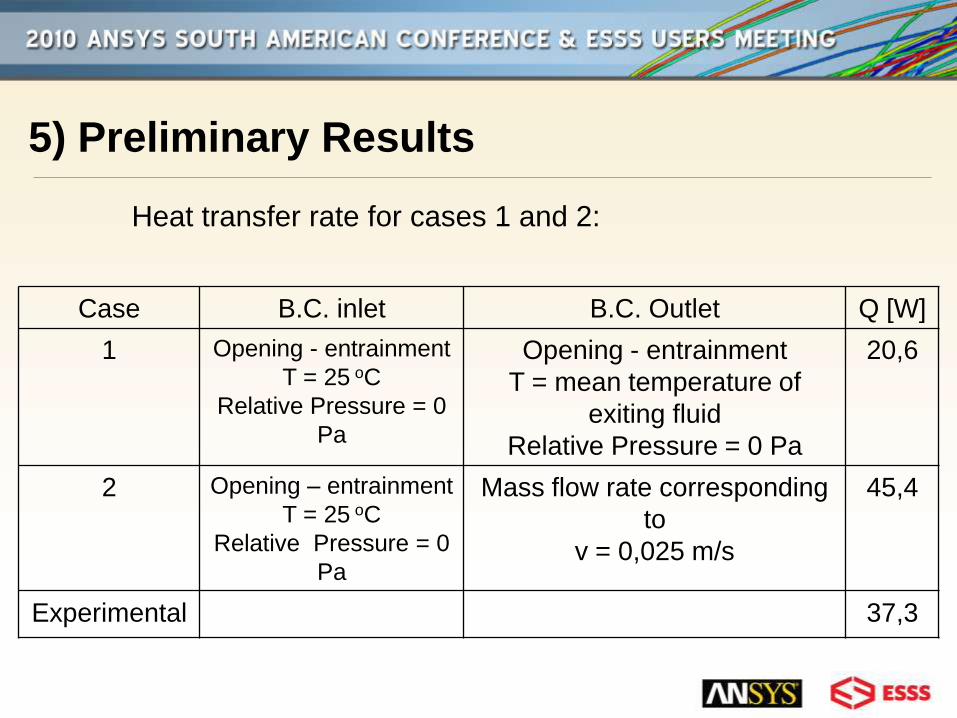
5) Preliminary Results
Heat transfer rate for cases 1 and 2:
Case B.C. inlet B.C. Outlet Q [W]
1 Opening - entrainment
T = 25 oC
Relative Pressure = 0
Pa
Opening - entrainment
T = mean temperature of
exiting fluid
Relative Pressure = 0 Pa
20,6
2 Opening – entrainment
T = 25 oC
Relative Pressure = 0
Pa
Mass flow rate corresponding
to
v = 0,025 m/s
45,4
Experimental 37,3
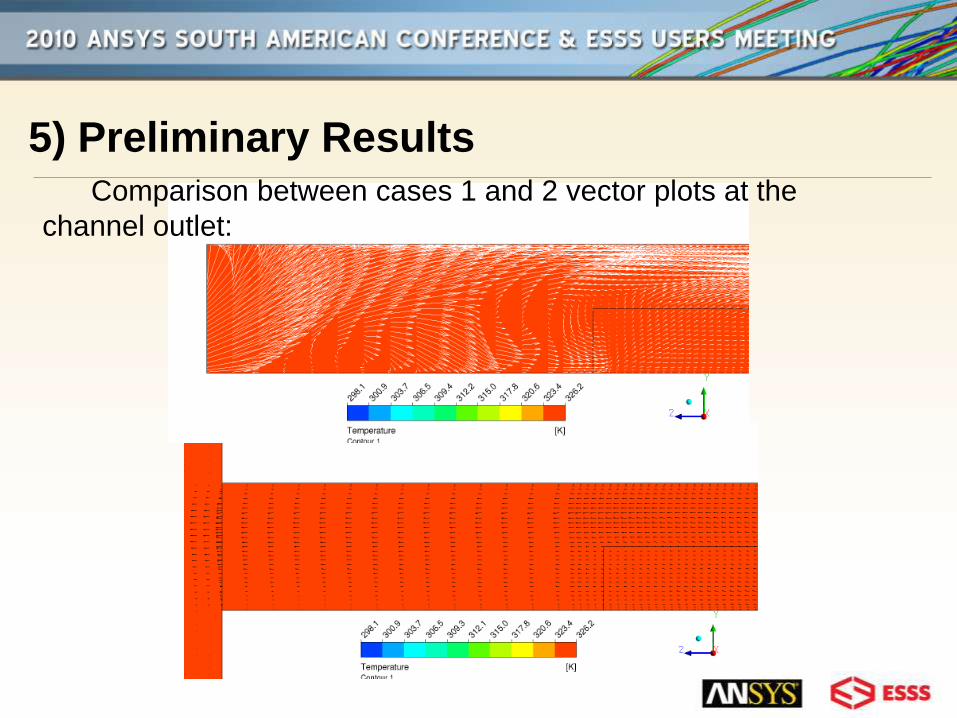
5) Preliminary ResultsComparison between cases 1 and 2 vector plots at the
channel outlet:
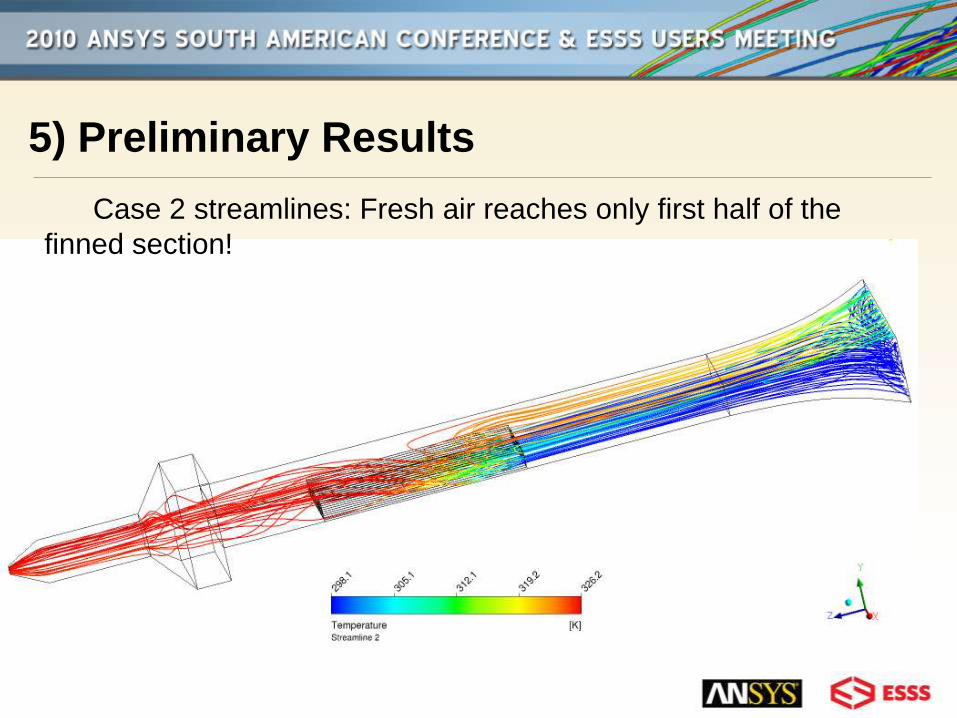
5) Preliminary Results
Case 2 streamlines: Fresh air reaches only first half of the
finned section!
6) Conclusions and next steps
The larger error of case 1 (44,8%) compared to case 2 (21,6%) and the
behavior of the flow at the outlet show that the geometric modeling used
in case 1 is not a good approximation. Some geometries can’t be
simplified for natural convection.
The experimental mass flow rate is given by the article as mean velocity
at the channel inlet but with a large error margin (0,02-0,025 m/s with
and error of 0.015 m/s ). Present simulations were made with the mass
flow rate corresponding to the higher velocity value. Smaller values could
give results closer to the experimental one.
Next steps:
- Use mass flow rate corresponding to the lower velocity case.
- Run case 2 with a more refined mesh.


![Natural Convection Heat Transfer from a Rectangular Block ... · 106 An Overview of Heat Transfer Phenomena Tso [5]. Natural convection from a discrete bottom flush-mounted rectangular](https://img.pdfslide.us/doc/110x75/5e840cdd925caf7f7408a997/natural-convection-heat-transfer-from-a-rectangular-block-106-an-overview-of.jpg)