Embed Size (px)
Citation preview
General rights Copyright and moral rights for the publications made accessible in the public portal are retained by the authors and/or other copyright owners and it is a condition of accessing publications that users recognise and abide by the legal requirements associated with these rights.
• Users may download and print one copy of any publication from the public portal for the purpose of private study or research. • You may not further distribute the material or use it for any profit-making activity or commercial gain • You may freely distribute the URL identifying the publication in the public portal
If you believe that this document breaches copyright please contact us providing details, and we will remove access to the work immediately and investigate your claim.
Downloaded from orbit.dtu.dk on: Jun 15, 2018
Numerical modelling of thin-walled hypereutectic ductile cast iron parts
Pedersen, Karl Martin; Hattel, Jesper Henri; Tiedje, Niels Skat
Published in:Acta Materialia
Link to article, DOI:10.1016/j.actamat.2006.06.049
Publication date:2006
Link back to DTU Orbit
Citation (APA):Pedersen, K. M., Hattel, J. H., & Tiedje, N. S. (2006). Numerical modelling of thin-walled hypereutectic ductilecast iron parts. Acta Materialia, 54, 5103-5114. DOI: 10.1016/j.actamat.2006.06.049
Post-print of article published in Acta Materialia 54 (2006) 5102-5114 Hyperlink to article: http://www.sciencedirect.com/science/journal/13596454
Numerical modelling of thin walled hypereutectic ductile cast iron parts
Karl Martin Pedersen*, Jesper H. Hattel, Niels Tiedje Department of Manufacturing Engineering and Management, Technical University of
Denmark, DK-2800 Kgs. Lyngby, Denmark * Corresponding author. Tel.: +45 45254720, Fax.: +45 45934570. E-mail address: [email protected] Post-print (final draft post-refereering) of article published in: Acta Materialia 54 (2006) 5102-5114 Journal homepage: www.elsevier.com/locate/actamat Hyperlink to article: http://www.sciencedirect.com/science/journal/13596454 Abstract Solidification of hypereutectic thin walled ductile cast iron has been modelled in 1-D taking into account the precipitation of off-eutectic austenite dendrites during solidification. The simulations have been compared with casting experiments on plate geometries with plate thicknesses from 2.8 mm to 8.0 mm with good agreement both on cooling curves and nodule counts. The experimental results revealed that the eutectic solidification of plates with thicknesses less than 4.3 mm was characterised by two stages; 1: An initial arrest and 2: The main eutectic reaction. The initial arrest was associated with the discovered austenite dendrites in these plates. Moreover, the experimental results confirm the numerical model’s prediction of off-eutectic austenite dendrites. The numerical model showed that the off-eutectic austenite dendrites mainly precipitate in the first stage before onset of the main eutectic solidification. Keywords Modelling, Thin walled casting, Iron Alloys, Solidification, Microstructure 1. Introduction In resent years the need to save energy and resources has forced designers to focus on light constructions. Traditionally, this has lead to increased use of light metals to save weight. The most commonly used light metals are inferior to the iron based alloys with respect to specific stiffness, yield and fatigue strength. To compensate for that, light metal parts are often strengthened by the use of larger cross sections or ribs that support the construction. Another way to create light constructions is to optimize the use of iron based materials in extremely thin-walled parts. In castings this means that complex parts such as manifolds or engine blocks should be designed with wall thicknesses down to 2 mm, [1]. Production of such parts are inherently difficult from a process point of view, but the need to save resources has forced manufacturers to improve their skills, and today more and more extremely thin-walled products are being made in ductile and vermicular cast iron.
1
Post-print of article published in Acta Materialia 54 (2006) 5102-5114 Hyperlink to article: http://www.sciencedirect.com/science/journal/13596454
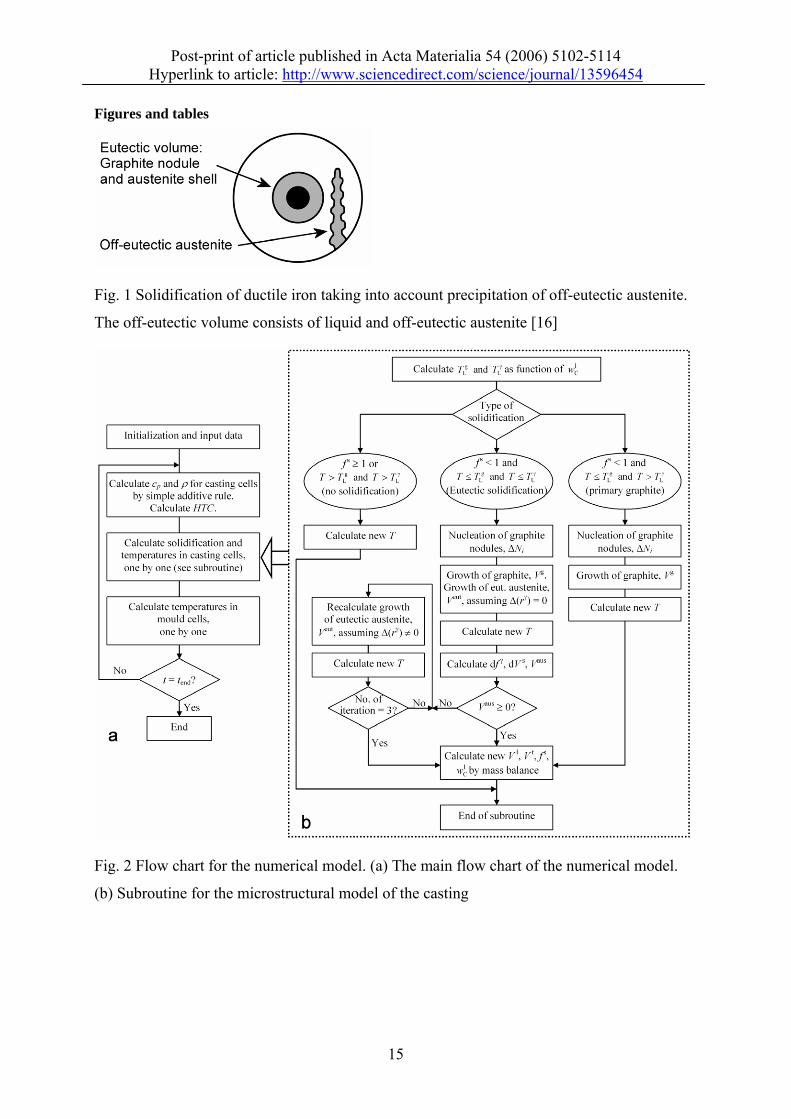
When wall thicknesses are reduced, cooling rates are increased, and this influences the microstructure and properties of the materials. In ductile cast iron it is well known that to successfully produce very thin-walled components, the carbon equivalent should be high, preferably hypereutectic, to avoid formation of primary carbides, [2-4]. During solidification of ductile iron both graphite nodules and austenite are nucleated. These two phases are probably growing independently in the melt in the beginning but at some point the graphite nodules are surrounded by austenite shells and further growth of the graphite nodules will be controlled by diffusion of carbon through the austenite shell. In numerical models of solidification of ductile iron it has therefore been assumed that small eutectic cells of graphite nodules surrounded by an austenite shell are formed at the onset of eutectic solidification. The growth of these graphite nodules are then controlled by diffusion of carbon through the austenite shell [2]. This can lead to reasonable results concerning cooling rates and nodule count. Examples of numerical simulations based on these assumptions are Chen et al. who have been looking at the volume change during solidification [5]. Almansour et al. have included the segregation of Si during solidification, which has an influence on the liquidus line of the graphite and austenite in the Fe-C-Si phase diagram [6]. Onsøien et.al have included the nucleation and growth of carbide and eutectoid reaction in the model being able to predict the microstructure at room temperature [7]. All these works are mainly based on eutectic solidification but in hypoeutectic iron, formation of primary austenite as dendrites will take place [8, 9]. The presence of primary dendrites has been incorporated as an equivalent sphere representing the dendritic grains in the modelling by Chang et al. [10]. Austenite dendrites can, however, also be present in hypereutectic ductile iron [11-13]. The presence of austenite dendrites seems to be even more pronounced in thin walled castings [14]. While the growth of flake graphite iron is shell-like, the growth of ductile iron is equiaxed, increasing the risk of shrinkage porosities [15]. The presence of off-eutectic austenite dendrites will block intergranular melt flow and hence increase the risk of formation of porosities. Lesoult et al. have therefore proposed a model that takes into account the presence of austenite dendrites, which they call off-eutectic austenite, see Fig. 1 [16]. This model constituted a major step forward in the modelling of microstructure in ductile cast iron. The implementation of the solidification model had however some limiting assumptions concerning the thermal field conditions [17]. Originally this solidification model was validated with experimental results from castings of cylinders with diameters from 9 to 62 mm [17]. The validation of the model showed good agreement with experimental results concerning nodule count and undercooling during solidification. For the large diameters (32 and 62 mm) the simulated cooling curves showed relatively good agreement with the experimental cooling curves [17]. For smaller diameters (9 mm and 16 mm) it is however difficult to compare the experimental and simulated temperature curves in the temperature-time graph because of the time scale used. The
2
Post-print of article published in Acta Materialia 54 (2006) 5102-5114 Hyperlink to article: http://www.sciencedirect.com/science/journal/13596454
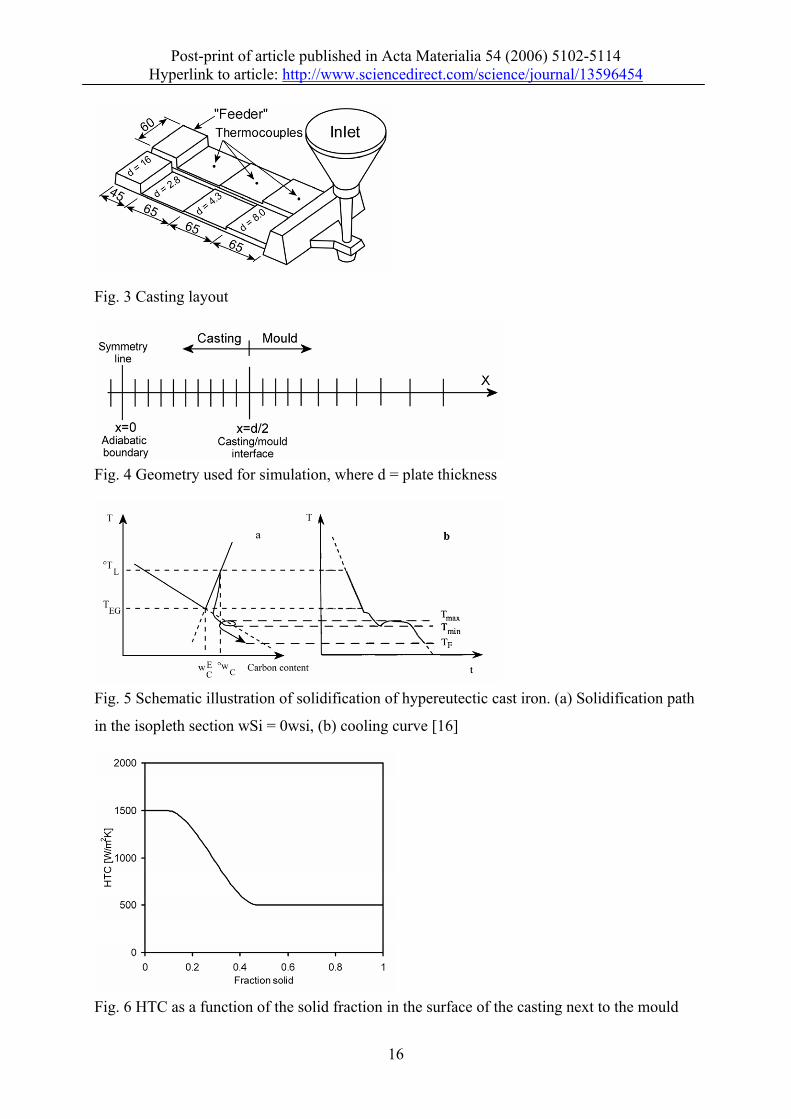
solidification time though seems to be far too long for the small cylinders [17]. Redoing the numerical simulations and comparing with the experimental results presented in [18] also shows that the simulated solidification time is in the range of 60-70% too long for the smaller diameters. This difference may be explained by the fact that the thermal analysis in [17] was based on a simple lumped approach in combination with Chvorinov´s rule not taking into account the heat transfer coefficient between the casting and the mould which can be very important for thinner castings. Furthermore, the cooling condition was determined by the experimental cooling rates at 1000 °C and not on e.g. solidification time. Also the validation of the presence of off-eutectic austenite in the experiments was not very clear [17]. Concerning the validation of the presence of off-eutectic austenite in the experiments there was not in the material presented a clear evidence of this in the casting experiments. The only prediction of off-eutectic austenite in the casting was based on the experimentally measured cooling curve. For the two largest diameters (62 and 32 mm) there was a change in slope on the cooling curves slightly before the eutectic plateau which could be interpreted as nucleation and growth of off-eutectic austenite [17]. The temperature was however measured in the centre of the cylinders [18]. So, this change in slope could therefore also be explained by the eutectic solidification having started at the edge of the cylinders leading to a decrease of the cooling rates in the centre of the cylinders. The aim of the present work is therefore to verify the numerical model from ref [16] with experimental results showing the presence of off-eutectic austenite dendrites in hypereutectic ductile cast iron. As the austenite dendrites seem to be more pronounced in thin walled castings than in thicker castings [14], thin walled castings will be the main focus of the paper. In order to improve the thermal analysis the solidification model is implemented in a transient 1D description, enabling an investigation of the effect of the heat transfer coefficient and the thermal gradients in both casting and mould on the evolution of microstructure in hypereutectic thin walled castings. 2. Numerical model The numerical model is presented in the following. For an overview, a flow chart is given in Fig. 2, including the microstructural model for the solidification process of ductile iron, Fig. 2b. 2.1 Geometry The casting layout is shown in Fig. 3. The three plate-shaped parts of the casting (d = 2.8 mm; d = 4.3 mm and d = 8.0 mm) are all modelled by a 1D plate geometry, see Fig. 4. An adiabatic boundary at the symmetry line in the centre of the plate is assumed. The interface between the casting and the mould will then be located at x = d/2 where d is the plate thickness. 10 cells of uniform width were used in the casting corresponding to Δx = d/20. The cases of d = 2.8 mm, 4.3 mm and 8.0 mm were analysed resulting in Δx = 0.00014 m, 0.000215 m and 0.0004 m for the three cases respectively. The mould was about 150 mm thick and divided into 80 cells of increasing cell size with increasing distance from the casting. The resulting
3
Post-print of article published in Acta Materialia 54 (2006) 5102-5114 Hyperlink to article: http://www.sciencedirect.com/science/journal/13596454
mesh arrangement for the simulation is shown in Table 1. The time step was set to a value just below the critical time step for the explicit formulation in each case. 2.2 Heat conduction model In general, the temperatures in the casting and the mould are governed by the 1D heat conduction equation, i.e.
genpT Tρc kt x x
∂ ∂ ∂⎛ ⎞ Q′′′= +⎜ ⎟∂ ∂ ∂⎝ ⎠& (1)
where T is temperature, t is time, ρ is density, cp is specific heat capacity and k is thermal
conductivity. The source term 3gen[Q W m′′′& ] is zero for the mould and for the casting is given by
s
genddfQ Hρt
′′′ = Δ& (2)
where ΔH is the latent heat and f s is fraction solid. The spatial discretisation of Eq. (1) is accomplished by a cell-centred finite volume method applying a straightforward formulation based on thermal resistances [19]. The time integration is carried out by a simple explicit method. The time step was kept below the explicit stability limit at all times. 2.3 Microstructural model The microstructural model is based on the model developed by Lesoult et al. [16, 17] and will shortly be described in the following, including some of the main governing equations. The solidification sequence of a hypereutectic casting is schematically shown in Fig. 5. Nucleation and growth of free graphite nodules in the liquid will start when the temperature reaches the graphite-liquidus line in the phase diagram. Both nucleation and growth of graphite nodules are difficult processes and the solidification path will therefore take place somewhere below the graphite liquidus line. The growth of primary graphite nodules will continue until the temperature reaches the extrapolation of the austenite liquidus line, where the eutectic solidification will start. At that point all the graphite nodules will be encapsulated in austenite shells and further growth of the graphite nodules will be controlled by diffusion. After reaching the extrapolation of the austenite liquidus line, further undercooling may be necessary before the number of graphite nodules and the driving force for growth is high enough to create a recalescence. The eutectic solidification will continue until the end of the solidification marked by TF in Fig. 5. 2.3.1 Solidification of primary graphite The first part of every time step is the nucleation of graphite nodules. The number of nucleated graphite nodules in time step i, ΔNi, is governed by the undercooling with respect to the graphite liquidus, ΔTL
g:
( ) ( ) ( )
( ) 00
0d
ddd
d
gL
gL
gLoffl1g
L
<Δ
=Δ
>ΔΔ
Δ=Δ−
dtTdwhenN
tTwhent
tTVfTAN
i
nni
(3)
4
Post-print of article published in Acta Materialia 54 (2006) 5102-5114 Hyperlink to article: http://www.sciencedirect.com/science/journal/13596454
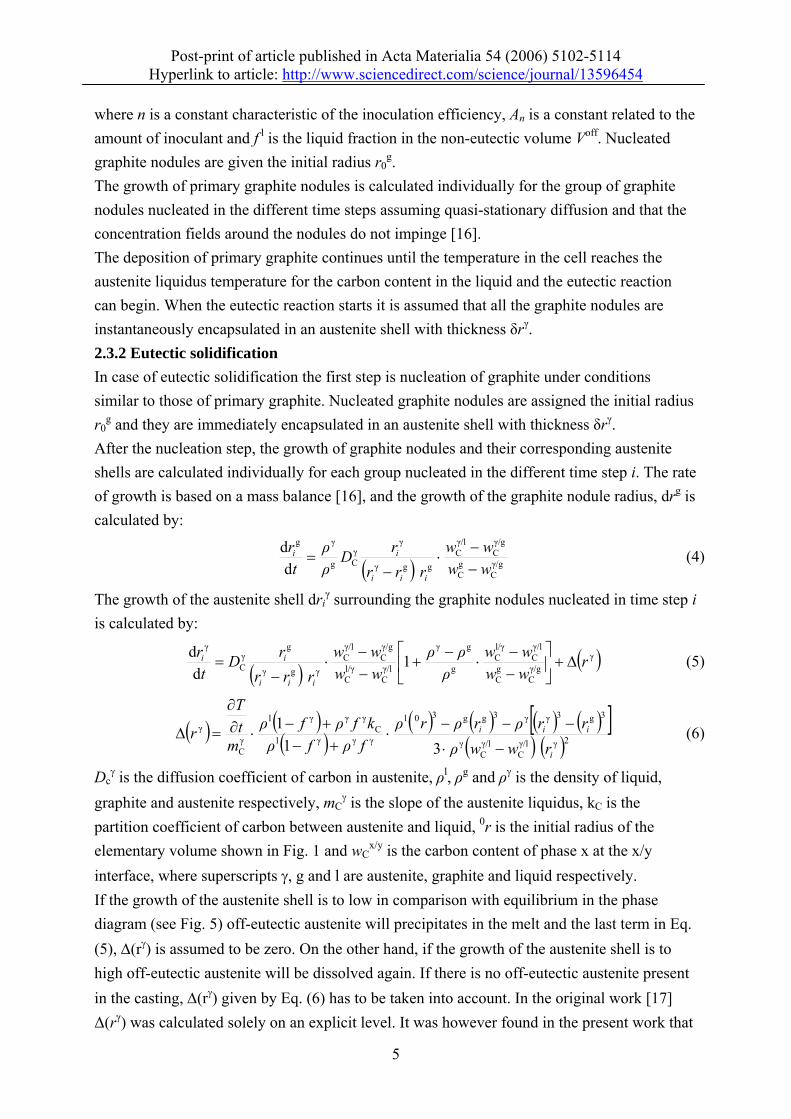
where n is a constant characteristic of the inoculation efficiency, An is a constant related to the amount of inoculant and f l is the liquid fraction in the non-eutectic volume Voff. Nucleated graphite nodules are given the initial radius r0
g. The growth of primary graphite nodules is calculated individually for the group of graphite nodules nucleated in the different time steps assuming quasi-stationary diffusion and that the concentration fields around the nodules do not impinge [16]. The deposition of primary graphite continues until the temperature in the cell reaches the austenite liquidus temperature for the carbon content in the liquid and the eutectic reaction can begin. When the eutectic reaction starts it is assumed that all the graphite nodules are instantaneously encapsulated in an austenite shell with thickness δrγ. 2.3.2 Eutectic solidification In case of eutectic solidification the first step is nucleation of graphite under conditions similar to those of primary graphite. Nucleated graphite nodules are assigned the initial radius r0
g and they are immediately encapsulated in an austenite shell with thickness δrγ. After the nucleation step, the growth of graphite nodules and their corresponding austenite shells are calculated individually for each group nucleated in the different time step i. The rate of growth is based on a mass balance [16], and the growth of the graphite nodule radius, drg is calculated by:
( ) γ/gC
gC
γ/gC
γ/lC
ggγ
γγCg
γg
dd
wwww
rrrrD
ρρ
tr
iii
ii
−−
⋅−
= (4)
The growth of the austenite shell driγ surrounding the graphite nodules nucleated in time step i
is calculated by:
( ) ( )γγ/gC
gC
γ/lC
l/γC
g
gγ
γ/lC
l/γC
γ/gC
γ/lC
γgγ
gγC
γ
1d
d rwwww
ρρρ
wwww
rrrrD
tr
iii
ii Δ+⎥⎦
⎤⎢⎣
⎡−−
⋅−
+−−
⋅−
= (5)
( ) ( )( )
( ) ( ) ( ) ( )[ ]( ) ( )2γγ/l
Cγ/lC
γ
3g3γγ3gg30l
γγγlC
γγγl
γC
γ
311
i
iii
rwwρrrρrρrρ
fρfρkfρfρ
mtT
r−⋅
−−−⋅
+−+−
⋅∂∂
=Δ (6)
Dcγ is the diffusion coefficient of carbon in austenite, ρl, ρg and ργ is the density of liquid,
graphite and austenite respectively, mCγ is the slope of the austenite liquidus, kC is the
partition coefficient of carbon between austenite and liquid, 0r is the initial radius of the elementary volume shown in Fig. 1 and wC
x/y is the carbon content of phase x at the x/y interface, where superscripts γ, g and l are austenite, graphite and liquid respectively. If the growth of the austenite shell is to low in comparison with equilibrium in the phase diagram (see Fig. 5) off-eutectic austenite will precipitates in the melt and the last term in Eq. (5), Δ(rγ) is assumed to be zero. On the other hand, if the growth of the austenite shell is to high off-eutectic austenite will be dissolved again. If there is no off-eutectic austenite present in the casting, Δ(rγ) given by Eq. (6) has to be taken into account. In the original work [17] Δ(rγ) was calculated solely on an explicit level. It was however found in the present work that
5
Post-print of article published in Acta Materialia 54 (2006) 5102-5114 Hyperlink to article: http://www.sciencedirect.com/science/journal/13596454
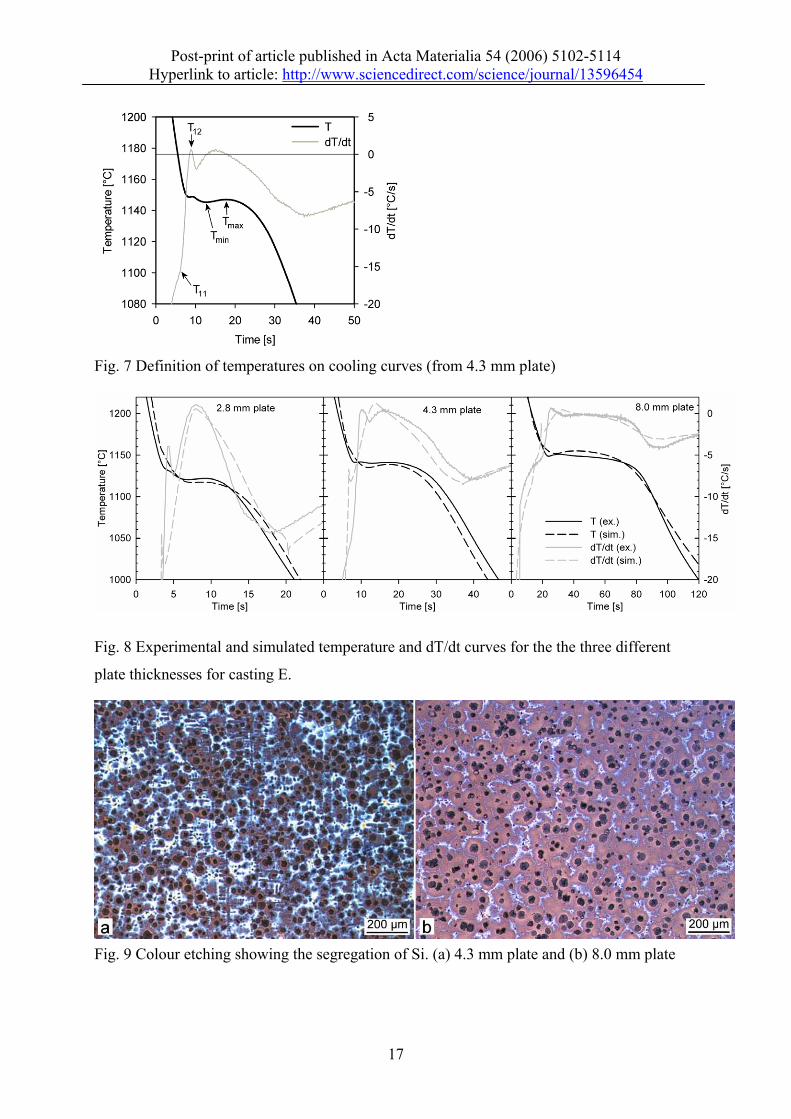
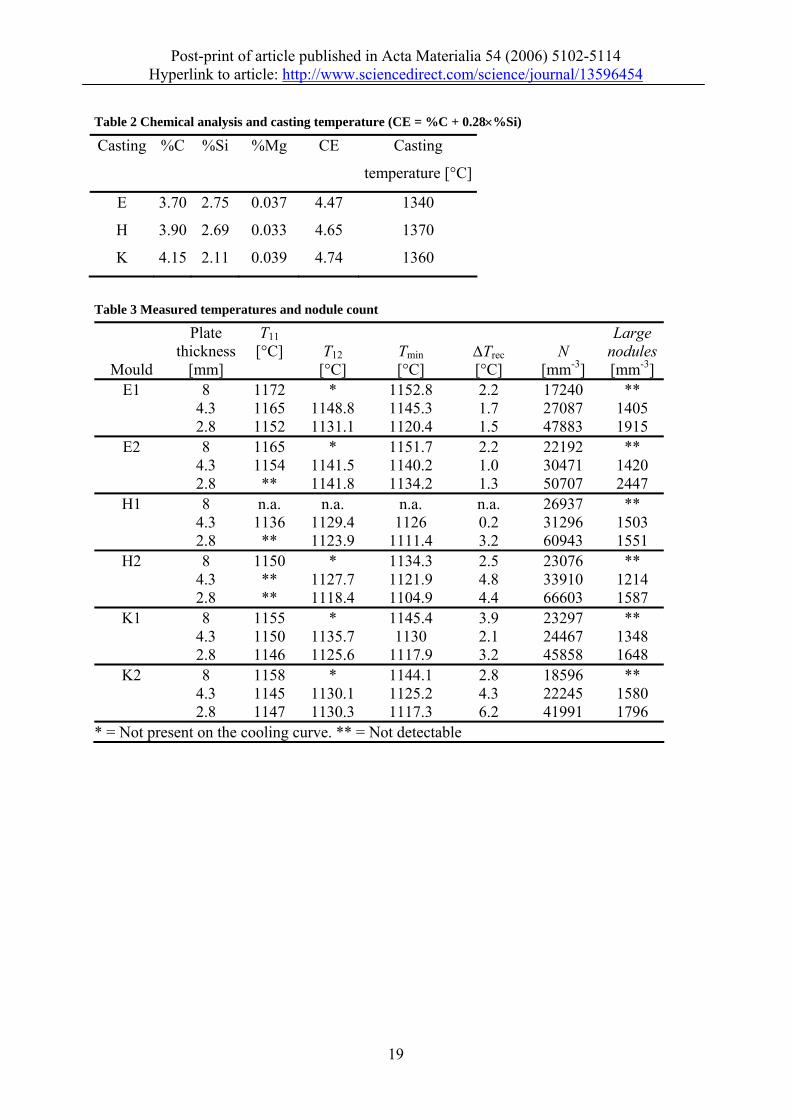
using a simple iteration process, involving the growth of the austenite shell and calculation of the new temperature, the calculation became more stable. Only three iterations were enough and further iterations did not improve the calculations, see Fig. 2 2.4 Heat transfer coefficient The heat transfer coefficient, HTC, between the casting and mould will have an influence on the results of the numerical simulations. A constant HTC has previously been used in the present numerical model resulting in some deviation between experiments and simulations [20]. However, the HTC typically has its maximum in the beginning when the entire casting is liquid and it decreases when solidification starts on the surface of the casting and an air gap can be formed [21-23]. This has also been reported for thin plates [24]. It is therefore assumed that the HTC will decrease during solidification of the casting. In the work by Almansour et al. [6] the HTC depends on the temperature. Above the eutectic temperature, TEG, the HTC was constant 1884 W m-2 K-1. At TEG the HTC abruptly decreases to 754 W m-2 K-1 and was decreasing further with decreasing temperature, [6]. There can, however, be some undercooling in the casting before the onset of the eutectic reaction, especially in thin walled castings, and it is thus more reasonable to use the fraction solid as the governing parameter for the HTC. Although ductile cast iron solidifies in an equiaxed manner there will be formed an austenite shell on the surface of the casting relatively early in the solidification. Consequently it has been chosen that the HTC decreases in the first part of the solidification process as shown in Fig. 6. 3. Casting experiments The numerical model is evaluated by comparing with experimental results from [25]. The experiments and results will briefly be described in the following. Three different hypereutectic castings were produced in batches of 90 kg. The chemical analyses of the castings are shown in Table 2. The melt was superheated to 1520°C before being poured into a preheated ladle for magnesium treatment with a Fe-Si-Mg alloy using a tundish sandwich method. The melt for each mould was then poured into a small insulated fiber cup where it was inoculated with 0.1 % to 0.2 % Fe-Si alloy before it was poured into the mould. The casting temperature was measured in the fiber cup with an S-type thermocouple. The casting temperatures are shown in Table 2. The moulds were made of sodium silicate chemically bonded sand. The casting layout shown in Fig. 3 had plates with thicknesses of 8.0, 4.3 and 2.8 mm. The temperature was measured in the middle of each plate using K-type thermocouples with a 0.2 mm wire. The sample rate for the temperature measurements was 500 Hz and every 100 values were averaged to reduce noise giving a time increment of 0.2 second. Further details about temperature measurement can be found in [25-27]. Some key points on the cooling curve, showing different stages of solidification are shown in Fig. 7. Tmin and Tmax are the minimum and maximum temperatures during the eutectic solidification. The recalescence ΔTrec is defined as the difference Tmax – Tmin. T11 is defined as the temperature where there is an abrupt increase in the slope of the dT/dt curve. T12 is
6
Post-print of article published in Acta Materialia 54 (2006) 5102-5114 Hyperlink to article: http://www.sciencedirect.com/science/journal/13596454
defined as the temperature where there is a maximum on the dT/dt curve before the Tmin. Examples of cooling curves for the three different plate thicknesses are shown in Fig. 8. For the 2.8 and 4.3 mm plates the solidification was divided into two stages with a local maximum (T12) and minimum on the dT/dt curve before the main eutectic reaction. This local maximum/minimum was present on all the 2.8 and 4.3 mm plates but not in any of the 8.0 mm plates. The peak on the dT/dt curve observed for the 2.8 and 4.3 mm plates has previously been reported for a 3 mm thick plate where it was associated with growth of primary graphite [28]. The volume of primary graphite is however too small to explain the size of the peak in both [28] and the present work. The growth of primary graphite can give a primary solidification arrest on the cooling curve but this will only occur in strongly hypereutectic castings and it will be much smaller than on the present cooling curves [29]. If the peak was related to growth of primary graphite it should also have been present in the 8.0 mm plates but this is not the case. The development of the peak on the dT/dt curve in the 2.8 and 4.3 mm plate must therefore include some growth of the austenite phase. Characterization of the graphite morphology and the matrix microstructure was performed on cross sections of the plates close to the thermocouples. The graphite morphology was characterized using image analysis. The two dimensional spatial size distribution of nodules was converted to a three dimensional size distribution by Schwarts-Saltykov analysis [30]. All the surface and volume size distributions of the nodule size were bimodal with a minimum diameter corresponding to about 5- 8 µm. Particles below this minimum were neglected in the nodule counts as these probably are small inclusions resulting from the magnesium treatment or micro porosities. In the 2.8 and 4.3 mm plates there was also a group with few large nodules, see Table 3. The number of the larger nodules was higher in the 2.8 than in the 4.3 mm plates. The 8.0 mm plates may also have a group of large nodules but it was not possible from the size distribution to identify this. There were no carbides in the castings except from the 4.3 mm plates in casting H, where there were very little inverse chill carbides (<0.1%) in the centre of the pates. In order to reveal the solidification morphology of the casting, some samples from casting E were etched with Klemm I which reveals the segregation of Si during solidification [31]. Areas with high content of Si will be red/purple and areas with lower content of Si will be bright. In order to avoid the influence of the ferrite/pearlite matrix on the etching results, the samples for colour etching were heat treated to obtain a fully ferritic matrix. Examples of the found microstructures are shown in Figs. 9a+b. The graphite nodules are surrounded by areas with high content of Si. Areas with low Si content are located in between the graphite nodules. However in the 2.8 and 4.3 mm plates there were examples of dendritic structure with high Si content in the areas in between the graphite nodules, see Fig. 9a. It seems that these dendritic structures not were associated with corresponding graphite nodules. The dendritic structures mainly consisted of long and thin primary dendrite arms perpendicular to
7
Post-print of article published in Acta Materialia 54 (2006) 5102-5114 Hyperlink to article: http://www.sciencedirect.com/science/journal/13596454
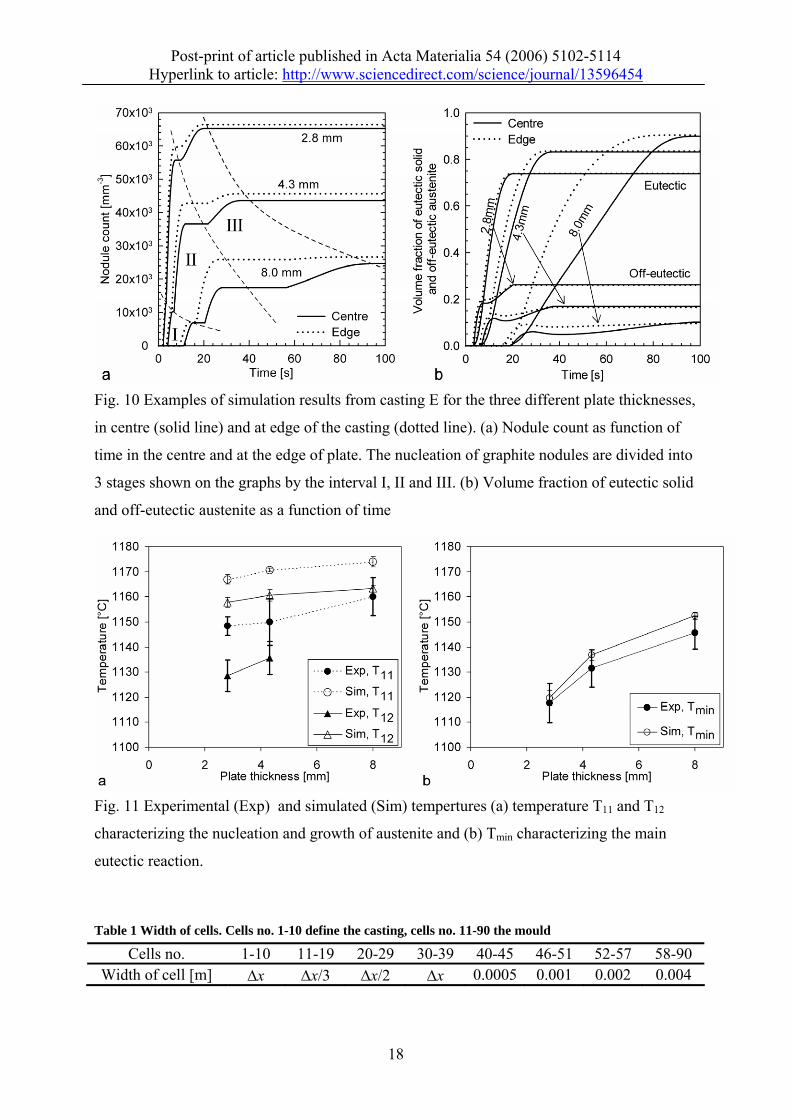
the surface of the castings. The thickness of the dendrites was 10 to 15 µm and some had a length of up to 700 µm. There were also small secondary dendrite arms with a length up to 100 µm. It was not possible to detect this thin dendritic structure in the 8.0 mm plate, see Fig. 9b. The main results from the experiments are shown in Table 3. The experimental results were similar for the different castings, exhibiting the same solidification morphology, although casting H had both higher undercooling and nodule count than the other castings. 4. Simulation results Examples of simulated cooling curves are shown in Fig. 8 together with the measured cooling curves. The simulated dT/dt curve had a maximum and minimum peak before the main eutectic reaction. This peak corresponds to that the temperature has reached the extended austenite-liquidus line in the phase diagram (see Fig. 5) where the austenite is nucleated and starts to grow. The peak on the dT/dt curve is followed by further undercooling before the main eutectic reaction and recalescence. The nodule count as function of time for the three different plate thicknesses is shown in Fig. 10a. The nucleation of graphite nodules is divided into three different stages as marked on the figure. The first stage is nucleation of primary graphite nodules in the hypereutectic region. This will continue until the growth of nucleated graphite nodules is in equilibrium with the cooling rate. The second stage of nucleation is when the temperature reaches the austenite liquidus starting the growth of off-eutectic austenite. As the carbon content in the liquid follows the austenite liquidus line, the undercooling with respect to the graphite liquidus line will increase and new graphite nodules will be nucleated until the onset of eutectic recalescence. The third stage of nucleation is in the last part of the solidification process where the temperature is decreasing again. The nodule counts are very similar in the centre and at the edge of the plates although there is a little difference in which stages the graphite nodules are nucleated, especially for the 8.0 mm plate. The volume fraction of eutectic solid and off-eutectic austenite as a function of time is shown in Fig. 10b. The simulation shows that the main part of the off-eutectic austenite is formed during the first few seconds after the temperature has reached the austenite-liquidus line and before the main eutectic recalescence. During the recalescence there is a small decrease in the amount of off-eutectic austenite. In the last part of the solidification the amount of off-eutectic austenite is increasing again. The amount of off-eutectic austenite is similar for the centre and the edge of the plate. Fig. 10b also shows that the solidification occurs as a mushy zone through the thickness of the plates, especially for the 2.8 and 4.3 mm plates. Although the difference between the centre and the edge becomes larger for the 8.0 mm plates, the growth still occurs through the plate thickness at the same time.
8
Post-print of article published in Acta Materialia 54 (2006) 5102-5114 Hyperlink to article: http://www.sciencedirect.com/science/journal/13596454
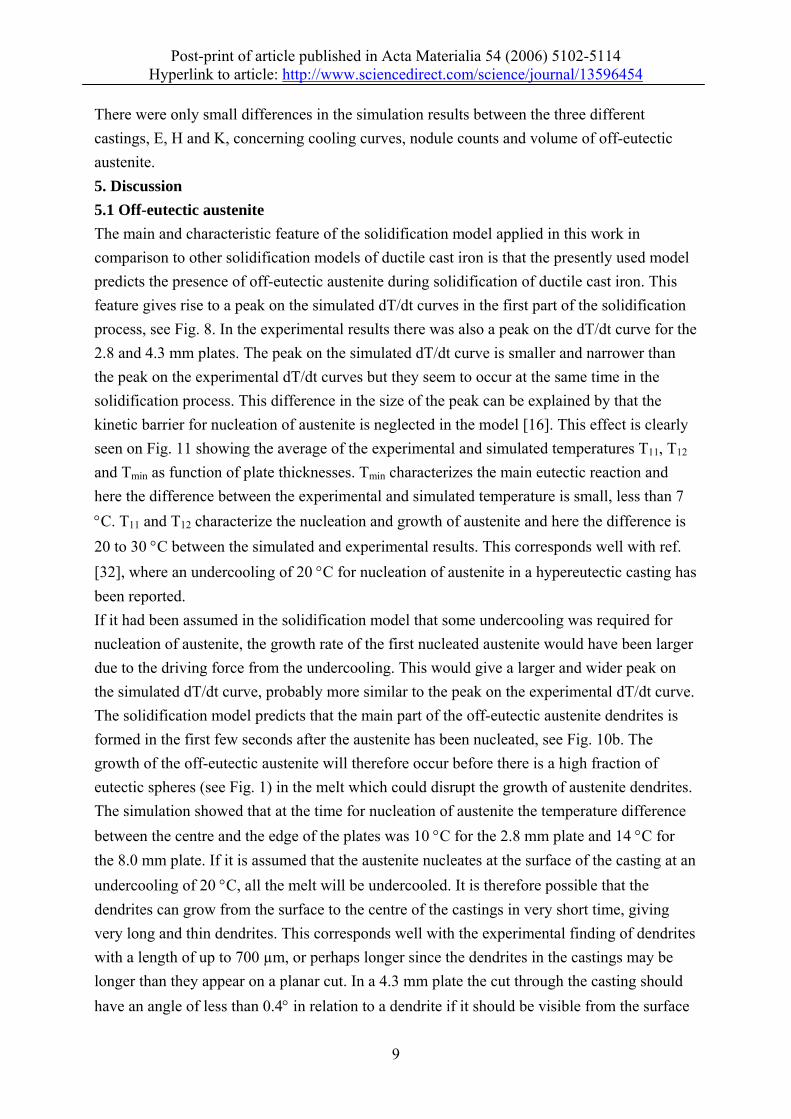
There were only small differences in the simulation results between the three different castings, E, H and K, concerning cooling curves, nodule counts and volume of off-eutectic austenite. 5. Discussion 5.1 Off-eutectic austenite The main and characteristic feature of the solidification model applied in this work in comparison to other solidification models of ductile cast iron is that the presently used model predicts the presence of off-eutectic austenite during solidification of ductile cast iron. This feature gives rise to a peak on the simulated dT/dt curves in the first part of the solidification process, see Fig. 8. In the experimental results there was also a peak on the dT/dt curve for the 2.8 and 4.3 mm plates. The peak on the simulated dT/dt curve is smaller and narrower than the peak on the experimental dT/dt curves but they seem to occur at the same time in the solidification process. This difference in the size of the peak can be explained by that the kinetic barrier for nucleation of austenite is neglected in the model [16]. This effect is clearly seen on Fig. 11 showing the average of the experimental and simulated temperatures T11, T12 and Tmin as function of plate thicknesses. Tmin characterizes the main eutectic reaction and here the difference between the experimental and simulated temperature is small, less than 7 °C. T11 and T12 characterize the nucleation and growth of austenite and here the difference is 20 to 30 °C between the simulated and experimental results. This corresponds well with ref. [32], where an undercooling of 20 °C for nucleation of austenite in a hypereutectic casting has been reported. If it had been assumed in the solidification model that some undercooling was required for nucleation of austenite, the growth rate of the first nucleated austenite would have been larger due to the driving force from the undercooling. This would give a larger and wider peak on the simulated dT/dt curve, probably more similar to the peak on the experimental dT/dt curve. The solidification model predicts that the main part of the off-eutectic austenite dendrites is formed in the first few seconds after the austenite has been nucleated, see Fig. 10b. The growth of the off-eutectic austenite will therefore occur before there is a high fraction of eutectic spheres (see Fig. 1) in the melt which could disrupt the growth of austenite dendrites. The simulation showed that at the time for nucleation of austenite the temperature difference between the centre and the edge of the plates was 10 °C for the 2.8 mm plate and 14 °C for the 8.0 mm plate. If it is assumed that the austenite nucleates at the surface of the casting at an undercooling of 20 °C, all the melt will be undercooled. It is therefore possible that the dendrites can grow from the surface to the centre of the castings in very short time, giving very long and thin dendrites. This corresponds well with the experimental finding of dendrites with a length of up to 700 µm, or perhaps longer since the dendrites in the castings may be longer than they appear on a planar cut. In a 4.3 mm plate the cut through the casting should have an angle of less than 0.4° in relation to a dendrite if it should be visible from the surface
9
Post-print of article published in Acta Materialia 54 (2006) 5102-5114 Hyperlink to article: http://www.sciencedirect.com/science/journal/13596454
to the centre of the casting. In addition to that, the presence of primary graphite nodules in the melt could also disrupt the growth of the dendrites which could limit the number of long dendrites. After the nucleation and growth of off-eutectic dendrites indicated by the peak on the dT/dt curve in the 4.3 and 2.8 mm plate, further undercooling is required before the number of nucleated graphite nodules is high enough to initiate the recalescence at the start of the main eutectic reaction. It was not possible to detect any dendritic structure in the microstructure of the 8.0 mm plates, see Fig. 9b. This could of course be due to that the cut through the casting was not parallel to the dendrites and they would therefore not be visible on the microstructure. However, the shape of the cooling curve was also different for the 8.0 mm plates in comparison with the 4.3 and 2.8 mm plates, Fig. 8. The 8.0 mm plates did not have a peak on the dT/dt curve before the main eutectic reaction as the thinner plates had. The simulated dT/dt curve has a peak before the main eutectic reaction, see Fig. 8, and the simulation also predicts some off-eutectic austenite in the 8.0 mm plates, see Fig. 10b. This difference is due to that the solidification model does not take into account the kinetic barrier for nucleation of austenite as previously discussed. As the 8.0 mm plates require less nucleated graphite nodules to initiate the main eutectic reaction and recalescence, this may occur at the same time as the austenite is nucleated. This explains why the peak on the experimental dT/dt curve for the eutectic reaction is larger than the same peak on the simulated dT/dt curve for the 8.0 mm plate, see Fig. 8, as the growth of both off-eutectic austenite and eutectic spheres contribute to the same peak. The growth of eutectic spheres may also intersect the growth of off-eutectic austenite dendrites, explaining why it was not possible to detect any dendritic structure in the 8.0 mm plates. 5.2 Nucleation of graphite nodules According to the simulation, the graphite nodules were nucleated in three steps, see Fig. 10a. The primary graphite nodules may correspond to the group of large nodules detected in the 4.3 and 2.8 mm plates, see Table 3. The simulated number of primary graphite nodules will increase with decreasing plate thicknesses as the experimental results also showed. The number of primary graphite nodules in the simulation is however in the range of 10000 to 15000 nodules⋅mm-3 while the number of large nodules in the experiments was in the range of 1200 to 2000 nodules⋅mm-3, almost a factor of 10 in difference. The growth of the primary graphite nodules is however based on a quasi-stationary diffusion of carbon, assuming that the concentration fields around the individual graphite nodules do not impinge. It is however more likely that the carbon concentration fields will impinge. According to [30] to the mean distance, Δl, between two nodules can be calculated by:
3
554.0N
l =Δ (7)
10
Post-print of article published in Acta Materialia 54 (2006) 5102-5114 Hyperlink to article: http://www.sciencedirect.com/science/journal/13596454
Having N = 2000 nodules⋅mm-3 the mean distance between two nodules will be Δl = 44×10-6 m. The concentration field of carbon, wc(r), around a graphite nodule as a function of radius, r, can be approximated by [33]:
( )⎟⎟
⎠
⎞
⎜⎜
⎝
⎛
⋅
−⋅⋅−−= ∞∞
tDrrerfc
rrwwwrw
lc
ggicccc
2)( (8)
where and is the carbon content of liquid, respectively far away and at the interface of
the graphite nodule, rg is the radius of the graphite nodule, Dcl is diffusion coefficient of
carbon in liquid and t is time. Assuming constant and , rg = 3×10⁻⁶ m and Dcl = 5×10⁻⁹
m2s-1, the concentration at r = 22×10-6 m will have changed by 5% of the concentration
difference after only 0.05 s, indicating the concentration fields is starting to impinge.
In the simulation, the time for growth of primary graphite nodules in the 2.8 mm plate was about 1.1 seconds and for the 4.3 mm plates 2.5 seconds. Hence, there will be some impingement of the concentration fields which will influence both the nucleation and growth of primary graphite nodules. It is therefore likely that the number of nucleated primary graphite nodules in the simulation is too high.
∞cw i
cw
∞cw i
cw
icc ww −∞
In the simulation the main group of the graphite nodules was nucleated before the eutectic recalescence at a certain undercooling. Decreasing plate thickness will increase both undercooling and nodule count as also the experiments showed. In the experiments, casting H had (probably due to small differences in the inoculation process) higher undercooling and by that also higher nodule count than the other casting, see Table 3. The higher undercooling seems also to give a higher recalescence due to the higher driving force for growth process. There was some graphite nodules nucleated at the end of the solidification process, see Fig. 10a. The graphite nodules nucleated at the end of the solidification process will probably be small, as there is only short time for the growth to take place. As the small graphite nodules were neglected in the total nodule count, the number of graphite nodules after stage II in Fig. 10a should be used when comparing the nodule count in the simulation with the experimental nodule count. 5.3 Influence of off-eutectic austenite on thin walled ductile iron Dendrites can form a coherent structure and by that impede intergranular melt flow. This will increase the risk of formation of shrinkage porosities. The dendritic structure is therefore normally undesirable in the solidification morphology [34, 35]. Depending on material the dendrite coherency can be formed already at a solid fraction of 10 percent [34]. In the present casting there were dendritic structures in the 2.8 and 4.3 mm plates and the porosities were actually more pronounced in the 2.8 and 4.3 mm plates than in the 8.0 mm plates. Based on the experiments and simulation off-eutectic austenite, dendrites seem to be formed in the thin plates in the first part of the solidification, during the decrease of the temperature between the nucleation of austenite and the main eutectic recalescence. From a metallurgical
11
Post-print of article published in Acta Materialia 54 (2006) 5102-5114 Hyperlink to article: http://www.sciencedirect.com/science/journal/13596454
point of view two different approaches may contribute to reducing the influence of off-eutectic austenite dendrites. One is to decrease the undercooling before the main eutectic recalescence; the other is to avert growth of large and coherent dendritic structures. Increasing the carbon equivalent of the melt is known to make the nucleation of graphite nodules easier and by that decreasing the undercooling before the onset of the main eutectic reaction. This did however not have a significant influence on the undercooling in the present work, neither in the experimental nor the numerical work. This is because the growth of the primary graphite nodules will consume carbon from the liquid which will limit the number of primary graphite nodules that can be nucleated. In turn, if the cast part also has thicker sections an increased carbon equivalent can give graphite flotation in these sections. A better method to decrease undercooling could be to improve the inoculation to give a higher nodule count. As the growth during the eutectic solidification is governed by diffusion (Eqs. (4) and (5)) a higher nodule count will decrease the undercooling. Concerning the latter approach it is maybe possible to suppress the growth of off-eutectic austenite. According to [35] reducing the oxidation and the superheat during melting could reduce the formation of austenite dendrites. The addition of 0.01% Bi did also reduce the formation of austenite dendrites [35]. This was however for larger castings with a solidification times of about 5 minutes. Whether this also will work in thin walled castings with short solidification time of 10 to 20 seconds and high undercooling has to be tested. If the austenite dendrites cannot be suppressed, a refinement could possible reduce the influence of off-eutectic austenite dendrites similar to the refinement treatment of aluminium castings [34]. 6. Conclusion A model describing the solidification of ductile cast iron taking into account the precipitation of off-eutectic austenite dendrites has been applied in a 1-D numerical framework. Results from the numerical simulations have been compared with experimental results from casting of plates with thicknesses of 2.8, 4.3 and 8.0 mm. There was good agreement between the simulations and experiments concerning both cooling curves and nodule counts. The solidification model predicts that the off-eutectic dendrites mainly will be formed in the first part of the solidification process. This is in agreement with experimental results for 2.8 and 4.3 mm plates. In the experiments the cooling curves for the 2.8 and 4.3 mm plates were characterised by two stages; 1: An initial arrest and 2: The main eutectic reaction. In the 8.0 mm plates there were only one main stage on the cooling curve. Dendrites were present in the 2.8 and 4.3 mm plates. The nucleation and growth of these dendrites was associated with stage 1 on the cooling curve. There was not observed dendrites in the 8.0 mm plates. The experimental results confirm the numerical model’s prediction of off-eutectic austenite dendrites. The numerical model shows that the off-eutectic austenite dendrites mainly precipitate in the first stage before the onset of the main eutectic solidification. The fraction of
12
Post-print of article published in Acta Materialia 54 (2006) 5102-5114 Hyperlink to article: http://www.sciencedirect.com/science/journal/13596454
off-eutectic austenite will according to the simulations increase with decreasing plate thicknesses. The kinetic barrier for nucleation of austenite should be taken into account for the prediction of off-eutectic austenite in thicker castings due to the lower undercooling required for initiating the main eutectic reaction. The simulation results show that the nucleation of graphite nodules can be divided into 3 stages: as primary graphite, in the first part of the eutectic solidification and in the last part of the solidification. The number of nucleated primary graphite nodules in the solidification model seems to be overestimated, mainly due to that the concentration field around the graphite nodules will impinge. Appendix For the phase diagram simple linear approximations were used, taken from [17]. The diffusion coefficient of carbon in austenite is based on an average between ref. [17, 36] and was set to
⎟⎠⎞
⎜⎝⎛ −××= −
TD 15260exp108.7 6γ
C (A1)
where temperature T is expressed in Kelvin. The initial temperature of the casting was set to 1400 °C in order to take the preheating during filling of the mould into account. The initial temperature of the mould was set to 25 °C. The other values used in the calculations are shown in Table A1. References
[1] Larsen P. PhD Thesis, Technical University of Denmark; 2004.
[2] Ductile Iron Handbook, Des Plaines, Illinois: American Foundrymen's Society, Inc.; 1992.
[3] Elliott R. Cast Iron Technology, London: Butterworths; 1988.
[4] Ductile Iron Molten Metal Processing, 2nd ed., Des Plaines, Illinois: American Foundrymen's Society, Inc.; 1986.
[5] Chen Q, Langer EW, Hansen PN. Scand J Metall 1995;24:48.
[6] Almansour A, Matsugi K, Hatayama T, Yanagisawa O. Mater Trans 1995;36:1487.
[7] Onsøien MI, Grong Ø, Gundersen Ø, Skaland T. Metall Mater Trans A 1999;30:1053.
[8] Rivera G, Boeri R, Sikora J. Mater Sci Tech 2002;18:691.
[9] Boeri R, Weinberg F. AFS Trans 1989;97:179.
[10] Chang S, Shangguan D, Stefanescu DM. Metall Trans A 1992;23:1333.
[11] Rivera G, Sikora J, Boeri R. AFS Trans 2003;979.
[12] Banerjee DK, Stefanescu DM. AFS Trans 1991;99:747.
[13] Benecke T, Venkateswaran S, Schubert WD, Lux B. The Foundryman 1994;89:355.
[14] Yeung CF, Zhao H, Lee WB. Mater Charact 1998;40:201.
13
Post-print of article published in Acta Materialia 54 (2006) 5102-5114 Hyperlink to article: http://www.sciencedirect.com/science/journal/13596454
[15] Stefanescu DM. Science and Engineering of Casting Solidification. New York: Kluwer Academic / Plenum Publishers; 2002.
[16] Lesoult G, Castro M, Lacaze J. Acta Mater, 1998;46:983.
[17] Lacaze J, Castro M, Lesoult G. Acta Mater, 1998;46:997.
[18] Castro M, Alexandre P, Lacaze J, Lesoult G. Physical metallurgy of cast iron IV. Materials Research Society, 1990;433.
[19] Hattel J, Fundamentals of Modelling of Casting Processes. 1 ed., Kgs. Lyngby, Denmark: Polyteknisk Forlag; 2005.
[20] Pedersen KM, Hattel J, Tiedje N. In: Gardin CA, Bellet M, editors. Modeling of Casting, Welding and Advanced Solidification Processes XI, TMS. 2006:545.
[21] Coone N, Browne DJ, Hussey M, O'Mahoney D. In: Kongoli F, Thomas GB, Sawamiphakdi K , editors. Modeling, Control and Optimization in Ferrous and NonFerrous Industry. 2003;343.
[22] Lau F, Lee WB, Xiong SM, Liu BC. J Mater Process Tech 1998;79:25.
[23] Zeng XC, Pehlke RD. AFS Trans 1985;93:275.
[24] Woodbury KA, Chen Y, Parker JK, Piwonka TS. AFS Trans 1998;106:705.
[25] Pedersen KM. PhD Thesis, Technical University of Denmark. 2005.
[26] Pedersen KM, Tiedje N. Temperature measurement during solidification of thin wall ductile cast iron. Part 1: Theory and experiment. Measurement, in press, doi:10.1016/j.measurement.2007.05.002
[27] Pedersen KM, Tiedje N. Temperature measurement during solidification of thin wall ductile cast iron. Part 2: Numerical simulations. Measurement, in press, doi:10.1016/j.measurement.2007.05.003
[28] Labrecque C, Gagné M. AFS Trans 2000;108:31.
[29] Chaudhari MO, Heine RW, Loper CRJr. AFS Trans 1974;82:431.
[30] Underwood EE. Quantitative Stereology. Addison-Wesley Publishing Company; 1970.
[31] Weck E, Leistner E. Metallographic instructions for colour etching by immersion. Düsseldorf: Deutsher Verlag für Schweisstechnik (DVS) GmbH; 1982.
[32] Mizoguchi T, Perepezko JH. Mater Sci Eng A, 1997;226-228:813.
[33] Carslaw HS, Jaeger JC. Conduction of heat in solids. 2nd ed. Oxford: Clarendon Press; 1959.
[34] Dahle AK, Arnberg L. JOM 1996;48:34.
[35] Parks TW, Loper CRJr. AFS Trans 1969;77:90.
[36] Ågren J. Scripta Metall 1986;20:1507.
14
Post-print of article published in Acta Materialia 54 (2006) 5102-5114 Hyperlink to article: http://www.sciencedirect.com/science/journal/13596454
Figures and tables
Fig. 1 Solidification of ductile iron taking into account precipitation of off-eutectic austenite.
The off-eutectic volume consists of liquid and off-eutectic austenite [16]
Fig. 2 Flow chart for the numerical model. (a) The main flow chart of the numerical model.
(b) Subroutine for the microstructural model of the casting
15
Post-print of article published in Acta Materialia 54 (2006) 5102-5114 Hyperlink to article: http://www.sciencedirect.com/science/journal/13596454
Fig. 3 Casting layout
Fig. 4 Geometry used for simulation, where d = plate thickness
Fig. 5 Schematic illustration of solidification of hypereutectic cast iron. (a) Solidification path
in the isopleth section wSi = 0wsi, (b) cooling curve [16]
Fig. 6 HTC as a function of the solid fraction in the surface of the casting next to the mould
16
Post-print of article published in Acta Materialia 54 (2006) 5102-5114 Hyperlink to article: http://www.sciencedirect.com/science/journal/13596454
Fig. 7 Definition of temperatures on cooling curves (from 4.3 mm plate)
Fig. 8 Experimental and simulated temperature and dT/dt curves for the the three different
plate thicknesses for casting E.
Fig. 9 Colour etching showing the segregation of Si. (a) 4.3 mm plate and (b) 8.0 mm plate
17
Post-print of article published in Acta Materialia 54 (2006) 5102-5114 Hyperlink to article: http://www.sciencedirect.com/science/journal/13596454
Fig. 10 Examples of simulation results from casting E for the three different plate thicknesses,
in centre (solid line) and at edge of the casting (dotted line). (a) Nodule count as function of
time in the centre and at the edge of plate. The nucleation of graphite nodules are divided into
3 stages shown on the graphs by the interval I, II and III. (b) Volume fraction of eutectic solid
and off-eutectic austenite as a function of time
Fig. 11 Experimental (Exp) and simulated (Sim) tempertures (a) temperature T11 and T12
characterizing the nucleation and growth of austenite and (b) Tmin characterizing the main
eutectic reaction.
Table 1 Width of cells. Cells no. 1-10 define the casting, cells no. 11-90 the mould
Cells no. 1-10 11-19 20-29 30-39 40-45 46-51 52-57 58-90 Width of cell [m] Δx Δx/3 Δx/2 Δx 0.0005 0.001 0.002 0.004
18
Post-print of article published in Acta Materialia 54 (2006) 5102-5114 Hyperlink to article: http://www.sciencedirect.com/science/journal/13596454
Table 2 Chemical analysis and casting temperature (CE = %C + 0.28×%Si)
Casting %C %Si %Mg CE Casting
temperature [°C]
E 3.70 2.75 0.037 4.47 1340
H 3.90 2.69 0.033 4.65 1370
K 4.15 2.11 0.039 4.74 1360
Table 3 Measured temperatures and nodule count
Mould
Plate thickness
[mm]
T11 [°C] T12
[°C] Tmin [°C]
ΔTrec [°C]
N [mm-3]
Large nodules [mm-3]
E1 8 1172 * 1152.8 2.2 17240 ** 4.3 1165 1148.8 1145.3 1.7 27087 1405 2.8 1152 1131.1 1120.4 1.5 47883 1915
E2 8 1165 * 1151.7 2.2 22192 ** 4.3 1154 1141.5 1140.2 1.0 30471 1420 2.8 ** 1141.8 1134.2 1.3 50707 2447
H1 8 n.a. n.a. n.a. n.a. 26937 ** 4.3 1136 1129.4 1126 0.2 31296 1503 2.8 ** 1123.9 1111.4 3.2 60943 1551
H2 8 1150 * 1134.3 2.5 23076 ** 4.3 ** 1127.7 1121.9 4.8 33910 1214 2.8 ** 1118.4 1104.9 4.4 66603 1587
K1 8 1155 * 1145.4 3.9 23297 ** 4.3 1150 1135.7 1130 2.1 24467 1348 2.8 1146 1125.6 1117.9 3.2 45858 1648
K2 8 1158 * 1144.1 2.8 18596 ** 4.3 1145 1130.1 1125.2 4.3 22245 1580 2.8 1147 1130.3 1117.3 6.2 41991 1796
* = Not present on the cooling curve. ** = Not detectable
19
Post-print of article published in Acta Materialia 54 (2006) 5102-5114 Hyperlink to article: http://www.sciencedirect.com/science/journal/13596454
Table A1 Selected values used in the calculations (superscript l is liquid, s is solid, γ is austenite, g is
graphite, c is casting and m is mould)
Parameter Value Density ρl 6800 kg m-3
ργ 7000 kg m-3
ρg 2200 kg m-3
ρm 1550 kg m-3
Specific heat capacity cpl 920 J K-1 kg-1
cps 750 J K-1 kg-1
cpm 1200 J K-1 kg-1
Thermal conductivity kc 25 W K-1 m-1
km 0.9 W K-1 m-1
Latent heat of casting ΔH 2.0×10⁵ J kg-1
Enthalpy of dissolution of graphite in liquid ΔHg 1.62×10⁶ J kg-1
Nucleation parameter An 2.5×10¹¹ m-3 K-n
Nucleation parameter n 1 Parameter for growth of primary graphite nodules in liquid K 1 Initial radius of nucleated graphite nodules r0
g 0.5×10⁻⁶ m Initial thickness of austenite shell around graphite nodules δrγ 1×10⁻⁶ m Diffusion coefficient of C in liquid DC
l 5.0×10⁻⁹ m2 s-1
Distribution coefficient of C between austenite and liquid kC 0.47
20


![Modelling Damage in Thin-Walled Structures [Keynote speaker]€¦ · MODELLING DAMAGE IN THIN-WALLED COMPOSITE STRUCTURES Brian G. Falzon 1*, Wei Tan1, Louis N.S. Chiu 2 1 School](https://img.pdfslide.us/doc/110x75/610a63ae8e20116cb8052a08/modelling-damage-in-thin-walled-structures-keynote-speaker-modelling-damage-in.jpg)