Embed Size (px)
Citation preview
Appl. Math. Inf. Sci. 7, No. 3, 999-1004 (2013) 999
Applied Mathematics & Information SciencesAn International Journal
c⃝ 2013 NSPNatural Sciences Publishing Cor.
Visualization of Buckling on Thin-walled CylindricalShell by Digital Image Correlation Method
C. Zhao1,2, H. Matsuda3, S. Lou1,∗, C. Morita3 and A. Koga4
1Key Laboratory of Geotechnical and Underground Engineering of Ministry of Education, Tongji University, Shanghai 200092, China2Dept. of Geotechnical Engineering, Tongji University, Shanghai 200092, China3Dept. of Structural Engineering, Nagasaki University, 1-14, Bunkyo Machi, Nagasaki, 852-8521 Japan4Information Media Center of Nagasaki University, 1-14, Bunkyo Machi, Nagasaki, 852-8521 Japan
Received: 23 Jul. 2012, Revised: 12 Sep. 2012, Accepted: 1 Oct. 2012Published online: 1 Feb. 2013
Abstract: The problem of buckling stability is very important in thin-walled cylindrical shell structure. In order to investigate thebuckling phenomena, digital image correlation (DIC) method was applied in this experiment. The specimens have a thickness of0.131mm and the ratio of external diameter (R0) to thickness (H) R0/H is 252. Due to its curved and thin walled elements, measurementof displacement and strains by using the traditional methods is difficult, because there is not enough space for sticking necessary torsiongauges to measure the out-of-plane behaviour, even if it is possible, the rigidity of the gauge itself will have an effect on the bucklingstrength. However, by using the optical image correlation method, the problem is solved. DIC method is an optical instrument whichutilizes the full-field and non-contact measurement to gauge the three-dimensional displacement and strains on materials and structuralparts. In this paper three dimensional digital image correlation system is applied to observe the buckling generation process in detailsand make a record of the surface displacement during the compression test by using two high resolution digital cameras, then the testdata are analyzed and compared by a special correlation technique which can determine the surface displacements of cylindrical shellsand it is shown in colour contour in full-field region. The buckling strengths obtained by the theoretical and experimental methods arecompared and discussed in this paper. The experimental study shows that the buckling strength of theoretical value is much higher thanthat of experimental one, because the buckling strength is highly dependent on the imperfections.
Keywords: Digital image correlation method, Buckling, Thin-walled cylindrical shell, Compression test
1. Introduction
Cylinder shells combine light weight with high strength,they are widely used in the most diverse branches of civilengineering technologies, such as pipelines, aerospace,shell roofs, liquid-retaining structures and petrol tanks.S.Aghajari and H. Showkati (2006). As to this kind ofstructure, the governing failure mode is frequentlybuckling under axial compression. A lot of research hasbeen undertaken on the buckling strength of this kind ofstructures. NASA (1968); J. Singer and R.T. Haftka(1975); A.N. Kounadis (2006). Many researches weredone on theoretical solution of the elastic buckling due tothe axial compression of the cylindrical shell, which islocated as basic problem of buckling of the shell. Thetheoretical analysis finished by S.P. Timoshenko (1961)was one of the most representatives. N. Yamaki (1984)
also did some theoretical analysis on this item. It was alsocompared with the classical theory of Timoshenko. Theelastoplasticity buckling valuation was also proposed byNASA: SP.8007 and ASME: Boiler and Pressure VesselCode Case N-284. Recently experimental studies alsoshow that the buckling strength of theoretical value ismuch higher than experimental one, S.R. Li and R.C.Batra (2006). Buckling experiment of cylindrical shellrequires advanced experimental technology, due to itscurved and thin walled elements, measurement ofdisplacement and strains using the traditional methods aredifficult. The traditional measurement for distortion valueis to use deformation gauge. But the value obtained by thegauge is just an average one along the length of stuckarea. For the buckling deformation it is necessary to stickmany distortion gauges, even if it is possible to stick so
∗ Corresponding author e-mail: [email protected]⃝ 2013 NSP
Natural Sciences Publishing Cor.
1000 C. Zhao et al. : Visualization of Buckling on Thin-walled...
many gauges, there must be a great influence caused bythose gauges because the structure itself is thin-walled.
In this paper 3D digital image correlation system isapplied to observe the buckling generation process indetails during the compression test of a thin-wall cylindershell. Theoretical and experimental values of bucklingstrength are compared, the discrepancy between them arealso discussed.
2. Digital Image Correlation Method
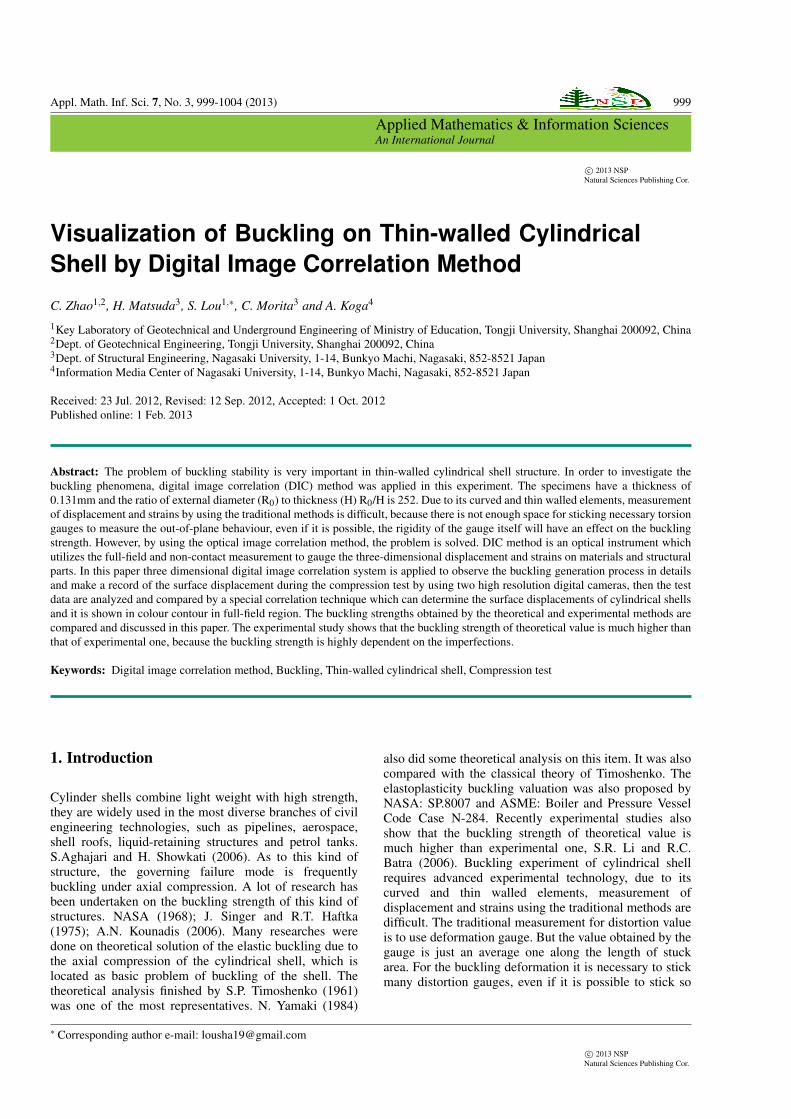
The 3D Digital Image Correlation (DIC) method is anoptical instrument for full-field, non-contact and threedimensional measurement of deformations and strains onstructural elements and engineering materials. The systemuses two high resolution digital cameras to record surfacechanges of the specimen as it deforms. The recordedimages are analyzed and compared by a specialcorrelation technique which allows the determination ofthe object contour as well as the surface displacementswith high local resolution.
2.1. Introduction of Digital Image CorrelationSystem
The DIC method has been developed and used to measuredeformation and strains of materials under variousloading regimes with sub-pixel accuracy since the 1980,s.It has been successfully applied to determine strains inspecimens of solid. The method allows determination ofdisplacements of selected points of the mesh on thesurface of the deformed specimen by comparingsuccessive images acquired during a test and crosscorrelating the gray intensity patterns of the directneighborhood of the points (or the reference areas).In-plane strain values εx, εy and γxy for deformation ofspecimen surfaces may then be obtained from analysisbased on a triangular or rectangular network of pointsL.Muszynski et al. (2000). In addition, out of planedisplacements may be accurately measured if twocameras are arranged in front of the same specimen areaat an angle so that the displacements captured at the sameinstants of time by two cameras are correlated to providestereoscopic information (Figure 1). Such capability isprovided by the ARAMIS system by GOM, MbH, P.Alanet al. (2004), and has been successfully applied to a widerange of experimental problems. Detailed description ofthe 3-D measurement principles, system specifications,calibration procedures, and sample applications are givenby H.A.Bruck et al. (1998), W.Ranson et al. (1987) andG.Vendroux et al. (1998).
The system is consisted of three parts as follows(Figure 1):
(1)2 black and white digital cameras (1600 × 1200pixels) for catching speckle images.
(2)PC for presenting and analyzing the displacementand strain fields.
(3)Matching program (Vic-Snap) for presenting andanalyzing the speckle images.
Figure 1 Schematic diagram of DIC system
2.2. Measurement accuracy of Digital ImageCorrelation System
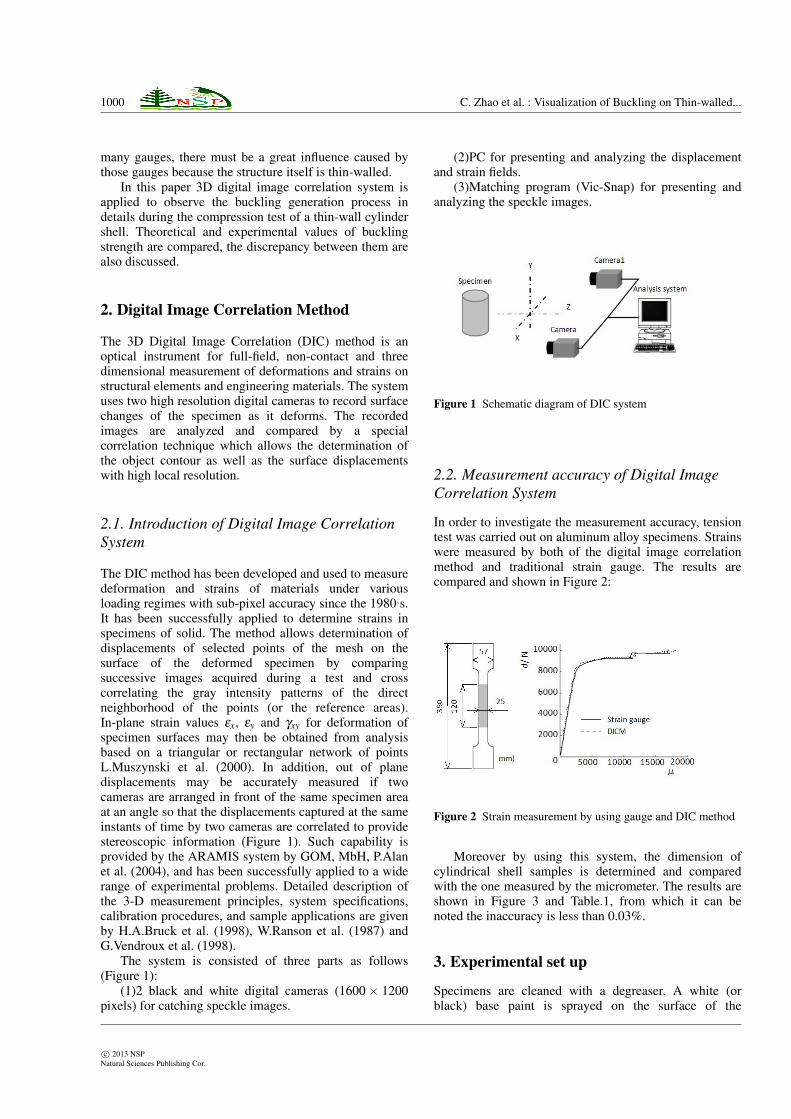
In order to investigate the measurement accuracy, tensiontest was carried out on aluminum alloy specimens. Strainswere measured by both of the digital image correlationmethod and traditional strain gauge. The results arecompared and shown in Figure 2:
Figure 2 Strain measurement by using gauge and DIC method
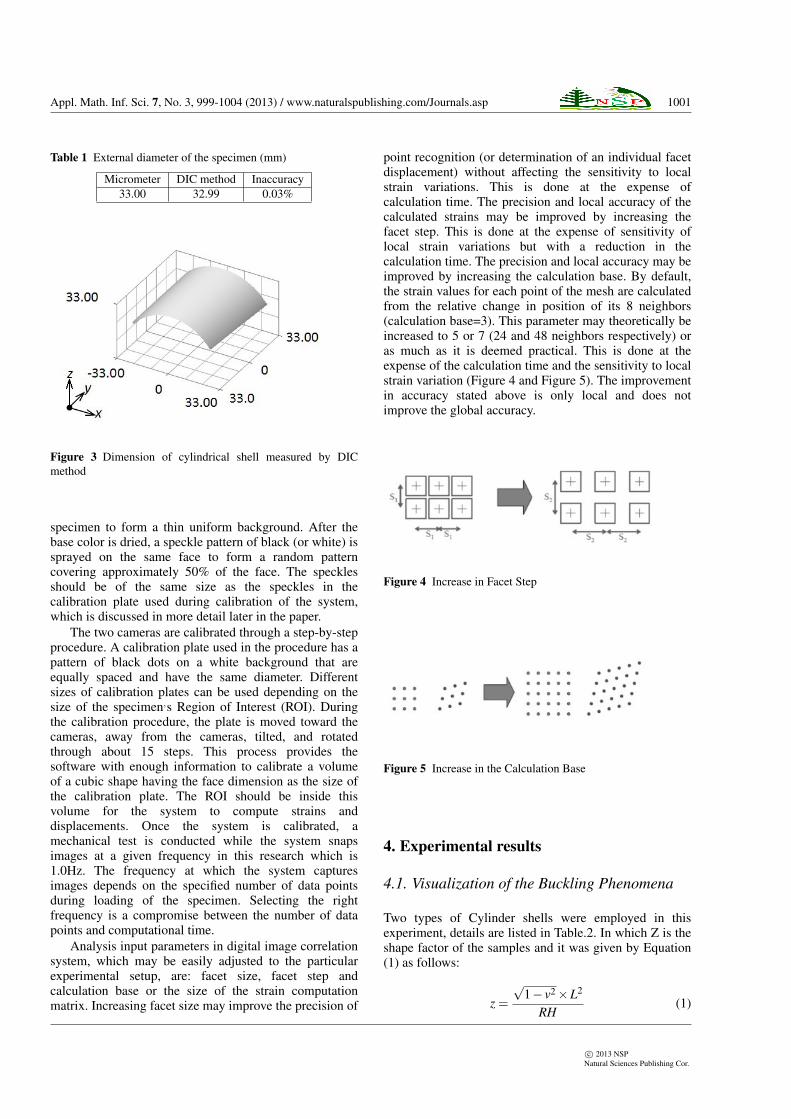
Moreover by using this system, the dimension ofcylindrical shell samples is determined and comparedwith the one measured by the micrometer. The results areshown in Figure 3 and Table.1, from which it can benoted the inaccuracy is less than 0.03%.
3. Experimental set up
Specimens are cleaned with a degreaser. A white (orblack) base paint is sprayed on the surface of the
c⃝ 2013 NSPNatural Sciences Publishing Cor.
Appl. Math. Inf. Sci. 7, No. 3, 999-1004 (2013) / www.naturalspublishing.com/Journals.asp 1001
Table 1 External diameter of the specimen (mm)
Micrometer DIC method Inaccuracy33.00 32.99 0.03%
Figure 3 Dimension of cylindrical shell measured by DICmethod
specimen to form a thin uniform background. After thebase color is dried, a speckle pattern of black (or white) issprayed on the same face to form a random patterncovering approximately 50% of the face. The specklesshould be of the same size as the speckles in thecalibration plate used during calibration of the system,which is discussed in more detail later in the paper.
The two cameras are calibrated through a step-by-stepprocedure. A calibration plate used in the procedure has apattern of black dots on a white background that areequally spaced and have the same diameter. Differentsizes of calibration plates can be used depending on thesize of the specimen,s Region of Interest (ROI). Duringthe calibration procedure, the plate is moved toward thecameras, away from the cameras, tilted, and rotatedthrough about 15 steps. This process provides thesoftware with enough information to calibrate a volumeof a cubic shape having the face dimension as the size ofthe calibration plate. The ROI should be inside thisvolume for the system to compute strains anddisplacements. Once the system is calibrated, amechanical test is conducted while the system snapsimages at a given frequency in this research which is1.0Hz. The frequency at which the system capturesimages depends on the specified number of data pointsduring loading of the specimen. Selecting the rightfrequency is a compromise between the number of datapoints and computational time.
Analysis input parameters in digital image correlationsystem, which may be easily adjusted to the particularexperimental setup, are: facet size, facet step andcalculation base or the size of the strain computationmatrix. Increasing facet size may improve the precision of
point recognition (or determination of an individual facetdisplacement) without affecting the sensitivity to localstrain variations. This is done at the expense ofcalculation time. The precision and local accuracy of thecalculated strains may be improved by increasing thefacet step. This is done at the expense of sensitivity oflocal strain variations but with a reduction in thecalculation time. The precision and local accuracy may beimproved by increasing the calculation base. By default,the strain values for each point of the mesh are calculatedfrom the relative change in position of its 8 neighbors(calculation base=3). This parameter may theoretically beincreased to 5 or 7 (24 and 48 neighbors respectively) oras much as it is deemed practical. This is done at theexpense of the calculation time and the sensitivity to localstrain variation (Figure 4 and Figure 5). The improvementin accuracy stated above is only local and does notimprove the global accuracy.
Figure 4 Increase in Facet Step
Figure 5 Increase in the Calculation Base
4. Experimental results
4.1. Visualization of the Buckling Phenomena
Two types of Cylinder shells were employed in thisexperiment, details are listed in Table.2. In which Z is theshape factor of the samples and it was given by Equation(1) as follows:
z =
√1− v2 ×L2
RH(1)
c⃝ 2013 NSPNatural Sciences Publishing Cor.
1002 C. Zhao et al. : Visualization of Buckling on Thin-walled...
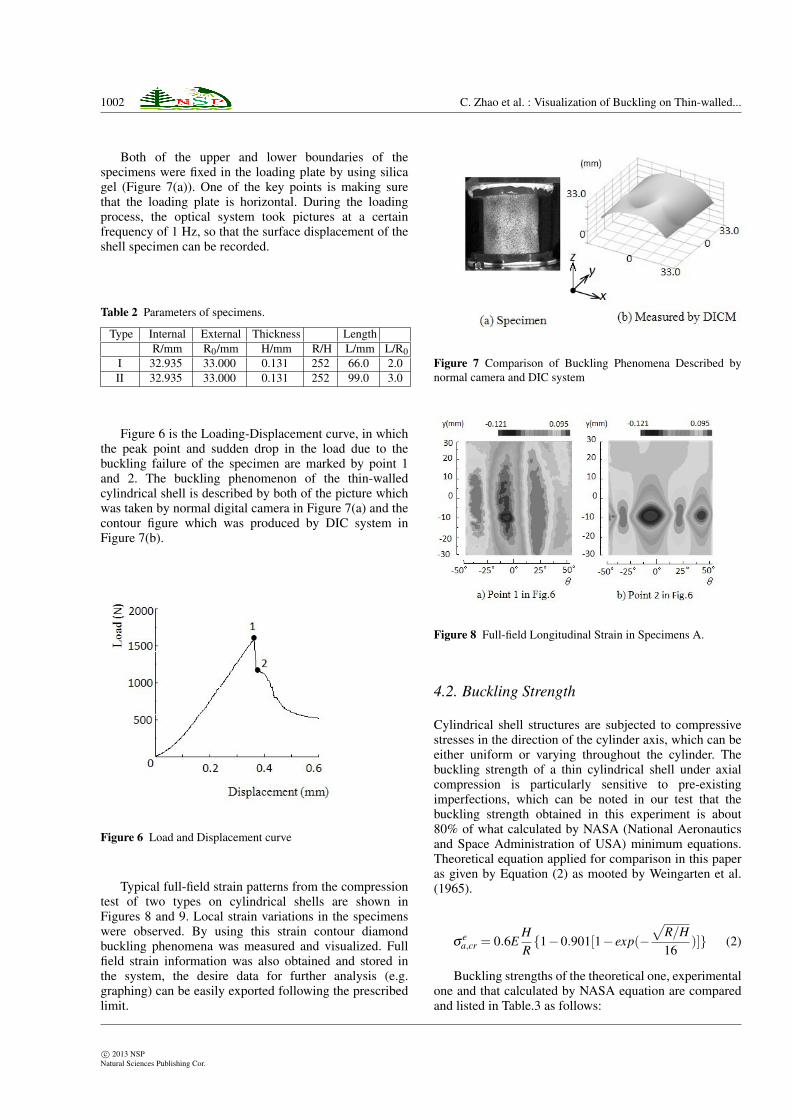
Both of the upper and lower boundaries of thespecimens were fixed in the loading plate by using silicagel (Figure 7(a)). One of the key points is making surethat the loading plate is horizontal. During the loadingprocess, the optical system took pictures at a certainfrequency of 1 Hz, so that the surface displacement of theshell specimen can be recorded.
Table 2 Parameters of specimens.
Type Internal External Thickness LengthR/mm R0/mm H/mm R/H L/mm L/R0
I 32.935 33.000 0.131 252 66.0 2.0II 32.935 33.000 0.131 252 99.0 3.0
Figure 6 is the Loading-Displacement curve, in whichthe peak point and sudden drop in the load due to thebuckling failure of the specimen are marked by point 1and 2. The buckling phenomenon of the thin-walledcylindrical shell is described by both of the picture whichwas taken by normal digital camera in Figure 7(a) and thecontour figure which was produced by DIC system inFigure 7(b).
Figure 6 Load and Displacement curve
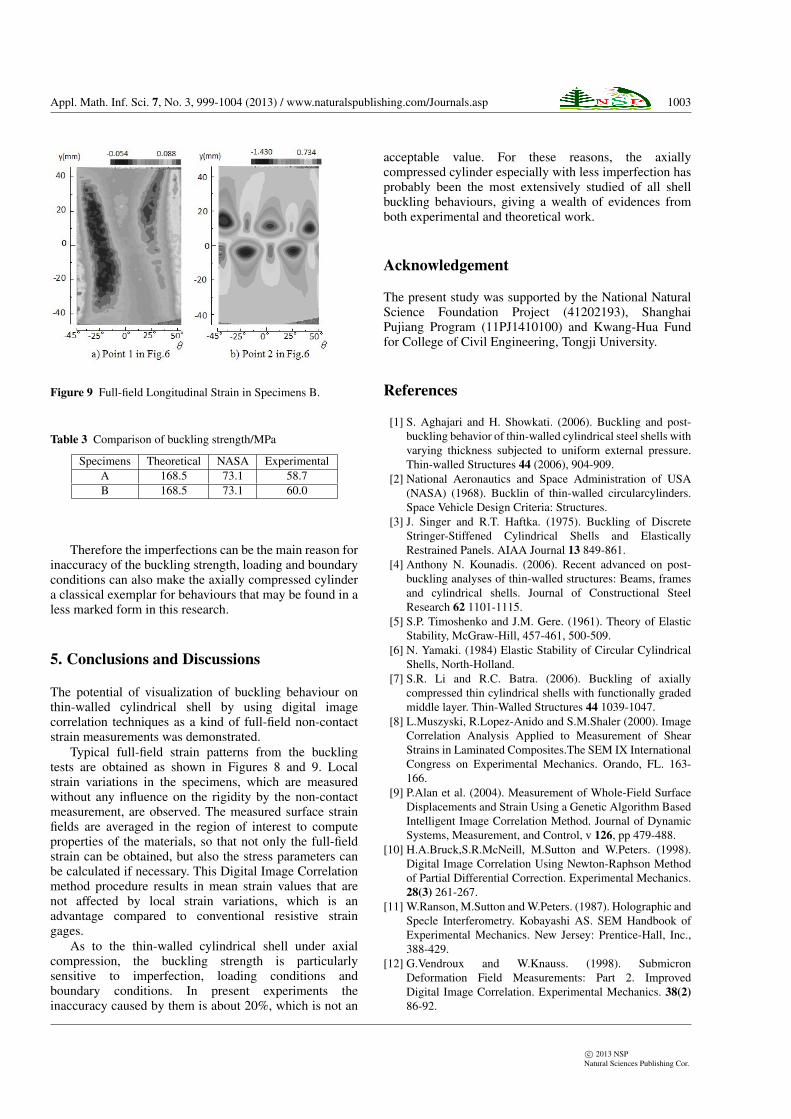
Typical full-field strain patterns from the compressiontest of two types on cylindrical shells are shown inFigures 8 and 9. Local strain variations in the specimenswere observed. By using this strain contour diamondbuckling phenomena was measured and visualized. Fullfield strain information was also obtained and stored inthe system, the desire data for further analysis (e.g.graphing) can be easily exported following the prescribedlimit.
Figure 7 Comparison of Buckling Phenomena Described bynormal camera and DIC system
Figure 8 Full-field Longitudinal Strain in Specimens A.
4.2. Buckling Strength
Cylindrical shell structures are subjected to compressivestresses in the direction of the cylinder axis, which can beeither uniform or varying throughout the cylinder. Thebuckling strength of a thin cylindrical shell under axialcompression is particularly sensitive to pre-existingimperfections, which can be noted in our test that thebuckling strength obtained in this experiment is about80% of what calculated by NASA (National Aeronauticsand Space Administration of USA) minimum equations.Theoretical equation applied for comparison in this paperas given by Equation (2) as mooted by Weingarten et al.(1965).
σ ea,cr = 0.6E
HR{1−0.901[1− exp(−
√R/H16
)]} (2)
Buckling strengths of the theoretical one, experimentalone and that calculated by NASA equation are comparedand listed in Table.3 as follows:
c⃝ 2013 NSPNatural Sciences Publishing Cor.
Appl. Math. Inf. Sci. 7, No. 3, 999-1004 (2013) / www.naturalspublishing.com/Journals.asp 1003
Figure 9 Full-field Longitudinal Strain in Specimens B.
Table 3 Comparison of buckling strength/MPa
Specimens Theoretical NASA ExperimentalA 168.5 73.1 58.7B 168.5 73.1 60.0
Therefore the imperfections can be the main reason forinaccuracy of the buckling strength, loading and boundaryconditions can also make the axially compressed cylindera classical exemplar for behaviours that may be found in aless marked form in this research.
5. Conclusions and Discussions
The potential of visualization of buckling behaviour onthin-walled cylindrical shell by using digital imagecorrelation techniques as a kind of full-field non-contactstrain measurements was demonstrated.
Typical full-field strain patterns from the bucklingtests are obtained as shown in Figures 8 and 9. Localstrain variations in the specimens, which are measuredwithout any influence on the rigidity by the non-contactmeasurement, are observed. The measured surface strainfields are averaged in the region of interest to computeproperties of the materials, so that not only the full-fieldstrain can be obtained, but also the stress parameters canbe calculated if necessary. This Digital Image Correlationmethod procedure results in mean strain values that arenot affected by local strain variations, which is anadvantage compared to conventional resistive straingages.
As to the thin-walled cylindrical shell under axialcompression, the buckling strength is particularlysensitive to imperfection, loading conditions andboundary conditions. In present experiments theinaccuracy caused by them is about 20%, which is not an
acceptable value. For these reasons, the axiallycompressed cylinder especially with less imperfection hasprobably been the most extensively studied of all shellbuckling behaviours, giving a wealth of evidences fromboth experimental and theoretical work.
Acknowledgement
The present study was supported by the National NaturalScience Foundation Project (41202193), ShanghaiPujiang Program (11PJ1410100) and Kwang-Hua Fundfor College of Civil Engineering, Tongji University.
References
[1] S. Aghajari and H. Showkati. (2006). Buckling and post-buckling behavior of thin-walled cylindrical steel shells withvarying thickness subjected to uniform external pressure.Thin-walled Structures 44 (2006), 904-909.
[2] National Aeronautics and Space Administration of USA(NASA) (1968). Bucklin of thin-walled circularcylinders.Space Vehicle Design Criteria: Structures.
[3] J. Singer and R.T. Haftka. (1975). Buckling of DiscreteStringer-Stiffened Cylindrical Shells and ElasticallyRestrained Panels. AIAA Journal 13 849-861.
[4] Anthony N. Kounadis. (2006). Recent advanced on post-buckling analyses of thin-walled structures: Beams, framesand cylindrical shells. Journal of Constructional SteelResearch 62 1101-1115.
[5] S.P. Timoshenko and J.M. Gere. (1961). Theory of ElasticStability, McGraw-Hill, 457-461, 500-509.
[6] N. Yamaki. (1984) Elastic Stability of Circular CylindricalShells, North-Holland.
[7] S.R. Li and R.C. Batra. (2006). Buckling of axiallycompressed thin cylindrical shells with functionally gradedmiddle layer. Thin-Walled Structures 44 1039-1047.
[8] L.Muszyski, R.Lopez-Anido and S.M.Shaler (2000). ImageCorrelation Analysis Applied to Measurement of ShearStrains in Laminated Composites.The SEM IX InternationalCongress on Experimental Mechanics. Orando, FL. 163-166.
[9] P.Alan et al. (2004). Measurement of Whole-Field SurfaceDisplacements and Strain Using a Genetic Algorithm BasedIntelligent Image Correlation Method. Journal of DynamicSystems, Measurement, and Control, v 126, pp 479-488.
[10] H.A.Bruck,S.R.McNeill, M.Sutton and W.Peters. (1998).Digital Image Correlation Using Newton-Raphson Methodof Partial Differential Correction. Experimental Mechanics.28(3) 261-267.
[11] W.Ranson, M.Sutton and W.Peters. (1987). Holographic andSpecle Interferometry. Kobayashi AS. SEM Handbook ofExperimental Mechanics. New Jersey: Prentice-Hall, Inc.,388-429.
[12] G.Vendroux and W.Knauss. (1998). SubmicronDeformation Field Measurements: Part 2. ImprovedDigital Image Correlation. Experimental Mechanics. 38(2)86-92.
c⃝ 2013 NSPNatural Sciences Publishing Cor.
1004 C. Zhao et al. : Visualization of Buckling on Thin-walled...
[13] V.I. Weingarten, E.J. Morgan, and P. Seide. (1965). ElasticStability of Thin-Walled Cylindrical and Conical ShellsUnder Axial Compression. AIAA Journal, 3(3) 500-505.
[14] V.I. Weingarten, E.J. Morgan, and P. Seide. (1965).Elastic Stability of Thin-WalledCylindrical andConical Shells under CombinedInternal PressureandAxialCompression.AIAA Journal, 3(6), 1118-1126.
Zhao Cheng, bornin 1982, got his PHD degreein Nagasaki University in2010. Now he is a researcherin college of civil engineeringof Tongji University, China.He is also a research fellowin Nagasaki university. Heis NSFC (National ScientificFoundation of China) andJss (Japan Society of Science)
projects leader. His major is about optical measurementand its application in civil engineering, buckling ofthin-walled shell structure and geotechnical engineering.
Matsuda Hiroshi, born in Nagasaki Prefecturein 1957 , is a professorof structural engineeringof Nagasaki University,Japan. He is also thevice president and the chiefmanager of InfrastructuresLifetime-ExtendingMaintenance Research Center
of Nagasaki University. His specialization are structuralmechanics, nonlinear finite element analyses, opticmeasurement method and infrastructures maintenanceengineering.
c⃝ 2013 NSPNatural Sciences Publishing Cor.