Embed Size (px)
Citation preview

*Corr. Author’s Address: University of Rijeka, Faculty of Engineering, Vukovarska 58, 51000 Rijeka, Croatia, [email protected] 641
Strojniški vestnik - Journal of Mechanical Engineering 61(2015)11, 641-650 Received for review: 2015-02-05© 2015 Journal of Mechanical Engineering. All rights reserved. Received revised form: 2015-06-08DOI:10.5545/sv-jme.2015.2493 Original Scientific Paper Accepted for publication: 2015-09-17
0 INTRODUCTION
The primary goal of the planning of the heating and cooling of an indoor working space is to find adequate microclimate conditions for occupants. This implies a thermodynamic balance between the human body and the environment. The balance and the perception of thermal comfort depend on several physical quantities that can be grouped as person-related (metabolic rate, clothing insulation) and environment-related (air temperature in the room, air humidity, local air velocity and the surface temperature of the surrounding walls, windows, and heating surfaces). These parameters must be appropriately combined in order to achieve a satisfactory thermal environment. Fanger et al. [1] presented a model that predicts the sensation of the draught as a function of air temperature, mean velocity, and turbulence intensity. Olesen and Parsons [2] presented the revision of EN ISO 7730 based on requirements for general thermal comfort (operative temperature and predicted mean vote) and local thermal discomfort (radiant temperature asymmetry, draught, vertical air temperature differences, and floor surface temperatures).
Designers of A/C system can choose between many different A/C unit types and setups. Alternative solutions also exist, such as those presented by Stritih and Butala [3] in which phase change materials are used for cooling and ventilation or Dovjak et al. [4]
where low exergy H/C ceiling radiative panels and conventional systems with electric heaters and cooling split systems with indoor units are compared regarding individual thermal comfort conditions. Numerical simulations aid in selecting the most appropriate solution, giving the designer an opportunity to check in advance what level of thermal comfort can be expected to be produced in the given space. For those reasons, it is essential to develop optimally simple yet reliable numerical tools that can accurately simulate real spaces and the physical processes in them.
From a computational perspective, airflows in enclosed spaces are very complex. In the context of heating or cooling in warm climates, these flows are buoyant; in some cases, buoyancy drives the mean flow motion. In reality, most airflows are inherently three-dimensional and unsteady. Due to these characteristics, airflows in rooms present a great challenge to the available numerical models.
In recent years, extensive research efforts have been made in the development of general fluid flow and heat transfer software for solving the flow of air in enclosed spaces. Rutman et al. [5] and [6] and Wolf [7] give extensive insight into using numerical modelling tools for improving indoor environment quality, component optimisation, and complete system optimisation. Weather forecasting, including solar radiation, can be incorporated to decrease the energy demand of cooling systems using intelligent
Numerical Modelling of Thermal Comfort Conditions in an Indoor Space with Solar Radiation Sources
Bonefacic, I. – Wolf, I. – Frankovic, B.Igor Bonefacic* – Igor Wolf – Bernard FrankovicUniversity of Rijeka, Faculty of Engineering, Croatia
In this paper, a three-dimensional case of heat transfer and air flow is presented for indoor space cooling with a wall-mounted A/C unit during the summer in Rijeka, Croatia. Numerical modelling is used to analyse the effect of different air flow angles of the A/C unit on the temperature and air velocity distribution under standard conditions with and without a direct solar radiation source. As parameters of thermal comfort conditions, the airflow velocities, indoor temperatures with its gradients, and the mean radiant temperature are analysed. Physical processes are modelled using the FLUENT computational fluid dynamics software. Calculations are carried out for an empty room without internal heat sources. When direct solar radiation through the window for an extreme case of summer solstice is included in the calculation, considerable deviations from thermal comfort conditions are observed, yielding the conclusion that solar radiation must be included in numerical simulations to properly predict heat balance and thermal comfort parameters in enclosed spaces.Keywords: numerical modelling, thermal comfort, space cooling, air flow, solar radiation, mean radiant temperature
Highlights• Enclosed space during cooling season is modelled to determine temperature distribution and air flow field.• Influence of the solar radiation on thermal comfort is examined using a solar ray-tracing algorithm.• Mean radiant temperature is calculated.• Local distortions from standard optimal comfort conditions are observed in cooling periods, taking into account solar
radiation through the window.
Strojniški vestnik - Journal of Mechanical Engineering 61(2015)11, 641-650
642 Bonefacic, I. – Wolf, I. – Frankovic, B.
control as in the paper by Dovrtel and Medved [8], in which a free-cooling system combined with heat storage is shown, and the method of incorporating weather forecasts into the control system is presented. With the constant progress of central processing units’ (CPU) power, three-dimensional models of enclosed space with detailed geometry can now be modelled according to thermal comfort predictions with sufficient accuracy, as by Kuznik et al. [9] where CFD methods are used to investigate the velocity and temperature fields in a mechanically ventilated enclosure. Sevilgen and Kilic [10] performed a three-dimensional steady-state numerical analysis of the room heated by two-panel radiators and Aziz et al. [11] experimentally and numerically investigated performance of vortex, round, and square ceiling diffusers.
The objective of the study presented here is to determine the impact of the solar radiation source on the cooling performance of the wall-mounted A/C unit and thermal comfort conditions using the computational fluid dynamics (CFD) modelling method. The space under consideration is an office with one south-oriented external wall.
1 STUDY SETUP AND METHOD
A numerical model of the solar radiation through the window has been verified experimentally prior to analysing the effect of the radiation on the thermal comfort parameters in the space, by comparing the measured and calculated floor temperatures in the area exposed to direct solar radiation. The temperature measurements of the floor area have been carried out using the thermal imaging camera FLIR ThermaCAM S65. Results for indoor air flow velocity, temperature distribution, mean radiant temperature (MRT) and predicted mean vote (PMV) values are presented and compared for four different cases regarding air flow inlet angles from the A/C unit and solar radiation. The impact of the direct solar radiation through the window is verified with a thermal imaging camera.
1.1 Thermal Comfort Evaluation
Thermal comfort can be evaluated using different comfort indices, among which the predicted mean vote and predicted percentage dissatisfied (PMV/PPD) model and adaptive comfort approach (ATC) are well established and frequently used. For mechanically conditioned spaces, the PMV/PPD model should be used [12] and [13]. For offices and other spaces with sedentary workers, the requirement for mechanically
air-conditioned buildings (based on the PMV/PPD model-category II) is an operative temperature range in winter 20 °C to 24 °C and 23 °C to 26 °C in summer. Thermal comfort also depends on the vertical temperature distribution in the room. The recommended vertical air temperature difference between 1.1 m and 0.1 m above the floor (at the head and at the ankle, respectively, of a person in the sitting position) or between 1.7 m and 0.1 m above the floor (at the head and at the ankle, respectively, of the person in an upright position) is less than 3 °C, ISO 7730:2005 [14]. According to [15], the most comfortable state is when the floor temperature is the same or slightly higher than the air temperature in the upper level. To avoid local discomfort, [13] and [14] recommend the air temperature difference between head and ankle to be less than 3 K. The state of thermal comfort cannot be determined simply by knowing the air temperature in the room.
A human body is constantly exchanging radiant heat with all the objects that surround it due to the temperature differences between them. The MRT of a space is the measure of the combined effects of the temperatures of the surfaces within that area of the human body. It is defined as the uniform temperature of an imaginary enclosure in which the radiant heat transfer from the human body is equal to the radiant heat transfer in the actual non-uniform enclosure [16]. The larger the surface area and the closer the person is to it, the more influence surface temperatures have on the individual. The mean radiant temperature, thus, changes with the position in the room and with it the corresponding air temperature, which provides thermal comfort.
Air-flow velocity is another important factor in determining thermal comfort because increased air velocity can cause discomfort due to increased convective heat transfer from the surface of a human body [14], limits local air flow velocity in offices and spaces where no major physical activities occur at 0.15 m/s during the winter (heating periods) and 0.25 m/s during the summer (cooling periods). The sense of draft is more pronounced with decreased physical activity. Furthermore, discomfort caused by draft increases with air temperature drops. Contrarily, if air velocity in an enclosed space is too low, it could cause a feeling of stuffiness and bad odour especially in winter (heating periods). It is, therefore, necessary to assure the optimal level of air circulation in the room.
The problem of indoor thermal comfort is sensitive to other physical parameters, in the cases of room environments with and without occupants. The existence of a thermal occupant was found to

Strojniški vestnik - Journal of Mechanical Engineering 61(2015)11, 641-650
643Numerical Modelling of Thermal Comfort Conditions in an Indoor Space with Solar Radiation Sources
produce thermal plume approximately 15% stronger in magnitude than that from an unoccupied room [17].
1.2 Study Setup
An empty office with the double glazed window facing south is modelled. Characteristic dimensions of the room and the window are given in Fig. 1. Four different cases regarding air flow inlet angles from the A/C unit and solar radiation on external surfaces and through the window are simulated and examined (Table 1). A few simplifications are made in the numerical model to decrease the number of control volumes needed to discretize the domain and, accordingly, accelerate the calculation. Internal obstacles such as office desks and cabinets are ignored. There are no additional heat sources in the room such as occupants, computers, monitors, etc.
Table 1. Cases examined
Case Solar radiation A/C air inlet angleA Not included 0°B Not included 45°C Included 0°D Included 45°
Fig. 1. Modelled enclosed room
Based on the known surrounding air temperature, convection boundary conditions are used to calculate heat transfer to the external surfaces. Where surfaces are exposed to the sun, radiation heat transfer is included. A numerical simulation is conducted for the most extreme case on the summer solstice at 13.00 in
Rijeka, Croatia. Solar data for that day are given in [18]: direct solar radiation, 715 W/m² and diffuse solar radiation, 185 W/m². Assumed radiation properties of the wooden parquet and clear double-glazed window are used in the model and are given in Table 2.
Table 2. Surface radiation properties
EmissivityWindow Floor
0.9 0.9
AbsorptivityVisible 0.1 0.6IR 0.1 0.6Diffuse 0.1 0.6
TransmissivityVisible 0.8 0IR 0.7 0Diffuse 0.7 0
The U-value of the wall and the U-value of the double-glazed window, are estimated as 0.4 W/(m²K) and 2.2 W/(m²K), respectively. The interior walls of the surrounding rooms are modelled with convection boundary conditions. It is assumed that the surrounding rooms (upstairs, downstairs and side rooms) have the same air temperature of 26 °C, corresponding to the indoor design temperature. The outdoor temperature is 32 °C, defined as the dry bulb temperature corresponding to 0.4 % of the annual cumulative frequency of occurrence and the mean coincident wet bulb temperature for Rijeka, Croatia. Constant air flow velocity was taken as the inlet boundary condition on the wall-mounted A/C unit with the following parameters: the inlet air velocity vin = 2.0 m/s, the inlet air temperature Tin = 20 °C, and the air flow inlet angle φ = 0°/45°. In the PMV calculations, it is assumed that the metabolic rate is 1.2 met for sedentary activity (office), clothing insulation is 0.6 clo (trousers and shirt) with relative humidity assumed to be 50%.
1.3 Governing Equations
Transient solutions tend to be numerically more stable and often converge when solution controls are too restrictive to tend towards a steady-state solution. This is the case with high Rayleigh number flows in which the guidelines are to use time-dependent approach [19]. The problem of heat transfer and fluid flow in the space is solved using a mathematical model of the unsteady three-dimensional turbulent flow of incompressible fluid which is described with the general differential equation:
∂∂( ) + ∂
∂( ) = ∂
∂∂∂
+t x
ux x
Si
ii i
ρϕ ρ ϕ ϕΓ , (1)

Strojniški vestnik - Journal of Mechanical Engineering 61(2015)11, 641-650
644 Bonefacic, I. – Wolf, I. – Frankovic, B.
where variable j represents the velocity components u, v, w and the temperature T. In addition to the forced convection imposed by the wall-mounted A/C unit, the importance of buoyancy effects should be determined. The ratio of the Grashof and Reynolds numbers is:
Gr g H/ Re / .2 2= ⋅ ⋅ ⋅( ) ∆ρ ρ ν (2)
The ratio exceeds unity, showing that a strong buoyancy effect in the flow could be expected. Performances of different turbulence models in similar studies were examined in [20]. Turbulence was modelled using the realizable k–ε model, which consists of the transport equation for turbulent kinetic energy, and its dissipation rate and includes the generation of turbulent kinetic energy due to buoyancy effects. The values of model constants [21] are given in Table 3.
Table 3. k–ε model constants
Model constants ValueC2 1.9
C1ε 1.0
C3ε 1.2
σk 0.85
σε 0.85
The system of transport equations was solved using the FLUENT CFD software, based on the finite volume method [22]. Heat transfer from the surroundings to the outer surface of the walls and window, due to convection and radiation, is defined as [21]:
q T T T Text o ext ext ext= ⋅ − + ⋅ ⋅ − ∞α ε σ( ) ,4 4 (3)
the second term in Eq. (3) represents the radiation term and is accounts for surfaces exposed to sun radiation. The radiation temperature T∞ is determined so that radiative heat flux on the external surface is 375 W/m², taking into account the angle of the sun of 68°. Heat flux through the walls and window is calculated from [21]:
qx
T Text=∆
⋅ −( )λint , (4)
where Δx is the thickness of the wall/window with constant thermal conductivity λ. The external heat transfer coefficients αext, in Eq. (3) for the wall and the window is calculated as 0.6 W/(m²K) and 6.5 W/(m²K), respectively.
The radiation energy source that results from incident solar radiation passing through the window
is predicted with the solar ray tracing algorithm [21]. It uses the sun’s position vector and two irradiation parameters, direct and diffuse solar irradiation, to set solar intensity. The resulting heat flux is coupled to the FLUENT calculation via the source term in the energy equation. The solar ray tracing algorithm also accounts for internal scattered and diffusive loading. The reflected component of direct solar irradiation is applied to all internal surfaces of the enclosed space.
1.4 Mean Radiant Temperature Calculation
The MRT calculation consists of the determination of view factors Fp, in every point of the room where MRT is to be calculated. It is based on the geometric position of the irradiated surface (human body) surrounded by surfaces with different temperatures, [16]. MRT should be calculated in relation to the human body surface area and orientation, but such a calculation is highly complicated. For simplicity, it is reduced to the point in space that is located in the human centre of gravity. The view factor for a very small surface area on the wall Ai, from an arbitrary point in space (x, y, z) can be calculated as:
F Ap
i− =
′14π, (5)
where ′Ai is the projection of the surface area Ai to the sphere of radius r = 1 (Fig. 2).
Fig. 2. View factors calculation
The projection area is then calculated as:
′ =+ +
= ⋅+ +
A Ax y z
A tx y zi
ii
cos
( ),
/
φ2 2 2 2 2 2 3 2
(6)
where t is the distance from the originating point to the wall. When wall surfaces have a high emittance
Strojniški vestnik - Journal of Mechanical Engineering 61(2015)11, 641-650
645Numerical Modelling of Thermal Comfort Conditions in an Indoor Space with Solar Radiation Sources
(ε), they can be assumed to be black, and thus the following equation for MRT can be used [23]:
T T F T F T Fr p p N p N4
1
4
1 2
4
2
4= ⋅ ⋅ +…+ ⋅+− − − . (7)
To be valid, the wall surface area Ai should be adequately small. Using CFD software, such as FLUENT, allows for very small surface areas to be defined on walls so that this condition for view factor calculation is fulfilled. The user-defined function (UDF) was created and incorporated in FLUENT solver to calculate MRT in post-processing based on previously calculated wall surface temperatures. Different face mesh sizes were examined to determine the optimal value of surface area Ai regarding calculation time and discretization error. Four different mesh sizes with surface areas of 50 cm × 50 cm, 25 cm × 25 cm, 10 cm × 10 cm, and 5 cm × 5 cm were considered. Based on the results on calculated mean radiant temperatures for enclosed room with dimensions 5 m × 3 m × 2.5 m and arbitrary wall temperatures (Fig. 3), where maximum percentage error is about 0.7 % between cases 3 and 4, the optimal value for Ai is taken to be 10 cm × 10 cm as in Case 3.
Fig. 3. Influence of face mesh size on calculated mean radiant temperatures
1.5 Model Verification
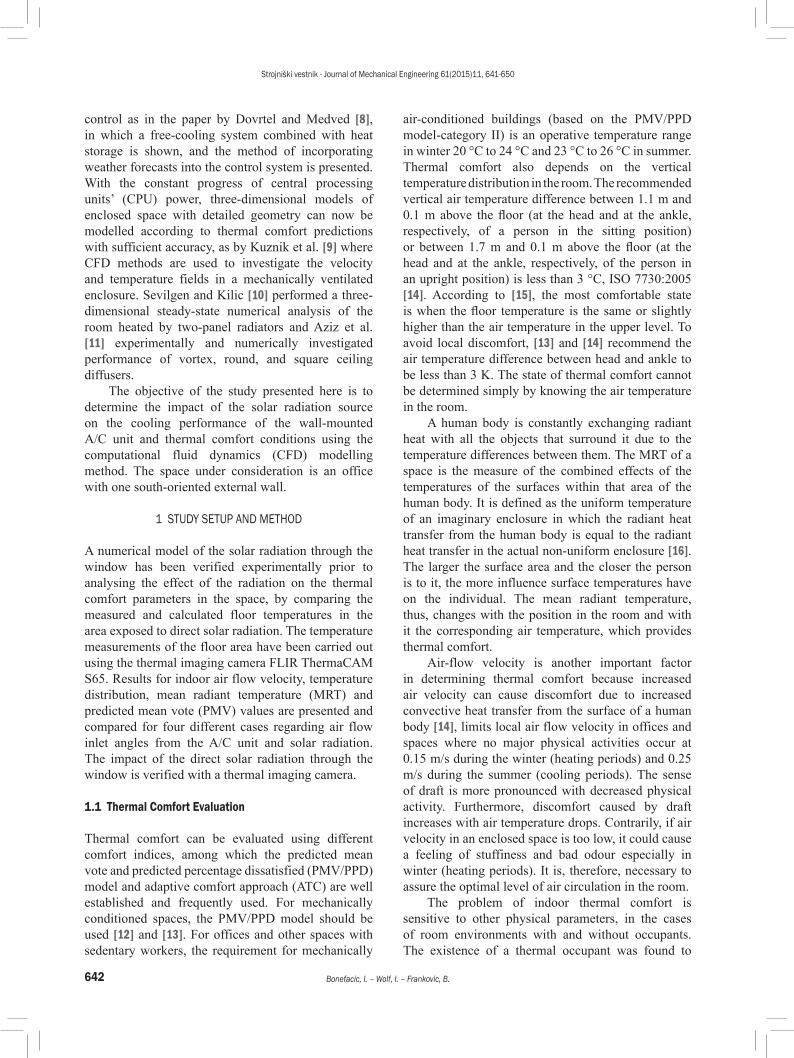
Verification of the solar ray tracing algorithm was conducted prior to analysing the effect of the solar radiation source on the thermal comfort conditions in the room. The temperature measurements of the floor area exposed to direct solar radiation through the window are done using the FLIR ThermaCAM S65 thermal imaging camera. Due to weather conditions, it was not possible to collect data exactly on the summer solstice, instead measurements were carried out on a clear sunny day on the 9th of July at 13.00
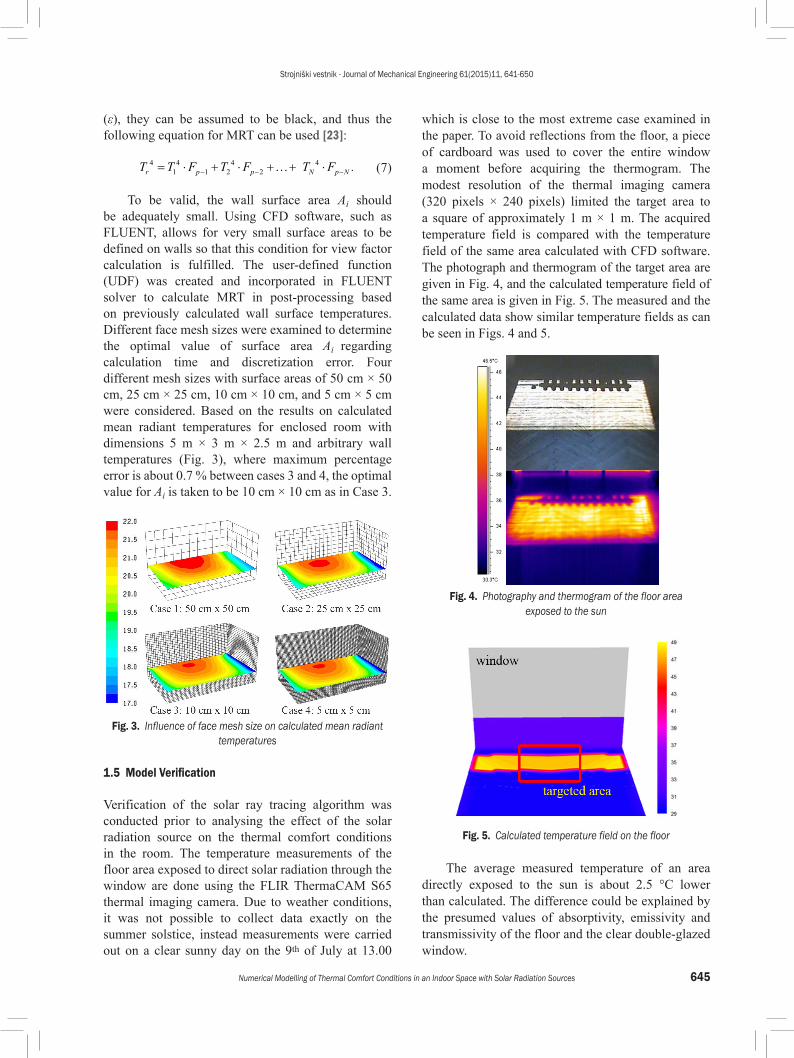
which is close to the most extreme case examined in the paper. To avoid reflections from the floor, a piece of cardboard was used to cover the entire window a moment before acquiring the thermogram. The modest resolution of the thermal imaging camera (320 pixels × 240 pixels) limited the target area to a square of approximately 1 m × 1 m. The acquired temperature field is compared with the temperature field of the same area calculated with CFD software. The photograph and thermogram of the target area are given in Fig. 4, and the calculated temperature field of the same area is given in Fig. 5. The measured and the calculated data show similar temperature fields as can be seen in Figs. 4 and 5.
Fig. 4. Photography and thermogram of the floor area exposed to the sun
Fig. 5. Calculated temperature field on the floor
The average measured temperature of an area directly exposed to the sun is about 2.5 °C lower than calculated. The difference could be explained by the presumed values of absorptivity, emissivity and transmissivity of the floor and the clear double-glazed window.
Strojniški vestnik - Journal of Mechanical Engineering 61(2015)11, 641-650
646 Bonefacic, I. – Wolf, I. – Frankovic, B.
2 RESULTS AND DISCUSSION
2.1 Solar Radiation Source Not Included
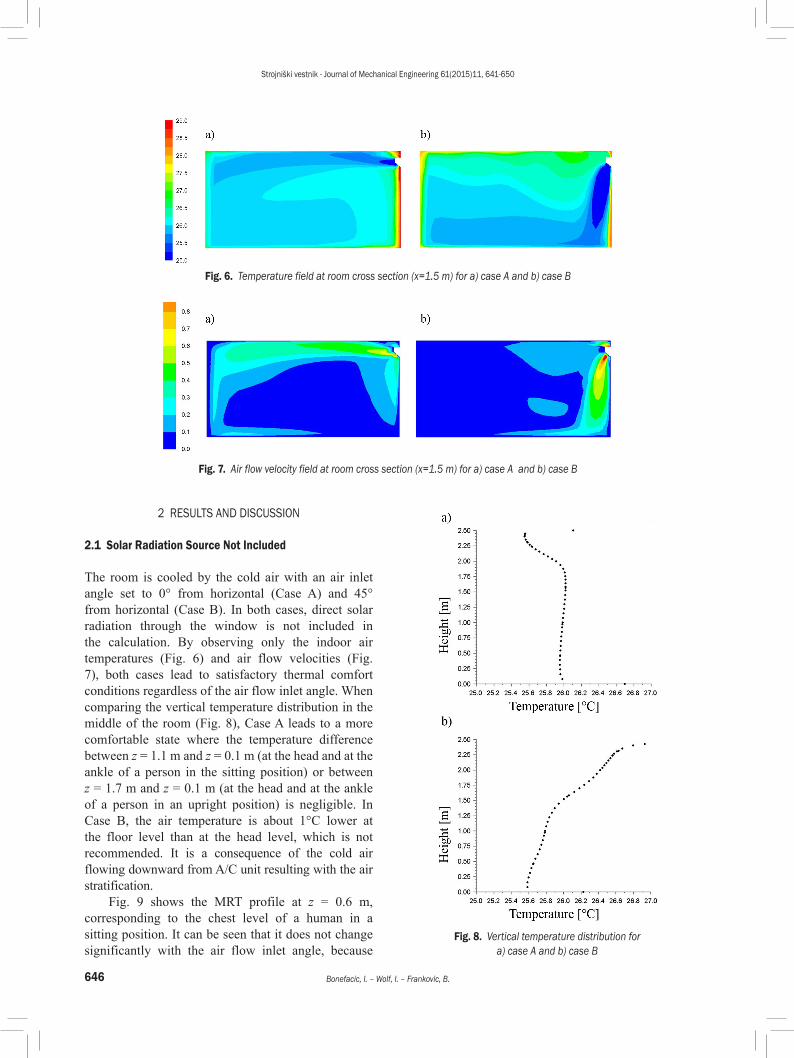
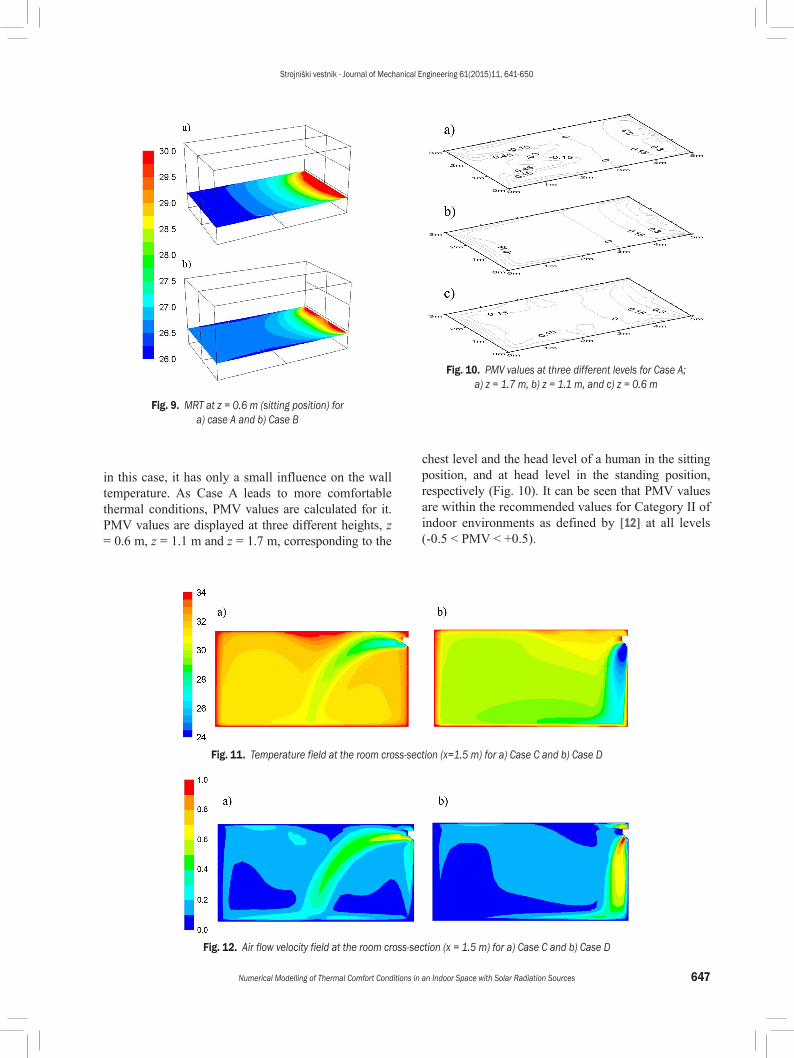
The room is cooled by the cold air with an air inlet angle set to 0° from horizontal (Case A) and 45° from horizontal (Case B). In both cases, direct solar radiation through the window is not included in the calculation. By observing only the indoor air temperatures (Fig. 6) and air flow velocities (Fig. 7), both cases lead to satisfactory thermal comfort conditions regardless of the air flow inlet angle. When comparing the vertical temperature distribution in the middle of the room (Fig. 8), Case A leads to a more comfortable state where the temperature difference between z = 1.1 m and z = 0.1 m (at the head and at the ankle of a person in the sitting position) or between z = 1.7 m and z = 0.1 m (at the head and at the ankle of a person in an upright position) is negligible. In Case B, the air temperature is about 1°C lower at the floor level than at the head level, which is not recommended. It is a consequence of the cold air flowing downward from A/C unit resulting with the air stratification.
Fig. 9 shows the MRT profile at z = 0.6 m, corresponding to the chest level of a human in a sitting position. It can be seen that it does not change significantly with the air flow inlet angle, because
Fig. 6. Temperature field at room cross section (x=1.5 m) for a) case A and b) case B
Fig. 7. Air flow velocity field at room cross section (x=1.5 m) for a) case A and b) case B
Fig. 8. Vertical temperature distribution for a) case A and b) case B
Strojniški vestnik - Journal of Mechanical Engineering 61(2015)11, 641-650
647Numerical Modelling of Thermal Comfort Conditions in an Indoor Space with Solar Radiation Sources
Fig. 9. MRT at z = 0.6 m (sitting position) for a) case A and b) Case B
Fig. 10. PMV values at three different levels for Case A; a) z = 1.7 m, b) z = 1.1 m, and c) z = 0.6 m
Fig. 11. Temperature field at the room cross-section (x=1.5 m) for a) Case C and b) Case D
Fig. 12. Air flow velocity field at the room cross-section (x = 1.5 m) for a) Case C and b) Case D
in this case, it has only a small influence on the wall temperature. As Case A leads to more comfortable thermal conditions, PMV values are calculated for it. PMV values are displayed at three different heights, z = 0.6 m, z = 1.1 m and z = 1.7 m, corresponding to the
chest level and the head level of a human in the sitting position, and at head level in the standing position, respectively (Fig. 10). It can be seen that PMV values are within the recommended values for Category II of indoor environments as defined by [12] at all levels (-0.5 < PMV < +0.5).
Strojniški vestnik - Journal of Mechanical Engineering 61(2015)11, 641-650
648 Bonefacic, I. – Wolf, I. – Frankovic, B.
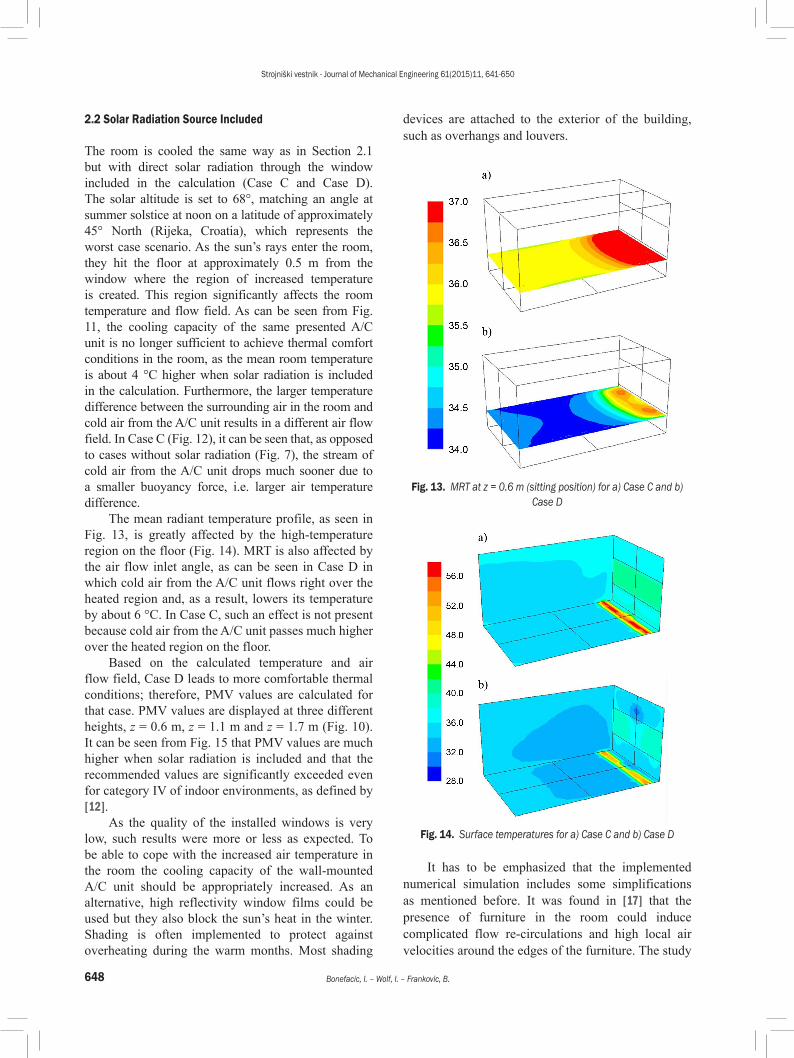
2.2 Solar Radiation Source Included
The room is cooled the same way as in Section 2.1 but with direct solar radiation through the window included in the calculation (Case C and Case D). The solar altitude is set to 68°, matching an angle at summer solstice at noon on a latitude of approximately 45° North (Rijeka, Croatia), which represents the worst case scenario. As the sun’s rays enter the room, they hit the floor at approximately 0.5 m from the window where the region of increased temperature is created. This region significantly affects the room temperature and flow field. As can be seen from Fig. 11, the cooling capacity of the same presented A/C unit is no longer sufficient to achieve thermal comfort conditions in the room, as the mean room temperature is about 4 °C higher when solar radiation is included in the calculation. Furthermore, the larger temperature difference between the surrounding air in the room and cold air from the A/C unit results in a different air flow field. In Case C (Fig. 12), it can be seen that, as opposed to cases without solar radiation (Fig. 7), the stream of cold air from the A/C unit drops much sooner due to a smaller buoyancy force, i.e. larger air temperature difference.
The mean radiant temperature profile, as seen in Fig. 13, is greatly affected by the high-temperature region on the floor (Fig. 14). MRT is also affected by the air flow inlet angle, as can be seen in Case D in which cold air from the A/C unit flows right over the heated region and, as a result, lowers its temperature by about 6 °C. In Case C, such an effect is not present because cold air from the A/C unit passes much higher over the heated region on the floor.
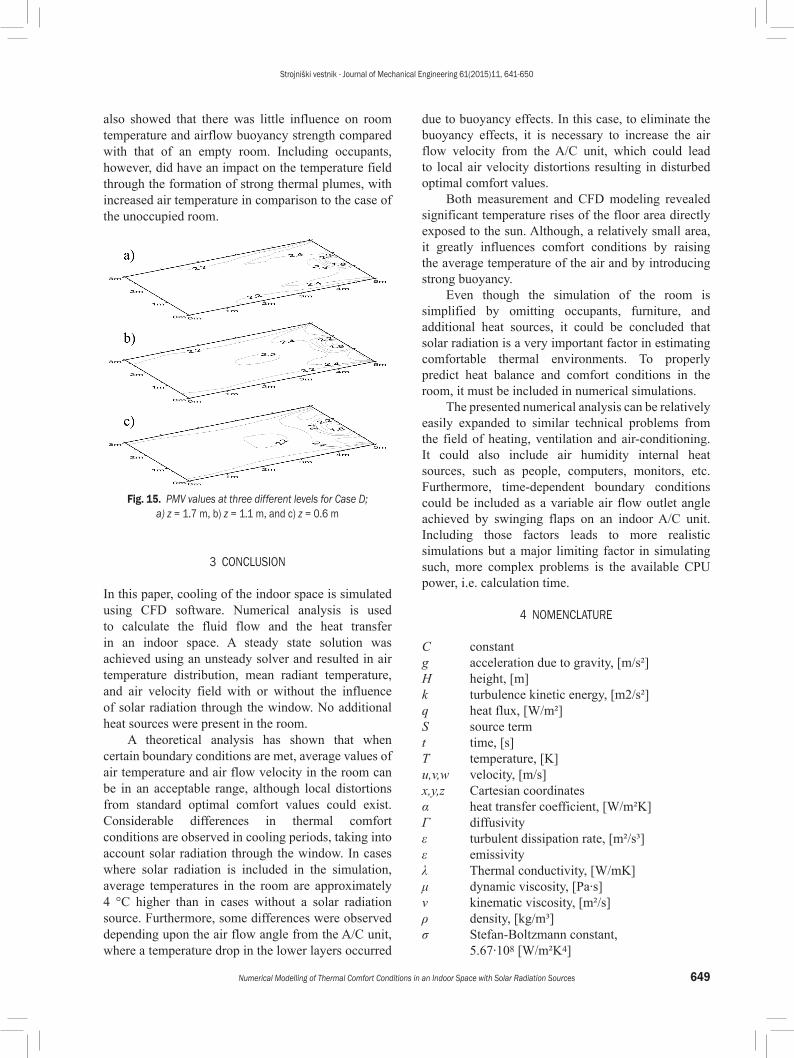
Based on the calculated temperature and air flow field, Case D leads to more comfortable thermal conditions; therefore, PMV values are calculated for that case. PMV values are displayed at three different heights, z = 0.6 m, z = 1.1 m and z = 1.7 m (Fig. 10). It can be seen from Fig. 15 that PMV values are much higher when solar radiation is included and that the recommended values are significantly exceeded even for category IV of indoor environments, as defined by [12].
As the quality of the installed windows is very low, such results were more or less as expected. To be able to cope with the increased air temperature in the room the cooling capacity of the wall-mounted A/C unit should be appropriately increased. As an alternative, high reflectivity window films could be used but they also block the sun’s heat in the winter. Shading is often implemented to protect against overheating during the warm months. Most shading
devices are attached to the exterior of the building, such as overhangs and louvers.
Fig. 13. MRT at z = 0.6 m (sitting position) for a) Case C and b) Case D
Fig. 14. Surface temperatures for a) Case C and b) Case D
It has to be emphasized that the implemented numerical simulation includes some simplifications as mentioned before. It was found in [17] that the presence of furniture in the room could induce complicated flow re-circulations and high local air velocities around the edges of the furniture. The study
Strojniški vestnik - Journal of Mechanical Engineering 61(2015)11, 641-650
649Numerical Modelling of Thermal Comfort Conditions in an Indoor Space with Solar Radiation Sources
also showed that there was little influence on room temperature and airflow buoyancy strength compared with that of an empty room. Including occupants, however, did have an impact on the temperature field through the formation of strong thermal plumes, with increased air temperature in comparison to the case of the unoccupied room.
Fig. 15. PMV values at three different levels for Case D; a) z = 1.7 m, b) z = 1.1 m, and c) z = 0.6 m
3 CONCLUSION
In this paper, cooling of the indoor space is simulated using CFD software. Numerical analysis is used to calculate the fluid flow and the heat transfer in an indoor space. A steady state solution was achieved using an unsteady solver and resulted in air temperature distribution, mean radiant temperature, and air velocity field with or without the influence of solar radiation through the window. No additional heat sources were present in the room.
A theoretical analysis has shown that when certain boundary conditions are met, average values of air temperature and air flow velocity in the room can be in an acceptable range, although local distortions from standard optimal comfort values could exist. Considerable differences in thermal comfort conditions are observed in cooling periods, taking into account solar radiation through the window. In cases where solar radiation is included in the simulation, average temperatures in the room are approximately 4 °C higher than in cases without a solar radiation source. Furthermore, some differences were observed depending upon the air flow angle from the A/C unit, where a temperature drop in the lower layers occurred
due to buoyancy effects. In this case, to eliminate the buoyancy effects, it is necessary to increase the air flow velocity from the A/C unit, which could lead to local air velocity distortions resulting in disturbed optimal comfort values.
Both measurement and CFD modeling revealed significant temperature rises of the floor area directly exposed to the sun. Although, a relatively small area, it greatly influences comfort conditions by raising the average temperature of the air and by introducing strong buoyancy.
Even though the simulation of the room is simplified by omitting occupants, furniture, and additional heat sources, it could be concluded that solar radiation is a very important factor in estimating comfortable thermal environments. To properly predict heat balance and comfort conditions in the room, it must be included in numerical simulations.
The presented numerical analysis can be relatively easily expanded to similar technical problems from the field of heating, ventilation and air-conditioning. It could also include air humidity internal heat sources, such as people, computers, monitors, etc. Furthermore, time-dependent boundary conditions could be included as a variable air flow outlet angle achieved by swinging flaps on an indoor A/C unit. Including those factors leads to more realistic simulations but a major limiting factor in simulating such, more complex problems is the available CPU power, i.e. calculation time.
4 NOMENCLATURE
C constantg acceleration due to gravity, [m/s²]H height, [m]k turbulence kinetic energy, [m2/s²]q heat flux, [W/m²]S source termt time, [s]T temperature, [K]u,v,w velocity, [m/s]x,y,z Cartesian coordinatesα heat transfer coefficient, [W/m²K]Γ diffusivityε turbulent dissipation rate, [m²/s³]ε emissivityλ Thermal conductivity, [W/mK]μ dynamic viscosity, [Pa∙s]ν kinematic viscosity, [m²/s]ρ density, [kg/m³]σ Stefan-Boltzmann constant,
5.67∙108 [W/m²K4]
Strojniški vestnik - Journal of Mechanical Engineering 61(2015)11, 641-650
650 Bonefacic, I. – Wolf, I. – Frankovic, B.
σk turbulent Prandtl number for kσε turbulent Prandtl number for εφ transported scalarΦ angle, [°]
Subscriptso outdoor ∞ radiation sourcein inletint internal surfaceext external surface
5 REFERENCES
[1] Fanger, P.O., Melikov, A.K., Hanzawa, H., Ring, J. (1998). Air turbulence and sensation of draught. Energy and Buildings, vol. 12, no. 1, p. 21-39, DOI:10.1016/0378-7788(88)90053-9.
[2] Olesen, B.W., Parsons, K.C. (2002). Introduction to thermal comfort standards and to the proposed new version of EN ISO 7730, Energy & Buildings, vol. 34, no. 6, p. 537-548, DOI:10.1016/S0378-7788(02)00004-X.
[3] Stritih, U., Butala, V. (2011). Energy savings in building with a PCM free cooling system. Strojniški vestnik - Journal of Mechanical Engineering, vol. 57, no. 2, p. 125-134, DOI:10.5545/sv-jme.2010.066.
[4] Dovjak, M., Shukuya, M., Krainer, A. (2012). Exergy analysis of conventional and low exergy systems for heating and cooling of near zero energy buildings Strojniški vestnik - Journal of Mechanical Engineering, vol. 58, no. 7-8, p. 453-461. DOI:10.5545/sv-jme.2011.158.
[5] Rutman, E., Inard, C., Viličić, I., Franković, B., Bailly, A. (2000). A global approach of air conditioned indoor environment quality considering thermal comfort, acoustic comfort and air diffusion. Energy and the Environment, Conference Proceedings, vol. 2, p. 149-158.
[6] Rutman, E., Fournier, F., Jurkowski, R., Bailly, A., Franković, B., Viličić, I. (2002). Industrial approach for CFD modelling applications for air-conditioning and heat exchanger systems. Energy and the Environment, Conference Proceedings, vol. 2, p. 11-18.
[7] Wolf, I. (2010). Numerical and Experimental Analysis of Thermal Comfort Parameters in an Air-Conditioned Room, PhD thesis. University of Rijeka, Faculty of Engineering. (in Croatian)
[8] Dovrtel, K., Medved, S. (2011). Weather-predicted control of building free cooling system. Applied Energy, vol. 88, no. 9, p. 3088-3096, DOI:10.1016/j.apenergy.2011.03.010.
[9] Kuznik, F., Rusaouën, G., Hohotă, R. (2006). Experimental and numerical study of a mechanically ventilated enclosure with thermal effects. Energy and Buildings, vol. 38, no. 8, p. 931-938, DOI:10.1016/j.enbuild.2005.08.016.
[10] Sevilgen, G., Kilic, M. (2011). Numerical analysis of air flow, heat transfer, moisture transport and thermal comfort in a room heated by two-panel radiators. Energy and Buildings, vol. 43, no. 1, p. 137-146, DOI:10.1016/j.enbuild.2010.08.034.
[11] Aziz, M.A., Gad, I.A.M., Mohammed, E.S.F.A., Mohammed, R.H. (2012). Experimental and numerical study of influence of air ceiling diffusers on room air flow characteristics. Energy and Buildings, vol. 55, p. 738-746, DOI:10.1016/j.enbuild.2012.09.027.
[12] CEN Standard EN15251 (2007). Indoor environmental input parameters for design and assessment of energy performance of buildings addressing indoor air quality, thermal environment, lighting and acoustics. European Committee for Standardization, Bruxelles.
[13] ASHRAE Standard 55 (2010). Thermal Environmental Conditions for Human Occupancy. American Society of Heating Refrigeration and Air-Conditioning Engineers, Atlanta.
[14] ISO 7730 (2005). Ergonomics of the Thermal Environment - Analytical Determination and Interpretation of Thermal Comfort using Calculation of the PMV and PPD Indices and Local Thermal Comfort Criteria. International Organization for Standardization, Geneva.
[15] Olesen, B.W., Schoeler, M., Fanger, P.O. (1979). Discomfort caused by vertical air temperature differences. Indoor Climate, Fanger, P.O., Valbjorn, O., (eds.) Danish Building Research Institute, Copenhagen, p. 561-579
[16] ISO 7726 (1998). Ergonomics of the Thermal Environment - Instrument for Measuring Physical Quantities, International Organization for Standardization, Geneva.
[17] Horikiri, K., Yao, Y., Yao, J. (2015). Numerical optimisation of thermal comfort improvement for indoor environment with occupants and furniture. Energy and Buildings, vol. 88, p. 303-315, DOI:10.1016/j.enbuild.2014.12.015.
[18] Viličić, I., (1994). Energy modelling with meteorological parameters of test referent year. Energy and the Environment, Conference Proceedings, vol. 2, p. 525-534.
[19] Henkes, R.A.W.M., Hoogendoorn, C.J. (1994). Scaling of the turbulent natural convection flow in a heated square cavity. Journal of Heat Transfer, vol. 116, no. 2, p. 400-408, DOI:10.1115/1.2911412.
[20] Rouaud, O., Havet, M. (2002). Computation of the airflow in a pilot scale clean room using K-ε turbulence models. International Journal of Refrigeration, vol. 25, no. 2, p. 351-361, DOI:10.1016/S0140-7007(01)00014-7.
[21] FLUENT 6.3 (2006). User’s Guide, FLUENT Inc., New York.[22] Patankar, S.V. (1980). Numerical Heat Transfer and Fluid
Flow. Hemisphere, Washington DC.[23] Fanger, P.O. (1970). Thermal Comfort: Analysis and
Applications in Environmental Engineering. Mc Graw Hill, New York.