Embed Size (px)
Citation preview
10th International Conference on Fracture Mechanics of Concrete and Concrete StructuresFraMCoS-X
G. Pijaudier-Cabot, P. Grassl and C. La Borderie (Eds)
NUMERICAL INVESTIGATION OF FACTORS INFLUENCING THEEXPERIMENTAL DETERMINATION OF CONCRETE FRACTURE
ENERGY
GILDA DAISSE∗†, IOANNIS BOUMAKIS†, CHRISTIAN CARLONI††,ROMAN WAN-WENDNER† ‡
†Christian Doppler Laboratory, University of Natural Resources and Life SciencesVienna, Austria
e-mail: [email protected]: [email protected]
††Case Western Reserve University, Department of Civil EngineeringCleveland, OH USA
e-mail: [email protected]
‡Ghent University, Department of Structural EngineeringGhent, Belgium
e-mail: [email protected]
Key words: Strain rate, Fracture energy, Loading rate effect, LDPM
Abstract. The fracture energy is one of the most crucial parameters for the numerical investigation ofdamage propagation and failure in reinforced concrete members. The correct characterization of con-crete fracture properties can be compromised by different laboratory limitations, such as specimenssize, mode of control, loading rate and the test apparatus. Nowadays limited recommendations existconcerning the experimental evaluation of fracture energy for normal and high strength concrete. Inorder to investigate the differences between different specimen sizes, evaluate the effect of mode ofcontrol and analyze the influence of different set-up on the fracture test, a numerical analysis sup-ported by an experimental campaign is presented. The Lattice Discrete Particle Model (LDPM) hasbeen used to simulate concrete and to provide realistic crack patterns and crack widths. In the firstpart of the study the position of the traveling crack tip is identified with two approaches and thenused to investigate the strain rate distribution along the ligament. It is well-known that concrete isa visco-elastic material with strain-rate dependent fracture properties. For this reason in the secondpart of the study the potential influence of differences in loading rate on the effective fracture energydetermined by the work of fracture method is investigated with simulated three-point bending tests ofdifferently sized specimens and two notch depths.
1 INTRODUCTION
The understanding and description of con-crete fracture is of major importance for the safedesign of structures [1]. The experimental eval-uation of fracture energy is difficult for quasi-brittle material and the results can be compro-
mised by different laboratory limitations. Inthis work, the classical three-point bending con-figuration is adopted and some of the influ-ence factors which may effect the determina-tion of the fracture parameters are investigatedby means of numerical simulations. Fracture
1

G. Daisse , I. Boumakis, C. Carloni, R. Wan-Wendner
tests on quasi-brittle material are often per-formed in crack mouth opening displacement(CMOD) control which ensures stable testseven for highly brittle specimens. Alternatively,fracture tests can also be controlled by load-point displacement if the load-frame is suffi-ciently stiff compared to the specimen compli-ance. Nowadays, it is widely known that con-crete is a visco-elastic material with rate depen-dent fracture properties, but the possible impli-cations of this behavior are still not fully stud-ied. For this reason, in this work, three-pointbending tests are simulated, replicating numer-ically both modes of control (open and closedloop). The strain and the strain rate at the crack-tip are monitored throughout the entire fracturepropagation process. The possible implicationthat the change of strain rate can introduce onthe material are then investigated through sim-ulations with three different loading rates: (1)the quasi-static rate, where the peak is reachedin 320 seconds, (2) a loading rate one order ofmagnitude higher, and (3) a loading rate one or-der of magnitude lower. The results in termsof fracture energy and the peak-load are thenpresented and discussed. The well-known dis-crete concrete model, the Lattice Discrete Par-ticle Model (LDPM) [2, 3] is chosen with theextensions as discussed in [4, 5]. The concretecreep effects are taken into account through arate-type model based on the micro-prestress-solidification formulation, able to combine thedifferent chemical and physical mechanisms.
2 LDPM SIMULATIONS2.1 Lattice Discrete Particle Model
The LDPM is a concrete model able to sim-ulate the mechanical interaction of coarse ag-gregate pieces embedded in a cementitious ma-trix. This meso-scale model is formulated inthe framework of discrete element models, fol-lowing the assumption of spherical aggregates,named particles. A lattice mesh is createdaround them, connecting all the centers of theaggregates. A system of polyhedral cells is cre-ated performing a Delauney tetrahedralizationand domain tessellation on the concrete domain.
The cells interact with each other through tri-angular facets on which the vectorial constitu-tive law is acting. In the elastic range the nor-mal stress is proportional to the normal strainthrough a parameter EN and the shear stressesare proportional to the shear strain through ET ,where EN = E0 (E0= effective normal modu-lus) and ET = αE0 (α=shear-normal couplingparameter). When the elastic limit is reached,the LDPM formulation considers fracture andcohesion, pore collapse and friction. A moredetailed description of the model can be foundin [2, 3].
2.2 Creep ImplementationIn this contribution, creep is modeled in
a rate-type form which is able to combinethe different physical and chemical mecha-nisms. This form is based on the Micro-Prestress-Solidification Theory (MPS) pro-posed by Bazant et al. [6, 7], where the totalstrain rate εtot is split into different strain ratesthat describe different physical mechanisms, asfollows:
εtot = ε∗ + εν + εf + εsh + εth + εdam (1)
where ε∗ is the instantaneous response, εν is theviscoelastic response, εf is the pure viscoelasticflow, εsh and εth are respectively the hygral andthermal strain rate and εdam is the strain rate dueto damage. For more details about the imple-mentation of the adopted creep model one canrefer to Boumakis et al. [4].
2.3 Three Point Bending ModelThe aim of this study is to analyze some
of the experimental factors which influencethe experimental determination of fracture pa-rameters. For this reason the classical three-point-bending configuration is chosen, where anotched beam rests on two roller supports andis subjected to a concentrated load at its cen-ter. Three different geometries and two notchdepths are modeled and investigated. The in-vestigated dimensions are reported in Table 1.
2

G. Daisse , I. Boumakis, C. Carloni, R. Wan-Wendner
Table 1: Geometry of three-point bending specimens.
Type D [mm] B [mm] L [mm] a0 [mm]A1 75 75 300 22.5 (0.3D)A2 75 75 300 37.5 (0.5D)B1 150 150 600 45 (0.3D)B2 150 150 600 75 (0.5D)C1 300 300 1200 90 (0.3D)C2 300 300 1200 150 (0.5D)
2.4 PID controllerThree-point bending tests are typically per-
formed with closed-loop control where the loadapplied on the top loading rate is controlledin such a way that a prescribed crack mouthopening displacement (CMOD) rate is ensured.In order to simulate this mode of control,also numerically a PID controller for this ex-plicit solver is applied [8]. In general, a PIDcontroller (proportional-integral-derivative con-troller) is a control loop feedback mechanismcommonly used in industry. The algorithm con-tinuously calculates an error value as the differ-ence between a measured process variable anda desired set point, here the CMOD. The con-troller is then able to minimize the error overtime by adjustment of a control variable, herethe force at the load point.
3 MATERIAL AND EXPERIMENTSThis contribution is based on experimental
results obtained by testing concrete of classC25/50. The mix design is reported in Table 2.
Table 2: Concrete mix design.
Cement type CEM II 42.5 NWater to cement ratio, w/c [-] 0.63Cement content, c [kg/m3] 275rmin/rmax [mm] 4/16Aggregate to cement ratio [-] 7.59
In order to adequately model the material,short-term and long-term properties are charac-terized.
3.1 Short-term testsThe material characterization performed
consists of compression tests on cylinders andcubes, fracture tests and indirect tensile strength(Brazilian splitting) [9]. Compressive strengthwas determined using cubes with a side lengthof 150 mm and cylinders of dimensions 150 ×300 mm and the tests were performed accord-ing to EN 12390-3 (2009). Tensile strengthwas determined through Brazilian splitting testson cylindrical specimens with a diameter of150 mm and a height of 70 mm accordingto DIN EN 12390-6:2000. The specimenswere stored in water with added lime (3g/l) ina room with a constant temperature of 23◦C.The tests were performed at a concrete age of70 days. The determined tensile strength, ten-sile strength, Young modulus and compressivestrength of 3.52 MPa, 31.1 GPa and 36.8 /36.45 MPa, respectively. In order to obtain theloading rate dependence on concrete, notchedthree point bending tests were carried out withfive different rates (Table 3). The dimension ofthe specimens are 100× 100× 400 mm and thecut notch has a width of 4 mm and a depth of30 mm. All the fracture tests were performed inCMOD control and the load-point displacementwas monitored by means of DIC measurements.The specimens tested with the quasi-static load-ing rate (1 QS) reached the peak in about 320 s.
Table 3: Three-point bending tests loading rates.
Relative rates Tested rates0.1 QS 0.01 µm/s0.3 QS 0.03 µm/s1 QS 0.1 µm/s3 QS 0.3 µm/s10 QS 1 µm/s
3.2 Long-term testsCreep and shrinkage tests were performed
on both sealed and drying cylinders with a di-ameter of 150 mm and a height of 300 mm.The specimens were stored in a water bath satu-rated with lime solution until the desired age.Three strain gauges with 50 mm length were
3

G. Daisse , I. Boumakis, C. Carloni, R. Wan-Wendner
applied around the cylinder in a 120o config-uration. For creep tests four specimens wereloaded in compression at around 30% of thecompressive strength. Two of the specimenswere sealed using a vapor barrier in order to ob-tain two dataset for each basic and total creep.Also, sealed specimens were instrumented rightafter the demoulding of the concrete in order tomeasure autogenous shrinkage.
3.3 Model CalibrationThe lattice discrete particle model is adopted
to simulate the damage propagation. The staticparameters are calibrated to match the abovementioned experimental results and they are re-ported in Table 4.
Table 4: Calibrated LDPM parameters.
Static Parameter ValueEffective Normal Modulus, E0 50 [GPa]Shear-Normal Coupling Parameter, α 0.25 [-]Tensile Strength, σt 2.4 [MPa]Tensile Characteristic Length, `t 240 [mm]Shear Strength Ratio, σs/σt 3.5 [-]Initial Friction, µ0 0.2 [-]Softening Exponent, n 1.5 [-]
4 ANALYSIS OF THE INFLUENCEFACTORS
The results shown in this section are theproduct of numerical simulations calibrated onthe above introduced experiments.
4.1 Mode of controlFracture tests involve three parameters: load,
load-point displacement and crack mouth open-ing displacement (CMOD). During three-pointbending tests the CMOD continuously in-creases as fracture proceeds and for this reasonthe crack opening has been proposed as con-trol variable. This way of testing ensures thefull conversion of the supplied energy into cracksurface energy and it is the most used for brit-tle and quasi-brittle materials. However, labora-tory limitations can lead to the necessity of per-
forming the tests in constant displacement rateand a stable fracture propagation can be difficultto obtain. In this work, two modes of controlare compared analyzing the strain rate at the ac-tual crack-tip. The latter is determined with twodifferent approaches and then compared. Thefirst method for the determination of the crack-tip position, is based on the assumption that thedamage begins when the ultimate tensile strainof the concrete, εT , has been exceeded (Fig. 1).
Figure 1: Strain profile of specimen A1 at different pointin time: A) 40% before the peak, B) 80% before the peakand C) at the peak.
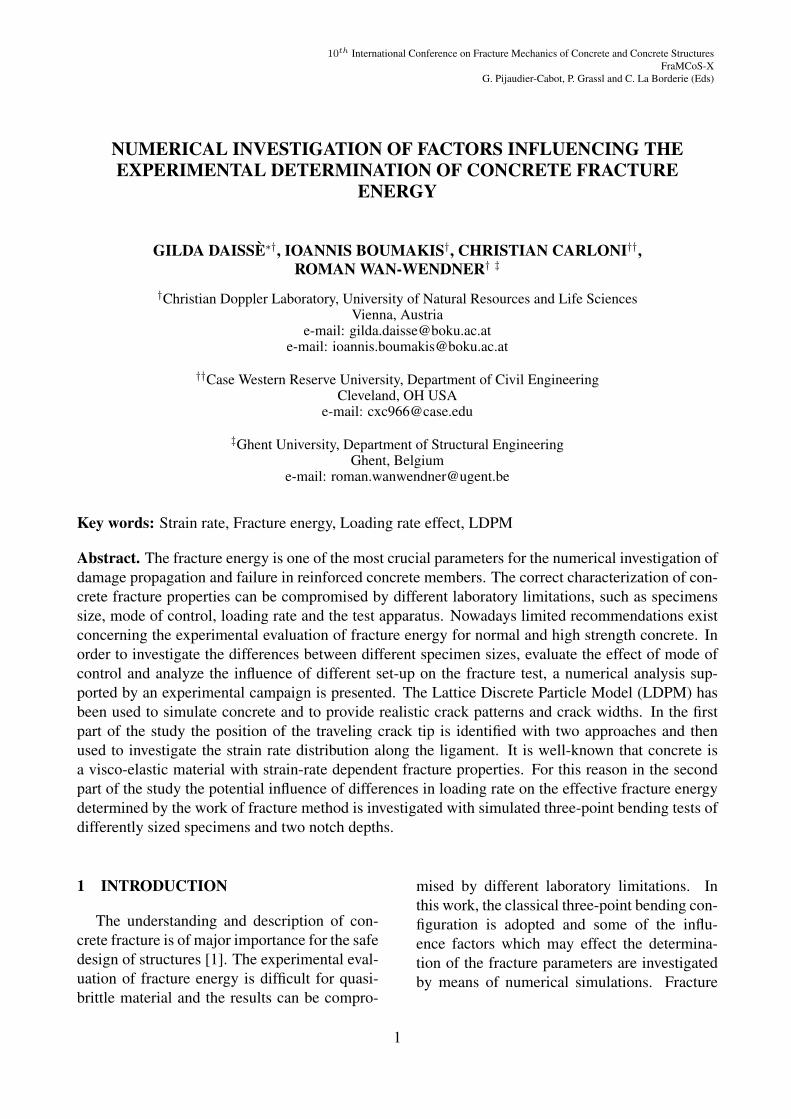
To obtain this result, a set of virtual exten-someters is applied on the specimen surface(Fig. 2 on the left) with a step of 6 mm be-tween each of them, corresponding to the meshsize (1.5 coarse aggregate diameter). The sec-ond approach is based on the energy dissipateddue to the fracture propagation. The relevantdata are extracted from the LDPM simulationsin the central region (Fig. 2 on the right) andthen the dissipated energy is calculated for hor-izontal stripes of 6 mm height through a numeri-
4
G. Daisse , I. Boumakis, C. Carloni, R. Wan-Wendner
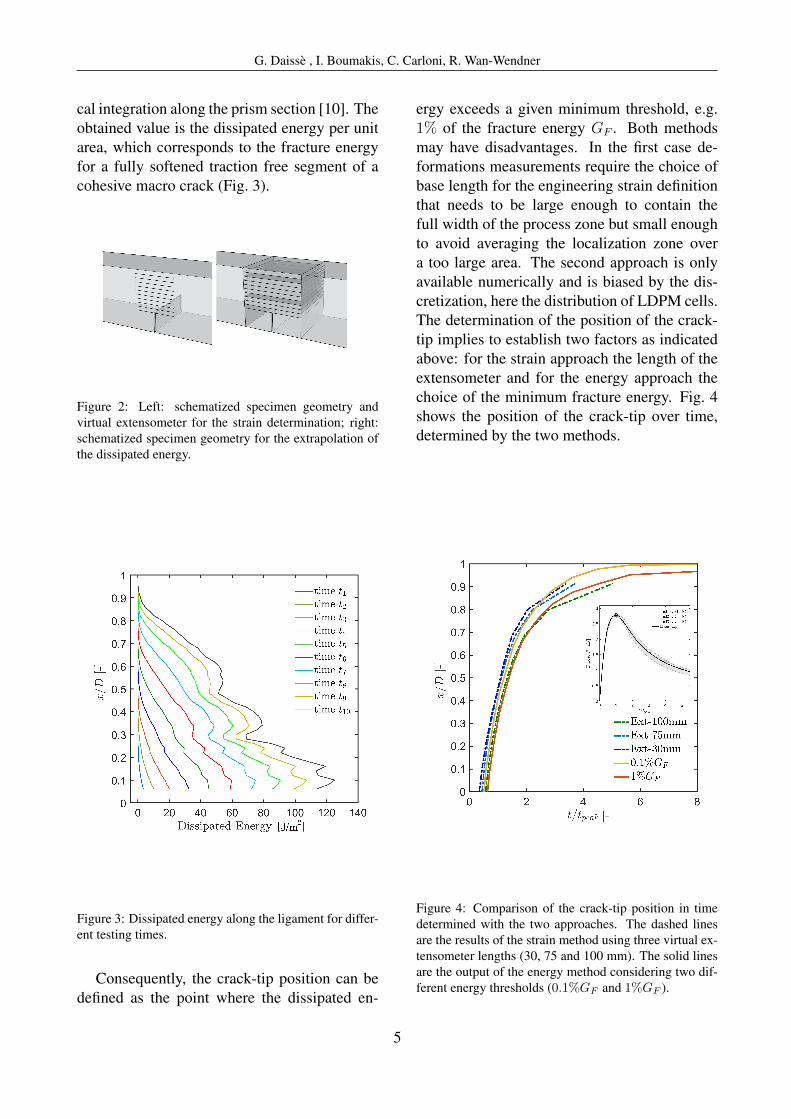
cal integration along the prism section [10]. Theobtained value is the dissipated energy per unitarea, which corresponds to the fracture energyfor a fully softened traction free segment of acohesive macro crack (Fig. 3).
Figure 2: Left: schematized specimen geometry andvirtual extensometer for the strain determination; right:schematized specimen geometry for the extrapolation ofthe dissipated energy.
Figure 3: Dissipated energy along the ligament for differ-ent testing times.
Consequently, the crack-tip position can bedefined as the point where the dissipated en-
ergy exceeds a given minimum threshold, e.g.1% of the fracture energy GF . Both methodsmay have disadvantages. In the first case de-formations measurements require the choice ofbase length for the engineering strain definitionthat needs to be large enough to contain thefull width of the process zone but small enoughto avoid averaging the localization zone overa too large area. The second approach is onlyavailable numerically and is biased by the dis-cretization, here the distribution of LDPM cells.The determination of the position of the crack-tip implies to establish two factors as indicatedabove: for the strain approach the length of theextensometer and for the energy approach thechoice of the minimum fracture energy. Fig. 4shows the position of the crack-tip over time,determined by the two methods.
Figure 4: Comparison of the crack-tip position in timedetermined with the two approaches. The dashed linesare the results of the strain method using three virtual ex-tensometer lengths (30, 75 and 100 mm). The solid linesare the output of the energy method considering two dif-ferent energy thresholds (0.1%GF and 1%GF ).
5

G. Daisse , I. Boumakis, C. Carloni, R. Wan-Wendner
With the strain approach, three different vir-tual extensometer lengths (30, 75 and 100 mm)were analyzed and for the second different frac-ture energy amounts are investigated (0.1% and1%GF ).
1 2 3 4 5 6 7 80
0.1
0.2
0.3
0.4
0.5
0.6
0.7
0.8
0.9
Figure 5: Strain rate at the crack-tip using a non-closedloop.
1 2 3 4 5 6 7 80
0.1
0.2
0.3
0.4
0.5
0.6
0.7
0.8
0.9
Figure 6: Strain rate at the crack-tip using a closed loop.
Due to the good degree of overlapping, the100 mm extensometer has been chosen for thefollowing strain rate analysis. The informationabout strain and time makes it easy to derive the
strain rate. Knowing the exact position of thecrack-tip, it is possible to see if its opening ratechanges during its propagation along the liga-ment. In Fig. 5 and 6 the crack-tip position intime and the contour lines showing the strainrate are presented. The first one is the result ofa simulation performed with a open loop (loadpoint displacement control) while in the secondone a closed-loop (CMOD control) is used. Thetest in displacement control takes less time forthe complete propagation of the fracture and thestrain rate is constant in almost all its develop-ment, only decelerating in the last phase. Thetest in CMOD control, on the other hand, showthat the crack-tip strain rate decreases drasti-cally in the first part, then becomes constant andfinally decelerates again towards the end. In therange between 0 and 0.4 of the normalized liga-ment, the strain rate decreases of more then halfof its speed (1.1e-6 to 0.5e-06 s−1), while thenon-closed loop keeps a constant value of ap-proximately 1e-6 s−1.
4.2 Loading rateIt is well known that the change of loading
rate has a direct effect on the mechanical prop-erties of concrete [11]. As discussed in section2, a rate-type model is implemented in this workin order to investigate the possible implicationthat the rate-dependency can have on the frac-ture parameters. Three-point bending simula-tions were run with three different loading rates,corresponding to the relative rates 0.1 QS, 1 QSand 10 QS shown in Table 3, where the quasi-static is the test velocity in which the peak isreached in 320 seconds. The rate effect imple-mentation is calibrated on the experiments de-scribed in section 3.1. For each specimen ge-ometry, the fracture energy and the maximumforce reached are analyzed in relation to the testvelocity. As widely known, the increase of theloading rate leads to an apparent strength in-crease (Fig. 8) which seems to be more accen-tuate in larger specimens. The considerationof the creep contribution accentuates the load-ing rate effect and decreases significantly thestrength, as shown in Fig. 7. It is interesting
6

G. Daisse , I. Boumakis, C. Carloni, R. Wan-Wendner
to observed that the fracture energy at higherloading rates decreases as the rate gets slower(Fig. 9).
0 0.05 0.1 0.15 0.20
0.5
1
1.5
2
2.5
3
Figure 7: Force vs. load-point displacement curve for dif-ferent loading rates. The dashed lines are the simulationswith the creep contribution, while the solid lines are thesimulations where only the rate effect is applied.
However, considering the creep contribu-tion, small specimens showed that for very slowrates, the fracture energy seems to increase asthe rate decreases (Fig. 9 on the right) as al-ready observed experimentally by Wittmann etal. [12].
-3 -2 -1 0 1 2 30.98
0.99
1
1.01
1.02
1.03
1.04
1.05
1.06
-3 -2 -1 0 1 2 30.92
0.94
0.96
0.98
1
1.02
1.04
1.06
1.08
1.1
1.12
Figure 8: Loading rate effect on strength for the differentspecimens geometry
-2 -1 0 1 20.85
0.9
0.95
1
1.05
1.1
1.15
-2 -1 0 1 20.85
0.9
0.95
1
1.05
1.1
1.15
Figure 9: Loading rate effect on the fracture energy GF
for the different specimens geometry
5 CONCLUSIONSThis work aims to analyze the influence of
the laboratory conditions and limitations on thefracture properties. After simulating differenttest features on a three-point bending test, thefollowing conclusions can be drawn:
• The different mode of control of fracturetests lead to different fracture propaga-tion. The tests in displacement controlhave the advantage of maintaining a con-stant strain rate at the crack-tip but in-volve snap-back and instability problems,which makes the fracture energy deter-mination difficult. However, the tests inCMOD control enable the stable fracturepropagation, allowing the determinationof the fracture energy, but it compromisesthe strain rate of the crack-tip, which de-creases during test duration;
• Larger specimens are more influenced bythe loading rate effect, both in terms ofstrength and fracture parameters.
• Creep has an important effect on fracturetests. It is well known that increasing theloading rate the strength increases and ithas been observed that the creep contri-bution amplifies this phenomena.
• Small specimens could be more affectedby the creep for very slow loading rates,showing a growth of the fracture energywhen the rate slows down considerably.
7

G. Daisse , I. Boumakis, C. Carloni, R. Wan-Wendner
ACKNOWLEDGEMENTThe financial support by the Austrian Fed-
eral Ministry of Economy, Family and Youthand the National Foundation for Research,Technology and Development is gratefully ac-knowledged, as is the additional support by ourindustrial partners. The computational resultspresented have been achieved using the ViennaScientific Cluster (VSC).
REFERENCES[1] Bazant, Z.P., and Planas, J. 1998. Frac-
ture and Size Effect in Concrete and OtherQuasi-Brittle Materials, CRC Press LLC,Boca Raton.
[2] Cusatis, G., Pelessone, D., Mencarelli,A. 2011. Lattice Discrete Particle Model(LDPM) for failure behavior of concrete.I:Theory., Cement and Concrete Compos-ites, 33, 881890.
[3] Cusatis, G., Mencarelli, A., Pelessone,D., 2011. Lattice Discrete Particle Model(LDPM) for failure behavior of concrete.II: Calibration and Validation., Cementand Concrete Composites, 33,891-905.
[4] Boumakis, I., Di Luzio, G., Marcon, M.,Vorel, J., Wan-Wendner, R., 2018. Dis-crete element framework for modeling ter-tiary creep of concrete in tension and com-pression, Engineering Fracture Mechanics200 (2018) 263-282.
[5] Boumakis, I., Marcon, M., Nincevic, K.,Czernuschka, L.-M., Wan-Wendner, R.,2018. Concrete creep and shrinkage effectin adhesive anchors subjected to sustainedload, Engineering Structures 175, pp. 790-805.
[6] Bazant, Z.P., Hauggaard, A.B., Baweja,S., Ulm F.-J., 1997. Microprestress-solidification theory for concrete creep i:Aging and drying effects, Journal of Engi-neering Mechanics 123 (11)1188-1194.
[7] Bazant, Z.P., Hauggaard, A.B., Baweja,S., 1997. Microprestress-solidificationtheory for concrete creep ii: Algorithmand verification, Journal of EngineeringMechanics 123 (11)1195-1201.
[8] Vorel, J., Marcon, M., Pelessone, D.,Cusatis, G., Wendner, R., 2016. PID Con-troller in Explicit Solver, 9th Interna-tional Conference on Fracture Mechan-ics of Concrete Structures FraMCoS-9, V.Saouma, J. Bolander, E. Landis, Berkeley.
[9] Czernuschka, L.-M., Wan-Wendner, R.,Vorel, J., 2018. Investigation of fracturebased on sequentially linear analysis, En-gineering Fracture Mechanics 202, pp. 75-86.
[10] Wan-Wendner, L., Wan-Wendner, R.,Cusatis, G., 2018. Age-dependent size ef-fect and fracture characteristics of ultra-high performance concrete, Cement andConcrete Composite 85, 67-82.
[11] Yon, J.-H., Hawkins, N.M., Kobayashi,A.S., 1992. Strain-Rate Sensitivity of Con-crete Mechanical Properties, ACI Materi-als Journal 89.
[12] Wittmann, F.H., Roelfstra, P.E., Mihashi,H., Huang,Y.-Y., Zhang, X.-H., Nomura,N., 1987. Influence of age of loading,water-cement ratio and rate of loadingon fracture energy concrete, Materials andStructures, 103-110.
8