Embed Size (px)
Citation preview
© 2016 IAU, Arak Branch. All rights reserved.
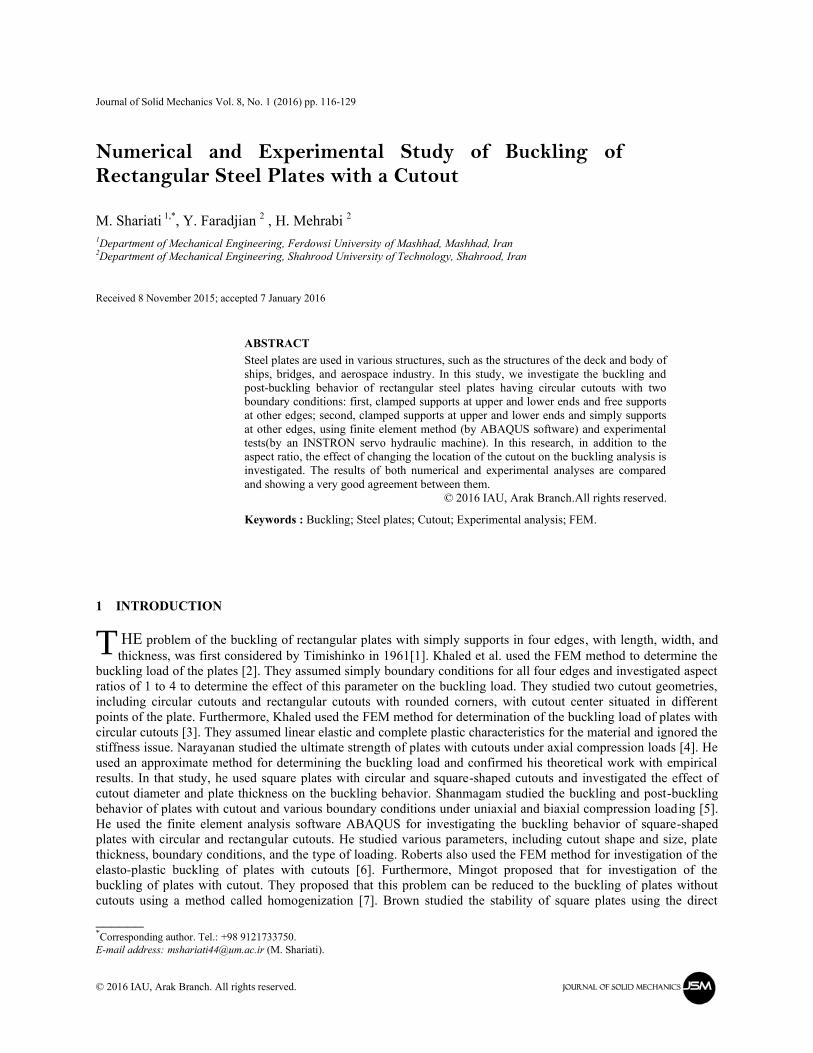
Journal of Solid Mechanics Vol. 8, No. 1 (2016) pp. 116-129
Numerical and Experimental Study of Buckling of Rectangular Steel Plates with a Cutout
M. Shariati 1,*
, Y. Faradjian 2 , H. Mehrabi
2
1Department of Mechanical Engineering, Ferdowsi University of Mashhad, Mashhad, Iran
2Department of Mechanical Engineering, Shahrood University of Technology, Shahrood, Iran
Received 8 November 2015; accepted 7 January 2016
ABSTRACT
Steel plates are used in various structures, such as the structures of the deck and body of
ships, bridges, and aerospace industry. In this study, we investigate the buckling and
post-buckling behavior of rectangular steel plates having circular cutouts with two
boundary conditions: first, clamped supports at upper and lower ends and free supports
at other edges; second, clamped supports at upper and lower ends and simply supports
at other edges, using finite element method (by ABAQUS software) and experimental
tests(by an INSTRON servo hydraulic machine). In this research, in addition to the
aspect ratio, the effect of changing the location of the cutout on the buckling analysis is
investigated. The results of both numerical and experimental analyses are compared
and showing a very good agreement between them.
© 2016 IAU, Arak Branch.All rights reserved.
Keywords : Buckling; Steel plates; Cutout; Experimental analysis; FEM.
1 INTRODUCTION
HE problem of the buckling of rectangular plates with simply supports in four edges, with length, width, and
thickness, was first considered by Timishinko in 1961[1]. Khaled et al. used the FEM method to determine the
buckling load of the plates [2]. They assumed simply boundary conditions for all four edges and investigated aspect
ratios of 1 to 4 to determine the effect of this parameter on the buckling load. They studied two cutout geometries,
including circular cutouts and rectangular cutouts with rounded corners, with cutout center situated in different
points of the plate. Furthermore, Khaled used the FEM method for determination of the buckling load of plates with
circular cutouts [3]. They assumed linear elastic and complete plastic characteristics for the material and ignored the
stiffness issue. Narayanan studied the ultimate strength of plates with cutouts under axial compression loads [4]. He
used an approximate method for determining the buckling load and confirmed his theoretical work with empirical
results. In that study, he used square plates with circular and square-shaped cutouts and investigated the effect of
cutout diameter and plate thickness on the buckling behavior. Shanmagam studied the buckling and post-buckling
behavior of plates with cutout and various boundary conditions under uniaxial and biaxial compression loading [5].
He used the finite element analysis software ABAQUS for investigating the buckling behavior of square-shaped
plates with circular and rectangular cutouts. He studied various parameters, including cutout shape and size, plate
thickness, boundary conditions, and the type of loading. Roberts also used the FEM method for investigation of the
elasto-plastic buckling of plates with cutouts [6]. Furthermore, Mingot proposed that for investigation of the
buckling of plates with cutout. They proposed that this problem can be reduced to the buckling of plates without
cutouts using a method called homogenization [7]. Brown studied the stability of square plates using the direct
______ *Corresponding author. Tel.: +98 9121733750.
E-mail address: [email protected] (M. Shariati).
T
M. Shariati et al. 117
© 2016 IAU, Arak Branch
matrix method [8]. Maan used the fixed grid finite element analysis (FGFEA) method to solve the buckling problem
[9]. Anada studied the buckling eigenvalue for double joint plates [10]. He used square and rectangular plates with
central cutouts. He calculated a buckling coefficient for above-mentioned plates and compared his results with the
existing findings and the finite element analysis results.
The elastic buckling behavior of rectangular perforated plates was studied using the finite element method by
Komur et al. [11]. They chosen circular cutout at different locations along the principal x-axis of plates subjected to
linearly varying loading in order to evaluate the effect of cutout location on the buckling behavior of plates. Their
results show that the center of a circular hole should not be placed at the end half of the outer panel for all loading
patterns. Furthermore, the presence of a circular hole always causes a decrease in the elastic buckling load of plates.
A new approximate procedure for buckling analysis of simply supported rectangular stepped or perforated plates
subjected to uniform edge stresses is formulated by Rahai et al. [12]. The procedure uses energy method based on
modified buckling mode shapes. Eccher et al. [13] provided the application of the isoparametric spline finite strip
method to the elastic buckling analysis of perforated folded plate structures. The general theory of the isoparametric
spline finite strip method is introduced. The linear buckling analyses of square and rectangular plates with circular
and rectangular holes in various positions subjected to axial compression and bending moment are developed has
been studied by Maiorana et al. [14]. The aim of their paper is to give some practical indications on the best position
of the circular hole and the best position and orientation of rectangular holes in steel plates, when axial compression
and bending moment act together. Eccher G, et al. [15] introduced the general theory of the isoparametric spline
finite strip method for buckling of perforated plates. The reliability of their method is demonstrated by applying the
method to classical nonlinear complex plate and shell problems as well as the geometric nonlinear analysis of
perforated flat and stiffened plates. Also, Jeom Kee Paik[16] has been studied ultimate strength of perforated steel
plates under axial compressive loading along short edges using Finite Element Method. The plates are considered to
be simply supported along all (four) edges, keeping them straight. The cutout is circular and located at the center of
the plate.
In this study, we investigate the buckling and post-buckling behavior of steel rectangular plates having circular
cutouts with two boundary conditions: first, clamped supports at upper and lower ends and free supports at other
edges; second, clamped supports at upper and lower ends and simply supports at other edges, using numerical
analysis and experimental methods. The locations of cutouts are interchanged vertically and horizontally on the
plates. The results of both numerical and experimental analyses are compared and showing a very good agreement
between them.
2 MECHANICAL PROPERTIES OF THE PLATES
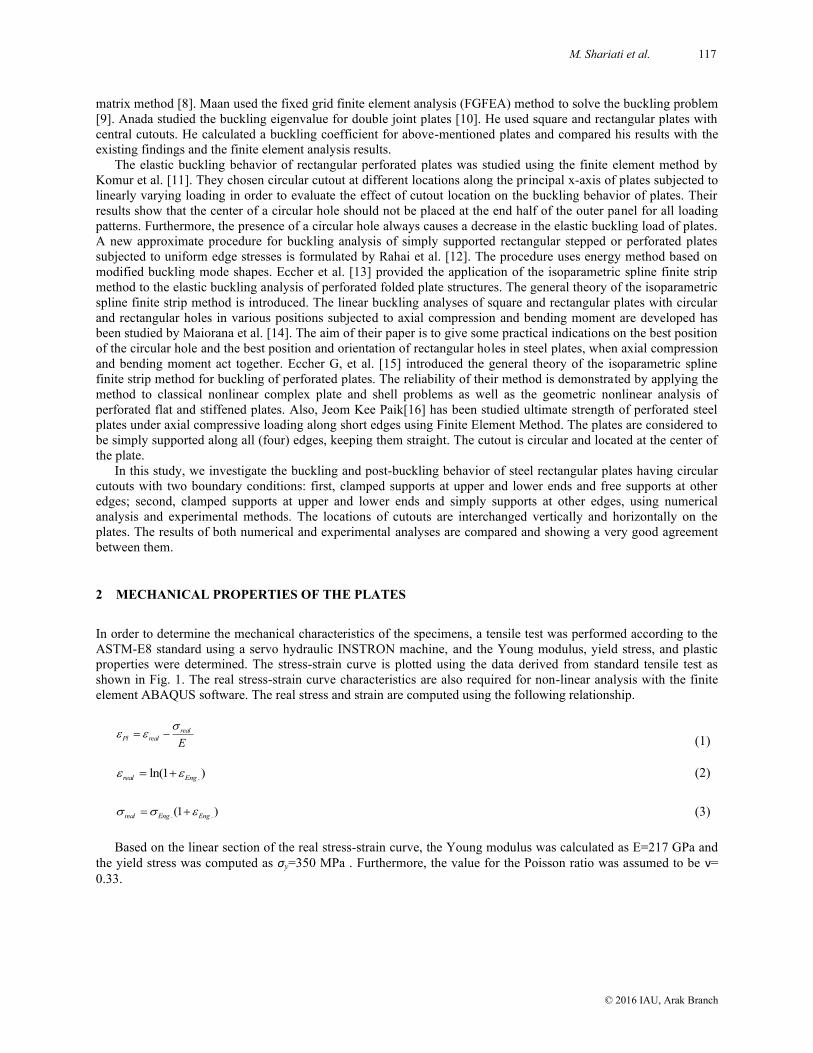
In order to determine the mechanical characteristics of the specimens, a tensile test was performed according to the
ASTM-E8 standard using a servo hydraulic INSTRON machine, and the Young modulus, yield stress, and plastic
properties were determined. The stress-strain curve is plotted using the data derived from standard tensile test as
shown in Fig. 1. The real stress-strain curve characteristics are also required for non-linear analysis with the finite
element ABAQUS software. The real stress and strain are computed using the following relationship.
real
Pl realE
(1)
.ln(1 )real Eng (2)
. .(1 )real Eng Eng (3)
Based on the linear section of the real stress-strain curve, the Young modulus was calculated as E=217 GPa and
the yield stress was computed as σy=350 MPa . Furthermore, the value for the Poisson ratio was assumed to be ν=
0.33.
118 Numerical and Experimental Study of Buckling of Rectangular….
© 2016 IAU, Arak Branch
Fig.1
Experimental stress-strain curve for used steel.
3 GEOMETRY OF THE SPECIMENS
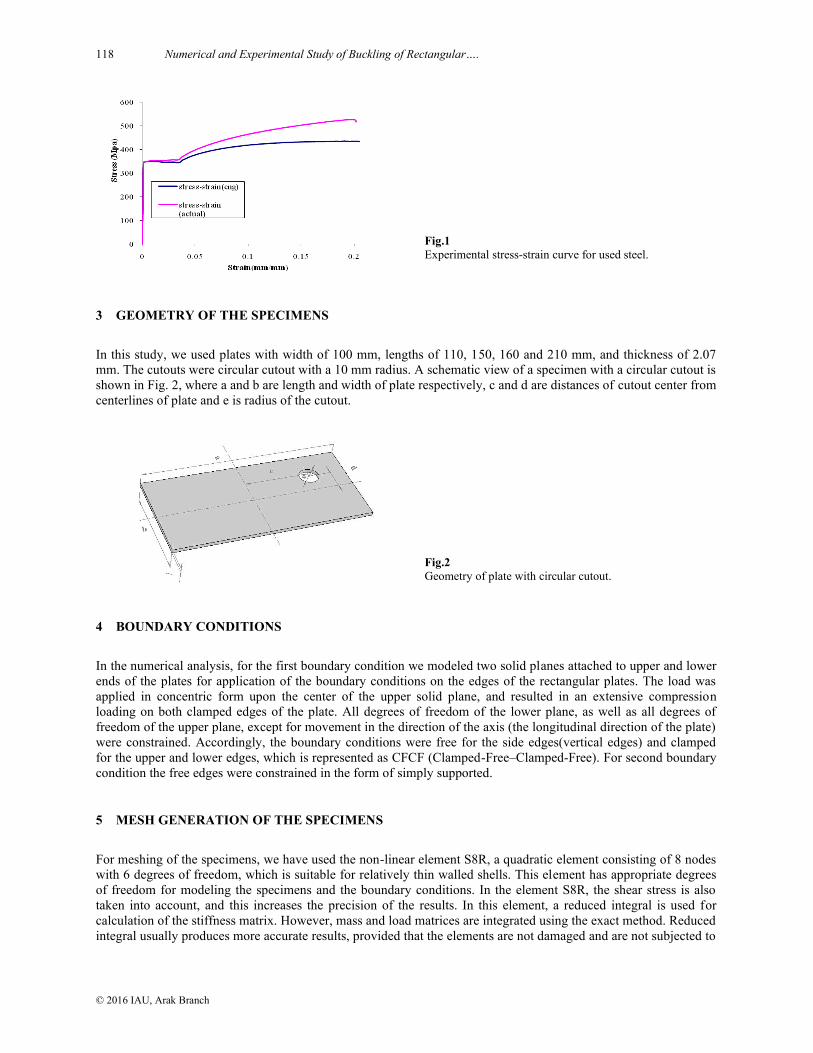
In this study, we used plates with width of 100 mm, lengths of 110, 150, 160 and 210 mm, and thickness of 2.07
mm. The cutouts were circular cutout with a 10 mm radius. A schematic view of a specimen with a circular cutout is
shown in Fig. 2, where a and b are length and width of plate respectively, c and d are distances of cutout center from
centerlines of plate and e is radius of the cutout.
Fig.2
Geometry of plate with circular cutout.
4 BOUNDARY CONDITIONS
In the numerical analysis, for the first boundary condition we modeled two solid planes attached to upper and lower
ends of the plates for application of the boundary conditions on the edges of the rectangular plates. The load was
applied in concentric form upon the center of the upper solid plane, and resulted in an extensive compression
loading on both clamped edges of the plate. All degrees of freedom of the lower plane, as well as all degrees of
freedom of the upper plane, except for movement in the direction of the axis (the longitudinal direction of the plate)
were constrained. Accordingly, the boundary conditions were free for the side edges(vertical edges) and clamped
for the upper and lower edges, which is represented as CFCF (Clamped-Free–Clamped-Free). For second boundary
condition the free edges were constrained in the form of simply supported.
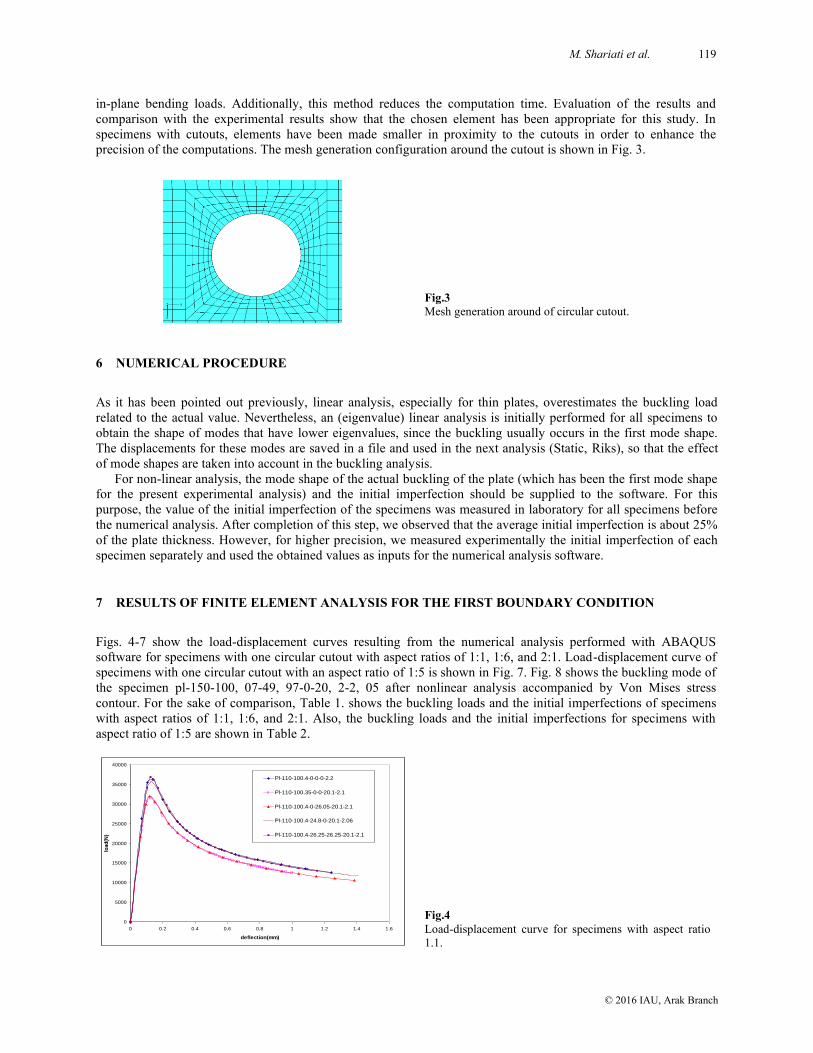
5 MESH GENERATION OF THE SPECIMENS
For meshing of the specimens, we have used the non-linear element S8R, a quadratic element consisting of 8 nodes
with 6 degrees of freedom, which is suitable for relatively thin walled shells. This element has appropriate degrees
of freedom for modeling the specimens and the boundary conditions. In the element S8R, the shear stress is also
taken into account, and this increases the precision of the results. In this element, a reduced integral is used for
calculation of the stiffness matrix. However, mass and load matrices are integrated using the exact method. Reduced
integral usually produces more accurate results, provided that the elements are not damaged and are not subjected to
M. Shariati et al. 119
© 2016 IAU, Arak Branch
in-plane bending loads. Additionally, this method reduces the computation time. Evaluation of the results and
comparison with the experimental results show that the chosen element has been appropriate for this study. In
specimens with cutouts, elements have been made smaller in proximity to the cutouts in order to enhance the
precision of the computations. The mesh generation configuration around the cutout is shown in Fig. 3.
Fig.3
Mesh generation around of circular cutout.
6 NUMERICAL PROCEDURE
As it has been pointed out previously, linear analysis, especially for thin plates, overestimates the buckling load
related to the actual value. Nevertheless, an (eigenvalue) linear analysis is initially performed for all specimens to
obtain the shape of modes that have lower eigenvalues, since the buckling usually occurs in the first mode shape.
The displacements for these modes are saved in a file and used in the next analysis (Static, Riks), so that the effect
of mode shapes are taken into account in the buckling analysis.
For non-linear analysis, the mode shape of the actual buckling of the plate (which has been the first mode shape
for the present experimental analysis) and the initial imperfection should be supplied to the software. For this
purpose, the value of the initial imperfection of the specimens was measured in laboratory for all specimens before
the numerical analysis. After completion of this step, we observed that the average initial imperfection is about 25%
of the plate thickness. However, for higher precision, we measured experimentally the initial imperfection of each
specimen separately and used the obtained values as inputs for the numerical analysis software.
7 RESULTS OF FINITE ELEMENT ANALYSIS FOR THE FIRST BOUNDARY CONDITION
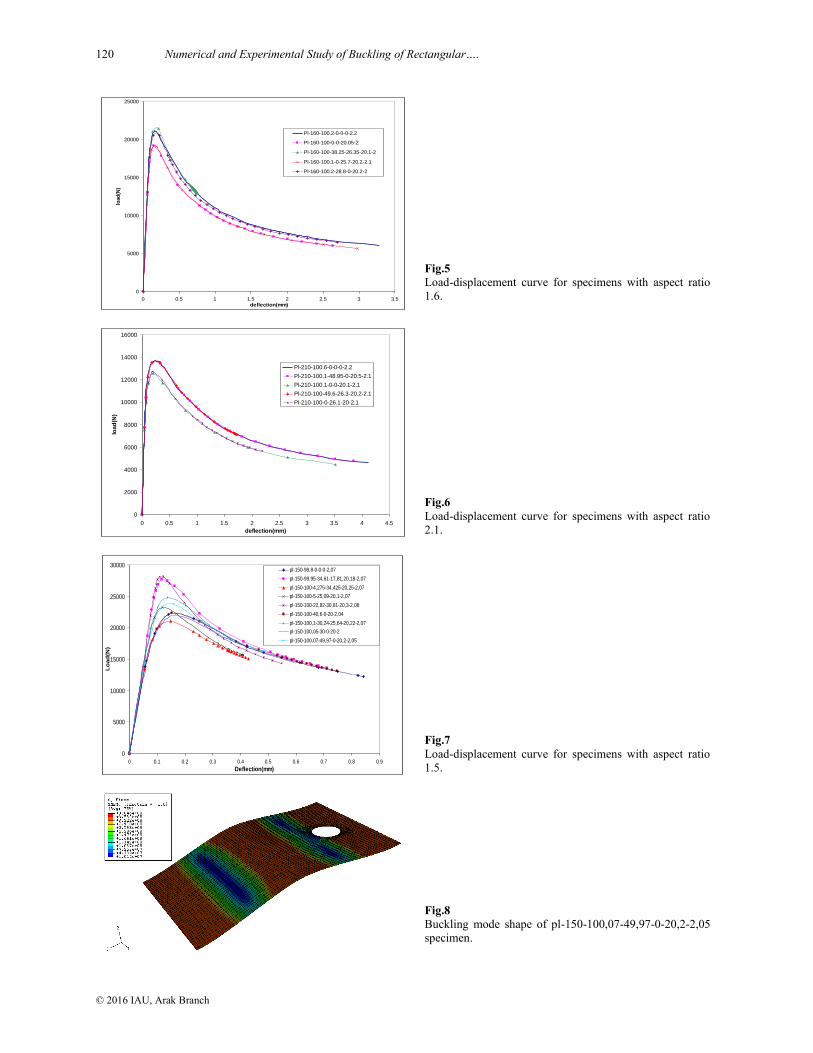
Figs. 4-7 show the load-displacement curves resulting from the numerical analysis performed with ABAQUS
software for specimens with one circular cutout with aspect ratios of 1:1, 1:6, and 2:1. Load-displacement curve of
specimens with one circular cutout with an aspect ratio of 1:5 is shown in Fig. 7. Fig. 8 shows the buckling mode of
the specimen pl-150-100, 07-49, 97-0-20, 2-2, 05 after nonlinear analysis accompanied by Von Mises stress
contour. For the sake of comparison, Table 1. shows the buckling loads and the initial imperfections of specimens
with aspect ratios of 1:1, 1:6, and 2:1. Also, the buckling loads and the initial imperfections for specimens with
aspect ratio of 1:5 are shown in Table 2.
0
5000
10000
15000
20000
25000
30000
35000
40000
0 0.2 0.4 0.6 0.8 1 1.2 1.4 1.6
deflection(mm)
load
(N)
Pl-110-100.4-0-0-0-2.2
Pl-110-100.35-0-0-20.1-2.1
Pl-110-100.4-0-26.05-20.1-2.1
Pl-110-100.4-24.8-0-20.1-2.06
Pl-110-100.4-26.25-26.25-20.1-2.1
Fig.4
Load-displacement curve for specimens with aspect ratio
1.1.
120 Numerical and Experimental Study of Buckling of Rectangular….
© 2016 IAU, Arak Branch
0
5000
10000
15000
20000
25000
0 0.5 1 1.5 2 2.5 3 3.5deflection(mm)
load
(N)
Pl-160-100.2-0-0-0-2.2
Pl-160-100-0-0-20.05-2
Pl-160-100-38.25-26.35-20.1-2
Pl-160-100.1-0-25.7-20.2-2.1
Pl-160-100.2-28.8-0-20.2-2
Fig.5
Load-displacement curve for specimens with aspect ratio
1.6.
0
2000
4000
6000
8000
10000
12000
14000
16000
0 0.5 1 1.5 2 2.5 3 3.5 4 4.5
deflection(mm)
loa
d(N
)
Pl-210-100.6-0-0-0-2.2
Pl-210-100.1-48.95-0-20.5-2.1
Pl-210-100.1-0-0-20.1-2.1
Pl-210-100-49.6-26.3-20.2-2.1
Pl-210-100-0-26.1-20-2.1
Fig.6
Load-displacement curve for specimens with aspect ratio
2.1.
0
5000
10000
15000
20000
25000
30000
0 0.1 0.2 0.3 0.4 0.5 0.6 0.7 0.8 0.9
Deflection(mm)
Lo
ad
(N)
pl-150-99,8-0-0-0-2,07
pl-150-99.95-34,61-17,81,20,18-2,07
pl-150-100-4,275-34,425-20,25-2,07
pl-150-100-5-25,09-20,1-2,07
pl-150-100-22,82-30,81-20,3-2,08
pl-150-100-40,6-0-20-2.04
pl-150-100,1-30,24-25,64-20,22-2,07
pl-150-100,05-30-0-20-2
pl-150-100,07-49,97-0-20,2-2,05
Fig.7
Load-displacement curve for specimens with aspect ratio
1.5.
Fig.8
Buckling mode shape of pl-150-100,07-49,97-0-20,2-2,05
specimen.
M. Shariati et al. 121
© 2016 IAU, Arak Branch
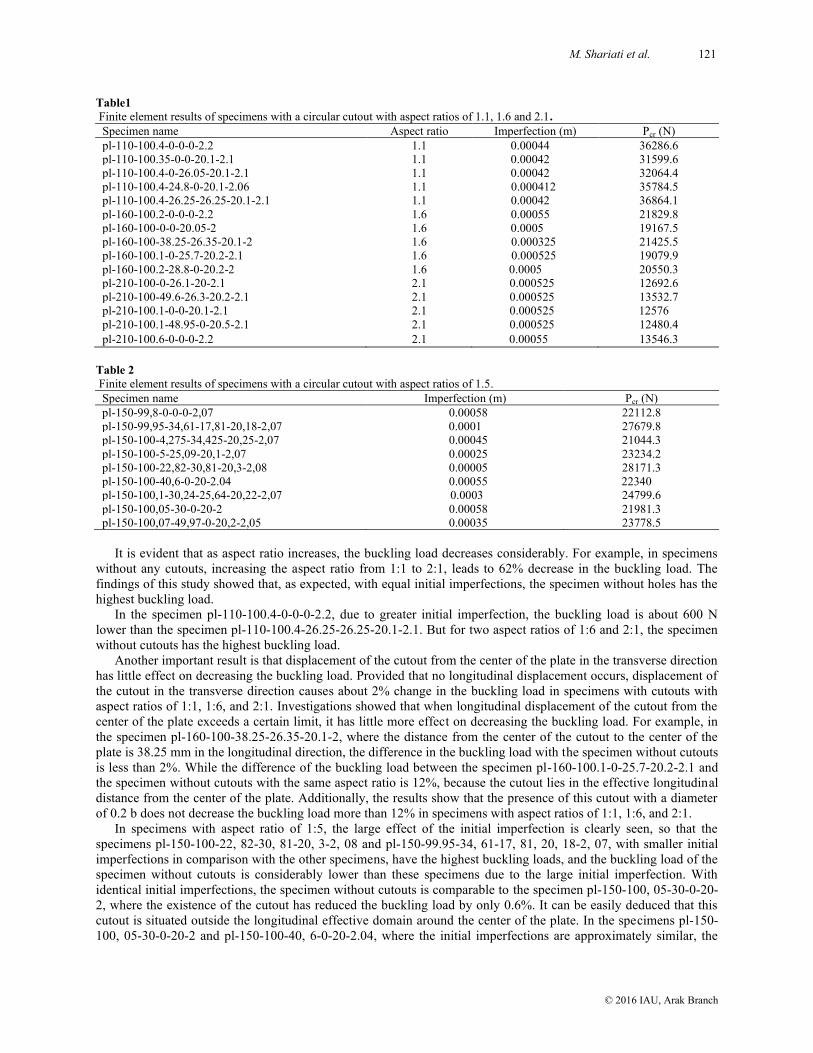
Table1
Finite element results of specimens with a circular cutout with aspect ratios of 1.1, 1.6 and 2.1.
Specimen name Aspect ratio Imperfection (m) Pcr (N)
pl-110-100.4-0-0-0-2.2 1.1 0.00044 36286.6
pl-110-100.35-0-0-20.1-2.1 1.1 0.00042 31599.6
pl-110-100.4-0-26.05-20.1-2.1 1.1 0.00042 32064.4
pl-110-100.4-24.8-0-20.1-2.06 1.1 0.000412 35784.5
pl-110-100.4-26.25-26.25-20.1-2.1 1.1 0.00042 36864.1
pl-160-100.2-0-0-0-2.2 1.6 0.00055 21829.8
pl-160-100-0-0-20.05-2 1.6 0.0005 19167.5
pl-160-100-38.25-26.35-20.1-2 1.6 0.000325 21425.5
pl-160-100.1-0-25.7-20.2-2.1 1.6 0.000525 19079.9
pl-160-100.2-28.8-0-20.2-2 1.6 0.0005 20550.3
pl-210-100-0-26.1-20-2.1 2.1 0.000525 12692.6
pl-210-100-49.6-26.3-20.2-2.1 2.1 0.000525 13532.7
pl-210-100.1-0-0-20.1-2.1 2.1 0.000525 12576 pl-210-100.1-48.95-0-20.5-2.1 2.1 0.000525 12480.4
pl-210-100.6-0-0-0-2.2 2.1 0.00055 13546.3
Table 2
Finite element results of specimens with a circular cutout with aspect ratios of 1.5.
Specimen name Imperfection (m) Pcr (N)
pl-150-99,8-0-0-0-2,07 0.00058 22112.8 pl-150-99,95-34,61-17,81-20,18-2,07 0.0001 27679.8 pl-150-100-4,275-34,425-20,25-2,07 0.00045 21044.3 pl-150-100-5-25,09-20,1-2,07 0.00025 23234.2 pl-150-100-22,82-30,81-20,3-2,08 0.00005 28171.3 pl-150-100-40,6-0-20-2.04 0.00055 22340 pl-150-100,1-30,24-25,64-20,22-2,07 0.0003 24799.6 pl-150-100,05-30-0-20-2 0.00058 21981.3 pl-150-100,07-49,97-0-20,2-2,05 0.00035 23778.5
It is evident that as aspect ratio increases, the buckling load decreases considerably. For example, in specimens
without any cutouts, increasing the aspect ratio from 1:1 to 2:1, leads to 62% decrease in the buckling load. The
findings of this study showed that, as expected, with equal initial imperfections, the specimen without holes has the
highest buckling load.
In the specimen pl-110-100.4-0-0-0-2.2, due to greater initial imperfection, the buckling load is about 600 N
lower than the specimen pl-110-100.4-26.25-26.25-20.1-2.1. But for two aspect ratios of 1:6 and 2:1, the specimen
without cutouts has the highest buckling load.
Another important result is that displacement of the cutout from the center of the plate in the transverse direction
has little effect on decreasing the buckling load. Provided that no longitudinal displacement occurs, displacement of
the cutout in the transverse direction causes about 2% change in the buckling load in specimens with cutouts with
aspect ratios of 1:1, 1:6, and 2:1. Investigations showed that when longitudinal displacement of the cutout from the
center of the plate exceeds a certain limit, it has little more effect on decreasing the buckling load. For example, in
the specimen pl-160-100-38.25-26.35-20.1-2, where the distance from the center of the cutout to the center of the
plate is 38.25 mm in the longitudinal direction, the difference in the buckling load with the specimen without cutouts
is less than 2%. While the difference of the buckling load between the specimen pl-160-100.1-0-25.7-20.2-2.1 and
the specimen without cutouts with the same aspect ratio is 12%, because the cutout lies in the effective longitudinal
distance from the center of the plate. Additionally, the results show that the presence of this cutout with a diameter
of 0.2 b does not decrease the buckling load more than 12% in specimens with aspect ratios of 1:1, 1:6, and 2:1.
In specimens with aspect ratio of 1:5, the large effect of the initial imperfection is clearly seen, so that the
specimens pl-150-100-22, 82-30, 81-20, 3-2, 08 and pl-150-99.95-34, 61-17, 81, 20, 18-2, 07, with smaller initial
imperfections in comparison with the other specimens, have the highest buckling loads, and the buckling load of the
specimen without cutouts is considerably lower than these specimens due to the large initial imperfection. With
identical initial imperfections, the specimen without cutouts is comparable to the specimen pl-150-100, 05-30-0-20-
2, where the existence of the cutout has reduced the buckling load by only 0.6%. It can be easily deduced that this
cutout is situated outside the longitudinal effective domain around the center of the plate. In the specimens pl-150-
100, 05-30-0-20-2 and pl-150-100-40, 6-0-20-2.04, where the initial imperfections are approximately similar, the
122 Numerical and Experimental Study of Buckling of Rectangular….
© 2016 IAU, Arak Branch
loads are seen to be almost identical, while the longitudinal distance of the center of the circular cutout has increased
by about 10 mm. Accordingly, we can conclude that when the cutout is outside the effective longitudinal distance
from the middle of the plate, displacement of the cutout has little effect on the buckling load. Furthermore, the
smallest buckling load for this aspect ratio belongs to the specimen pl-150-100-4, 275-34, 425-20, 25-2, 07, because
not only the cutout lies in the effective domain, but also there is a relatively large initial imperfection in this
specimen.
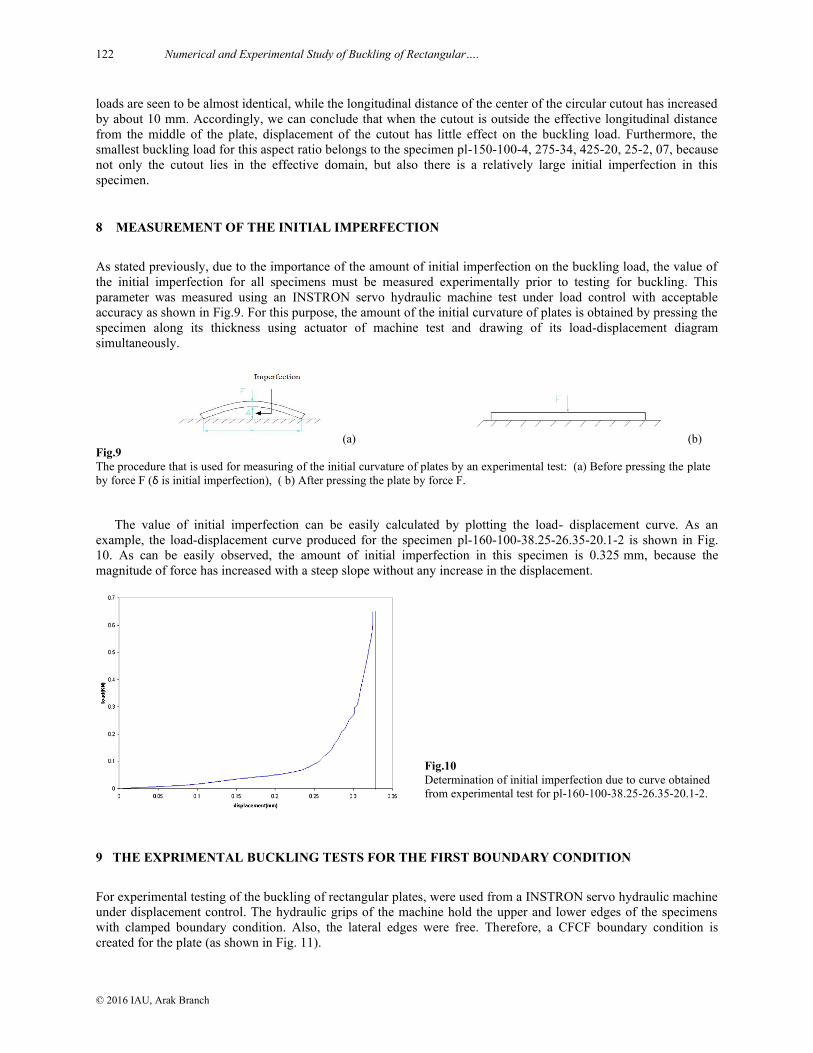
8 MEASUREMENT OF THE INITIAL IMPERFECTION
As stated previously, due to the importance of the amount of initial imperfection on the buckling load, the value of
the initial imperfection for all specimens must be measured experimentally prior to testing for buckling. This
parameter was measured using an INSTRON servo hydraulic machine test under load control with acceptable
accuracy as shown in Fig.9. For this purpose, the amount of the initial curvature of plates is obtained by pressing the
specimen along its thickness using actuator of machine test and drawing of its load-displacement diagram
simultaneously.
(a) (b)
Fig.9
The procedure that is used for measuring of the initial curvature of plates by an experimental test: (a) Before pressing the plate
by force F (δ is initial imperfection), ( b) After pressing the plate by force F.
The value of initial imperfection can be easily calculated by plotting the load- displacement curve. As an
example, the load-displacement curve produced for the specimen pl-160-100-38.25-26.35-20.1-2 is shown in Fig.
10. As can be easily observed, the amount of initial imperfection in this specimen is 0.325 mm, because the
magnitude of force has increased with a steep slope without any increase in the displacement.
Fig.10
Determination of initial imperfection due to curve obtained
from experimental test for pl-160-100-38.25-26.35-20.1-2.
9 THE EXPRIMENTAL BUCKLING TESTS FOR THE FIRST BOUNDARY CONDITION
For experimental testing of the buckling of rectangular plates, were used from a INSTRON servo hydraulic machine
under displacement control. The hydraulic grips of the machine hold the upper and lower edges of the specimens
with clamped boundary condition. Also, the lateral edges were free. Therefore, a CFCF boundary condition is
created for the plate (as shown in Fig. 11).
M. Shariati et al. 123
© 2016 IAU, Arak Branch
Fig.11
Plates in hydraulic clamped grips.
10 RESULTS OF THE EXPERIMENTAL TESTS
Similar to the results of numerical analysis, the results of the experimental analysis are classified into multiple
categories and are presented accordingly. For each group of the specimens, we present figures related to the
buckling mode of the specimens, load-displacement curves, and a table summarizing the buckling load and the
initial imperfection.
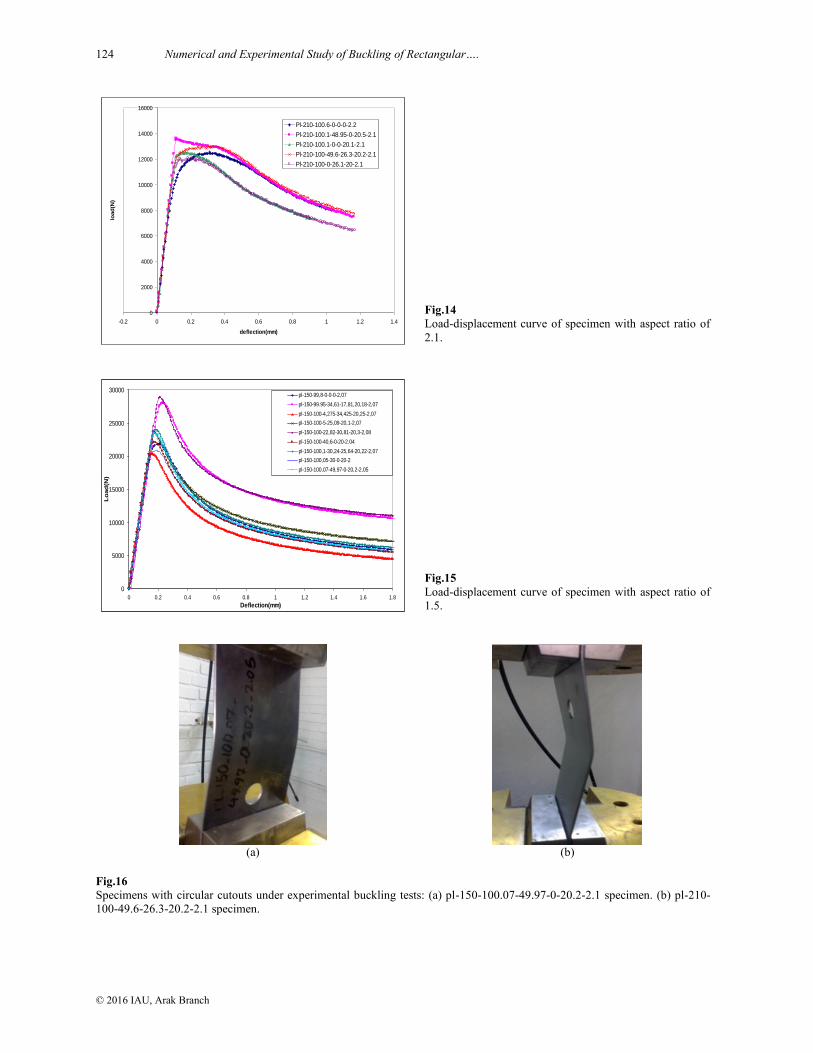
Figs. 12-14 show the load-displacement curves resulting from experimental analysis for specimens with circular
cutout and aspect ratios of 1:1, 1:6, and 2:1. Load-displacement curve of the experimental analysis of specimens
with an aspect ratio of 1:5 is shown in Fig. 15. Fig. 16 shows the buckling mode of the specimens pl-210-100-49.6-
26.3-20.2-2.1 and pl-150-100.07-49.97-0-20.2-2.1.
To facilitate comparison, Table 3. shows the buckling loads of experimental analysis and the initial
imperfections for specimens with circular cutout and aspect ratios of 1:1, 1:6, and 2:1. The experimental buckling
load and the initial imperfection for specimens with aspect ratio of 1:5 are shown in Table 3.
0
5000
10000
15000
20000
25000
30000
35000
40000
0 0.2 0.4 0.6 0.8 1 1.2 1.4
deflection(mm)
loa
d(N
)
Pl-110-100.4-0-0-0-2.2
Pl-110-100.35-0-0-20.1-2.1
Pl-110-100.4-0-26.05-20.1-2.1
Pl-110-100.4-24.8-0-20.1-2.06
Pl-110-100.4-26.25-26.25-20.1-2.1
Fig.12
Load-displacement curve of specimen with aspect ratio of
1.1.
0
5000
10000
15000
20000
25000
0 0.5 1 1.5 2 2.5 3
deflection(mm)
loa
d(N
)
Pl-160-100.2-0-0-0-2.2
Pl-160-100-0-0-20.05-2
Pl-160-100-38.25-26.35-20.1-2
Pl-160-100.1-0-25.7-20.2-2.1
Pl-160-100.2-28.8-0-20.2-2
Fig.13 Load-displacement curve of specimen with aspect ratio of
1.6.
124 Numerical and Experimental Study of Buckling of Rectangular….
© 2016 IAU, Arak Branch
0
2000
4000
6000
8000
10000
12000
14000
16000
-0.2 0 0.2 0.4 0.6 0.8 1 1.2 1.4
deflection(mm)
load
(N)
Pl-210-100.6-0-0-0-2.2
Pl-210-100.1-48.95-0-20.5-2.1
Pl-210-100.1-0-0-20.1-2.1
Pl-210-100-49.6-26.3-20.2-2.1
Pl-210-100-0-26.1-20-2.1
Fig.14
Load-displacement curve of specimen with aspect ratio of
2.1.
0
5000
10000
15000
20000
25000
30000
0 0.2 0.4 0.6 0.8 1 1.2 1.4 1.6 1.8
Deflection(mm)
Lo
ad
(N)
pl-150-99,8-0-0-0-2,07
pl-150-99.95-34,61-17,81,20,18-2,07
pl-150-100-4,275-34,425-20,25-2,07
pl-150-100-5-25,09-20,1-2,07
pl-150-100-22,82-30,81-20,3-2,08
pl-150-100-40,6-0-20-2.04
pl-150-100,1-30,24-25,64-20,22-2,07
pl-150-100,05-30-0-20-2
pl-150-100,07-49,97-0-20,2-2,05
Fig.15 Load-displacement curve of specimen with aspect ratio of
1.5.
(a)
(b)
Fig.16 Specimens with circular cutouts under experimental buckling tests: (a) pl-150-100.07-49.97-0-20.2-2.1 specimen. (b) pl-210-
100-49.6-26.3-20.2-2.1 specimen.
M. Shariati et al. 125
© 2016 IAU, Arak Branch
Table 3
Experimental results for specimens with circular cutouts with aspect ratios 1.1, 1.6 and 2.1.
Specimen name Aspect ratio Imperfection (m) Pcr (N)
pl-110-100.4-0-0-0-2.2 1.1 0.00044 35819.1 pl-110-100.35-0-0-20.1-2.1 1.1 0.00042 35188 pl-110-100.4-0-26.05-20.1-2.1 1.1 0.00042 32335.6 pl-110-100.4-24.8-0-20.1-2.06 1.1 0.000412 36643 pl-110-100.4-26.25-26.25-20.1-2.1 1.1 0.00042 37184.8
pl-160-100.2-0-0-0-2.2 1.6 0.00055 21594.5
pl-160-100-0-0-20.05-2 1.6 0.0005 18109.6
pl-160-100-38.25-26.35-20.1-2 1.6 0.000325 20938.3
pl-160-100.1-0-25.7-20.2-2.1 1.6 0.000525 18406.1
pl-160-100.2-28.8-0-20.2-2 1.6 0.0005 20099.6
pl-210-100-0-26.1-20-2.1 2.1 0.000525 12092.5
pl-210-100-49.6-26.3-20.2-2.1 2.1 0.000525 12963.3
pl-210-100.1-0-0-20.1-2.1 2.1 0.000525 12546.4
pl-210-100.1-48.95-0-20.5-2.1 2.1 0.000525 13475.1 pl-210-100.6-0-0-0-2.2 2.1 0.00055 12537.5
Table 4
Experimental results for specimens with circular cutouts with aspect ratios 1.5.
Specimen name Imperfection (m) Pcr (N)
pl-150-99,8-0-0-0-2,07 0.00058 21882.24 pl-150-99,95-34,61-17,81-20,18-2,07 0.0001 28044.2 pl-150-100-4,275-34,425-20,25-2,07 0.00045 20408.9 pl-150-100-5-25,09-20,1-2,07 0.00025 23734.8 pl-150-100-22,82-30,81-20,3-2,08 0.00005 28964.8 pl-150-100-40,6-0-20-2.04 0.00055 22063.6 pl-150-100,1-30,24-25,64-20,22-2,07 0.0003 24051.24 pl-150-100,05-30-0-20-2 0.00058 20869.6 pl-150-100,07-49,97-0-20,2-2,05 0.00035 23503.74
The experimental analysis, similar to the numerical analysis, evidently shows that with increasing the aspect
ratio, the buckling load of the specimens considerably decreases. For example, in specimens without any cutouts,
increasing the aspect ratio from 1:1 to 2:1, leads to 64% decrease in the buckling load.
The results of this study showed that, as expected, with equal initial imperfections, the specimen without cutouts
has the highest buckling load. For specimens with aspect ratios of 1:1 and 1:2, the maximum buckling load is not
observed for the specimen without cutouts due to its higher amount of initial imperfection, but is observed in a
specimen in which the hole has been moved in the longitudinal direction away from the middle of the pale.
Also in experimental results, it can be observed that when the cutout is more than 20% away from the middle of
the plate in the longitudinal direction, it has little effect on decreasing the buckling load. Displacement of the cutout
in transverse direction by the amount specified in this study had little effect on the buckling load.
As an example, in the specimen pl-160-100-38.25-26.35-20.1-2, where the distance between the center of the
cutout and the middle of the plate is 38.25 mm in the longitudinal direction, the buckling load is less than 3%
different from the specimen without cutouts. On the other hand, the buckling load of the specimen pl-160-100.1-0-
25.7-20.2-2.1 has a difference of 14% with the specimen without cutouts, because the cutout lies in the effective
longitudinal distance from the center of the plate.
In specimens with aspect ratio of 1:5, the importance of the initial imperfection is clearly seen, so that the
specimens pl-150-100-22, 82-30, 81-20, 3-2, 08 and pl-150-99.95-34, 61-17, 81, 20, 18-2, 07, which have relatively
smaller initial imperfections compared to the other specimens, have the highest buckling loads, and the buckling
load of the specimen without cutouts is much lower than these specimens due to the high degree of initial
imperfection. In specimens with identical initial imperfections, the specimen without cutouts is comparable to the
specimen pl-150-100, 05-30-0-20-2, where the existence of the cutout has decreased the buckling load by about 4%.
Furthermore, it is noticed that if the cutout is not situated in the effective distance from the center of the plate in the
longitudinal direction, displacement of the cutout outside this domain, will have little effect on the buckling load.
For this aspect ratio, the lowest buckling load pertains to the specimen pl-150-100-4, 275-34, 425-20, 25-2, 07,
because the cutout is in the effective longitudinal distance from the center of the plate and there is a relatively large
initial imperfection.
126 Numerical and Experimental Study of Buckling of Rectangular….
© 2016 IAU, Arak Branch
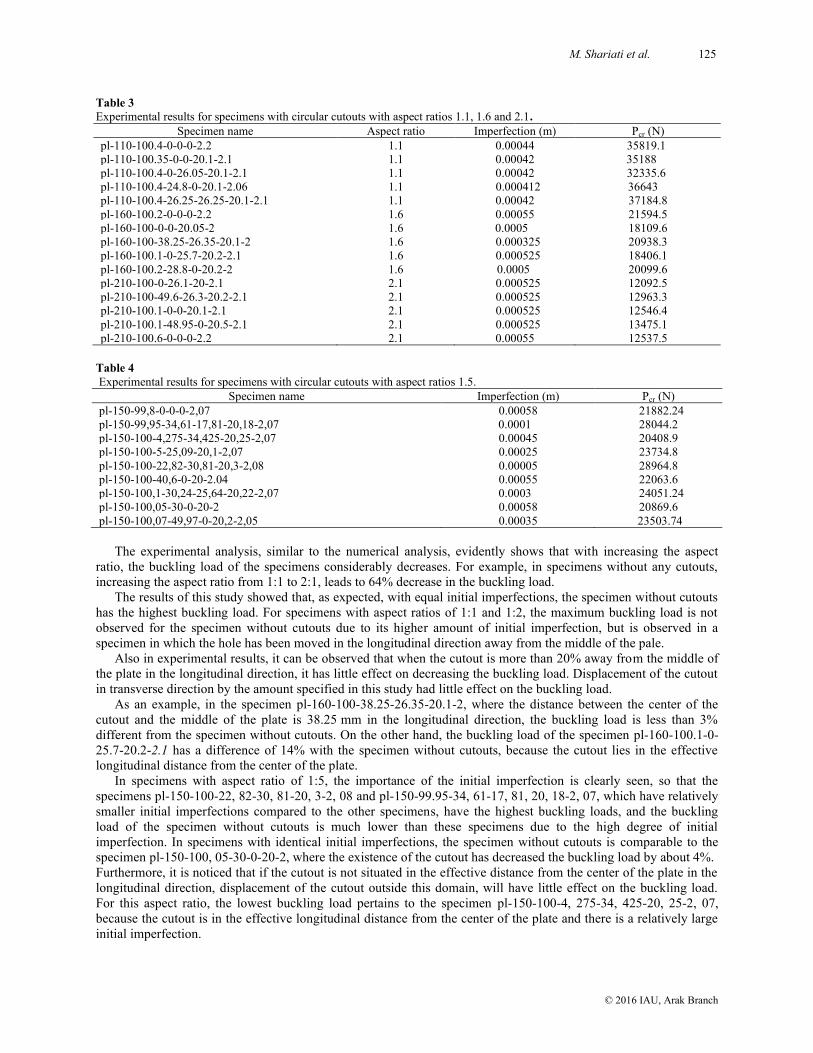
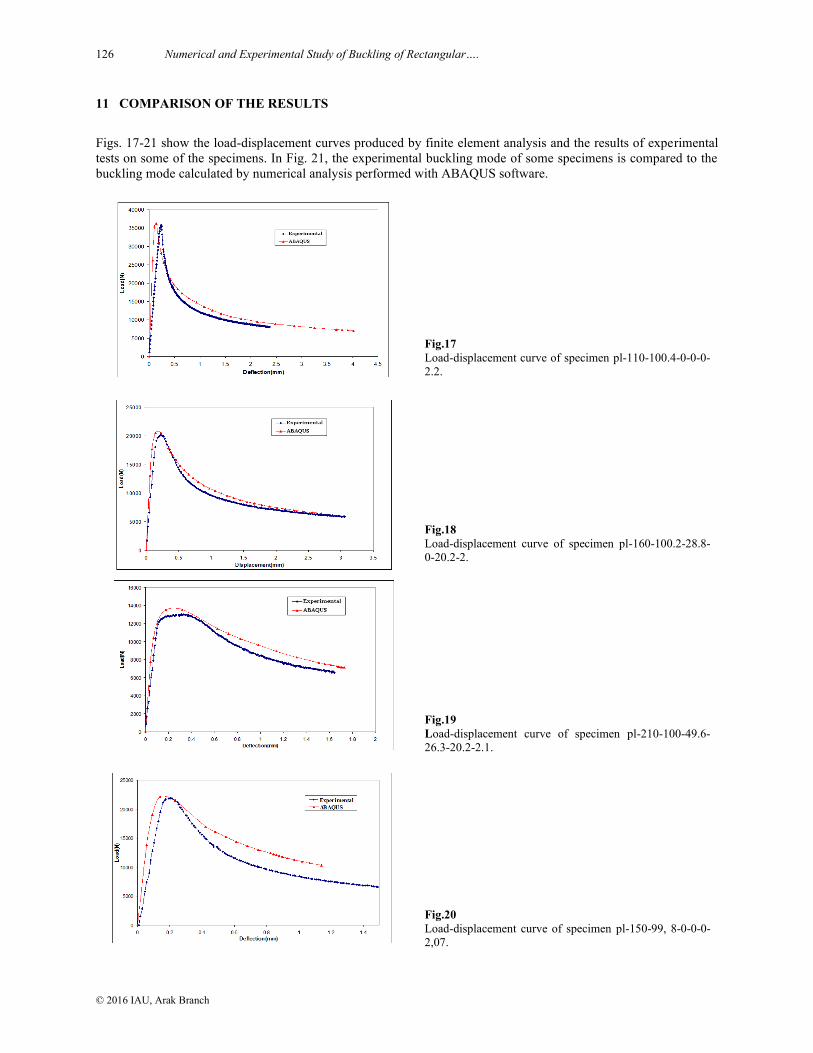
11 COMPARISON OF THE RESULTS
Figs. 17-21 show the load-displacement curves produced by finite element analysis and the results of experimental
tests on some of the specimens. In Fig. 21, the experimental buckling mode of some specimens is compared to the
buckling mode calculated by numerical analysis performed with ABAQUS software.
Fig.17
Load-displacement curve of specimen pl-110-100.4-0-0-0-
2.2.
Fig.18 Load-displacement curve of specimen pl-160-100.2-28.8-
0-20.2-2.
Fig.19
Load-displacement curve of specimen pl-210-100-49.6-
26.3-20.2-2.1.
Fig.20 Load-displacement curve of specimen pl-150-99, 8-0-0-0-
2,07.
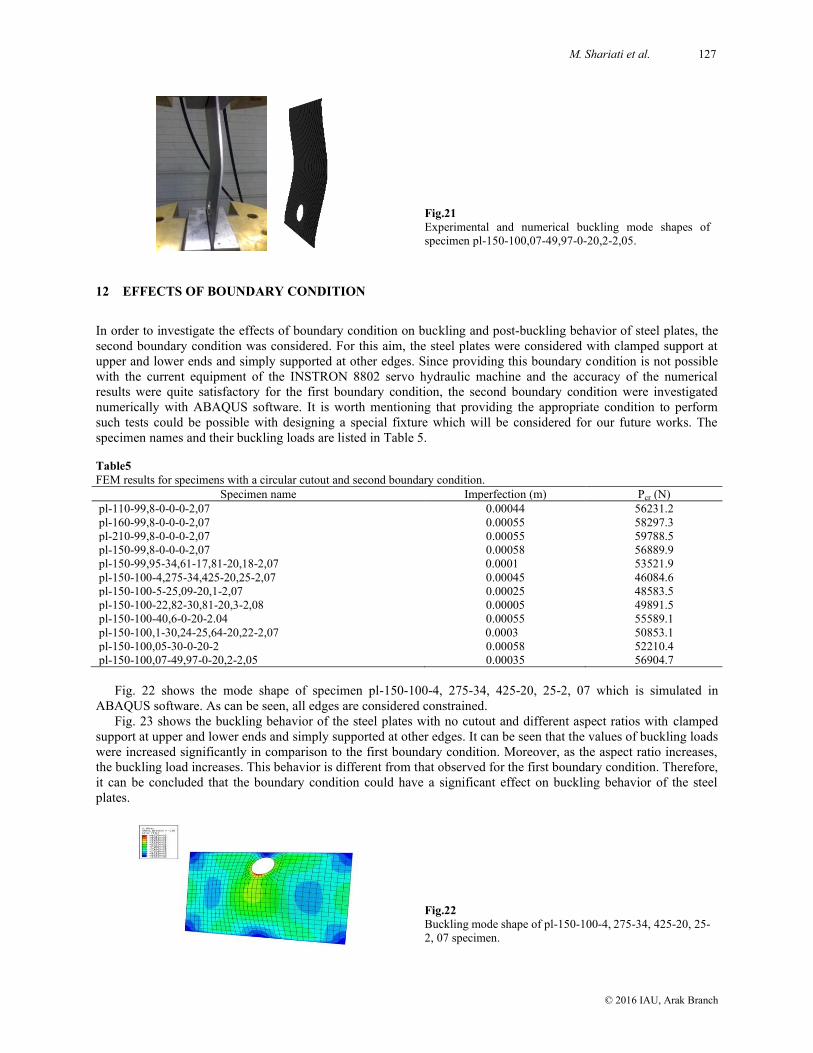
M. Shariati et al. 127
© 2016 IAU, Arak Branch
Fig.21 Experimental and numerical buckling mode shapes of
specimen pl-150-100,07-49,97-0-20,2-2,05.
12 EFFECTS OF BOUNDARY CONDITION
In order to investigate the effects of boundary condition on buckling and post-buckling behavior of steel plates, the
second boundary condition was considered. For this aim, the steel plates were considered with clamped support at
upper and lower ends and simply supported at other edges. Since providing this boundary condition is not possible
with the current equipment of the INSTRON 8802 servo hydraulic machine and the accuracy of the numerical
results were quite satisfactory for the first boundary condition, the second boundary condition were investigated
numerically with ABAQUS software. It is worth mentioning that providing the appropriate condition to perform
such tests could be possible with designing a special fixture which will be considered for our future works. The
specimen names and their buckling loads are listed in Table 5.
Table5
FEM results for specimens with a circular cutout and second boundary condition.
Specimen name Imperfection (m) Pcr (N)
pl-110-99,8-0-0-0-2,07 0.00044 56231.2 pl-160-99,8-0-0-0-2,07 0.00055 58297.3 pl-210-99,8-0-0-0-2,07 0.00055 59788.5
pl-150-99,8-0-0-0-2,07 0.00058 56889.9 pl-150-99,95-34,61-17,81-20,18-2,07 0.0001 53521.9 pl-150-100-4,275-34,425-20,25-2,07 0.00045 46084.6 pl-150-100-5-25,09-20,1-2,07 0.00025 48583.5 pl-150-100-22,82-30,81-20,3-2,08 0.00005 49891.5 pl-150-100-40,6-0-20-2.04 0.00055 55589.1 pl-150-100,1-30,24-25,64-20,22-2,07 0.0003 50853.1 pl-150-100,05-30-0-20-2 0.00058 52210.4 pl-150-100,07-49,97-0-20,2-2,05 0.00035 56904.7
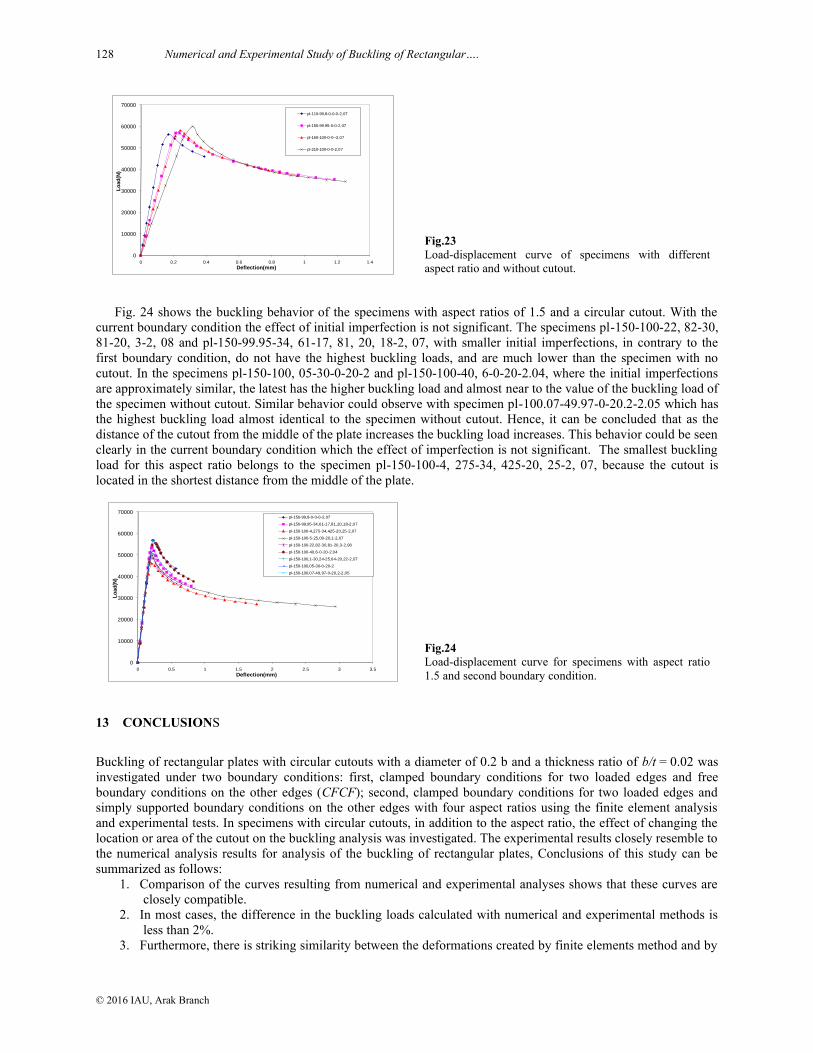
Fig. 22 shows the mode shape of specimen pl-150-100-4, 275-34, 425-20, 25-2, 07 which is simulated in
ABAQUS software. As can be seen, all edges are considered constrained. Fig. 23 shows the buckling behavior of the steel plates with no cutout and different aspect ratios with clamped
support at upper and lower ends and simply supported at other edges. It can be seen that the values of buckling loads
were increased significantly in comparison to the first boundary condition. Moreover, as the aspect ratio increases,
the buckling load increases. This behavior is different from that observed for the first boundary condition. Therefore,
it can be concluded that the boundary condition could have a significant effect on buckling behavior of the steel
plates.
Fig.22 Buckling mode shape of pl-150-100-4, 275-34, 425-20, 25-
2, 07 specimen.
128 Numerical and Experimental Study of Buckling of Rectangular….
© 2016 IAU, Arak Branch
0
10000
20000
30000
40000
50000
60000
70000
0 0.2 0.4 0.6 0.8 1 1.2 1.4
Lo
ad
(N)
Deflection(mm)
pl-110-99,8-0-0-0-2,07
pl-150-99.95-0-0-2,07
pl-160-100-0-0--2,07
pl-210-100-0-0-2,07
Fig.23 Load-displacement curve of specimens with different
aspect ratio and without cutout.
Fig. 24 shows the buckling behavior of the specimens with aspect ratios of 1.5 and a circular cutout. With the
current boundary condition the effect of initial imperfection is not significant. The specimens pl-150-100-22, 82-30,
81-20, 3-2, 08 and pl-150-99.95-34, 61-17, 81, 20, 18-2, 07, with smaller initial imperfections, in contrary to the
first boundary condition, do not have the highest buckling loads, and are much lower than the specimen with no
cutout. In the specimens pl-150-100, 05-30-0-20-2 and pl-150-100-40, 6-0-20-2.04, where the initial imperfections
are approximately similar, the latest has the higher buckling load and almost near to the value of the buckling load of
the specimen without cutout. Similar behavior could observe with specimen pl-100.07-49.97-0-20.2-2.05 which has
the highest buckling load almost identical to the specimen without cutout. Hence, it can be concluded that as the
distance of the cutout from the middle of the plate increases the buckling load increases. This behavior could be seen
clearly in the current boundary condition which the effect of imperfection is not significant. The smallest buckling
load for this aspect ratio belongs to the specimen pl-150-100-4, 275-34, 425-20, 25-2, 07, because the cutout is
located in the shortest distance from the middle of the plate.
0
10000
20000
30000
40000
50000
60000
70000
0 0.5 1 1.5 2 2.5 3 3.5
Lo
ad
(N)
Deflection(mm)
pl-150-99,8-0-0-0-2,07
pl-150-99.95-34,61-17,81,20,18-2,07
pl-150-100-4,275-34,425-20,25-2,07
pl-150-100-5-25,09-20,1-2,07
pl-150-100-22,82-30,81-20,3-2,08
pl-150-100-40,6-0-20-2.04
pl-150-100,1-30,24-25,64-20,22-2,07
pl-150-100,05-30-0-20-2
pl-150-100,07-49,97-0-20,2-2,05
Fig.24 Load-displacement curve for specimens with aspect ratio
1.5 and second boundary condition.
13 CONCLUSIONS
Buckling of rectangular plates with circular cutouts with a diameter of 0.2 b and a thickness ratio of b/t = 0.02 was
investigated under two boundary conditions: first, clamped boundary conditions for two loaded edges and free
boundary conditions on the other edges (CFCF); second, clamped boundary conditions for two loaded edges and
simply supported boundary conditions on the other edges with four aspect ratios using the finite element analysis
and experimental tests. In specimens with circular cutouts, in addition to the aspect ratio, the effect of changing the
location or area of the cutout on the buckling analysis was investigated. The experimental results closely resemble to
the numerical analysis results for analysis of the buckling of rectangular plates, Conclusions of this study can be
summarized as follows:
1. Comparison of the curves resulting from numerical and experimental analyses shows that these curves are
closely compatible.
2. In most cases, the difference in the buckling loads calculated with numerical and experimental methods is
less than 2%.
3. Furthermore, there is striking similarity between the deformations created by finite elements method and by
M. Shariati et al. 129
© 2016 IAU, Arak Branch
experimental tests in the buckling and post-buckling states.
4. The buckling load in all specimens is lower than the yield load, and elastic buckling occurred in all
specimens.
5. The maximum effect of a cutout (d/b = 0.2) is a 12% reduction in the buckling load compared to the
specimen without cutouts.
6. With increasing aspect ratio, the buckling load decreases considerably.
7. The effective longitudinal distance from the middle of the plate is about 20% of the length of the plate.
When the cutout lies outside this region it will have little effect on the buckling load of the plate.
8. Due to free boundary conditions along the lateral edges of the specimens, changing the location of the
cutout in the transverse direction has very little effect on the buckling load.
9. The amount of initial imperfection has no effect of the post-bucking behavior of the rectangular plate.
10. For the second boundary condition as the aspect ratio increases, the buckling load increases which is
different from that observed for the first boundary condition. Hence, it can be concluded that the boundary
condition could have a great influence of buckling behavior of the steel plates.
11. For second boundary condition the effect of initial imperfection is not significant and as the distance of the
cutout from the middle of the plate increases the buckling load increases.
REFERENCES
[1] Timoshenko S.P., Gere J.M., 1961, Theory of Elastic Stability, McGraw-Hill Book Company, New York.
[2] El-Sawy Khaled M., Nazmy Aly S., 2001, Effect of aspect ratio on the elastic buckling of uniaxially loaded plates with
eccentric holes , Thin-Walled Structures 39: 983-998.
[3] El-Sawy Khaled M., Nazmy Aly S., Ikbal Martini M., 2004, Elasto-plastic buckling of perforated plates under uniaxial
compression , Thin-Walled Structures 42: 1083-1101. [4] Narayanan R., Chow F.Y., 1984, Ultimate capacity of uniaxially compressed perforated plates, Thin-Walled Structures
2: 241-264. [5] Shanmugam N.E., Thevendran V., Tan Y.H., 1999, Design formula for axially compressed perforated plates, Thin-
Walled Structures 34: 1-20.
[6] Roberts T.M., Azizian Z.G.,1984, Strength of perforated plates subjected to in-plane loading, Thin-Walled Structures 2:
153-164.
[7] Mignot F., Puel J-P., Suquet P-M., 1980, Homogenization and bifurcation of perforated plates, Engineering science 18:
409-414. [8] Yetterman A.L., Brown C.J., 1985, The elastic stability of square perforated plates, Computer & Structures 21(6):
1267-1272.
[9] Maan F.S., Querin O.M., Barton D.C., 2007, Extension of the fixed grid finite element method to eigenvalue problems,
Advances in Engineering Software 38(8-9): 607-617.
[10] Singh Anand V., Tanveer M., 2006, Eigenvalue analysis of doubly connected plates with different configurations,
Journal of Sound and Vibration 295: 76-93.
[11] Aydin Komur M., Sonmez M., 2008, Elastic buckling of rectangular plates under linearly varying in-plane normal load
with a circular cutout, Mechanics Research Communications 35(6): 361-371.
[12] Rahai A.R., Alinia M.M., Kazemi S., 2008, Buckling analysis of stepped plates using modified buckling mode shapes,
Thin-Walled Structures 46: 484-493.
[13] Eccher G., Rasmussen K.J.R., Zandonini R., 2008, Elastic buckling analysis of perforated thin-walled structures by the
isoparametric spline finite strip method, Thin-Walled Structures 46: 165-191.
[14] Maiorana E., Pellegrino C.. Modena C., 2009, Elastic stability of plates with circular and rectangular holes subjected to
axial compression and bending moment, Thin Walled Structure 47(3): 241-255.
[15] Eccher G., Rasmussen K.J.R., Zandoninib R., 2009, Geometric nonlinear isoparametric spline finite strip analysis of
perforated, Thin-walled structures 47(2): 219-232.
[16] Paik J.K., 2008, Ultimate strength of perforated steel plates under combined biaxial compression and edge shear loads,
Thin-Walled Structures 46: 207-213.