Embed Size (px)
Citation preview
HAL Id: hal-02361446https://hal.archives-ouvertes.fr/hal-02361446
Submitted on 13 Nov 2019
HAL is a multi-disciplinary open accessarchive for the deposit and dissemination of sci-entific research documents, whether they are pub-lished or not. The documents may come fromteaching and research institutions in France orabroad, or from public or private research centers.
L’archive ouverte pluridisciplinaire HAL, estdestinée au dépôt et à la diffusion de documentsscientifiques de niveau recherche, publiés ou non,émanant des établissements d’enseignement et derecherche français ou étrangers, des laboratoirespublics ou privés.
Numerical and experimental investigations of buffet on adiamond airfoil designed for space launcher applications
Jéromine Dumon, Yannick Bury, Nicolas Gourdain, Laurent Michel
To cite this version:Jéromine Dumon, Yannick Bury, Nicolas Gourdain, Laurent Michel. Numerical and experimentalinvestigations of buffet on a diamond airfoil designed for space launcher applications. InternationalJournal of Numerical Methods for Heat and Fluid Flow, Emerald, 2019, pp.1-17. �10.1108/HFF-07-2018-0353�. �hal-02361446�

��� ������������ ��������� ��� ������ ����� �� ��� �� ��� �������� �������������
����������������������������������
��� ������� ������� ������� ������� �������
����� � �� ��� ���� �������� ���� ������� ��� ��� �� ��� �������
��������� ��� �� � �� ������ ��������� ���� ��� ��� ����� ������
��� � ������ ������� ���
�� ���� ��� �����
�������� ��� �
an author's https://oatao.univ-toulouse.fr/24670
https://doi.org/10.1108/HFF-07-2018-0353
Dumon, Jéromine and Bury, Yannick and Gourdain, Nicolas and Michel, Laurent Numerical and experimental
investigations of buffet on a diamond airfoil designed for space launcher applications. (2019) International Journal
of Numerical Methods for Heat & Fluid Flow. 1-17. ISSN 0961-5539
Numerical and experimentalinvestigations of buffet on a
diamond airfoil designed for spacelauncher applications
Jéromine Dumon, Yannick Bury and Nicolas GourdainDAEP, ISAE-SUPAERO, Toulouse, France, and
Laurent MichelInstitut Clement Ader (ICA), CNRS-INSA-Mines Albi-UPS,
University of Toulouse, Toulouse, France and DMSM, ISAE-SUPAERO,Toulouse, France
AbstractPurpose The development of reusable space launchers requires a comprehensive knowledge of transonicflow effects on the launcher structure, such as buffet. Indeed, the mechanical integrity of the launcher can becompromised by shock wave/boundary layer interactions, that induce lateral forces responsible for plungingand pitchingmoments.Design/methodology/approach This paper aims to report numerical and experimental investigations onthe aerodynamic and aeroelastic behavior of a diamond airfoil, designed for microsatellite dedicated launchers,with a particular interest for the fluid/structure interaction during buffeting. Experimental investigations based onSchlieren visualizations are conducted in a transonic wind tunnel and are then compared with numericalpredictions based on unsteady Reynolds averaged Navier Stokes and large eddy simulation (LES) approaches.The effect of buffeting on the structure is finally studied by solving the equation of the dynamics.Findings Buffeting is both experimentally and numerically revealed. Experiments highlight 3Doscillations of the shock wave in the manner of a wind flapping flag. LES computations identify a lambdashaped shock wave foot width oscillations, which noticeably impact aerodynamic loads. At last, theexperiments highlight the chaotic behavior of the shock wave as it shifts from an oscillatory periodic to anerratic 3D flapping state. Fluid structure computations show that the aerodynamic response of the airfoiltends to damp the structural vibrations and to mitigate the effect of buffeting.Originality/value While buffeting has been extensively studied for classical supercritical profiles, thisstudy focuses on diamond airfoils. Moreover, a fluid structure computation has been conducted to point outthe effect of buffeting.
Keywords Buffet, Wind tunnel test, URANS, LES, Fluid structure interaction, Composite
Paper type Research paper
This work is partially funded by the French Space Agency (CNES); this support is greatlyacknowledged. The authors particularly thank Jean Oswald and FlorentPuel from DLA (Directiondes LAnceurs) at CNES for their help on this study. The experimental campaign was conducted withthe technical team of ISAE Supaero (special thanks to Emmanuel Rivet, Patrick Cheze and MarcGrellet). The simulations performed were achieved using CALMIP computing means, under projectp1425 and GENCI A0042 A07178.
Numerical andexperimentalinvestigations
of buffet
DOI 10 1108/HFF 07 2018 0353
Nomenclature
a Angle of attack [rad];a0 Initial angle of attack [rad];C Chord of the aileron [m];g Heat capacity ratio [ ];D Damping matrix;E Young’s modulus [Pa];FA Aerodynamic forces [N];fi Frequency [Hz];Flift or FY Lift force [N];FX Drag force [N];G Shear modulus [Pa];k Stiffness of the solid [N/m or N.m];K Stiffness matrix [N/m];L Span of the aileron [m];m Mass of the solid [kg];M Matrix of mass [kg];m* Mass ratio between the solid and the fluid [ ];Ma Mach number [ ];P Static pressure [Pa];Pi Stagnation pressure [Pa];r Local flow density [kg/m3];r1 Upstream flow density [kg/m3];S Reference surface of the aileron [m2];St Strouhal number [ ];u Rotational displacement of the aileron [rad];U1 Upstream flow velocity [m/s];U* Normalized velocity based on ratio between the fluid velocity and the solid displace
ment velocity [ ];v* Maximum displacement velocity [ ];x Position vector of the solid [m/s];xþ, yþ, zþ Dimensionless wall distance in axial, normal and span wise direction, respectively [ ];y Displacement of the aileronin the vertical direction [m]; andy* Normalized displacement [ ].
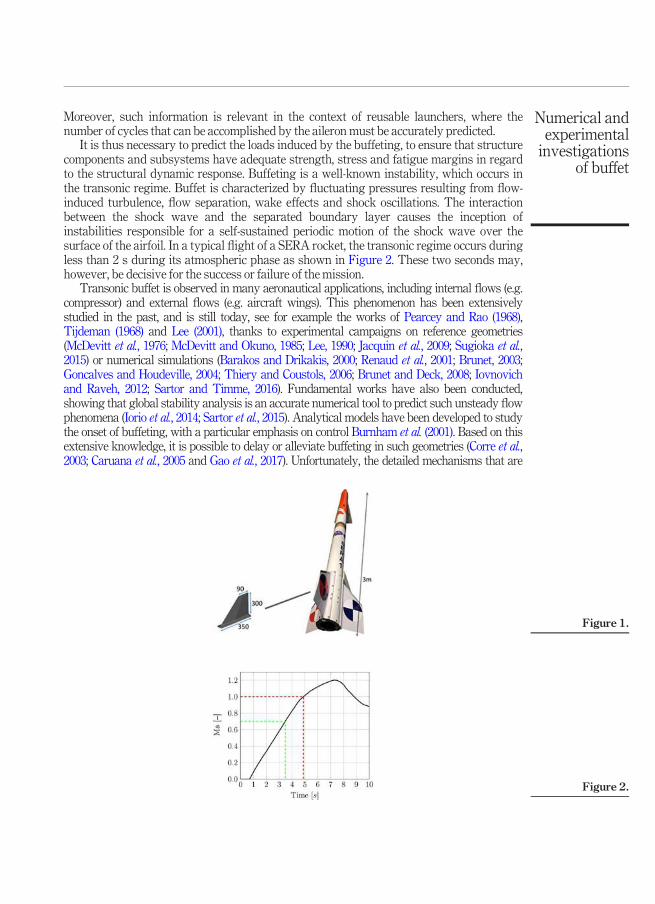
1. IntroductionMicrosatellite-dedicated launchers, for which payload is lower than 50 kg, are of paramountimportance for future space missions. Among the difficulties encountered for the design ofsuch launchers, the aero-elastic behavior of the ailerons in transonic regimes still remainspartly unknown. Such ailerons are originally designed to provide stability to the launcher,especially when lateral winds are experienced. The present work takes place in the frame ofthe PERSEUS’ project (French acronym for Academic and Scientific European StudentProject for Space Research) led by CNES, the French Space Agency, to promote theemergence of innovative technical solutions for space launchers. More precisely, this workfocuses on the Supersonic Experimental Rocket ARES (SERA) series launchers (Figure 1).
To improve the stability of the rocket, SERA is equipped with three ailerons, composedof diamond airfoils made in a composite material. With the objective to increase theirreliability in turbulent transonic flows, it is necessary to better understand the interactionsbetween the unsteady flow, including shock induced flows, and the composite walls.
HFF
Moreover, such information is relevant in the context of reusable launchers, where thenumber of cycles that can be accomplished by the aileron must be accurately predicted.
It is thus necessary to predict the loads induced by the buffeting, to ensure that structurecomponents and subsystems have adequate strength, stress and fatigue margins in regardto the structural dynamic response. Buffeting is a well-known instability, which occurs inthe transonic regime. Buffet is characterized by fluctuating pressures resulting from flow-induced turbulence, flow separation, wake effects and shock oscillations. The interactionbetween the shock wave and the separated boundary layer causes the inception ofinstabilities responsible for a self-sustained periodic motion of the shock wave over thesurface of the airfoil. In a typical flight of a SERA rocket, the transonic regime occurs duringless than 2 s during its atmospheric phase as shown in Figure 2. These two seconds may,however, be decisive for the success or failure of the mission.
Transonic buffet is observed in many aeronautical applications, including internal flows (e.g.compressor) and external flows (e.g. aircraft wings). This phenomenon has been extensivelystudied in the past, and is still today, see for example the works of Pearcey and Rao (1968),Tijdeman (1968) and Lee (2001), thanks to experimental campaigns on reference geometries(McDevitt et al., 1976; McDevitt and Okuno, 1985; Lee, 1990; Jacquin et al., 2009; Sugioka et al.,2015) or numerical simulations (Barakos and Drikakis, 2000; Renaud et al., 2001; Brunet, 2003;Goncalves and Houdeville, 2004; Thiery and Coustols, 2006; Brunet and Deck, 2008; Iovnovichand Raveh, 2012; Sartor and Timme, 2016). Fundamental works have also been conducted,showing that global stability analysis is an accurate numerical tool to predict such unsteady flowphenomena (Iorio et al., 2014; Sartor et al., 2015). Analytical models have been developed to studythe onset of buffeting, with a particular emphasis on control Burnham et al. (2001). Based on thisextensive knowledge, it is possible to delay or alleviate buffeting in such geometries (Corre et al.,2003; Caruana et al., 2005 and Gao et al., 2017). Unfortunately, the detailed mechanisms that are
Figure 2.
Figure 1.
Numerical andexperimentalinvestigations
of buffet
responsible for the inception of the buffeting phenomenon and its dynamics are still nowadaysdebated (Crouch et al., 2009). Moreover, contrary to classical supercritical profiles designed forcivil aircrafts, there is a lack of studies for diamond airfoils, adapted to supersonic flows, whichare the target of this work.
The first part of this paper deals with the experimental and numerical methods that havebeen used to study the inception of buffet in a diamond airfoil. In a second part, aerodynamicdata are compared and analyzed, to highlight some of the mechanisms related to buffet for anon-moving airfoil. In the last part of the paper, numerical simulations are conducted,considering a moving airfoil, that dynamically responds to aerodynamic forces. Finally,some conclusions and perspectives are drawn.
2. Methods2.1 Experimental setupThe ISAE-SUPAERO transonic wind tunnel has a 130mm-by-80-mm rectangular testsection. It is powered by four vacuum pumps and provides flow Mach numbers rangingfrom 0.76 0.05 to 1.36 0.1. Here, the Mach number is determined from the measurementsof stagnation pressure Pi and static pressure P according to equation (1), with Ma the Machnumber and g the heat capacity ratio.
PPi
¼ 1þ g � 12
Ma2� � g
g 1
(1)
Time-resolved Schlieren visualizations are recorded using a high speed Photron camera.Two sets of data can be recorded: 704 � 512 pixels’ image with an acquisition frequency of20,000 frames per second or a 512 � 272 pixels’ image with an acquisition frequency of50,000 frames per second. However, Schlieren technique intrinsically integrates 3Dinformation into a 2D image. This makes difficult the analysis of the images when the flownaturally exhibits transient 3D structures and is then responsible for a hard-to-quantifyinaccuracy in the shock wave spatio-temporal tracking, for instance.
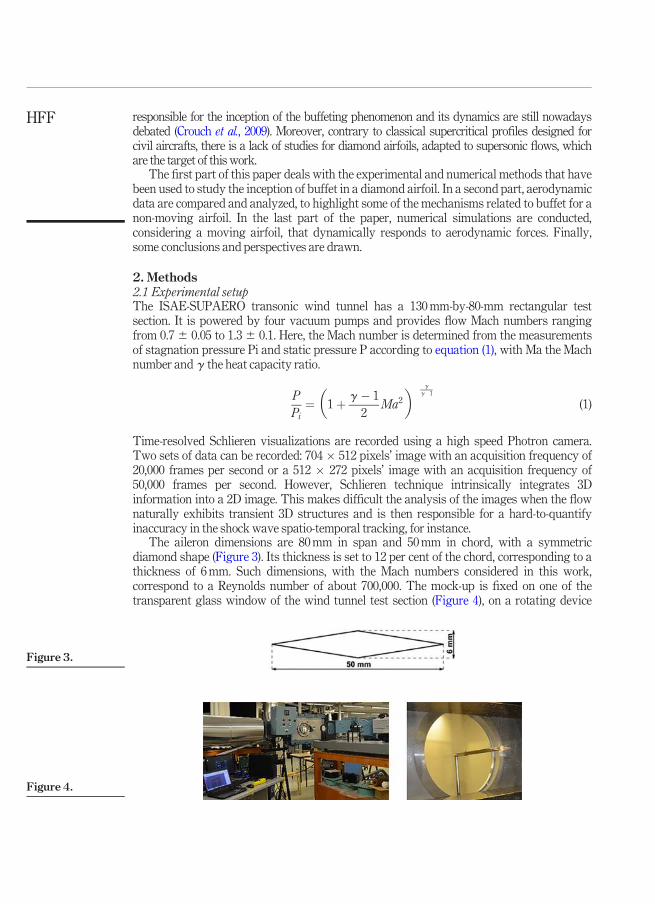
The aileron dimensions are 80mm in span and 50mm in chord, with a symmetricdiamond shape (Figure 3). Its thickness is set to 12 per cent of the chord, corresponding to athickness of 6mm. Such dimensions, with the Mach numbers considered in this work,correspond to a Reynolds number of about 700,000. The mock-up is fixed on one of thetransparent glass window of the wind tunnel test section (Figure 4), on a rotating device
Figure 4.
Figure 3.
HFF
allowing to change the angle of attack of the aileron. The 0° angle is determined on the basisof the Schlieren images revealing the symmetric distribution of the shock waves on bothsides of the WT model. The accuracy of the aerodynamic angle is estimated to 0.5° via postprocessing images of calibration targets. The angle of attack can be set from �2° to 2° bysteps of 0.5°.The boundary layer is not tripped in the wind tunnel. The laminar toturbulent transitionnaturally occurs after the crest, such that the buffeting phenomenon occurs in a regionwhere the boundary layer is turbulent.
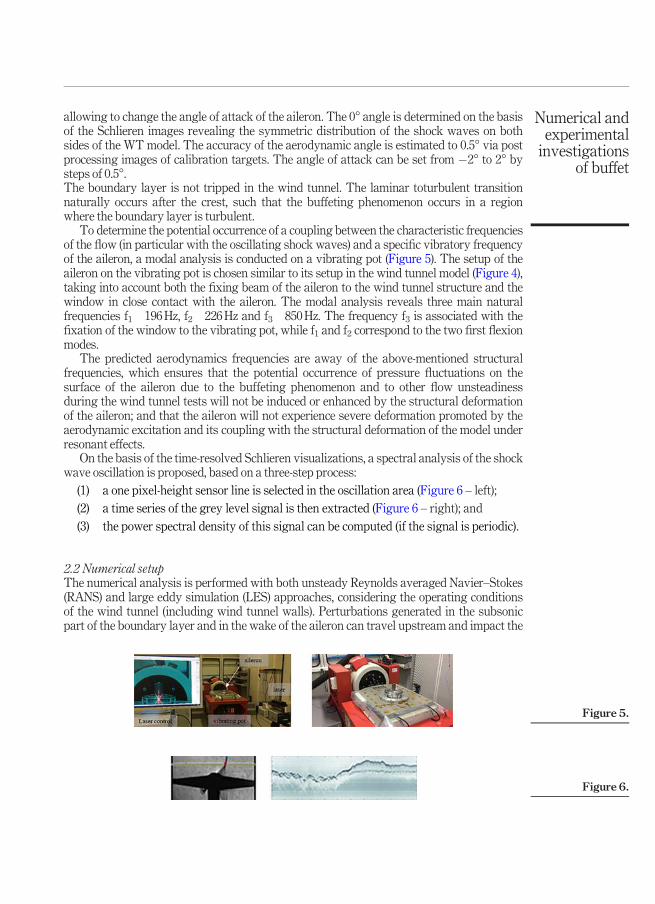
To determine the potential occurrence of a coupling between the characteristic frequenciesof the flow (in particular with the oscillating shock waves) and a specific vibratory frequencyof the aileron, a modal analysis is conducted on a vibrating pot (Figure 5). The setup of theaileron on the vibrating pot is chosen similar to its setup in the wind tunnel model (Figure 4),taking into account both the fixing beam of the aileron to the wind tunnel structure and thewindow in close contact with the aileron. The modal analysis reveals three main naturalfrequencies f1 196Hz, f2 226Hz and f3 850Hz. The frequency f3 is associated with thefixation of the window to the vibrating pot, while f1 and f2 correspond to the two first flexionmodes.
The predicted aerodynamics frequencies are away of the above-mentioned structuralfrequencies, which ensures that the potential occurrence of pressure fluctuations on thesurface of the aileron due to the buffeting phenomenon and to other flow unsteadinessduring the wind tunnel tests will not be induced or enhanced by the structural deformationof the aileron; and that the aileron will not experience severe deformation promoted by theaerodynamic excitation and its coupling with the structural deformation of the model underresonant effects.
On the basis of the time-resolved Schlieren visualizations, a spectral analysis of the shockwave oscillation is proposed, based on a three-step process:
(1) a one pixel-height sensor line is selected in the oscillation area (Figure 6 – left);(2) a time series of the grey level signal is then extracted (Figure 6 – right); and(3) the power spectral density of this signal can be computed (if the signal is periodic).
2.2 Numerical setupThe numerical analysis is performed with both unsteady Reynolds averaged Navier–Stokes(RANS) and large eddy simulation (LES) approaches, considering the operating conditionsof the wind tunnel (including wind tunnel walls). Perturbations generated in the subsonicpart of the boundary layer and in the wake of the aileron can travel upstream and impact the
Figure 6.
Figure 5.
Numerical andexperimentalinvestigations
of buffet
shock development in the zone of the lambda-shaped shock pedestal, so a particular careshould be brought to the grid in the boundary layer region.
The numerical model used in the URANS approach is purely two dimensional, in order toreduce computational time effort, corresponding to the mid-section of the aileron (Figure 3).The dimensions of the computational domain are similar to those of the wind tunnel testsection (130 mm high and 30 chords long).The center of the model is located 10 chordsdownstream from the inlet of the domain. For the LES computations, the 2D section of theactual wind tunnel model is extruded in the span-wise direction, with a span correspondingto 25 per cent of the chord, to ensure uncorrelated turbulence.
The URANS simulations are performed using STAR-CCMþ v11.02. The k-v SST-Menter turbulence model (Menter, 1994) is used for turbulence modeling. A compressiblesolver is used with a second-order Runge–Kutta scheme for the time discretization. Thespatial discretization of the convective fluxes is performed with a third-order MUSCLscheme. Regarding the grid, an unstructured polyhedral 2D mesh is used, based on prismlayers close to the airfoil walls and polyhedral cells in the rest of the computational domain.The size of the mesh is highly refined close to the aileron surface, and in the zone where theshock waves are expected to develop. The prism layers are set on the aileron and wallsurfaces to better capture the flow gradients inside the boundary layer. The size of the firstlayer was chosen to impose yþ<0.5 on the aileron surfaces. A grid convergence study wasperformed, showing that a 1 million cell mesh is sufficient to ensure convergence on lift anddrag coefficients while capturing the buffet phenomenon.
The numerical simulations are run in turbulent mode. However, based on the previousconsiderations about the state of the boundary layer in the wind tunnel, a numericalsimulation with a transition model “Gamma-Re-Theta” has been performed to study theinfluence of transition on buffeting. The results show that the onset of buffeting and itsfrequency are not modified by the transition of the boundary layer. However, the magnitudeof the shock displacement is reduced by about 30 per cent compared to the fully turbulentcase. The main objective of the present work is to investigate the mechanisms related to theonset of buffeting and its interaction with the structure (and not the amplitude of the shockdisplacement). Thus, due to the computational overcost of the transition model, all URANSsimulations reported in this paper are carried out in a fully turbulent mode.
LES computations are performed using the CharLESX solver (Bermejo-Moreno et al.,2014), which solves the spatially filtered compressible Navier–Stokes equations with a finitevolume formulation on unstructured hexahedral meshes. A fourth-order central scheme isused for the computation (second order on stretched volumes as in the present study). Anexplicit third-order Runge–Kutta (RK3) scheme is used for time integration with theVremansubgrid-scale (SGS) model (Vreman, 2004). The approach relies on the combinationof a non-dissipative centered numerical scheme and an essentially non-oscillatory (ENO)second-order shock-capturing scheme, with a shock sensor (Bermejo-Moreno et al., 2014).Two grid strategies have been considered. The first one relies on a wall-modelling approach,with yþ�15, xþ�30 and zþ�50, leading to a 30 million cells grid. The second methodrelies on a wall resolved approach (Kawai and Larsson, 2012), with yþ�1, xþ�30 andzþ�20, that leads to a 120 million cells grid. Beyond the mesh size reduction, the maininterest with the wall-modelling approach is the possibility to increase the time step by afactor of 10 in contrast to the wall resolved approach. Indeed, the cost ratio between wallresolved andwall modelling approaches is around 40.
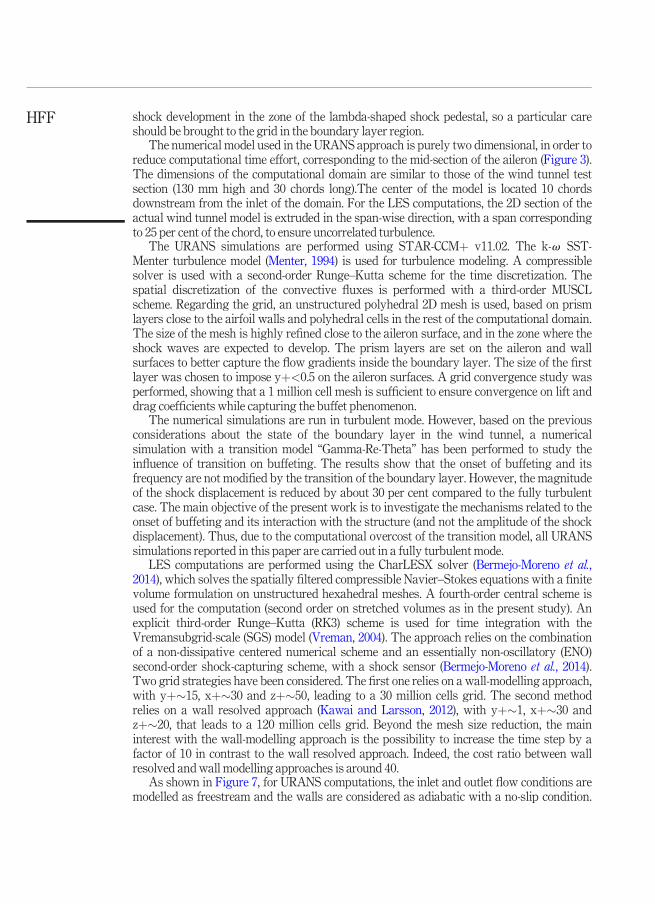
As shown in Figure 7, for URANS computations, the inlet and outlet flow conditions aremodelled as freestream and the walls are considered as adiabatic with a no-slip condition.
HFF
For LES computations, total pressure and temperature are imposed at the inlet, staticpressure at the outlet and walls are considered as adiabatic with a no-slip condition.
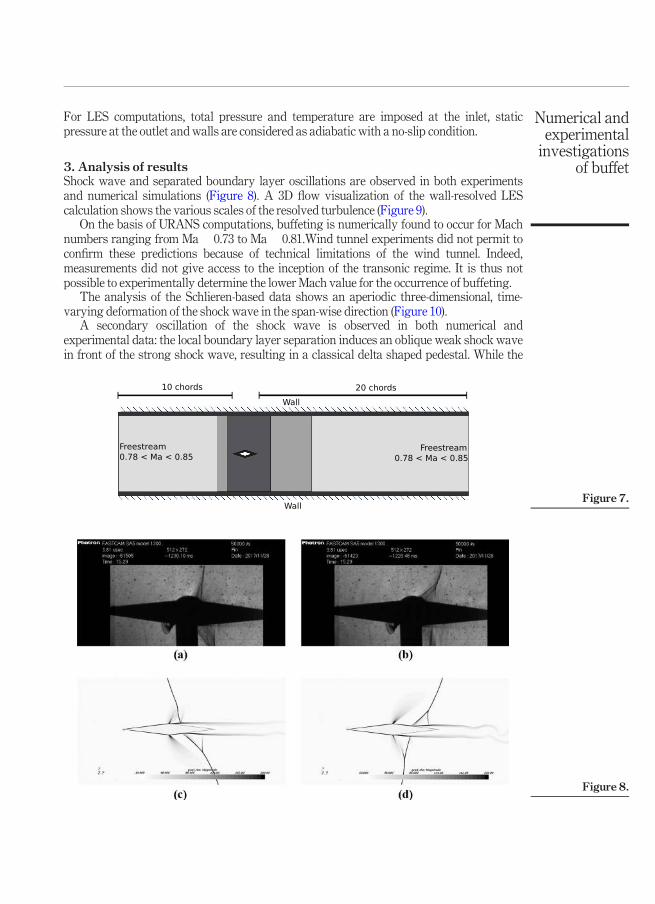
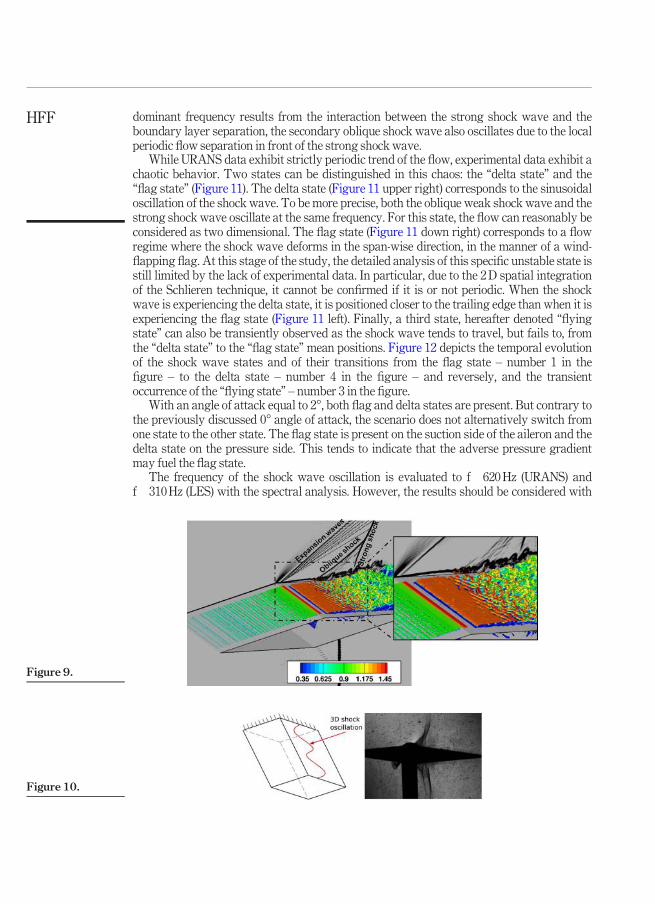
3. Analysis of resultsShock wave and separated boundary layer oscillations are observed in both experimentsand numerical simulations (Figure 8). A 3D flow visualization of the wall-resolved LEScalculation shows the various scales of the resolved turbulence (Figure 9).
On the basis of URANS computations, buffeting is numerically found to occur for Machnumbers ranging from Ma 0.73 to Ma 0.81.Wind tunnel experiments did not permit toconfirm these predictions because of technical limitations of the wind tunnel. Indeed,measurements did not give access to the inception of the transonic regime. It is thus notpossible to experimentally determine the lower Mach value for the occurrence of buffeting.
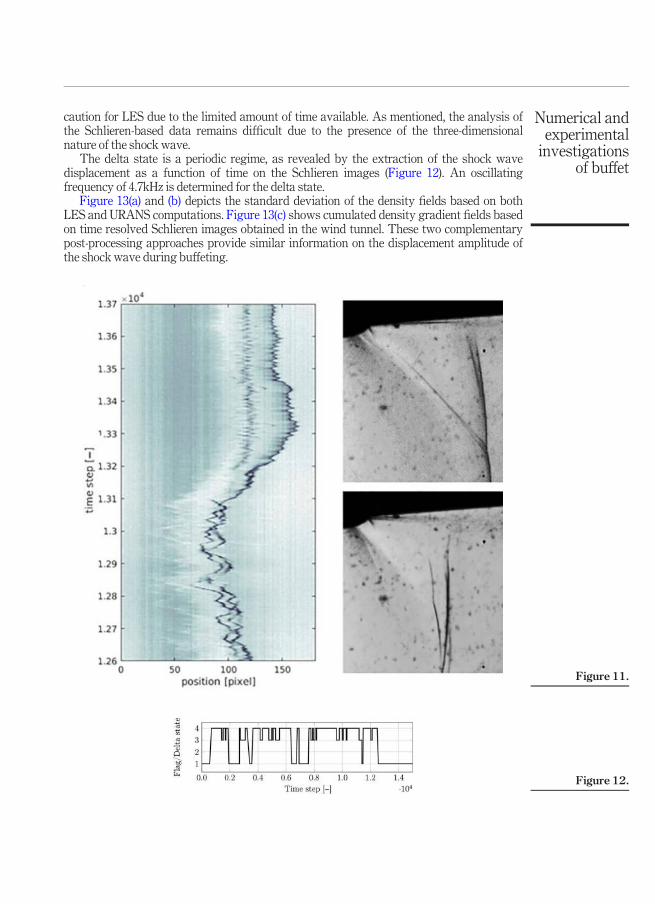
The analysis of the Schlieren-based data shows an aperiodic three-dimensional, time-varying deformation of the shock wave in the span-wise direction (Figure 10).
A secondary oscillation of the shock wave is observed in both numerical andexperimental data: the local boundary layer separation induces an oblique weak shock wavein front of the strong shock wave, resulting in a classical delta shaped pedestal. While the
Figure 8.
Figure 7.
Freestream0.78 < Ma < 0.85
Freestream0.78 < Ma < 0.85
Wall
Wall
20 chords10 chords
Numerical andexperimentalinvestigations
of buffet
dominant frequency results from the interaction between the strong shock wave and theboundary layer separation, the secondary oblique shock wave also oscillates due to the localperiodic flow separation in front of the strong shock wave.
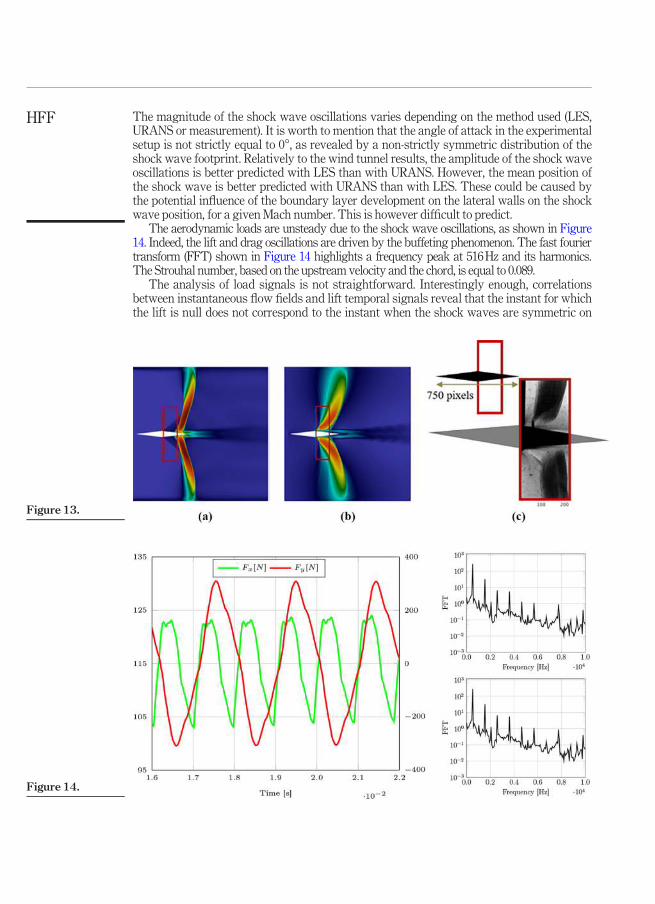
While URANS data exhibit strictly periodic trend of the flow, experimental data exhibit achaotic behavior. Two states can be distinguished in this chaos: the “delta state” and the“flag state” (Figure 11). The delta state (Figure 11 upper right) corresponds to the sinusoidaloscillation of the shock wave. To be more precise, both the oblique weak shock wave and thestrong shock wave oscillate at the same frequency. For this state, the flow can reasonably beconsidered as two dimensional. The flag state (Figure 11 down right) corresponds to a flowregime where the shock wave deforms in the span-wise direction, in the manner of a wind-flapping flag. At this stage of the study, the detailed analysis of this specific unstable state isstill limited by the lack of experimental data. In particular, due to the 2D spatial integrationof the Schlieren technique, it cannot be confirmed if it is or not periodic. When the shockwave is experiencing the delta state, it is positioned closer to the trailing edge than when it isexperiencing the flag state (Figure 11 left). Finally, a third state, hereafter denoted “flyingstate” can also be transiently observed as the shock wave tends to travel, but fails to, fromthe “delta state” to the “flag state” mean positions. Figure 12 depicts the temporal evolutionof the shock wave states and of their transitions from the flag state – number 1 in thefigure – to the delta state – number 4 in the figure – and reversely, and the transientoccurrence of the “flying state” – number 3 in the figure.
With an angle of attack equal to 2°, both flag and delta states are present. But contrary tothe previously discussed 0° angle of attack, the scenario does not alternatively switch fromone state to the other state. The flag state is present on the suction side of the aileron and thedelta state on the pressure side. This tends to indicate that the adverse pressure gradientmay fuel the flag state.
The frequency of the shock wave oscillation is evaluated to f 620Hz (URANS) andf 310Hz (LES) with the spectral analysis. However, the results should be considered with
Figure 10.
Figure 9.
HFF
caution for LES due to the limited amount of time available. As mentioned, the analysis ofthe Schlieren-based data remains difficult due to the presence of the three-dimensionalnature of the shock wave.
The delta state is a periodic regime, as revealed by the extraction of the shock wavedisplacement as a function of time on the Schlieren images (Figure 12). An oscillatingfrequency of 4.7kHz is determined for the delta state.
Figure 13(a) and (b) depicts the standard deviation of the density fields based on bothLES and URANS computations. Figure 13(c) shows cumulated density gradient fields basedon time resolved Schlieren images obtained in the wind tunnel. These two complementarypost-processing approaches provide similar information on the displacement amplitude ofthe shock wave during buffeting.
Figure 11.
Figure 12.
Numerical andexperimentalinvestigations
of buffet
The magnitude of the shock wave oscillations varies depending on the method used (LES,URANS or measurement). It is worth to mention that the angle of attack in the experimentalsetup is not strictly equal to 0°, as revealed by a non-strictly symmetric distribution of theshock wave footprint. Relatively to the wind tunnel results, the amplitude of the shock waveoscillations is better predicted with LES than with URANS. However, the mean position ofthe shock wave is better predicted with URANS than with LES. These could be caused bythe potential influence of the boundary layer development on the lateral walls on the shockwave position, for a givenMach number. This is however difficult to predict.
The aerodynamic loads are unsteady due to the shock wave oscillations, as shown in Figure14. Indeed, the lift and drag oscillations are driven by the buffeting phenomenon. The fast fouriertransform (FFT) shown in Figure 14 highlights a frequency peak at 516Hz and its harmonics.The Strouhal number, based on the upstream velocity and the chord, is equal to 0.089.
The analysis of load signals is not straightforward. Interestingly enough, correlationsbetween instantaneous flow fields and lift temporal signals reveal that the instant for whichthe lift is null does not correspond to the instant when the shock waves are symmetric on
Figure 14.
Figure 13.
HFF
both sides of the airfoil. This behavior is explained by the dynamics of the shock wave,which is different depending on its direction of displacement (upstream or downstream).This shock wave dynamic is thus associated with both lift and drag signals which are notsinusoidal, which in turn explains why the zero lift is not achieved when the positions of theshock waves are symmetric. This analysis also shows that the drag frequency is twice thelift frequency.
The lift and drag predicted with the wall-resolved LES are shown in Figure 15. Only oneperiod of the shock wave oscillation has been simulated at the moment, which is insufficientto fully analyze the spectral content of the signal. However, these results highlight two mainfrequencies: one low frequency associated with buffeting and one higher frequency, relatedto the oblique shock wave oscillation. The magnitude order in terms of lift and drag aresimilar to URANS predictions.
4. Fluid structure interaction: impact of buffeting on the aileronThe objective here is now to study the effect of aerodynamic forces on the dynamic responseof the profile. As a first approximation, only rigid movements of the aileron are considered,such as bending and torsion, as shown in Figure 16(a). The 3D aileron is reduced to its 2Dextruded shape. The bending is modeled by a pure vertical translation in the plane while thetorsion is modeled by a rotation in the plane, as in in Figure 16(b).
The aileron on the rocket is made of a sandwich composite material. The core is an epoxyfoam and the skin is a carbon laminate. The aileron is considered as a beam with a thin webcross section. Moments of inertia are then calculated geometrically, for a diamond crosssection of diagonals equal to 220mm and 12.5mm, with a 1mm [. . .] thick web [. . .]corresponding to the laminate skin. The Young’s modulus E and the shear modulus G arematerial properties, determined by the Classical Laminate Theory (Berthelot, 2012). Thestiffness results are presented in Table I.
Figure 16.
Figure 15.
Numerical andexperimentalinvestigations
of buffet
The dynamic response of the aileron is driven by the fundamental equation of dynamics.The ideal solution is to simulate the solid displacement in a fully coupled way with the flow.However, the large difference between the characteristic times of the fluid and the solidmakes this approach impracticable in the present case. The method relies thus on aseparation between the numerical simulation of the flow and the resolution of the ailerondynamics. As a first step, only flapping is considered, that is driven by equation (2):
M€x þ D _x þ Kx ¼X
FA (2)
with M the matrix of mass, D the damping matrix, K the stiffness matrix and FA theaerodynamic forces. To simplify the problem, an equivalent homogeneous material isconsidered, so matrices are reduced to a scalar.
This equation is timemarched bymeans of a classical four steps Runge–Kutta scheme. At eachtime step, the aerodynamic forces are composed of two components: one related to the phenomenonof buffet and one due to the reaction of the aerodynamic force, induced by the profile displacement.The buffet force is extracted from the numerical simulations (URANS and LES database) and theaerodynamic response is modelled. Due to the low thickness of the profile, and the fact thatdisplacement velocity is small compared to the fluid velocity, the lift force ismodelled using the thinprofile theory, with a compressibility correction (Anderson, 2007) [equation (3)]:
Flift ¼2p a� a0ð Þ
1�Ma2p � 1
2r1U2
1 � S (3)
The angle of the flow seen by the profile at each instant of time is estimated as equation (4):
tana ¼ � _xU1
(4)
As the flow is responding in phase with the solid, the aerodynamic response is apositive damping term in the equation of the dynamic [equation (2)]. The mainlimitation of this approach is that the aerodynamic response to the profile displacementis instantaneous, while a lag is observed in practice. For this reason, this method isvalid only when the ratio between the flow velocity and the displacement velocity of thesolid is large (so the time lag becomes negligible). The results are expressed in terms ofnon-dimensional parameters U*, representing the ratio between the fluid velocity andthe displacement velocity of the solid and m*, representing the mass ratio between thesolid and the fluid:
U* ¼ U112p
km
q� C
m* ¼ mrSL
(5)
Table I.Material properties ofthe aileron
K f [Hz]
Flexion 1373 N/m 13.2Torsion 346 Nm 55.1
HFF
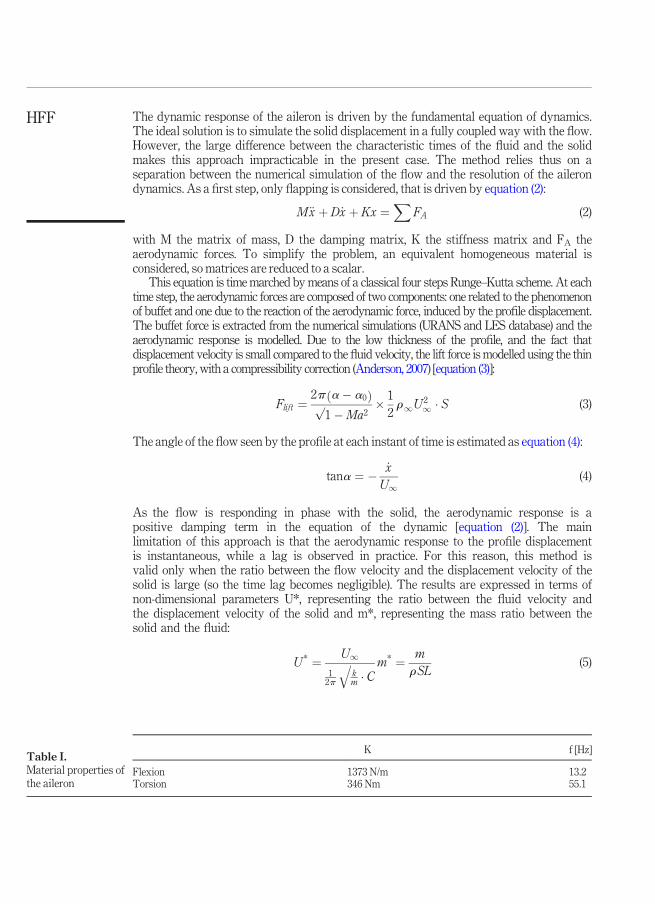
with k the stiffness, C the chord of the aileron and m the mass of the solid. In the case of thescaled 1:1 aileron, the value of the normalized velocity U* is estimated to be close to 100.Two cases are considered: without aerodynamic coupling (only the force coming from buffetis applied) and with coupling (aerodynamic response of the profile is added). The evolutionof the normalized displacement, y* y/C, with respect to the normalized velocity U* isrepresented in Figure 17(a) (using URANS data) and in Figure 17(b) (using LES data), for alarge mass ratio parameter m* 1600.
In Figure 17(a), the peak close to U* 10 corresponds to the resonance between thenatural frequency of the solid and the aerodynamic excitation (buffet). In the case of LES, thebuffet is associated to a more complex signal in terms of spectral content, so two resonancefrequencies are shown in Figure 17(b). In the uncoupled case, the maximum displacementincreased with U* (corresponding to a reduction of the stiffness). In the coupled case, asexpected, the aerodynamic forces act as a damping term, which reduced the amplitude of thedisplacement, especially at the resonance frequency. A plateau is also reached for U* valueshigher than 500. At such velocity ratios, the periodic excitation due to buffet is no longerseen by the solid (as the time-average force of buffet is null, the solid does not react to thisphenomenon). The effect of buffet predicted by LES has a weaker effect on the soliddisplacement compared to URANS.
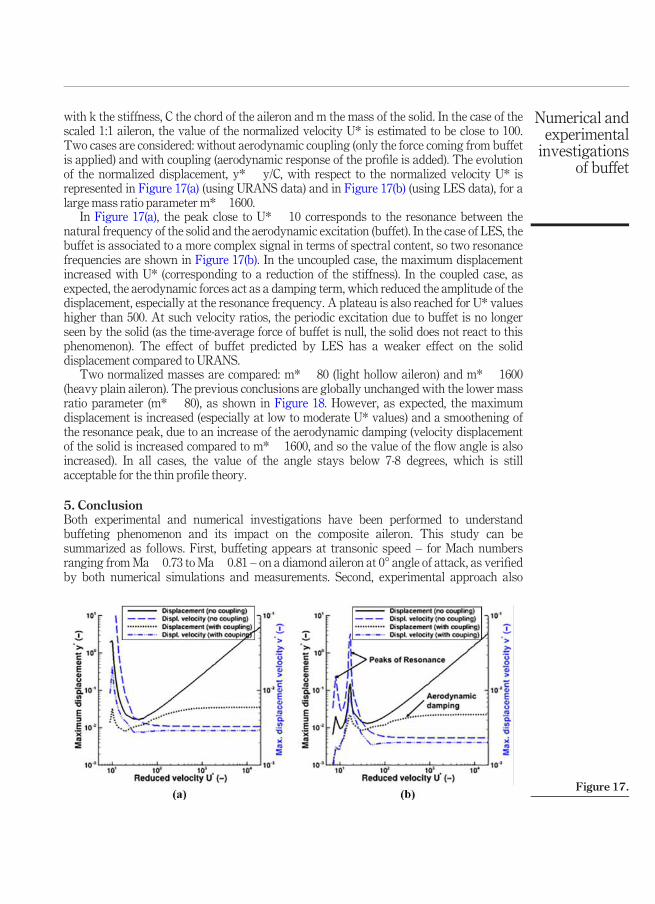
Two normalized masses are compared: m* 80 (light hollow aileron) and m* 1600(heavy plain aileron). The previous conclusions are globally unchanged with the lower massratio parameter (m* 80), as shown in Figure 18. However, as expected, the maximumdisplacement is increased (especially at low to moderate U* values) and a smoothening ofthe resonance peak, due to an increase of the aerodynamic damping (velocity displacementof the solid is increased compared to m* 1600, and so the value of the flow angle is alsoincreased). In all cases, the value of the angle stays below 7-8 degrees, which is stillacceptable for the thin profile theory.
5. ConclusionBoth experimental and numerical investigations have been performed to understandbuffeting phenomenon and its impact on the composite aileron. This study can besummarized as follows. First, buffeting appears at transonic speed – for Mach numbersranging fromMa 0.73 to Ma 0.81 – on a diamond aileron at 0° angle of attack, as verifiedby both numerical simulations and measurements. Second, experimental approach also
Figure 17.
Numerical andexperimentalinvestigations
of buffet
reveals a 3D oscillation of the shock wave in the manner of a wind-flapping flag, but at thisstep, there is no clear evidence of the physical phenomena promoting this 3D mode. Third,LES identifies an oscillation of the width of the shock foot (l -width) which has a significantimpact on the aerodynamics load, but this phenomenon is not seen with the URANSsimulations. At last, interestingly enough, the experiments have also highlighted the chaoticbehavior of the shock wave as it shifts from an oscillatory periodic state (delta state) to anerratic 3D flapping state (flag state), transiently separated by transition states, where theshock wave moves from a close-to-trailing edge position (delta state) to a close-to-dihedronposition (flag state).
This study allows the creation of a first experimental and numerical database ofbuffeting on diamond geometry which, to the authors’ knowledge, has not been documentedin the literature. Moreover, as mentioned by several authors as Sartor and Timme (2016),URANS confirms to be efficient to globally predict the buffet phenomenon, even if LES canimprove the turbulence description.
However, the results reported in this paper still highlight a lack of deciphering of thebuffeting origin. Exhaustive 3D numerical simulationsare to be conducted to betterunderstand the spanwise oscillation of the shock wave, as observed in the wind tunnelexperiments. To this avail more information are also required regarding the wind tunnelupstream flow conditions. The use of unsteady pressure sensors on the aileron will provide amore accurate validation of the numerical simulations in the future. Fluid/structureinteraction has been investigated, considering only the bending mode. The effect of torsionshould now be investigated since it should have more impact on the flow due to the increaseof incidence that amplifies buffeting effects. A provision for future work will also consist inusing a time-dependent stiffness, to represent the influence of progressive damages ofunsteady loads on the aileron (fatigue).
ReferencesAnderson, J. D. (2007), Fundamental of Aerodynamics, McGraw Hill.Barakos, G. and Drikakis, D. (2000), “Numerical simulation of transonic buffet flows using various
turbulence closures”, International Journal of Heat and Fluid Flow, Vol. 21 No. 5, pp. 620 626.Bermejo Moreno, I., Bodart, J., Larsson, J., Barney, B., Nichols, J.W. and Jones, S. (2014), “Solving the
compressible Navier Stokes equations on up to 1.97 million cores and 4.1 trillion grid points”, in
Figure 18.
HFF
SC ’13: Proceedings of the International Conference on High Performance Computing,Networking, Storage and Analysis in Denver, CO, USA, 2013, IEEE, pp. 1 10.
Berthelot, J. M. (2012), Comportement Mécanique et Analyse des Structures. Materiaux Composites,Editions TECDOC, 5eme édition.
Brunet, V. (2003), “Computational study of buffet phenomenon with URANS equations”, AIAA Paper,No. 2003 3679, Orlando, FL.
Brunet, V. and Deck, S. (2008), “Zonal detached eddy simulation of transonic buffet on a civil aircrafttype configuration”, in Peng, S. H. and Haase, W. (Eds), Advances in Hybrid RANS LESModelling, Springer Berlin Heidelberg, pp. 182 191.
Burnham, J.K., Pitt, D.M., White, E.V., Henderson, D.A. and Moses, R.W. (2001), “An advanced buffetload alleviation system”, in42ndAIAA/ASME/ASCE/AHS/ASC Structures, StructuralDynamics, andMaterials Conference and Exhibition in Seattle,WA,USA, 16 19 April 2001.
Caruana, D., Mignosi, A., Correge, M., Le Pourhiet, A. and Rodde, A.M. (2005), “Buffet and buffetingcontrol in transonic flow”,Aerospace Science and Technology, Vol. 9 No. 7, pp. 605 616.
Corre, C., Renaud, T. and Lerat, A. (2003), “Transonic flow control using a Navier Stokes solver and amulti objective genetic algorithm”, in IUTAMSymposiumTranssonicum IV, pp. 297 302.
Crouch, J.D., Garbaruk, A., Magidov, D. and Travin, A. (2009), “Origin of transonic buffet on aerofoils”,Journal of FluidMechanics, Vol. 628, pp. 357 369.
Gao, C., Zhang, W., Kou, J., Liu, Y. and Ye, Z. (2017), “Active control of transonic buffet flow”, Journal ofFluidMechanics, Vol. 824, pp. 312 351.
Goncalves, E. and Houdeville, R. (2004), “Turbulence model and numerical scheme assessment forbuffet computations”, International Journal for Numerical Methods in Fluids, Vol. 46 No. 11,pp. 1127 1152.
Iorio, M.C., Gonzalez, L.M. and Ferrer, E. (2014), “Direct and adjoint global stability analysis ofturbulent transonic flows over a NACA0012 profile”, International Journal for NumericalMethods in Fluids, Vol. 46 No. 11, pp. 1127 1152.
Iovnovich, M. and Raveh, D.E. (2012), “Reynolds averaged Navier Stokes study of the shock buffetinstability mechanism”,AIAA Journal, Vol. 50 No. 4, pp. 880 890.
Jacquin, L., Molton, P., Deck, S., Maury, B. and Soulevant, D. (2009), “Experimental study of shockoscillation over a transonic supercritical profile”,AIAA Journal, Vol. 47 No. 9, pp. 1985 1994.
Kawai, S. and Larsson, J. (2012), “Wall modeling in large eddy simulation: length scales, grid resolution,and accuracy”, Physics of Fluids, Vol. 24 No. 1, p. 015105.
Lee, B.H.K. (1990), “Oscillatory shock motion caused by transonic shock boundary layer interaction”,AIAA Journal, Vol. 28 No. 5, pp. 942 944.
Lee, B.H.K. (2001), “Self sustained shock oscillations on airfoils at transonic speeds”, Progress inAerospace Sciences, Vol. 37 No. 2, pp. 147 196.
McDevitt, J.B. and Okuno, A.F. (1985), “Static and dynamic pressure measurements on a NACA 0012airfoil in the ames high reynolds number facility”, Technical Report, 2485, NASA.
McDevitt, J.B., Levy, J.L.L. and Deiwert, G.S. (1976), “Transonic flow about a thick circular arc airfoil”,AIAA Journal, Vol. 14 No. 5, pp. 606 613.
Menter, F.R. (1994), “Two equation eddy viscosity turbulence models for engineering applications”,AIAA Journal, Vol. 32 No. 8, pp. 1598 1605.
Pearcey, A.H. and Rao, K. (1968), “The interaction between local effect at the shock and rear separationa source of a significant scale effects in wind tunnel tests on airfoils and wings”, TechnicalReport, AGARD.
Renaud, T., Corre, C. and Lerat, A. (2001), “Efficient numerical simulation of buffet for airfoils transonicregime”, In International Forum onAeroelasticity and Structural Dynamics, pp. 29 37.
Numerical andexperimentalinvestigations
of buffet
Sartor, F. and Timme, S. (2016), “Mach number effects on buffeting flow on a half wing bodyconfiguration”, International Journal of Numerical Methods for Heat and Fluid Flow, Vol. 26No. 7, pp. 2066 2080.
Sartor, F., Mettot, C. and Sipp, D. (2015), “Stability, receptivity and sensitivity analyses of buffetingtransonic flow over a profile”,AIAA Journal, Vol. 53 No. 7, pp. 1980 1993.
Sugioka, Y., Numata, D., Asai, K., Koike, S., Nakakita, K. and Koga, S. (2015), “Unsteady PSPmeasurement of transonic buffet on a wing”, AIAA Paper, No. 2015 0025, Kissimmee, FL.
Thiery, M. and Coustols, E. (2006), “Numerical prediction of shock induced oscillations over a 2d airfoil:influence of turbulence modelling and test section walls”, International Journal of Heat and FluidFlow, Vol. 27 No. 4, pp. 661 670.
Tijdeman, J. (1968), “Investigations of the transonic flow around oscillating airfoils”, Technical Report,TR 77090U, NLR.
Vreman, A.W. (2004), “An eddy viscosity subgrid scale model for turbulent shear flow: algebraictheory and applications”, Physics of Fluids, Vol. 16 No. 10, pp. 3670 3681.
Corresponding authorJéromine Dumon can be contacted at: [email protected]
HFF