Embed Size (px)
Citation preview
Applied Energy 123 (2014) 37–46
Contents lists available at ScienceDirect
Applied Energy
journal homepage: www.elsevier .com/locate /apenergy
Numerical analysis of the scavenge flow and convective heat transferin large two-stroke marine diesel engines
http://dx.doi.org/10.1016/j.apenergy.2014.02.0360306-2619/� 2014 Elsevier Ltd. All rights reserved.
Abbreviations: BDC, bottom dead center; CFD, computational fluid dynamics;EVC, exhaust valve closing; EVO, exhaust valve opening; LUD, linear upwinddifference; MARS, monotone advection and reconstruction scheme; RANS, Rey-nolds-Averaged Navier–Stokes; SPC, scavenge port closing; SPO, scavenge portopening; TDC, top dead center; UD, upwind difference.⇑ Corresponding author at: Department of Mechanical Engineering, Technical
University of Denmark, Nils Koppels Allé Building 404, 2800 Kgs. Lyngby, Denmark.Tel.: +45 4525 4327; fax: +45 4588 4325.
E-mail address: [email protected] (J.H. Walther).
E. Sigurdsson a, K.M. Ingvorsen a, M.V. Jensen a, S. Mayer b, S. Matlok b, J.H. Walther a,c,⇑a Department of Mechanical Engineering, Technical University of Denmark, Nils Koppels Allé Building 404, 2800 Kgs. Lyngby, Denmarkb MAN Diesel & Turbo SE, Teglholmsgade 41, 2450 Kbh. SV, Denmarkc Chair of Computational Science, ETH Zürich, Clausiusstrasse 33 ETH-Zentrum, CLT F 11, CH-8092 Zürich, Switzerland
h i g h l i g h t s
� An accurate CFD model of the scavenge flow in a marine diesel engine is developed.� Conjugate heat transfer calculations are performed for the piston crown.� The combustion is accounted for by a novel heat release approach.� A detailed analysis of the scavenging flow is presented.� The temporal and spatial temperature distribution in the piston crown is presented.
a r t i c l e i n f o
Article history:Received 20 August 2013Received in revised form 6 December 2013Accepted 7 February 2014
Keywords:Uniflow scavengingTwo-strokeHeat-transferSwirlCFDMarine diesel engines
a b s t r a c t
A novel computational fluid dynamics (CFD) model is presented for the study of the scavenging processand convective heat transfer in a large two-stroke low-speed uniflow-scavenged marine diesel engine.The engine is modeled using a fully resolved 12� sector, corresponding to one scavenge port, with cyclicboundaries in the tangential direction. The CFD model is strongly coupled to experiments and effectivelyprovides a high order ‘‘interpolation’’ of the engine processes through the solution of the Reynolds-Aver-aged Navier–Stokes (RANS) equations subject to boundary conditions obtained through experiments. Theimposed experimental data includes time histories of the pressure difference across the engine and theheat release during combustion. The model is validated by a numerical sensitivity analysis and througha comparison of model predictions and experimental data, which shows a good agreement. The resultsshow an effective scavenging and a low convective heat loss in agreement with experimental data forlarge marine diesel engines.
� 2014 Elsevier Ltd. All rights reserved.
1. Introduction
The International Maritime Organization has defined new regu-lations for marine engines which aim at reducing NOx emissions by75% in many coastal areas from 2016. At the same time, a contin-ued increase in the fuel oil price is expected. These factors call for
increased control and improvement of emission levels and engineefficiency.
A key engine process for two-stroke engines, both in terms ofemission levels and fuel efficiency, is the scavenging process. Theuniflow method is the most efficient scavenging method for two-stroke engines [1] and has also been considered for free piston en-gines [2] and opposed piston engines [3]. In large two-stroke low-speed marine diesel engines the uniflow method is used in a con-figuration with angled scavenge ports located in the cylinder linerand a single centered exhaust valve in the cylinder head. As thepiston uncovers the ports the fresh charge is blown into the cylin-der creating a swirling flow that forces the combustion gases outthrough the exhaust valve while cooling the combustion chambersurfaces. The swirling motion improves the scavenging and en-hances the mixing of air and fuel during the combustion phase.
38 E. Sigurdsson et al. / Applied Energy 123 (2014) 37–46
Optimization of the scavenge flow can therefore lead to reducedemissions and fuel consumption as well as reductions in heat lossand thermal loads.
Despite the importance of the scavenging process, the details ofthe in-cylinder flow processes are poorly understood. Due to thesize of two-stroke low-speed marine diesel engines, experimentalinvestigations have in general been limited to simplified scalemodels, see e.g. [4,5] and references therein. As experimental workoften has significant practical limitations as well as being bothtime-consuming and expensive, it is desirable to develop numeri-cal tools capable of predicting the in-cylinder processes.
Numerical modeling of the in-cylinder flow in uniflow-scav-enged engines has been the subject of earlier works and includesteady-flow simulations [6–9], 2D-axisymmetric simulations [10–15], sector simulations without scavenge port geometry [16,17],and full 3D simulations [18–20]. The steady-flow simulations mustbe considered to provide only a coarse approximation of the flow ina running engine, and have primarily been used for validation bycomparison with experimental velocity profiles. The 2D-axisym-metric simulations are the least computational expensive, butthe poor representation of the scavenge port geometry is knownto lead to large errors in the predictions [16]. The sector approachprovides a reasonable compromise between the accuracy of thegeometrical representation and the computational cost by assum-ing rotational symmetry. The full 3D-simulations are the only ap-proach that allows asymmetric phenomenons to be studied.However, the large computational cost of the full 3D simulationsgenerally necessitates reductions of the spatial resolution, whichcan lead to considerable reductions of the accuracy. In the workswhere the scavenging process is studied for direct injection en-gines under fired conditions, only a part of the engine cycle is sim-ulated, see e.g. [11–13,16,17,21]. In these cases, the simulations arestarted at exhaust valve opening (EVO) or scavenge port opening(SPO), and are sensitive to the initial fields, which must be esti-mated. These fields include the in-cylinder distribution of the tem-perature, velocity, and turbulence which in general are unknown.
In the present work a computational fluid dynamics (CFD) mod-el of a large two-stroke low-speed uniflow-scavenged marine die-sel engine is developed. The simulated engine is the MAN Diesel &Turbo 4T50ME-X research engine, which is a four cylinder two-stroke marine diesel engine with electronically controlled exhaustvalve and fuel injection and has recently been modified to giveoptical access into the combustion chamber [22]. The cylinder boreis B ¼ 0:50 m, the stroke is S ¼ 2:2 m, and the engine speed isN ¼ 123 rpm at full load conditions. The cylinder has 30 equallyspaced scavenge ports with port angles of /sc ¼ 20� with respectto the radial direction. The main specifications for the research
Table 1Main specifications for the 4T50ME-X research engine at full load conditions.
Parameter Sym. Unit –
Bore B m 0.50Stroke S m 2.20Connecting rod L m 2.885Compression volumea Vc m3 0.02653Geometric compression ratio CR – 17.28:1Engine speed N rpm 123Number of scavenge ports nport – 30Scavenge port angle /sc � 20.0Scavenged mass pr. cycle msc kg 2.07Temperature in scavenge box Tsc K 312Mean scavenge box pressure Psc bar 3.68Mean exhaust receiver pressure Pexh bar 3.28Open port period tsc s 0.10Characteristic flow velocity Usc m/s 26.3
a Uncertain estimate due to compression of connecting rod and thermal expan-sion of cylinder cover.
engine at full load conditions are presented in Table 1. The charac-teristic scavenge flow velocity given in the table is defined byUsc ¼ msc=ðqsctscAcylÞ, where qsc is the fluid density at scavengebox conditions and Acyl ¼ B2p=4 is the cross-sectional area of thecylinder. The Reynolds number for the scavenging process isRe ¼ UscB=msc ¼ 2:5� 106, where msc is the kinematic viscosity atscavenge box conditions. The large Reynolds number indicates thatthe flow is fully turbulent. The flow resistance over the engine isgiven by the non-dimensional Euler NumberEu ¼ ðPsc � PexhÞ qscU2
sc
� �.¼ 14:5, where Psc is the mean scavenge
box pressure and Pexh is the mean exhaust receiver pressure. Theblowdown process starts at exhaust valve opening (EVO) which oc-curs at a crank angle of 68� before the piston reaches bottom deadcenter (BDC). The scavenge port opening (SPO) and scavenge portclosing (SPC) is 37� before and after the BDC, respectively. Thescavenging process ends at exhaust valve closing (EVC) 89� afterBDC.
For the simulations only one engine cylinder is considered andthe geometry is simplified by assuming that the scavenge box andexhaust duct are rotational symmetric. These assumptions make itpossible to represent the engine geometry using a 12� sector, cor-responding to one scavenge port, with cyclic boundaries in the tan-gential direction. The combustion is accounted for byimplementing a time dependent heat source based on the experi-mentally determined heat release. Compared to earlier works, thisnew approach allows for continuous simulation of the full enginecycle and makes the model results independent of the initial fields.The in-cylinder pressure, velocity, temperature, and concentrationfields are predicted through the solution of the Reynolds-AveragedNavier–Stokes (RANS) equations. The purpose of the present workis to use the CFD model to gain knowledge on primarily the scav-enging process but also the convective contribution to the in-cylin-der heat transfer.
The model is validated by a sensitivity analysis of the numericalparameters and through comparison of model predictions andexperimental data. The mixing of the cylinder gases is examinedand the concentration of fresh charge in the cylinder at exhaustvalve closing is estimated. The transient behavior of the angularand axial momentum in the engine cylinder is studied over the fullengine cycle. Convective heat transfer between cylinder gases andcombustion chamber surfaces is investigated and the total in-cyl-inder heat loss is estimated. Conjugate heat transfer computationsare performed for the upper part of the piston crown and surfacetemperature variations through the engine cycle are studied.
2. Numerical model
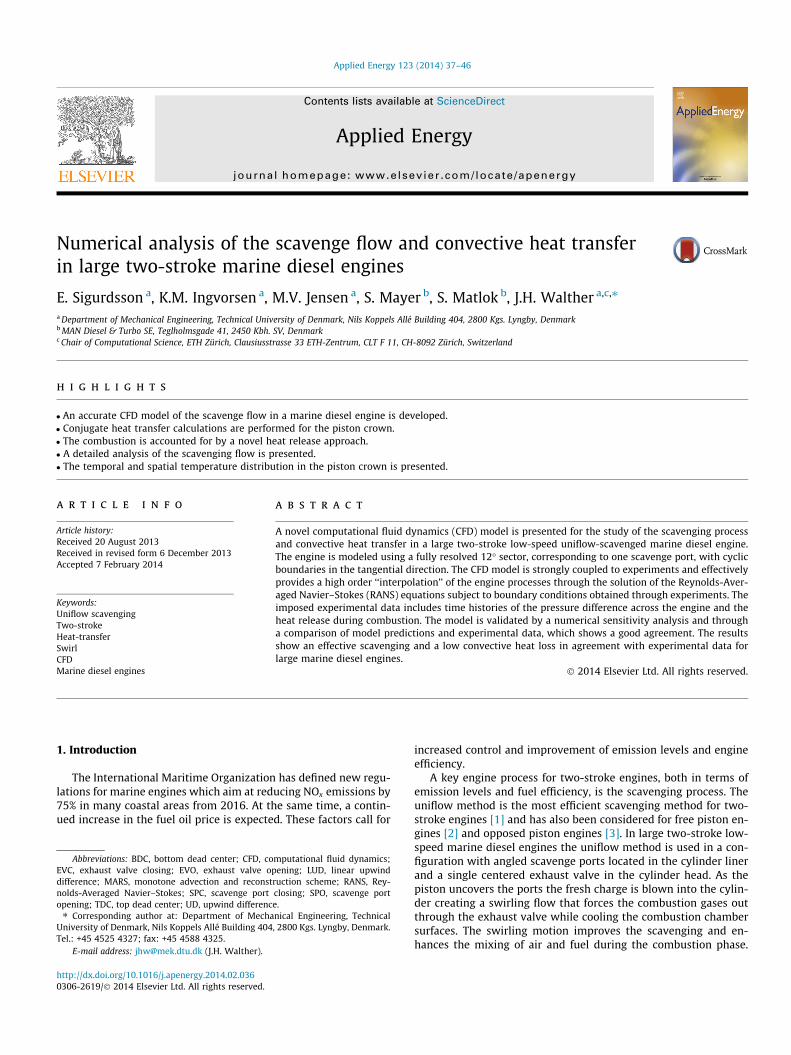
The engine simulations are performed using the commercialCFD code STAR-CD version 4.12.010 solving the RANS equationsusing a finite volume discretization. The computational domain isa 12� sector corresponding to a single scavenge port and representsthe engine geometry from the scavenge box inlet to the exhaustdiffuser outlet (Fig. 1). For simplicity, the piston, cylinder head, ex-haust valve, and scavenge port geometries are modeled using planesurfaces with sharp edges. However, care is taken, to ensure thatthe compression volume and the effective flow areas in the modelare the same as in the physical engine. The mesh consists ofapproximately 174,000 cells corresponding 5.2 million cells forthe full 360� geometry. The mesh resolution in the cylinder volumeis 76 cells in radial direction, 8 cells in tangential direction, and 172cells in axial direction. The mesh is gradually refined toward thewalls in radial and axial directions ensuring yþ values throughoutthe engine cycles within the limits of the applied turbulence mod-els (yþ < 250). Additional details and visualizations of the mesh aregiven in [23]. The motion of the piston and exhaust valve is mod-
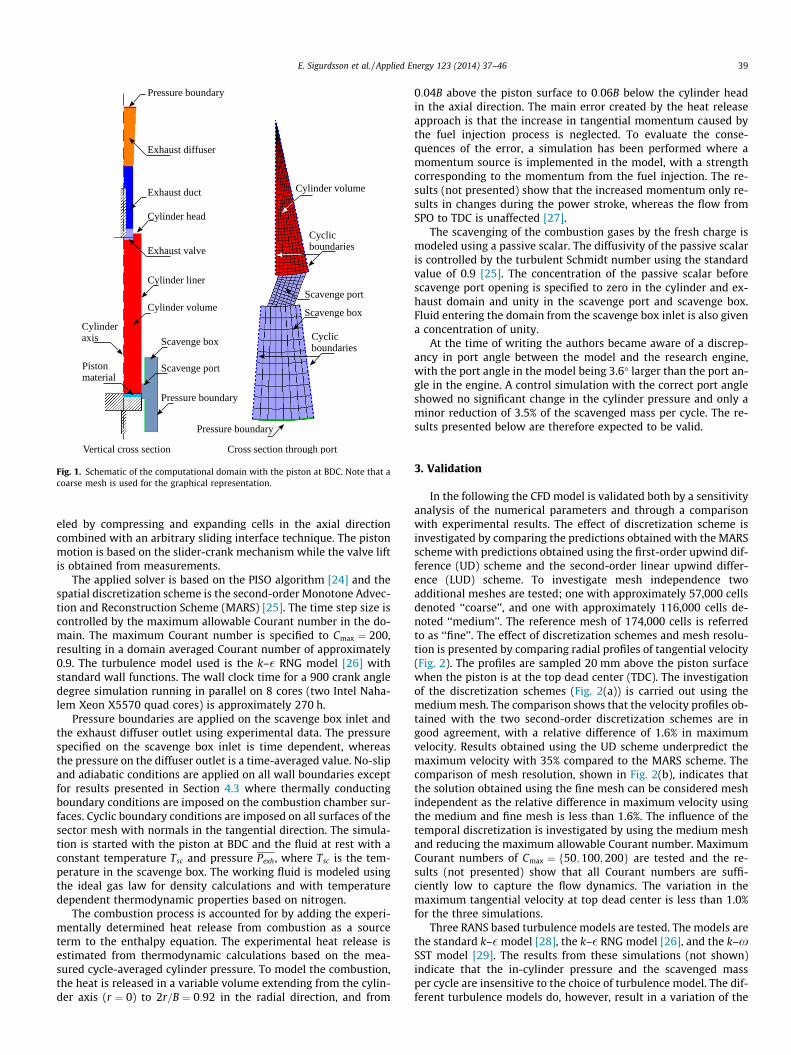
Fig. 1. Schematic of the computational domain with the piston at BDC. Note that acoarse mesh is used for the graphical representation.
E. Sigurdsson et al. / Applied Energy 123 (2014) 37–46 39
eled by compressing and expanding cells in the axial directioncombined with an arbitrary sliding interface technique. The pistonmotion is based on the slider-crank mechanism while the valve liftis obtained from measurements.
The applied solver is based on the PISO algorithm [24] and thespatial discretization scheme is the second-order Monotone Advec-tion and Reconstruction Scheme (MARS) [25]. The time step size iscontrolled by the maximum allowable Courant number in the do-main. The maximum Courant number is specified to Cmax ¼ 200,resulting in a domain averaged Courant number of approximately0.9. The turbulence model used is the k–� RNG model [26] withstandard wall functions. The wall clock time for a 900 crank angledegree simulation running in parallel on 8 cores (two Intel Naha-lem Xeon X5570 quad cores) is approximately 270 h.
Pressure boundaries are applied on the scavenge box inlet andthe exhaust diffuser outlet using experimental data. The pressurespecified on the scavenge box inlet is time dependent, whereasthe pressure on the diffuser outlet is a time-averaged value. No-slipand adiabatic conditions are applied on all wall boundaries exceptfor results presented in Section 4.3 where thermally conductingboundary conditions are imposed on the combustion chamber sur-faces. Cyclic boundary conditions are imposed on all surfaces of thesector mesh with normals in the tangential direction. The simula-tion is started with the piston at BDC and the fluid at rest with aconstant temperature Tsc and pressure Pexh, where Tsc is the tem-perature in the scavenge box. The working fluid is modeled usingthe ideal gas law for density calculations and with temperaturedependent thermodynamic properties based on nitrogen.
The combustion process is accounted for by adding the experi-mentally determined heat release from combustion as a sourceterm to the enthalpy equation. The experimental heat release isestimated from thermodynamic calculations based on the mea-sured cycle-averaged cylinder pressure. To model the combustion,the heat is released in a variable volume extending from the cylin-der axis (r ¼ 0) to 2r=B ¼ 0:92 in the radial direction, and from
0:04B above the piston surface to 0:06B below the cylinder headin the axial direction. The main error created by the heat releaseapproach is that the increase in tangential momentum caused bythe fuel injection process is neglected. To evaluate the conse-quences of the error, a simulation has been performed where amomentum source is implemented in the model, with a strengthcorresponding to the momentum from the fuel injection. The re-sults (not presented) show that the increased momentum only re-sults in changes during the power stroke, whereas the flow fromSPO to TDC is unaffected [27].
The scavenging of the combustion gases by the fresh charge ismodeled using a passive scalar. The diffusivity of the passive scalaris controlled by the turbulent Schmidt number using the standardvalue of 0.9 [25]. The concentration of the passive scalar beforescavenge port opening is specified to zero in the cylinder and ex-haust domain and unity in the scavenge port and scavenge box.Fluid entering the domain from the scavenge box inlet is also givena concentration of unity.
At the time of writing the authors became aware of a discrep-ancy in port angle between the model and the research engine,with the port angle in the model being 3.6� larger than the port an-gle in the engine. A control simulation with the correct port angleshowed no significant change in the cylinder pressure and only aminor reduction of 3.5% of the scavenged mass per cycle. The re-sults presented below are therefore expected to be valid.
3. Validation
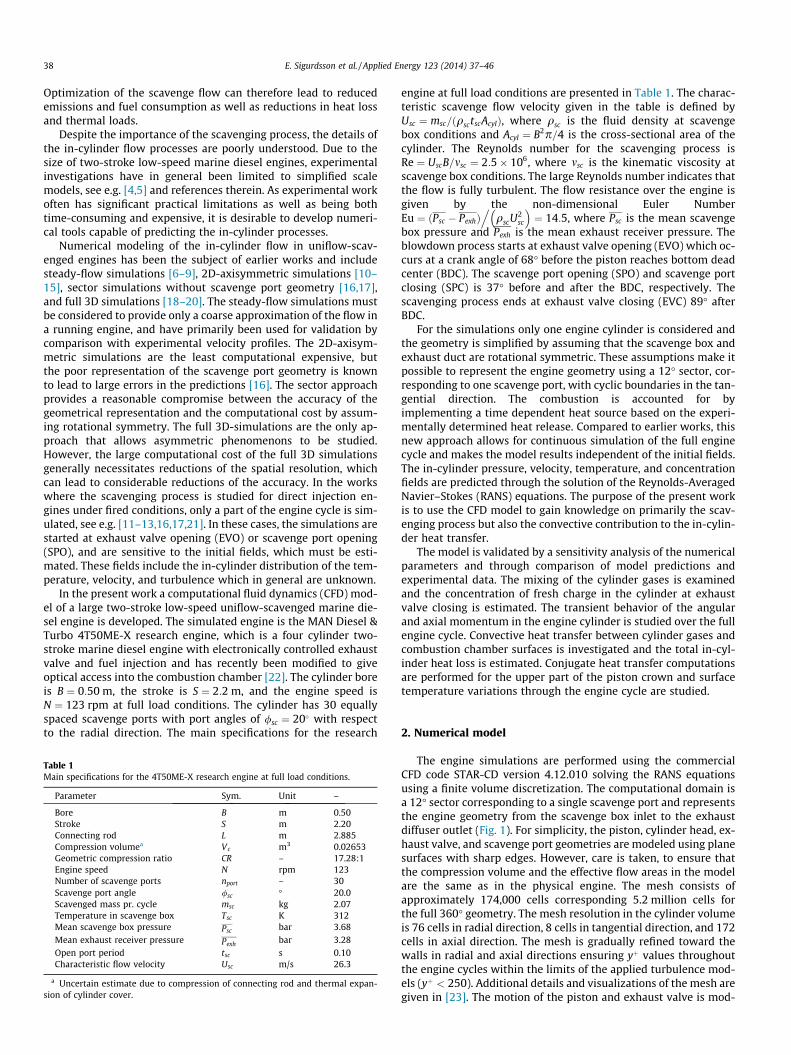
In the following the CFD model is validated both by a sensitivityanalysis of the numerical parameters and through a comparisonwith experimental results. The effect of discretization scheme isinvestigated by comparing the predictions obtained with the MARSscheme with predictions obtained using the first-order upwind dif-ference (UD) scheme and the second-order linear upwind differ-ence (LUD) scheme. To investigate mesh independence twoadditional meshes are tested; one with approximately 57,000 cellsdenoted ‘‘coarse’’, and one with approximately 116,000 cells de-noted ‘‘medium’’. The reference mesh of 174,000 cells is referredto as ‘‘fine’’. The effect of discretization schemes and mesh resolu-tion is presented by comparing radial profiles of tangential velocity(Fig. 2). The profiles are sampled 20 mm above the piston surfacewhen the piston is at the top dead center (TDC). The investigationof the discretization schemes (Fig. 2(a)) is carried out using themedium mesh. The comparison shows that the velocity profiles ob-tained with the two second-order discretization schemes are ingood agreement, with a relative difference of 1.6% in maximumvelocity. Results obtained using the UD scheme underpredict themaximum velocity with 35% compared to the MARS scheme. Thecomparison of mesh resolution, shown in Fig. 2(b), indicates thatthe solution obtained using the fine mesh can be considered meshindependent as the relative difference in maximum velocity usingthe medium and fine mesh is less than 1.6%. The influence of thetemporal discretization is investigated by using the medium meshand reducing the maximum allowable Courant number. MaximumCourant numbers of Cmax ¼ f50;100;200g are tested and the re-sults (not presented) show that all Courant numbers are suffi-ciently low to capture the flow dynamics. The variation in themaximum tangential velocity at top dead center is less than 1.0%for the three simulations.
Three RANS based turbulence models are tested. The models arethe standard k–�model [28], the k–� RNG model [26], and the k–xSST model [29]. The results from these simulations (not shown)indicate that the in-cylinder pressure and the scavenged massper cycle are insensitive to the choice of turbulence model. The dif-ferent turbulence models do, however, result in a variation of the
0.00 0.05 0.10 0.15 0.20 0.250
5
10
15
20
25
30
r [m]
V θ [
m/s
]
MARS
LUD
UD
(a) Velocity profiles obtained with different discretizationschemes.
0.00 0.05 0.10 0.15 0.20 0.250
5
10
15
20
25
30
r [m]
Vθ
[m
/s]
Fine
Medium
Coarse
(b) Velocity profiles obtained with different mesh resolutions.
Fig. 2. Numerical sensitivity analysis. Comparison of radial profiles of tangentialvelocity at TDC.
−105 −90 −75 −60 −45 −300
5
10
15
20
25EVC
Crank angle [°]
Pres
sure
[ba
r]
CFDExp.
−180 −135 −90 −45 0 45 90 135 1800
25
50
75
100
125
150
175BDC SPC EVC TDC EVO SPO BDC
Crank angle [°]
Pres
sure
[ba
r]
CFDExp.
(a) Cylinder pressure over the full engine cycle.
(b) Close-up of the cylinder pressure after exhaust valve closing (EVC).
Fig. 3. In-cylinder pressure measured at the cylinder head vs. crank angle after TDC.
40 E. Sigurdsson et al. / Applied Energy 123 (2014) 37–46
velocity profiles. Compared to the maximum tangential velocity atTDC obtained with the k–� RNG model, the standard k–�model andthe k–x SST model give 10% and 3% lower velocities, respectively.It is chosen to use the k–� RNG model for the remaining simula-tions which is consistent with the work of Lendormy et al. [30].
The cyclic convergence of the simulation, meaning the time re-quired to reach a periodic state, is investigated by comparingvelocity profiles and mass flow rate through the scavenge portsfor consecutive cycles after the simulation start. The comparisonshows that cyclic convergence is achieved after the second enginecycle as differences in the monitored quantities from the secondand third cycle are negligible.
The model predictions are now compared with the experimen-tal data. The predicted mass of scavenged gas per cycle is 1:92 kg,which is in good agreement with the experimental value of 2:07 kg,corresponding to a relative difference of 7%. Comparison of the pre-dicted and experimental in-cylinder pressure traces (Fig. 3(a))shows a good agreement except near TDC where the model under-predicts the pressure. The largest relative discrepancy is 14% and isobserved at TDC. The discrepancy is mainly attributed to the idealgas assumption, as differences between ideal gas and real gas den-sity become significant at high pressures. Preliminary results, ob-tained using the same numerical model, show that applying theRedlich–Kwong equation of state, instead of the ideal gas law, re-duces the discrepancy in maximum cylinder pressure to 6.5%[27]. The remaining discrepancy is mainly attributed the uncer-
tainty of the mass trapped in the cylinder at EVC and the uncer-tainty of the measured heat release.
After exhaust valve closing the experimental pressure traceshows an oscillatory behavior (Fig. 3(b)). The frequency of theoscillations is found to be f ¼ c=ð2LÞ, where c is the average speedof sound in the cylinder and L is the cylinder length. This is the fun-damental frequency of a pipe with both ends closed and corre-sponds to a pressure wave traveling between the piston surfaceand the cylinder head. The CFD prediction shows a good agreementon the frequency but underestimates the amplitude of theoscillations.
4. Results
In this section the validated model is used to analyze the in-cyl-inder flow as well as the convective contribution to the in-cylinderheat transfer.
4.1. The scavenge flow
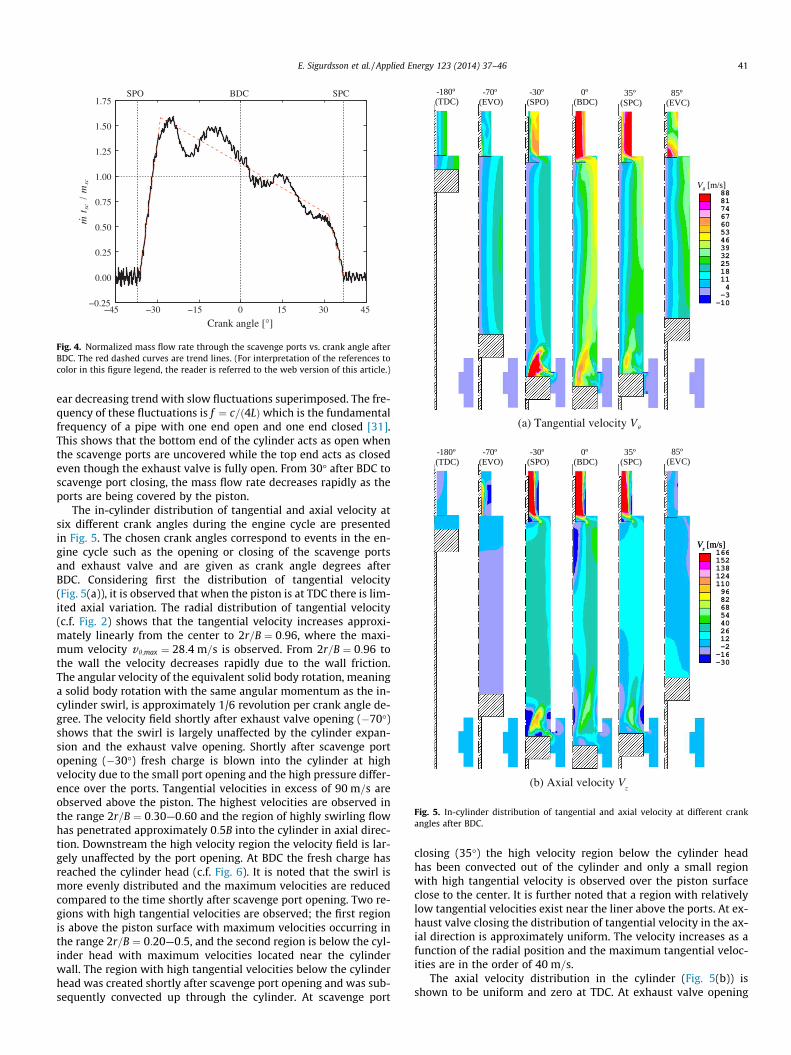
The normalized mass flow rate through the scavenge ports dur-ing scavenging is presented in Fig. 4. The mass flow rate shows arapid increase in the first 7� after scavenge port opening reachinga cycle maximum at �30� after BDC. The fact that no negative massflow rate is observed after port opening shows that no blowblackoccurs. From �30� to 30� after BDC the mass flow rate shows a lin-
−45 −30 −15 0 15 30 45−0.25
0.00
0.25
0.50
0.75
1.00
1.25
1.50
1.75BDC SPCSPO
Crank angle [°]
sc/m
sc
Fig. 4. Normalized mass flow rate through the scavenge ports vs. crank angle afterBDC. The red dashed curves are trend lines. (For interpretation of the references tocolor in this figure legend, the reader is referred to the web version of this article.)
(a) Tangential velocity V
(b) Axial velocity Vz
Fig. 5. In-cylinder distribution of tangential and axial velocity at different crankangles after BDC.
E. Sigurdsson et al. / Applied Energy 123 (2014) 37–46 41
ear decreasing trend with slow fluctuations superimposed. The fre-quency of these fluctuations is f ¼ c=ð4LÞwhich is the fundamentalfrequency of a pipe with one end open and one end closed [31].This shows that the bottom end of the cylinder acts as open whenthe scavenge ports are uncovered while the top end acts as closedeven though the exhaust valve is fully open. From 30� after BDC toscavenge port closing, the mass flow rate decreases rapidly as theports are being covered by the piston.
The in-cylinder distribution of tangential and axial velocity atsix different crank angles during the engine cycle are presentedin Fig. 5. The chosen crank angles correspond to events in the en-gine cycle such as the opening or closing of the scavenge portsand exhaust valve and are given as crank angle degrees afterBDC. Considering first the distribution of tangential velocity(Fig. 5(a)), it is observed that when the piston is at TDC there is lim-ited axial variation. The radial distribution of tangential velocity(c.f. Fig. 2) shows that the tangential velocity increases approxi-mately linearly from the center to 2r=B ¼ 0:96, where the maxi-mum velocity vh;max ¼ 28:4 m=s is observed. From 2r=B ¼ 0:96 tothe wall the velocity decreases rapidly due to the wall friction.The angular velocity of the equivalent solid body rotation, meaninga solid body rotation with the same angular momentum as the in-cylinder swirl, is approximately 1/6 revolution per crank angle de-gree. The velocity field shortly after exhaust valve opening (�70�)shows that the swirl is largely unaffected by the cylinder expan-sion and the exhaust valve opening. Shortly after scavenge portopening (�30�) fresh charge is blown into the cylinder at highvelocity due to the small port opening and the high pressure differ-ence over the ports. Tangential velocities in excess of 90 m=s areobserved above the piston. The highest velocities are observed inthe range 2r=B ¼ 0:30—0:60 and the region of highly swirling flowhas penetrated approximately 0:5B into the cylinder in axial direc-tion. Downstream the high velocity region the velocity field is lar-gely unaffected by the port opening. At BDC the fresh charge hasreached the cylinder head (c.f. Fig. 6). It is noted that the swirl ismore evenly distributed and the maximum velocities are reducedcompared to the time shortly after scavenge port opening. Two re-gions with high tangential velocities are observed; the first regionis above the piston surface with maximum velocities occurring inthe range 2r=B ¼ 0:20—0:5, and the second region is below the cyl-inder head with maximum velocities located near the cylinderwall. The region with high tangential velocities below the cylinderhead was created shortly after scavenge port opening and was sub-sequently convected up through the cylinder. At scavenge port
closing (35�) the high velocity region below the cylinder headhas been convected out of the cylinder and only a small regionwith high tangential velocity is observed over the piston surfaceclose to the center. It is further noted that a region with relativelylow tangential velocities exist near the liner above the ports. At ex-haust valve closing the distribution of tangential velocity in the ax-ial direction is approximately uniform. The velocity increases as afunction of the radial position and the maximum tangential veloc-ities are in the order of 40 m=s.
The axial velocity distribution in the cylinder (Fig. 5(b)) isshown to be uniform and zero at TDC. At exhaust valve opening
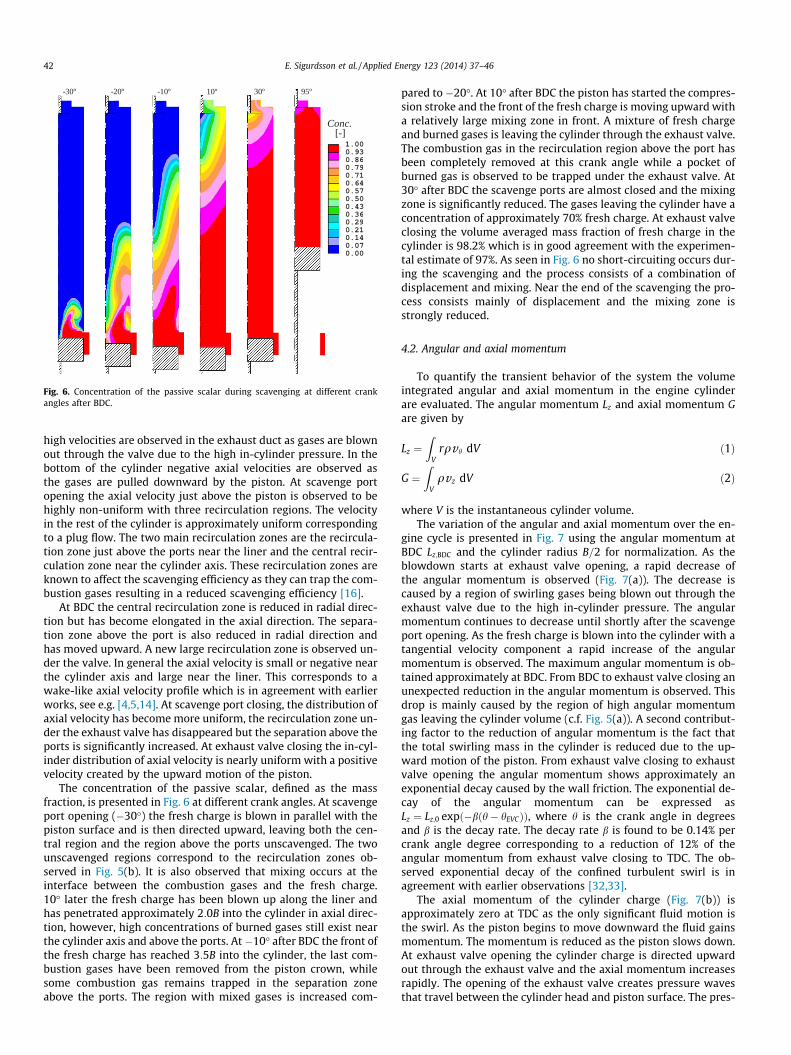
Fig. 6. Concentration of the passive scalar during scavenging at different crankangles after BDC.
42 E. Sigurdsson et al. / Applied Energy 123 (2014) 37–46
high velocities are observed in the exhaust duct as gases are blownout through the valve due to the high in-cylinder pressure. In thebottom of the cylinder negative axial velocities are observed asthe gases are pulled downward by the piston. At scavenge portopening the axial velocity just above the piston is observed to behighly non-uniform with three recirculation regions. The velocityin the rest of the cylinder is approximately uniform correspondingto a plug flow. The two main recirculation zones are the recircula-tion zone just above the ports near the liner and the central recir-culation zone near the cylinder axis. These recirculation zones areknown to affect the scavenging efficiency as they can trap the com-bustion gases resulting in a reduced scavenging efficiency [16].
At BDC the central recirculation zone is reduced in radial direc-tion but has become elongated in the axial direction. The separa-tion zone above the port is also reduced in radial direction andhas moved upward. A new large recirculation zone is observed un-der the valve. In general the axial velocity is small or negative nearthe cylinder axis and large near the liner. This corresponds to awake-like axial velocity profile which is in agreement with earlierworks, see e.g. [4,5,14]. At scavenge port closing, the distribution ofaxial velocity has become more uniform, the recirculation zone un-der the exhaust valve has disappeared but the separation above theports is significantly increased. At exhaust valve closing the in-cyl-inder distribution of axial velocity is nearly uniform with a positivevelocity created by the upward motion of the piston.
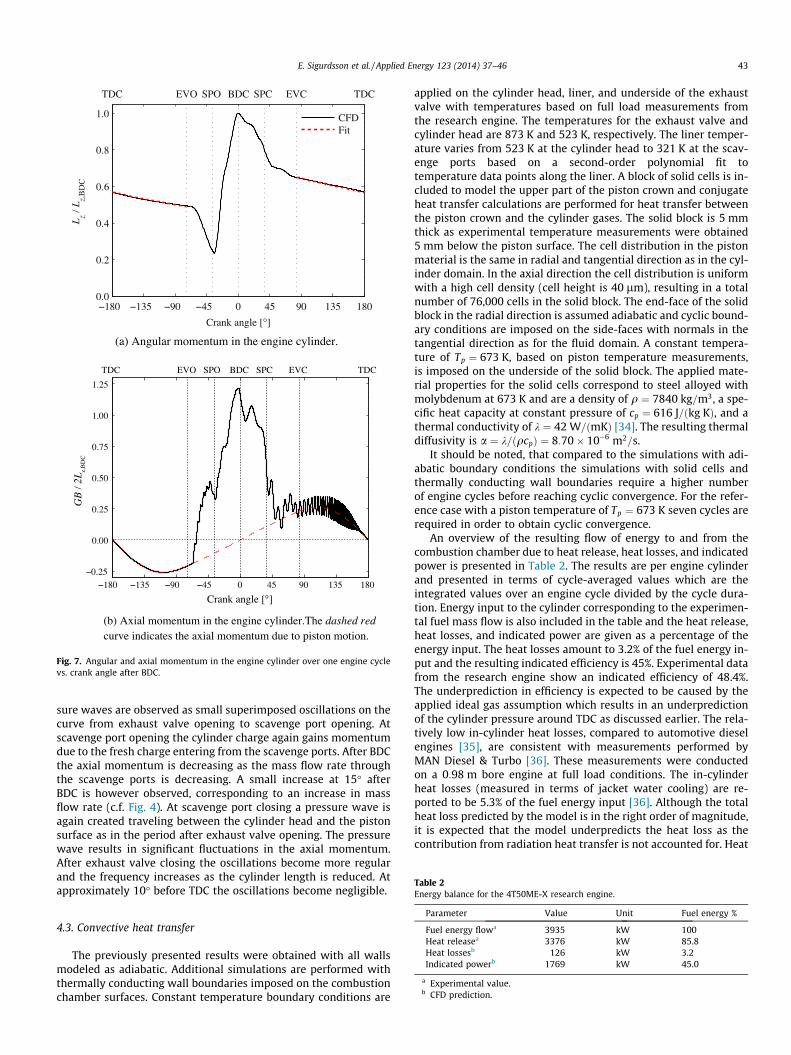
The concentration of the passive scalar, defined as the massfraction, is presented in Fig. 6 at different crank angles. At scavengeport opening (�30�) the fresh charge is blown in parallel with thepiston surface and is then directed upward, leaving both the cen-tral region and the region above the ports unscavenged. The twounscavenged regions correspond to the recirculation zones ob-served in Fig. 5(b). It is also observed that mixing occurs at theinterface between the combustion gases and the fresh charge.10� later the fresh charge has been blown up along the liner andhas penetrated approximately 2:0B into the cylinder in axial direc-tion, however, high concentrations of burned gases still exist nearthe cylinder axis and above the ports. At�10� after BDC the front ofthe fresh charge has reached 3:5B into the cylinder, the last com-bustion gases have been removed from the piston crown, whilesome combustion gas remains trapped in the separation zoneabove the ports. The region with mixed gases is increased com-
pared to �20�. At 10� after BDC the piston has started the compres-sion stroke and the front of the fresh charge is moving upward witha relatively large mixing zone in front. A mixture of fresh chargeand burned gases is leaving the cylinder through the exhaust valve.The combustion gas in the recirculation region above the port hasbeen completely removed at this crank angle while a pocket ofburned gas is observed to be trapped under the exhaust valve. At30� after BDC the scavenge ports are almost closed and the mixingzone is significantly reduced. The gases leaving the cylinder have aconcentration of approximately 70% fresh charge. At exhaust valveclosing the volume averaged mass fraction of fresh charge in thecylinder is 98.2% which is in good agreement with the experimen-tal estimate of 97%. As seen in Fig. 6 no short-circuiting occurs dur-ing the scavenging and the process consists of a combination ofdisplacement and mixing. Near the end of the scavenging the pro-cess consists mainly of displacement and the mixing zone isstrongly reduced.
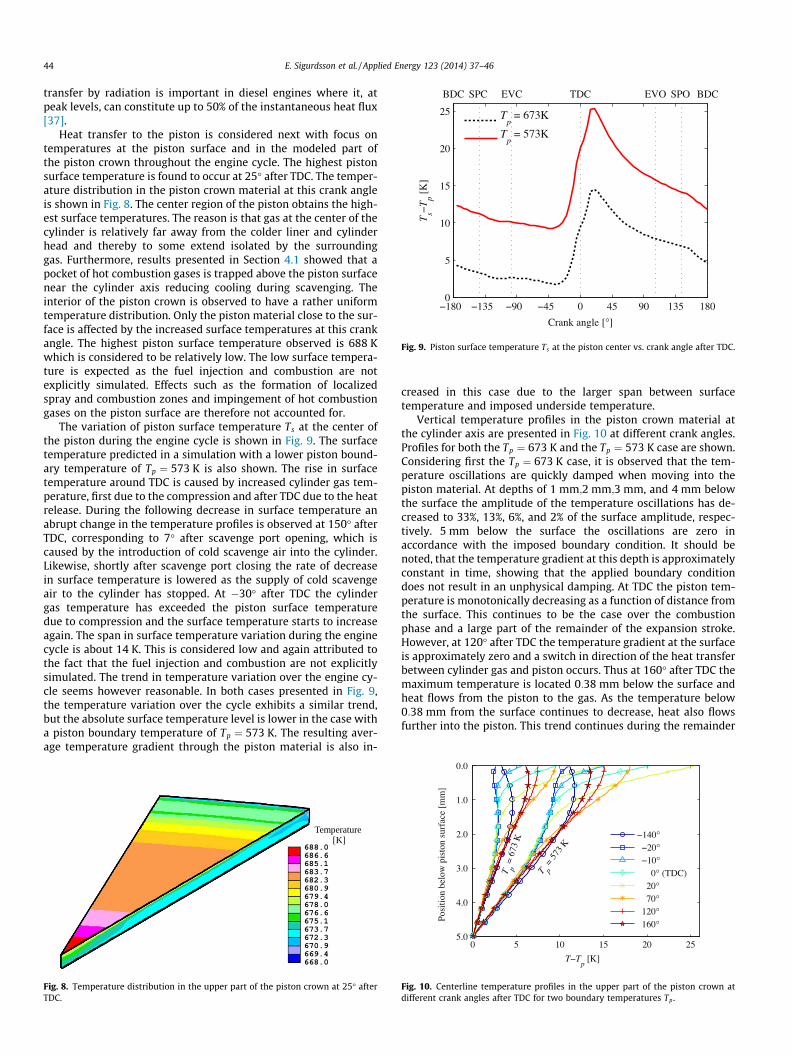
4.2. Angular and axial momentum
To quantify the transient behavior of the system the volumeintegrated angular and axial momentum in the engine cylinderare evaluated. The angular momentum Lz and axial momentum Gare given by
Lz ¼Z
Vrqvh dV ð1Þ
G ¼Z
Vqvz dV ð2Þ
where V is the instantaneous cylinder volume.The variation of the angular and axial momentum over the en-
gine cycle is presented in Fig. 7 using the angular momentum atBDC Lz;BDC and the cylinder radius B=2 for normalization. As theblowdown starts at exhaust valve opening, a rapid decrease ofthe angular momentum is observed (Fig. 7(a)). The decrease iscaused by a region of swirling gases being blown out through theexhaust valve due to the high in-cylinder pressure. The angularmomentum continues to decrease until shortly after the scavengeport opening. As the fresh charge is blown into the cylinder with atangential velocity component a rapid increase of the angularmomentum is observed. The maximum angular momentum is ob-tained approximately at BDC. From BDC to exhaust valve closing anunexpected reduction in the angular momentum is observed. Thisdrop is mainly caused by the region of high angular momentumgas leaving the cylinder volume (c.f. Fig. 5(a)). A second contribut-ing factor to the reduction of angular momentum is the fact thatthe total swirling mass in the cylinder is reduced due to the up-ward motion of the piston. From exhaust valve closing to exhaustvalve opening the angular momentum shows approximately anexponential decay caused by the wall friction. The exponential de-cay of the angular momentum can be expressed asLz ¼ Lz;0 expð�bðh� hEVCÞÞ, where h is the crank angle in degreesand b is the decay rate. The decay rate b is found to be 0.14% percrank angle degree corresponding to a reduction of 12% of theangular momentum from exhaust valve closing to TDC. The ob-served exponential decay of the confined turbulent swirl is inagreement with earlier observations [32,33].
The axial momentum of the cylinder charge (Fig. 7(b)) isapproximately zero at TDC as the only significant fluid motion isthe swirl. As the piston begins to move downward the fluid gainsmomentum. The momentum is reduced as the piston slows down.At exhaust valve opening the cylinder charge is directed upwardout through the exhaust valve and the axial momentum increasesrapidly. The opening of the exhaust valve creates pressure wavesthat travel between the cylinder head and piston surface. The pres-
(a) Angular momentum in the engine cylinder.
−180 −135 −90 −45 0 45 90 135 180
−0.25
0.00
0.25
0.50
0.75
1.00
1.25
BDC SPC EVC TDCTDC EVO SPO
Crank angle [°]
GB
/ 2L
z,B
DC
(b) Axial momentum in the engine cylinder.The dashed redcurve indicates the axial momentum due to piston motion.
−180 −135 −90 −45 0 45 90 135 1800.0
0.2
0.4
0.6
0.8
1.0
BDC SPC EVC TDCTDC EVO SPO
Crank angle [°]
Lz /
Lz,
BD
C
CFDFit
Fig. 7. Angular and axial momentum in the engine cylinder over one engine cyclevs. crank angle after BDC.
Table 2Energy balance for the 4T50ME-X research engine.
E. Sigurdsson et al. / Applied Energy 123 (2014) 37–46 43
sure waves are observed as small superimposed oscillations on thecurve from exhaust valve opening to scavenge port opening. Atscavenge port opening the cylinder charge again gains momentumdue to the fresh charge entering from the scavenge ports. After BDCthe axial momentum is decreasing as the mass flow rate throughthe scavenge ports is decreasing. A small increase at 15� afterBDC is however observed, corresponding to an increase in massflow rate (c.f. Fig. 4). At scavenge port closing a pressure wave isagain created traveling between the cylinder head and the pistonsurface as in the period after exhaust valve opening. The pressurewave results in significant fluctuations in the axial momentum.After exhaust valve closing the oscillations become more regularand the frequency increases as the cylinder length is reduced. Atapproximately 10� before TDC the oscillations become negligible.
Parameter Value Unit Fuel energy %
Fuel energy flowa 3935 kW 100Heat releasea 3376 kW 85.8Heat lossesb 126 kW 3.2Indicated powerb 1769 kW 45.0
a Experimental value.b CFD prediction.
4.3. Convective heat transfer
The previously presented results were obtained with all wallsmodeled as adiabatic. Additional simulations are performed withthermally conducting wall boundaries imposed on the combustionchamber surfaces. Constant temperature boundary conditions are
applied on the cylinder head, liner, and underside of the exhaustvalve with temperatures based on full load measurements fromthe research engine. The temperatures for the exhaust valve andcylinder head are 873 K and 523 K, respectively. The liner temper-ature varies from 523 K at the cylinder head to 321 K at the scav-enge ports based on a second-order polynomial fit totemperature data points along the liner. A block of solid cells is in-cluded to model the upper part of the piston crown and conjugateheat transfer calculations are performed for heat transfer betweenthe piston crown and the cylinder gases. The solid block is 5 mmthick as experimental temperature measurements were obtained5 mm below the piston surface. The cell distribution in the pistonmaterial is the same in radial and tangential direction as in the cyl-inder domain. In the axial direction the cell distribution is uniformwith a high cell density (cell height is 40 lm), resulting in a totalnumber of 76,000 cells in the solid block. The end-face of the solidblock in the radial direction is assumed adiabatic and cyclic bound-ary conditions are imposed on the side-faces with normals in thetangential direction as for the fluid domain. A constant tempera-ture of Tp ¼ 673 K, based on piston temperature measurements,is imposed on the underside of the solid block. The applied mate-rial properties for the solid cells correspond to steel alloyed withmolybdenum at 673 K and are a density of q ¼ 7840 kg=m3, a spe-cific heat capacity at constant pressure of cp ¼ 616 J=ðkg KÞ, and athermal conductivity of k ¼ 42 W=ðmKÞ [34]. The resulting thermaldiffusivity is a ¼ k=ðqcpÞ ¼ 8:70� 10�6 m2=s.
It should be noted, that compared to the simulations with adi-abatic boundary conditions the simulations with solid cells andthermally conducting wall boundaries require a higher numberof engine cycles before reaching cyclic convergence. For the refer-ence case with a piston temperature of Tp ¼ 673 K seven cycles arerequired in order to obtain cyclic convergence.
An overview of the resulting flow of energy to and from thecombustion chamber due to heat release, heat losses, and indicatedpower is presented in Table 2. The results are per engine cylinderand presented in terms of cycle-averaged values which are theintegrated values over an engine cycle divided by the cycle dura-tion. Energy input to the cylinder corresponding to the experimen-tal fuel mass flow is also included in the table and the heat release,heat losses, and indicated power are given as a percentage of theenergy input. The heat losses amount to 3.2% of the fuel energy in-put and the resulting indicated efficiency is 45%. Experimental datafrom the research engine show an indicated efficiency of 48.4%.The underprediction in efficiency is expected to be caused by theapplied ideal gas assumption which results in an underpredictionof the cylinder pressure around TDC as discussed earlier. The rela-tively low in-cylinder heat losses, compared to automotive dieselengines [35], are consistent with measurements performed byMAN Diesel & Turbo [36]. These measurements were conductedon a 0:98 m bore engine at full load conditions. The in-cylinderheat losses (measured in terms of jacket water cooling) are re-ported to be 5.3% of the fuel energy input [36]. Although the totalheat loss predicted by the model is in the right order of magnitude,it is expected that the model underpredicts the heat loss as thecontribution from radiation heat transfer is not accounted for. Heat
−180 −135 −90 −45 0 45 90 135 1800
5
10
15
20
25
Crank angle [°]
T s−Tp [
K]
BDC SPC EVC TDC EVO SPO BDC
Tp = 673K
Tp = 573K
Fig. 9. Piston surface temperature Ts at the piston center vs. crank angle after TDC.
44 E. Sigurdsson et al. / Applied Energy 123 (2014) 37–46
transfer by radiation is important in diesel engines where it, atpeak levels, can constitute up to 50% of the instantaneous heat flux[37].
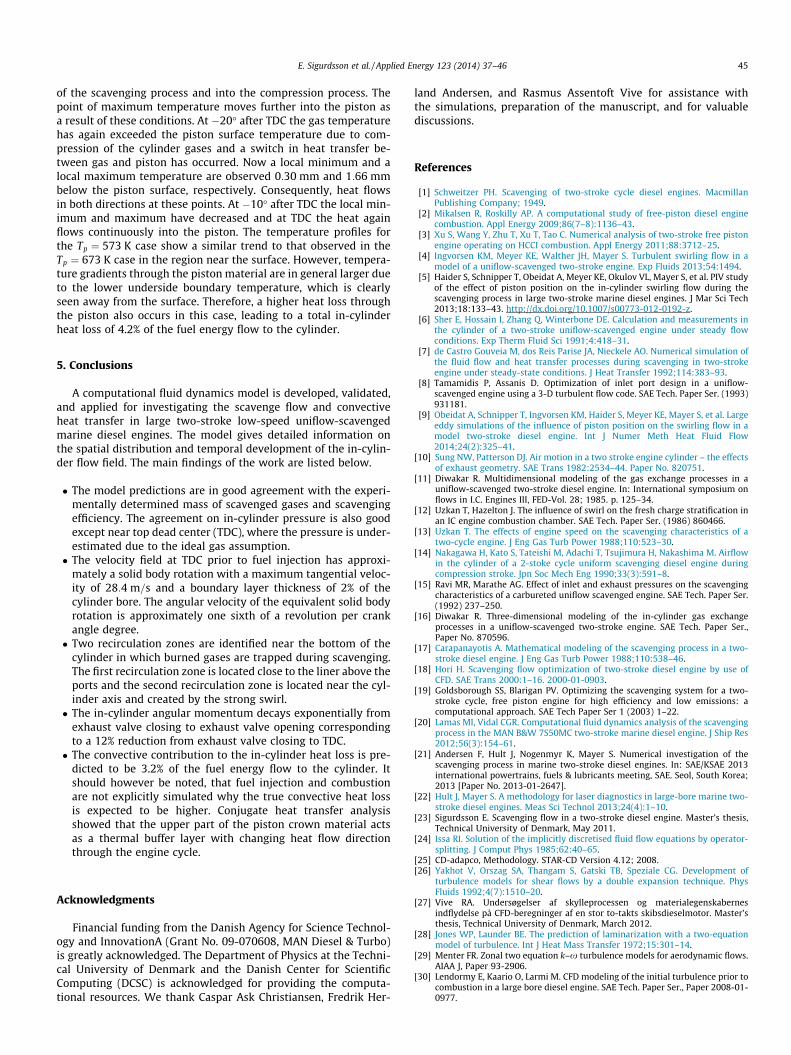
Heat transfer to the piston is considered next with focus ontemperatures at the piston surface and in the modeled part ofthe piston crown throughout the engine cycle. The highest pistonsurface temperature is found to occur at 25� after TDC. The temper-ature distribution in the piston crown material at this crank angleis shown in Fig. 8. The center region of the piston obtains the high-est surface temperatures. The reason is that gas at the center of thecylinder is relatively far away from the colder liner and cylinderhead and thereby to some extend isolated by the surroundinggas. Furthermore, results presented in Section 4.1 showed that apocket of hot combustion gases is trapped above the piston surfacenear the cylinder axis reducing cooling during scavenging. Theinterior of the piston crown is observed to have a rather uniformtemperature distribution. Only the piston material close to the sur-face is affected by the increased surface temperatures at this crankangle. The highest piston surface temperature observed is 688 Kwhich is considered to be relatively low. The low surface tempera-ture is expected as the fuel injection and combustion are notexplicitly simulated. Effects such as the formation of localizedspray and combustion zones and impingement of hot combustiongases on the piston surface are therefore not accounted for.
The variation of piston surface temperature Ts at the center ofthe piston during the engine cycle is shown in Fig. 9. The surfacetemperature predicted in a simulation with a lower piston bound-ary temperature of Tp ¼ 573 K is also shown. The rise in surfacetemperature around TDC is caused by increased cylinder gas tem-perature, first due to the compression and after TDC due to the heatrelease. During the following decrease in surface temperature anabrupt change in the temperature profiles is observed at 150� afterTDC, corresponding to 7� after scavenge port opening, which iscaused by the introduction of cold scavenge air into the cylinder.Likewise, shortly after scavenge port closing the rate of decreasein surface temperature is lowered as the supply of cold scavengeair to the cylinder has stopped. At �30� after TDC the cylindergas temperature has exceeded the piston surface temperaturedue to compression and the surface temperature starts to increaseagain. The span in surface temperature variation during the enginecycle is about 14 K. This is considered low and again attributed tothe fact that the fuel injection and combustion are not explicitlysimulated. The trend in temperature variation over the engine cy-cle seems however reasonable. In both cases presented in Fig. 9,the temperature variation over the cycle exhibits a similar trend,but the absolute surface temperature level is lower in the case witha piston boundary temperature of Tp ¼ 573 K. The resulting aver-age temperature gradient through the piston material is also in-
Fig. 8. Temperature distribution in the upper part of the piston crown at 25� afterTDC.
creased in this case due to the larger span between surfacetemperature and imposed underside temperature.
Vertical temperature profiles in the piston crown material atthe cylinder axis are presented in Fig. 10 at different crank angles.Profiles for both the Tp ¼ 673 K and the Tp ¼ 573 K case are shown.Considering first the Tp ¼ 673 K case, it is observed that the tem-perature oscillations are quickly damped when moving into thepiston material. At depths of 1 mm;2 mm;3 mm, and 4 mm belowthe surface the amplitude of the temperature oscillations has de-creased to 33%, 13%, 6%, and 2% of the surface amplitude, respec-tively. 5 mm below the surface the oscillations are zero inaccordance with the imposed boundary condition. It should benoted, that the temperature gradient at this depth is approximatelyconstant in time, showing that the applied boundary conditiondoes not result in an unphysical damping. At TDC the piston tem-perature is monotonically decreasing as a function of distance fromthe surface. This continues to be the case over the combustionphase and a large part of the remainder of the expansion stroke.However, at 120� after TDC the temperature gradient at the surfaceis approximately zero and a switch in direction of the heat transferbetween cylinder gas and piston occurs. Thus at 160� after TDC themaximum temperature is located 0:38 mm below the surface andheat flows from the piston to the gas. As the temperature below0:38 mm from the surface continues to decrease, heat also flowsfurther into the piston. This trend continues during the remainder
0 5 10 15 20 25
0.0
1.0
2.0
3.0
4.0
5.0
T−Tp [K]
Posi
tion
belo
w p
isto
n su
rfac
e [m
m]
T p =
673
K
T p =
573
K
−140° −20° −10° 0° (TDC) 20° 70° 120° 160°
Fig. 10. Centerline temperature profiles in the upper part of the piston crown atdifferent crank angles after TDC for two boundary temperatures Tp .
E. Sigurdsson et al. / Applied Energy 123 (2014) 37–46 45
of the scavenging process and into the compression process. Thepoint of maximum temperature moves further into the piston asa result of these conditions. At �20� after TDC the gas temperaturehas again exceeded the piston surface temperature due to com-pression of the cylinder gases and a switch in heat transfer be-tween gas and piston has occurred. Now a local minimum and alocal maximum temperature are observed 0:30 mm and 1:66 mmbelow the piston surface, respectively. Consequently, heat flowsin both directions at these points. At �10� after TDC the local min-imum and maximum have decreased and at TDC the heat againflows continuously into the piston. The temperature profiles forthe Tp ¼ 573 K case show a similar trend to that observed in theTp ¼ 673 K case in the region near the surface. However, tempera-ture gradients through the piston material are in general larger dueto the lower underside boundary temperature, which is clearlyseen away from the surface. Therefore, a higher heat loss throughthe piston also occurs in this case, leading to a total in-cylinderheat loss of 4.2% of the fuel energy flow to the cylinder.
5. Conclusions
A computational fluid dynamics model is developed, validated,and applied for investigating the scavenge flow and convectiveheat transfer in large two-stroke low-speed uniflow-scavengedmarine diesel engines. The model gives detailed information onthe spatial distribution and temporal development of the in-cylin-der flow field. The main findings of the work are listed below.
� The model predictions are in good agreement with the experi-mentally determined mass of scavenged gases and scavengingefficiency. The agreement on in-cylinder pressure is also goodexcept near top dead center (TDC), where the pressure is under-estimated due to the ideal gas assumption.� The velocity field at TDC prior to fuel injection has approxi-
mately a solid body rotation with a maximum tangential veloc-ity of 28:4 m=s and a boundary layer thickness of 2% of thecylinder bore. The angular velocity of the equivalent solid bodyrotation is approximately one sixth of a revolution per crankangle degree.� Two recirculation zones are identified near the bottom of the
cylinder in which burned gases are trapped during scavenging.The first recirculation zone is located close to the liner above theports and the second recirculation zone is located near the cyl-inder axis and created by the strong swirl.� The in-cylinder angular momentum decays exponentially from
exhaust valve closing to exhaust valve opening correspondingto a 12% reduction from exhaust valve closing to TDC.� The convective contribution to the in-cylinder heat loss is pre-
dicted to be 3.2% of the fuel energy flow to the cylinder. Itshould however be noted, that fuel injection and combustionare not explicitly simulated why the true convective heat lossis expected to be higher. Conjugate heat transfer analysisshowed that the upper part of the piston crown material actsas a thermal buffer layer with changing heat flow directionthrough the engine cycle.
Acknowledgments
Financial funding from the Danish Agency for Science Technol-ogy and InnovationA (Grant No. 09-070608, MAN Diesel & Turbo)is greatly acknowledged. The Department of Physics at the Techni-cal University of Denmark and the Danish Center for ScientificComputing (DCSC) is acknowledged for providing the computa-tional resources. We thank Caspar Ask Christiansen, Fredrik Her-
land Andersen, and Rasmus Assentoft Vive for assistance withthe simulations, preparation of the manuscript, and for valuablediscussions.
References
[1] Schweitzer PH. Scavenging of two-stroke cycle diesel engines. MacmillanPublishing Company; 1949.
[2] Mikalsen R, Roskilly AP. A computational study of free-piston diesel enginecombustion. Appl Energy 2009;86(7–8):1136–43.
[3] Xu S, Wang Y, Zhu T, Xu T, Tao C. Numerical analysis of two-stroke free pistonengine operating on HCCI combustion. Appl Energy 2011;88:3712–25.
[4] Ingvorsen KM, Meyer KE, Walther JH, Mayer S. Turbulent swirling flow in amodel of a uniflow-scavenged two-stroke engine. Exp Fluids 2013;54:1494.
[5] Haider S, Schnipper T, Obeidat A, Meyer KE, Okulov VL, Mayer S, et al. PIV studyof the effect of piston position on the in-cylinder swirling flow during thescavenging process in large two-stroke marine diesel engines. J Mar Sci Tech2013;18:133–43. http://dx.doi.org/10.1007/s00773-012-0192-z.
[6] Sher E, Hossain I, Zhang Q, Winterbone DE. Calculation and measurements inthe cylinder of a two-stroke uniflow-scavenged engine under steady flowconditions. Exp Therm Fluid Sci 1991;4:418–31.
[7] de Castro Gouveia M, dos Reis Parise JA, Nieckele AO. Numerical simulation ofthe fluid flow and heat transfer processes during scavenging in two-strokeengine under steady-state conditions. J Heat Transfer 1992;114:383–93.
[8] Tamamidis P, Assanis D. Optimization of inlet port design in a uniflow-scavenged engine using a 3-D turbulent flow code. SAE Tech. Paper Ser. (1993)931181.
[9] Obeidat A, Schnipper T, Ingvorsen KM, Haider S, Meyer KE, Mayer S, et al. Largeeddy simulations of the influence of piston position on the swirling flow in amodel two-stroke diesel engine. Int J Numer Meth Heat Fluid Flow2014;24(2):325–41.
[10] Sung NW, Patterson DJ. Air motion in a two stroke engine cylinder – the effectsof exhaust geometry. SAE Trans 1982:2534–44. Paper No. 820751.
[11] Diwakar R. Multidimensional modeling of the gas exchange processes in auniflow-scavenged two-stroke diesel engine. In: International symposium onflows in I.C. Engines III, FED-Vol. 28; 1985. p. 125–34.
[12] Uzkan T, Hazelton J. The influence of swirl on the fresh charge stratification inan IC engine combustion chamber. SAE Tech. Paper Ser. (1986) 860466.
[13] Uzkan T. The effects of engine speed on the scavenging characteristics of atwo-cycle engine. J Eng Gas Turb Power 1988;110:523–30.
[14] Nakagawa H, Kato S, Tateishi M, Adachi T, Tsujimura H, Nakashima M. Airflowin the cylinder of a 2-stoke cycle uniform scavenging diesel engine duringcompression stroke. Jpn Soc Mech Eng 1990;33(3):591–8.
[15] Ravi MR, Marathe AG. Effect of inlet and exhaust pressures on the scavengingcharacteristics of a carbureted uniflow scavenged engine. SAE Tech. Paper Ser.(1992) 237–250.
[16] Diwakar R. Three-dimensional modeling of the in-cylinder gas exchangeprocesses in a uniflow-scavenged two-stroke engine. SAE Tech. Paper Ser.,Paper No. 870596.
[17] Carapanayotis A. Mathematical modeling of the scavenging process in a two-stroke diesel engine. J Eng Gas Turb Power 1988;110:538–46.
[18] Hori H. Scavenging flow optimization of two-stroke diesel engine by use ofCFD. SAE Trans 2000:1–16. 2000-01-0903.
[19] Goldsborough SS, Blarigan PV. Optimizing the scavenging system for a two-stroke cycle, free piston engine for high efficiency and low emissions: acomputational approach. SAE Tech Paper Ser 1 (2003) 1–22.
[20] Lamas MI, Vidal CGR. Computational fluid dynamics analysis of the scavengingprocess in the MAN B&W 7S50MC two-stroke marine diesel engine. J Ship Res2012;56(3):154–61.
[21] Andersen F, Hult J, Nogenmyr K, Mayer S. Numerical investigation of thescavenging process in marine two-stroke diesel engines. In: SAE/KSAE 2013international powertrains, fuels & lubricants meeting, SAE. Seol, South Korea;2013 [Paper No. 2013-01-2647].
[22] Hult J, Mayer S. A methodology for laser diagnostics in large-bore marine two-stroke diesel engines. Meas Sci Technol 2013;24(4):1–10.
[23] Sigurdsson E. Scavenging flow in a two-stroke diesel engine. Master’s thesis,Technical University of Denmark, May 2011.
[24] Issa RI. Solution of the implicitly discretised fluid flow equations by operator-splitting. J Comput Phys 1985;62:40–65.
[25] CD-adapco, Methodology. STAR-CD Version 4.12; 2008.[26] Yakhot V, Orszag SA, Thangam S, Gatski TB, Speziale CG. Development of
turbulence models for shear flows by a double expansion technique. PhysFluids 1992;4(7):1510–20.
[27] Vive RA. Undersøgelser af skylleprocessen og materialegenskabernesindflydelse på CFD-beregninger af en stor to-takts skibsdieselmotor. Master’sthesis, Technical University of Denmark, March 2012.
[28] Jones WP, Launder BE. The prediction of laminarization with a two-equationmodel of turbulence. Int J Heat Mass Transfer 1972;15:301–14.
[29] Menter FR. Zonal two equation k–x turbulence models for aerodynamic flows.AIAA J, Paper 93-2906.
[30] Lendormy E, Kaario O, Larmi M. CFD modeling of the initial turbulence prior tocombustion in a large bore diesel engine. SAE Tech. Paper Ser., Paper 2008-01-0977.

46 E. Sigurdsson et al. / Applied Energy 123 (2014) 37–46
[31] Young HD, Freedman RA. Sears and Zemansky’s university physics: withmodern physics. 11th ed. Sansome St., San Fransico: Addison-WesleyPublishing Company; 2004.
[32] Kreith F, Sonju OK. The decay of a turbulent swirl in a pipe. J Fluid Mech1965;22(2):257–71.
[33] Kitoh O. Experimental study of turbulent swirling flow in a straight pipe. JFluid Mech 1991;225:445–79.
[34] Incropera FP, DeWitt DP. Introduction to heat transfer. 4th ed. John Wiley &Sons; 2002.
[35] Finol CA, Robinson K. Thermal modelling of modern engines: a review ofempirical correlations to estimate the in-cylinder heat transfer coefficient.Proc Inst Mech Eng Part D – J Automob Eng 2006;220(12):1765–81.
[36] MAN B&W Diesel A/S. Thermo efficiency system (TES) for reduction of fuelconsumption and CO2 emission. Tech. rep., MAN B&W Diesel, Copenhagen,Denmark; 2005.
[37] Borman G, Nishiwaki K. Internal-combustion engine heat transfer. Prog EnergyCombust Sci 1987;13(1):1–46.