Embed Size (px)
Citation preview
Numeracy Booklet
A guide for parents and staff
2
Introduction
What is meant by numeracy?
Numeracy is a ‘service’ for various subjects, and for many things
in everyday life: the numerical skills and reasoning capabilities
that enable learners to make solid progress in their education.
This booklet concentrates on the core numeracy needed to learn
effectively in other subjects and for everyday life.
There is a strong focus on literacy and numeracy in the new
curriculum, because all children and young people require these skills to learn effectively and to succeed in
life. Confidence and competence in literacy and numeracy provide the foundations for lifelong learning.
What is the purpose of the booklet?
This booklet has been produced to give guidance to parents on how certain common numeracy topics are
taught in mathematics and throughout the school. Staff from all departments have had input into the
creation of the booklet, and it is hoped that with a consistent approach across all subjects pupils will
progress successfully.
How can it be used?
If you are helping your child with their homework, you can
refer to the booklet to see what methods are being taught in
school. Look up the relevant page for a step by step guide.
The booklet includes numeracy skills that are useful in many
other areas than mathematics. There is also a glossary at the back, which explains what several
mathematical terms mean.
Why do some topics include more than one method?
In some cases (e.g. percentages), the method used will be dependent on the level of difficulty of the
question, and whether or not a calculator is permitted.
For mental calculations, pupils should be encouraged to develop a variety of strategies so that they can
select the most appropriate method in any given situation.

3
What level of numeracy does this booklet cover?
This booklet broadly contains information about numeracy which is used in the school from nursery
through to secondary level. There is a section at the start with some considerations for Early level –
nursery and lower primary. The remainder of the booklet covers a variety of topics, up to around CfE Level
3.
If you have any questions, then please do not hesitate to contact the school.
4
Early Level
Some Considerations for Early Level for early mathematical development and some practical ideas to try out at home. Children need to become confident and competent in learning and using key skills. These are:-
Understanding and using number
Developing a mathematical language –(words used in mathematics e.g. less, fewer, shorter. makes, equals, 2 pence, o’clock, empty) – See the Maths Glossary.
Finding solutions to mathematical problems
Pattern, order and relationships
Logical thinking
Exploring and comparing quantities, shapes and measures. Children experience maths as part of their everyday environment. The type of maths young children now do is not writing sums but sorting socks. They need to touch and do in order to learn, so their early maths is based on practical activities that can be incorporated into their play. Here are a few ideas to try:-
Role play shopping – counting money, matching, recognising and writing numbers
Setting the dinner table – counting, matching, ordering, position
Water play – comparing volume, capacity, height and depth
Climbing frame whole body experience of height, space, weight, angles and direction
Outdoor walk– counting, recognising numbers, experimenting with big numbers, looking for shapes
Counting is a skill that children often pick up very early. At first, your child might chant numbers in a random way without focusing on each object. Don’t worry if your child doesn’t seem to count carefully to begin with, this will come later as they learn to match numbers and objects. Remember to:-
Point to each object as you count it
Take the cue from your child – if your child is not interested now, try again another day
Talk about numbers in context such as “there are five buttons on your coat, but only four on mine, you’ve got more than me”
5
Addition
Mental strategies
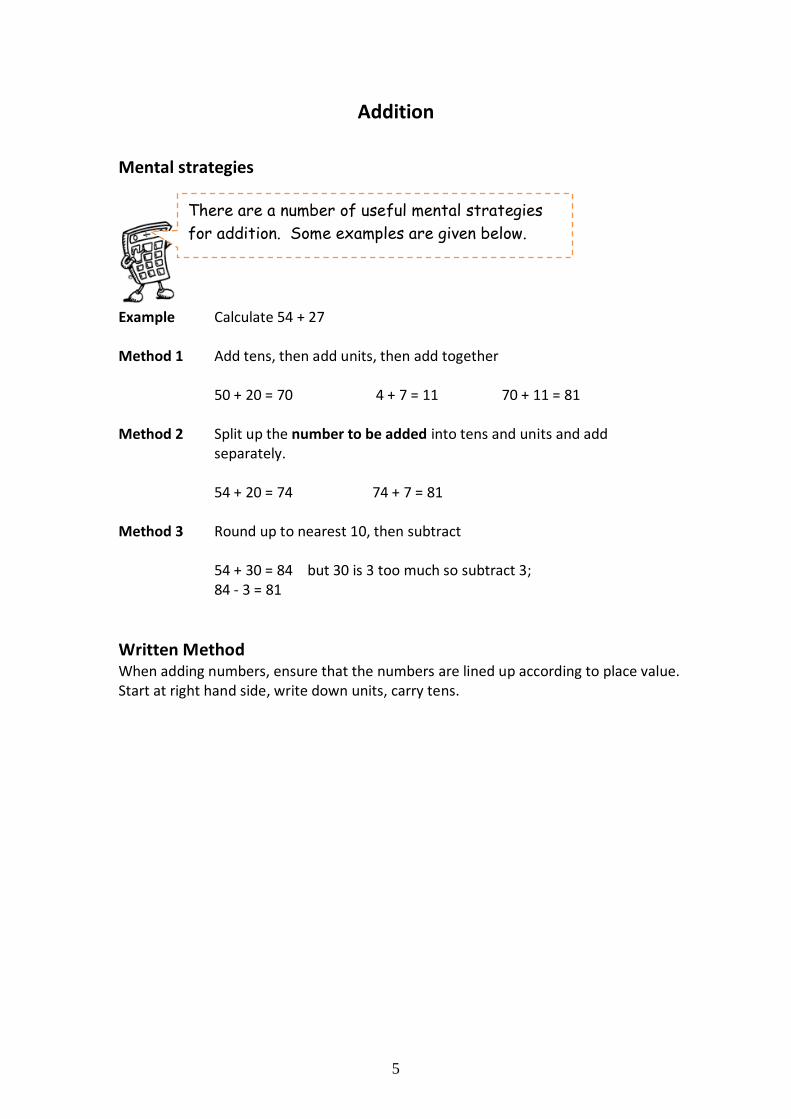
Example Calculate 54 + 27 Method 1 Add tens, then add units, then add together 50 + 20 = 70 4 + 7 = 11 70 + 11 = 81 Method 2 Split up the number to be added into tens and units and add
separately. 54 + 20 = 74 74 + 7 = 81 Method 3 Round up to nearest 10, then subtract 54 + 30 = 84 but 30 is 3 too much so subtract 3;
84 - 3 = 81
Written Method When adding numbers, ensure that the numbers are lined up according to place value. Start at right hand side, write down units, carry tens.
There are a number of useful mental strategies
for addition. Some examples are given below.
6
Subtraction
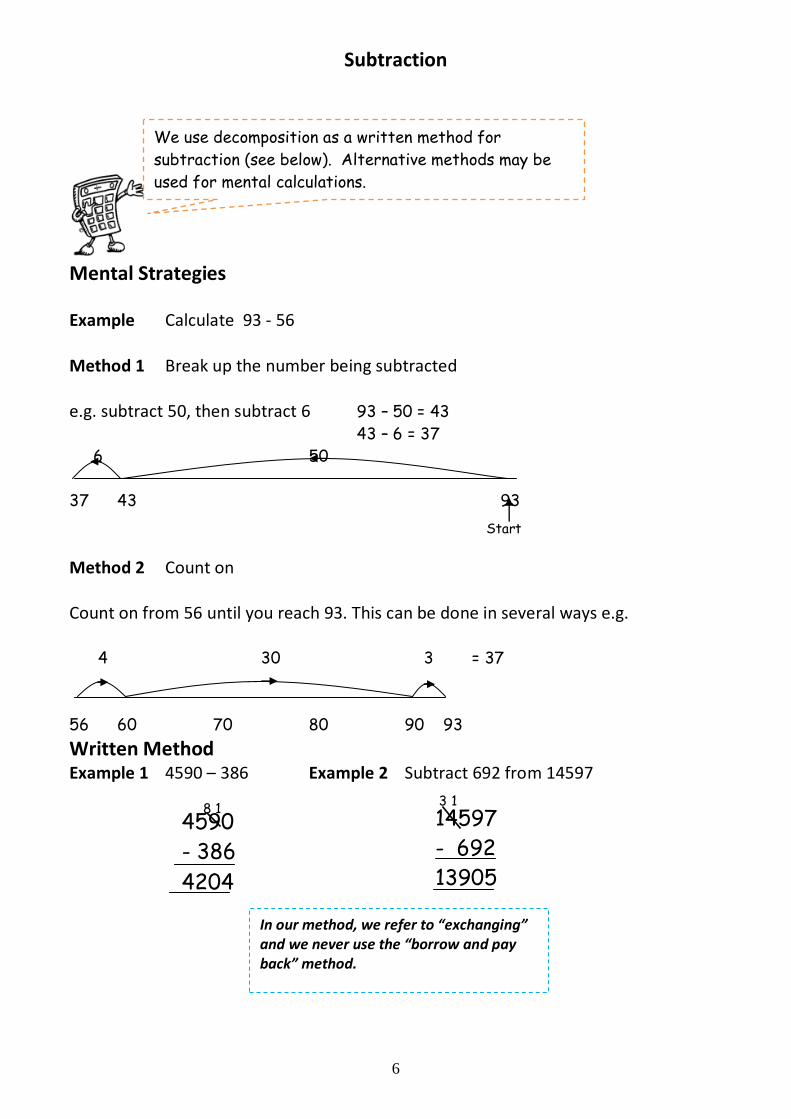
Mental Strategies Example Calculate 93 - 56 Method 1 Break up the number being subtracted e.g. subtract 50, then subtract 6 93 – 50 = 43
43 – 6 = 37
6 50
37 43 93
Method 2 Count on Count on from 56 until you reach 93. This can be done in several ways e.g.
4 30 3 = 37
56 60 70 80 90 93
Written Method Example 1 4590 – 386 Example 2 Subtract 692 from 14597
We use decomposition as a written method for
subtraction (see below). Alternative methods may be
used for mental calculations.
4590
- 386
4204
14597
- 692
13905
8 1 3 1
In our method, we refer to “exchanging” and we never use the “borrow and pay back” method.
Start
7
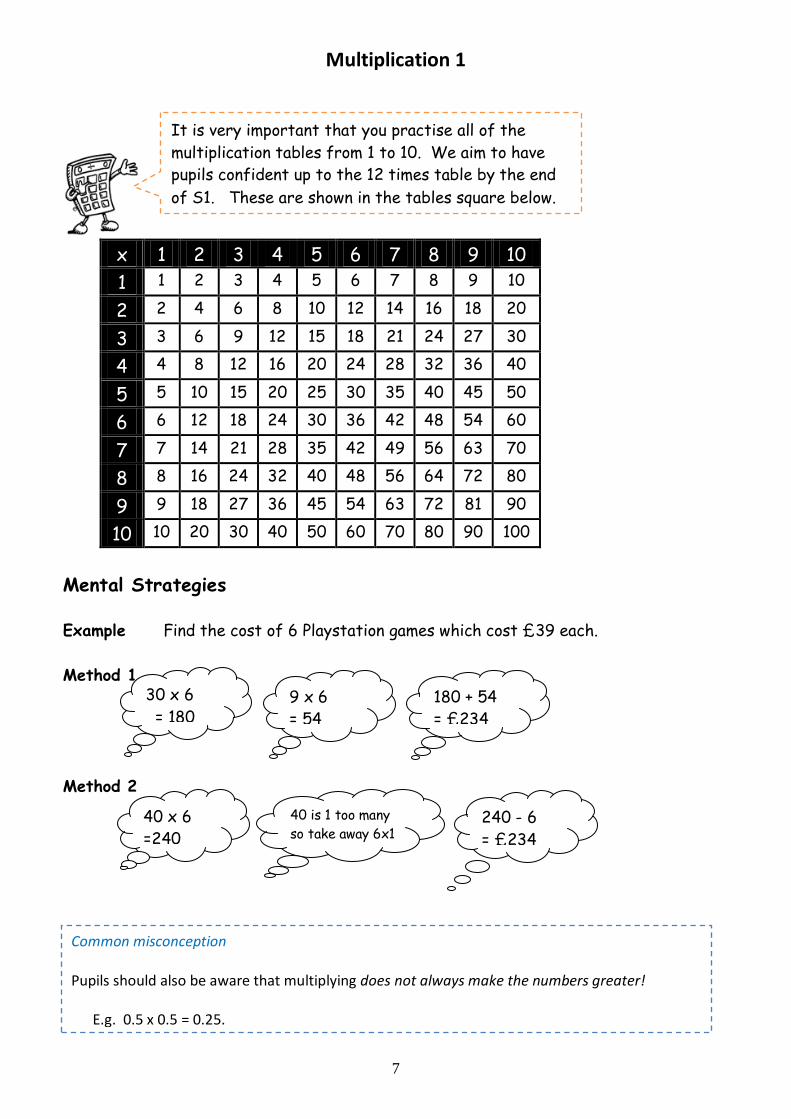
Multiplication 1
x 1 2 3 4 5 6 7 8 9 10
1 1 2 3 4 5 6 7 8 9 10
2 2 4 6 8 10 12 14 16 18 20
3 3 6 9 12 15 18 21 24 27 30
4 4 8 12 16 20 24 28 32 36 40
5 5 10 15 20 25 30 35 40 45 50
6 6 12 18 24 30 36 42 48 54 60
7 7 14 21 28 35 42 49 56 63 70
8 8 16 24 32 40 48 56 64 72 80
9 9 18 27 36 45 54 63 72 81 90
10 10 20 30 40 50 60 70 80 90 100
Mental Strategies
Example Find the cost of 6 Playstation games which cost £39 each.
Method 1
Method 2
It is very important that you practise all of the
multiplication tables from 1 to 10. We aim to have
pupils confident up to the 12 times table by the end
of S1. These are shown in the tables square below.
30 x 6
= 180 9 x 6
= 54
180 + 54
= £234
40 x 6
=240
40 is 1 too many
so take away 6x1 240 - 6
= £234
Common misconception Pupils should also be aware that multiplying does not always make the numbers greater! E.g. 0.5 x 0.5 = 0.25.
8
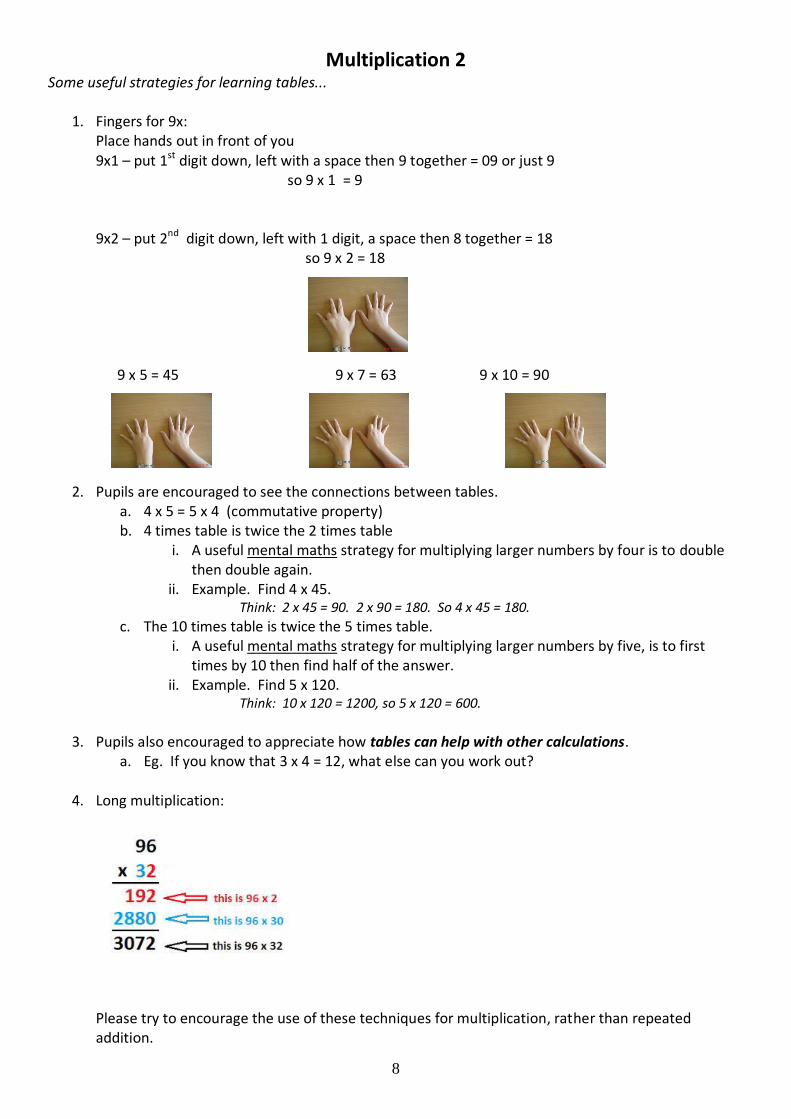
Multiplication 2 Some useful strategies for learning tables...
1. Fingers for 9x: Place hands out in front of you 9x1 – put 1st digit down, left with a space then 9 together = 09 or just 9
so 9 x 1 = 9
9x2 – put 2nd digit down, left with 1 digit, a space then 8 together = 18 so 9 x 2 = 18
9 x 5 = 45 9 x 7 = 63 9 x 10 = 90
2. Pupils are encouraged to see the connections between tables. a. 4 x 5 = 5 x 4 (commutative property) b. 4 times table is twice the 2 times table
i. A useful mental maths strategy for multiplying larger numbers by four is to double then double again.
ii. Example. Find 4 x 45. Think: 2 x 45 = 90. 2 x 90 = 180. So 4 x 45 = 180.
c. The 10 times table is twice the 5 times table. i. A useful mental maths strategy for multiplying larger numbers by five, is to first
times by 10 then find half of the answer. ii. Example. Find 5 x 120.
Think: 10 x 120 = 1200, so 5 x 120 = 600.
3. Pupils also encouraged to appreciate how tables can help with other calculations.
a. Eg. If you know that 3 x 4 = 12, what else can you work out?
4. Long multiplication:
Please try to encourage the use of these techniques for multiplication, rather than repeated addition.
9
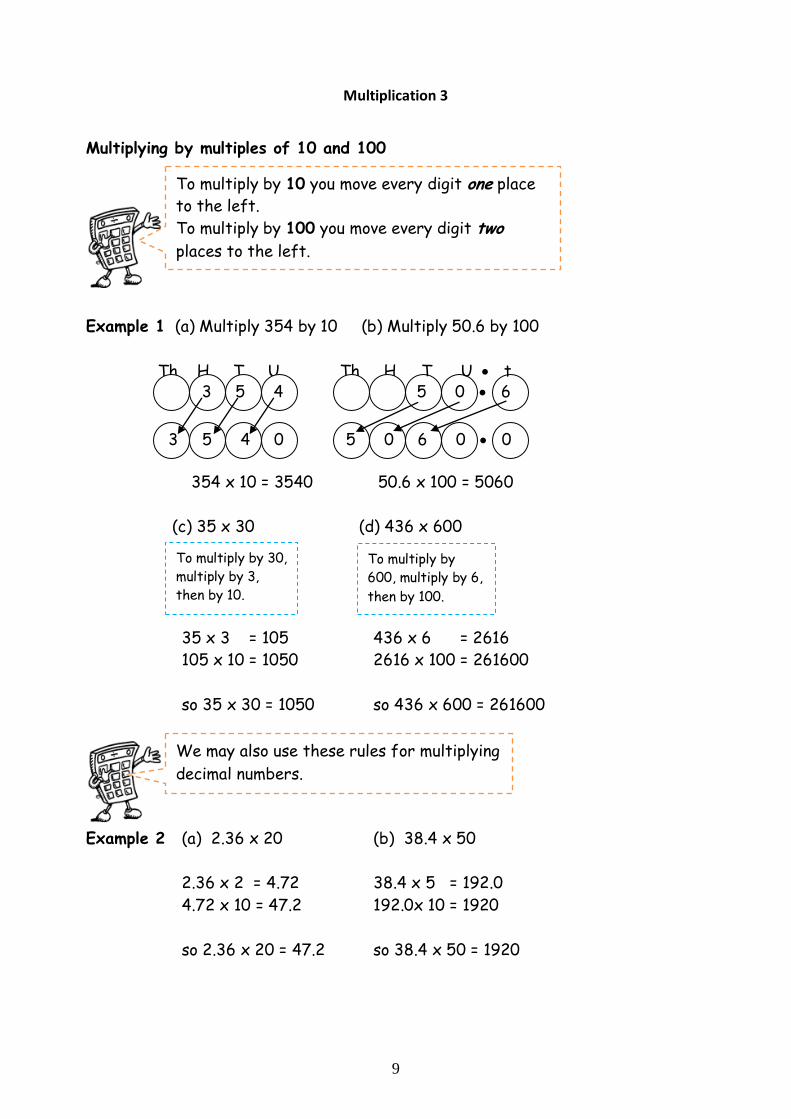
Multiplication 3
Multiplying by multiples of 10 and 100
Example 1 (a) Multiply 354 by 10 (b) Multiply 50.6 by 100
Th H T U Th H T U t
354 x 10 = 3540 50.6 x 100 = 5060
(c) 35 x 30 (d) 436 x 600
35 x 3 = 105 436 x 6 = 2616
105 x 10 = 1050 2616 x 100 = 261600
so 35 x 30 = 1050 so 436 x 600 = 261600
Example 2 (a) 2.36 x 20 (b) 38.4 x 50
2.36 x 2 = 4.72 38.4 x 5 = 192.0
4.72 x 10 = 47.2 192.0x 10 = 1920
so 2.36 x 20 = 47.2 so 38.4 x 50 = 1920
To multiply by 10 you move every digit one place
to the left.
To multiply by 100 you move every digit two
places to the left.
3 5 4 5 0 6
3 5 4 0 5 0 6 0 0
To multiply by 30,
multiply by 3,
then by 10.
To multiply by
600, multiply by 6,
then by 100.
We may also use these rules for multiplying
decimal numbers.
10
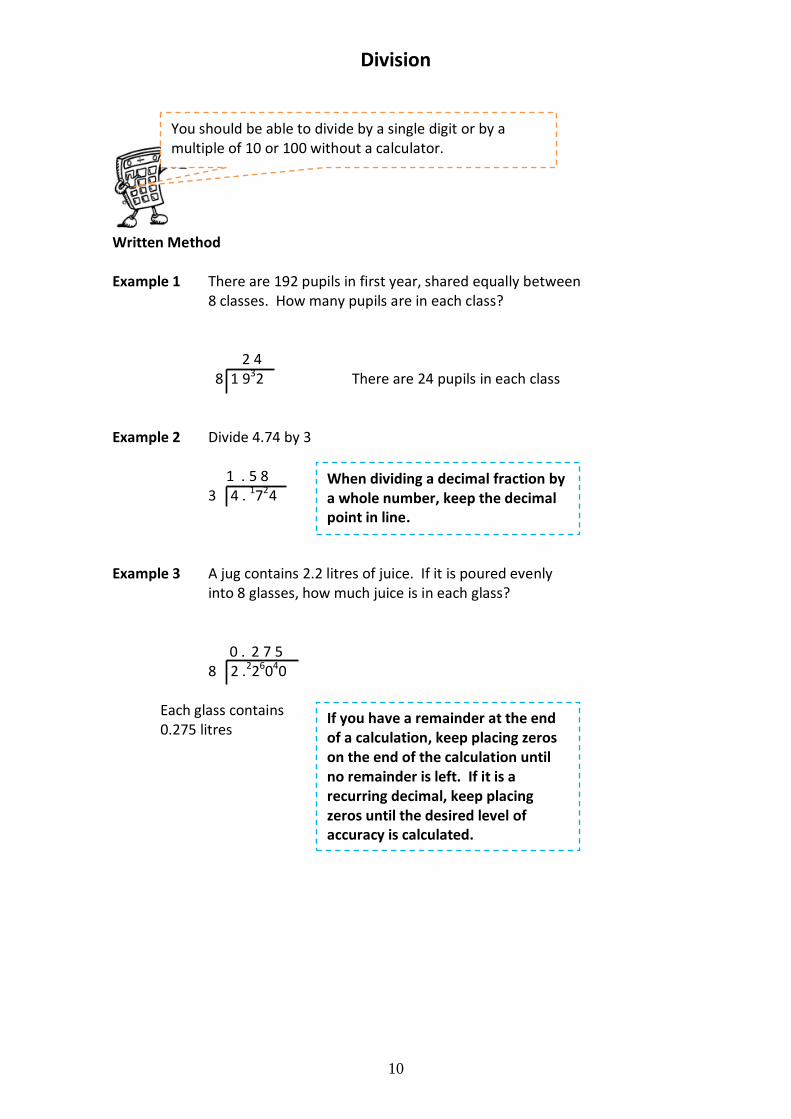
Division
Written Method Example 1 There are 192 pupils in first year, shared equally between
8 classes. How many pupils are in each class? 2 4 8 1 932 There are 24 pupils in each class Example 2 Divide 4.74 by 3 1 . 5 8 3 4 . 1724 Example 3 A jug contains 2.2 litres of juice. If it is poured evenly
into 8 glasses, how much juice is in each glass? 0 . 2 7 5 8 2 .226040 Each glass contains 0.275 litres
You should be able to divide by a single digit or by a multiple of 10 or 100 without a calculator.
When dividing a decimal fraction by a whole number, keep the decimal point in line.
If you have a remainder at the end of a calculation, keep placing zeros on the end of the calculation until no remainder is left. If it is a recurring decimal, keep placing zeros until the desired level of accuracy is calculated.
11
Order of Calculation (BODMAS)
Consider this: What is the answer to 2 + 5 x 8 ? Is it 7 x 8 = 56 or 2 + 40 = 42 ? The correct answer is 42.
The BODMAS rule tells us which operations should be done first. BODMAS represents: Scientific calculators use this rule, some basic calculators may not, so take care.
Example 1 15 – 12 6 BODMAS tells us to divide first = 15 – 2 = 13 Example 2 (9 + 5) x 6 BODMAS tells us to work out the = 14 x 6 brackets first = 84
Example 3 18 + 6 (5-2) Brackets first
= 18 + 6 3 Then divide = 18 + 2 Now add = 20
Calculations which have more than one operation need to
be done in a particular order. The order can be
remembered by using the mnemonic BODMAS
(B)rackets
(O)f (O)rder
(D)ivide
(M)ultiply
(A)dd
(S)ubract
12
Substitution into Expressions/Formulae
VR
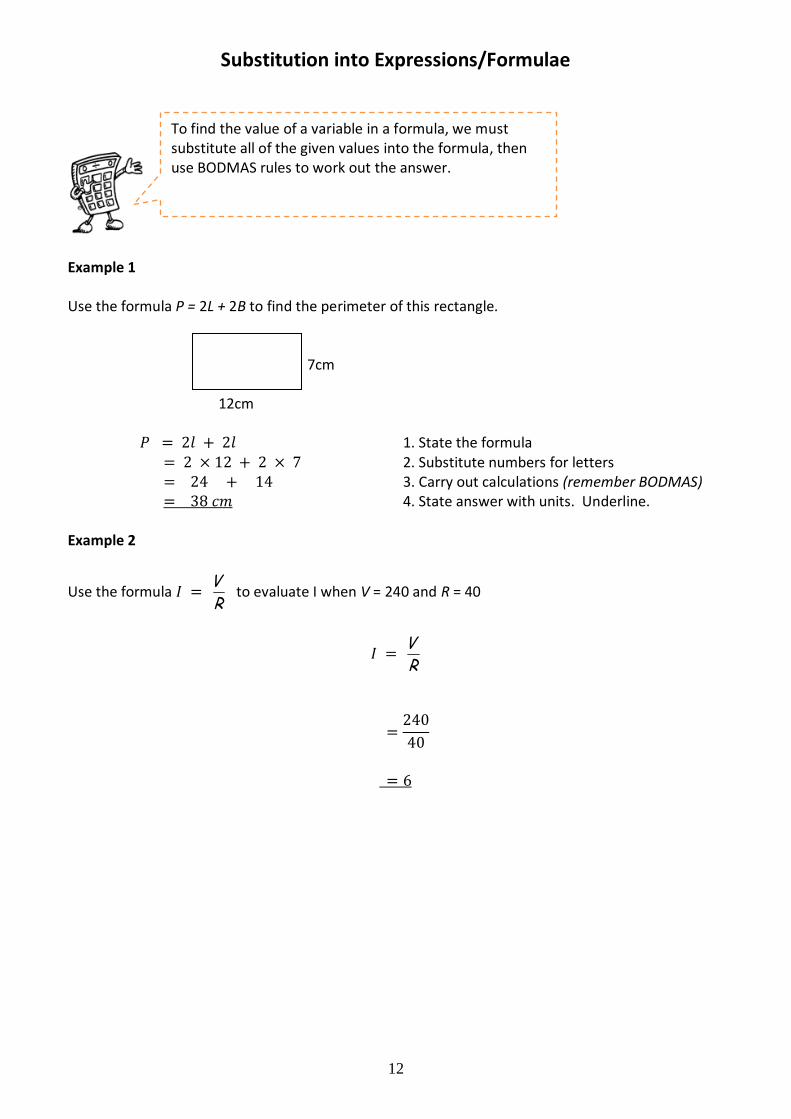
Example 1 Use the formula P = 2L + 2B to find the perimeter of this rectangle.
7cm 12cm
1. State the formula
2. Substitute numbers for letters 3. Carry out calculations (remember BODMAS) 4. State answer with units. Underline. Example 2
Use the formula
VR
to evaluate I when V = 240 and R = 40
To find the value of a variable in a formula, we must substitute all of the given values into the formula, then use BODMAS rules to work out the answer.
13
Estimation and Rounding
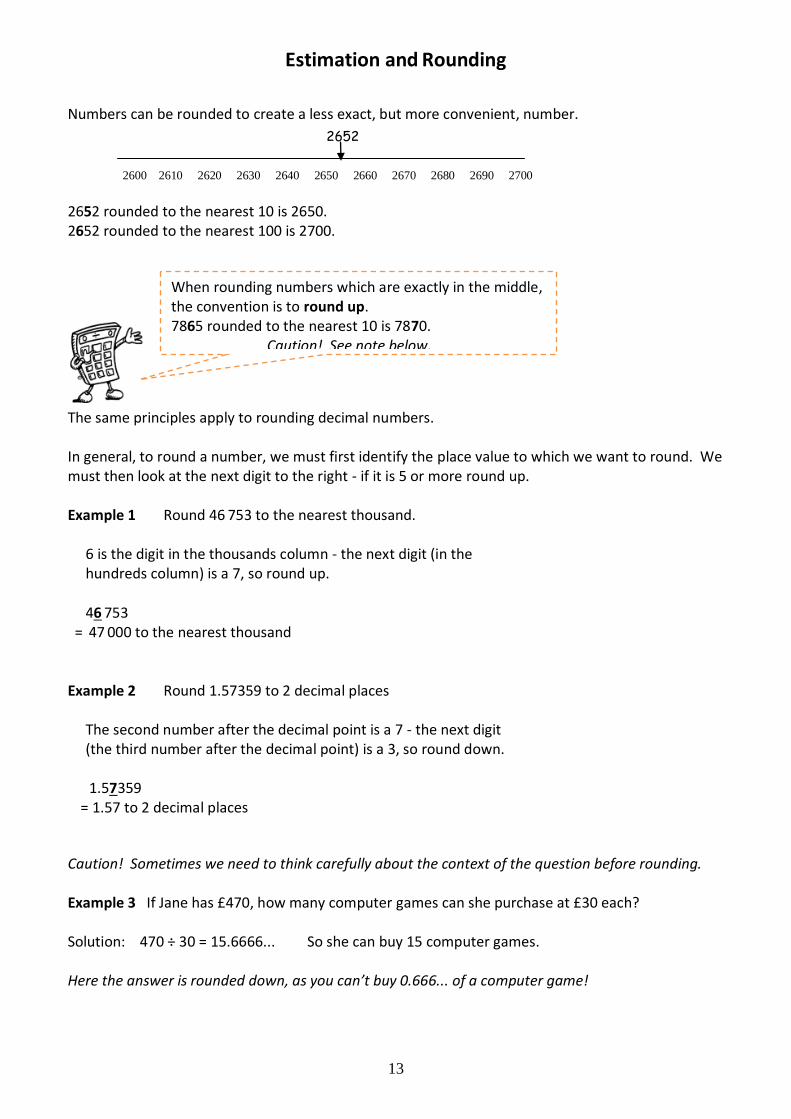
Numbers can be rounded to create a less exact, but more convenient, number. 2652 rounded to the nearest 10 is 2650. 2652 rounded to the nearest 100 is 2700.
The same principles apply to rounding decimal numbers. In general, to round a number, we must first identify the place value to which we want to round. We must then look at the next digit to the right - if it is 5 or more round up. Example 1 Round 46 753 to the nearest thousand. 6 is the digit in the thousands column - the next digit (in the hundreds column) is a 7, so round up. 46 753 = 47 000 to the nearest thousand Example 2 Round 1.57359 to 2 decimal places The second number after the decimal point is a 7 - the next digit (the third number after the decimal point) is a 3, so round down. 1.57359 = 1.57 to 2 decimal places
Caution! Sometimes we need to think carefully about the context of the question before rounding. Example 3 If Jane has £470, how many computer games can she purchase at £30 each? Solution: 470 ÷ 30 = 15.6666... So she can buy 15 computer games. Here the answer is rounded down, as you can’t buy 0.666... of a computer game!
When rounding numbers which are exactly in the middle, the convention is to round up. 7865 rounded to the nearest 10 is 7870.
Caution! See note below.
2600 2610 2620 2630 2640 2650 2660 2670 2680 2690 2700
2652
14
Estimation : Calculation
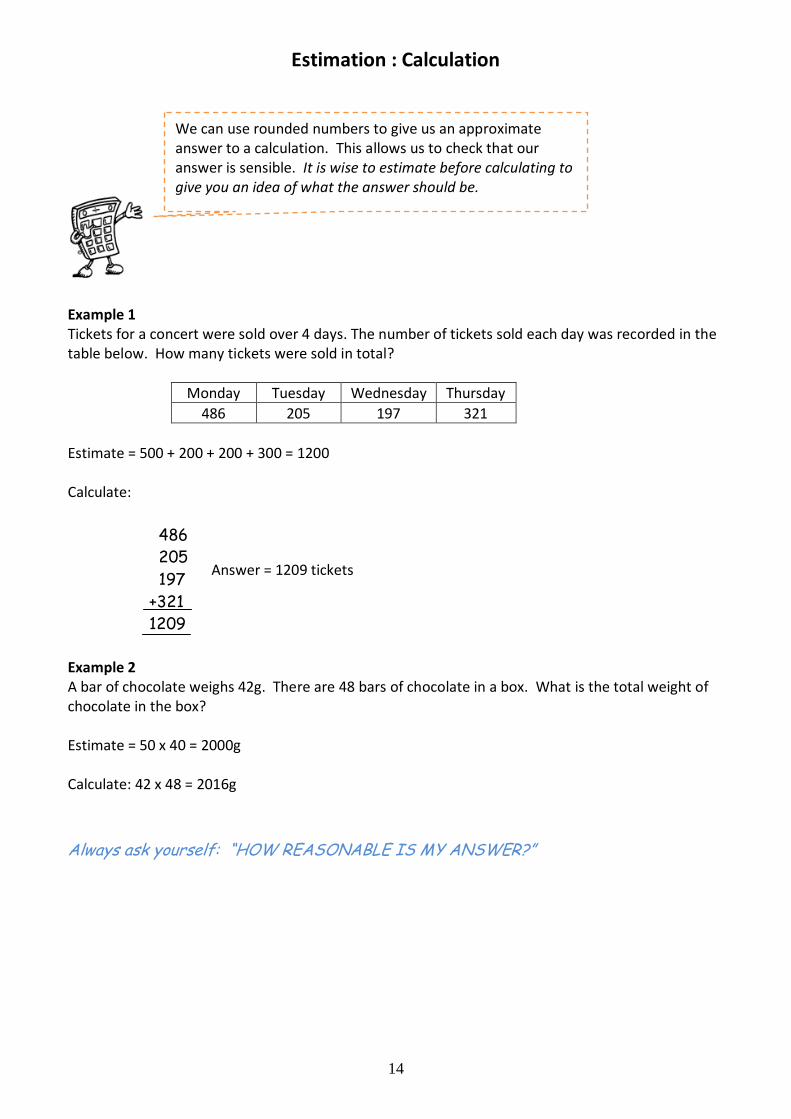
Example 1 Tickets for a concert were sold over 4 days. The number of tickets sold each day was recorded in the table below. How many tickets were sold in total?
Monday Tuesday Wednesday Thursday
486 205 197 321
Estimate = 500 + 200 + 200 + 300 = 1200 Calculate:
Answer = 1209 tickets
Example 2 A bar of chocolate weighs 42g. There are 48 bars of chocolate in a box. What is the total weight of chocolate in the box? Estimate = 50 x 40 = 2000g Calculate: 42 x 48 = 2016g
Always ask yourself: “HOW REASONABLE IS MY ANSWER?”
We can use rounded numbers to give us an approximate answer to a calculation. This allows us to check that our answer is sensible. It is wise to estimate before calculating to give you an idea of what the answer should be.
486
205
197
+321
1209
15
Time 1
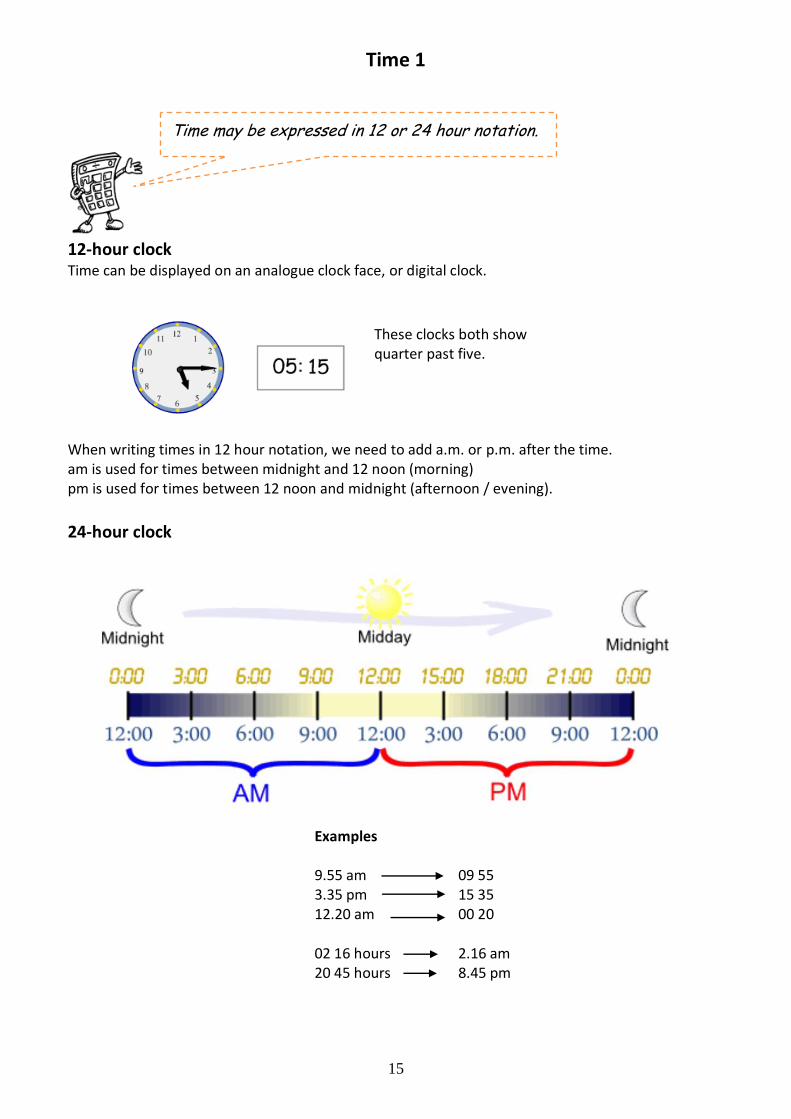
12-hour clock Time can be displayed on an analogue clock face, or digital clock.
When writing times in 12 hour notation, we need to add a.m. or p.m. after the time. am is used for times between midnight and 12 noon (morning) pm is used for times between 12 noon and midnight (afternoon / evening).
24-hour clock
Midnight is written as 0000 hrs. Note! You need to be careful when dealing with midnight when giving instructions. For example, if you arrange to meet someone at midnight
Time may be expressed in 12 or 24 hour notation.
Examples 9.55 am 09 55 3.35 pm 15 35 12.20 am 00 20 02 16 hours 2.16 am 20 45 hours 8.45 pm
These clocks both show quarter past five.
16
Time 2
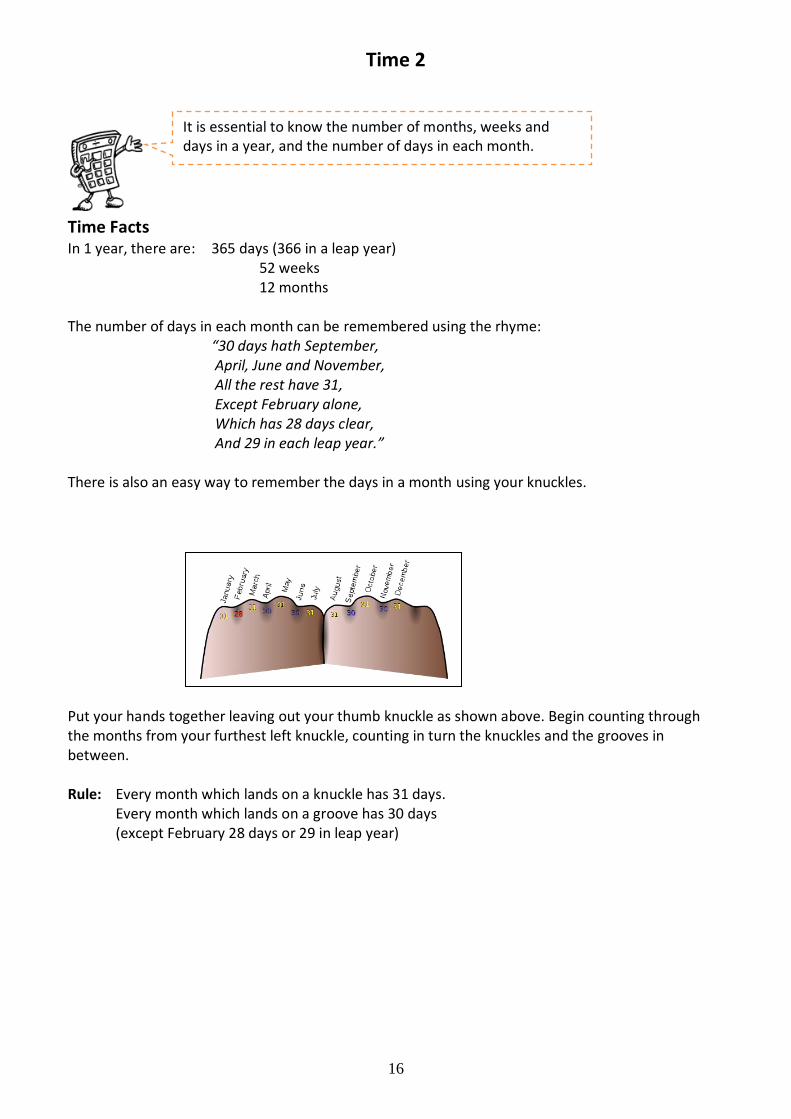
Time Facts In 1 year, there are: 365 days (366 in a leap year) 52 weeks 12 months The number of days in each month can be remembered using the rhyme:
“30 days hath September, April, June and November, All the rest have 31, Except February alone, Which has 28 days clear, And 29 in each leap year.” There is also an easy way to remember the days in a month using your knuckles. Put your hands together leaving out your thumb knuckle as shown above. Begin counting through the months from your furthest left knuckle, counting in turn the knuckles and the grooves in between. Rule: Every month which lands on a knuckle has 31 days. Every month which lands on a groove has 30 days
(except February 28 days or 29 in leap year)
It is essential to know the number of months, weeks and days in a year, and the number of days in each month.
17
Time 3
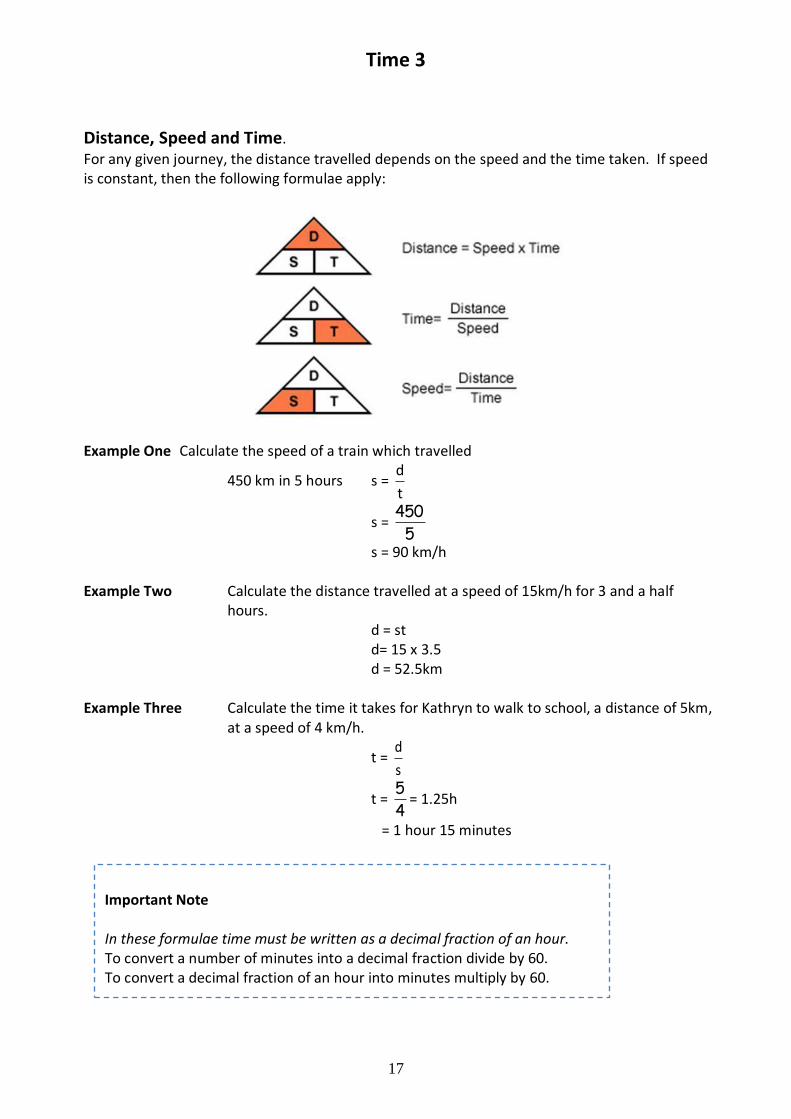
Distance, Speed and Time.
For any given journey, the distance travelled depends on the speed and the time taken. If speed is constant, then the following formulae apply:
Example One Calculate the speed of a train which travelled
450 km in 5 hours s = t
d
s =
450
5
s = 90 km/h Example Two Calculate the distance travelled at a speed of 15km/h for 3 and a half
hours. d = st
d= 15 x 3.5 d = 52.5km Example Three Calculate the time it takes for Kathryn to walk to school, a distance of 5km,
at a speed of 4 km/h.
t = s
d
t = 4
5= 1.25h
= 1 hour 15 minutes
Important Note In these formulae time must be written as a decimal fraction of an hour. To convert a number of minutes into a decimal fraction divide by 60. To convert a decimal fraction of an hour into minutes multiply by 60.
18
Fractions 1
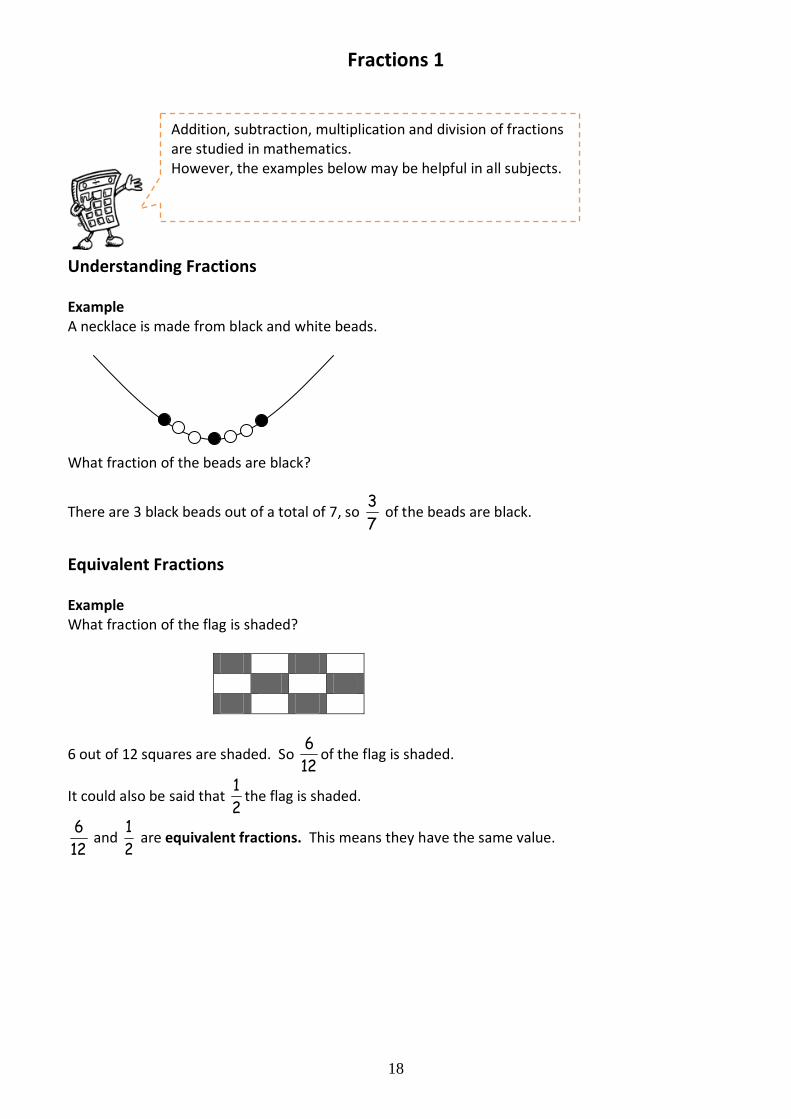
Understanding Fractions Example A necklace is made from black and white beads. What fraction of the beads are black?
There are 3 black beads out of a total of 7, so 7
3 of the beads are black.
Equivalent Fractions Example What fraction of the flag is shaded?
6 out of 12 squares are shaded. So 12
6of the flag is shaded.
It could also be said that 2
1the flag is shaded.
12
6 and
2
1 are equivalent fractions. This means they have the same value.
Addition, subtraction, multiplication and division of fractions are studied in mathematics. However, the examples below may be helpful in all subjects.
19
Fractions 2
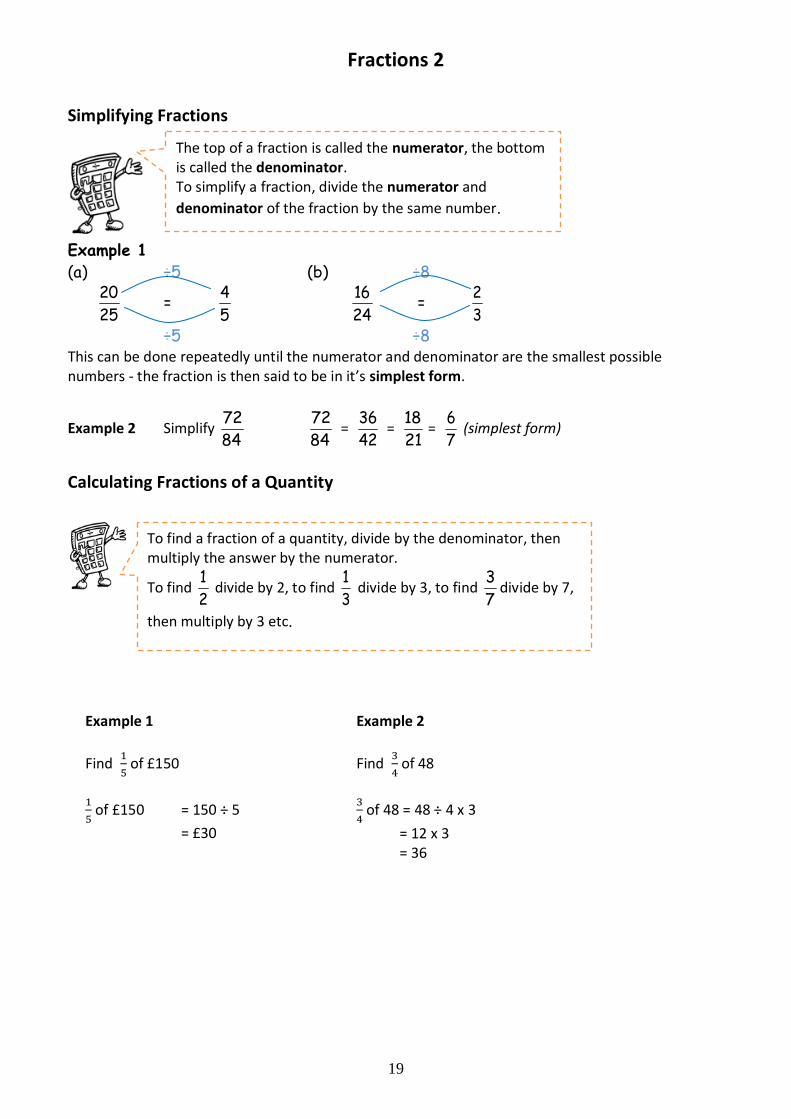
Simplifying Fractions
Example 1
(a) ÷5 (b) ÷8
25
20 =
5
4
24
16 =
3
2
÷5 ÷8 This can be done repeatedly until the numerator and denominator are the smallest possible numbers - the fraction is then said to be in it’s simplest form.
Example 2 Simplify
72
84
72
84 =
36
42 =
18
21 =
6
7 (simplest form)
Calculating Fractions of a Quantity
The top of a fraction is called the numerator, the bottom is called the denominator. To simplify a fraction, divide the numerator and
denominator of the fraction by the same number.
To find a fraction of a quantity, divide by the denominator, then multiply the answer by the numerator.
To find 2
1 divide by 2, to find
3
1 divide by 3, to find
7
3divide by 7,
then multiply by 3 etc.
Example 1
Find
of £150
of £150 = 150 ÷ 5
= £30
Example 2
Find
of 48
of 48 = 48 ÷ 4 x 3
= 12 x 3 = 36
20
Percentages 1
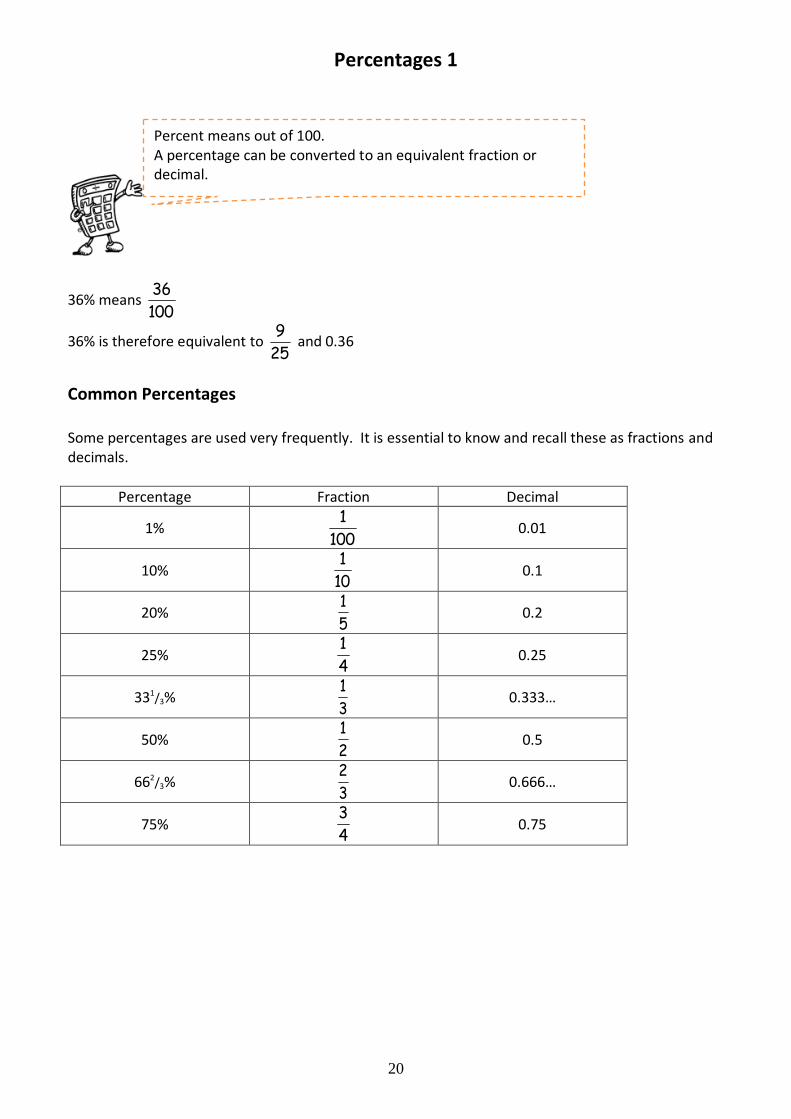
36% means 100
36
36% is therefore equivalent to 25
9 and 0.36
Common Percentages Some percentages are used very frequently. It is essential to know and recall these as fractions and decimals.
Percentage Fraction Decimal
1% 100
1 0.01
10% 10
1 0.1
20% 5
1 0.2
25% 4
1 0.25
331/3%
3
1 0.333…
50% 2
1 0.5
662/3% 3
2 0.666…
75% 4
3 0.75
Percent means out of 100. A percentage can be converted to an equivalent fraction or decimal.
21
Percentages 2
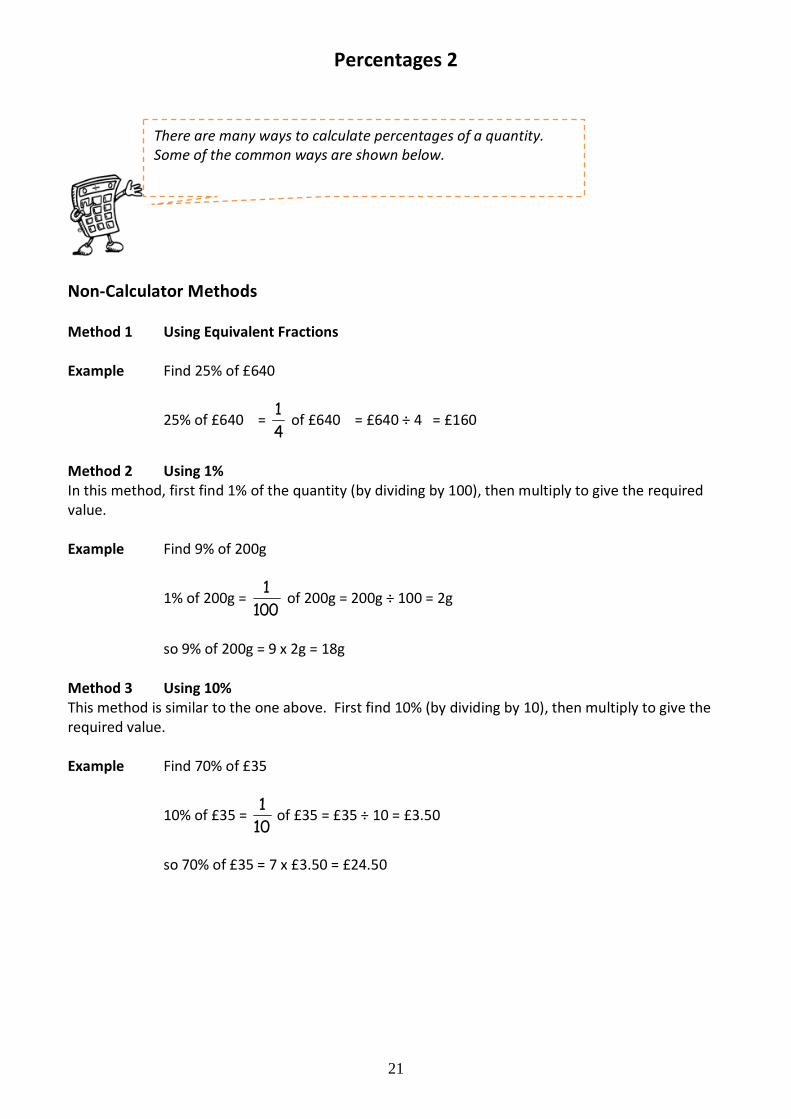
Non-Calculator Methods Method 1 Using Equivalent Fractions Example Find 25% of £640
25% of £640 = 4
1 of £640 = £640 ÷ 4 = £160
Method 2 Using 1% In this method, first find 1% of the quantity (by dividing by 100), then multiply to give the required value. Example Find 9% of 200g
1% of 200g = 100
1 of 200g = 200g ÷ 100 = 2g
so 9% of 200g = 9 x 2g = 18g Method 3 Using 10% This method is similar to the one above. First find 10% (by dividing by 10), then multiply to give the required value. Example Find 70% of £35
10% of £35 =
1
10 of £35 = £35 ÷ 10 = £3.50
so 70% of £35 = 7 x £3.50 = £24.50
There are many ways to calculate percentages of a quantity. Some of the common ways are shown below.
22
Percentages 3
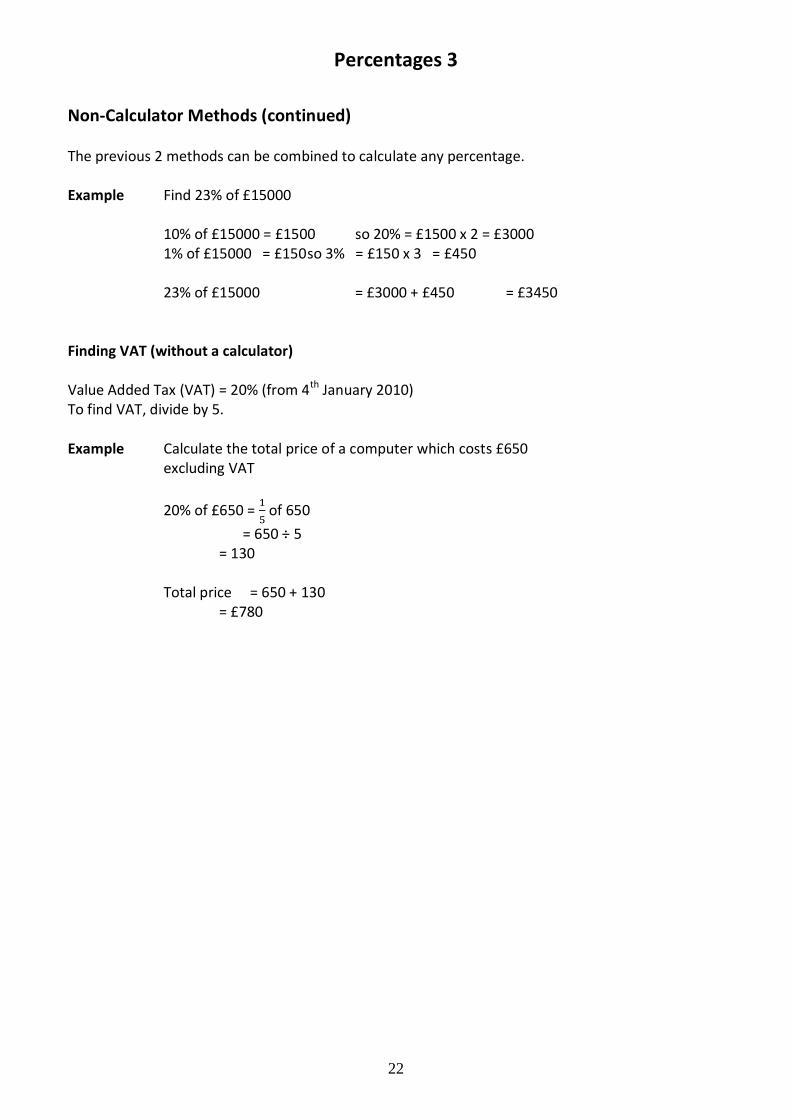
Non-Calculator Methods (continued) The previous 2 methods can be combined to calculate any percentage. Example Find 23% of £15000 10% of £15000 = £1500 so 20% = £1500 x 2 = £3000 1% of £15000 = £150 so 3% = £150 x 3 = £450 23% of £15000 = £3000 + £450 = £3450 Finding VAT (without a calculator) Value Added Tax (VAT) = 20% (from 4th January 2010) To find VAT, divide by 5. Example Calculate the total price of a computer which costs £650
excluding VAT
20% of £650 =
of 650
= 650 ÷ 5 = 130 Total price = 650 + 130 = £780
23
Percentages 4
Calculator Method To find the percentage of a quantity using a calculator, change the percentage to a decimal, then multiply. Example 1 Find 23% of £15000 23% = 0.23 so 23% of £15000 = 0.23 x £15000 = £3450
Example 2 House prices increased by 19% over a one year period.
What is the new value of a house which was valued at £236000 at the start of the year?
19% = 0.19 so Increase = 0.19 x £236000
= £44840
Value at end of year = original value + increase = £236000 + £44840 = £280840
The new value of the house is £280840
We do not use the % button on calculators. The methods taught in the mathematics department are all based on converting percentages to decimals.
24
Percentages 5
Finding the percentage
Example 1 There are 30 pupils in Class A3. 18 are girls.
What percentage of Class A3 are girls?
18
30 = 18 30 x 100 = 60%
60% of A3 are girls Example 2 James scored 36 out of 44 in his biology test. What is his percentage mark?
Score =
36
44
36 ÷ 44 x 100 = 0.81818… x 100 = 81.818..% = 81.82% (to two decimal places)
Example 3 In class P1, 14 pupils had brown hair, 6 pupils had blonde
hair, 3 had black hair and 2 had red hair. What percentage of the pupils were blonde?
Total number of pupils = 14 + 6 + 3 + 2 = 25 6 out of 25 were blonde, so,
6
25 x 100 = 24%
24% were blonde.
To find a percentage of a total, first make a fraction. Convert to a percentage by dividing the top by the bottom and multiplying by 100.
25
Ratio 1
Writing Ratios Example 1
Example 2
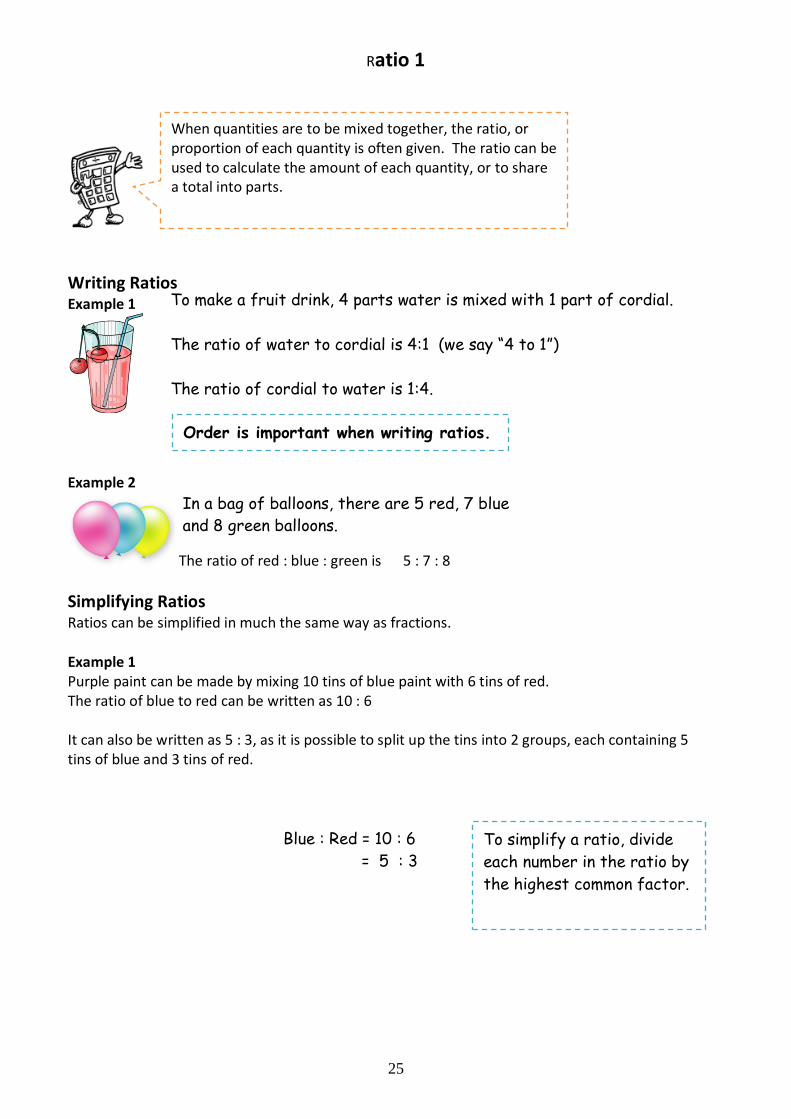
The ratio of red : blue : green is 5 : 7 : 8
Simplifying Ratios Ratios can be simplified in much the same way as fractions. Example 1 Purple paint can be made by mixing 10 tins of blue paint with 6 tins of red. The ratio of blue to red can be written as 10 : 6 It can also be written as 5 : 3, as it is possible to split up the tins into 2 groups, each containing 5 tins of blue and 3 tins of red.
When quantities are to be mixed together, the ratio, or proportion of each quantity is often given. The ratio can be used to calculate the amount of each quantity, or to share a total into parts.
Order is important when writing ratios.
In a bag of balloons, there are 5 red, 7 blue
and 8 green balloons.
To make a fruit drink, 4 parts water is mixed with 1 part of cordial.
The ratio of water to cordial is 4:1 (we say “4 to 1”)
The ratio of cordial to water is 1:4.
Blue : Red = 10 : 6
= 5 : 3 To simplify a ratio, divide
each number in the ratio by
the highest common factor.
26
Ratio 2
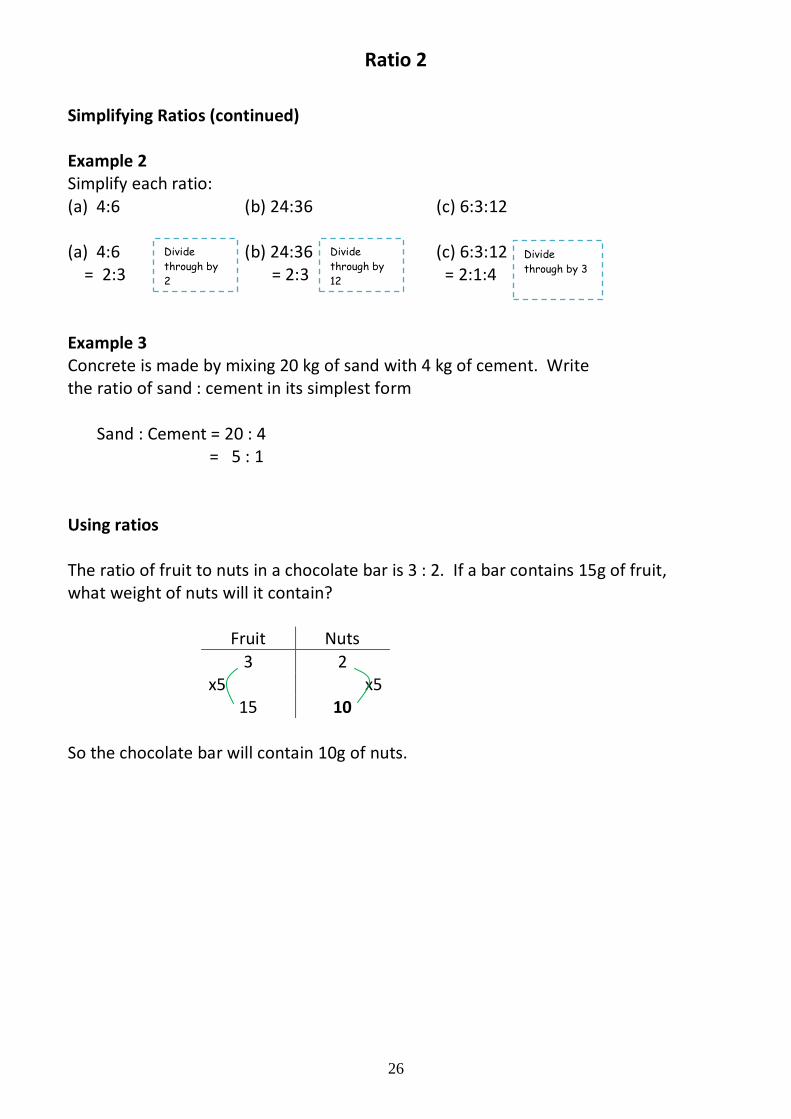
Simplifying Ratios (continued) Example 2 Simplify each ratio: (a) 4:6 (b) 24:36 (c) 6:3:12 (a) 4:6 (b) 24:36 (c) 6:3:12 = 2:3 = 2:3 = 2:1:4 Example 3 Concrete is made by mixing 20 kg of sand with 4 kg of cement. Write the ratio of sand : cement in its simplest form Sand : Cement = 20 : 4 = 5 : 1 Using ratios The ratio of fruit to nuts in a chocolate bar is 3 : 2. If a bar contains 15g of fruit, what weight of nuts will it contain?
Fruit Nuts
3 2 x5 x5
15 10 So the chocolate bar will contain 10g of nuts.
Divide
through by
2
Divide
through by
12
Divide
through by 3
27
Ratio 3
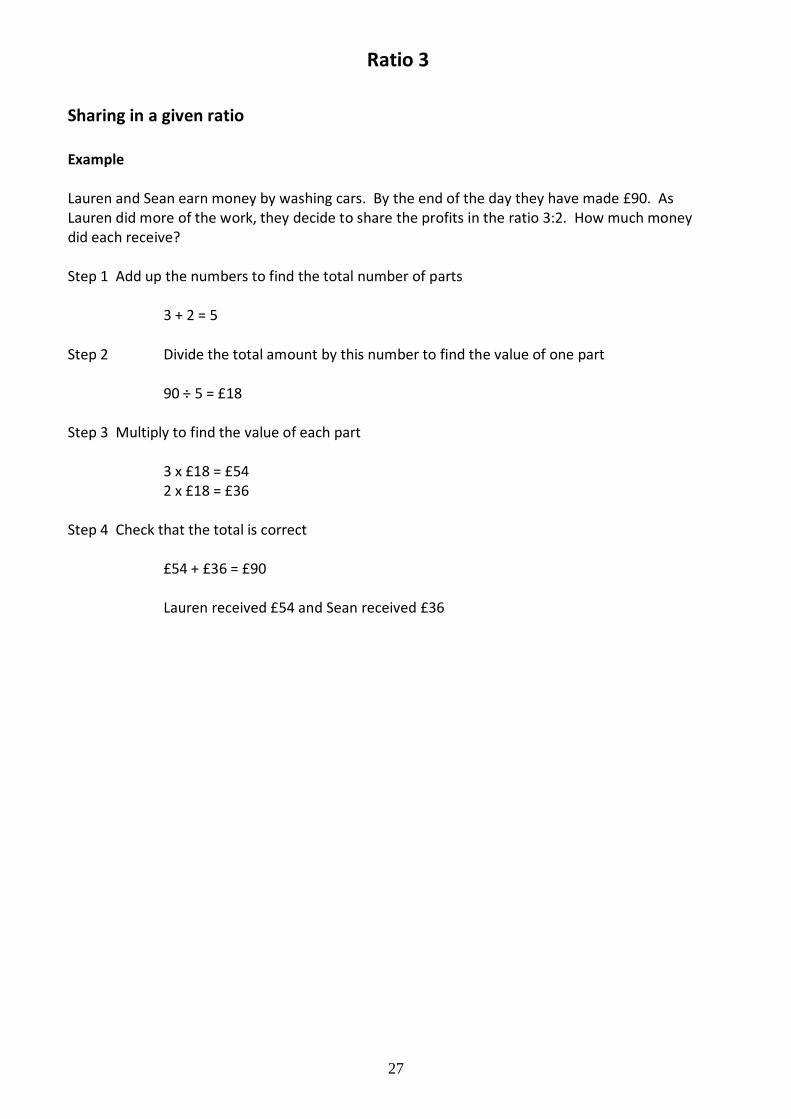
Sharing in a given ratio Example Lauren and Sean earn money by washing cars. By the end of the day they have made £90. As Lauren did more of the work, they decide to share the profits in the ratio 3:2. How much money did each receive? Step 1 Add up the numbers to find the total number of parts
3 + 2 = 5 Step 2 Divide the total amount by this number to find the value of one part
90 ÷ 5 = £18 Step 3 Multiply to find the value of each part
3 x £18 = £54 2 x £18 = £36 Step 4 Check that the total is correct
£54 + £36 = £90
Lauren received £54 and Sean received £36
28
Proportion
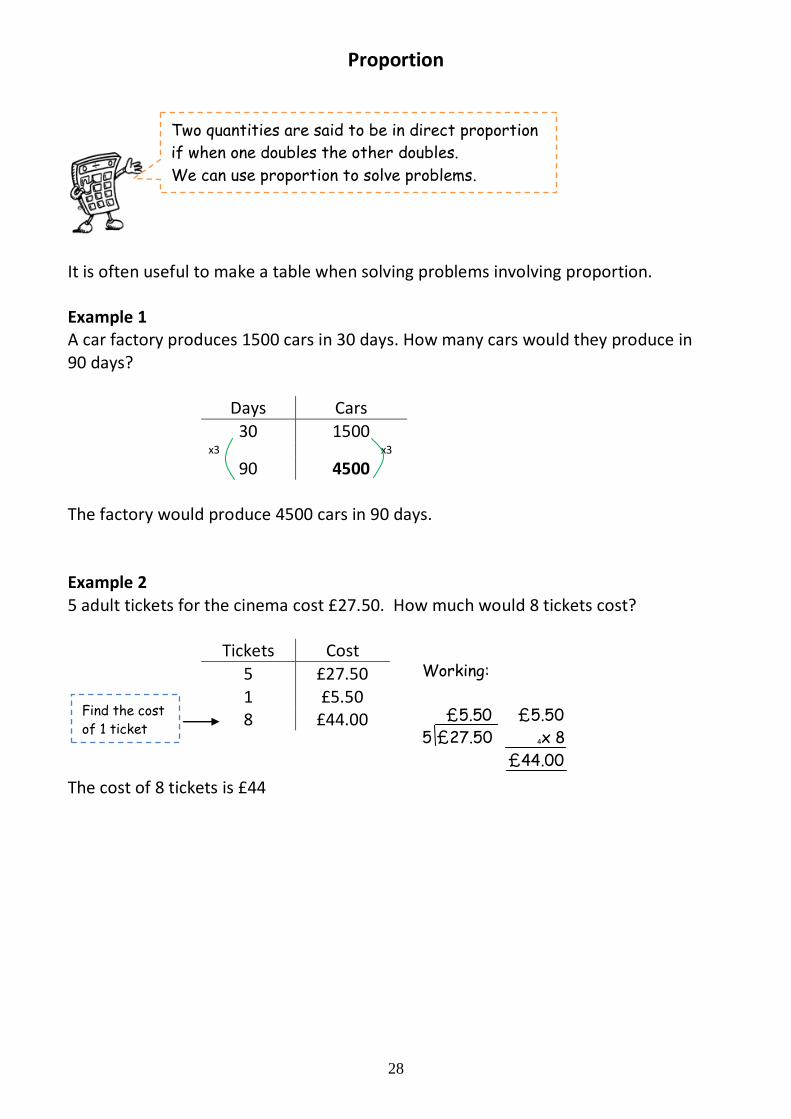
It is often useful to make a table when solving problems involving proportion. Example 1 A car factory produces 1500 cars in 30 days. How many cars would they produce in 90 days?
Days Cars
30 1500 x3 x3
90 4500 The factory would produce 4500 cars in 90 days. Example 2 5 adult tickets for the cinema cost £27.50. How much would 8 tickets cost?
Tickets Cost
5 £27.50 1 £5.50 8 £44.00
The cost of 8 tickets is £44
Two quantities are said to be in direct proportion
if when one doubles the other doubles.
We can use proportion to solve problems.
Find the cost
of 1 ticket
Working:
£5.50 £5.50
5 £27.50 4x 8
£44.00
29
Information Handling : Tables
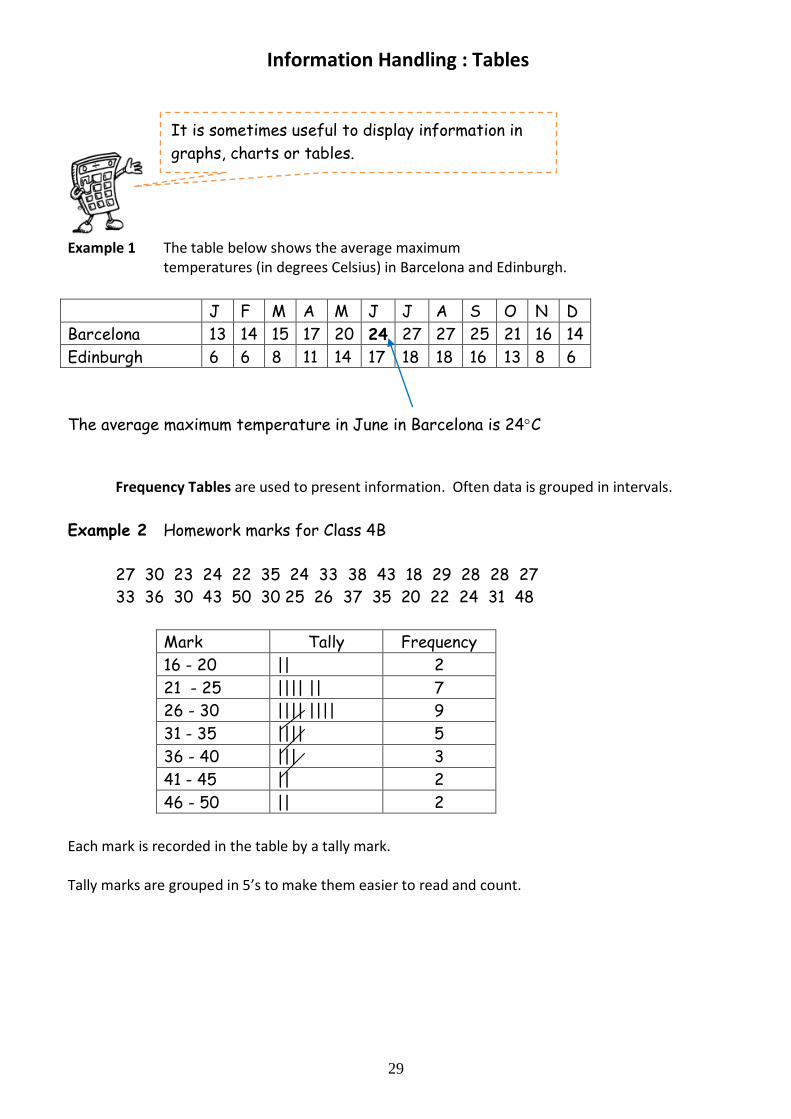
Example 1 The table below shows the average maximum
temperatures (in degrees Celsius) in Barcelona and Edinburgh.
J F M A M J J A S O N D
Barcelona 13 14 15 17 20 24 27 27 25 21 16 14
Edinburgh 6 6 8 11 14 17 18 18 16 13 8 6
The average maximum temperature in June in Barcelona is 24C
Frequency Tables are used to present information. Often data is grouped in intervals.
Example 2 Homework marks for Class 4B
27 30 23 24 22 35 24 33 38 43 18 29 28 28 27
33 36 30 43 50 30 25 26 37 35 20 22 24 31 48
Mark Tally Frequency
16 - 20 || 2
21 - 25 |||| || 7
26 - 30 |||| |||| 9
31 - 35 |||| 5
36 - 40 ||| 3
41 - 45 || 2
46 - 50 || 2
Each mark is recorded in the table by a tally mark. Tally marks are grouped in 5’s to make them easier to read and count.
It is sometimes useful to display information in
graphs, charts or tables.
30
Information Handling : Bar Graphs
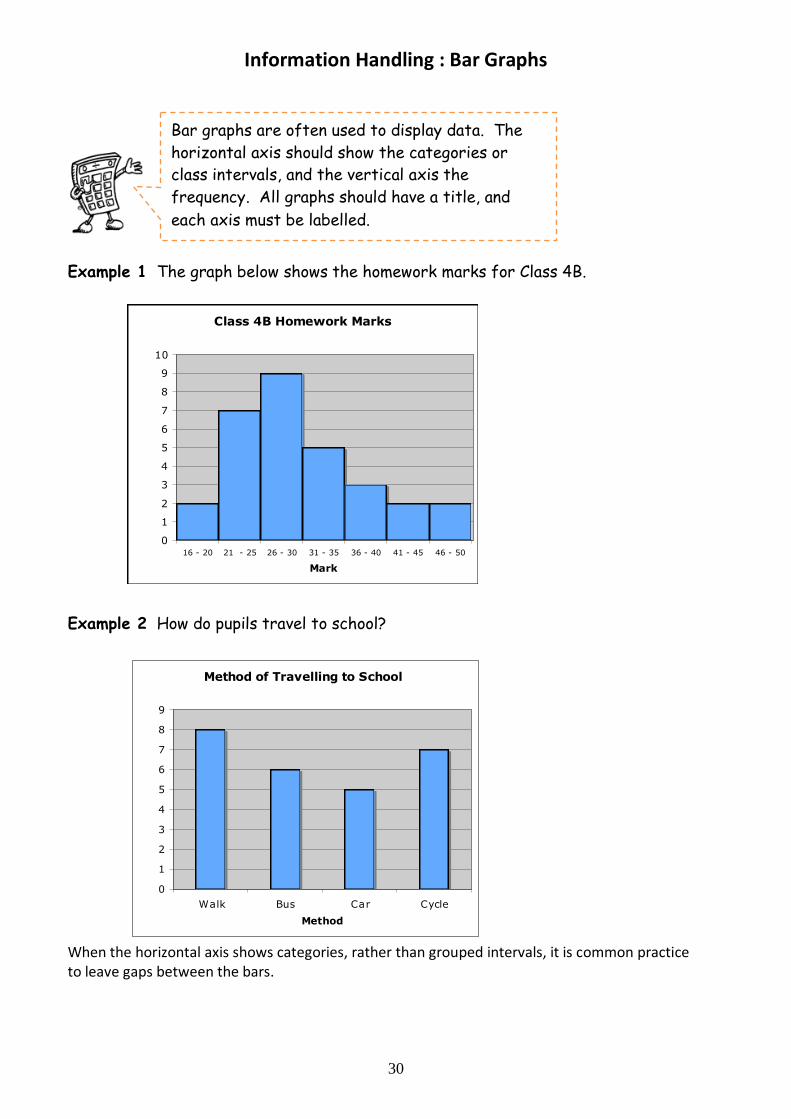
Example 1 The graph below shows the homework marks for Class 4B.
Example 2 How do pupils travel to school?
When the horizontal axis shows categories, rather than grouped intervals, it is common practice to leave gaps between the bars.
Class 4B Homework Marks
0
1
2
3
4
5
6
7
8
9
10
16 - 20 21 - 25 26 - 30 31 - 35 36 - 40 41 - 45 46 - 50
Mark
Nu
mb
er o
f p
up
ils
Method of Travelling to School
0
1
2
3
4
5
6
7
8
9
Walk Bus Car Cycle
Method
Nu
mb
er o
f P
up
ils
Bar graphs are often used to display data. The
horizontal axis should show the categories or
class intervals, and the vertical axis the
frequency. All graphs should have a title, and
each axis must be labelled.
31
Information Handling : Line Graphs
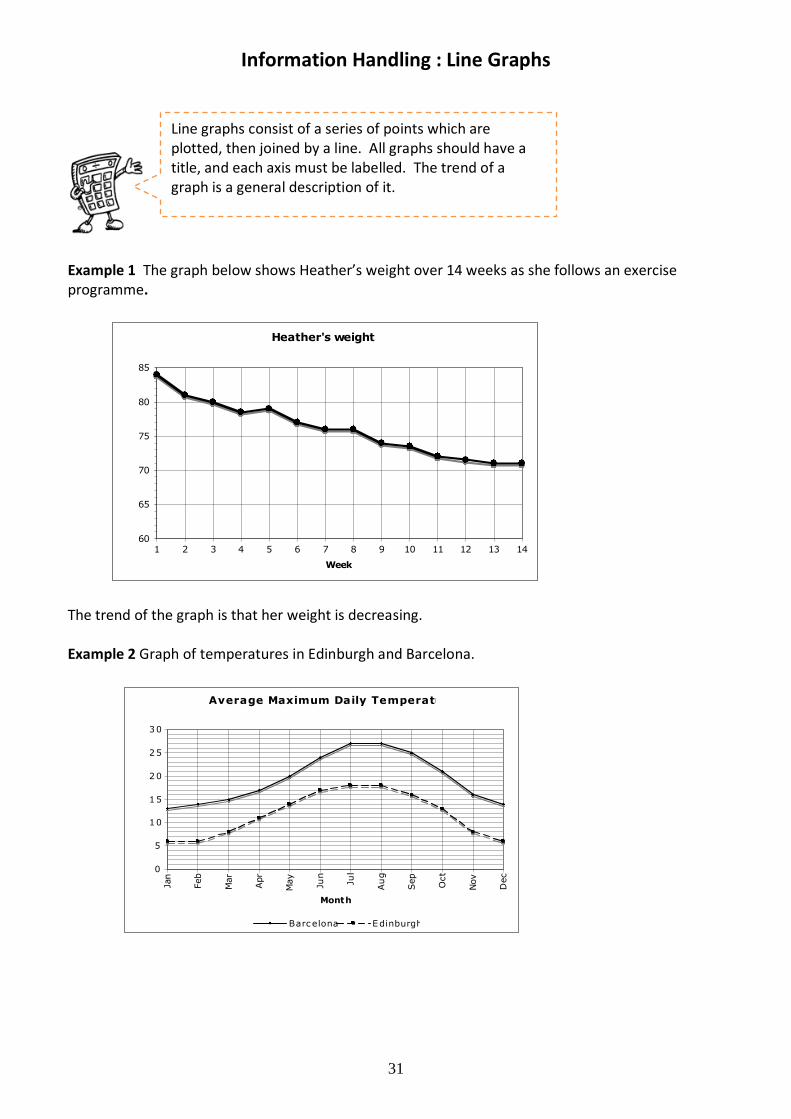
Example 1 The graph below shows Heather’s weight over 14 weeks as she follows an exercise programme.
The trend of the graph is that her weight is decreasing. Example 2 Graph of temperatures in Edinburgh and Barcelona.
Heather's weight
60
65
70
75
80
85
1 2 3 4 5 6 7 8 9 10 11 12 13 14
Week
We
igh
t in
kg
.
Average Maximum Daily Temperature
0
5
10
15
20
25
30
Jan
Feb
Mar
Apr
May
Jun
Jul
Aug
Sep
Oct
Nov
Dec
Month
Te
mp
era
ture
(C
els
ius)
Barc elona Edinburgh
Line graphs consist of a series of points which are plotted, then joined by a line. All graphs should have a title, and each axis must be labelled. The trend of a graph is a general description of it.
32
Information Handling : Scatter Graphs
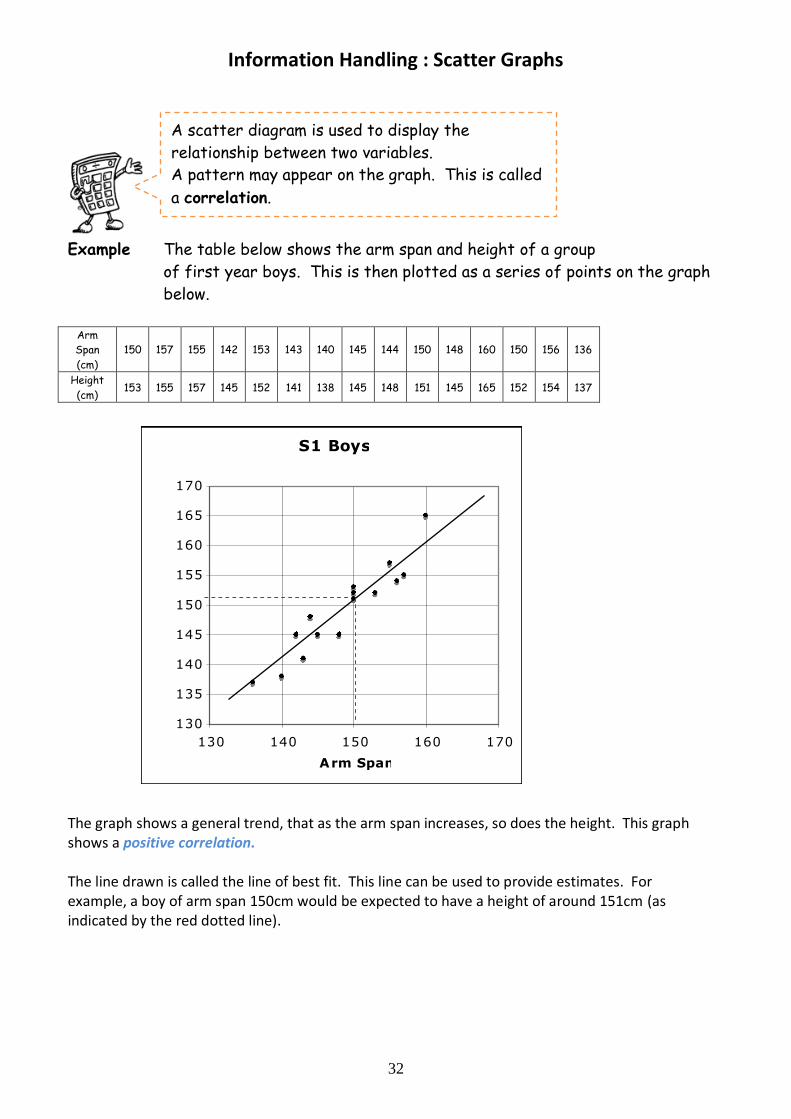
Example The table below shows the arm span and height of a group
of first year boys. This is then plotted as a series of points on the graph
below.
Arm
Span
(cm)
150 157 155 142 153 143 140 145 144 150 148 160 150 156 136
Height
(cm) 153 155 157 145 152 141 138 145 148 151 145 165 152 154 137
The graph shows a general trend, that as the arm span increases, so does the height. This graph shows a positive correlation. The line drawn is called the line of best fit. This line can be used to provide estimates. For example, a boy of arm span 150cm would be expected to have a height of around 151cm (as indicated by the red dotted line).
S1 Boys
130
135
140
145
150
155
160
165
170
130 140 150 160 170
Arm Span
Heig
ht
A scatter diagram is used to display the
relationship between two variables.
A pattern may appear on the graph. This is called
a correlation.
33
Information Handling : Pie Charts
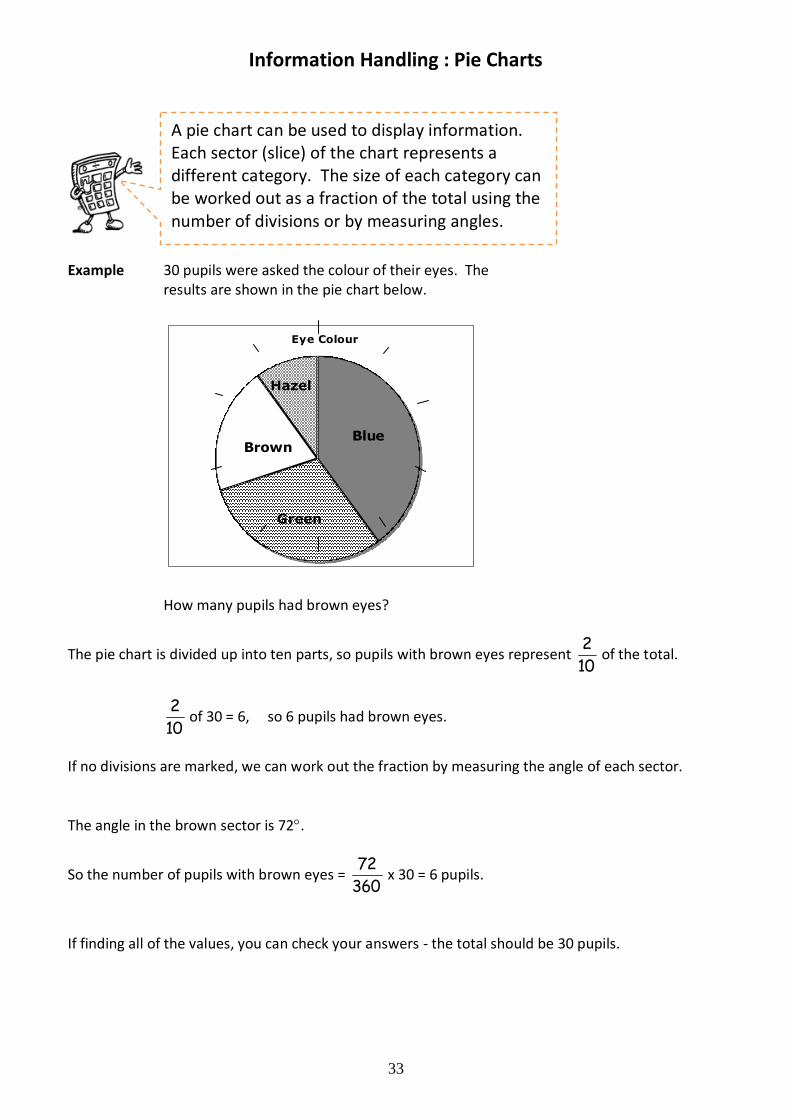
Example 30 pupils were asked the colour of their eyes. The
results are shown in the pie chart below.
How many pupils had brown eyes?
The pie chart is divided up into ten parts, so pupils with brown eyes represent
2
10 of the total.
2
10 of 30 = 6, so 6 pupils had brown eyes.
If no divisions are marked, we can work out the fraction by measuring the angle of each sector.
The angle in the brown sector is 72.
So the number of pupils with brown eyes =
72
360 x 30 = 6 pupils.
If finding all of the values, you can check your answers - the total should be 30 pupils.
Eye Colour
Hazel
Brown
Green
Blue
A pie chart can be used to display information. Each sector (slice) of the chart represents a different category. The size of each category can be worked out as a fraction of the total using the number of divisions or by measuring angles.
34
Information Handling : Pie Charts 2
Statistics
Drawing Pie Charts
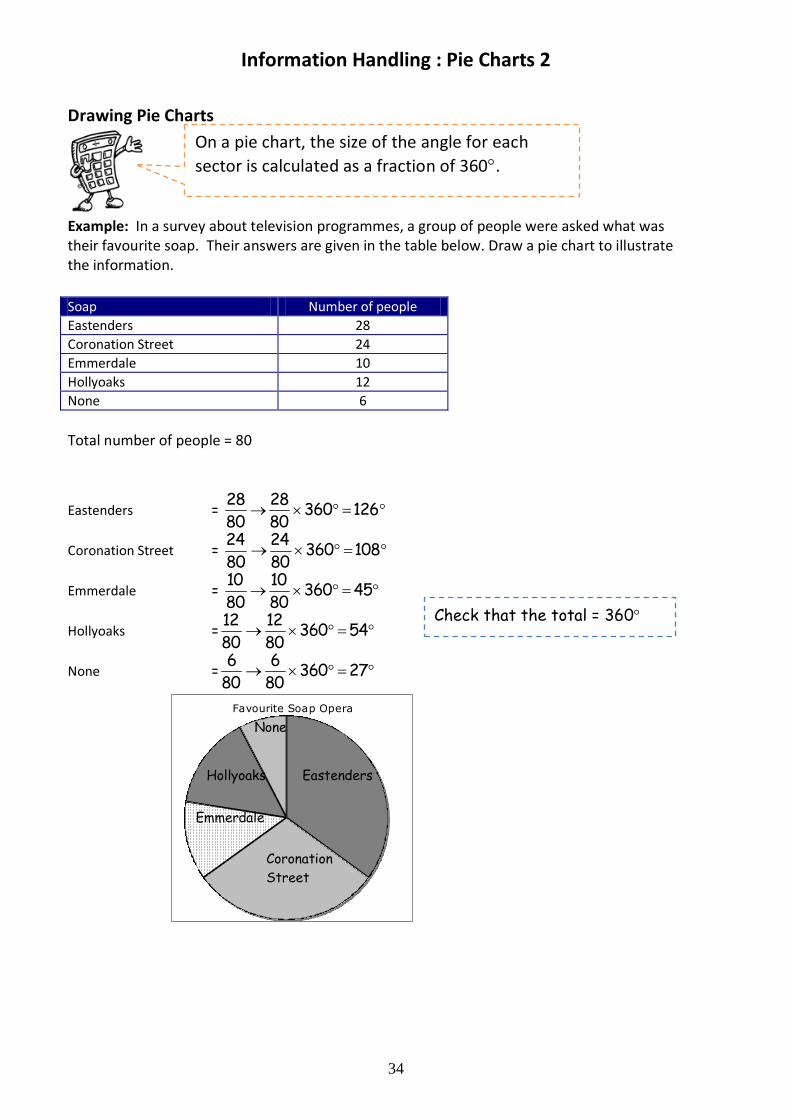
Example: In a survey about television programmes, a group of people were asked what was their favourite soap. Their answers are given in the table below. Draw a pie chart to illustrate the information.
Soap Number of people
Eastenders 28
Coronation Street 24
Emmerdale 10
Hollyoaks 12
None 6
Total number of people = 80
Eastenders =
28
80
28
80360 126
Coronation Street =
24
80
24
80360 108
Emmerdale =
10
80
10
80360 45
Hollyoaks =
12
80
12
80360 54
None =
6
80
6
80360 27
Favourite Soap Operas
On a pie chart, the size of the angle for each
sector is calculated as a fraction of 360.
Check that the total = 360
Eastenders
Coronation
Street
Emmerdale
Hollyoaks
None
35
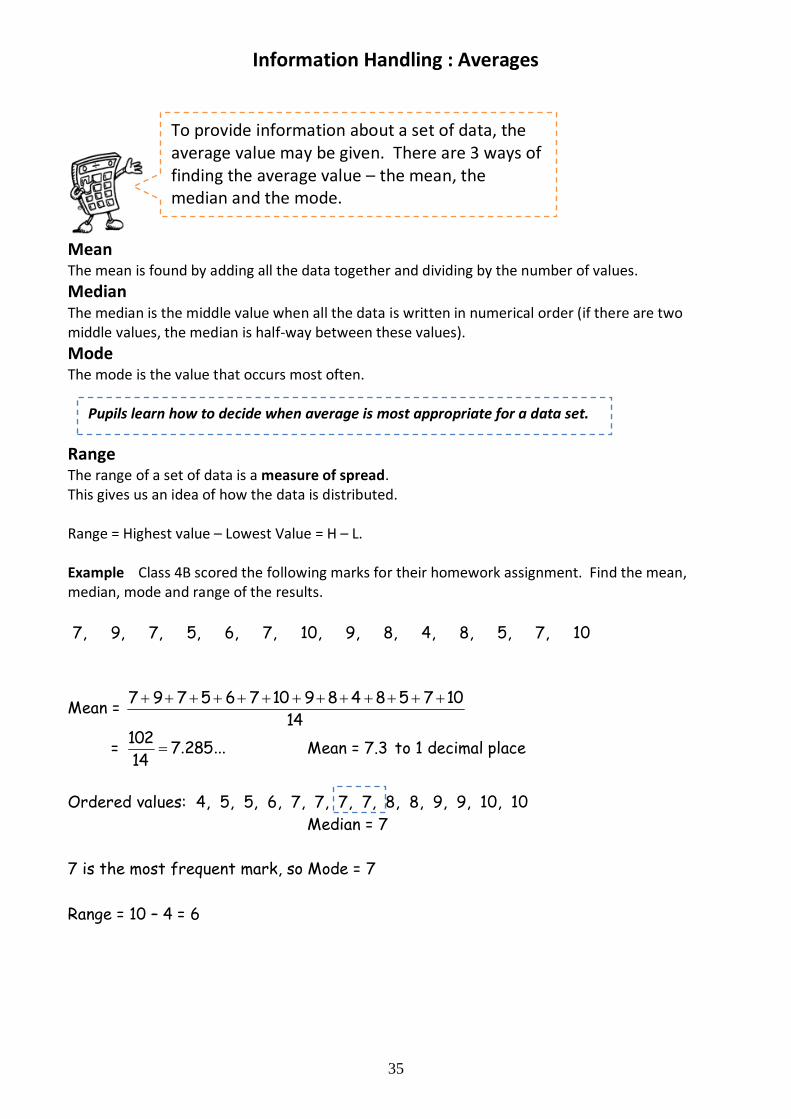
Information Handling : Averages
Mean The mean is found by adding all the data together and dividing by the number of values.
Median The median is the middle value when all the data is written in numerical order (if there are two middle values, the median is half-way between these values).
Mode The mode is the value that occurs most often.
Range The range of a set of data is a measure of spread. This gives us an idea of how the data is distributed. Range = Highest value – Lowest Value = H – L. Example Class 4B scored the following marks for their homework assignment. Find the mean, median, mode and range of the results.
7, 9, 7, 5, 6, 7, 10, 9, 8, 4, 8, 5, 7, 10
Mean =
79756710 984 85710
14
=
102
14 7.285... Mean = 7.3 to 1 decimal place
Ordered values: 4, 5, 5, 6, 7, 7, 7, 7, 8, 8, 9, 9, 10, 10
Median = 7
7 is the most frequent mark, so Mode = 7
Range = 10 – 4 = 6
To provide information about a set of data, the average value may be given. There are 3 ways of finding the average value – the mean, the median and the mode.
Pupils learn how to decide when average is most appropriate for a data set.

36