Embed Size (px)
Citation preview
Item ID Number °0631
Author Erickson, Mitchell D.
Research Triangle Institute, Research Triangle Park, NC
Ronort/ArtiClO TltlO Acquisition and Chemical Analysis of Mother's Milk forSelected Toxic Substances
Journal/Book Title
Year 190°
Month/Day December
Color
Number of Images 168
DBSOrlptOn NOtOS Alvin L- Youn9 filcd this item under the category"Human Exposure to Phenoxy Herbicides and TCDD"
Tuesday, February 20, 2001 Page 631 of 680
H.fc. e.V.«A. l r t*A WlJ
Acquisition and Chemical Analysis of Mother'sMilk for Selected Toxic Substances
*
Research Triangle Inst.Research Triangle Park, NC
Prepared for
Environmental Protection AgencyWashington, DC
Dec 80
U.S. DEPARTMENT OF COMMERCENational Technical Information Service
PB81-231029
United StatesEnvironmental ProtectionAgency
Office of Pesticides andToxic SubstancesWashington, DC 20460
EPA-560/13-80-029December 1980
L-23 1029Toxic Substances
&EPA Acquisition and ChemicalAnalysis of Mother's Milkfor Selected Toxic Substances
REPRODUCED 3VNATIONAL TECHNICALINFORMATION SERVICE
U.S. DEPARWfNI Of COMMERCESPRWflflELO. VA 22161
TECHNICAL REPORT DATA(Pleat read Inttructiom on the reverie before completing)
1. REPORT NO.560/13-80-029
3. R
4. TITLE ANOSUBTITLS
ACQUISITION AND CHEMICAL ANALYSIS OF MOTHER'S MILK FORSELECTED TOXIC SUBSTANCES
6. REPORT DATE
December, 1980
7.AUTH0R(S)Mitchell D. Erickson, Benjamin S. H. Harris,III, Edo D. Pellizzari, Kenneth B. Tomer, Richard D.Waddell and Donald A. Whitaker
S. PERFORMING ORGANIZATION CODE
31U-1521-21 + 22 '__m. PERFORMING ORGANIZATION REPORT NO.
9. PERFORMING ORGANIZATION NAME AND ADDRESS
Research Triangle InstituteP. 0. Box 12194Research Triangle Park, NC 27709
10. PROGRAM ELEMENT NO.
It. CONTRACT/GRANT NO.
68-01-3849 - Task 212. SPONSORING AGENCY NAME ANO ADDRESS
Field Studies Branch, Exposure Evaluation DivisionOffice of Pesticides and Toxic Substances, U. S.Environmental Protection Agency, Washington, DC 20460
13. TYPE OF REPORT ANO PERIOD COVEREDTask Final 1/23/78-4/18/80
14. SPONSORING AGENCY CODE
15. SUPPLEMENTARY NOTES
Project Officer: Joseph Breen
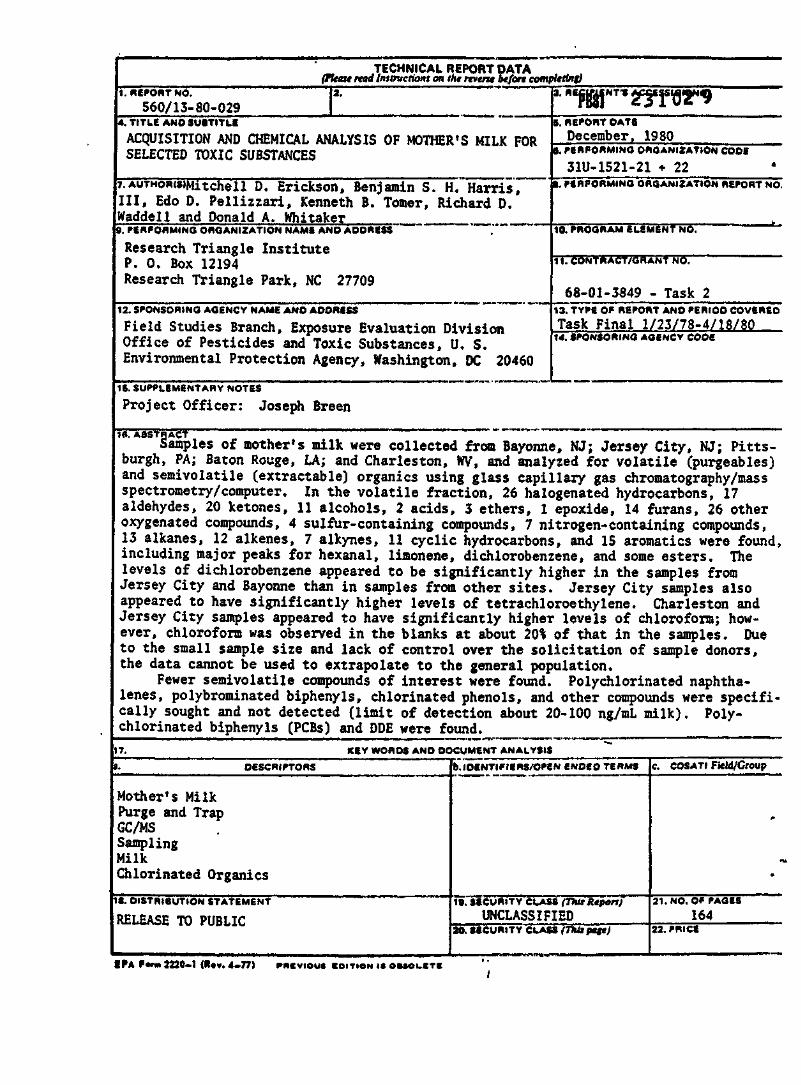
. ABSTRACTRACTSamples of mother1s milk were collected from Bayonne, NJ; Jersey City, NJ; Pitts-
burgh, PA; Baton Rouge, LA; and Charleston, WV, and analyzed for volatile (purgeables)and semivolatile (extractable) organics using glass capillary gas chromatography/massspectrometry/computer. In the volatile fraction, 26 halogenated hydrocarbons, 17aldehydes, 20 ketones, 11 alcohols, 2 acids, 3 ethers, 1 epoxide, 14 furans, 26 otheroxygenated compounds, 4 sulfur-containing compounds, 7 nitrogen-containing compounds,13 alkanes, 12 alkenes, 7 alkynes, 11 cyclic hydrocarbons, and 15 aromatics were found,including major peaks for hexanal, limonene, dichlorobenzene, and some esters. Thelevels of dichlorobenzene appeared to be significantly higher in the samples fromJersey City and Bayonne than in samples from other sites. Jersey City samples alsoappeared to have significantly higher levels of tetrachloroethylene. Charleston andJersey City samples appeared to have significantly higher levels of chloroform; how-ever, chloroform was observed in the blanks at about 20% of that in the samples. Dueto the small sample size and lack of control over the solicitation of sample donors,the data cannot be used to extrapolate to the general population.
Fewer semivolatile compounds of interest were found. Polychlorinated naphtha-lenes, polybrominated biphenyls, chlorinated phenols, and other compounds were specifi-cally sought and not detected (limit of detection about 20-100 ng/mL milk). Poly-chlorinated biphenyls (PCBs) and DDE were found.
17. KEY WORDS AND DOCUMENT ANALYSIS
a. DESCRIPTORS
Mother's MilkPurge and TrapGC/MSSamplingMilkChlorinated Organics
It. DISTRIBUTION STATEMENT
RELEASE TO PUBLIC
b.lDENTIFIERS/OPEN ENDED TERMS
19. SECURITY CLASS <TMs Rtpon)UNCLASSIFIED
20. SECURITY CLASS <TM* page)
c. COSATi Field/Croup
f
f.
21. NO. Of PAGES164
22. PRICE
EPA f*rm 2220.1 (R««. 4-77) PNCVIOU* COITION i* OMOLCTC
EPA 560/13-80-029
ACQUISITION AND CHEMICAL ANALYSIS OF MOTHER'S MILK
FOR SELECTED TOXIC SUBSTANCES
by
Mitchell 0. Erickson, Benjamin S. H. Harris, III, Edo D. Pellizzari,Kenneth B. Tomer, Richard D. Waddell and Donald A. Whitaker
Contract No. 68-01-3849Task 2
Project Officer: Joseph Breen
Field Studies BranchExposure Evaluation Division
Office of Pesticides and Toxic SubstancesU. S. Environmental Protection Agency
Washington, DC 20460
December 1980
/ -a.
DtCLAIMER
This document has been reviewed and approved for publication by the
Office of Pesticides and Toxic Substances, U.S. Environmental Protection
Agency. Approval does not signify that the contents necessarily reflect the
views and policies of the Environmental Protection Agency, nor does the
mention of trade names or commercial products constitute endorsement or
recommendation for use.
ii
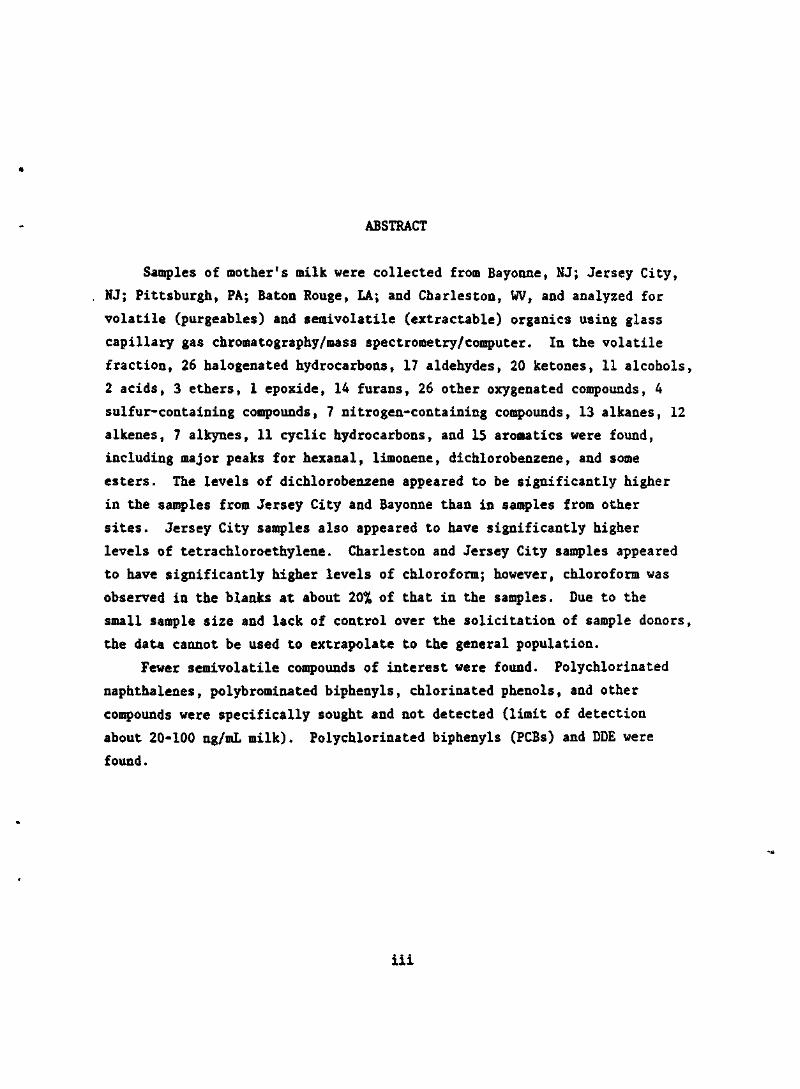
ABSTRACT
Samples of mother's milk were collected from Bayonne, NJ; Jersey City,
NJ; Pittsburgh, PA; Baton Rouge, LA; and Charleston, WV, and analyzed for
volatile (purgeables) and semivolatile (extractable) organics using glass
capillary gas cbromatography/mass spectrometry/computer. In the volatile
fraction, 26 halogenated hydrocarbons, 17 aldehydes, 20 ketones, 11 alcohols,
2 acids, 3 ethers, 1 epoxide, 14 furans, 26 other oxygenated compounds, 4
sulfur-containing compounds, 7 nitrogen-containing compounds, 13 alkanes, 12
alkenes, 7 alkynes, 11 cyclic hydrocarbons, and 15 aromatics were found,
including major peaks for hexanal, limonene, dichlorobenzene, and some
esters. The levels of dichlorobenzene appeared to be significantly higher
in the samples from Jersey City and Bayonne than in samples from other
sites. Jersey City samples also appeared to have significantly higher
levels of tetrachloroethylene. Charleston and Jersey City samples appeared
to have significantly higher levels of chloroform; however, chloroform was
observed in the blanks at about 20% of that in the samples. Due to the
small sample size and lack of control over the solicitation of sample donors,
the data cannot be used to extrapolate to the general population.
Fewer semivolatile compounds of interest were found. Polychlorinated
naphthalenes, polybrominated biphenyls, chlorinated phenols, and other
compounds were specifically sought and not detected (limit of detection
about 20-100 ng/mL milk). Polychlorinated biphenyls (PCBs) and DDE were
found.
iii
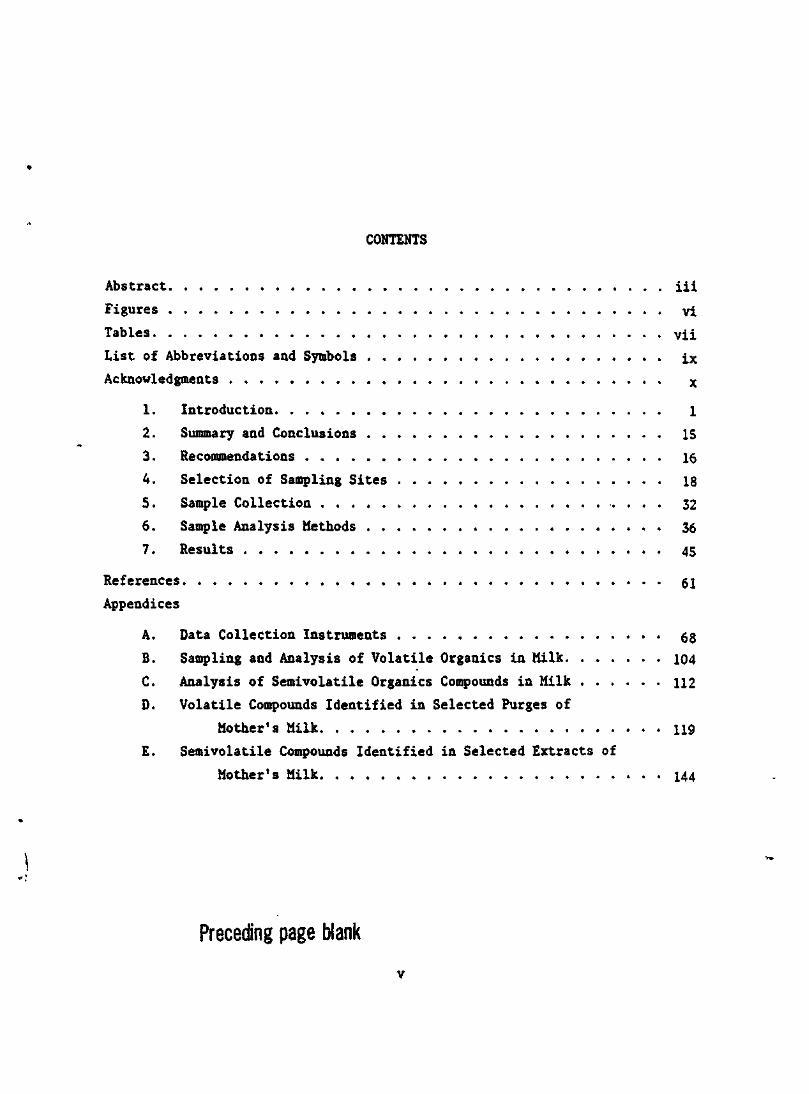
CONTENTS
Abstract iii
Figures vi
Tables vii
List of Abbreviations and Symbols ix
Acknowledgments x
1. Introduction 1
2. Summary and Conclusions 15
3. Recommendations 16
4. Selection of Sampling Sites 18
5. Sample Collection 32
6. Sample Analysis Methods 36
7. Results 45
References 61
Appendices
A. Data Collection Instruments 68
B. Sampling and Analysis of Volatile Organics in Milk 104
C. Analysis of Semivolatile Organics Compounds in Milk 112
0. Volatile Compounds Identified in Selected Purges of
Mother's Milk 119
E. Semivolatile Compounds Identified in Selected Extracts of
Mother's Milk 144
Preceding page blank
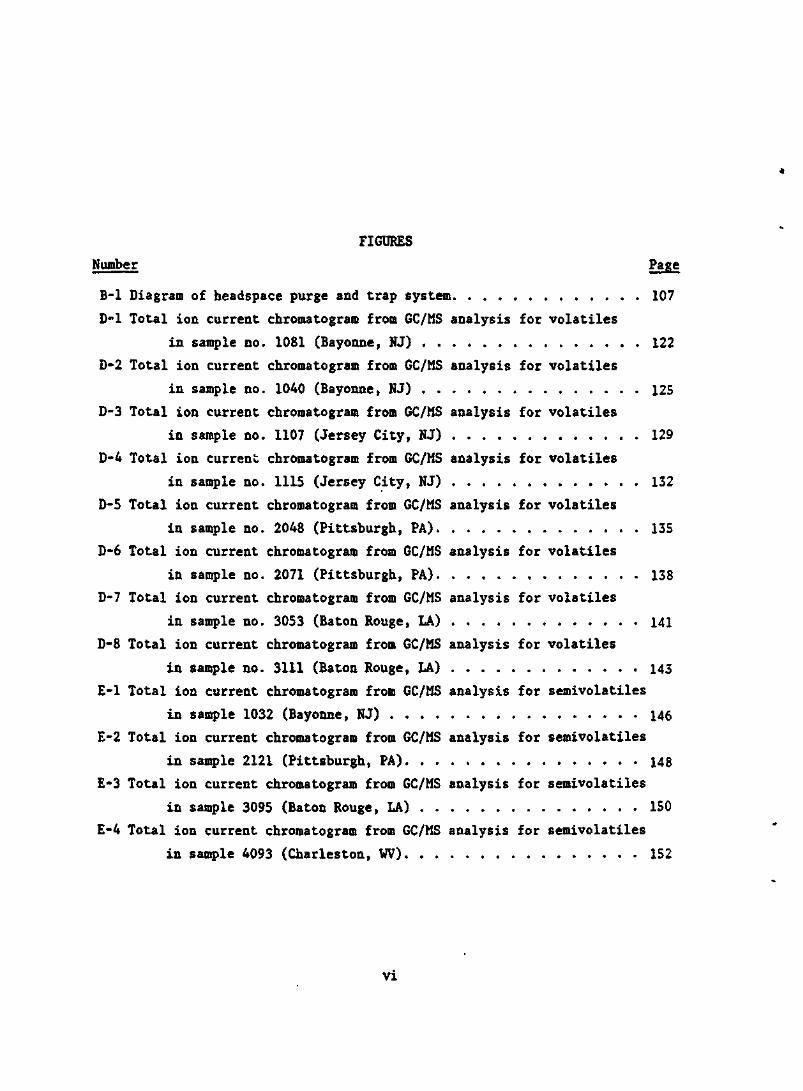
FIGURES
Number Page
B-l Diagram of headspace purge and trap system 107
D-l Total ion current chromatogram from GC/MS analysis for volatiles
in sample no. 1081 (Bayonne, NJ) 122
D-2 Total ion current chromatogram from GC/MS analysis for volatiles
in sample no. 1040 (Bayonne, NJ) 125
D-3 Total ion current chromatogram from GC/MS analysis for volatiles
in sample no. 1107 (Jersey City, NJ) 129
D-4 Total ion current chromatogram from GC/MS analysis for volatiles
in sample no. 1115 (Jersey City, NJ) 132
D-5 Total ion current chromatogram from GC/MS analysis for volatiles
in sample no. 2048 (Pittsburgh, PA) 135
D-6 Total ion current chromatogram from GC/MS analysis for volatiles
in sample no. 2071 (Pittsburgh, PA) 138
D-7 Total ion current chromatogram from GC/MS analysis for volatiles
in sample no. 3053 (Baton Rouge, LA) 141
D-8 Total ion current chromatogram from GC/MS analysis for volatiles
in sample no. 3111 (Baton Rouge, LA) 143
E-l Total ion current chromatogram from GC/MS analysis for semivolatiles
in sample 1032 (Bayonne, NJ) 146
E-2 Total ion current chromatogram from GC/MS analysis for semivolatiles
in sample 2121 (Pittsburgh, PA) 148
E-3 Total ion current chromatogram from GC/MS analysis for semivolatiles
in sample 3095 (Baton Rouge, LA) 150
E-4 Total ion current chromatogram from GC/MS analysis for semivolatiles
in sample 4093 (Charleston, WV) 152
VI
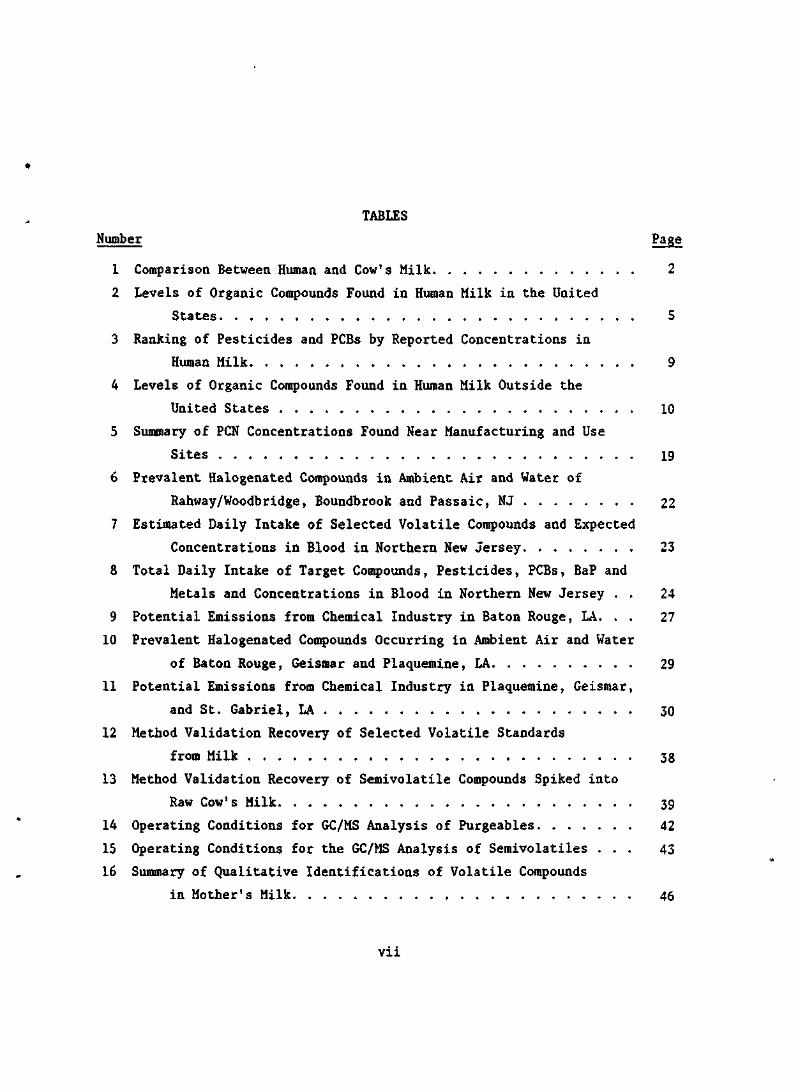
TABLES
Number
1 Comparison Between Human and Cow's Milk
2 Levels of Organic Compounds Found in Human Milk in the United
States 5
3 Ranking of Pesticides and PCBs by Reported Concentrations in
Human Milk 9
4 Levels of Organic Compounds Found in Human Milk Outside the
United States 10
5 Summary of PCN Concentrations Found Near Manufacturing and Use
Sites 19
6 Prevalent Halogenated Compounds in Ambient Air and Water of
Rahway/Woodbridge, Boundbrook and Passaic, NJ 22
7 Estimated Daily Intake of Selected Volatile Compounds and Expected
Concentrations in Blood in Northern New Jersey 23
8 Total Daily Intake of Target Compounds, Pesticides, PCBs, BaP and
Metals and Concentrations in Blood in Northern New Jersey . . 24
9 Potential Emissions from Chemical Industry in Baton Rouge, LA. . . 27
10 Prevalent Halogenated Compounds Occurring in Ambient Air and Water
of Baton Rouge, Geismar and Plaquemine, LA 29
11 Potential Emissions from Chemical Industry in Plaquemine, Geismar,
and St. Gabriel, LA 30
12 Method Validation Recovery of Selected Volatile Standards
from Milk 38
13 Method Validation Recovery of Semivolatile Compounds Spiked into
Raw Cow's Milk 39
14 Operating Conditions for GC/MS Analysis of Purgeables 42
15 Operating Conditions for the GC/MS Analysis of Semivolatiles ... 43
16 Summary of Qualitative Identifications of Volatile Compounds
in Mother's Milk 46
vii

TABLES CONT'D.
Number Page
17 Volatiles Quantitated in Mother's Milk Samples (ng/mL) 52
18 Summary Statistics for Volatile Compounds by Site 55
19 Significance of the Differences in the Geometric Means by Site . . 56
20 Spearman Correlation Coefficients for Volatile Organics Found
in Mother's Milk 57
21 Quality Control Results for Volatiles in Milk 58
22 DDE and Tetrachlorobiphenyl Levels in Selected Mother's Milk
Samples 60
B-l Instrumental Operating Conditions 108
D-l Volatile Compounds Identified in Purge of Sample No. 1081
(Bayonne, NJ) 120
D-2 Volatile Compounds Identified in Purge of Sample No. 1040
(Bayonne, NJ) 123
D-3 Volatile Compounds Identified in Purge of Sample No. 1107
(Jersey City, NJ) 126
D-4 Volatile Compounds Identified in Purge of Sample No. 1115
(Jersey City, NJ) 130
D-5 Volatile Compounds Identified in Purge of Sample No. 2048
(Pittsburgh, PA) 133
D-6 Volatile Compounds Identified in Purge of Sample No. 2071
(Pittsburgh, PA) 136
D-7 Volatile Compounds Identified in Purge of Sample No. 3053
(Baton Rouge, LA) 139
D-8 Volatile Compounds Identified in Purge of Sample No. 31]1
(Baton Rouge, LA) 142
E-l Semivolatile Compounds Identified in Extract of Sample 1032
(Bayonne, NJ) 145
E-2 Semivolatile Compounds Identified in Extract of Sample 3095
(Baton Rouge, LA) 147
E-3 Semivolatile Compounds Identified in Extract of Sample 3095
(Baton Rouge, LA) 149
E-4 Semivolatile Compounds Identified in Extract of Sample 4093
(Charleston, WV) 151
viii
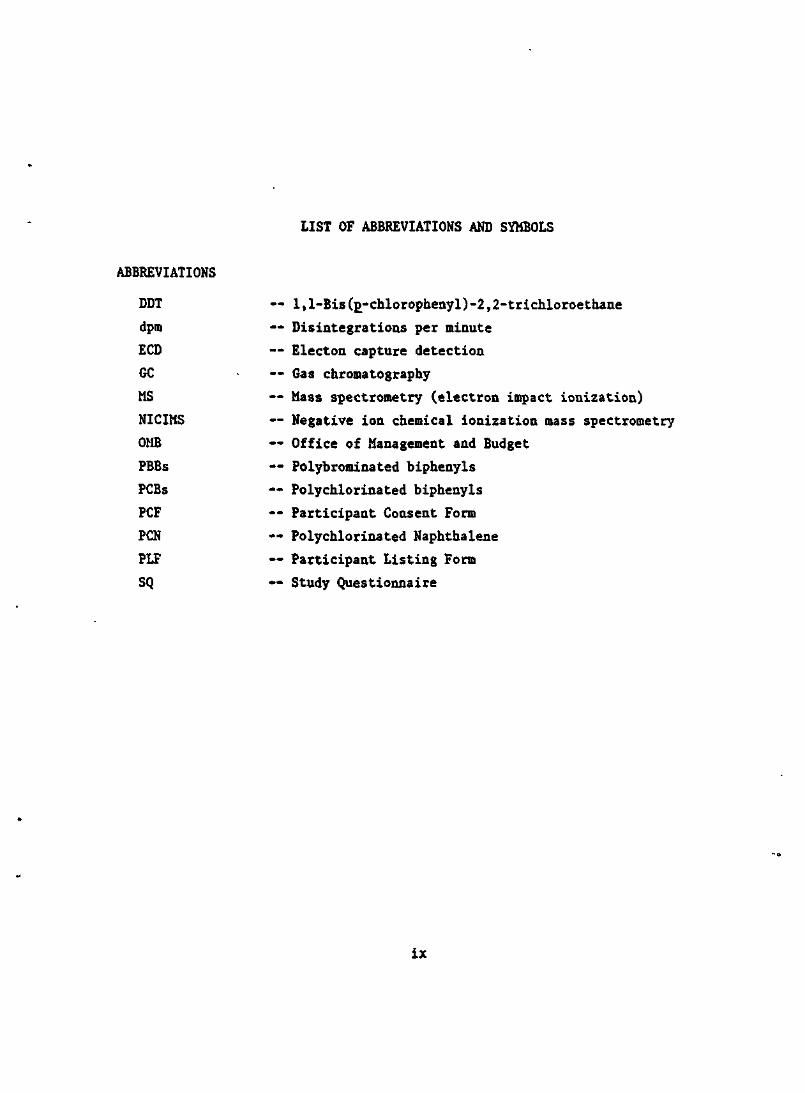
LIST OF ABBREVIATIONS AND SYMBOLS
ABBREVIATIONS
DDT
dpra
ECD
GC
MS
NICIMS
OMB
PBBs
PCBs
PCF
PCN
PLF
SQ
l,l-Bis(p_-chlorophenyl)-2,2-trichloroethane
Disintegrations per minute
Electon capture detection
Gas chromatography
Mass spectrometry (electron impact ionization)
Negative ion chemical ionization mass spectrometry
Office of Management and Budget
Polybrominated biphenyls
Polychlorinated biphenyls
Participant Consent Form
Polychlorinated Naphthalene
Participant Listing Form
Study Questionnaire
ix
ACKNOWLEDGMENTS
The authors thank the Project Officer, Dr. Joseph Breen, for his guidance
and advice. Sandra P. Parks, David L. Newton, and Larry C. Michael are
acknowledged for their assistance in the laboratory. Nora P. Castillo and
Kent W. Thomas are thanked for their assistance with mass spectral interpreta-
tion. Pamela A. Gentry, Fred A. McKinney, Stephen P. Burke, and Barbara L.
Bickford are thanked for sample analysis using mass spectrometry.
Personnel who assisted in the milk collection are greatly appreciated:
Elizabeth Bartholomew, Bayonne Hospital, Bayonne, NJ; Jules Rivkind and
Trudy Strunk, Medical Center Hospital, Jersey City, NJ; Ian Holtzman, Magee-
Women's Hospital, Pittsburgh, PA; Lewis Tracbtman, Louisiana Health Department,
New Orleans, LA; Maxine Parker, Baton Rouge Area Regional Nursing Consultant,
Baton Rouge, LA; Clementine Martine, Public Health Nursing Supervisor of the
East Baton Rouge Parish Health Unit, Baton Rouge, LA; and N. N. Sehgal,
Charleston Area Medical Center (Memorial Division), Charleston, WV.
Finally we would like to thank the 42 women who so kindly donated the
samples.
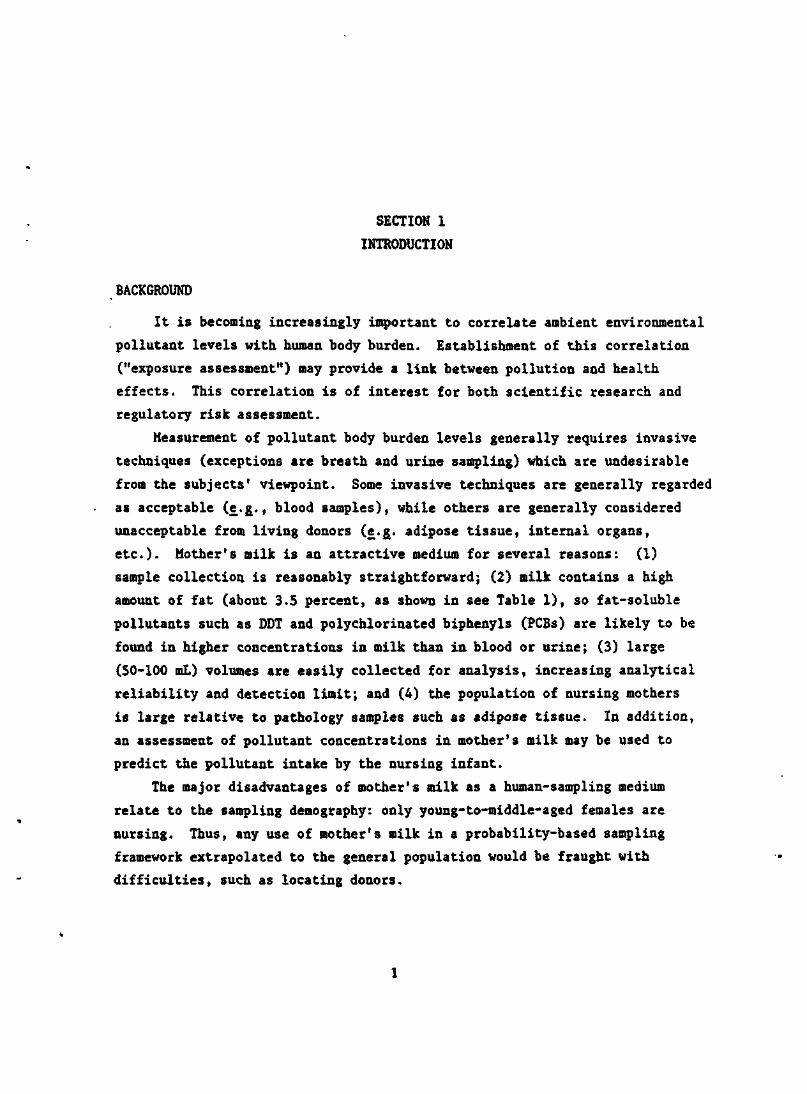
SECTION 1
INTRODUCTION
BACKGROUND
It is becoming increasingly important to correlate ambient environmental
pollutant levels with human body burden. Establishment of this correlation
("exposure assessment") may provide a link between pollution and health
effects. This correlation is of interest for both scientific research and
regulatory risk assessment.
Measurement of pollutant body burden levels generally requires invasive
techniques (exceptions are breath and urine sampling) which are undesirable
from the subjects' viewpoint. Some invasive techniques are generally regarded
as acceptable (e.g., blood samples), while others are generally considered
unacceptable from living donors (e.g. adipose tissue, internal organs,
etc.). Mother's milk is an attractive medium for several reasons: (1)
sample collection is reasonably straightforward; (2) milk contains a high
amount of fat (about 3.5 percent, as shown in see Table 1), so fat-soluble
pollutants such as DDT and polychlorinated biphenyls (PCBs) are likely to be
found in higher concentrations in milk than in blood or urine; (3) large
(50-100 ml) volumes are easily collected for analysis, increasing analytical
reliability and detection limit; and (4) the population of nursing mothers
is large relative to pathology samples such as adipose tissue. In addition,
an assessment of pollutant concentrations in mother's milk may be used to
predict the pollutant intake by the nursing infant.
The major disadvantages of mother's milk as a human-sampling medium
relate to the sampling demography: only young-to-middle-aged females are
nursing. Thus, any use of mother's milk in a probability-based sampling
framework extrapolated to the general population would be fraught with
difficulties, such as locating donors.
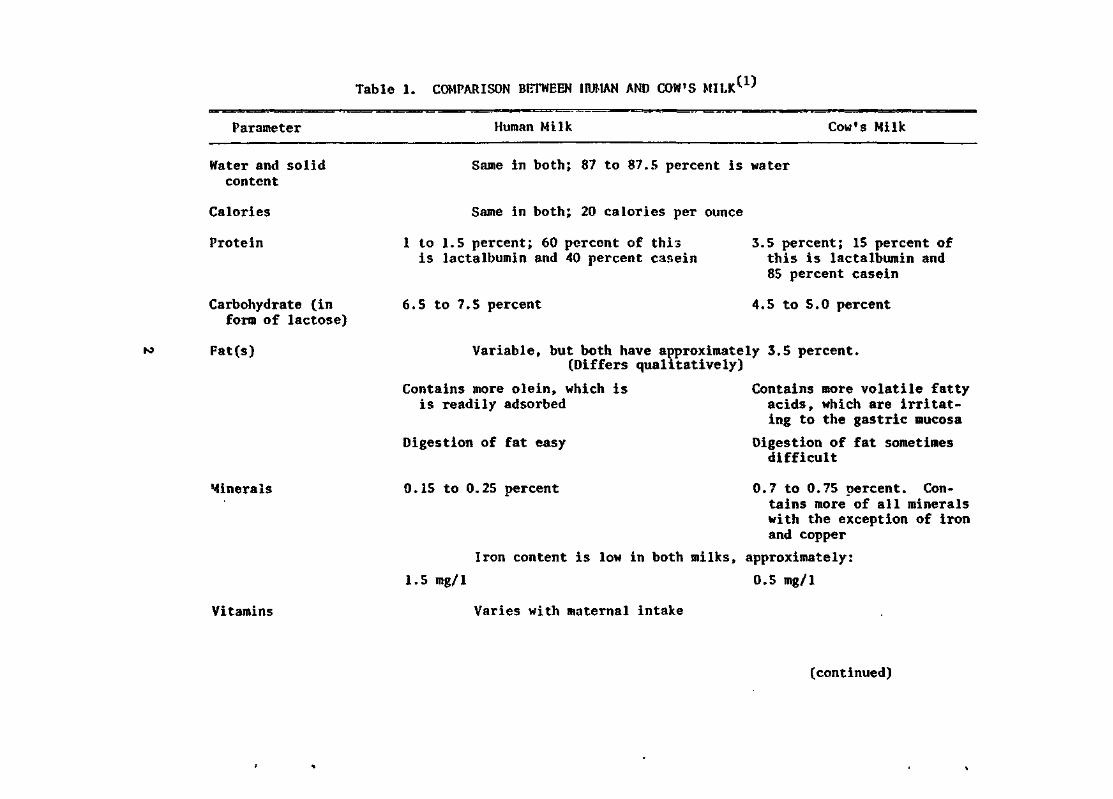
Table 1. COMPARISON BETWEEN HUMAN AND COW'S MILK(1)
Parameter Human Milk Cow's Milk
Water and solidcontent
Calories
Protein
Carbohydrate (inform of lactose)
Fat(s)
Minerals
Same in both; 87 to 87.5 percent is water
Same in both; 20 calories per ounce
1 to 1.5 percent; 60 percent of thisis lactalbumin and 40 percent car.ein
6.5 to 7.5 percent
3.5 percent; 15 percent ofthis is lactalbumin and85 percent casein
4.5 to 5.0 percent
Variable, but both have approximately 3.5 percent.(Differs qualitatively)
Contains more olein, which isis readily adsorbed
Digestion of fat easy
0.15 to 0.25 percent
Contains more volatile fattyacids, which are irritat-ing to the gastric mucosa
Digestion of fat sometimesdifficult
Vitamins
0.7 to 0.75 percent. Con-tains more of all mineralswith the exception of ironand copper
Iron content is low in both milks, approximately:
1.5 mg/1 0.5 mg/1
Varies with maternal intake
(continued)
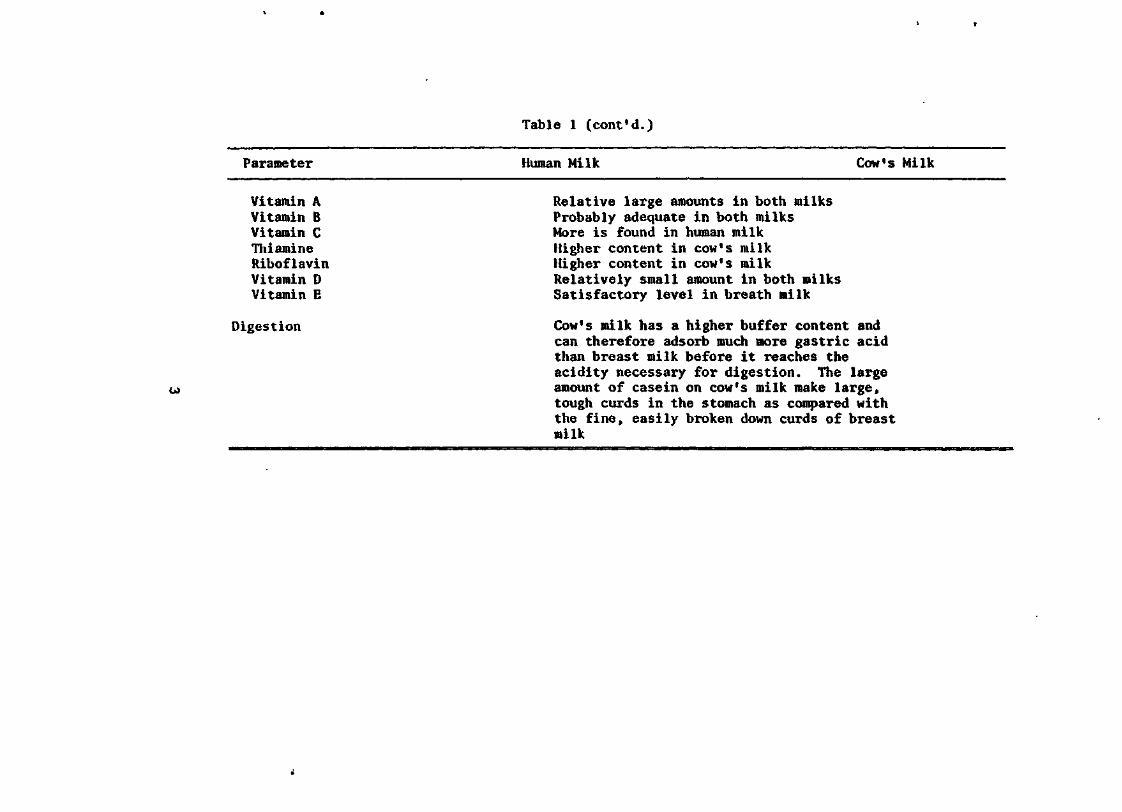
Table 1 (cont'd.)
Parameter Human Milk Cow's Milk
Vitamin A Relative large amounts in both milksVitamin B Probably adequate in both milksVitamin C More is found in human milkThiamine Higher content in cow's milkRiboflavin Higher content in cow's milkVitamin D Relatively small amount in both milksVitamin E Satisfactory level in breath milk
Digestion Cow's milk has a higher buffer content andcan therefore adsorb much more gastric acidthan breast milk before it reaches theacidity necessary for digestion. The largeamount of casein on cow's milk make large,tough curds in the stomach as compared withthe fine, easily broken down curds of breastmilk
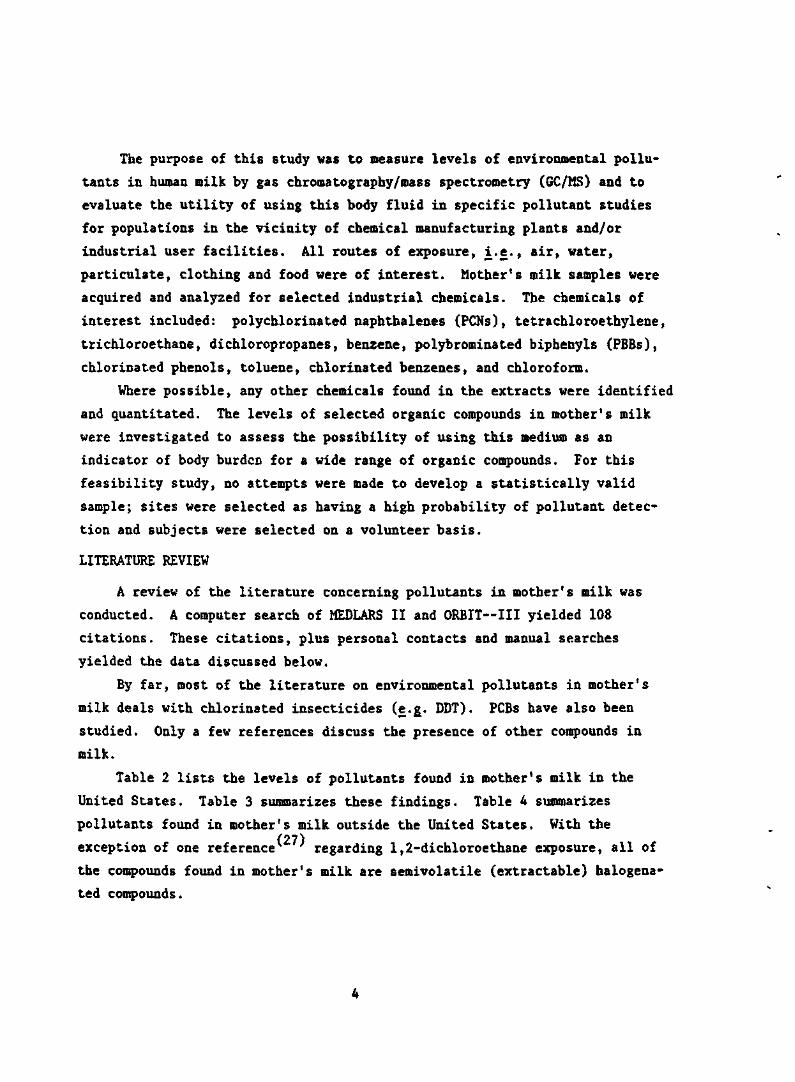
The purpose of this study was to measure levels of environmental pollu-
tants in human milk by gas chromatography/mass spectrometry (GC./HS) and to
evaluate the utility of using this body fluid in specific pollutant studies
for populations in the vicinity of chemical manufacturing plants and/or
industrial user facilities. All routes of exposure, i.-e., air, water,
particulate, clothing and food were of interest. Mother's milk samples were
acquired and analyzed for selected industrial chemicals. The chemicals of
interest included: polychlorinated naphthalenes (PCNs), tetrachloroethylene,
trichloroethane, dichloropropanes, benzene, polybrominated biphenyls (PEBs),
chlorinated phenols, toluene, chlorinated benzenes, and chloroform.
Where possible, any other chemicals found in the extracts were identified
and quantitated. The levels of selected organic compounds in mother's milk
were investigated to assess the possibility of using this medium as an
indicator of body burden for a wide range of organic compounds. For this
feasibility study, no attempts were made to develop a statistically valid
sample; sites were selected as having a high probability of pollutant detec-
tion and subjects were selected on a volunteer basis.
LITERATURE REVIEW
A review of the literature concerning pollutants in mother's milk was
conducted. A computer search of MEDLARS II and ORBIT—III yielded 108
citations. These citations, plus personal contacts and manual searches
yielded the data discussed below.
By far, most of the literature on environmental pollutants in mother's
milk deals with chlorinated insecticides (e.£. DDT). PCBs have also been
studied. Only a few references discuss the presence of other compounds in
milk.
Table 2 lists the levels of pollutants found in mother's milk in the
United States. Table 3 summarizes these findings. Table 4 summarizes
pollutants found in mother's milk outside the United States. With the(27)exception of one reference regarding 1,2-dichloroethane exposure, all of
the compounds found in mother's milk are semivolatile (extractable) halogena-
ted compounds.
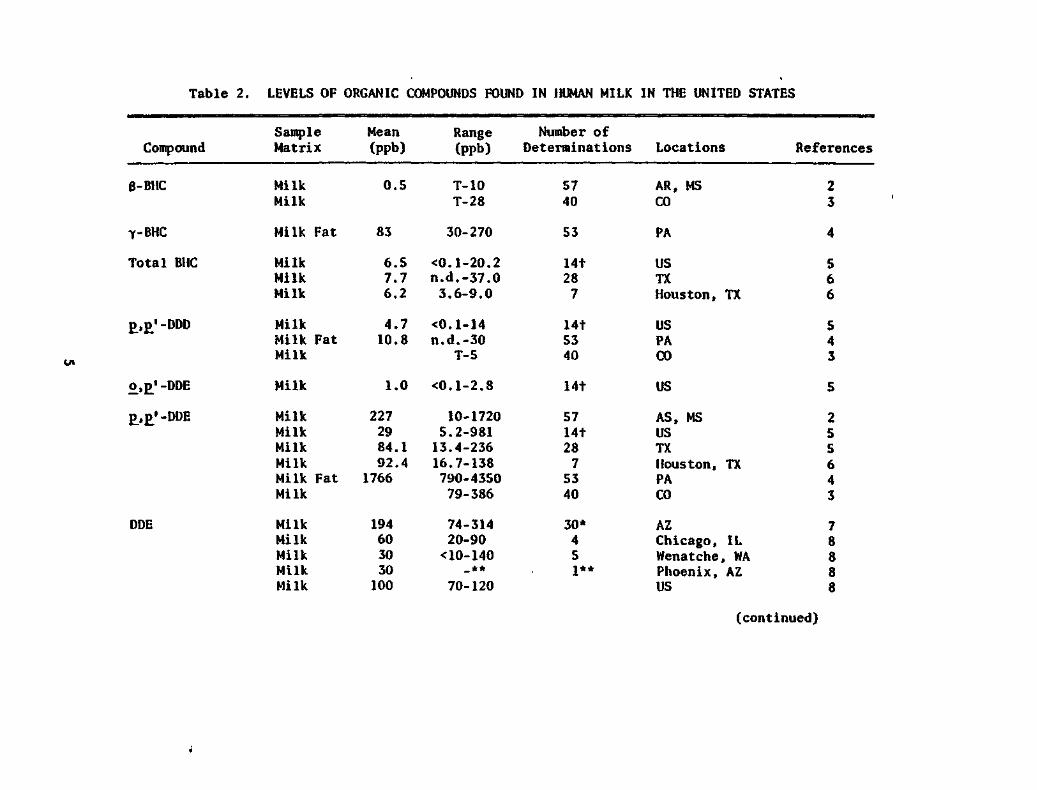
Table 2. LEVELS OF ORGANIC COMPOUNDS FOUND IN HUMAN MILK IN THE UNITED STATES
Compound
B-BHC
Y-BHC
Total BUG
£,p_' -DDD
o,p_'-DDE
£,p_* -DDE
DDE
SampleMatrix
MilkMilk
Milk Fat
MilkMilkMilk
MilkMilk FatMilk
Milk
MilkMilkMilkMilkMilk FatMilk
MilkMilkMilkMilkMilk
Mean(ppb)
0.5
83
6.57.76.2
4.710.8
1.0
2272984.192.4
1766
194603030100
Range Number of(ppb) Determinations Locations
T-10T-28
30-270
<0.1-20.2n.d.-37.03.6-9.0
<0.1-14n.d.-30
T-5
<0.1-2.8
10-17205.2-98113.4-23616.7-138790-435079-386
74-31420-90<10-140
_**70-120
5740
53
14t287
14t5340
14t
5714t2875340
30*451**
AR, MSCO
PA
USTXHouston, TX
USPACO
US
AS, MSUSTXHouston, TXPACO
AZChicago, ILWenatche, WAPhoenix, AZUS
References
23
4
566
543
5
255643
78888
(continued)
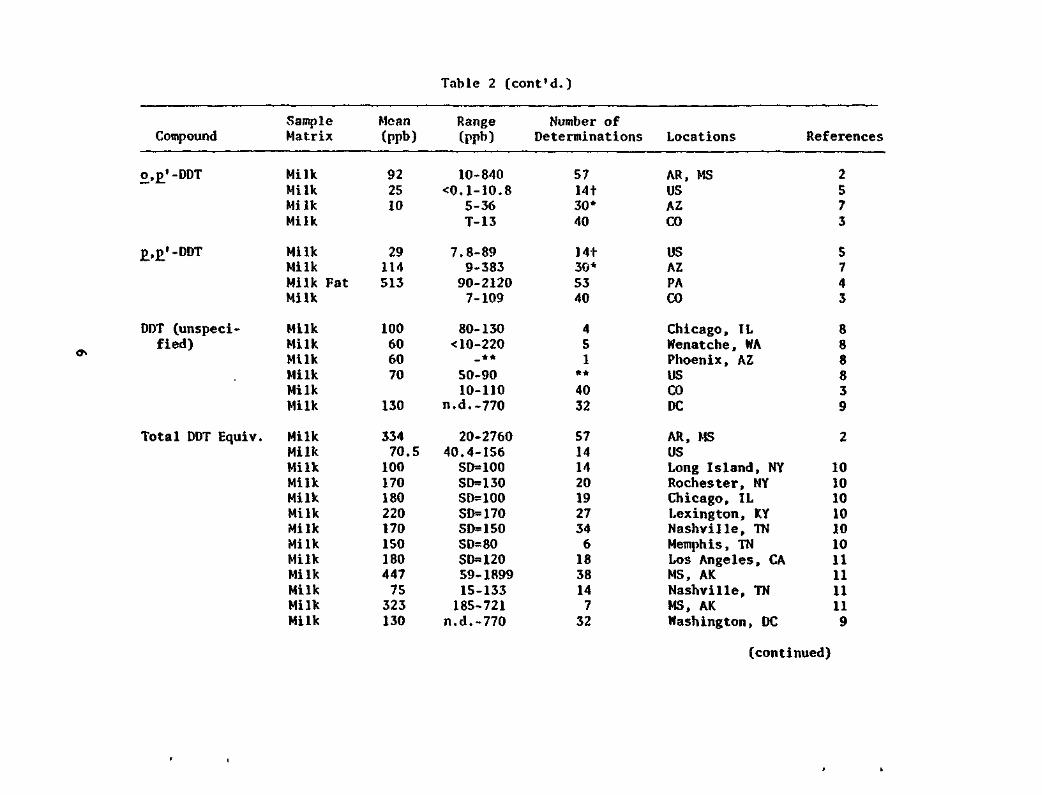
Table 2 (cont'd.)
Compound
o,£' -DDT
£,£'-DDT
DDT (unspeci-fied)
Total DDT Equiv.
SampleMatrix
MilkMilkMilkMilk
MilkMilkMilk FatMilk
MilkMilkMilkMilkMilkMilk
MilkMilkMilkMilkMilkMilkMilkMilkMilkMilkMilkMilkMilk
Mean(ppb)
922510
29114513
100606070
130
33470.510017018022017015018044775323130
Range Number of(ppb) Determinations Locations References
10-840<0.1-10.8
5-36T-13
7.8-899-38390-21207-109
80-130< 10-220
_**50-9010-110
n.d.-770
20-276040.4-156SD=100SD=130SD=100SD=170SD=150SD=80SD=12059-189915-133185-721
n.d.-770
5714 130*40
14t30*5340
451
**4032
571414201927346183814732
AR, MSUSAZCO
USAZPACO
Chicago, ILWenatche, WAPhoenix, AZUSCODC
AR, MSUSLong Island, NYRochester, NYChicago, ILLexington, KYNashville, TNMemphis, TNLos Angeles, CAMS, AKNashville, TNMS, AKWashington, DC
2573
5743
888839
2
101010101010111111119
(continued)
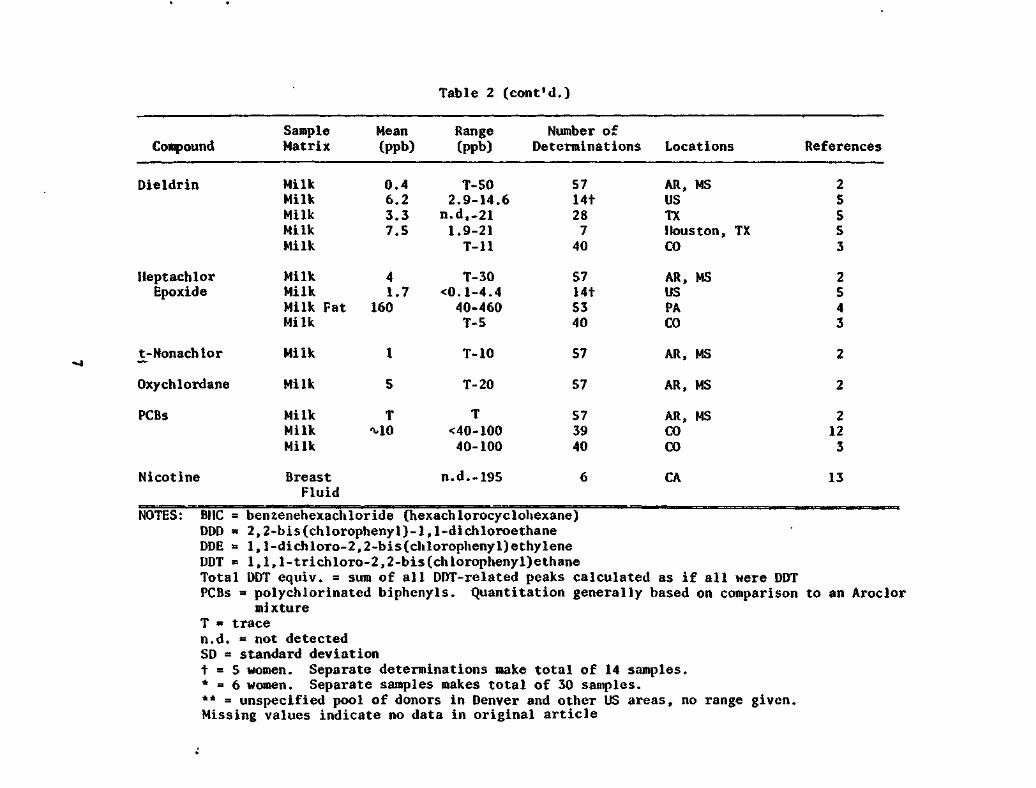
Table 2 (cont'd.)
Compound
Dieldrin
HeptachlorEpoxide
t-Nonachlor
Oxychlordane
PCBs
Nicotine
SampleMatrix
MilkMilkMilkMilkMilk
MilkMilkMilk FatMilk
Milk
Milk
MilkMilkMilk
BreastFluid
Mean(ppb)
0.46.23.37.5
41.7
160
1
5
TMO
Range Number of(ppb) Determinations Locations
T-502.9-14.6
n.d,-211.9-21T-ll
T-30<0.1-4.440-460T-5
T-10
T-20
T<40-10040-100
n.d.-195
5714t28740
5714t5340
57
57
573940
6
AR, MSUSTXHouston, TXCO
AR, MSUSPACO
AR, MS
AR, MS
AR, MSCOCO
CA
References
25553
2543
2
2
2123
13
NOTES: BUG = benzenehexachloride (hexachlorocyclohexane)ODD a 2,2-bis(chlorophenyl)-l,l-dichloroethaneDDE = l,l-dichloro-2,2-bis(chlorophenyl)ethyleneDDT = l,l,l-trichloro-2,2-bis(chlorophenyl)ethaneTotal DDT equiv. = sum of all DDT-related peaks calculated as if all were DDTPCBs = polychlorinated biphenyls. Quantitation generally based on comparison to an Aroclor
mixtureT = tracen.d. = not detectedSD = standard deviationt = 5 women. Separate determinations make total of 14 samples.* = 6 women. Separate samples makes total of 30 samples.** = unspecified pool of donors in Denver and other US areas, no range given.Missing values indicate no data in original article
Table 2 (cont'd.)
NOTES (cont'd.): Mean values were taken from original citation where available; otherwisearithmetic mean was calculated, counting "ND" values as zero and "T" valuesas 0.5 times the lowest reported value.
oe
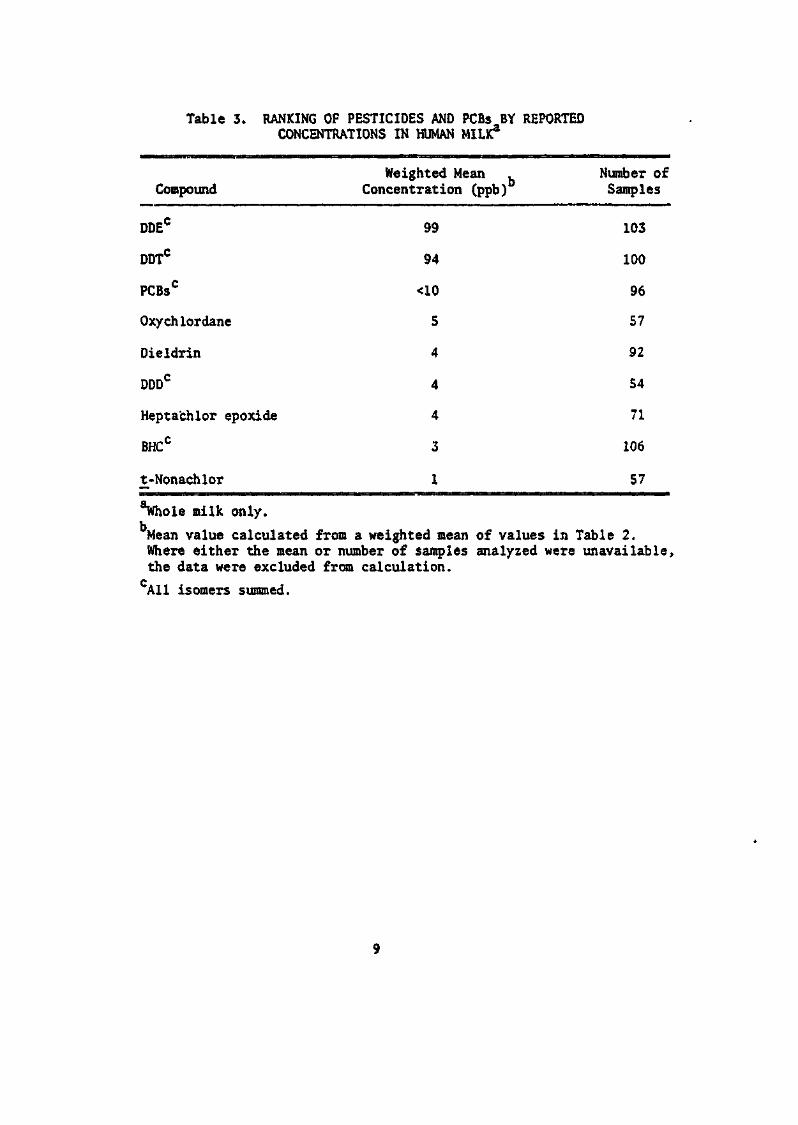
Table 3. RANKING OF PESTICIDES AND PCBs BY REPORTEDCONCENTRATIONS IN HUMAN MILKa
Compound
DDEC
DDTC
PCBsC
Oxychlordane
Dieldrin
DDDC
Hepta'chlor epoxide
BHCC
t-Nonachlor
Weighted MeanConcentration (ppb)
99
94
<10
5
4
4
4
3
1
Number ofSamples
103
100
96
57
92
54
71
106
57
milk only.
Mean value calculated from a weighted mean of values in Table 2.Where either the mean or number of samples analyzed were unavailable,the data were excluded from calculation.
CA11 isomers summed.
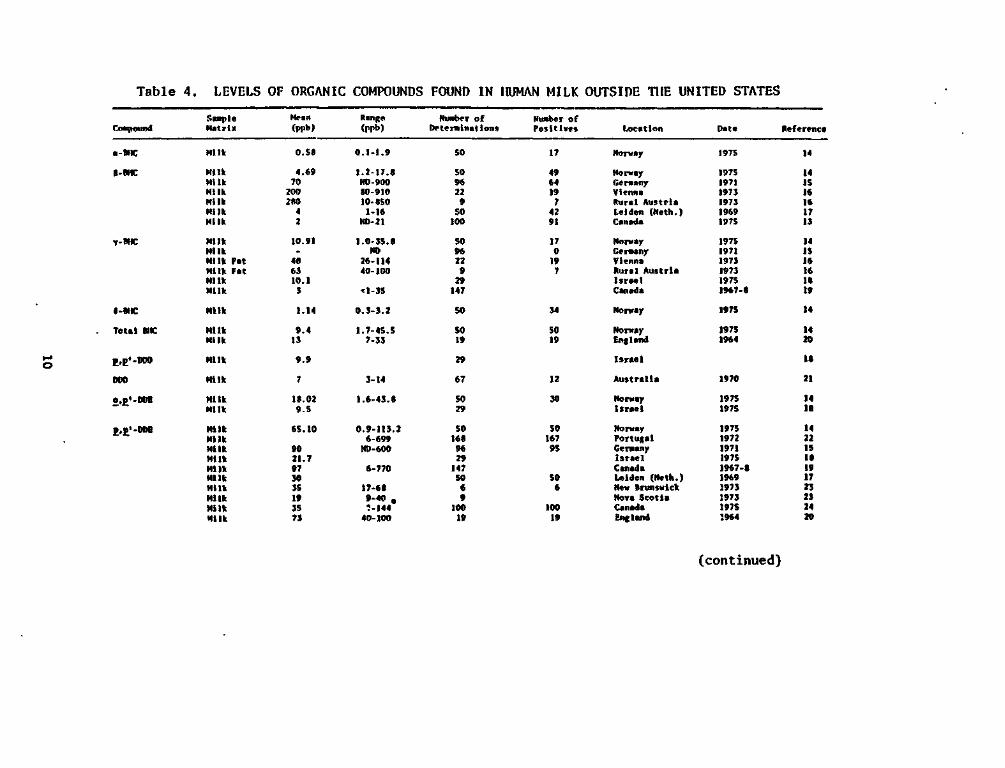
Table 4. LEVELS OF ORGANIC COMPOUNDS FOUND IN HUMAN MILK OUTSIDE THE UNITED STATES
Compound
a- me
t-rnc
Y-MC
I-8HC
Total MIC
£.£'-DDD
ODD
O.g'-DDB
£.,>'-Doe
SupleMatrix
HI Ik
H1UMilkHi IkHI IkHi IkMilk
HI IkMilkMilk FitMilk FatHI IkMilk
Milk
HI IkMilk
Milk
Hi Ik
MilkMilk
MilkHI IkMilkMilkHI IkHI IkMilkMilkMilkMilk
Mrnn(ppb)
0.58
4.69702002 BO42
10.91
-486310.11
1.14
9.413
9.9
7
IS. 029.5
65.10
9021.7973035193573
Range<PPI>)
0.1-1.9
1.2-17.8NO -90080-91010-8501-16
ND-21
1.0-35.8NO
26-11440- 100
<l-35
0.3-3.2
1.7-45.57-33
3-14
1.6-43.8
0.9-113.26-699ND-600
6-770
17-689-40 .•-I4440-100
Nurt.fr ofDeterminations
50
5096229SO100
509622929147
SO
5019
29
67
5029
SO1689629147SO69
10019
Number ofPositive!
17
49641974291
170197
34
SO19
12
30
SO16795
SO6
10019
Location
Norwujr
NorwayGemanjrViennaKuril AustriaLeiden (Neth.)Canada
NorwayCenanyViennaRural AustriaIsraelCanada
Norway
NorwayEn f land
Israel
Australia
NorwayIsrael
NorwayPortugalCcnanyIsraelCanadaLeiden (Neth.)N«w IrunswlckNova ScotiaCanadaEnfland
Date
1975
197519711973197319691975
197519711973197319751967-8
197S
19751964
1970
197S1975
19751972197119751967-8196929733973!97S1964
Reference
14
14IS16161713
141516161819
14
1420
18
21
1418
1422IS18191723232420
(continued)
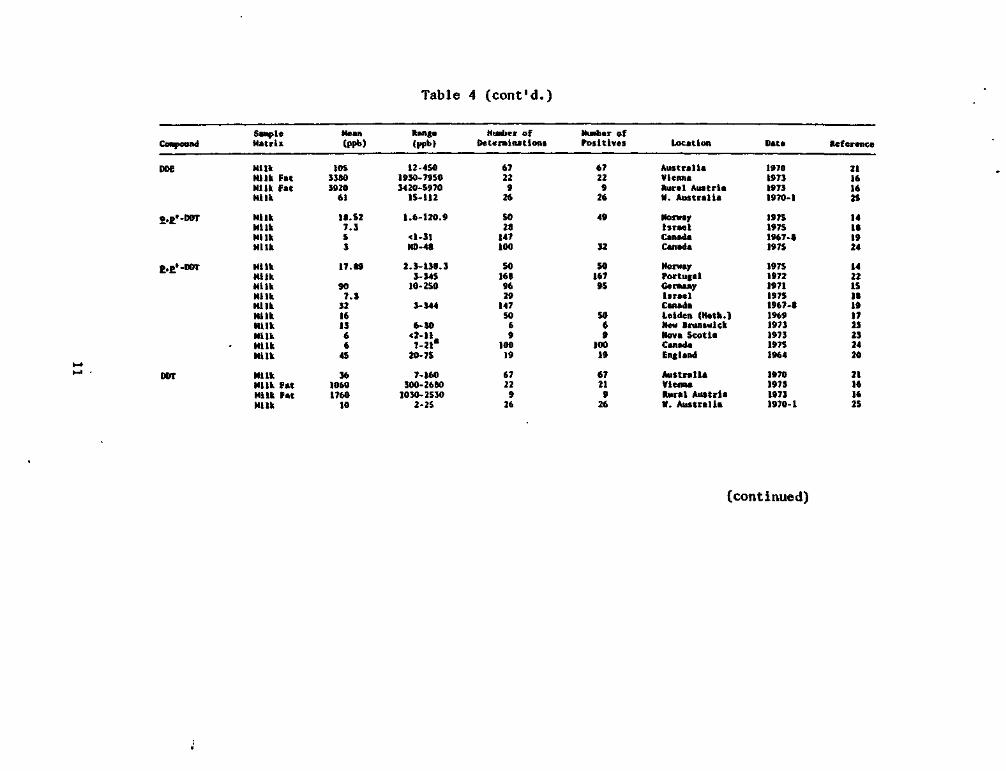
Table 4 (cont'd.)
Compound
DDE
o.p_'-DDT
E.P/-DDT
DOT
SampleMatrix
HI IkMilk FatMilk FatMilk
HI IkMilkMilkMilk
MilkMilkMilkMilkHI IkMilkMilkMilkHllkMilk
MilkHllk FatMilk FatMilk
Mean(PRb)
IOS3180192061
1S.S27.1s3
17.89
907.11216136645
361060176010
Range<H>b)
12-4501930-79503420-5970
15-112
1.6-120.9
<1-31ND-4B
2.1-118.11-14510-250
1-144
6-10«2-llt-21m
20-75
7-160100-26801030-2530
2-25
Nudier ofDetenlnationa
6722926
5021147100
5016S96291475069
10019
6722926
Nunber ofPositives
6722926
49
12
SO16795
SO69
10019
6721926
Location
AustraliaViennaRural AustriaM. Australia
HoneyIsraelCanadaCanada
NorwayPortugalGentanjrIsraelCanadaLeiden (N«th.)Hex BrunswickNova ScotiaCanadaEngland
AustraliaViennaRural AustriaM. Australia
Date
1970197119711970-1
197519751967-81975
19751972197119751967-819691971197119751964
1970197119711970-1
Reference
21161625
14161924
1422IS18191721212420
21161625
(continued)
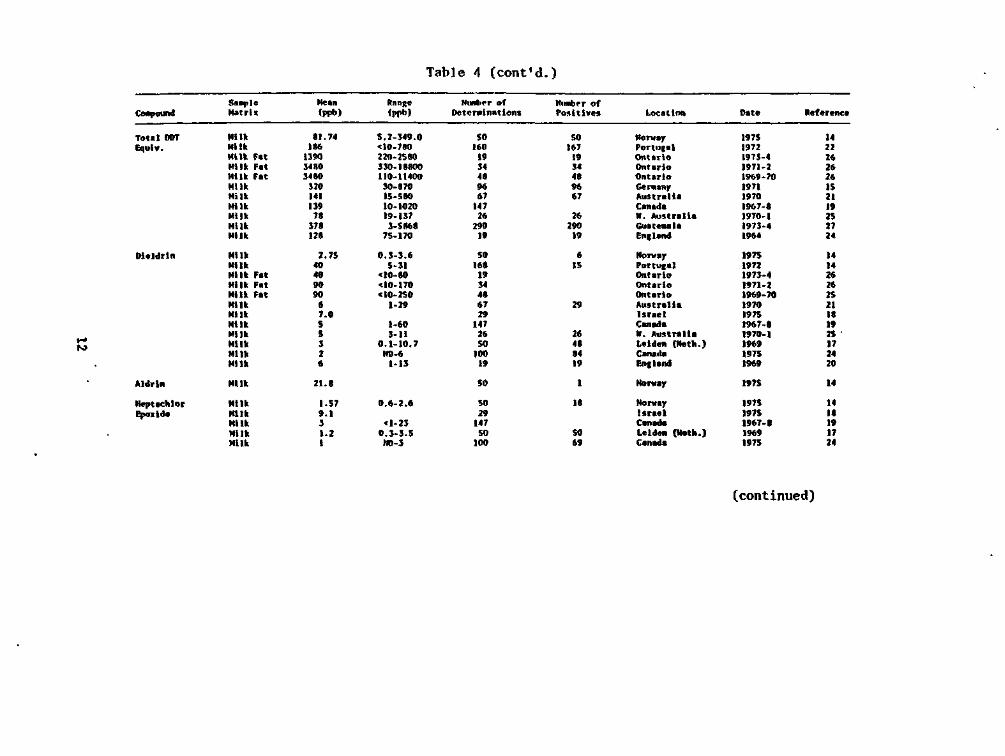
Table 4 (cont'd.)
Compound
Totil DOTEqulv.
Dieldrln
Aldrin
HeptachlorEpoxid*
SampleMatrix
MilkMilkMilk FitMilk FatMilk F«tMilkMilkMilkMilkMilkMilk
MilkMilkMilk FitMilk FitMilk FatMilkMilkMilkMilkMilkMilkMilk
Milk
MilkMilkMilkMilkMilk
Mean(PPb)
81.741061390348034 BO3201411397137812R
Z.754040909067.05sI26
21. «
1.579.131.21
Range(|.pb)
S. 2-349.0< 10-780220-2580330-18800110-1140030-87015-58010-102019-1373-58687S-170
0.3-3.65-31
<10-BO<10-170< 10- 2501-29
1-603-11
0.1-10.7ND-61-13
0.6-2.6
<l-230.3-3.5ND-3
NintfMT ofDeterminations
5016019344896671472629019
SO1681934486729147265010019
50
5029147SO100
Nimbrr ofPositives
501671934489667
2629019
6IS
29
26408419
1
18
SO69
Location
NorwayPortugalOntarioOntarioOntarioGermanyAustraliaCanadaW. AustraliaGuatemalaEngland
NorwayPortugalOntarioOntarioOntarioAustralia.IsraelCanadaW. AustraliaLeiden (Heth.)CanadaEngland
Norway
NorwayIsraelCanadaLeiden (Heth.)Canada
Date
19 7519721973-41971-21969-70197119701967-81970-11973-41964
197519721973-41971-21969-70197019751967-81970-1196919751969
1975
197519751967-119691975
Reference
1422262626152119252724
141426262521181925172420
14
14IS191724
(continued)
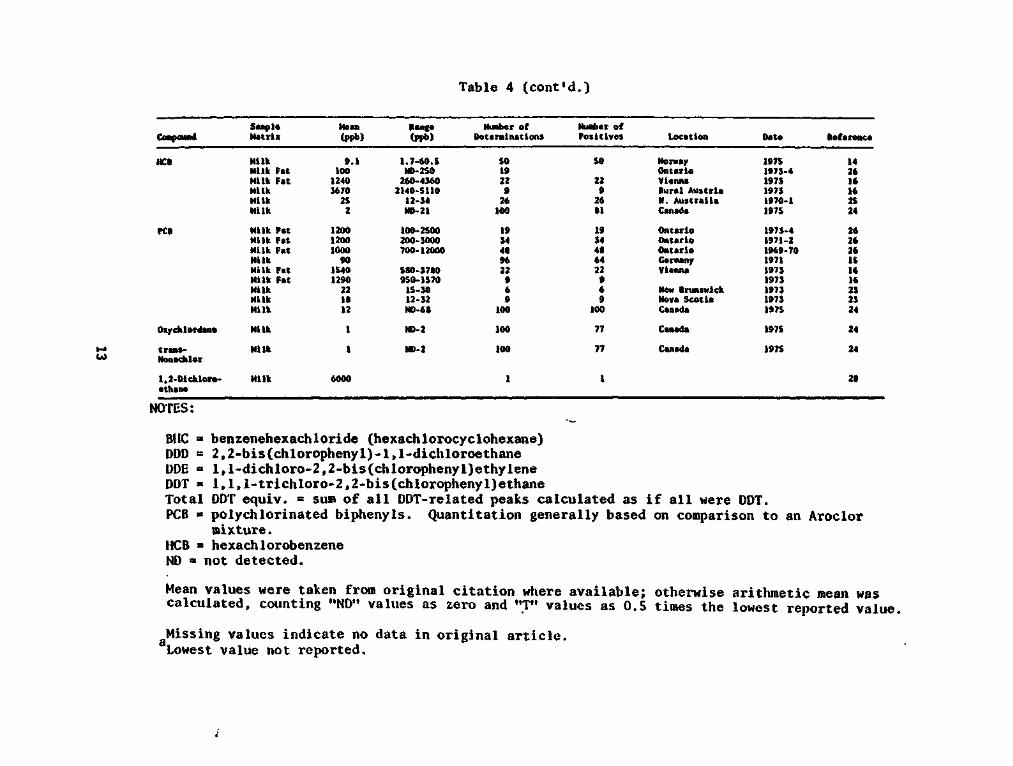
Table 4 (cont'd.)
Coepound
HCB
KB
Oxychlordane
truis-Nonachlor
1.2-Dichloro-ethiM
SupleMatrU
MilkHI Ik FitMilk FatMl IkMilkMilk
Milk FitMilk FatMilk FatMilkMilk FitMilk FitMilkMilkMilk
Milk
Milk
Milk
Mem(ppb)
9.110012401670252
12001200100090
IS40129022ia12
1
1
6000
Ring*(PI*)
1.T-60.SND-2SO260-41602140-511012-14NO- 21
100-2500200-1000700-12000
S80-37809SO-1S701S-JO12-12ND-68
KD-2
NO-2
HiMber ofDeterminations
SO1922926100
1914489622969
100
100
100
1
Number ofPositives
SO
2292681
1934416422969
100
77
77
t
location
HoneyOntarioViennaRural AustriaM. AustraliaCanada
OntarioOntarioOntarioGermanyVienna
New BrunswickNova ScotiaCanada
Canada
Canada
Date
197S1971-4197319711970-1197S
1971-41971-21969-7019711971197]19711971I97S
197S
197S
Reference
142616162S24
262626IS1616212124
24
24
2B
NOTES:
BUG = benzenehexachloride (hexachlorocyclohexane)ODD - 2,2-bis(chlorophenyl)-l,l-dichloroethaneDDE = l,l-dichloro-2,2-bis(chlorophenyl)ethyleneDDT = l,l,l-trichloro-2,2-bis(chlorophenyl)ethaneTotal DDT equiv. = sum of all DDT-related peaks calculated as if all were DDT.PCB = polychlorinated biphenyls. Quantitation generally based on comparison to an Aroclor
mixture.HCB - hexachlorobenzeneND = not detected.
Mean values were taken from original citation where available; otherwise arithmetic mean wascalculated, counting "ND" values as zero and "T" values as 0.5 times the lowest reported value.
Missing values indicate no data in original article.Lowest value not reported.
The literature shows that mother's milk often contains seraivolatile
chlorinated organic pollutants (pesticides). Presumably due to lack of
analytical techniques and/or sensitivity, the presence of other pollutants
has apparently not been investigated.
14
SECTION 2
SUMMARY AND CONCLUSIONS
The results show that sampling and analysis for organic compounds in
mother's milk is feasible. The sample collection technique presented no
significant problems. Analysis of the samples was generally satisfactory.
The use of purge and trap with gas chromatography/mass spectrometry/com-
puter (GC/MS/COMP) analysis for volatile organics was successful, although
the intrusion of contaminants during analysis presented problems with some
compounds. The wide range of volatile compounds found includes common air
and water pollutants and possible metabolites. Thus, it may be possible to
use mother's milk as an indicator of body burden if a correlation between
exposure and mother's milk concentration is established.
The extraction and GC/MS analysis for semivolatile organics was only
marginally successful due to limited sensitivity (about 20-100 ppb milk).
PCBs and ODE were the only halogenated semivolatiles found. The target
semivolatile compounds (PCNs, PBBs, chlorinated phenols, and the higher
chlorinated benzenes) were not present in quantities detectable by the
survey techniques. The use of more sensitive (generally a factor of 100-1000)
and selective methods [GC/electron capture detection (BCD), GC/negative ion
chemical ionization mass spectrometry (NICIMS) or GC/single ion monitoring
MS] may detect these compounds, but was outside the scope of this project.
15
SECTION 3
RECOMMENDATIONS
Further studies of the applicability of mother's milk as a matrix for
assessing the human body burden of pollutants must directly compare human
milk with the other available sample matrices. For example, comparison of
the volatiles in breath, blood, urine, and mother's milk would determine
which matrices are most suitable for measuring these compounds. It may also
be advisable to use animal studies to determine the extent of environmental
exposure-body burden correlation.
In addition, the effects of transport of pollutants to a newborn infant
should be studied. Infants may be uniquely affected by some pollutants due
to their small body weight and different metabolism relative to adults.
The measurement of semivolatile organics in mother's milk requires more
sensitive techniques than those used in this study. For example, chlorinated
compounds could best be detected using GC/ECD or GC/negative ion chemical
ionization mass spectrometry and polynuclear aromatics by GC/photoionization
detection.
Improvement in analytical methodology could occur at several points:
(1) As discussed above, more sensitive, analytical procedures could be
used for specific compound classes.
(2) For volatile organics, background levels could be reduced with an
on-line purge and trap/GC system.
Potential improvements in survey and sampling methodology include:
(1) Addition of questions regarding length of nursing, age of infant,
time since last nursing, etc.
(2) Selection of participants according to a more statistically valid
method (e.g. statistically random sampling).
(3) Closer control over physical collection methodologies (e.g. all
respondents gathered at one location).
16
The 5-month time lag in the study awaiting OMB clearance was seriously
detrimental to the project. The personnel and apparatus used for the valida-
tion studies had to be reassembled once OMB clearance was obtained. Restart-f
ing a project following a long dormant period requires retraining analytical
personnel (or training new personnel if original personnel have been reassig-
ned to other research projects), recalibration of instruments, and assembling
the necessary laboratory apparatus and supplies, all of which consume govern-
ment resources. Reducing this time lag is extremely important for execution
of programs involving human testing.
17
SECTION 4
SELECTION OF SAMPLING SITES
Five urban areas were chosen as sampling sites. Each of these cities
is a high-probability area for the presence of one or more of the chemicals
of interest in mother's milk. Since many of the compounds of interest are
probably specific to certain industrial sites, the samples from the other
sites were intended to serve as controls for the site-specific compounds.
Other compounds are considered ubiquitous and their levels in milk was
probably not related to local industrial activity. The rationale for select-
ing the five sampling sites is discussed below.
BRIDGEVILLE, PENNSYLVANIA
PCNs are manufactured by Koppers Company, Inc., of Pittsburgh, PA, at
the Koppers Chemical and Coatings plant in Bridgeville, about 10 km SW of(29)Pittsburgh. Reported production levels were 7 million Ib in 1956 and 5
(29)million Ib in 1972, indicating a potential long-term, relatively constant,
exposure level in the surrounding area. Results from environmental monitoring
in the area immediately (< 1 km) surrounding the plant indicated higher
levels of PCNs in air and soil than those found near five PCN user sites, asf f\f\ O / *\
shown in Table 5. Furthermore, fish and apple samples from the same
area were found to contain PCNs, indicating a potential link to the human
food chain.
In addition to PCNs, plants in the Bridgeville area have been reported( 5)to emit large quantities of phthalic anhydride particulate. At this
plant site, Koppers is reported to manufacture chlorinated naphthalenes,
phthalic anhydride, maleic anhydride, and alkyd resins.
18
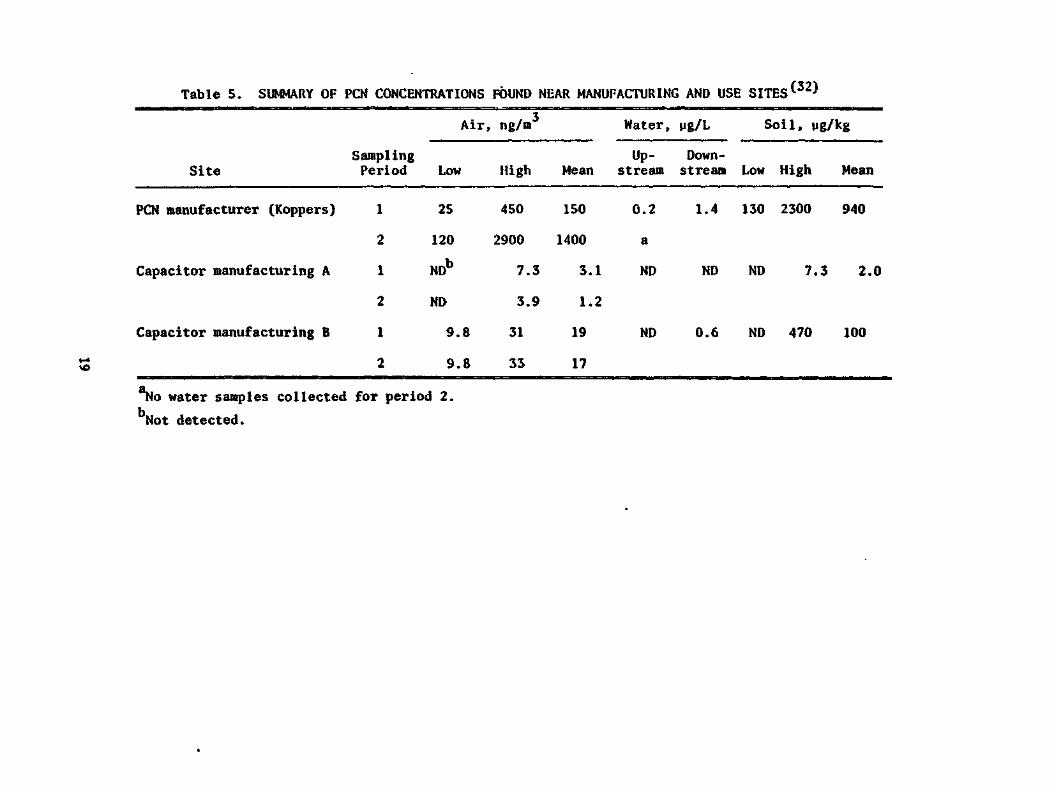
Table 5. SUMMARY OF PCN CONCENTRATIONS FOUND NEAR MANUFACTURING AND USE SITES
Air, ng/m Water, pg/L Soil, ng/kg
Sampling Up- Down-Site Period Low High Mean stream stream Low High Mean
PCN manufacturer (Koppers)
Capacitor manufacturing A
Capacitor manufacturing B
1
2
1
2
1
2
25
120
NDb
ND
9.8
9.8
450
2900
7.3
3.9
31
33
150 0.2 1.4 130 2300 940
1400 a
3.1 ND ND ND 7.3 2.0
1.2
19 ND 0.6 ND 470 100
17
o water samples collected for period 2.
Not detected.
NORTHERN NEW JERSEY - STATEN ISLAND, NEW YORK, AREA (NNJ)
The Northern New Jersey (NNJ) area was selected as a sampling site on
two bases: production of PBBs and general chemical industrial activity.
Three facilities are of interest^ ' with respect to PBBs: White Chemical
Co., E 22nd St., Bayonne, NJ; Marcor, Inc., Standard T. Chemical Co., subsi-
diary, 2500 Richmond Terrace, Staten Island, NY; and Hexcel Corp., Fine
Organics Division, 880 Main St., Sayreville, NJ. White produced 45,000 kg
of FBBs (specifically octabromobiphenyl and decabromobiphenyl) between 1970/oo^ f39}
and 1973. Hexcel is reported to have produced unspecified amounts
of decabromobiphenyl [as well as to have produced or used decabromobiphenyl
oxide, ethylene dichloride, and l,2-bis(2,A,6-tribromophenoxy)ethane].(39)Standard T is thought to have been a PBB user up to about 1974.
Results of environmental sampling in the area surrounding these three(40 41)companies ' indicated the presence of PBBs, especially the more highly
brominated homologs, in sediment, water, soil, human hair, fish, turtle, and
plant matter. The findings in human hair oil (18 total samples), which
ranged from undetectable to 310 ppm, are especially relevant to this study,
since they indicate that the PBB manufacturing in this area and the resultant
environmental contamination has resulted in human exposure.(42)Northern New Jersey has a high concentration of chemical industries,
many of which use or produce halogenated hydrocarbons. The list of industries
and locations are summarized below. Coastal Industries, Inc. (swimming pool
chemicals), Diamond Shamrock (textile processing chemicals), Scientific
Chemical Processing (chemical waste disposal) and Tenneco Chemicals (synthetic
foam rubbers) are located in Carlstadt. Crompton & Knowles Corp. (dyes,
colors and chemicals) are located in Fairlawn. Fisher Scientific (chemicals),
Conoco Chemicals are in Saddle Brook. In Bayonne are CIBA-Geigy (dyes and
intermediates) and ICI America (organics). In Jersey City are Mallinkrodt
(analytical reagents) and Onya Chemical Co. (textile finish compounds, water
repellants, germicides, and detergents). In Kearney are Standard Chlorine
Chemical Co. (chlorobenzenes), Theobald Industries (bleaches), PPG Industries
(paint) and Monsanto (industrial chemicals). In South Kearney is BASF-
Wyandotte (dyestuffs and vinylidine chloride). In Newark are American Oil
and Supply Co. (surfactants and chemicals), Celanese Plastics (plastics),
20
DuPont (pigments), Inmoat (paint), Haas & Waldstein (paint), Otto B. May
(dyes, surfactants), 3M (chemicals), Benjamin Moore (paint), Sherwin-Williams
(paint) and Vulcan Materials (chlorome thanes ). In Elizabeth are Perk (chlori-
nated solvents) and Speciality Chemicals Division of Allied Chemical Corp.
Linden Chlorine Products (chlorine) is in Linden. In Rahway are M & T
Chemicals (speciality chemicals) and Merck and Co. (industrial chemicals).
In Edison are Gary Page Chemicals (PVC compounds) and Mobile Chemical (paint).
In Parlin, Hercules manufactures chloroform. In Passaic are Pantasote Co.
of New York (PVC resin film), Stauffer (vinyl sheet and film) and United
Wool Piece Dyeing and Finishing (dyes). In Patterson are several dye manufac-
turers. In Wayne are American Cyanamid (chemicals) and Owens Illinois
(plastics). Many of these and other firms in NNJ undoubtedly manufacture or
use compounds which are of interest to this study.
The levels of general organic pollutants in NNJ have been found to be
high due to intense chemical manufacturing in the area. Environmental
monitoring by RTI under separate contracts, " has found a wide variety
of organic pollutants in this area. In addition, preliminary results from
ground and surface water samples indicate measurable levels of a number of45)
volatile halogenated hydrocarbons. ' These data, summarized in Table
6, are indicative of environmental levels of organics in the NNJ area to
which humans may be exposed and thus are indicative of the types of compounds(45)
anticipated in mother's milk. Under a separate research project, the
daily intake of some selected organics was roughly estimated. These estimates
are given in Tables 7 and 8. Clearly there is ample exposure to pollutants
which could potentially partition into milk.
The statistics for cancer in two counties of NNJ are very high. '
The overall rate for all malignant neoplasms is significantly above the
national average. This cancer incidence in New Jersey has been partially
linked to the chemical and allied industries located there.
Northern New Jersey is a metropolitan area with a relatively static
population, a well-established chemical industry, known environmental levels
of organics (including PBBs) and abnormally high cancer rates. These factors
make this area especially suited to this study of organics in mother's milk.
21
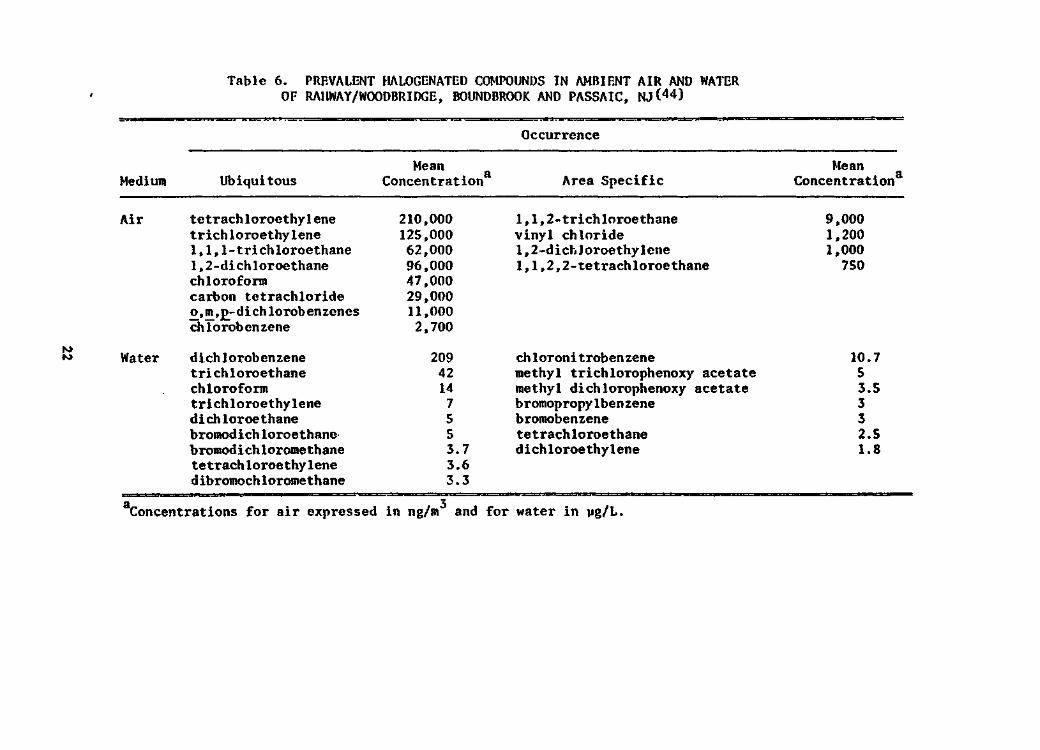
Table 6. PREVALGNT HALOGENATED COMPOUNDS IN AMBIENT AIR AND WATEROF RAIIWAY/WOODBRIDGE, BOUNDBROOK AND PASSAIC, Nj(4<0
Occurrence
Medium UbiquitousMean
Concentration Area SpecificMean
Concentrationa
roK>
Air tetrachloroethylenetrichloroethylene1,1,1-trichloroethane1,2-dichloroethanechloroformcarbon tetrachloridep_,m,p_-dichlorobenzeneschlorobenzene
Water dichlorobenzenetrichloroethanechloroformtrichloroethylenedichloroethanebromodichloroethanebromodichloromethanetetrachloroethylened ibromoch1orome thane
210,000125,00062,00096,00047,00029,00011,0002,700
20942147553.73.63.3
1,1,2-trichloroethanevinyl chloride1,2-dichJoroethylene1,1,2,2-tetrachloroethane
chloronitrobenzenemethyl trichlorophenoxy acetatemethyl dichlorophenoxy acetatebromopropyIben zenebromobenzenetetrachloroethanedichloroethylene
9,0001,2001,000750
10.753.5332.51.8
a 3Concentrations for air expressed in ng/m and for water in pg/L.
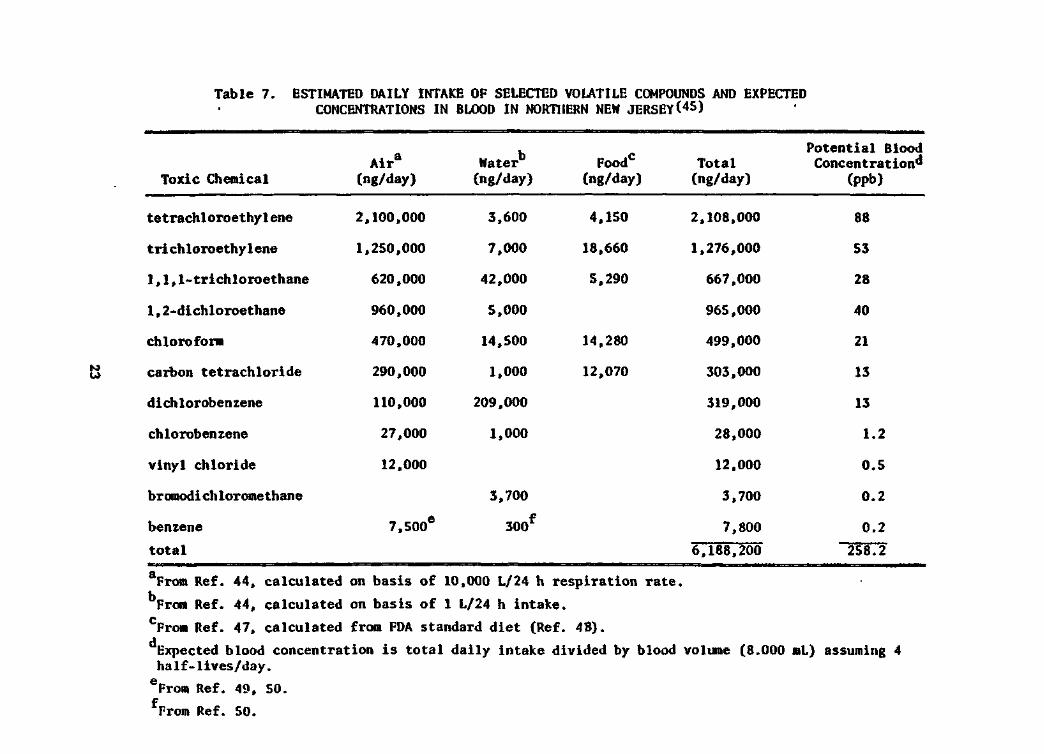
Table 7. ESTIMATED DAILY INTAKE OF SELECTED VOLATILE COMPOUNDS AND EXPECTEDCONCENTRATIONS IN BLOOD IN NORTHERN NEW JERSEY(45)
10u>
Toxic Chemical
tetrachloroethylene
tri chloroethy 1 ene
1,1, 1- trichloroethane
1 , 2-dichloroethane
chloroform
carbon tetrachloride
dichlorobenzene
chlorobenzene
vinyl chloride
bromodichloromethane
benzene
total
Aira
(ng/day)
2,100,000
1,250,000
620,000
960,000
470,000
290,000
110,000
27,000
12,000
7,500C
Waterb Foodc
(ng/day) (ng/day)
3,600 4,150
7,000 18,660
42,000 5,290
5,000
14,500 14,280
1,000 12,070
209,000
1,000
3,700
300f
Total(ng/day)
2,108,000
1,276,000
667,000
965,000
499,000
303,000
319,000
28,000
12.000
3,700
7,800
6,188,200
Potential BloodConcentration^
(ppb)
88
53
28
40
21
13
13
1.2
0.5
0.2
0.2
258.2
From Ref. 44, calculated on basis of 10,000 L/24 h respiration rate,
'prom Ref. 44, calculated on basis of 1 L/24 h intake.:From Ref. 47, calculated from FDA standard diet (Ref. 48).d,.Expected blood concentration is total daily intake divided by blood volume (8.000 mL) assuming 4half-lives/day.
'From Ref. 49, 50.
From Ref. 50.
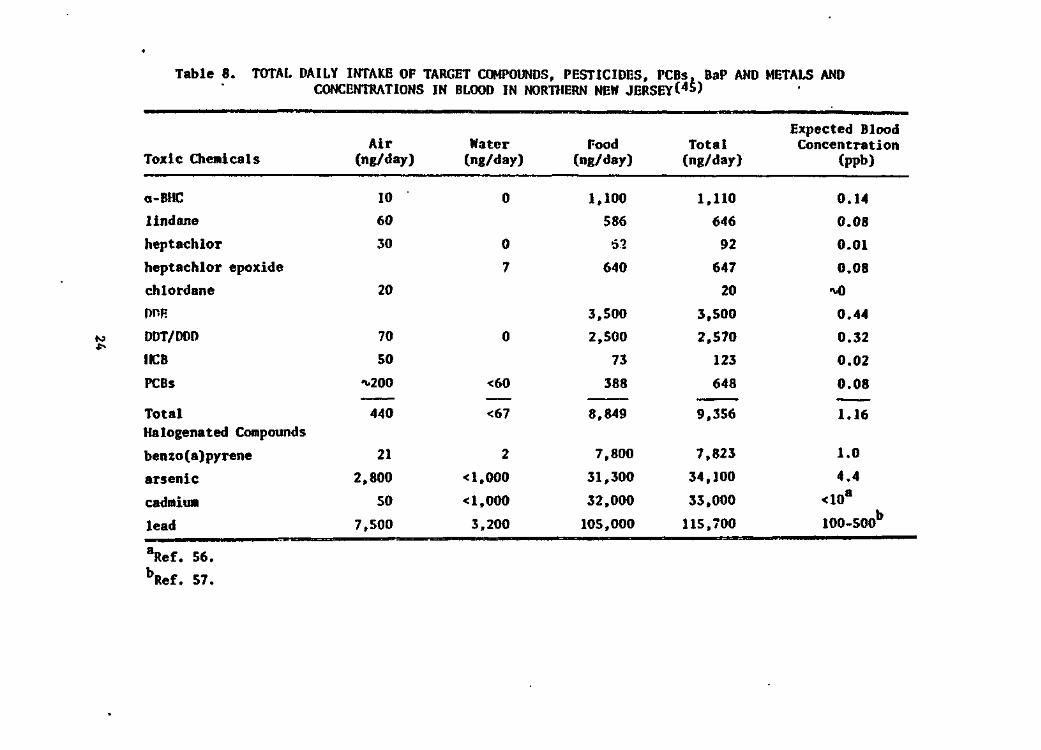
Table 8. TOTAL DAILY INTAKE OF TARGET COMPOUNDS, PESTICIDES, PCBs, BaP AND METALS ANDCONCENTRATIONS IN BLOOD IN NORTHERN NEW JERSEY(45>
to
Toxic Chemicals
a -BUG
lindane
heptachlor
heptachlor epoxide
chlordane
DHRDDT/ ODD
lO
PCBs
TotalHalogenated Compounds
benzo(a)pyrene
arsenic
cadmium
lead
Air(ng/day)
10
60
30
20
70
50
•x.200
440
21
2,800
50
7,500
Water(ng/day)
0
0
7
0
<60
<67
2
< 1,000
<1,000
3,200
Food(ng/day)
1,100
586
62
640
3,500
2,500
73
388
8,849
7,800
31,300
32,000
105,000
Total(ng/day)
1,110646
92
647
20
3,500
2,570
123
648
9,356
7,823
34,100
33,000
115,700
Expected BloodConcentration
(ppb)
0.14
0.08
0.01
0.08
*Q
0.44
0.32
0.02
0.08
1.16
1.0
4.4
<ioa
100-500b
Ref. 56.
'Ref. 57.
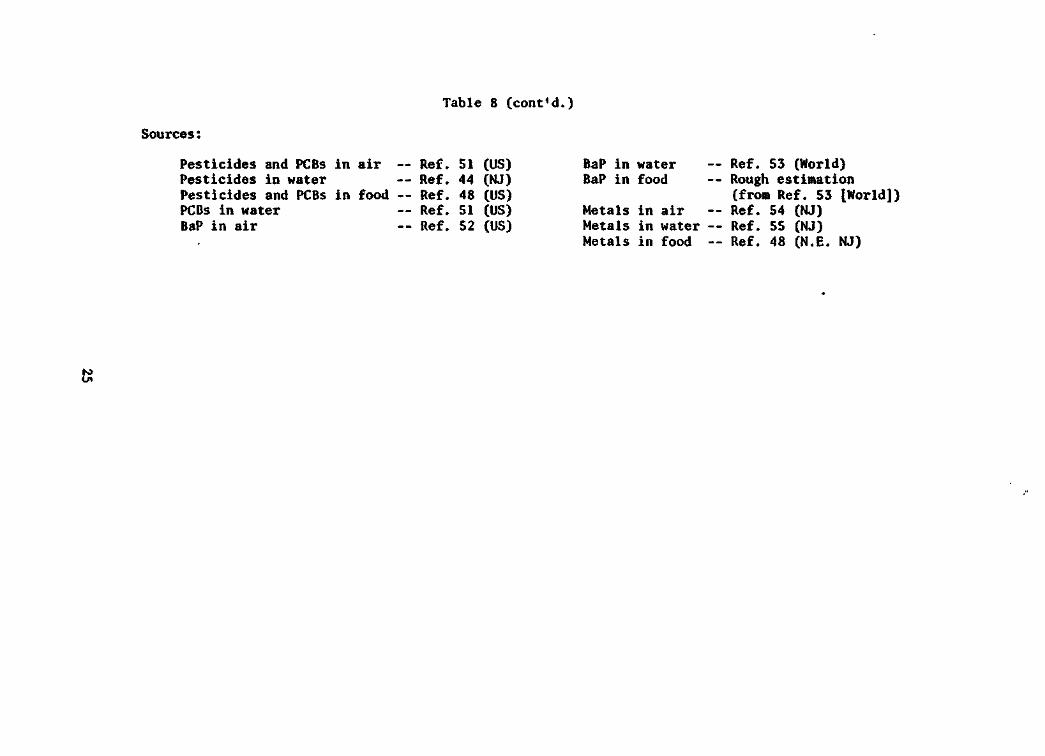
Table 8 (cont'd.)
Sources:
Pesticides and PCBs in air — Ref. 51 (US)Pesticides in water -- Ref. 44 (NJ)Pesticides and PCBs in food -- Ref. 48 (US)PCBs in water — Ref. 51 (US)BaP in air -- Ref. 52 (US)
BaP in waterBaP in food
Metals in airMetals in waterMetals in food
- Ref. 53 (World)•- Rough estimation
(from Ref. S3 [World])-- Ref. 54 (NJ)-- Ref. 55 (NJ)-- Ref. 48 (N.E. NJ)
10
BATON ROUGE, LOUISIANA
Baton Rouge was selected on the basis of extensive organic chemical
production (especially volatile halogenated hydrocarbons) as summarized in(43)Table 9. In addition, RTI has collected and analyzed ambient air samples
from this area and established the presence of a number of compounds of(43)interest in ambient air. A summary of the levels of halogenated compounds
found in water and air is presented in Table 10.
In addition to the industrial production in Baton Rouge, industries in
Flaquemine (15 km SSW), St. Gabriel (20 km SSE) and Geismar (27 km SSE) may
emit significant levels of chemicals which may contribute to the levels
observed in mother's milk in Baton Rouge. These industries and their produc-
tion are listed in Table ll.(36)
KANAWHA VALLEY, WEST VIRGINIA
Many manufacturers of organic chemicals are located in the Kanawha
Valley, WV. DuPont, near Belle, W, has a large chemical complex for the
synthesis of substances such as methylmethacrylate, methylamines, ammonia,
hydrogen cyanide, herbicides, and insecticides. In South Charleston are
production and consumption plants (Union Carbide, and FMC). Plastics, PVC,
antifreeze, chlorine, halogenated organics, carbon disulfide, peroxides,
etc., are the predominant chemicals produced here. The major industrial
facility in the town of Institute is Union Carbide, which also processes a
broad spectrum of compounds, e.g., viscose rayon and phthalate esters.
There is also a large-scale olefin processing complex and a rubber accelerator
plant. A major terminal loading facility in South Charleston bandies large
quantities of a variety of organic compounds. Monsanto, FMC, Allied, and
Fike have plants near Nitro for the production of antioxidants, rubber
accelerators, industrial chemicals, and other materials. Several other
chemical manufacturers, consumers, and transporters are located in the
Kanawha Valley, some or all of which may contribute to the presence of
organic materials in the ambient air or water and thus contribute to human
exposure.
Previous RTI sampling^3 >46'65>66) in the Kanawha Valley found a broad
range of halogenated, ketone, aldehyde, ester, aromatic, and aliphatic3
compounds. Quantitative results included high values in air of 11,000 ng/m
26
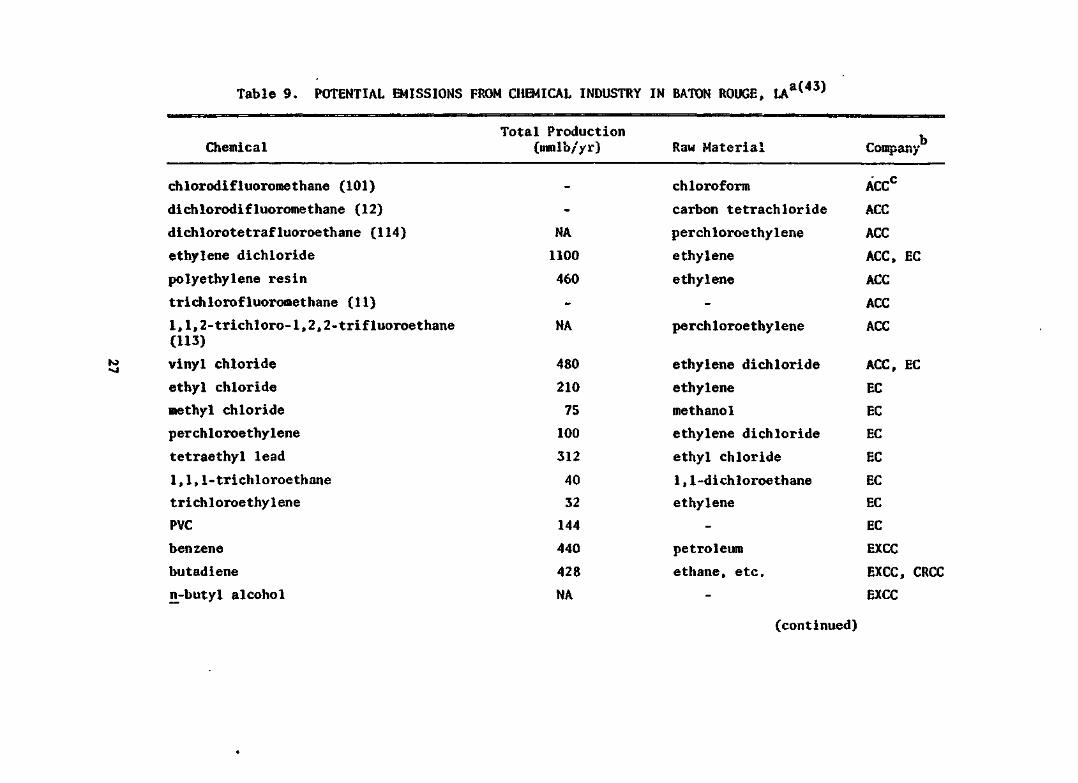
Table 9. POTENTIAL EMISSIONS FROM CHEMICAL INDUSTRY IN BATON ROUGE, LAa(43)
ChemicalTotal Production
(nimlb/yr) Raw Material Company
chlorodifluoromethane (101)
dichlorodifluoromethane (12)
dichlorotetrafluoroethane (114)
ethylene dichloride
polyethylene resin
trichlorofluoromethane (11)
1,1,2-trichloro-l,2,2-trifluoroethane(113)
vinyl chloride
ethyl chloride
methyl chloride
perchloroethylene
tetraethyl lead
1,1,1-trichloroethane
trichloroethylene
PVC
benzene
butadiene
n-butyl alcohol
NA
1100
460
NA
480
210
75
100
312
40
32
144
440
428
NA
chloroform
carbon tetrachloride
perchloroe thy1ene
ethylene
ethylene
perchloroethylene
ethylene dichloride
ethylene
methanol
ethylene dichloride
ethyl chloride
1,1-dichloroethane
ethylene
petroleum
ethane, etc.
AcerACC
ACC
ACC, EC
ACC
ACC
ACC
ACC, EC
EC
EC
EC
EC
EC
EC
EC
EXCC
EXCC, CRCC
EXCC
(continued)
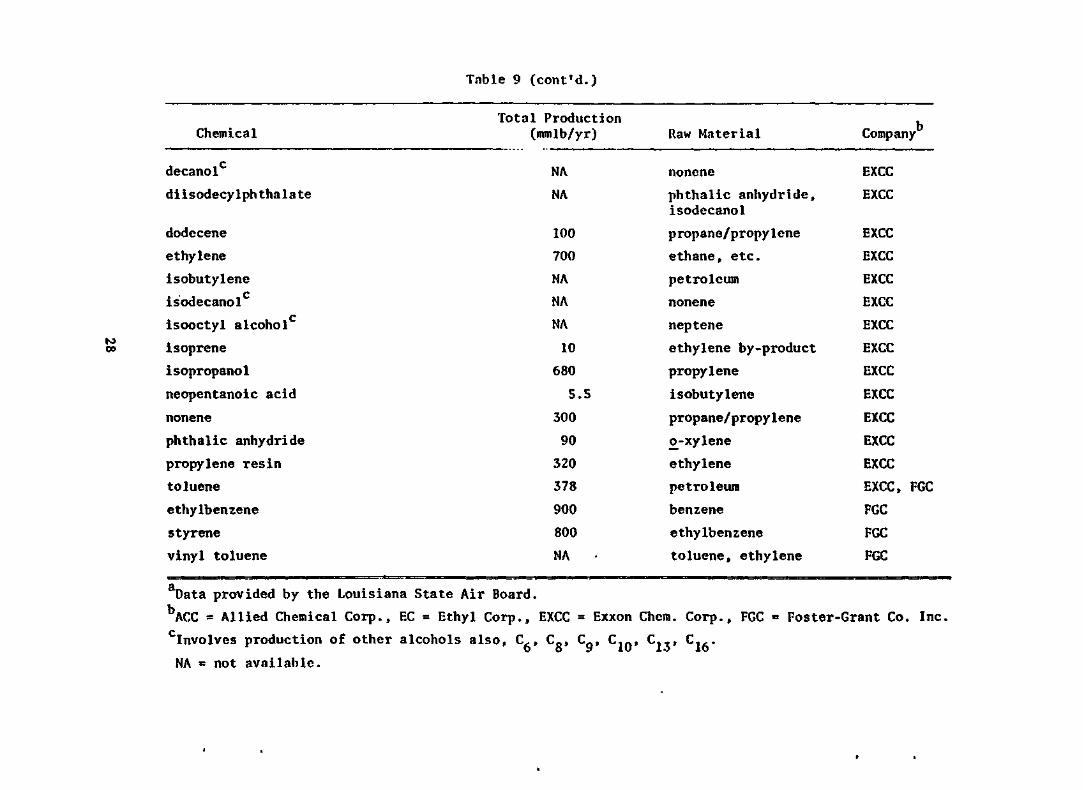
Table 9 (cont'd.)
ChemicalTotal Production
(mmlb/yr) Raw Material Company
to00
decanol
diisodecylphthalate
dodccene
ethylene
isobutylene£isodecanol
p
isooctyl alcohol
isoprene
isopropanol
neopentanoic acid
nonene
phthalic anhydride
propylene resin
toluene
ethylbenzene
styrene
vinyl toluene
NA
NA
100
700
NA
NA
NA
10
680
5.5
300
90
320
378
900
800
NA
nonene
phthalic anhydride,isodecanol
propane/propylene
ethane, etc.
petroleum
nonene
neptene
ethylene by-product
propylene
isobutylene
propane/propylene
£-xylene
ethylene
petroleum
benzene
ethylbenzene
toluene, ethylene
EXCC
EXCC
EXCC
EXCC
EXCC
EXCC
EXCC
EXCC
EXCC
EXCC
EXCC
EXCC
EXCC
EXCC, FGC
FGC
FGC
FGC
Data provided by the Louisiana State Air Board.
ACC = Allied Chemical Corp., EC = Ethyl Corp., EXCC = Exxon Chem. Corp., FGC = Foster-Grant Co. Inc.CInvolves production of other alcohols also, C,, C0, C , Cln, C._, C.,.u o y iu j.o it)NA = not available.
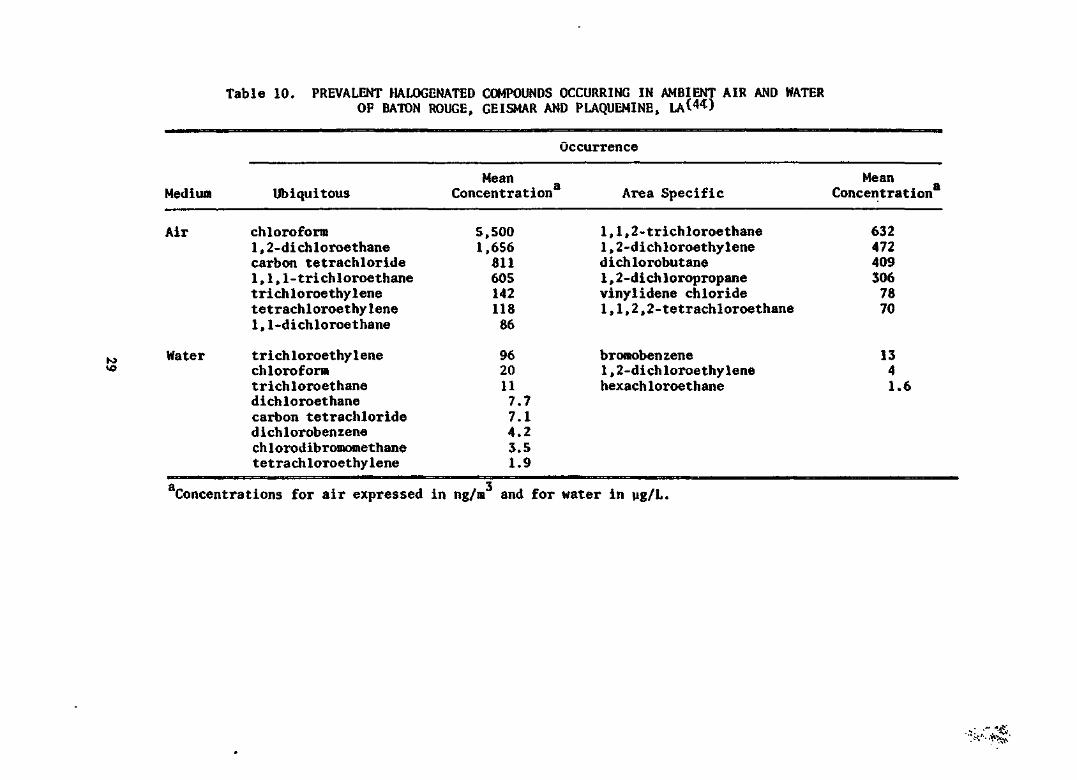
Table 10. PREVALENT HALOGENATED COMPOUNDS OCCURRING IN AMBIENT AIR AND WATEROF BATON ROUGE, GEISMAR AND PLAQUEMINE,
Occurrence
Medium UbiquitousMean
Concentration' Area SpecificMean
Concentrationa
Air
rovo
Water
chloroform1,2-dichloroethanecarbon tetrachloride1,1,1-trichloroethanetrichloroethylenetetrachloroethylene1,1-dichloroethane
trichloroethylenechloroformtrichloroethanedichloroethanecarbon tetrachloridedichlorobenzenech1orod ibromomethanetetrachloroethylene
5,5001,656
Sll60514211886
9620117.77.14.23.51.9
1,1,2-trichloroethane1,2-dichloroethylenedichlorobutane1,2-dichloropropanevinylidene chloride1,1,2,2-tetrachloroethane
bromobenzene1,2-dichloroethylenehexachloroethane
6324724093067870
1341.6
a 3Concentrations for air expressed in ng/m and for water in pg/L.
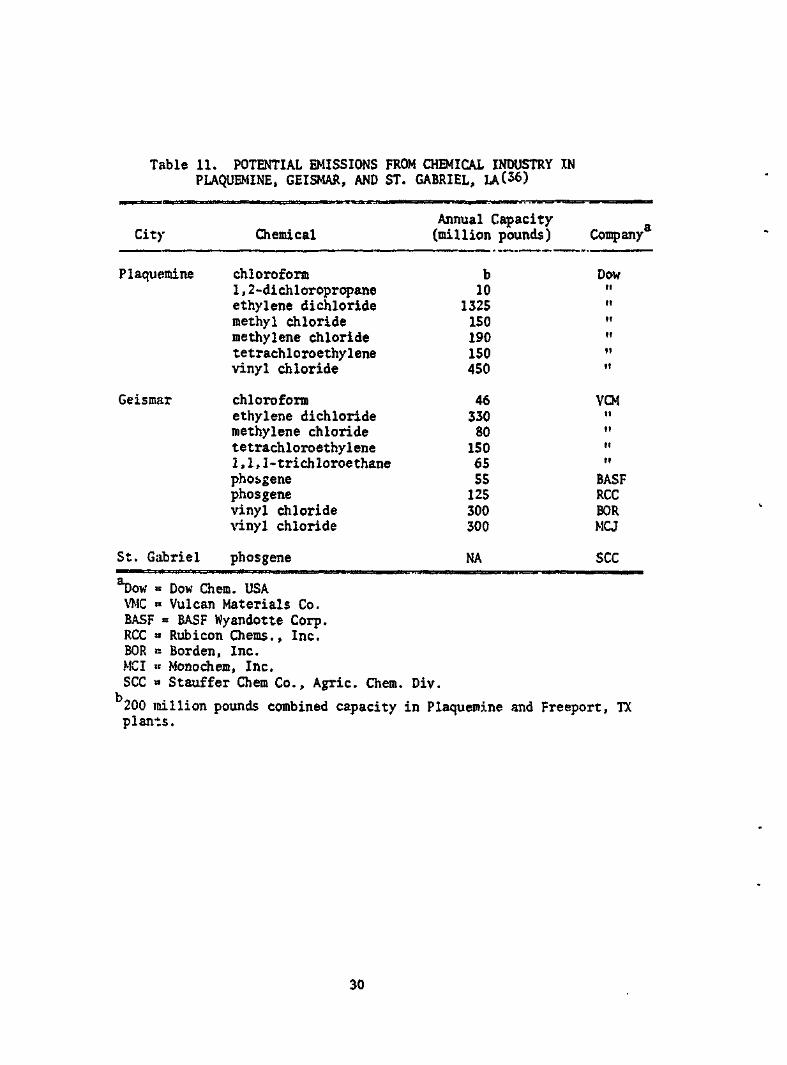
Table 11. POTENTIAL EMISSIONS FROM CHEMICAL INDUSTRY INPLAQUEMINE, GEISMAR, AND ST. GABRIEL, LA(36)
City
Plaquemine
Chemical
chloroform1 , 2-dichloropropaneethylene dichloridemethyl chloridemethylene chloridetetrachloroethylenevinyl chloride
Annual Capacity(million pounds)
b10
1325150190150450
Company
DowititiiMiiii
Geismar chloroformethylene dichloridemethylene chloridetetrachloroethylene1,1,1-trichloroethanephosgenephosgenevinyl chloridevinyl chloride
St. Gabriel phosgene
46330801506555125300300
NA
VCM
BASFRCCBORMCJ
SCC
Dow « Dow Chem. USAVMC ~ Vulcan Materials Co.BASF = BASF Wyandotte Corp.RCC «= Rubicon Chems., Inc.BOR « Borden, Inc.MCI « Monochem, Inc.SCC « Stauffer Chem Co., Agric. Chem. Div.
200 million pounds combined capacity in Plaquemine and Freeport, TXplants.
30
3 3for methylene chloride, 1500 ng/m for tetrachloroethylene, and 72,000 ng/m
for benzene. Compounds identified in the air particulate fraction included
.long-chain alkanes, polycyclic aromatic hydrocarbons (PAH) from naphthalene
through anthanthrene (or an isomer), alkyl-PAH derivatives, and nitrogen-con-
taining heterocycles.
31
SECTION 5
SAMPLE COLLECTION
At each of the five sites, arrangements were made to work through
clinical facilities to recruit a suitable panel of respondents. These
facilities included the Bayonne Hospital in Bayonne, NJ; the Medical Center
Hospital in Jersey City, NJ; Magee-Women's Hospital in Pittsburgh, PA;
Charleston Area Medical Center in Charleston, WV; and the East Baton Rouge
Parish Health Clinic in Baton Rouge, LA.
Advance arrangements were made through a contact person at each facility.
This person was responsible for recruiting a professional member of the
facility's staff to serve as the data collector. The data collector was
usually & registered, licensed practical, or public health nurse associated
with the facility.
Respondents were paid $5 for their assistance in providing a milk
sample and completing the survey questionnaire.
The data collection effort is discussed in the following sections.
OMB CLEARANCE
Under the Federal Reports Act, clearance for the study of human subjects
must be obtained from the Office of Management and Budget. This clearance
was obtained on October 18, 1978. The OMB number is 158-578010. This study
was approved with the understanding that: (1) the surveys were conducted as
a pretest of the feasibility of information collection procedures; (2) the
information collected will not be used to generalize to either local areas
or the nation as a whole. These two caveats were invoked since the sample
size was small and a nonprobability sampling method (subject selection) was
used.
32
TRAINING
Before data collection began at a site, a training session was held to
acquaint the facility contact person and data collector(s) with the survey.
The session addressed the study objectives; use of the data collection
instruments; administrative instructions; quality control procedures; and
instructions for collecting, packing, and shipping milk samples to RTI. The
training was conducted by an RTI survey specialist from the Survey Operations
Center. A detailed manual and necessary field reporting forms were developed
for use in these sessions. All training was conducted at the participating
facility and lasted approximately 4 hours.
SURVEY INSTRUMENTS
Three data collection instruments (see Appendix A) were developed for
use by the data collectors. The Participant Consent Form (FCF) was used to
introduce the study, explain the study objectives and requirements of partici-
pation, present the confidentiality procedures, and obtain consent of partici-
pant. This form was signed by the respondent, who retained a copy for her
files. The original was attached to the data collection instrument and a
second copy was filed in the respondent's hospital record.
The Participant Listing Form (PLF) provided a means of assigning unique
numbers to participants at each performance site. The data collector comple-
ted this form as each participant was solicited; the form was returned to
RTI with the completed questionnaires when work at the site was finished.
The Study Questionnaire (SQ) was the primary data collection instrument.
Information concerning participant demographic characteristics, residence
information, health data, use of medications, and personal characteristics
was obtained through this document. The SQ was administered after patients
had been screened and prior to collection of the milk sample.
PARTICIPANT SCREENING
Potential participants (lactating women) were screened by the data
collector to determine whether or not they met certain study criteria, which
included:
33
ability and desire to provide a milk sample of approximately
100 ml.
permanent residence within the area of interest for
at least the preceding 12 months, and
no travel outside the area of interest for the seven days
preceding sample collection.
After potential participants were screened, 10 women who met all the criteria
for participation were asked to provide a milk sample and complete the SQ.
PLF, PCF, AND SQ COMPLETION PROCEDURES
When an eligible person agreed to participate, her name was listed on
the PLF anci she was assigned a unique participant number. The data collector
then read the information contained on the PCF to the participant while she
followed along using a second copy. After answering questions or handling
problems, the data collector asked the participant to sign the PCF prior to
administration of the SQ.
The data collector then completed the SQ by asking the questions directly
to the participant. Completion time averaged 15 minutes. An adhesive,
computer-generated ID label was affixed to the SQ; a duplicate label was
provided to be used for identifying the milk sample bottle.
Each participant was a self-respondent unless she was under 18 years of
age, in which case the SQ could have been administered in whole or part to
the parent or guardian, but in the participant's presence.
SAMPLE COLLECTION PROCEDURES
After completion of the SQ, the data collector made the necessary
arrangements for the participant to provide the milk sample. A collection
bottle was taken from the shipping box and the adhesive ID label was affixed
to the bottle. The milk was manually expressed directly into the bottle; no
breast pumps or other devices were allowed. Immediately after the milk was
collected, the bottle was capped and the sample frozen until all ten samples
were collected and ready for shipment to RTI. A minimum of 60 ml (half-full
bottle) was required for each sample. If insufficient milk was collected,
the sample was discarded and an additional subject was added to the study.
34
SHIPPING PROCEDURES
Sample bottles were packed in the shipping container, cooled with dry
ice, and sent directly to RTI via Federal Express.
35
SECTION 6
SAMPLE ANALYSIS METHODS
The milk samples were analyzed using gas chromatography/mass spectrome-
try/cornpute:r. Due to the broad range of volatilities, the samples were
partitioned into two general classes of compounds: volatiles (e.g. benzene,
chloroform) and semivolatiles (e.g. PCNs, PCBs, pesticides). The analytical
protocols developed for the volatile and semivolatile components in mother's
milk are reproduced in Appendices B and C, respectively. The experiments
conducted which led to these protocols are discussed below.
DEVELOPMENT OF ANALYTICAL PROTOCOL FOR VOLATILES
The headspace purge technique was validated by determining the recovery
of four model compounds from raw cow's milk samples. Compounds labeled with
carbon-14 were chosen in order to examine both the amounts recovered on
Tenax GC and the amounts remaining in purged samples.
Twelve 50 mL cow's milk samples were spiked with methanol solutions of14the C-compounds. The analysis for each of the four model compounds was
performed in triplicate. In addition, standards were prepared in triplicate
by adding the appropriate amount of each compound in solution to a scintilla-
tion-counting vial containing 15 mL of Triton X/toluene/Omnifluor scintilla-
tion "cocktail." Milk samples were purged as described in Appendix B; Tenax
cartridges were stored, and aliquots of the purged samples were retained for
oxidation and counting.
Tenax cartridges were desorbed at 270°C and 30 mL/min N. for 10 minutes
into 15 ml, of Triton X cocktail in tandem scintillation vials. The vials
were capped and refrigerated until scintillation counting. An aliquot (1
mL) of each purged milk sample was oxidized in the Packard Tricarb Sample
Oxidizer, which converted all carbon-containing compounds to carbon dioxide14and water. The C-carbon dioxide was collected in a trapping solution and
36
referenced to a quench correction curve. All standards, Tenax samples and
oxidized milk samples were counted on a Packard Liquid Scintillation Counter
with automatic standardization. Counting data was analyzed by computer to
obtain the number of disintegrations per minute (dpm) for each vial. The
percent recovery was calculated for each milk sample as shown below:
1 rocov-rv - dpm in first vial + dpm in second vial . ~* ^ ~ average dpm added to triplicate standards *
The second of the tandem scintillation vials contained <2 percent of the14radioactivity in every case. The amounts of C compounds retained in the
purged sample was calculated:
v retained = dpm in oxidized, purged sample ,QQ«* average dpm added to triplicate standards * x *
The data are tabulated in Table 12. The recoveries for the volatile chloro-
form and carbon tetrachloride were about 90 percent, as expected. The
less-volatile chlorobenzene and bromobenzene exhibited correspondingly
poorer recoveries. These compounds are generally considered only marginally
purgeable from water, so these results from milk are not surprising.
The methodology validation experiment indicated that the proposed
method of analyzing human milk for volatile organic compounds was adequate.
Sensitivity and detection limits were determined by the capabilities of the
GC/MS/COMP system.
DEVELOPMENT OF ANALYTICAL PROTOCOL FOR SEMIVOLATILES
The extraction and cleanup method was validated using six model compounds
(2,4-dichlorophenol, pentachlorobenzene, 1,2,3,4-tetrachloronaphthalene,
4,4'-dibi:omobiphenyl, 2,2',5,5'-tetrabromobiphenyl, and octachloronaphthalene)
which were representative of the semivolatile (nonpurgeable) compounds of
interest. The compounds were spiked into raw cow's milk at a level of about
1 pg/mL. Raw cow's milk was chosen as the closest readily available analog
to mother's milk.
The results are presented in Table 13. The overall mean recovery was
about 70 percent and the mean of the relative standard deviations was 22
37
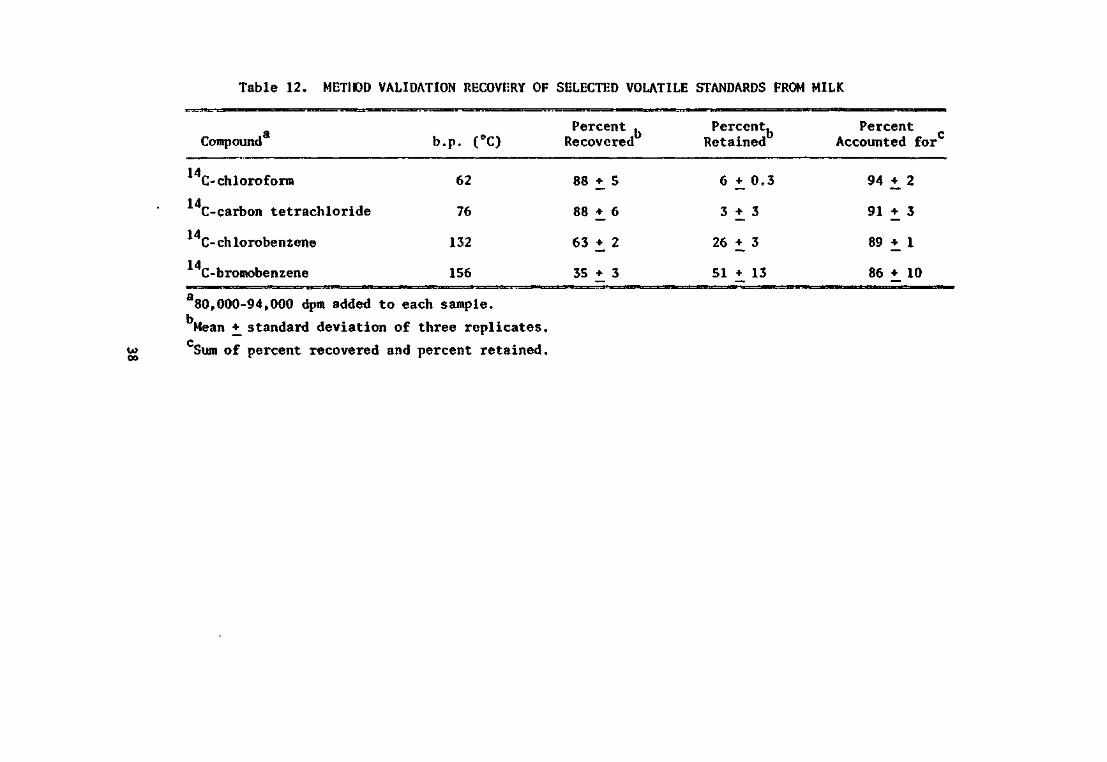
Table 12. METHOD VALIDATION RECOVERY OF SELECTED VOLATILE STANDARDS FROM MILK
14
14
14
14
aCompound
C- chloroform
C-carbon tetrachloride
C- ch lorobenzene
C-bromobenzene
b.p. (°C)
62
76
132
156
Percent .Recovered
88
88
63
35
+
+
+
+
5
6
2
3
Percent.Retained
6
3
26
51
+
+
+
+
0.3
3
3
13
PercentAccounted for
94
91
89
86
1 2
± 3
+_ 1
1 10
00CO
80,000-94,000 dpm added to each sample.3Mean +_ standard deviation of three replicates.•*
"Sum of percent recovered and percent retained.
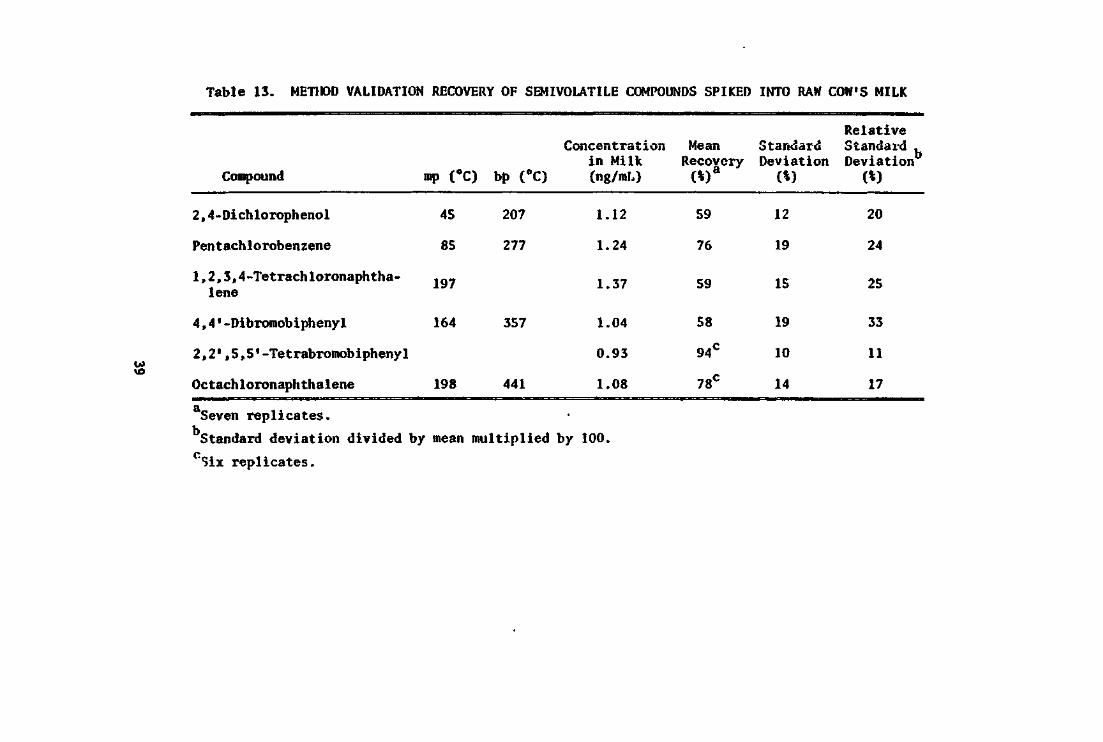
Table 13. METHOD VALIDATION RECOVERY OF SEMIVOLATILE COMPOUNDS SPIKED INTO RAW COW'S MILK
vo
Compound mp (°C) bp (°C]
2,4-Dichlorophenol 45 207
Pentachlorobenzene 85 277
1,2,3,4-Tetrachloronaphtha- ig_lene
4,4'-Dibromobiphenyl 164 357
2 , 2 ' , 5 , 5 ' -Tetrabromobipheny 1
Octachloronaphthalene 198 441
Concentrationin Milk
1 (ng/mL)
1.12
1.24
1.37
1.04
0.93
1.08
MeanRecovery
59
76
59
58
94C
78C
StandardDeviation
12
19
15
19
10
14
RelativeStandard ,Deviation
20
24
25
33
11
17
Seven replicates.
'standard deviation divided by mean multiplied by 100.
replicates.
percent. These results indicated that refinements in the method should be
considered prior to a large-scale study.
Two methods were available for removing fat and other nonvolatile
components of the milk extract: Florisil column chromatography and gel
permeation chromatography (GPC). Evaluation of the two techniques indicated
that the Florisil method was more suitable to this project. The Florisil
method was faster and had greater sample capacity than the GPC. In addition,
the GPC procedure required the use of a pumping system, UV detector, and
expensive, fragile GPC columns. Initial tests with both methods revealed
interference problems, although those with GPC were more severe. Using GPC,
decabromobiphenyl and hexabromobiphenyl eluted with the fat peak. This was
judged totally unsatisfactory. Using Florisil, some fat eluted in the
fraction with the compounds of interest, but repetition of the procedure
yielded samples sufficiently clean for analysis.
DEPARTURES :FROM THE ANALYTICAL PROTOCOLS
Emulsions
The formation of an emulsion during the toluene-acetone extraction of
semivolatiles (step 6, Appendix C) was an area of concern. Approximately 80
percent of the time an emulsion occurred. To eliminate this, three approaches
were taken with reasonable success. The first was to avoid the emulsion
formation by swirling rather than shaking the toluene and acetone extracts.
The second approach was to break the emulsion by adding Na.SO, and waiting.
Both the amounts of Na-SO, and the time required varied. In severe cases
emulsions were broken by filtering through glass wool wetted with toluene.
Lipid Removal Using Florisil
Problems were also encountered during the Florisil cleanup. Some
samples had a tendency to solidify while concentrating the ether/pentane
eluate, apparently due to abnormally high fat content. This usually occurred
when the sample volume reached 1-3 mL. The samples to which this happened
were diluted with pentane and eluted through another Florisil column. The
Florisil cleanup was repeated until the samples remained liquid at small
(<1.0 mL) volumes. Three cleanups was the maximum required for any sample.
40
GC/MS ANALYSIS PROCEDURES
Samples were analyzed by gas chromatography/mass spectrometry using an
LKB 2091 EI/CI GC/MS. Operating conditions for the analysis of purgeables
is given in Table 14 and the operating conditions for the extractables is
given in Table 15. Analysis of the purgeables involved the use of the
desorption apparatus described in Appendix B.
Quantitation of the unknowns was accomplished using relative molar
responses (RMRs) as discussed in Appendices B and C. The RMRs were calculated
from replicate determinations of known amounts of standards and analytes.
Qualitative Analysis
Initial identification of compounds by GC/MS involved comparisons of
unknown spectra with data compiled in the Eight Peak Index of Mass Spectra^ .
If the peaks present in the unknown spectra clearly matched the peaks of the
standard compound in the tables and the intensities were about the same,
then a positive identification was usually made. If peak intensities of
unknowns varied from those of the standards, and there were isomers of the
compounds that were not listed in the Eight Peak Index, then the compound
was listed as an "isomer."
Whea the background peaks interfered with the spectrum of an unknown to
an extent that made identification uncertain, the compound identification
was labeled as "tentative" (tent.). If no standard spectra similar to those
of the unknowns appeared in the mass spectral references, but fragments
characteristic of a certain class of compounds were identified, tentative
identifications were made on the basis of the characteristic fragments and
apparent molecular weights. These identifications were also labeled "tent".
Usually tentative identifications involved alkyl derivatives or homologs of
classes of compounds that were positively identified in the same sample.
Positive identifications, as well as some tentative identifications,
often required more detailed investigations of standard spectra in the
Registry of Mass Spectral Data or standard spectra found in other
literature such as scientific journals. The Registry of Mass Spectral Data
presents data in the form of histograms rather than as a list of peaks and
their intensities. This type of format allowed more subtle differences in
mass.spectra to be considered when several similar standard spectra in the
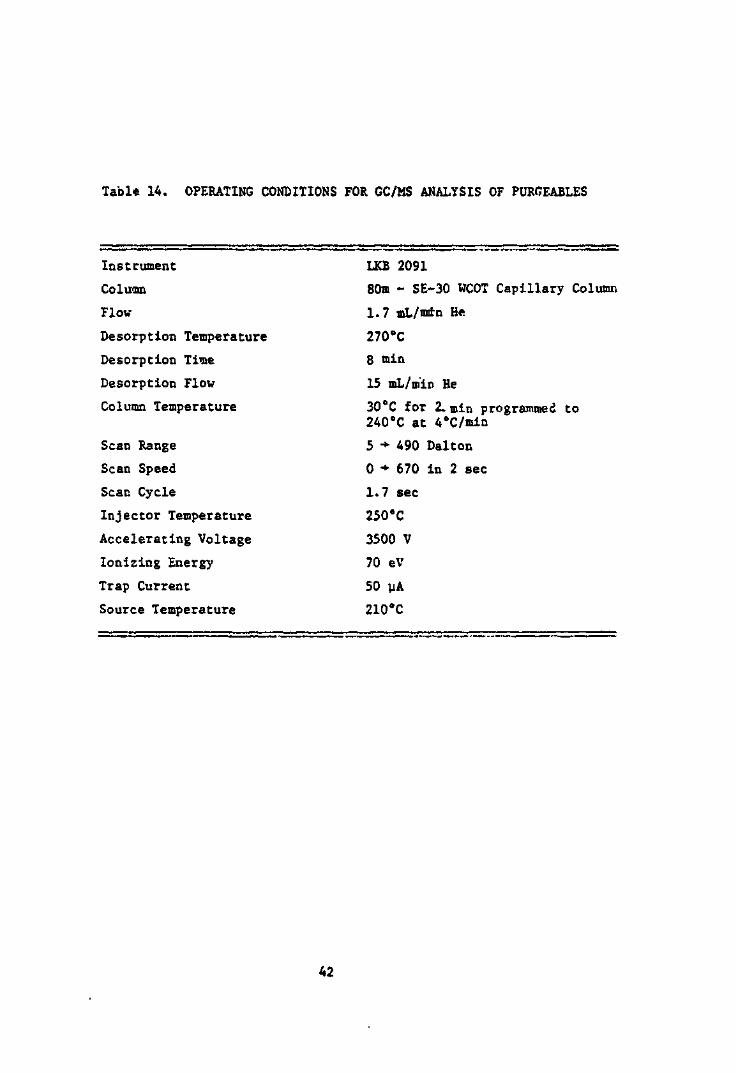
Table 14. OPERATING CONDITIONS FOR GC/MS ANALYSIS OF PURGEABLES
Instrument
Coluxnn
Flow
Desorption Temperature
Desorption Time
Desorption Flow
Column Temperature
Scan Range
Scan Speed
Scar Cycle
Injector Temperature
Accelerating Voltage
Ionizing Energy
Trap Current
Source Temperature
LKB 2091
80m - SE-30 WCOT Capillary Column
1.7 mL/imtn He
270°C
8 min
15 mL/m"in He
30°C for 2. min programmed to240°C at 4cC/min
5 •* 490 Dalton
0 •*• 670 in 2 sec
1.7 sec
250°C
3500 V
70 eV
50 yA
210°C
42

Table 15. OPERATING CONDITIONS FOR THE GC/MS ANALYSIS OFSEMIVOLATILES
Instrument LKB 2091
GC Column 25m SE-52 WCOT capillary column
Flow 1.5 mL/min with 15:1 split
Column Temperature 80°C for 3 min then 8°C/min to 265°C
Scan Range 5 •»• 530 Dalton
Scan Speed 2 sec 0 -*• 670 Dalton
Scan Cycle 2.4 sec
Injector Temperature 240°C
Accelerating Voltage 3500 V
Ionizing Energy 70 eV
Trap Current 50 UA
Source Temperature 210"C
Eight Peak Xndex appeared to represent possible candidates for unknown
identifications.
A large number of sample components remained unidentified. These unidenti-
fied components were labeled "unknown."
In order to quantify the degree of certainty with which a compound has
been identified, a "level" heirarchy has been established. The compound
identification criteria are listed below:
Level I Computer Interpretation. The raw data generated from theanalysis of samples are subjected to computerized decon-volution/library search. Compounds identified using thisapproach have the lowest level of confidence. In general LevelI is reserved for only those cases where compound verificationis the primary intent of the qualitative analysis.
Level II Manual Interpretation. The plotted mass spectra are manuallyinterpreted and compared to those spectra compiled in a datacompendium by a skilled interpreter. In general a minimum offive masses and intensities (±5 percent) should match between theunknown and the library spectrum. This level does not utilizeany further information such as retention time since theauthentic compound may not be available for establishingretention times.
Level III Manual Interpretation Plus Retention Time/Boiling Pointof Compound. In addition to the effort described underLevel II, the retention time of the compound is compared tothe retention time that has been derived from previous chro-matographic analysis. Also the boiling point of the identifiedcomponent is compared to the boiling points of other compoundsin the near vicinity of the one in question when a capillarycoated with a nonpolar phase has been used.
Level IV Manual Interpretation Plus Retention Time of Authentic Compounds.Under this Level, the authentic compound has been chromato-graphed on the same capillary column using identical operatingconditions and the mass spectrum of the authentic compound iscompared to that of the unknown.
Level V Level TV Plus Independent Confirmation Techniques. This Levelutilizes other physical methods of analysis such as GC/Fouriertransform infrared spectrometry, GC/high resolution massspectrometry, or nmr analysis. This Level constitutes thehighest degree of confidence in the identification of organiccompounds.
Unless otherwise stated, all identifications in this report were Level II.
44
SECTION 7
RESULTS
VOLATILES
All 42 of the purged samples were analyzed by thermal desorption/GC/MS.
The mass spectra from selected samples were interpreted manually to deter-
mine which compounds should be quantitated. From these data, selected
compounds were quantitated in all samples. All data were stored on magnetic
tape for subsequent processing and are routinely archived for at least 5
years.
Qualitative Identifications
Eight samples were interpreted. The results are presented in Appendix D.
Samples were selected according to the following criteria. At least two
samples were required from each collection site (Jersey City and Bayonne,
NJ, were counted as two separate sites). The total ion current chromatograms
were inspected and the samples with the greatest number of peaks or those
containing very intense unique peaks (not observed in other samples) were
selected. For those samples selected, all of the mass spectra were printed
and interpreted manually by experienced spectroscopists.
Table 16 summarizes the compounds found and their frequency of occurrence.
It is interesting to note that some compounds (e.£. 1,1,1-trichloroethane
and hydrocarbons.) are common air pollutants, others (e.g.., dibromochloro-
methane) are common water pollutants, others (dimethyldisulfide, furans,
aldehydes) appear to be metabolites, others (chlorofluorocarbons, siloxanes)
are known background interferents, and others (iodopentane) are of unknown
source.
Quantisation
Based upon the qualitative identifications summarized above, nine coo-
pounds were selected for quantitation in all of the samples. The results
for four compounds are summarized in Table 17. As discussed below, the
45
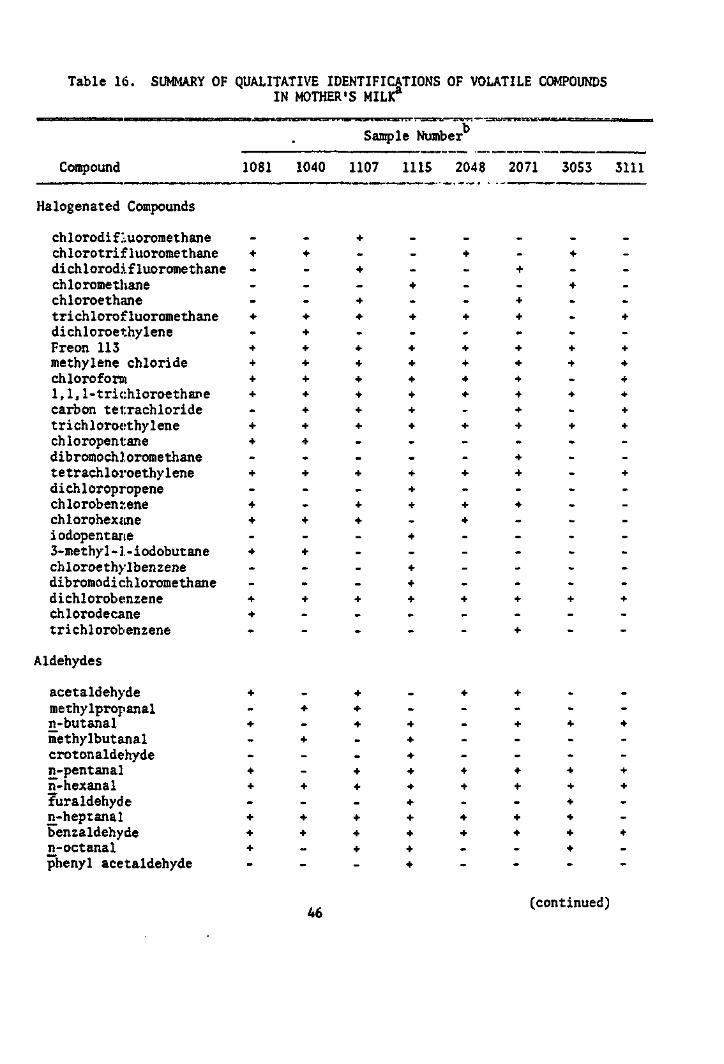
Table 16. SUMMARY OF QUALITATIVE IDENTIFICATIONS OF VOLATILE COMPOUNDSIN MOTHER'S MILK
Sample Number
Compound
Halogenated Compounds
chlorodif;.uoromethanechlorotrlfluoromethanedichlorodifluorome thanechlorome thanechloroethanetrichlorofluoromethanedichloroei:hyleneFreon 113methylene chloridechloroform1,1, 1-trichloroethanecarbon tetrachloridetrichloroethylenechloropentanedibromochloromethanetetrachloroethylenedichloropropenechlorobenzenechlorohexzineiodopentarie3-methyl-3.-iodobutanechloroethylbenzenedibromodichloromethanedichlorobenzenechlorodecanetrichlorobenzene
Aldehydes
acetaldehydemethylpropanaln-butanalmethylbutanalcrotonaldehydenj-pentanal£-hexanalfuraldehyden-heptanalbenzaldehyden-octanalphenyl acetaldehyde
1081
_
4
-
-
-4
-
4
4
4
4
-4
4
-4
-4
4
-
4
-
-4
4
-
4
-
4
-
-
4
4
-4
4
4
-
1040 1107 1115
4
4
4
4
4
4 4 4
4
4 4 4
4 4 4
4 4 4
4 4 4
4 4 4
4 4 4
4
. . .
4 4 4
4
- 4 4
4 4 -
4
4 - -
4
4
4 4 4. . .
. . .
4
4 4 -
- 4 4
4 - 4
- . 4
- 4 4
4 4 4
4
4 4 4
4 4 4
- 4 4
- - 4
2048
_
4
.
-
-4
-
4
4
4
4
-
4
-
-4
-
4
4
.
-
-
-4
--
4
-
--
-
4
4
-4
4
.
-
2071
_
-4
-4
4
-
4
4
4
4
4
4
.
4
4
-4
-
-
--
.
4
.
4
4
-
4
-
-
4
4
-4
4
-
-
3053
—
4
.
4
.
.
-
4
4
-4
-4
-
-
--
-
-
-
-
-
-4
--
_
-
4
--
4
4
4
4
4
4
-
3111
—_
---4
-
4
4
4
4
4
4
-
-
4
-
-
-
-
-
-
-4
-
-
.
-
4
-
-
4
4
-
-
4
--
(continued)46
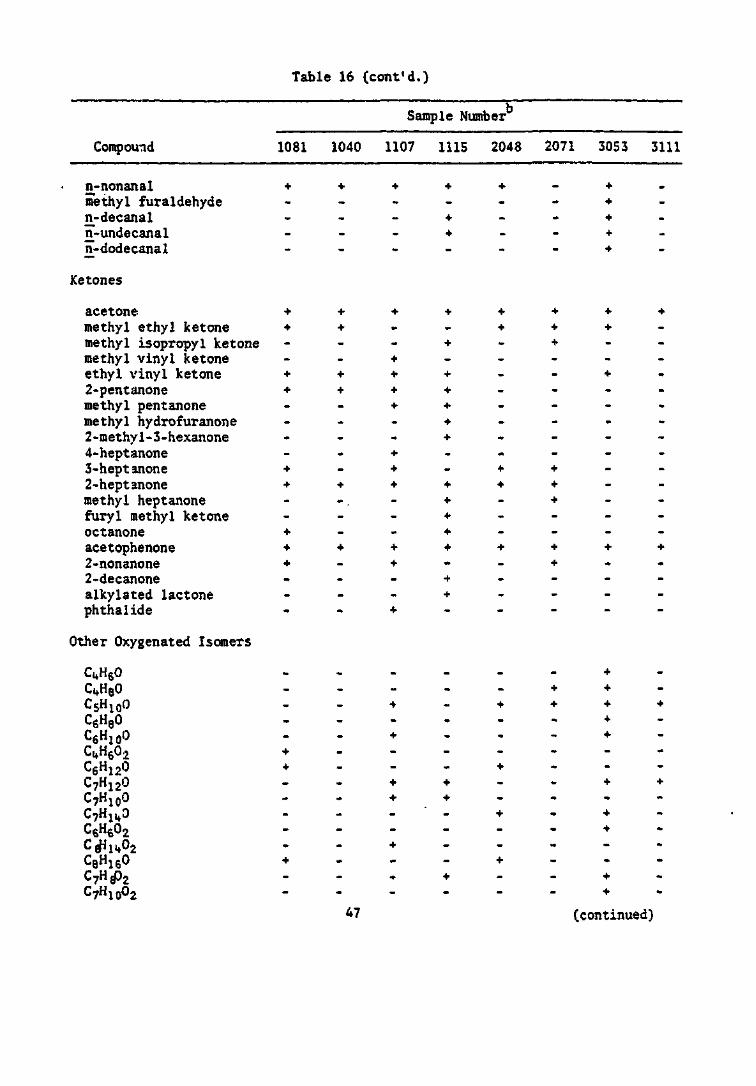
Table 16 (cont'd.)
Sample Number
Compou-id 1081 1040 1107 1115 2048 2071 3053 3111
n_-nonanal + + + + + - + -methyl furaldehyde . _ . . . . + .n-decanal . . _ + . - + _n_-undecanal _ _ _ + . - + _iv-dodecanal _ _ . . . - + .
Ketones
acetone + + H- + + + + +methyl ethyl ketone + + > _ + + + _methyl isopropyl ketone - - - + - + - -methyl vinyl ketone . . + . . - . .ethyl vinyl ketone + + + + _ . + ,2-pent£inone + + + + _ _ . _methyl pentanone _ _ + + _ _ - .methyl hydrofuranone . . _ + . _ . .2-methyl-3-hexanone . . . + . _ _ .4-heptanone _ . + . . - - .3-heptanone + . + _ * + . .2-heptanone + + + + + + . _methyl heptanone - - . - + - +furyl methyl ketone . . _ + . . . .octanone + _ . + . - . -acetophenone + + + + + + + +2-nonanone + _ + . . + . .2-decanone _ _ _ - h _ _ _ .alkylated lactone . . _ + _ - . -phthalide . . + . _ - _ _
Other Oxygenated Isomers
C5H100C6H80C6H100Ci,H602C6H120C7H120C7H100
C6H602
C^mOjC8H150
(continued)
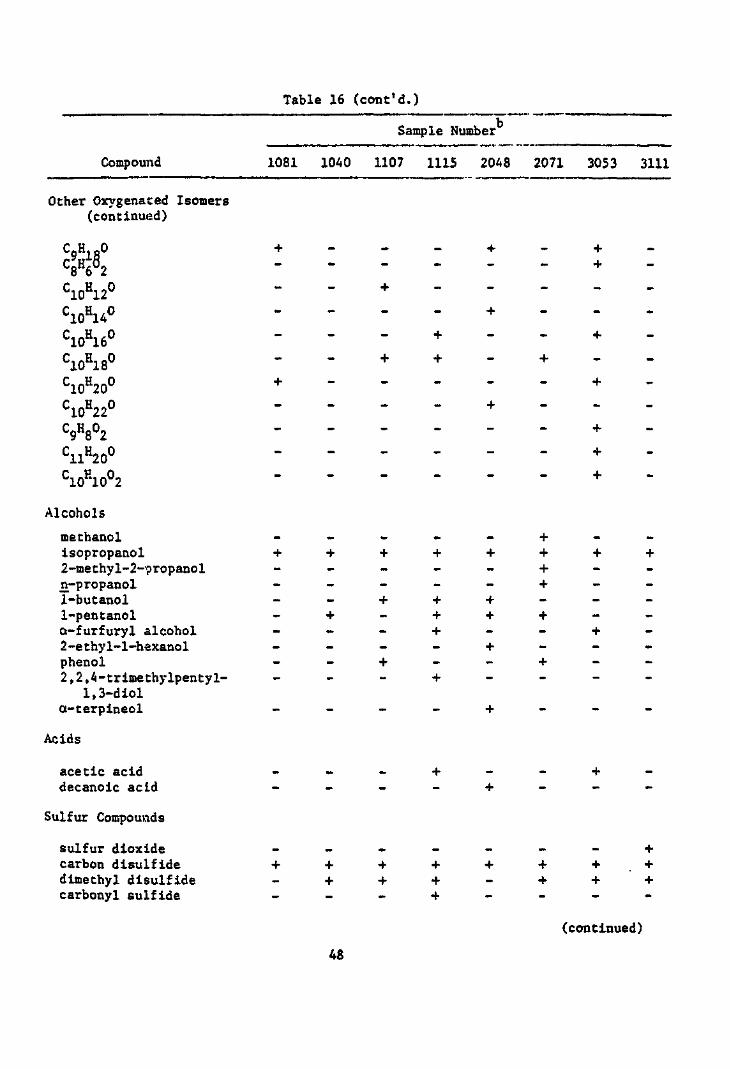
Table 16 (cont'd.)
Sample Number
Compound 1081 1040 1107 1115 2048 2071 3053 3111
Other Oxygenaced Isomers(continued)
C10H120 -
C10HU0 . . - _ + _ _
C10H160 -
C1£)H180 -
C10K20° + +
C10H220 -C9H8°2 . . . . . .CUH200 . . . . . .
C10E10°2 . . . . . . +
Alcohols
methanol _ _ _ . _ + - ,isopropanol + + + + + + + •2-methyl-2-'?ropanol _ _ _ _ _ + _ ,n.-propanol _ _ _ _ _ + _ .1-butanol - - + + + - - •1-pentanol - + - + + + - •o-furfuryl alcohol _ . _ + _ _ + .2-ethyl-l-hexanol _ _ _ _ + _ _ .phenol _ . + _ _ + _ .2,2,4-triiaethylpentyl- _ _ _ + _ _ _ .
1,3-diola-terpineol _ _ . _ + - - .
Acids
acetic acid _ . _ + _ _ + .decanoic acid _ _ _ _ + _ _ .
Sulfur Compounds
sulfur dioxide _ _ _ _ _ . - •carbon disuLfide + + -f + + + +dimethyl disulfide _ + + + _ + + •carbonyl sulfide _ _ . + _ _ _ .
(continued)
48

Table 16 (cont'd.)
Sample Number
Compound 1081 1040 1107 1115 2048 2071 3053 3111
Nitrogen Compounds
nitrome thane _ - + - . _ - - _C5H6N2 . . . + . . . .
C5H8N2 . . . + . . . .
C.H.N-0 _ _ - + _ _ - _4 4 2
methyl acetamide _ _ + . _ _ _ _benzonitrile - - + • * • - + - -methyl cinnoline _ _ - + _ - _ _
Esters
vinyl propionate - + + - f - - - -ethyl acetate . _ _ . _ + _ .ethyl-n-caproate _ _ _ _ _ + _ ,methyl caprylate _ _ _ - _ + - _ethyl caprylate . _ _ _ - + - -isoamyl formate _ + . - _ - - _methyl decanoate . _ _ _ _ + - _ethyl decanoate - _ _ . - + - -
Ethers
dimethyl ether _ + . _ _ - - -£-dioxane .. + _ - - _ -dihydropyran . _ + + . - - _
Epoxide
l,8-cin«ole . _ _ + - - _ _
Furans
furan _ . _ _ _ _ + -tetrahydrofuran _ _ + _ _ _ _ -methyl furan _ . _ + _ _ + _methyl tetrahydrofuran . + _ - - - - -ethylfuran _ . + + _ _ _ -dimethylfuran _ . _ 4 . _ _ - -2-vinylfuran . _ _ _ _ _ + -furaldehyde _ _ _ 4 . _ . + _2-n-butylfuran . + _ . _ _ _ -2-pentylfuran + + + + + + + -methylifuraldehyde _ _ _ - _ - + _furyl xaethyl ketone _ _ _ + _ _ _ _a-furfuryl alcohol - _ . + - . + -benzofuran - - + + - + - -
,_ (continued)
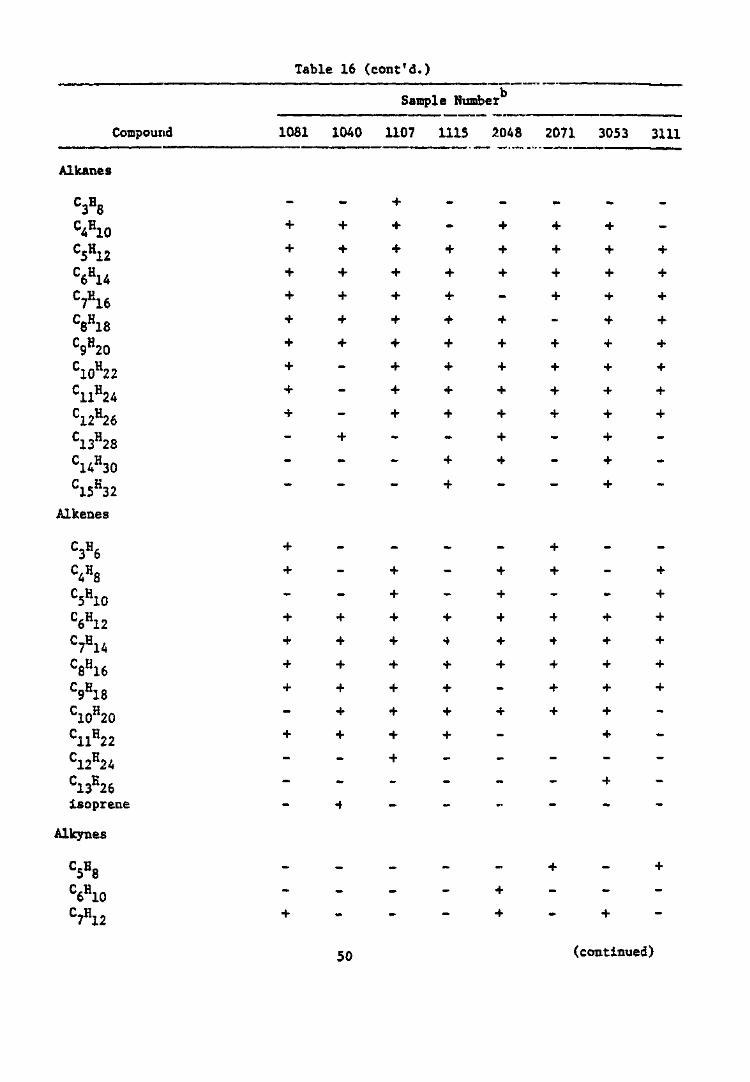
Table 16 (cont'd.)
Sample Number
Compound 1081 1040 1107 1115 2048 2071 3053 3111
Alkanes
C3H8 -
C4H1Q +
C5H12 + + +
CfiH14 +
C7E16 +
C8H18 +
C9H2Q +
C10H22 +
CUH24 +
C12H26 +r u _ 4 - _ _ J . _ 4 . _L13H28 * + +
C14H30 -C15K32 . . . + .. + .
Alkenes
C3H6 + . . . . + ..
C4H8 +
C5H1Q .. + . + . . +
CfiH12 4
CyHu +
CgH16 + + + + + + + +
CgH18 +p T J J _ L _ l _ _ f _ _ L _ LC1QH20 _ + + + + + + -
C11H22 + + + * *C12K24 - . + . . - - -C13K26 - - - - - - + -isoprene -f _ „ . . _ _ -
Alkynes
C5Hg . . . _ . + . +
C6H1Q . . . . + ...
C7H12
50 (continued)
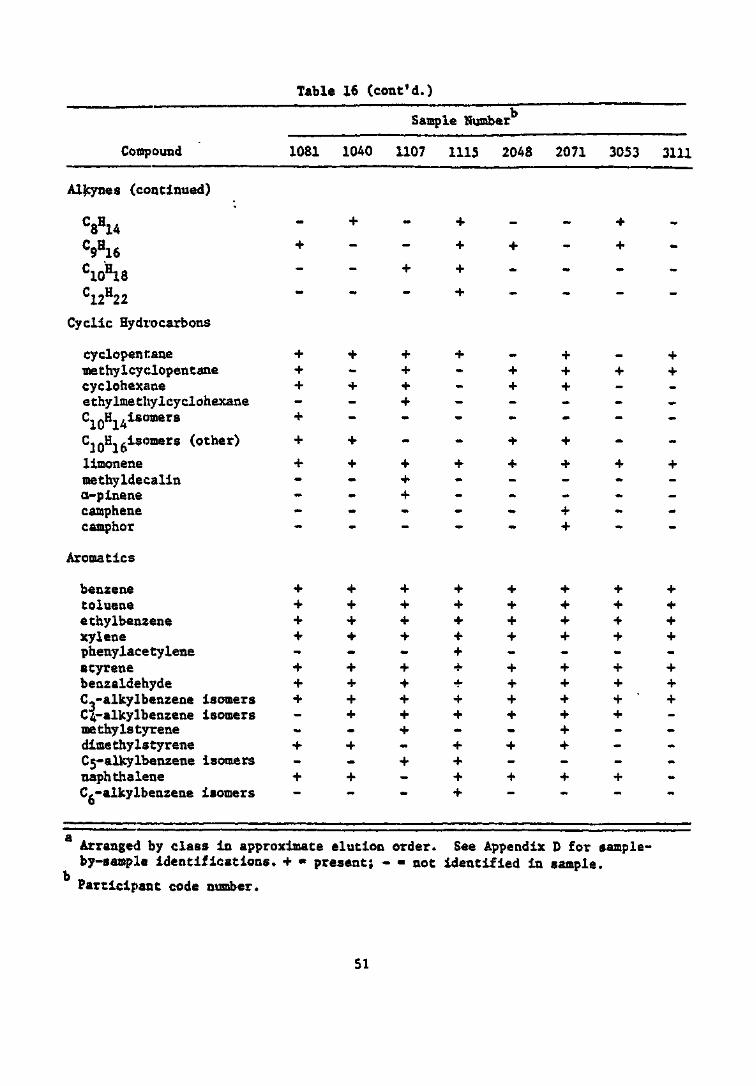
Table 16 (cont'd.)
Sample Number
Compound 1081 1040 1107 1115 2048 2071 3053 3111
Alkynes (continued)
C8H14 - + - + .. + .
C9Hlfi + - - + H-C10H18 - - + + . - - .C12H22 - . - + . . . .
Cyclic Hydrocarbons
cyclopentane + + + + - + - +methylcyclopentane + - + - + + + +cyclohexane + + + - + + --ethylmethylcyclohexane - _ + _ _ - - _C10H14is"mers + - - - - - - _C-0H.,isomers (other) + + _ - + + - _
limonene + + + + + + + +methyldecalin - _ + _ _ _ _ _a-pinene - _ + _ _ _ - _canphene . - - - • + - -camphor - . - . - + . _
Aromatics
benzene + + + + + + + +toluene + + + •)• + + + +ethylbenzene + + + + + + + +xylene + + + •<• + + + +phenylacetylene - - - + - - . -styrene + + + * + + + +benzaldehyde + 4 - + -«- + + + +C,-alkylbenzene isomers + + + + + + + ' +C4-alkylbenzene isomers - + + + + + + -methylstyrene - _ + . - + - .dimethylstyrene + + - + + + -C5-alkylbenzene isomers - _ + . » . _ . . _ _naphthalene + + - + + + + -Cg-alkylbenzene isomers - - - + - - - -
Arranged by class in approximate elution order. See Appendix D for sample-by-saaple identifications. + - present; - - not identified in sample.
bParticipant code number.
51
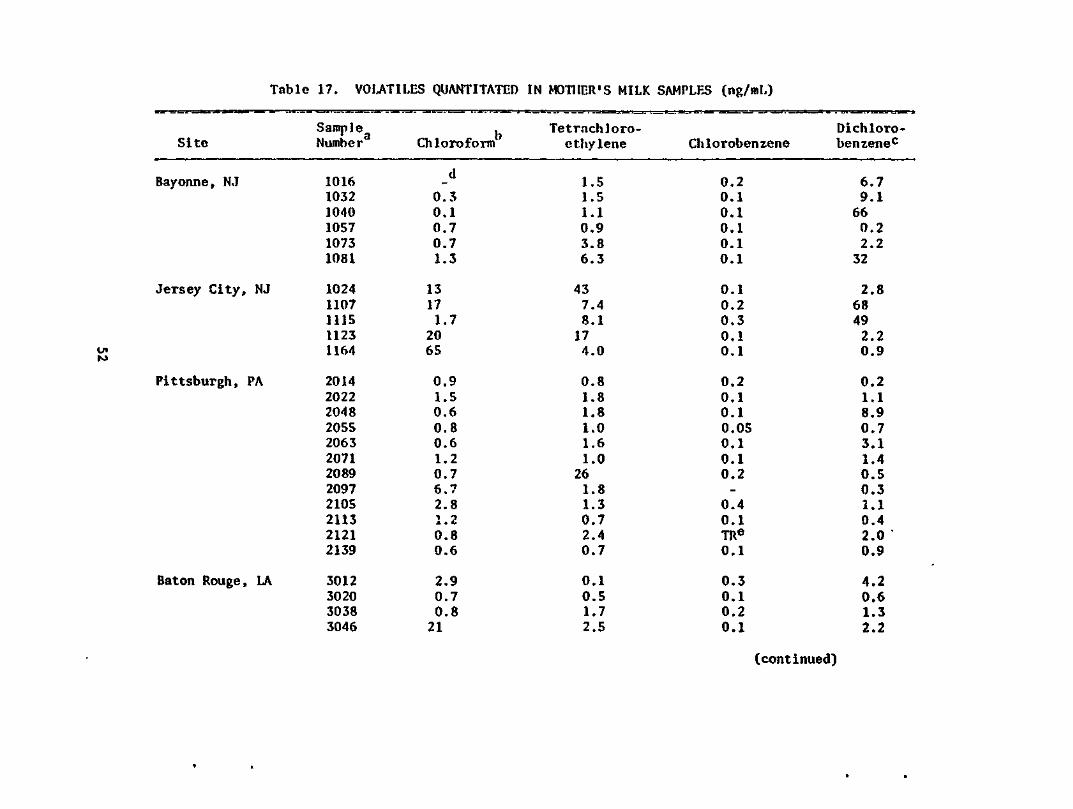
Table 17. VOLATILES QUANTITATED IN MOTHER'S MILK SAMPLES (ng/ml.)
tn
Site
Bayonne, NJ
Jersey City, NJ
Pittsburgh, PA
Baton Rouge, LA
SampleNumber'
101610321040105710731081
10241107111511231164
201420222048205520632071208920972105211321212139
3012302030383046
Chloroform1'
d
0.30.10.70.71.3
13171.72065
0.91.50.60.80.61.20.76.72.81.20.80.6
2.90.70.821
Tetrachloro-ethylene
1.51.51.10.93.86.3
437.48.1174.0
0.81.81.81.01.61.0261.81.30.72.40.7
0.10.51.72.5
Chlorobenzene
0.20.10.10.10.10.1
0.10.20.30.10.1
0.20.10.10.050.10.10.2-0.40.1TRe
0.1
0.30.10.20.1
Dichloro-benzenec
6.79.1660.22.232
2.868492.20.9
0.21.18.90.73.11.40.50.31.10.42.0 '0.9
4.20.61.32.2
(continued)
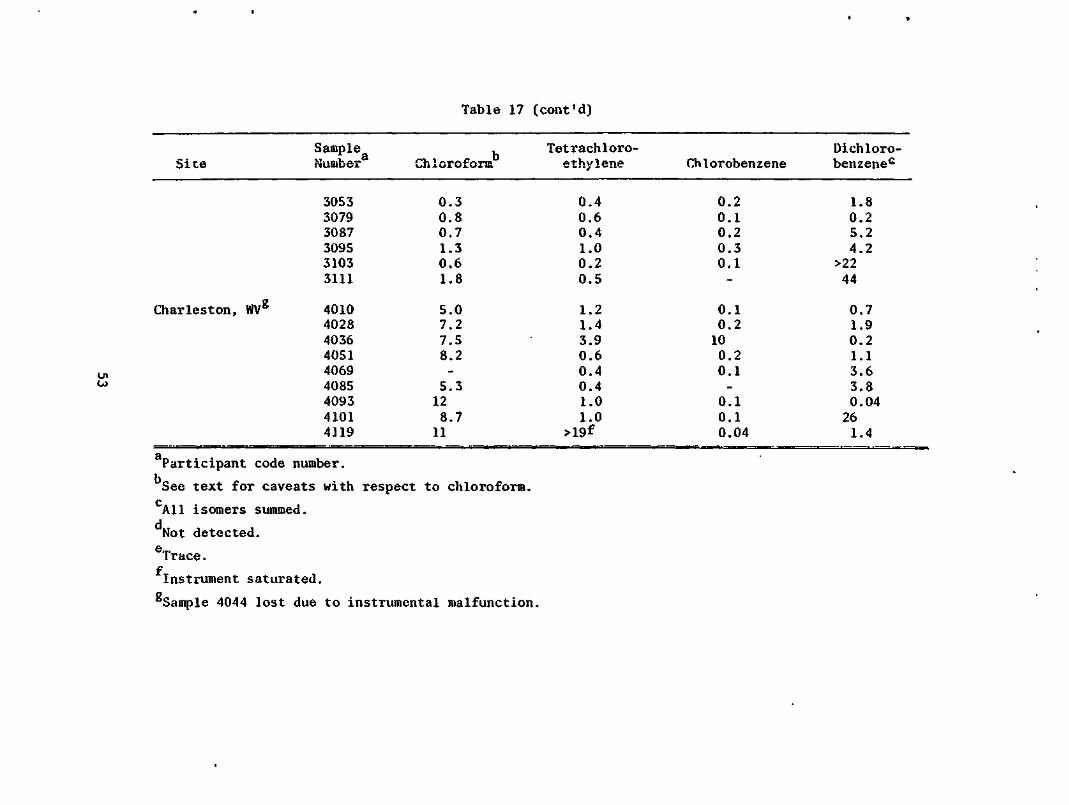
Table 17 (cont'd)
OJ
SampleSite Number3
305330793087309531033111
Charleston, WVg 401040284036405140694085409341014119
Chloroform
0.30.80.71.30.61.8
5.07.27.58.2-5.3128.7
11
Tetrachloro-ethylene
0.40.60.41.00.20.5
1.21.43.90.60.40.41.01.0
>19f
CMorobenzene
0.20.10.20.30.1-
0.10.2100.20.1-0.10.10.04
Dichloro-benzenec
1.80.25.24.2
>2244
0.71.90.21.13.63.80.04261.4
Participant code number.
See text for caveats with respect to chloroform.£*
All isomers summed.
Not detected.
Trace.
Instrument saturated.p
Sample 4044 lost due to instrumental malfunction.
quantitation of the other five compounds is not reported, since the levels
in milk were not judged sufficiently greater than background to be reliable.
Upon inspection, it is obvious that most values are low relative to
only a few high "outliers." These high values suggest that there is a
range of levels of these compounds which may correlate with exposure.
These results were analyzed statistically to determine if any of the values
correlated significantly. As can be seen in Table 18, the arithmetic mean
and median values generally are quite different. The arithmetic mean is
skewed toward the high end, generally due to one or two relatively high
values. A more realistic representation of the central data is the geometric
mean. These geometric mean values were tested for their significance
( .6., are the geometric means significantly different from site to site?).
Table 19 summarizes this data, prom this table, it appears that samples
from Jerse}' City have significantly higher levels of chloroform, tetrachloro-
ethylene, and dichlorcbenzene than the other study samples. Charleston
samples appear to have significantly higher levels of chloroform, and
Bayonne samples appear to have significantly higher levels of dichlorobenzene.
To test if any of the compound levels were related, the Spearman
correlation coefficients (nonparametric correlation based on the sample,
designed to lessen the weight of a single high outlier) were determined as
shown in Table 20. There does not appear to be any compound-to-compound
correlation among the subjects.
In interpreting these data, it must be remembered that this is a very
small data set. Therefore these data should not be used to extrapolate to
the city or area from which the samples were collected.
Quality Control
Table 21 presents the quality control results for chloroform, tetra-
chloroethylene, chlorobenzene, and dichlorobenzene. The very high recovery
of chloroform from the controls indicates either a miscalculation of the
amount actually spiked or contamination of the samples used as controls.
Since the procedural blanks contained about 15 times less chloroform, the
former explanation is most reasonable. However, the chloroform values
reported in Table 17 must be interpreted subject to the following
54
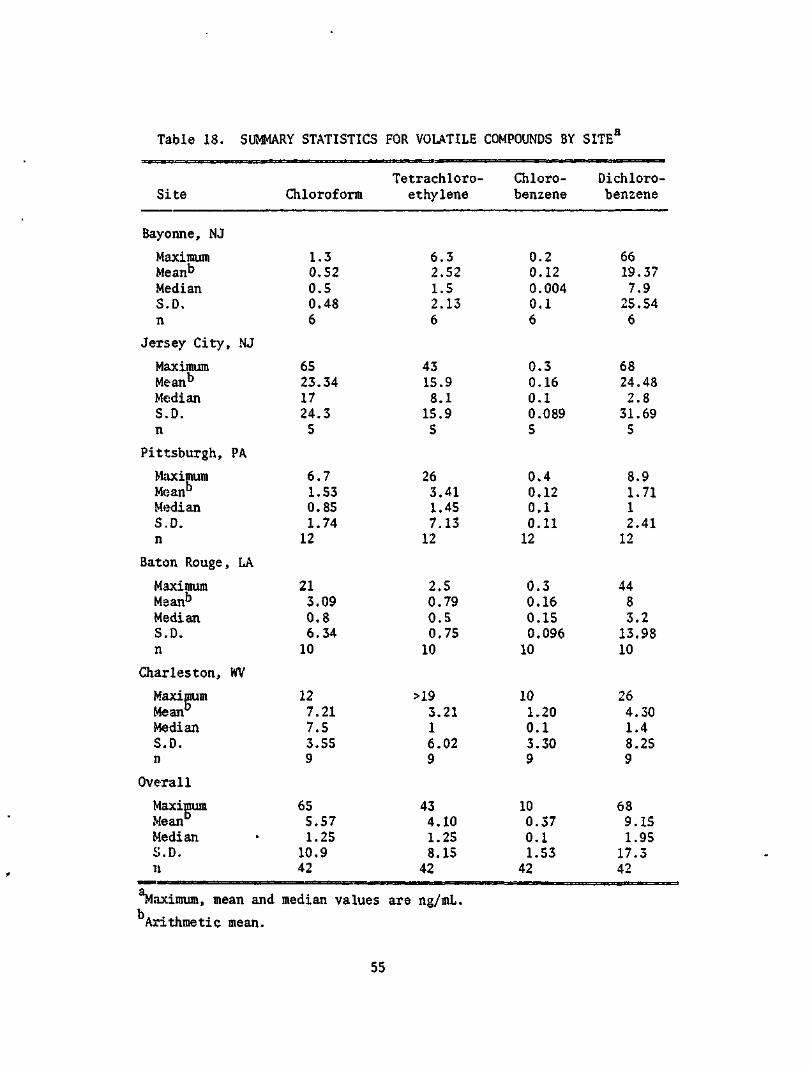
Table 18. SUMMARY STATISTICS FOR VOLATILE COMPOUNDS BY SITE
Site
Bayonne, NJ
MaximumMeanb
MedianS.D.n
Jersey City, NJ
MaximumMeanb
MedianS.D.n
Pittsburgh, PA
MaximumMeanb
MedianS.D.n
Baton Rouge, LA
MaximumMsanb
MedianS.D.n
Charleston, WV
MaximumMeanb
MedianS.D.n
Overall
MaximumMeanMedianS.D.n
Chloroform
1.30.520.50.486
6523.341724.35
6.71.530.851.7412
213.090.86.3410
127.217.53.559
655.571.25
10.942
Tetrachloro-ethylene
6.32.521.52.136
4315.98.115.95
263.411.457.1312
2.50.790.50.7510
>193.2116.029
434.101.258.1542
Chloro-benzene
0.20.120.0040.16
0.30.160.10.0895
0.40.120.10.1112
0.30.160.150.09610
101.200.13.309
100.370.11.53
42
Dichloro-benzene
6619.377.925.546
6824.482.831.695
8.91.7112.4112
4483.213.9810
264.301.48.259
689.151.95
17.342
Tlaximum, mean and median values are ng/mL.
Arithmetic mean.
55
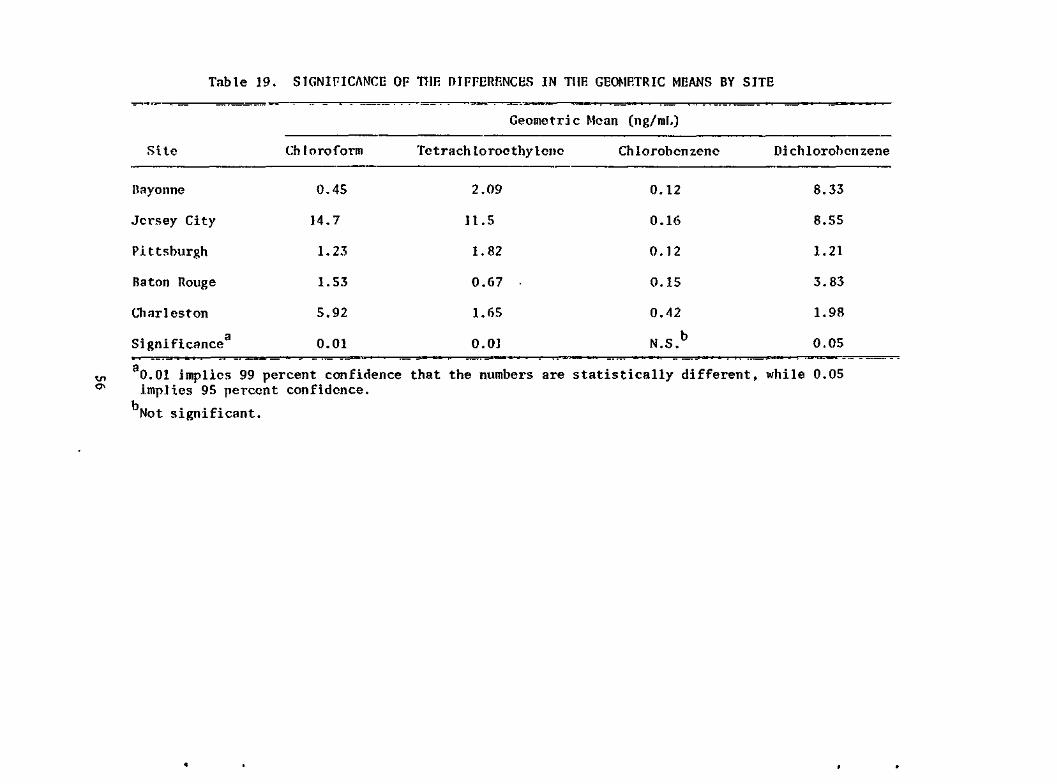
Table 19. SIGNIFICANCE OF THF. DIFFERENCES IN THE GEOMFTRIC MEANS BY SITE
Site
Nayonne
Jersey City
Pittsburgh
Baton Rouge
Charlestonrt
Significance
Ch loroform
0.45
14.7
1.23
1.53
5.92
0.01
Geometric
Tetrach loroethylcno
2.09
11.5
1.82
0.67
1 . 65
0.01
Mean (ng/mF,)
Chlorobcnzene
0.12
0.16
0.12
0.15
0.42
N.S.b
Di ch lorobcn zene
8.33
8.55
1.21
3.83
1.98
0.05
g
0.01 implies 99 percent confidence that the numbers are statistically different, while 0.05implies 95 percent confidence.
Not significant.
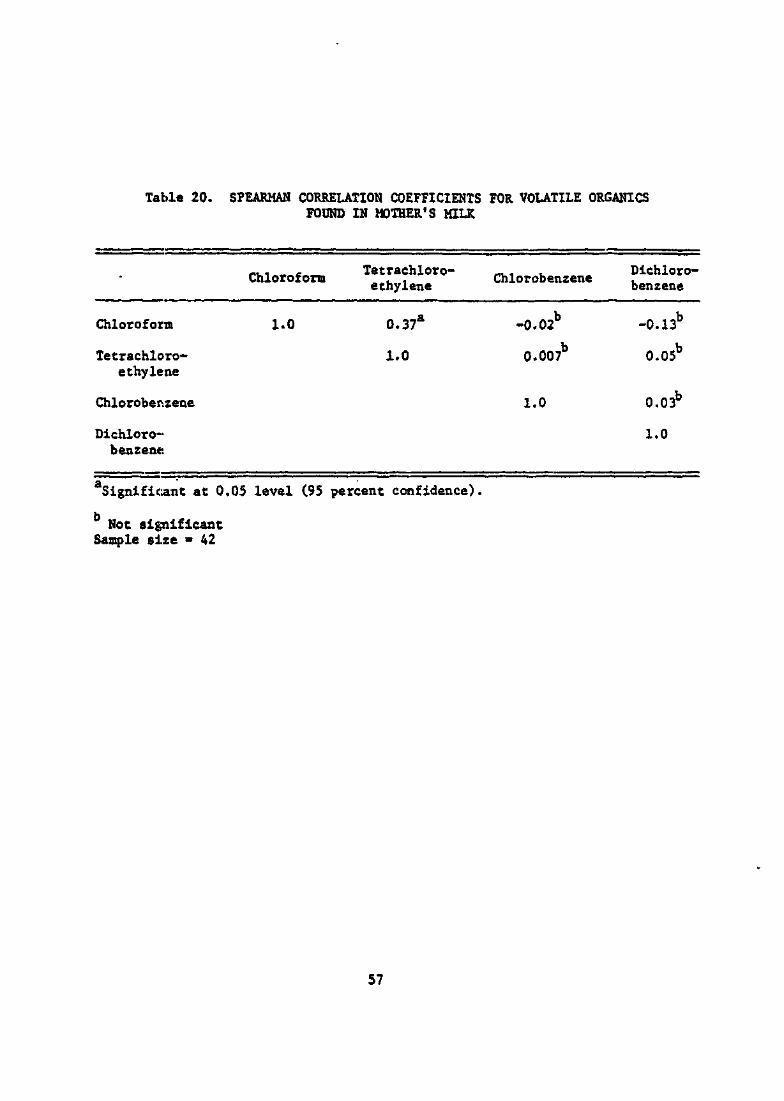
Table 20. SPEARMAN CORRELATION COEFFICIENTS FOR VOLATILE ORGANICSFOUND IN MOTHER'S MILK
... , , Tetrachloro- „. , , Dichloro-Chloroform . . Chlorobenzene ,ethylene benzene
Chloroform
Tetrachloro-ethylene
Chlorober.zene
Dichloro-benzene
1.0 0.37a -0.02b -0.13b
1.0 0.007b 0.05b
1.0 0.03b
1.0
Significant at 0.05 level (95 percent confidence).
b Not significantSample size - 42
57
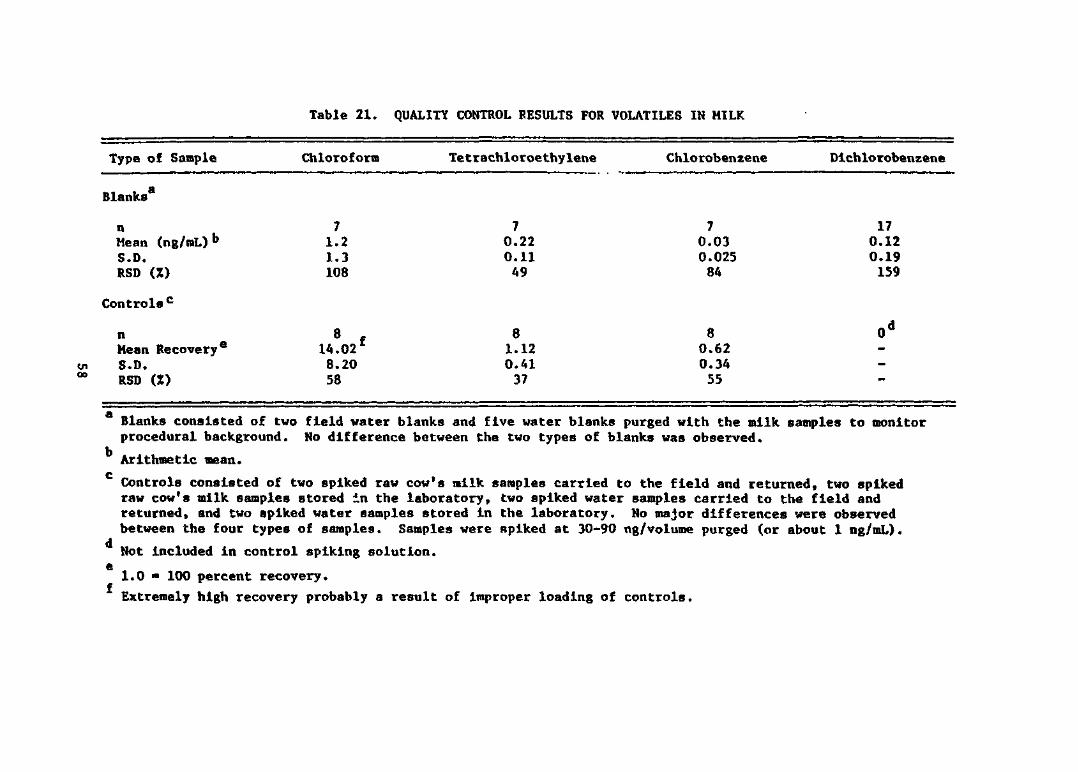
Table 21. QUALITY CONTROL RESULTS FOR VOLATILES IN MILK
Type of Sample
Blanksa
Chloroform Tetrachloroethylene Chlorobenzene Dichlorobenzene
Mean (ng/mL)b
S.D.RSD (Z)
Controls0
71.21.3108
70.220.11
49
70.030.025
84
170.120.19
159
Vnoo
Mean Recovery®S.D.RSD (Z)
14.028.2058
81.120.4137
80.620.3455
Blanks consisted of two field water blanks and five water blanks purged with the milk samples to monitorprocedural background. No difference between the two types of blanks was observed.
Arithmetic mean.
Controls consisted of two spiked raw cow's milk samples carried to the field and returned, two spikedraw cow's milk samples stored in the laboratory, two spiked water samples carried to the field andreturned, and two spiked water samples stored in the laboratory. No major differences were observedbetween the four types of samples. Samples were spiked at 30-90 ng/volume purged (or about 1 ng/mL).
Not included in control spiking solution.
1.0 • 100 percent recovery.Extremely high recovery probably a result of improper loading of controls.

considerations: the mean reported levels in the samples were only 4.9 times
the blank levels; the recovery from controls was about 1400 percent, invali-
dating the recovery study; and chloroform is known to be a laboratory atmos-
pheric contaminant.
The compounds presented in Table 17 represented significant levels
above the background in blanks. Several other compounds were quantitated
that did not exhibit substantial concentrations. These compounds, with the
ratio of the mean in the samples to the mean in the background given in
parenthesis, were: 1,1,1-trichloroethane (1:1), benzene (2:1), toluene
(2:4), trichloroethylene (1:2) and carbon tetrachloride (1:4). These levels
in the samples cannot be reliably assigned to either the milk sample or to
laboratory contamination. If these compounds are present in milk, they are
very low and cannot be regarded as significant, given the limitations of the
technique employed. Apparently, mother's milk does not represent a bioconcen-
tration matrix for these compounds.
SEMIVOLATILES
Three samples were fully interpreted, as presented in Appendix E. As
can be seen from the data, few compounds of interest were observed in the
mass spectra. The data were searched on the GC/MS data system for target
compounds (PCNs, PBBs and PCBs) using single ion plots called up from the
full data set. No evidence for any of these compounds was observed at a
detection limit of about 20 ppb. DDE was quantitated in five samples as
shown in Table 22. These values were in the range generally reported by
previous investigators (see Tables 2-4). Since none of the target compounds
were present in detectable quantities, no further identification or quantita-
tion was attempted.
59
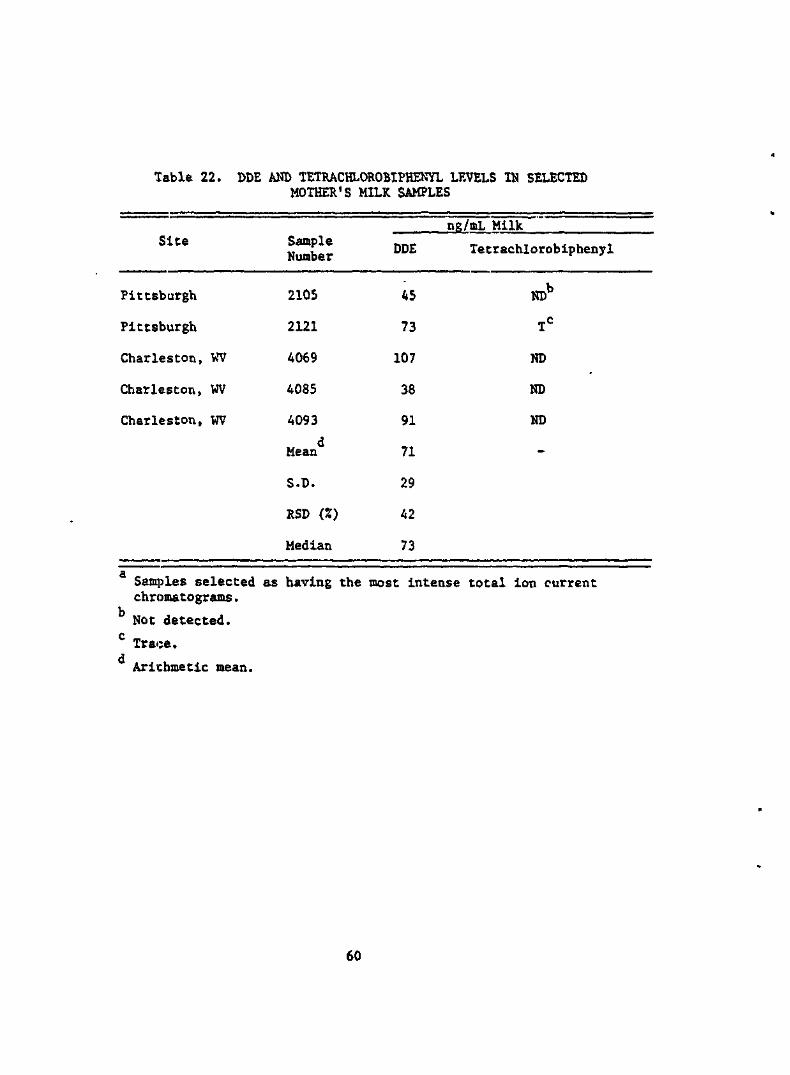
Table 22. DDE AND TETRACHLOROBIPHENYL LEVELS IN SELECTEDMOTHER'S MILK SAMPLES
Sice
Pittsburgh
Pittsburgh
Charleston, WV
Charleston, WV
Charleston, WV
SampleNumber
2105
2121
4069
4085
4093
dMean
S.D.
RSD (2)
Median
ng/mL Milk
DDE Tetrachlorobiphenyl
45 NDb
73 Tc
107 ND
38 ND
91 ND
71
29
42
73
Samples selected as having the most intense total ion currentchromatograms.
Not detected.
Trace.
Arithmetic mean.
60
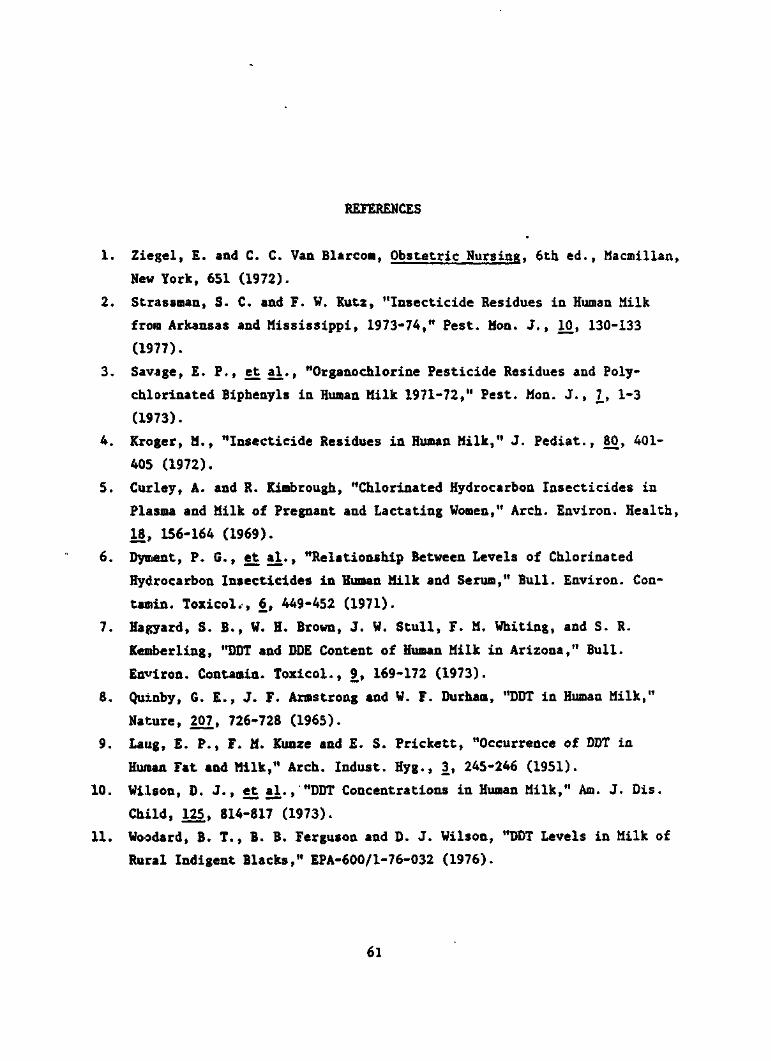
REFERENCES
1. Ziegel, E. and C. C. Van Blarcom, Obstetric Nursing, 6th ed., Macmillan,
New York, 651 (1972).
2. Strassman, S. C. and F. W. Kutz, "Insecticide Residues in Human Milk
from Arkansas and Mississippi, 1973-74," Pest. Moo. J., 10, 130-133
(1977).
3. Savage, E. P., et. al., "Organochlorine Pesticide Residues and Poly-
chlorinated Biphenyls in Human Milk 1971-72," Pest. Mon. J., 7_, 1-3
(1973).
4. Kroger, M., "Insecticide Residues in Human Milk," J. Pediat., 80, 401-
405 (1972).
5. Curley, A. and R. Kimbrough, "Chlorinated Hydrocarbon Insecticides in
Plasma and Milk of Pregnant and Lactating Women," Arch. Environ. Health,
18, 156-164 (1969).
6. Dyment, P. G., et al., "Relationship Between Levels of Chlorinated
Hydrocarbon Insecticides in Human Milk and Serum," Bull. Environ. Con-
tamin. Toxicol., 6, 449-452 (1971).
7. Halyard, S. B., W. H. Brown, J. W. Stull, F. M. Whiting, and S. R.
Kemberling, "DOT and ODE Content of Human Milk in Arizona," Bull.
Environ. Contamin. Toxicol., 9, 169-172 (1973).
8. Quinby, G. E., J. F. Armstrong and W. F. Durham, "DDT in Human Milk,"
Nature, 207. 726-728 (1965).
9. Lang, E. P., F. M. Kunze and E. S. Prickett, "Occurrence of DDT in
Hunan Fat and Milk," Arch. Indust. Hyg., 3, 245-246 (1951).
10. Wilson, 0. J., et al., "DDT Concentrations in Human Milk," Am. J. Dis.
Child, 125. 814-817 (1973).
11. Woodard, B. T., B. B. Ferguson and D. J. Wilson, "DDT Levels in Milk of
Rural Indigent Blacks," EPA-600/1-76-032 (1976).
61

12. Savage, E. P., et al., "A Search for Polychlorinated Biphenyls in Human
Milk in Rural Colorado," Bull. Environ. Contamin. Toxicol., 9, 222-226
(1973).
13. Petrakis, N. L., L. D. Gruenka, T. C. Beelen, N. Castagnoli, Jr., and
J. C. Craig, "Nicotine in Breast Fluid of Nonlactating Women," Science,
199. 303-305 (1978).
14. Bakken, A. F. and M. Seip, "Insecticides in Human Breast Milk," Acta
Paediatr. Scan., 65, 525-529 (1976).
15. Knoll, W. and S. Jayaraman, "Zur Kontamination Von Humanmilch tnit
chlorierten Kohlenwasserstoffer," Die Nahrung, 17, 599-615 (1973).
16. Psendorfer, Von H., "Ruchstande von Organochlorpestiziden (DDT u.a.)
und polychlorierten Biphenylen (PCBs) in der Muttennllch," Wiener
Klinische Wochenschrift, 87, 731-736 (1976).
17. Th. TuLustra, L. G. M., "Organochlorine Insecticide Residues in Human
Milk ia the Leiden Region," Neth. Milk Diary J., 25, 24-32 (1971).
18. Polishiik, Z. W., M. Ron, M. Wasserman, S. Cucas, 0. Wasserman, and C.
Lemesca, "Organochlorine Compounds in Human Blood Plasma and Milk,"
Pest. Mon. J., 10, 121-129 (1977).
19. Ritchy, W. R., G. Savary and K. A. McCulley, "Organochlorine Insecticide
Residues in Human Milk, Evaporated Milk, and Some Milk Substitutes in
Canada," Can. Publ. Health J., 63, 125-132 (197?.).
20. Egan, H., R. Goulding, J. Roburn and J. O'G. Tatton, "Organo-chlorine
Pesticide Residues in Human Fat and Human Milk," Bxit. Med. J., 2, 66-
69 (1965).
21. Newton, K. G. and N. C. Greene, "Organocblorine Pesticide Residue
Levels in Human Milk — Victoria, Australia 1970," Pest. Mon. J., 6,
4-8 (1972).
22. Graca, I., A. M. S. Silva Fernandes and H. C. Mourao, "Organochlorine
Insecticide Residues in Human Milk in Portugal," Pest. Mon. J., 8,
148-156 (1974).
23. Musial, C. J., 0. Hutzinger, V. Zitko and J. Crocker, "Presence of PCB,
DDE, and DDT in Human Milk in the Providences of New Brunswick and Nova
Scotia, Canada," Bull. Environ. Contamin. Toxicol., 12, 258-267 (1974).
62
24. Hes. J. and D. J. Oavies, "Presence of Polychlorinated Biphenyl and
Organochlorine Pesticide Residues and the Absence of Polychlorinated
Terphenyls in Canadian Human Milk Samples," Bull. Environ. Contain.
Toxicol., 21, 381-387 (1979).
25. Stacey, C. I. and B. W. Thomas, "Organochlorine Pesticide Residues in
Human Milk, Western Australia — 1970-71," Pest. Mon. J., 9, 64-66
(1975).
26. Van House Holdrinet, M., H. E. Braun, R. Frank, G. J. Stopps, M. S.
Smout, and J. W. McWade, "Organochlorine Residues in Human Adipose
Tissue and Milk from Ontario Residents," Can. J. Pub. Health, 68,
74-83 (1977).
27. Winter, M., M. Thomas, S. Wernick, S. Levin and M. T. Farver, "Analysis
of Pesticide Residues in 290 Samples of Guatemalan Mother's Milk,"
Bull. Environ. Contamin. Toxicol., 16, 652-657 (1976).
28. "Criteria for a Recommended Standard...Occupational Exposure to Ethylene
Bichloride (1,2-dichloroethane)," HEW Publ. No. (NIOSH) 76-139 (March
1976).
29. Kover, F. D., Environmental Hazard Assessment Report. Chlorinated
Naphthalenes. EPA 560/8-75-001 (December 1975).
30. Erickson, M. D., R. A. Zweidinger, L. C. Michael and E. D. Pellizzari,
"Environmental Monitoring Near Industrial Sites: Polychloroaaphthalenes,"
EPA-560/6-77-019 (1977).
31. Erickson, M. D., L. C. Michael, R. A. Zweidinger, and E. D. Pellizzari,
"Development of Methods for Sampling and Analysis of Polychlorinated
Naphthalenes in Ambient Air," Environ. Sci. Techno1., 12, 927-931
(1978).
32. Erickson, M. D., L. C. Michael, R. A. Zweidinger and E. D. Pellizzari,
"Sampling and Analysis for Polychlorinated Naphthalenes in the Environ-
ment," JAOAC, 61, 1335-1346 (1978).
33. Erickson, M. D., L. C. Michael, R. A. Zweidinger, and E. D. Pellizzari,
"Development of Methods for Sampling and Analysis of Polychlorinated
Naphthalenes in Ambient Air," 1977 Annual Meeting, American Chemical
Society, Chicago, IL (August 31, 1977).
63
34. Erickscn, H. D., L. C. Michael, R. A. Zweidinger, and E. D. Pellizzari,
"Sampling and Analysis for Polychlorinated Naphthalenes in the Environ-
ment," 1977 Annual Meeting AOAC, Washington, DC (October 20, 1977).
35. Unpublished data, E. Roessler, Borough of Bridgeville, PA (1976).
36. 197? Directory of Chemical Producers-USA, Chemical Information Services,
Stanford Research Inst., Menlo Park, CA (1977).
37. Environmental Sciences and Engineering, "Trip Report for Sampling of
Polybrominated Biphenyls (PBBs)," submitted to OTS, EPA, Washington, DC,
Contract No. 68-01-3248 (April 1977)).
38. Mumma, C. E. and D. D. Wallace, "Survey of Industrial Processing Data.
Task I - Pollution Potential of Polybrominated Biphenyls," EPA-560/3-
75-004 (June 1975).
39. Unpublished data, E. J. Londres, New Jersey Dept. of Environmental
Protection via G. E. Parris, OTS, EPA, Washington, DC (1977).
40. Erickson, M. D., R. A. Zweidinger, and E. D. Pellizzari, "Analysis of a
Series of Samples for Polybrominated Biphenyls (PBBs)," EPA-560/6-77-020
(Augus-: 1977).
41. Environmental Science and Engineering, "Data Report for Polybrominated
Biphenyl Near Manufacture (sic) in the Northeast," submitted to OTS,
EPA, Washington, DC Contract No. 68-01-3248 (June 16, 1977).
42. 1974 New Jersey State Industrial Directory, New Jersey State Industrial
Directory, 2 Perm Plaza,. NY, 10001 (1974).
43. Pellizzari, E. D., "The Measurement of Carcinogenic Vapors in Ambient
Atmospheres," EPA-600/7-77-055 (June 1977).
44. Pellizzari, E. D., M. D. Erickson, and R. A. Zweidinger, "Formulation of
a Preliminary Assessment of Halogenated Organic Compounds in Man and
Environmental Media," EPA-560/13-79-006 (July 1979).
45. Pellizzari, E. D., M. D. Erickson, T. D. Hartwell, S. R. Williams, C. M.
Sparacino and R. D. Waddell, "Preliminary Study on Toxic Chemicals in
Environmental and Human Samples. Part I: Formulation of an Exposure
and Body Burden Monitoring Program," submitted to IT. S. Environmental
Protection Agency, Washington, DC, Contract No. 68-01-3849 (June 1980).
64
46. Pellizzari, E. D., "Analysis of Organic Air Pollutants by Gas Chromato-
graphy and Mass Spectrescopy," Publication No. EPA-600/2-77-100,
Contract No. 68-02-2262, (June 1977).
47. McDonnell, G., D. H. Ferguson and C. R. Pearson, "Chlorinated Hydrocar-
bons and the Environment," Endeavour, 34, 13-18 (1975).
48. FDA Compliance Program, Evaluation, "FY 74 Total Diet Studies (7320.08),"
Date accepted: January 21, 1977.
49. State of New Jersey Department of Environmental Protection, "Initial
Report on the Findings of the State Air Monitoring Program for Selected
Volatile Organic Substances in Air," (October 1979).
50. Zweidinger, R. A., A. Sherdon, B. S. Harris, III, H. Zelon, T. Hartwell,
and E. D. Pellizzari, "Measurement of Benzene Body Burden of Potentially
Environmentally Exposed Individuals," Final Report, EPA Contract No.
68-OL-3849, Task 1 (May 1980).
51. Hartwell, T., P. Piserchia,.S. White, N. Gustafson, A. Sherdon, R.
Lucas, D. Lucas, D. Myers, J. Batts, R. Handy, and S. Williams, "Analysis
of E?A Pesticide Monitoring Networks," Office of Toxic Substances,
Washington, DC. Draft Report (1979).
52. U.S. Environmental Protection Agency, Office of Research and Development,
"Health Assessment Document for Polycyclic Organic Matter," (May 1978).
53. Stanford Research Institute, "The Environmental Fate of Selected Poly-
nuclear Aromatic Hydrocarbons," Prepared for U. S. Environmental Pro-
tection Agency (February 1976).
54. State of New Jersey Department of Environmental Protection, "Initial
Report on the Findings of the State Air Monitoring Program for Selected
Heavy Metals in Air," (October 1979).
.55. Unpublished'data, William J. Librizzi, U.S. Environmental Protection
Agency, Region II (October 1977).
56. Fribers, L., M. Piscator, G. F. Nandberg and T. Kjellstrom, "Cadmium in
the Environment," CRC Press, Cleveland, OH (1974).
65
57. National Academy of Sciences, "Lead," Washington, DC (1972).
58. Mason, T. J., F. W. McKay, "U.S. Cancer Mortality by County: 1950-69,"
DHEW Publ. No. (NIH), 74-615, Washington, DC, U.S. Govt. Printing Office
(1974).
59. Mason, T. J., F. W. McKay, J. R. Hoover, W. Blot and J. F. Fraumeni,
Jr., "Atlas of Cancer Mortality for U.S. Counties: 1950-69," DHEW Publ.
No. (NIH) 75-780, Washington, DC, U.S. Govt. Printing Office (1975).
60. Greenberg, Michael R., "The Spacial Distribution of Cancer Mortality and
of High and Low Risk Factors in the New Jersey-New York-Philadelphia
Metropolitan Regions, 1950-1969, Part I," New Jersey Dept. of Environ-
mental Protection, Program on Environmental Cancer and Toxic Substances
(January 1979).
61. Greenberg, M., F. McKay, and P. White, "A Time-Series Comparison of
Cancel Mortality Rates in the New Jersey-New York-Philadelphia Metropoli-
tan Region and the Remainder of the United States, 1950-1969," Am. Jour,
of Epidemiology, 111. 166 (I960).
62. Greenberg, M. R., P. W. Preuss, and R. Anderson, "Clues for Case Control
Studies of Cancer in the Northeast Urban Corridor," Soc, Sci. & Med.,
14D, 37-43 (1980).
63. Greenberg, M. R., J. Caruana, B. Holcomb, G. Greenberg, R. Parker, J.
Louis, and P. White, "High Cancer Mortality Rates from Childhood Leukemia
and Young Adult Hodgkin's Disease and Lymphoma in the New Jersey-New
York-Philadelphia Metropolitan Corridor, 1950-1969," Cancer Research,
40, 439-443 (1980).
64. Cross, J. and G. B.tWiersma, "Preliminary Analysis of Cancer Rates in
Organic Chemical-Producing Counties," EPA-600/1-79-022 (June 1979).
65. Pellizzari, E. D., and M. D. Erickson, "Analysis of Organic Air Pollutants
in the Kanawha Valley, WV and the Shenandoah Valley, VA," Publication
No. EPA-903/9-78-007, Contract No. BOA 68-02-2543 (June 1978).
66. Erickson, M. D., S. P. Parks, D. Smith and E. D. Pellizzari, "Sampling
and Analysis of Organic Air Pollutants in Two Industrialized Valleys,"
FACSS V, Boston (October 30 - November 3, 1978.
67. McLafferty, F. W., E. Stenhagen, and S. Abrahammson, Ed., Registry of
Mass Spectral Data, John Wiley and Sons, New York (1974).
66
68. Eight Peak Index of Mass Spectra. Vol. I (Tables 1 and 2) and II
(Table 3), Mass Spectrometry Data Centre, AWRE, Aldermaston, Reading,
RG74PR, UK (1970).
67
APPENDIX A
DATA COLLECTION INSTRUMENTS
68
STUDY OF ORGANIC COMPOUNDS IN HUMAN MILK
EPA Contract No. 68-01-3849
RTI Project No. 31U-1S21-22
DATA COLLECTION INSTRUCTIONS
Performed for
Office of Toxic Substances
Environmental Protection Agency
Washington, DC 20460
69
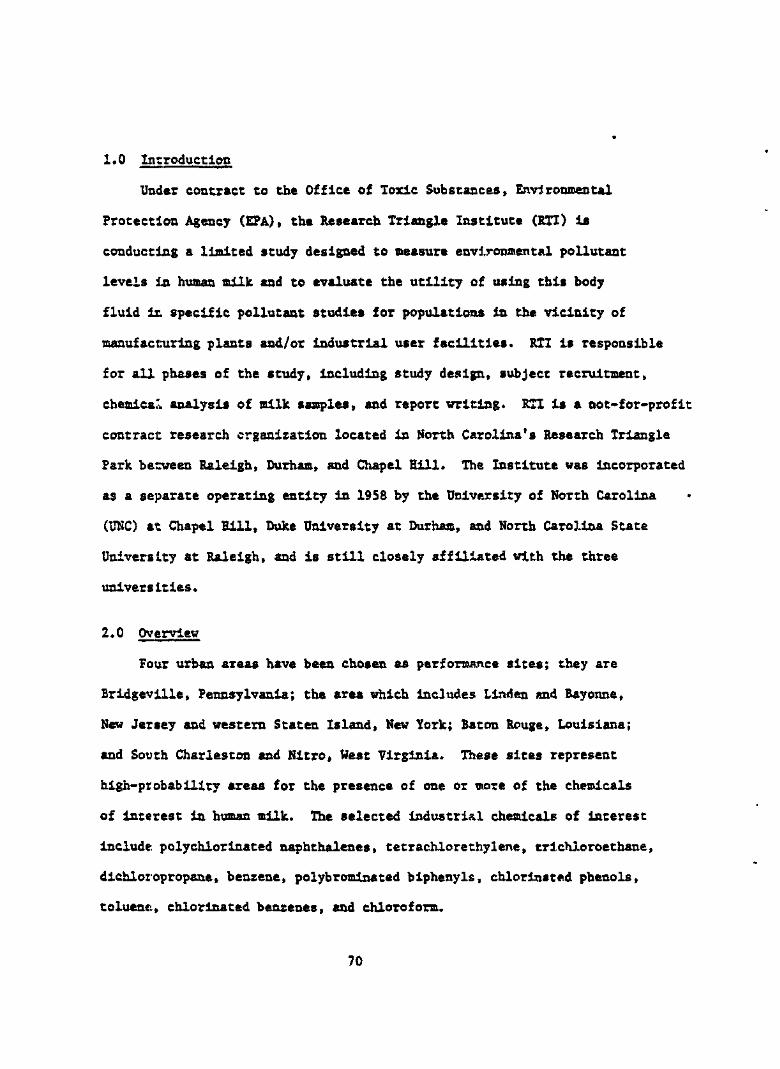
1.0 Introduction
Under contract to the Office of Toxic Substances, Environmental
Protection Agency (EPA), the Research Triangle Institute (RTI) is
conducting a limited study designed to measure environmental pollutant
levels in human Bilk and to evaluate the utility of using this body
fluid it. specific pollutant studies for populations in the. vicinity of
manufacturing plants and/or industrial user facilities. RTI is responsible
for all phases of the study, including study design, subject recruitment,
chemical analysis of milk samples, and report writing. RTI is a not-for-profit
contract research organization located in North Carolina's Research Triangle
Park between Raleigh, Durham, and Chapel Hill. The Institute was incorporated
as a separate operating entity in 1958 by the University of North Carolina
(UNO at Chapel Bill, Duke University at Durham, and North Carolina State
University at Raleigh, and is still closely affiliated with the three
universities.
2.0 Overview
Four urban areas have been chosen as performance sites; they are
Bridgeville, Pennsylvania; the area which includes Linden and Bayonne,
New Jersey and western Staten Island, New York; Baton Rouge, Louisiana;
and South Charleston and Nitro, West Virginia. These sites represent
high-probability areas for the presence of one or more of the chemicals
of interest in human milk. The selected industrial chemicals of interest
include polychlorinated naphthalenes, tetrachlorethylene, trichloroethane,
diehloropropane, benzene, polybrominated biphenyls, chlorinated phenols,
toluene:, chlorinated benzenes, and chloroform.
70
At each of the four sites, arrangements will be made to work through
clinical facilities such as hospitals, clinics, or physician's offices,
In order to recruit a panel of respondents. At each site ten participants
will be recruited, for a total of 40. Potential participants (lactating
females) will be screened to determine that they live in one of the areas
of interest and are willing and able to provide the milk sample.
A questionnaire will be administered for each participant to obtain
information on demographic variables, residence histories, and potential
exposure situations; for each participant, a sample of milk will be collected
and analyzed for the compounds of interest by gas chromatography/mass
spectrometry or high pressure liquid chromatography. A professional member
of the facility's staff, such as a registered nurse, will be trained in the
proper procedures to administer the questionnaire and obtain the milk sample,
To try to reduce the non-participation rate due to refusals, and to reimburse
the subject for the time spent on the study, volunteers will be offered a
$5.DO incentive for participating.
3.0 Data Collection
3.1 General Remarks
Data collection for this research effort consists of the following
steps:
1. Screening of potential participants (lactating women) to
determine that they live in one of the areas of interest
(see below), that they have resided in that area for at
least the preceding 12 months, that they have remained in
that area continuously for the preceding week, and that they
are willing and able to provide a milk sample.
71
2. When an eligible person is encountered, the nature and
purpose of the study will be explained and their partici-
pation solicited.
3. When an eligible person agrees to participate, the person
will be required to sign a Participant Consent Form (PCF)
in order to participate in the study.
4. Once the participant has signed the PCF, the person should
be listed on the Participant Listing Form (PLF), a Patient
Number assigned, and the data collector will proceed to
administer the Study Questionnaire (SQ) and collect the
tr.Uk sample.
5. Once the SQ has been administered and the milk sample collected,
the participant will be offered a $5.00 incentive for
participating.*
6. Milk samples and completed data collection instruments will
be returned to RTI.
3.2 Survey Instruments
As indicated in the preceding section, there are 3 data collection
instruments for this research effort, the PCF, the PLF, and the SQ; subsequent
sections contain instructions for the use of each instrument as well as
item-by-tiem explanations for their completion, and general descriptions
are provided below. The survey instruments have been designed hopefully
to provr.de an efficient means of collecting and recording the requisite
data for the study. It is imperative that all s-urvey instruments be completed
accurately. The success and reliability of the study and its results are
dependent upon the quality of data collected, which will be fully dependent
72
on the accuracy of your execution of your assignment. As you complete
a fora, conduct a thorough edit to verify that required data have been
entered and entered correctly. Copies of the data collection instruments
appear in Attachment 1.
3.2.1 Participant Consent Fora (PCF)
• Purpose; The purposes of the PC? are to introduce
the study; explain its objectives, sponsorship (the
relationship and roles of 811 and EPA), and require-
ments of and risks, burdens, and benefits to partici-
pants; and stress that participation is completely
voluntary and that all data collected will be kept
confidential.
. General Description; The PCF is a single page fora
printed on special paper which makes three copies from
a single impression. The survey title appears at the
top, along with the name of RII; spaces for necessary
identifying information appear at the bottom.
. Administration; The PCF will be signed by the partici-
pant and contains an agreement to provide the necessary
information and milk sample. Participants may freely
withdraw from the study at any time; however, in order
to encourage participation RII offers an incentive of
five dollars to each participant to be paid after each
data set (PCI, SQ, and milk sample) is obtained. Again,
confidentiality of data is stressed, including steps
73
taken to disassociate the name of the participant
from the data once collected; for example', the PCF
is the only data collection instrument which bears
the name of the participant and allows its association
to study identification numbers, but will be maintained
in hard copy only and stored in a restricted area.
To further emphasize this disassociation, the incentive
will be paid in cash rather than by check or money order,
although the participant will sign the PCF indicating
that the incentive was received. A signed PCF must be
obtained for each participant before proceeding with
Study Questionnaire (SQ) administration and collection
of the milk sample.
• Disposition; The top (white) copy will be attached
to the appropriate SQ until it is received at RTI and
verified; the yellow copy will be provided to the
participant; the pink copy will be retained by the data
collector.
3.2.2 Participant Listing Fora r(PLF)
. Purpose; The purpose of the FLF is to provide a means
of assigning unique numbers to participants at each
performance site.
. General Description; The PLF is a single page form
printed on pink paper; space for Comments is provided
on the reverse side. The survey title appears at the
top, along with the names and addresses of RTI and EPA/OTS
and a confidentiality statement.
74
. Administration; Aa each participant is enlisted up
Co the required number (10) , that participant should
be listed on the PLT.
. Disposition; When data collection at a site or facility
is completed, the FLF (or a copy) should be sent to RTI.
3.2.3 Study Questionnaire (SQ)
: The purpose of the SQ is to obtain information
on participants, Including demographic characteristics
such as age, sex, race, and occupation; residence infor-
mation; health information such as current health status
and prescription medications; and personal characteristics
such as hobbies.
. General Description; The SQ is divided into six sections,
dealing respectively with demographic characteristics,
occupation, health and personal habits, residence and
household information, information on the interviewer and
respondent, and information regarding the milk sample,
including an indication as to whether or not the milk
sample was obtained, the date and time of acquisition
of the sample, and the date the sample was shipped to RTI.
Participants will be identified by a unique study number
used to correlate and cross-identify the questionnaires
and samples by way of pre-printed self-adhesive labels.
The SQ is 5 pages long, with space provided for comments,
75
. Administration; An SQ is to be completed for each
participant for whoa a signed PCF is obtained.
• Disposition! The SQ1* are to be sent to RTI as instructed.
3.3 Screening
As indicated in section 3.1, potential participants (lactating women)
should be screened to determine that they meet certain study criteria for
participation:
1. That they are willing and able to provide a milk sample of
sufficient quantity (approximately 100 ml.),
2. That they live in one of the areas of interest (see below),
3. That they have resided in that area for at least the preceding
12 months, and
A. That they have remained in that area continuously for the
preceding 7 days.
As indicated in section 2.0, four areas have been chosen as perfor-
mance situs, with a specific Site Number assigned to each which will remain
constant ilor each site and is to be entered where appropriate on data
collection instruments as follows:
Site Site Number
Northern New Jersey/Staten Island, New York 1
Bridgeville, Pennsylvania 2
Baton Rouge, Louisiana 3
Nitro/South Charleston, West Virginia 4
With the exception of Bridgeville, Pennsylvania, participants residing in
some areas at each site are of considerably more interest to the study than
those living in others, as discussed in the following sections.
76
3.3.1 Northern Sew Jersey/Staten Island. New York
Within the Northern New Jersey/Staten Island area, potential
participants residing in some communities are of more interest than those
residing in others, more or less in the order listed below:
1. Bayonne, NJ 9. Elizabeth, NJ
2. Northern Staten Island 10. Sayreville, NJ(Port Richmond), NY ,, _ . ...11. Rahway, NJ
3' Linde0' » 12. Edison, NJ4. Carlstadc, NJ ^ Parlin> NJ
5. Saddle Brook, NJ
6. Jersey City, NJ ^ Patterson, NJ7. Kearney, NJ ^ Wayne> HJ
8. Newark, NJ
3.3.2 Baton Rouge, Louisiana
Potential participants residing in Baton Rouge are of primary
interest to this study; other communities in the Baton Rouge area of interest
are Placquemine, St. Gabriel, and Geismar.
3.3.3 Nitro/South Charleston, West Virginia
Potential participants residing in Nitro and South Charleston
are of primary interest to this study; other communities of interest in the
area are Belle and Institute.
3.4 Participant Listing Fora
When an eligible person is encountered who agrees to participate,
that person should be listed on a PLF in order to be assigned a unique
Participant Number. The PLF is completed by entering the appropriate Site
Number (see section 3.3 above); then, each time that an eligible participant
is encountered who agrees to participate, up to the number required, enter the
Participant's Name (Last, Firstt Middle) on the PLF and assign a Porticipois
Number in the left-hand column, beginning with 0001 at each site unless other-
77
vise instructed. Assign Participant Numbers consecutively for all study
participants. Where appropriate, enter the participant's Medical Record
Kuniber in the right-hand column. When making numerical entries, right-adjust
and enter leading zeros.
3.5 Participant Consent Fora
Potential participants must understand exactly -what is involved in
participation in the study and what benefits may be realized by participation;
this understanding and agreement must be documented by a signed PCF. In the
event that the potential participant is under the age of 18 years, the person's
parent or other legal guardian must sign the PCF in order for the designated
eligible to participate.
More specifically, the potential participant and/or that person's
parent, guardian or other spokesman, must understand that full participation
in the study consists of providing answers to a questionnaire related to
environmental exposure, part of which relates to the individual's household
in general and part of which is related to the individual participant (be
prepared to show the person the SQ), and providing a ntf.lk sample of approximately
100 ml. (be prepared to show the person one of the collection bottles.)
The individual must further understand that she will only enjoy certain limited
benefit.1! in return for her time and inconvenience, primarily a $5.00 incentive
to be disbursed after administration of the questionnaire and collection of
the milk sample. The individual must understand that participation in the
study iu completely voluntary and that she may withdraw at any tine, but that
payment of the incentive is dependent on full pcrtiGipavion. The individual
must also understand that all data collected in the study will be held
strictly confidential, and that names will not be disclosed.
78
If the participant or that perons's parent, guardian or other
spokesman agrees to participate, read through the PC? with then and make
entries where appropriate. At the bottom, record the Date (month, day, aid
year) that the PCS' is signed and print the Participant's full Same (First,
Middle or Maiden, Last - do not abbreviate); record the appropriate Site
Sianber (see section 3.3 above) and Participant Number (from the PLF); have
the participant (or other appropriate person) sign the PCF; enter jour signa-
ture as witness; and record the participant's home Address (Street Number and
None, City, State, and Zip Code) in the spaces provided.
After data collection (administration of SQ and collection of milk
sample) is completed, the participant (or that person's parent or guardian)
should be given $5.00. The recipient must sign in the space provided at the
bottom of the PCF to indicate receipt of the incentive. Should the signatures
on the PCF for Participant and Recipient be other than the participant's,
please explain in the Comments section of the SQ.
Finally, as indicated in section 3.2.1, the top (white) copy of
the PCF is to be attached to the appropriate SQ; the yellow copy is to be
provided to the participant or her guardian; and the pink copy is to be
retained by the data collector.
3.6 Study Questionnaire
Before proceeding with administration of the SQ, read the justifi-
cation and confidentiality statement in the box on the cover. Enter the
appropriate Site (see section 3.3 above) and Participant (from the PL?)
Numbers. Stapled inside the SQ you will find a set of pre-printed, self-
achesive labels which are necessary to identify corresponding SQs and samples.
Each label contains a unique Study Number, which should be the same on all
79
labels in a set, and an indication of what the label is for. You should
also have some labels that have Cj.ly a Study Number and a few that are
completely blank; these are for your use in the event that a label is
damaged or missing. If you use a label that has a Study Number only,
you will have to write on the label what it is intended for, such as MILK;
if you use a blank label, you must write on the label the Study Number and
what i'C is intended for. Check to be sure that all the labels in a given
SQ contain the same Study Number; if not, do not use the SQ and return it
to RTI. If the Study Number is the. same on all labels, remove the one for
the QUESTIONNAIRE and place it on the cover of the SQ over the spaces
provided for the Study Number. Space for Comments is provided on page 5.
If the.participant is under 18 years of age, the SQ may have to
be administered in whole or part to the parent or guardian, and must be
administered in that person's presence.- If the participant suffers from a
speech or hearing deficit, or is otherwise incapacitated, the SQ may have
to be administered to the spouse or some other spokesman.
Item 1 - Race; Indicate the participant's race by placing an X
in the appropriate box. This question may be answered by
observation; however, if there is any doubt whatsoever, ask.
Item 2 - Age; Determine and enter the participant's age in years
as of the last birthday.
Item 3 — Birthdate; Determine and enter the participant's exact
birthdste (month, day and year). Again, remember to right-
adjust and enter leading zeros. A note on dates: accept and
record partial datest if that is all that the respondent can
provide; in that case, indicate missing elements of the date
80
with • dash (-) — for example, April 1977 would be
recorded as |01AJ - H j - |7|7j .
Item 4 - Weight; Determine and enter the participant's approxi-
mate weight In pounds (to the nearest pound—no fractions!)
or kilograms, in which case observe the decimal.
Item 5 - Height; Determine and enter the participant's approximate
height in inahea or centimeters.
Item 6 - Current Employment; Determine if the participant is currently
employed in any capacity and place an X in the appropriate box.
If the answer is Yes, continue to Item 7; if the answer is
No, skip to Item 10.
Item 7 - Length of Present Employment: Determine and record the
length of time that the participant has been employed by
her present employer; enter the units in the spaces provided•
and then place an X in the appropriate box to indicate whether
the units represent days, months, or years.
Item 8 - Occupation Away From Home; Determine if the participant's
occupation usually takes her away from home and place an X in
the appropriate box. If Yes, continue to Item 9; if No, skip
to Item 11. This question, and Item 9 below, are aimed at
eliciting information regarding the location of the participant's
various exposure to the environment.
Item 9 - Location of Present Employment; If the participant is
currently employed, determine the nature (not the name) and
location (street address, city, state, and Zip Code, if known)
81
of Che employer. By naturet we mean Che type of business,
such as service station, school, hospital, grocery store,
doctor's office, hotel, restaurant, etc.
Item 10 - Employment Statusr If the participant is not presently
employed, determine which of the provided categories best
describes the participant's status and place an X in the
appropriate box. If the response is choice 1 or 2, skip
to Item 15; if the response is choice 3-5, continue to Item 11.
Itec 11 - Usual Occupation; Determine and record the participant's
usual (or most common) occupation (when employed); be succinct -
e.g., high school coach, waitress, hotel desk clerk, taxi driver.
Item 12 - Present Occupation; Determine if the participant is
presently employed in her usual occupation (indicated in Item
11) and place an X in the appropriate box. Items 12 and 13
may be skipped for unemployed, retired and disabled persons.
Item 13; If the response to Item 12 was positive, determine how
long the participant has been employed in her usual occupation
(recorded in Item 11) and record; enter the units in the spaces
provided and then place an X in the appropriate box to indicate
whether the units represent days, months or years.
Item 14; Determine if the participant presently works at or in any
of the listed occupations or establishments and place an X
in each appropriate box.
Item 15 - Present JSmoking Status.; Ascertain if the participant
currently smokes cigarettes, and place an X in the appropriate
box. If YES, continue to Item 16; if NO, skip to Item 18.
82
*• I_ten_16 -_ Age at First Smoke; If the participant is a smoker
(a positive response to Item 15), ascertain the age (in years)
at which the participant started smoking and record in the
spaces provided.
Item 17 - Smoking Frequency: Ascertain how many cigarettes the
participant smokes per day, an the average, and place an X
in the appropriate box. If the participant uses tobacco in
some form other than cigarettes, such as snuff, record in the
space provided.
Item 18 -Time Outdoors; Ascertain the average number of hours
that the participant spends out of doors each day and record
in the spaces provided — another indication of environmental
exposure.
Item 19 "Time Away From Hornet Determine how many hours of the day
on the average the participant normally spends more than 2
miles away from home, and record in the spaces provided. This
determination should be done separately for weekdays and
weekends.
Item 20 - General Health Status; Using the four qualifiers provided,
ascertain the participant's general current health status and
place an X in the appropriate box.
Item 21 - Prescription Medications; Inquire as to whether the
participant is currently taking any prescription mediaavionfs)
on a regular daily basis and place an X in the appropriate
box; if YES, determine and record the drug name - e.g., penicillin,
oral contraceptives, Vallum, phenobarbital, etc.
83
Item 22 - Non-prescription Medications; Inquire as to whether
the participant has taken any non-prescription medications
in the past 24 hours, and place an. X in the appropriate box;
If YES, determine and record the drug name -e.g., aspirin,
vitamins, Dristan, Bufferin, Alka-Seltzer, etc.
Item 23 - Gasoline; Inquire as to whether the participant pumps
her own gasoline, for example at self-service pumps, and place
and X in the appropriate box.
Item 24 - Egg Consumption; Determine and record the approximate
number of -eggs that the participant has eaten in the past
48 hours. Again, in recording numerical entries, remember
to right-adjust and enter leading zeros.
Item 25 - Hobbies; Determine if the participant pursues any of
the listed avocations and place an X in each appropriate box.
Item 26; Determine if the participant pursues any activity that
includes regular use of solvent glue or model airplane cement,
and place an X in the appropriate box.
Item 27 - Length of Residence in Area; Determine hew many years
the participant has lived in the area, of interest, and record
in the spaces provided. Round to the nearest year, except
that if the response is less than one year record as [ < ! I I
and terminate the interview; the individual is ineligible to
participate further in the study. This situation should be
detected during the screening process.
84
Item 28 - Length of Residence at Current Address; Determine how
long Che participant has lived at her current address;
record the units in the spaces provided and place an X in
the appropriate box to indicated whether the units represent
days, months, or years. Use the most appropriate units and
round to the nearest appropriate unit. For example, more
than 28 days should be expressed in months and more than 11
months should be expressed in years. If the participant has
resided at her current address for less than 12 months, but
has lived in the area of interest for at least 12 months,
record any previous addresses during the preceding 12 months
(city and state is sufficient) in the Comments section.
Item 29 - Cooling Appliances; Determine whether any of the indicated
appliances or others, in which case specify, are used to cool
the participant's home and place an X in the appropriate box(es)
for all that apply.
Item 30 - Home Garden; Determine if the participant's household
consumes food grown in a home garden and indicate the response
by placing an X in the appropriate box. If a positive response
is obtained, determine the location of the garden and record.
Location could be participant's backyard, or another community,
in which case specify city and state; be as specific as
possible.
Item 31 __- Commercial Food Source; Determine where the participant's
household usually obtains fruit and/or vegetables and record.
85
Again, be as specific as possible. For example, if
Che city or town has more than one store by the same name,
the store name alone would not be an adeuqate answer; as a
matter of course, record the name and location of the store,
market, or vendor.
Items 32-34 - Water Sources; In Item 32, try to determine the
primary source of drinking water for the participant's
household and place an X in the appropriate box. In Item
33, determine if the same primary drinking water source
indicated in Item 32 is used for drink mixes such as coffee
and tea; if it differs, indicate how. In Item 24, try co
determine the primary source of water for cooking in the
participant's household and place an X in the appropriate box.
For example, some households in some areas of the country
use bottled water for drinking and drink mixes but tap water
(from whatever source) in cooking.
Itea 35 - Other Household Tobacco Use; Inquire as to whether
other members of the participant's household smoke, and place
an X in the appropriate box; if YES, dpr.ernine if the other
members smoke cigarettes, cigars, a pipe, etc. and place an
X in each appropriate box.
Item 36 - Occupation of Other Household Members: Determine if any
other members of the participant's household work at any of
the listed occupations or businesses, and place an X in each
appropriate box.
86
Item 37 - Hobbies of Other Household Members; Determine if any
other members of the participant's household pursue any of
the listed avocations, and place an X in each appropriate box.
Respondent/Interviewer Information
Item 38 - Respondent; Indicate, by placing an X in the appropriate
box, whether the person who served as the primary respondent was
the participant or some other person, in which case specify
in the space provided.
Iten 39 - Interviewer Number; Enter your assigned 3-digit
Interviewer identification Number.
Item 40 - Date of Interview; Enter the date (month, day and year)
that the interview was conducted and the questionnaire completed.
Item 41 - Interviewer Name; The name of the person administering
the questionnaire should be printed in the space provided.
Sample Information
Item 42; Indicate, by placing an X in the appropriate box, whether
or not a milk sample was collected; if not, explain in the•
Comments section below.
Item 43 - Date, and Tine of Milk Saaple Collection; If a milk sample
is collected, record the date (month, day and year) and
approximate time (using a 24-hour clock) of such collection.
The time should correspond to the time that collection was
completed; on a 24-hour clock, add 12 to the p.m. hours - e.g.,
1:00 p.m. would be 13:00, 5:30 would be 17:30, etc.
87
Iten 44 - Date Shipped to RTI; Record the date (month, day and
year) that the respective milk sample was shipped to RTI, or
turned over to an RTI representative.
3.7 Collection of the Milk Sample
3.7.1 General Remarks
As indicated in section 1.0 above, the milk samples are
being collected for chemical analysis by RTI as part of an EPA study to
measure pollutant levels in human milk and evaluate the utility of using this
body fluid in specific pollutant studies. The chemical compounds for which
the samples will be analyzed are present in extremely low levels, so the
utmost care and cleanliness must be used to prevent either contamination or
loss. The instructions below are designed to preserve the integrity of the
sample and should be followed precisely.
3.7.2 Sample Collection Instructions
1. The bottles provided have been thoroughly cleaned and
should be kept tightly closed, except during sampling;
do not wash or otherwise clean them.
2. Remove the MILK SAMPLE label from the sheet of labels
in the appropriate SQ and place on one of the collection
bottles.
3. The milk should be manually expressed directly into the
the bottle; do not use breast pumps or other devices as
the plastics in such devices would contaminate the sample.
Hands should be cleaned and thoroughly rinsed to remove
any residual soap; do not use rubber gloves.
88
4. Collect as ouch milk as possible. Unless the mother
has recently nursed her infant, at least half a bottle
should be easily obtainable. Less than half a bottle
is unuseable and does not constitute a sample. The
ability of the participant to provide an adequate sample
should be determined during the screening process.
5. Immediately cap the bottle and double check to see that
the study numbers on the bottle and questionnaire match.
6. The milk sample should be immediately frozen following
collection and remain so until shipping.
7. Note any deviations from this procedure in the Comments
. section of the appropriate SQ.
3.7.3 Shipping Instructions
1. Pack the container as it was received.
2. Fill the can with dry ice.
3. Make sure that there is adequate padding to prevent
breakage, that all excess space is filled with packing
material.
4. Fill out enclosed Federal Express forms, attach to
the outside of the box, and seal the box.
5. Call Federal Express and have them pick up the package.
6. When Federal Express picks up the package, call Dr. Mitch
Erickson at RTI (see below) to notify him that Federal
Express has picked up the package; if Dr. Erickson is ouc,
leave an appropriate message with his secretary.
89
7. Mail Che corresponding questionnaires to RTI in one of
the envelopes provided.
8. When the questionnaires are in the. mail, call Ben Harris
at RTZ (see below) to notify him that the questionnaires
are in the mail; if Mr. Harris is out, leave an appropriate
message with his secretary.
4.0 Confidentiality
All survey research conducted by RTI is based on highest ethical standards,
including those related to confidentiality. These standards are applied from
the earliest steps of deciding whether or not RTI should participate in a
proposed survey to the final steps of analyzing and reporting the information
obtained. Strict precautions must be observed at all times to protect
the rights of those whom we interview or about whom we collect data. Such9
precautions are built into the study design, so that promises of confidentiality
and anonymity will be upheld during all phases of data handling and analysis.
Ho amount of effort to insure confidentiality will be successful,
however, unless those responsible for data collection in the field maintain
equally rigid standards, treating with utmost confidence all information offered
or observed during data collection. Successful and meaningful survey research
is dependent on the establishment of trust between individuals engaged in data
collection and sources of information, and maintaining this sense of responsibility
to the public throughout all survey activities.
Each data collector will be required to sign in duplicate a contractual
agreement which Includes provisions on confidential treatment of data. This
agreement is designed to protect you as well as RTI and participating institu-
tions and individuals. A copy of this agreement appears in Attachment 2.
90
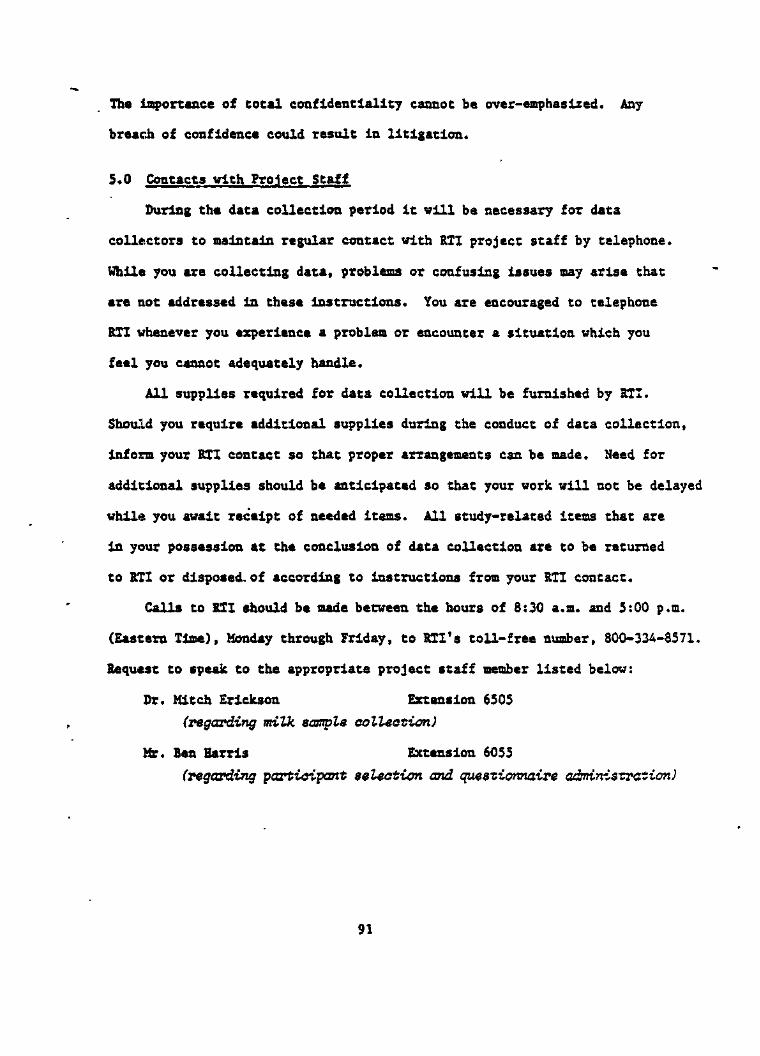
The Importance of cotal confidentiality cannot be over-emphasized. Any
breach of confidence could result in litigation.
5.0 Contacts with Project Staff
During the data collection period it will be necessary for data
collectors to maintain regular contact with RTI project staff by telephone.
While you are collecting data, problems or confusing issues may arise that
are not addressed in these instructions. You are encouraged to telephone
RTI whenever you experience a problem or encounter a situation which you
feel you cannot adequately handle.
All supplies required for data collection will be furnished by RTI.
Should you require additional supplies during the conduct of data collection,
inform your RTI contact so that proper arrangements can be made. Need for
additional supplies should be anticipated so that your work will not be delayed
while you await receipt of needed items. All study-related items that are
in your possession at the conclusion of data collection are to be returned
to RTI or disposed, of according to instructions from your RTI contact.
Calls to RTI should be made between the hours of 8:30 a.m. and 5:00 p.m.
(Eastern Time), Monday through Friday, to RTI'3 toll-free number, 800-334-8571.
Request to speak to the appropriate project staff member listed below:
Or. Mitch Erickson Extension 6505
(regarding milk sample collection)
MX. Ben Harris Extension 6055
(regarding participant selection and questionnaire administration)
91
If che problem is particularly acute, and you have trouble getting through
on .the toll-free line, call collect 919-541-6505 (Dr. Erickson) or 919-541-6055
(Mr. Harris). After 6:00 p.m. Eastern Time you may call Mr. Harris collect
at work (919-541-6055) or person-to-person at home (919-942-6988).
92
Attachment 1
Data Collection Instruments
93
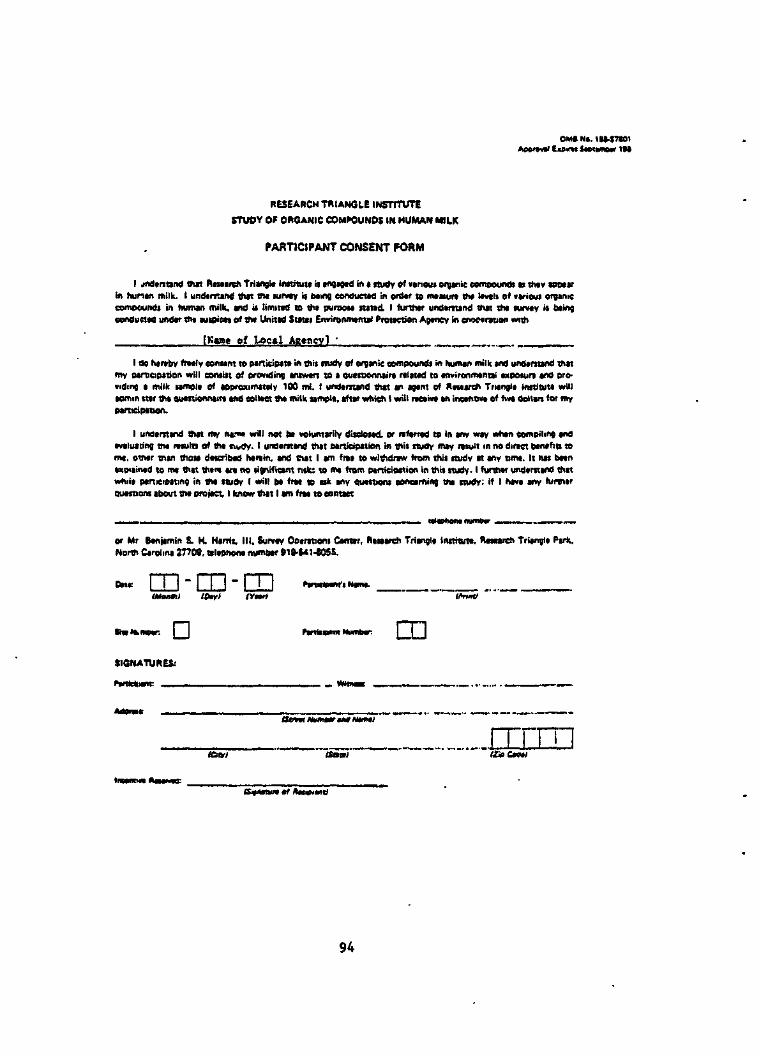
OMVNo. IM-ITtOIim Snnmoir 1H
RESEARCH TRIANGLE INSTITUTE
STUDY OF ORGANIC COMPOUNDS IN HUMAN MILK
PARTICIPANT CONSENT FORM
I jndtrttand thit Rntireh Triangla Innitutt ii angagad in * nudy of vinous organic compounds u thtv aopaarin hunan milk. I undantand th*t tha wrvty ii baing eonduettd in onitr to maBura th» Itvili of various organiccompciundi in human milk, and it limittd to tha purpota natad. I hirthar undamtnd thit thi lurvtv '« baingconductad undar tht autpica* Of thi Unitld Stitu EnvironmantaJ Protaetion Agtnev in emmmion with
[Kaae of Local Agency] •
I do htnfav fncly eonunt to piriieiott* in thit nudy of ergviie compound* in human milk ind undtnond thaimy airbcipttion will contiit of eroviding miwtn to a sutiuonnain ralawd to tnvironmtntai txpotun and pro-viding a milk tampia of aopraximtttlv 100 ml. I undtrnand that an agtnt of Rmareh Tnanolt Initituta willacmm ttar tha auaitionnaira and collact tfw milk tampia, aftar which I will nMtint an incannva of hva dollara for myparticipation.
I unaarnand thai my na.1"* will not bt voluntarily ditdoiad. or raltrrad to in any way whan compiling andavaluating tni nrauln of th* nxdy. I undarnand tfiat oarticipation in tfiii ttudy may rawlt in no dirtet banafia torrn. om«r tnan tnou datcribad harain. and that I am fraa to wi^draw from thii nudy at any tima. It hat bnnaxpiainad to m« that than ara no lignificant nik: to ma from participation in thii ttudy. I funtiar undarnand thatwhila panicioating in thi itudv I will b* frat to atk any quattiont eoncaming ma nudy: if I hava any funnarOuanioru about trw projaet, I know that I am fra« to contact
or Mr Banjamin S. K Harrit, III, Survay Ooarationi Canttr, Haaarch Triangla Innituta, Raiaarch Triangli Park.Norm Carolina Z770S, vlaphona numbtr 91S-S*1-605S.
One . , ," • i . ' " Ifinml
D uSIGNATURES:
ISotti Htimetr mt Html
TTTIKarl Oaal t£p Can;
94
STUDY OF ORGANIC COMPOUNDS IN HUMAN MILK
Off to e/ To«« SUHWMMIfwRuinwitM PmnctKNi tyitt
2MW
Conduced by:*nmtra\ ~rmrq* Inuai*
_RnHn« Trian«i« fw*. Norti CmliiM 2T708
PARTICIPANT LISTING FORM
NOT1CI!: All i I on 4i* c rmit Mnnfladon «f HI indn^uw or m •DDil«uiMni milta K«d in wict eenfldinei. mil « MM only by gmonitfiKlOMtl Of (VWUMl TO OCflVT PWtt Of UMd "Of OAV OCflOf
in md tor ow purpoMi IORM (or *• mrtv. m) will net M
D
95
COMMENTS
96
OMINO. 1U-S7WAoorewi txeirn StmrnMt 19
STUDY OF ORGANIC COMPOUNDS IN HUMAN MILK
Iponmtf by.
<MiM of Tontmiromwnul Prannion A^aiQNMAinfton. O.C. «M«0
Conam.ua by:
ft«Mrah Triwigto Imtaiu
fttMKft Triwifli Nrt. Nam Cwaiw 27709
QUESTIONNAIRE
THE RESEARCH TRIANGLE INSTITUTE OF RESEARCH TMIANCLE PARK. NORTH CAROLINA. IS
UNDERTAKING A RESEARCH STUDY FOR THE U.S. ENVIRONMENTAL PROTECTION AGENCY
OF LEVELS OF VARIOUS ORGANIC COMPOUNDS IN HUMAN MILK. THE INFORMATION
RECORDED IN THIS QUESTIONNAIRE WILL BE HELD IN STRICT CONFIDENCE AND WILL BE
USED SOLELY FOR RESEARCH INTO THE EFFECTS OF ENVIRONMENTAL FACTORS ON PUBLIC
HEALTH. ALL RESULTS WILL BE SUMMARIZED FOR GROUPS OF PEOPLE; NO INFORMATION
ABOUT INDIVIDUAL PERSONS WILL BE RELEASED WITHOUT THE CONSENT OF THE INDI-
VIDUAL. THIS QUESTIONNAIRE IS AUTHORIZED BY LAW (P.L. 94-469). WHILE YOU ARE NOT
REQUIRED TO RESPOND. YOUR COOPERATION IS NEEDED TO MAKE THE RESULTS OF THIS
SURVEY COMPREHENSIVE. ACCURATE. AND TIMELY.
Stu*.r nuflitar: Stanumbtn• D Prttetpim number:
97
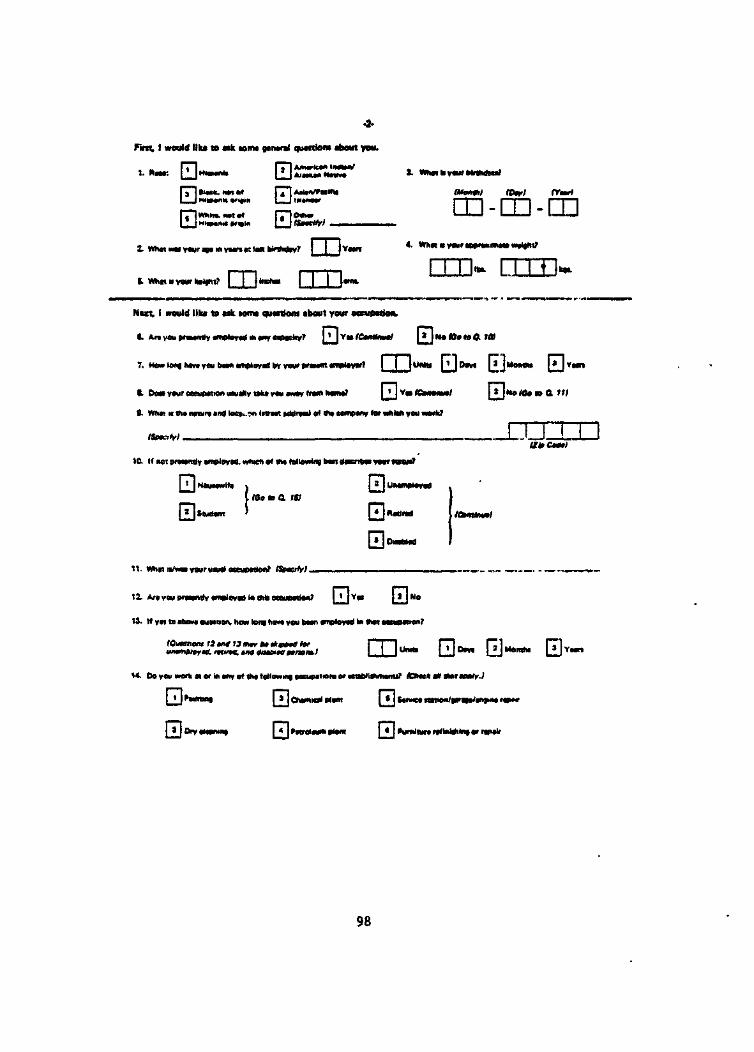
Fint, I would Ilk* to «k torn* gutmi qu*ftiom obout you.
1. Mm: QHWWI. [[]j
f"*™^ I™
fl|»'«*-""*( p.I I Hlventa *ri*ifi I I l«(«
E "'•«••>«*•''•'« B
2. Whn «•» your •(• in y«n K IBM hirtm»y7
1 Whn • your htightr | j |ircn« | | j |
m-m-cn
DID- nI ureuld like to uk lomt quottiem about your oeeupnien.
B. An vou priMRily *mDlov*ri IK Wf cmehy? | ' | Vot ICamtnni \ t ] No <0e ta 0. 101
7. How long hw*you bion unploy** Bv your prownt unployir? [__JU|»K» LlJt>*v' LiJMDmn uJ1>Mr>
(. Doo) your eecupttion iou*liy t>k* you M*V from horn*? jjj Voi ICotmnutl \ * |No/6«io 0. Ill
I. flhf. a Vw nnurt *nd loe*>.?n Ittrxt iddr»«l of *<• compmy for whWi you wort?
1C. If net prmntlv •mpley*a. whteh of «u foUONin) b*n d*Briboi your n*B»7
HOUHWlt*
ICc u a »»
a No
11. Whn atwm youruwd occuorton? tSe*aty> .
12. Art von prmnoy •mplt Bl in thto <xcuORien7 [ < [Y»
13. If y«i to ibon ouMOon, haw long hm you bun vnoloyid In Ml i
PT~| ITIrw-I I I"1"" L_J°"" EV-
. Do you work n of in «ny of *• following oeeupni
I ' I 'wrong [T
[_SJ Dry dwung PnralMii pteni
lCh«e*«oteri
• I Serve* ration/pr*j»/«nj>«« r»p*»
hirnlBira r«f hiMikii or rap**
98
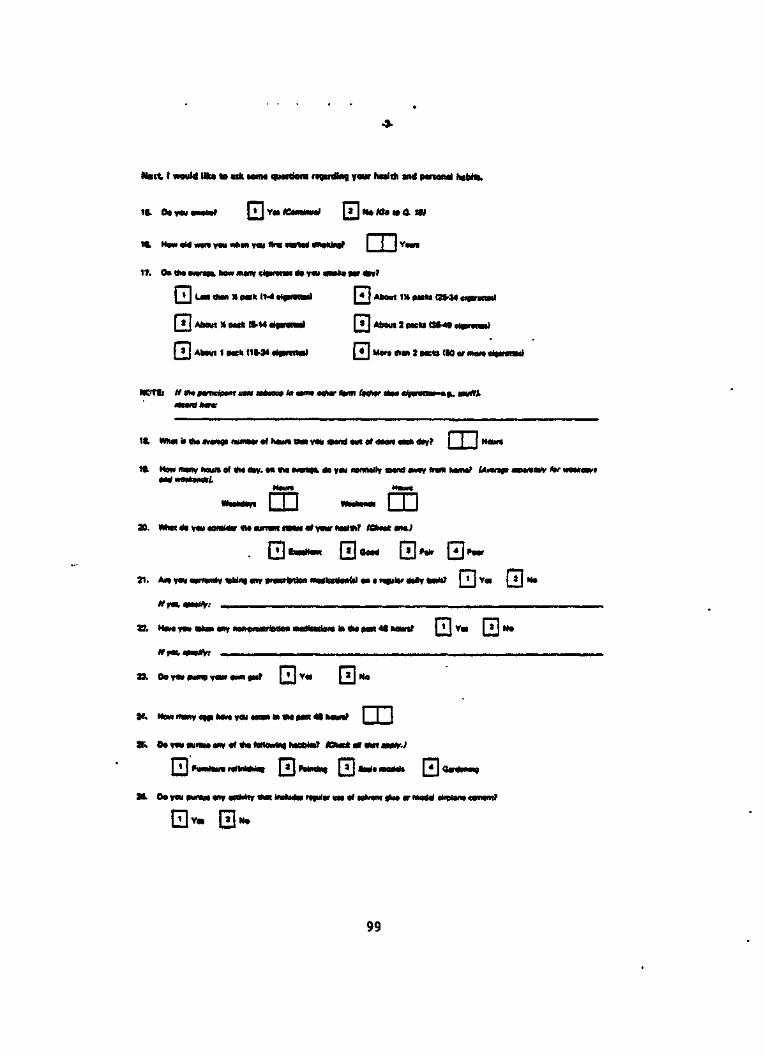
tteit I would Ilk* to «k urn* quartern ragudlno, your hctltti wd pononol tabta.
11 Oo you motor HI Voi ICum^MJ {TJNo»o«af«
Ifc HQW old won you Mritvn you flnn icmtd
17. On On oiorin. haw m«ny cltirvRM do you ««oti oor ON'
QJ LM ttun M port (M «praMd QJ About 1H p«la I2M4 c*nml
[jj About » OMk 15-14 lifBuart Qj About J p«ki O8-49 clpnmi)
I pock I1H4 iljatnoJ QMor(*in2poela(SQarfflara*itnttHl
NCTh /f *w ttneiptn tarn Mawco /« »<n» MMr ftm feoXr MM
11 Win it «M n«raai numew o< houn am you omd out ol doon forii doy? Haun
19. Mow fflmy haun of *• diy. M *• »mi|lL do you namully OMI* unv from Kamnf Mmnaf •**»!•» «x n»i«unt
Mount~"
[ | ~"l H.*-"* ( f |
». Wan do you eoniov «M eumm lonii ol your koil«7 ffiktv* ancj
Q faortom Q Hood Qj »>*
21. Ait you aurrwrty «Ui«j ony »i«u»iloa modkabodUl on * rojulv <My br tf QJ Voi Q No
J2. M««you t^w*nvnon«>«BrioitoniMdlador«kl«M»on4«lH)un7 Voi
33. Oo you puma yaufoMipir Q] Yoi Q]
X. How mony *)gi h*x you «on * M pon <
8L Oo you punuo «iy of tn MHo«Hn| hobela? tttac* o« otn ojp rJ
|»umHuioro)lnWiini |«| PUnant Q] leoto mod i Q
XL Oo you purojo ony onMiy «in Indudoi ropilor ino of tolvtm gluo or «
[JJYoi Q]"*o
99
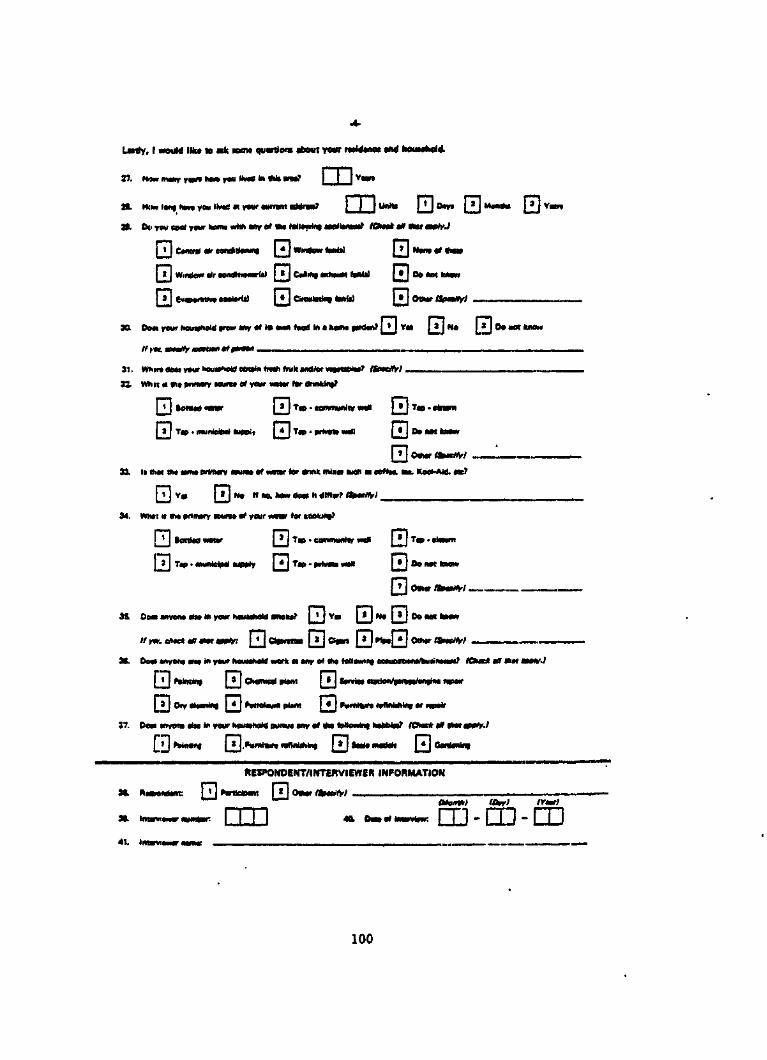
L*rty, I would Ilk* to mk lomt quortc™ (bout your rodrianc* md houMhoJd.
27. HIM mony y«n hw* you «•* <" «* "» I I ~| Vnn
a. Now lor* hm yen IM n your cwnm oddraorf \ \ | Unta [_jj ten [*
9. DC TOM ceo! your norm with Mr of Ow hXlc«rln» •ollvotf ffikM* •» Ultr •Pft'J
I » | Window *Jr oondltKmrli) | » | C*imt oihoyn hnUI |_jj Do AM know
[T] EvoBomw* MOtorta) Q Cirwtatlni Mi) jjjj Other f*
Don your heu«*old ore* ony of la OMI food In a hem, pr4«n? Qj V« Q Do mn know
31. WK« dew v«uf heu»HcW etoin fmti tntt milt, MoratHM? Ootdtrl
12. Whit • 9li pnmw mm 0f ytur nmr tar dnnkinf?
[»JT«p.i
[TJ Tip • municipil wppi, | «| T«s> • prMB Mil [_*J Oa Ml know
n li that th« ovnt prinury mm ft xnor nx dnnk mi»« ueri • eoffoi. iov KookAid. me'
Q]VII [Tj »c If no. how *o« h dlttorr «3iMBnV/
34. Whit a Bit prirMry mm* of your «•»» for cooking?
[ * I Top • munlekHl wpery | * | Top - DnVoo wdl | * | Oo not
}& Com xvon. MM m your imMMd motor Qj Voi [JJ No Qj Oo not know
If ytr. duct til Mff MPV/ JjJ QoHitai Qj OpMl [JJ p|p,| «] OOw t&atityl
M. Oo» onyom •• In your houMhaW work • ony of th« followini oceuoKurK/buvnMir*? lOuet off Kwr oppryj
Q feimlni [*| Chomal ptam [_»J fonriei n»don/oii»oi/>noino npoir
[_^1 Dry elo»n| |*| Nmlowii plwn ( * | •vmnur* wflnWilnH or n»lr
17. Do* invent *IM if your ttaafheU pumn ony of «M toMowmt hobbW /Due* *» «Ht*&Y.>r~i r—I r—i
IJJ.rHirnhun nftnMiki| I » I la
M. Movendonc [j]
RESPONDENT/INTERVIEWER INFORMATION
[_»J
»« I0*rl lYmrl
en - CD - nn41. I
100
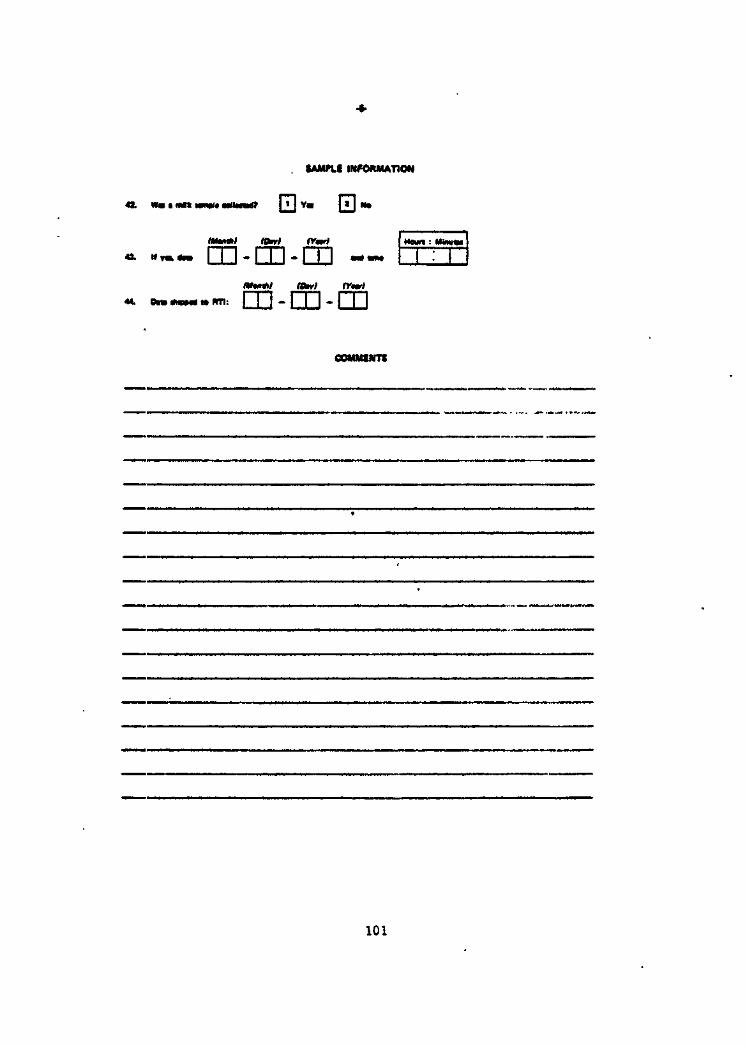
SAMPLI INFORMATION
43. W» i n*k wnpi* mUmuit M V« I I No
Won*/ (Dnt«. ,,^-» en-nn-en —• Houn : Minuw
I :
44. On *«Md » I -m-m
COMMENTS
101

Attachment 2
Research Triangle Institute
Data Collection Agreement
102
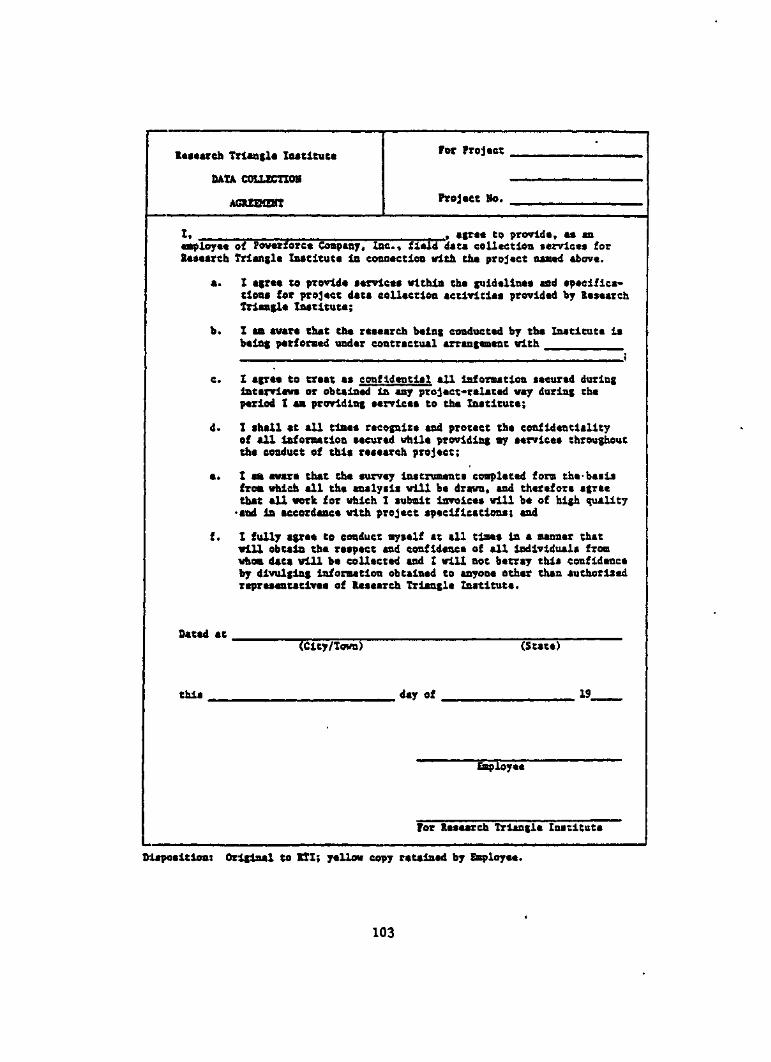
Research Triangle Institute for
DATA. COLLECTION
AGREEMENT Project Mo.
X, . agree to provide, as inemployee of Poverforee Company, Inc., field data collection services forResearch Triangle Institute in connection with the project named above.
a. X agree to provide services within the guideline* aod •pacifica-tions for project data collection activities provided by ResearchTriangle Institute;
b. X an aware that the research being conducted by the Institute isbeing perfomed under contractual arrangeaent with
t
c. X agree to treat as confidential all information secured duringinterviews or obtained la any project-related way during theperiod X aa providing services to the Institute;
d. I shall at all tines recognize and protect the confidentialityof all information secured while providing ay services throughoutthe conduct of this research project;
e. I aa aware that the survey instruments completed fora the-basisfrom which all the analysis will be dravn. and therefore agreethat all work for which X subait invoices will be of high quality•and la accordance with project specifications; and
f. X fully agree to conduct myself at all tlaet in a manner thatwill obtain the respect and confidence of all individuals fromwhom data will be collected and I will not betray this confidenceby divulging information obtained to anyone other than authorizedrepresentatives of Research Triangle Institute.
Dated at(City/Town) (State)
thia . day of 19_
Employee
For Research Triangle Institute
Disposition: Original to KTX; yellow copy retained by Employee.
103
APPENDIX B
SAMPLING AND ANALYSIS OF VOLATILE ORGANICS IN MILK
104
SAMPLING AND ANALYSIS OF VOLATILE ORGANICS IN MILK
1.0 Principle of the Method
Volatile compounds are recovered from an aqueous or solid sample by
warming the sample and purging helium over it. The vapors are then trapped on
a Tenax cartridge which can be introduced by thermal desorption directly into
the GC/HS for analysis. This protocol is the result of extensive development
efforts.(1'9)
2.0 Range and Sensitivity
For a typical organic compound approximately 30 ng is required to
obtain mass spectral identification using high resolution gas capillary
GC/MS analysis. Based on a 50 g milk sample, a detection limit of about 0.6
JJg/kg would be possible. The dynamic range (limit of detection to saturation
on the mass spectrometer) for a purged sample is M.O ; however, smaller
samples may be purged and the upper end of the range increased commensurately.
3.0 Interferences
Two possible types of interferences must be considered: (1) material
present in the sample which physically prevents the effective purge of the
•ample, and (2) material which interferes with the analysis of the purged
sample. In the former case, several techniques have been developed to .
handle such problems (e.g., foaming) by diluting and stirring the sample.
The second case is minimized by the use of GC/MS for the analysis, since
unique combinations of m/£ and retention time can be selected for most
compounds. This permits the evaluation of compounds even though chromatogra-
phic resolution is not obtained.
4.0 Precision and Accuracy
The purge and trap technique has been evaluated for a variety of
matrices using model compounds which are expected to be typical of volatile
halogenated compounds.
105

The recovery of the purge step was validated using cow's milk samples14 14 14spiked w-'th C-chlorofonn, C-carbon tetrachloride, C-chlorobenzene and
14C-bromobenzene. The average recoveries were 88, 88, 63, and 35 percent,
respectively. The recoveries correlate roughly with volatility (inversely
with boiling point), so anticipated recovery for other compounds may be
interpolated from these data.
5.0 Apparatus
5.1 Purge Apparatus
The purge apparatus is shown in Figure 1.
5.2 Sampling Cartridges
The sampling tubes are prepared by packing a 10"en long x 1.5-cm i.d.
glass tube containing 6 cm of 35/60 mesh Tenax GC with glass wool in the ends(2 3}to provide support. ' Virgin Tenax is extracted in a Soxhlet extractor for
a minimum of 24 h with redistilled methanol and pentane prior to preparation(•> 3)
of cartridge samples. ' After purification of the Tenax GC sorbent and
drying in a vacuum oven at 100°C for 2-3 h all of the sorbent material is
meshed to provide a 35/60 mesh-size range. Sample cartridges are then prepared
and conditioned at 270°C with helium flow at 30 ml/min for 30 minutes. Thefit
conditioned cartridges are transferred to Kiroax (2.5 cm x 150 cm) culture
tubes, immediately sealed using Teflon-lined caps, and cooled. This procedure(2 3)is performed in order to avoid recontamination of the sorbent bed. '
5.3 GC/MS/COMP
The volatile halogenated hydrocarbons purged from water are analyzed on
either an 1KB 2091 GC/MS with an LKB 2031 data system or a Varian HAT CH-7
GC/MS with « Varian 620/i data system. The sample, concentrated on a Tenax GC(2 4)cartridge, is thermally desorbed using an inlet manifold system. ' The
operating conditions for the thermal desorption unit and the analysis Tenax GC
cartridges lire given in Table 1.
6.0 Materials
6.1 Sampling
Clean, 120 ml, wide-mouth glass bottles with Teflon-lined caps are used
for the collection of milk samples.
106
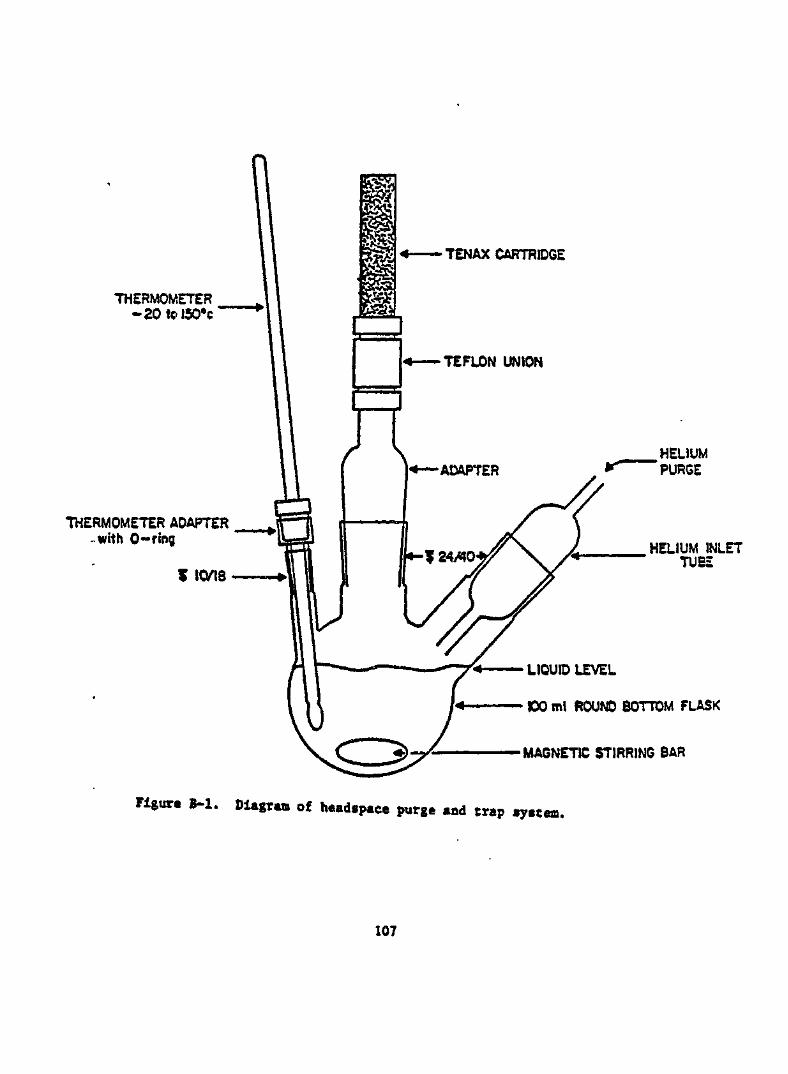
THERMOMETER-20tcl50°c
THERMOMETER ADAPTER-with 0-ring
¥ 10/18
TENAX CARTRIDGE
HELIUM'PURGE
HELIUM INLETTUBE
LIQUID LEVEL
100 ml ROUND BOTTOM FLASK
MAGNETIC STIRRING BAR
Figure B-l. Diagram of headspace purge and trap .yatea.
107
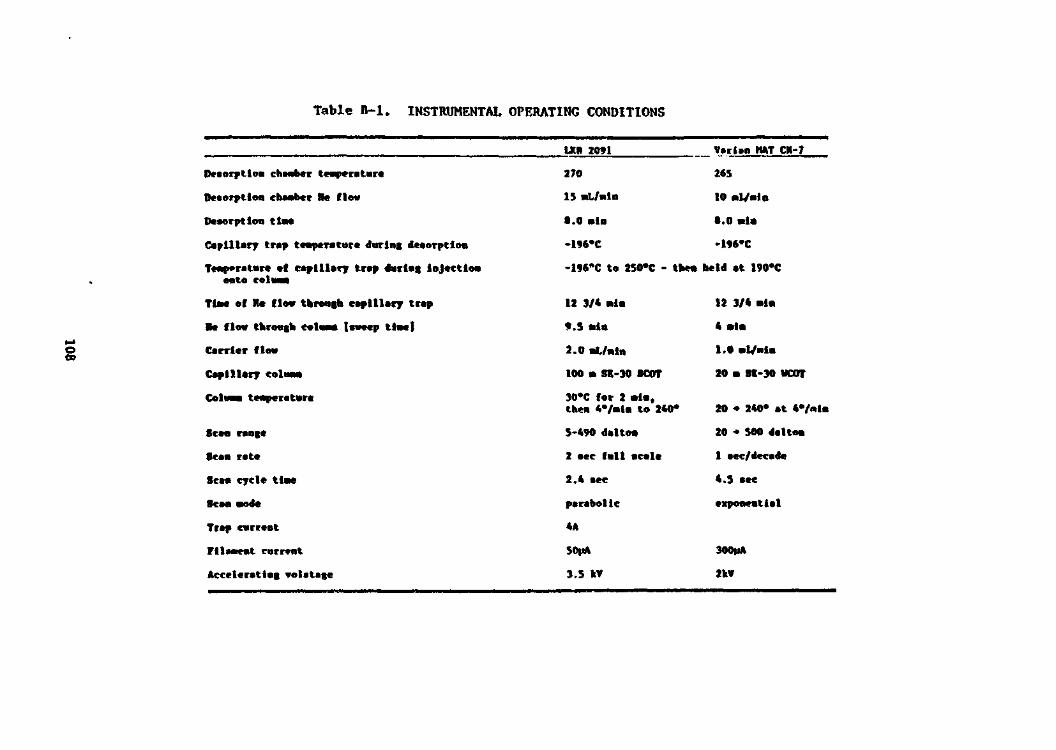
Table H-l. INSTRUMENTAL OPERATING CONDITIONS
o00
Deaorptlon chamber temperature
Deaorptloa chamber Re flew
Deaorption tlM
Capillary trap temperature during deeorptlon
Temperature *f capillary trap darlag injectiononto rolMui
Tiae of He flow through capillary trap
He flow through column laveep time]
Carrier flow
Capillary column
Column temperature
Bcaa range
Scan rate
Scan cycle tl«*
Scan •o4e
Trap current
Fll«Bent current
Accelerating Tolctage
UC* 2091
270
IS *L/»ln
8.0 Bin
-196»C
-196*C to 2SO*C - tbea
12 3/4 •!•
f .5 »tn
2.0 BL/.ln
100 • SK-30 SCOT
30*C for 2 »1«,then «•/•!• to 2*0*
5-490 dalton
2 aec full acale
2.4 aec
parabolic
4A
SO|iA
3.5 kV
VarUn HAT CH-7
265
10 HlVmia
8.0 mla
-196"C
held at 190*C
12 3/4 ail.
4 •!•
1.0 ml/mlo
20 • 8C-30 VCOT
20 •» 240* at 4»/»ln
20 * 500 dalton
1 aec/decade
4.3 aec
eiponeatial
300|iA
IkV
6.2 Purge
Teuax cartridges - 16-mm o.d. x 10.5 cm glass tubes filled with 6 cm of
Tenax with 1-cm glass-wool plugs in each end.
Charcoal cartridges - 16-mm o.d. x 6 cm filled with 4 on of charcoal
and glans-wool plugs in each end.
Glass culture tubes with Teflon-lined screw caps.
7.0 Procedure
7•1 Collection of Field Samples
Milk (60-120 ml) is expressed directly into the wide-mouth bottle,
capped tightly, and frozen for shipment and storage. To preserve the inte-
grity with respect to volatiles, handling and transfer must be minimized.
7.2 Purging of Volatiles
The apparatus is assembled as depicted in Figure 1, including the Tenax
GC cartridges (1.5-cm diameter x 6.0-cm length). A carbon cartridge 1.5-cm
diameter x 4.0-cm length is connected to the effluent end of the Tenax
cartridge to prevent contamination of the cartridge by laboratory vapors.
The milk sample is cooled to ~A°C, shaken vigorously and 100 ml diluted with
350 ml distilled water. The pH of the solution is adjusted to 4.0 with
sulfuric acid. A glass-wool plug is inserted into the center neck of the
flask just above the level of the solution and, with the flask in a heating
mantle, the solution is heated to 70°C while it is stirred with a magnetic
stirrer. The sample is purged at 15 ml helium/min and 70°C for 90 minutes.
The loaded cartridge is removed and stored in a culture tube containing 1-2 g
CaSO, desiccant for 2-12 h. The desiccant is removed from the culture tube
and the dry, loaded cartridge stored at -20°C.
7.3 Analysis of Sample Purged on Cartridge
The instrumental conditions for the analysis of volatile compounds of(2-9)the sorbent Tenax GC sampling cartridge are shown in Table 1. The
thermal desorption chamber and six-port valve are maintained at 270°C and
200°C, respectively. The helium purge gas through the desorption chamber is
adjusted to 15-20 mL/min. The nickel capillary trap at the inlet manifold
is cooled with liquid nitrogen. In a typical thermal desorption cycle a
sampling cartridge is placed in the preheated desorption chamber and helium
gas is channeled through the cartridge to purge the vapors into the liquid
109
nitrogen cooled nickel capillary trap. After desorption the six-port valve
is rotated and the temperature on the capillary loop is rapidly raised; the
carrier gas then introduces the vapors onto the high resolution GC column.
The glass capillary column is temperature programmed from 20°C to 240°C at
4°/min and held at the upper limit for a minimum of 10 minutes. After all
of the components have eluted from the capillary column, the analytical
column is cooled to ambient temperature and the next sample is processed.
7.4 Quantitation
All data are acquired in the full scan mode. Quantitation of the
halogenateci compounds of interest is accomplished by utilizing selected ion
plots (SIPs), which are plots of the intensity of specific ions (obtained
from full t.can data) versus time. Using SIPs of ions characteristic of a
given compound in conjunction with retention times permits quantitation of
components of overlapping peaks. Two external standards, perfluorobenzene
and perfluorotoluene, were added to each Tenax GC cartridge in known quanti-
ties just prior to analysis. In order to eliminate the need to construct
complete calibration curves for each compound quantitated, the method of
relative molar response (RMR) is used. In this method the relationship of
the RMR of the unknown to the RMR of the standard is determined as follows:
- Auak/m°leSunkstd " A.td'"lM.td
where A = peak response of a selected ion,std = standardunk = unknown
g = number of grams present, andGMW = gram molecular weight.
Thus, in the sample analyzed:
. tAtok)(OWunk)(l.td)
110
The value of an RMR is determined from at least three independent analyses
of standards of accurately known concentration prepared using a gas permeation
system. ' The precision of this method has been determined to be generally
±10 percent when replicate sampling cartridges are examined.
8.0 References
1. Michael, L. C., M. D. Erickson, S. P. Parks, and E. D. Pellizzari,
Anal. Chem., 52, 1836-1841 (1980).
2. Pellizzari, E. D., "Development of Analytical Techniques for Measuring
Ambient Atmospheric Carcinogenic Vapors," Publication No. EPA-600/2-
76-076, Contract No. 68-02-1228, 185 (November 1975).
3. Pellizzari, E. D., "Development of Analytical Techniques for Measuring
Ambient Atmospheric Carcinogenic Vapors," EPA 600/2-75-075, 187, (Novem-
ber 1975).
4. Pellizzari, E. D., J. E. Bunch, R. E. Berkley and J. McRae, Anal.
Chem., 48, 803 (1976).
5. Pellizzari, E. D., J. E. Bunch, B. H. Carpenter and E. Savicki, Environ.
Sci. Tech., 9, 552 (1975).
6. Pellizzari, E. D., B. H. Carpenter, J. E. Bunch, and E. Sawicki, Environ.
Sci. Tech., 9, 556 (1975).
7. Pellizzari, E. D., Quarterly Report No. 1, EPA Contract No. 68-02-2262,
February, 1976.
8. Pellizzari, E. D., J. E. Bunch, R. E. Berkley and J. McRae, Anal.
Lett., 9, 45 (1976).
9. Pellizzari, E. D., Analysis of Organic Air Pollutants by Gas Chromato-
graphy and Mass Spectroscopy. EPA-600/2-79-057, 243 pp., March, 1979.
Protocol Prepared, June, 1980
111
APPENDIX C
ANALYSIS OF SEMIVOLATILE ORGANIC COMPOUNDS IN MILK
112
ANALYSIS OF SEMIVOLATILE ORGANIC COMPOUNDS IN MILK
1.0 Principle of the Method
Milk samples are collected from nursing mothers and frozen until ready
for analysis. An aliquot of the thawed sample is then extracted, cleaned up
by Flori.sil column chromatography and analyzed by GC/MS/COMF.
The extraction procedure used here is preferable to that used by the
AOAC , since both polar and nonpolar compounds are extracted from the
milk. Tie AOAC method is designed for pesticide residues and would not
efficiently extract polar and/or acidic compounds.
Opea column chromatography is a necessary prerequisite to GC/MS/COMF
analysis. Although some loss of sample may occur during the extraction and
cleanup, these procedures remove proteins and fats from the sample which
would otherwise create overwhelming interferences for GC/MS/COMP analysis.
Since the compounds of interest in these fractions cover such a broad
range of volatilities, the GC/MS/COMF analysis can be rather complex. The
higher PBBs of interest in the extracted fraction must be chromatographed on
a very short column (45 cm x 0.2-cm i.d., 2 percent OV-101 on Gas-Chrom Q)
at high temperatures to elute them as sharp peaks which may be identified
and quantitated. These chromatographic conditions are not applicable to
more volatile compounds since they are not resolved from the solvent. Thus,
the extracted fraction is analyzed a second time using a nonpolar SCOT
capillary column (either OV-101 or SE-30 liquid phase) to separate and
identify semivolatile constituents (e.g. chlorobenzenes, PCNs, pesticides,
etc.). The chromatographic conditions are typically 60°C initially, program-
med to 2AO°C (or the column limit) at 6°/min.
The: mass spectral data are stored on magnetic tape. The mass spectra of
interest: will be printed out by the instrument operator for qualitative
analysiii. Quantitation from this data may be achieved by integrating the
area of selected ions and comparing them to the area of the external standard.
113
The sensitivity of the determination may be significantly improved for
quantitative purposes by using the technique of selected ion monitoring
(SIM), also known as multiple ion detection (HID). This technique monitors
up to 9 ions at a sensitivity 10-100 greater than the normal operating mode.
This technique is used for quantitation of compounds in samples where the
increased sensitivity is necessary for detection or accurate determination.
2.0 Range and Sensitivity
The detection limit of the GC/MS/COMP system has been determined to be
about 5*50 ng/pL for pesticides such as v-BHC, £,£(-DDE, atrazine, trifluralin
and heptaculor using a 40 m SE-30 capillary column. When SIM was used, the
detection limit was about one order of magnitude less (i.e., 0.5-5 ng/pL).
The detection limit for tetrabromobiphenyl is about 1 ng/[.(L in the SIM mode
using A5 x 0.2-cm i.d. column packed with 2 percent OV-101 coated on Gas-
Chrom Q.
For an instrumental detection limit of 1 ng/pL, the overall sensitivity
of the method should be about 6 ng/mL (6 ppb) milk assuming a 50 ml milk
sample extracted and extract concentrated to 0.3 ml. This detection limit may
be improved by using SIM and may be worsened by background interferences.
3.0 Precision and Accuracy
When electron capture gas chromatography (GC/ECD) was used, the mean
recoveries from cow's milk for seven replicates ranged from 57 to 93 percent
for six model compounds. Thus, the results obtained may be as little as
half the actual amount in the sample. The relative standard deviations
(RSD) for the above replicates ranged from 11 to 33 percent, with the average
RSD at 21.7 percent. Thus the precision of the method is about + 20 percent.
It is anticipated that accuracy and precision will improve with experience
with the method.
4.0 Apparatus
4.1 Gas Chromatograph3
A Fisher-Victoreen 4400 gas Chromatograph with an H electron capture
detector, a 10 AFS electrometer, and a 1.0 mV recorder is used.
4.2 Gas Chromatography Column
For most compounds, separation is achieved using « 40 m SCOT glass
capillary column coated with 1 percent SE-30 and 0.32 percent Tullanox. For
114
the compounds of very low volatility (e.g. the higher PBBs) which will not
chromatograph'on the capillary column, a 45- x 0.2-cm i.d. glass column
packed with 2 percent OV-101 on Gas-Chrom Q is used.
4.3 Liquid Chromatography Column
A 24-mm i.d. glass column with a Teflon stopcock is used.
4.4 Gas Chromatography/Mass Spectrometer
An LKB 2091 gas chromatograph/mass spectrometer with 2 PDF 11/4 computer
is used. The system is equipped with a glass jet separator and is used with
either glass capillary or packed glass column.
5.0 Materials
Kuderna-Danish evaporators:5 ml receivers
250 ml KD flasks
Snyder columns
500 mL flat-bottom boiling flasks
250 ml separately funnels
Clean glass wool
Whatman 1 P/S .filter paper
Florisil
Sodium sulfate (anhydrous)
Acetone "Distilled in Glass", redistilled
Pentane "Distilled in Glass", redistilled
Toluene "Distilled in Glass", redistilled
Ethyl ether "Distilled in Glass"
6.0 Procedure
6.1 Extraction(1) Mix 50 mL (or volume available up to 50 ml) of a milk sample with
clean glass wool and 150 ml of acetone to precipitate the proteins.
(2) Decant and filter the acetone/water layer.
(3) Repeat steps 1 and 2 with two 50 ml acetone fractions.
(4) Concentrate to about 20 mL using a Kuderna-Danish evaporator.
(5) Extract the precipitate with 40 mL of toluene; decant and filter
the toluene layer.
115
(6) Combine the toluene extract and the acetone extract with shaking.
(7) Let the layers separate and draw off toluene (top) layer.
(8) Repeat Steps 5-7 with 40 ml toluene and then with 10-20 mL toluene.
(9) Discard the lower water layer.
(10) Dry the organic layer with anhydrous sodium sulfate and concentrate
to desired volume using a flat-bottom boiling flask and Snyder
column. Quantatively transfer to a vial and concentrate to 5-10
mL under a gentle stream of nitrogen.
6.2 FlqrisrLl Column Chromatography
(1) Prepare Florisil by beating to 130°C for at least 5 hours.
(2) Prepare a 24-mm i.d. column so that the Florisil is 10 cm high
after settling.
(3) Place about 1 cm of anhydrous sodium sulfate on top of the Florisil.
(4) Rinse column with 40-50 mL pentane, never allowing the solvent to
go below the Na.SO, layer, as channeling may result.
(5) Add up to 10 mL of sample to column.
(6) Elute with 200 mL of 6 percent ethyl ether/pentane solution at <5
mL/min.
(7) Collect and concentrate in a Kuderna-Danish evaporator.
(8) Evaporate under nitrogen stream to 1 1.5 mL. Quantitatively
transfer to a vial, store in a freezer.
(9) If sample solidifies after concentration, repeat the Florisil
cleanup (Steps 1-8).
6.3 Standards
Standards are spiked into the sample following the extraction and
workup (d..-pyrene was used at 200 ng/mL).
6.4 Analysis
6.4.1 GC/MS/COMP Analysis for Semivolatiles
Inject 0.2 yL onto a 40 n SE-30 SCOT capillary at 60°C initially,
program at 6°/min to 240°C, then hold until no more peaks are observed.
Collect mass spectral data at 2 sec/scan from m/z 20-500. Compounds amenable
to this analysis include organic compounds with volatility lower than that
for purgeable compounds. Only the very low volatile compounds (e.g. higher
PBBs) will not elute from the capillary.
116
6.4.2 GC/MS/COMP Analysis for Low Volatile Compounds
6.4.2.1 Normal Procedure
Inject 1.0 pL onto a 45 x 0.2-cm i.d. glass column packed with 2 percent
OV-101 on GasChrom Q at 220°C initially, program to 300° at 12°/min and hold
until all peaks have eluted. A helium flow rate of 20 mL/min is used. The
mass spectrometer is scanned from m/z 20-1000 at 2 sec/scan.
6.4.2.2 Alternate Procedure
Using the same chromatographic conditions analyze the sample by SIM.
Preselect up to 8 ions characteristic of the compound(s) of interest and one
ion characteristic of the standard. Retention times provide qualitative
identifications. Peak areas may be used for quantification as discussed
below. This alternate procedure has 10-100 times better sensitivity than
the full scan mode and provides faster quantitative results. The main
disadvantage is that only preselected compounds may be identified.
In addition, if specific halogenated compounds are found to be present
with little interference in most samples, they may be analyzed by GC/ECD.
This procedure improves the sensitivity and reduces the analysis time (since
GC/MS/COMP requires an offline data output). If GC/ECD is used, approximately
10 percent of the analyses are verified by GC/MS/COMP.
6.4.3 Qualitative Data Interpretation
Spectra are interpreted by visual comparison with standard spectral(2 3)reference collectionsv ' where possible. Where standard spectra are not
available, tentative identifications are made based upon interpretation of
the mass spectrum. Where possible, the GC retention time is also used to
assist in the identification procedure.
All identifications and interpretations are checked independently by
other experienced chemists or spectroscopists to assure that the interpreta-
tions are correct.
6.4.4 Quantitative Analysis
In order to eliminate the need to construct complete calibration curves
for each compound to be quantified, the method of relative molar response
(RMR) is used. Successful use of this method requires information on the
exact amount of standard added and the relationship of RMR (unknown) to the
RMR (standards). In general, the RMR for a compound is determined for a
117
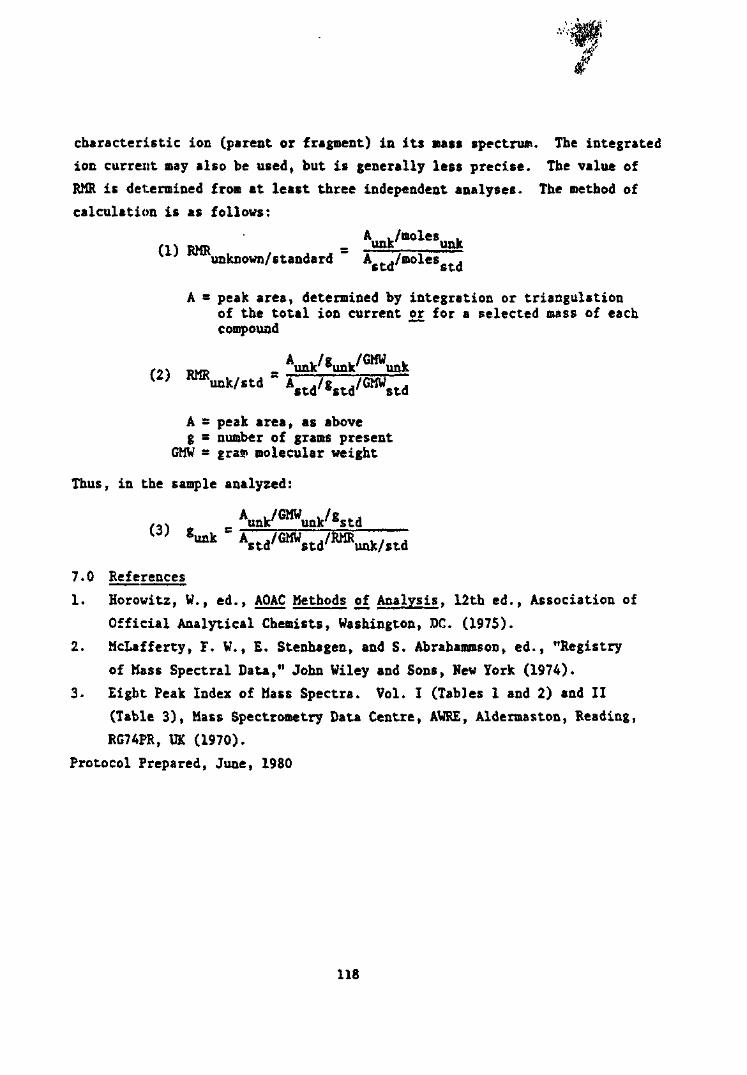
characteristic ion (parent or fragment) in its mass spectrum. The integrated
ion current may also be used, but is generally less precise. The value of
RMR is determined from at least three independent analyses. The method of
calculation is as follows:
A ./moles
unknown/standard " A . ./moles .. .std std
A = peak area, determined by integration or triangulationof the total ion current or for a selected mass of eachcompound
."»/.U
A = peak area, as aboveg = number of grams present
GMW = grain molecular weight
Thus, in the sample analyzed:
7.0 References
1. Horowitz, W., ed., AOAC Methods of Analysis, 12th ed., Association of
Official Analytical Chemists, Washington, DC. (1975).
2. McLafferty, F. W. , £. Stenhagen, and S. Abrahammson, ed., "Registry
of Mass Spectral Data," John Wiley and Sons, New York (1974).
3. Eight Peak Index of Mass Spectra. Vol. I (Tables 1 and 2) and II
(Table 3), Mass Spectrometry Data Centre, AWRE, Aldennaston, Reading,
RG74PR, UK (1970).
Protocol Prepared, June, 1980
118
APPENDIX D
VOLATILE COMPOUNDS IDENTIFIED IN SELECTED PURGES
OF MOTHER'S MILK
119
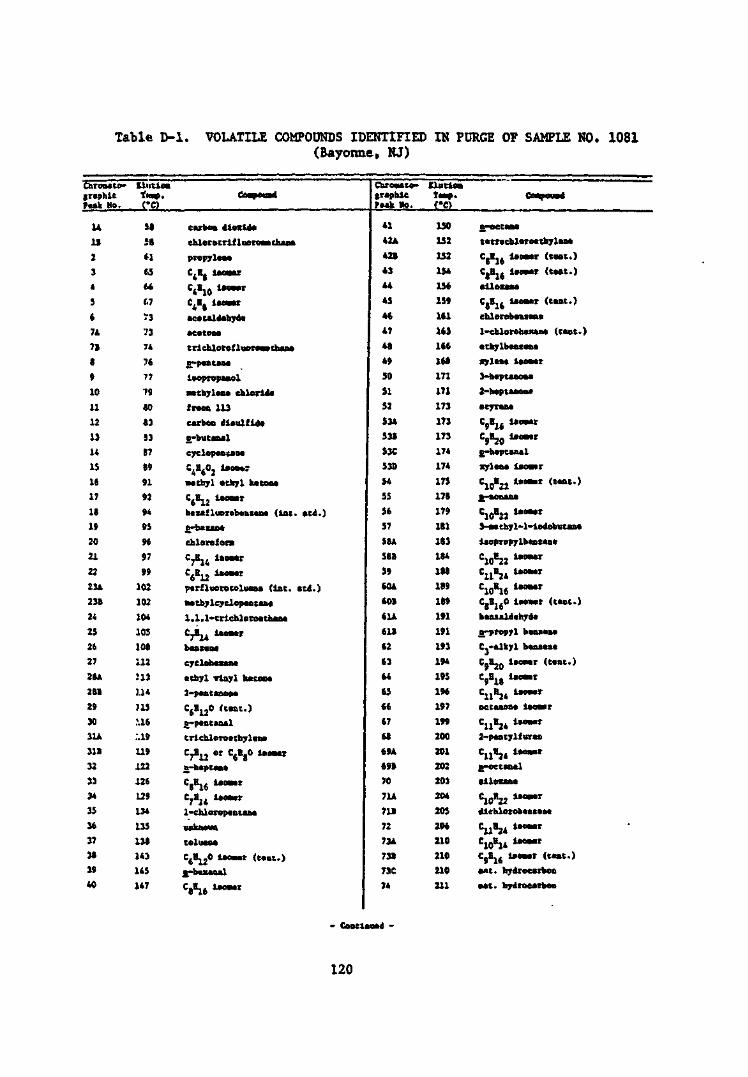
Table D-l. VOLATILE COMPOUNDS IDENTIFIED IN PURGE OF SAMPLE NO. 1081(Bayonne, KJ)
Chromlto-iraphlcFaak Mo.
14
11
2
34
5
6
74
71
8
9
10
11
12
13
14
IS
16
17
18
19
20
21
22
234
231
24
25
26
27
28A
281
29
30
31A
31132
3334
35
36
37
38
39
40
Uiitiaafnp.C'C)
U58
(1r.s(•6
f,7
V3
•1374
76
77
79
.to
.13
93
87
89
91
92
94
95
96
97
99
102
102
104
105
108
112
:i3a 4)13
M6
:.i9119
.L22
.126
L29
134
135
138
143
145
147
QMBOUBd
carbon dloxldacblorocriflneroa* chu*propylaa*C^UomrC4*10 *"•"C4Bj iaOMt
acauldabjrdaaeatma
t ri cUoraf luenv* cbw*c.-paBtaoaiaeprapaaol•atbylua cbloridafnoa 113carbon dlaulfidaB-bucaaalcyclopaatamC,B,0. iaOMT
Mtbyl athyl batBaa
CjEjj laoatr
btufluorobcntao* (1st. atd.)D-bauB*ehlarefoi*C?EK IkoMtC£BU ICOMTparfluetotaluana <iot. atd.)MebylcyelepaBcana1.1.1-criehleroatbaaaCjE^ i»am»r
twBMB*
crelebaua*
ttbyl Tiajrl kctoat
2-paataDaaa
C.B..O <tact.)B.p.ocu.1
CricblBroacbylana
C7E12 ot C6E8° U- "B_-baptaaa
CBE16 *>olnl
C7EJ4 Ue~r
1-ehletepaBtaBa
unknown
tBlUBBB
C£E^jO laoaar (Mat.)
£-baxaoal
C8E16 t««t
CUr o»» to-graphicPftAk. MOa
41
42A
421
43
44
45
46
47
48
49
SO
SI52
S34
531
S3C
S3D
54
55
56
57
584
581
S9
604
601
61A
611
62
63
M
65
66
67
68
69A
691
70
714
711
72
73A
731
73C
74
riuttoBTaap.CO
150
152
132
154
156
159
161
163
166
168
171
171
173
173
173
174
174
173
178
179
181
183
184
188
189
189
191
191
193
194
195
196
197
199
200
201
202
203
204
205
206
210
210
210
211
CnayBUBd
£-»ct«.
tatracblBroatbylaMCjE16 laoaar (tut.)CgE16 lanMT (MBt.)•llauaaC.E, , iaoaar (MBt.)8 16ehlorobman*1-ehlorohaicaBa (cant.)•thylb.««.STlaaa laoMr3»hapf imrniftJ II r BTMriiw
1-haptBBBB*
acTTU*
C9E16 lg—rCjEjp iaoMr
£-haptaul
xylaaa laeatr
C10H22 *«— * <t'nt->
£-BOBaBa
C10E22 lt<mtr
S-vatbTl-l-lBdobutaaa
laopropjlbaacaBa
C10E22 t"m'r
C11B24 tK»"C10E16 1"*'r
CjEj.O laoMt (taut.)
baualdahrda
B^propjl baaaaaa
C.-a.lk]tl baasaaa
CjEj0 taaavr (tint.)
C9B18 lao«T
C11E24 l>0— r
oecaaoBa laoacr
C11E24 lM~r
2-paBt7lf«raB
C11E24 ttol"r
g-octanal
alleiau
C10E22 t'01"r
dieblorobaataBa
C11E2* t'°-r
C10E14 1K>- r
CjElt ifomtr (cast.)
ant. hydroearboa
aat. hydrocarbon
- CoBtlBIMd -
120
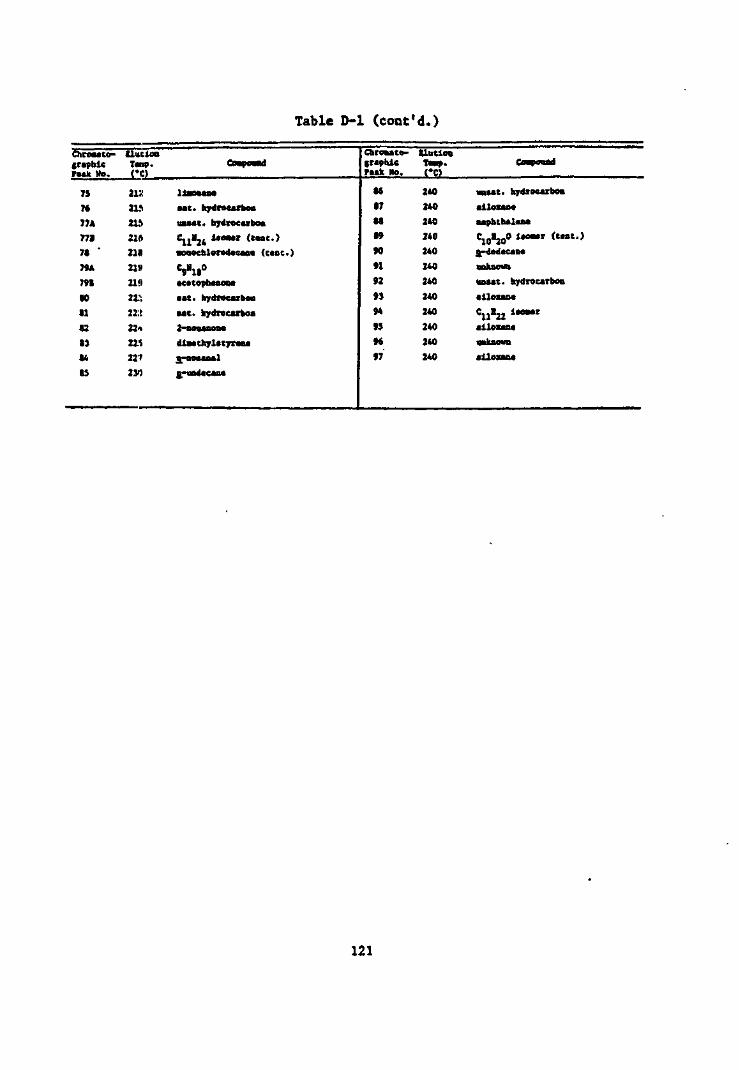
Table D-l (cont'd.)
Chreuto-(raphlcP**k No.
75
76
77*
77B
78 '
79A
798
SO
81
82
S3
84to
SluKionTctip.CO
212
21.1
21.1
21ft
2111
21!)
22,'L
22:!224
22'i
22'»
230
Co-pound
!!»....••t. hydrocarbon
imMt. hydrocarbon
•onochlorod*caM (t«nt.)
C9»18°tc*tophnoM
•*t. hydrocarbon
•at. hydrocarbon2-000*000*
dlMthylatyrm*B-geaaaal
n.-undicau
Chrouto-irapaicPuk No.
868788899091929394
939697
UutlooT««p.CO
240240240240240240240240240240240240
Compound
mat. hydrocarbon
•llOUM
naphtha l*n*C10H20° Uo-r (""')£-dod*can*uakaovn
unaat. hydrocarbon
•lloiana
CUH22 laoMralloun*ankaowa•iloxaa*
121
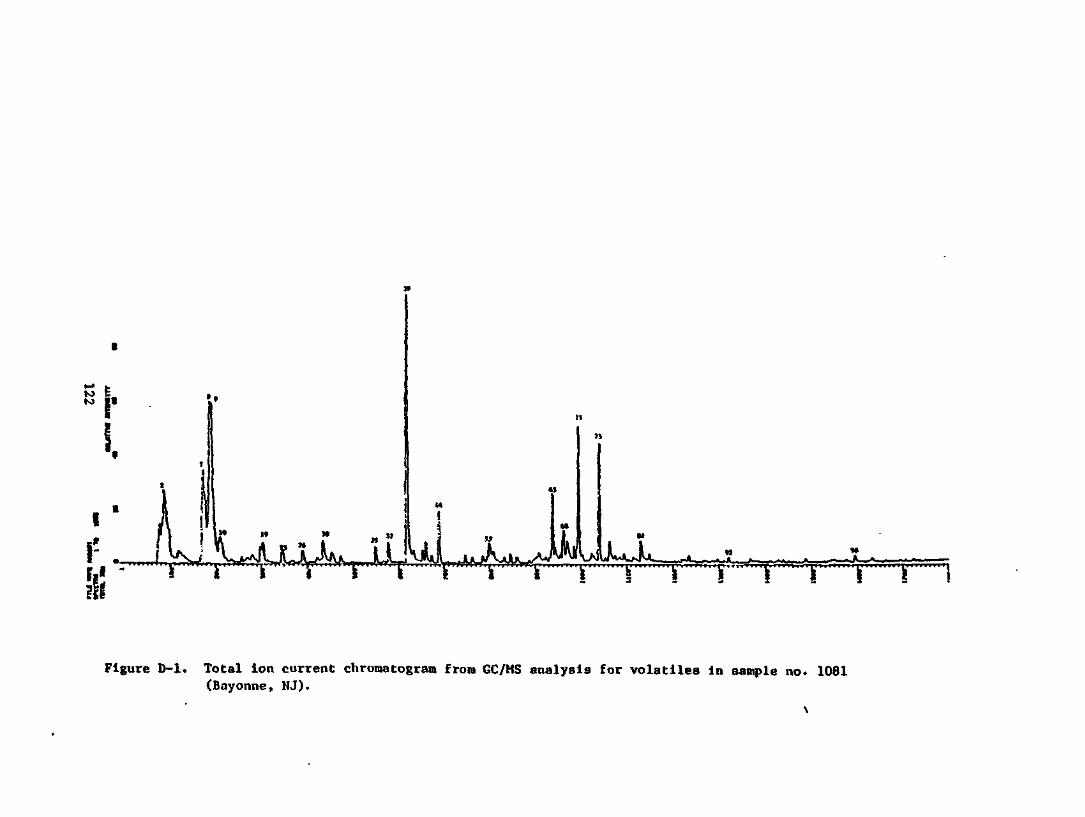
M
^Jw^M***-,^^ .
Sf ........ V ......... fc1 i i * . . . . . . . . r . . . . . i " i i
Figure D-l. Total ion current chromatogram from GC/MS analysis for volatiles in sample no. 1081(Bayonne, NJ).
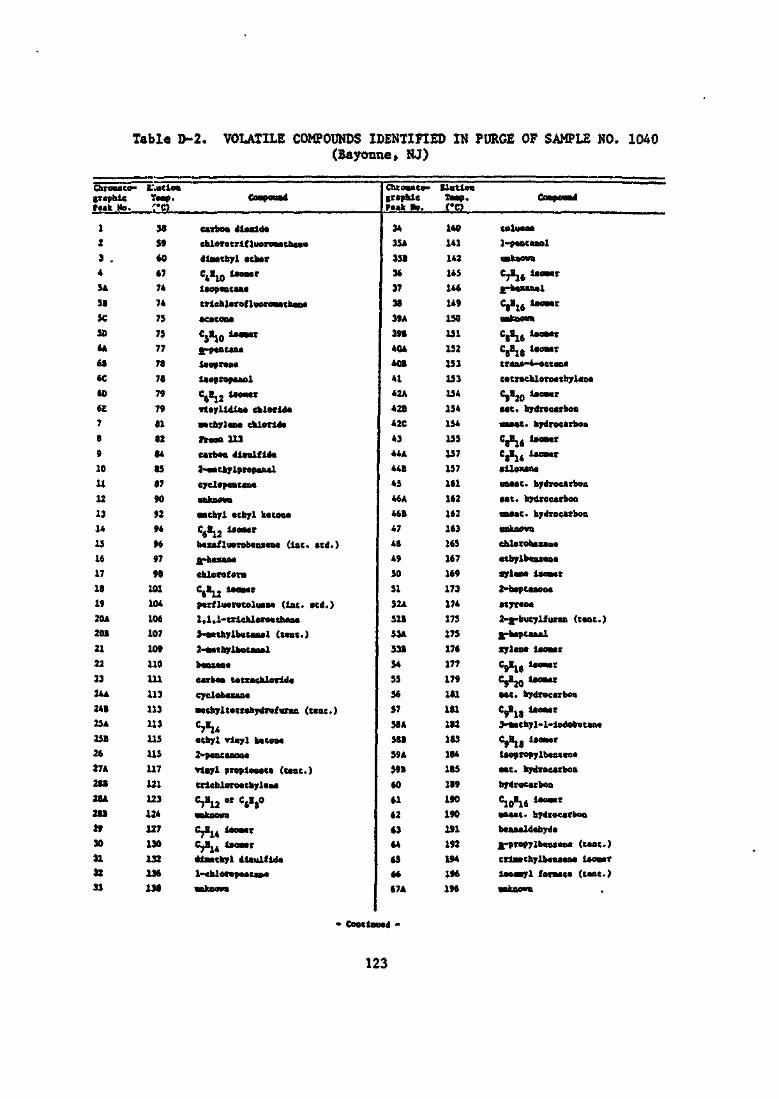
Table D-2. VOLATILE COMPOUNDS IDENTIFIED IN PURGE OF SAMPLE NO.(Bayonne, NJ)
1040
Cbrouco-iraphlcFuk Me.
1
2
3 .4
5A
SB
5C
SO
6A
61
6C
60
6£
7
8
9
10
11
12
13
14
13
16
17
18
19
20A
201
21
22
23
24A
24B
25A
23B
26
27A
28B
28A
28B
29
30
31
32
33
t.utioo•r«p.
38
59
60
67
74
74
75
73
77
78
78
79
79
81
82
84
85
87
90
92
94
96
97
98
101
104
106
107
109
110
111
113
113
113
115
115
117
121
123
124
127
130
132
136
138
Covpouad
Mrbaa dteaidacaleratrlfluoroajatbaaadlMtbyl ataarC.H.0 iWMrlaopaatMatrlehlarofluoreajathaa*•eatoaaCjH10 laaaarn-paataaalaepraaalaoprapaaal
Vl2 Uo~r
vtnylldlaa ebleridaavtbylana cfalorid*ftaoa 113earboa diaulflda2-vataylprepanaleyelopaatanaunknownMthyl athyl kacoaaC.tL, laoaarbuaflueTobaaiaa* (int. atd.)£-haxaaacalerefoniC6«12 Uo""parfluoroteluaM (lat. >td.)1,1.1-trlchlemthaaa3-Mthylbutaaal (tut.)2-Mthylbutaaalbauaatc«rboa tatraealaxidicyclobuun*
C7H1*•tbyl vlayl katoa*2-p«nt«noo«Tlnyl proplaaaM (taat.)tziebloreatbylaaaC7H12 " WoakaoimC7814 laoa*rCjH14 laoMrdlMtnyl diauldda1-ealenpaataa*
"aluam
jrtphleP«ak No.
34
35A
351
36
37
38
39A
39B
40A
40B
41
42A
42B
42C
43
44A
44B
45
46A
46B
47
48
49
30
51
52A
52B
53A
331
34
35
36
57
58A
581
S9A
59B
60
61
62
63
64
63
66
67A
UutloaTaap.fC)
1*0
141
142
145
146
149
ISO
131
152
153
153
154
154
154
155
137
157
161
162
162
163
165
167
169
173
174
173
175
176
177
179
181
181
182
183
184
185
189
190
190
191
192
194
196
196
Compound
COllMO*
1-paataael
imkaown
C;H16 laoMr
^phtfMUuil
8^1 & laHMaT
unknownC|B1& taoMtCjH18 UoMttr«n»-*-oet«n«tatraehleTo«thyl«a«
•at. hydrocarbonoaaat. hydrocarbonC>H16 iaeawrCgB14 laoMiailouaauaaat. hydrocarbonaat. hydrocarbonoBMt. hydrocarbonaakaewaebletohtcan*athylb«uaaa*ylaat iaoawr2-bap canon*•tyt*o*2-£-bucylfuran (tant.)a^haptaaalsylaaa taoaarC9B18 laoaurCjBjQ laoatar•at. hydrocarbon
Vis 1"~r
3-*aehyl-l-ladebutaa«C,HI8 l.o~rtaeptopylbaaxto*aat. hydrocarbonhydrocarbon
uaaat. hydrocarbonbaasaldabyda£-propylb«nt«n« (tant.)triaathylbrataaa iaoaurlaoaayl format* (taat.)aakaevB
- Caatlauad -
123
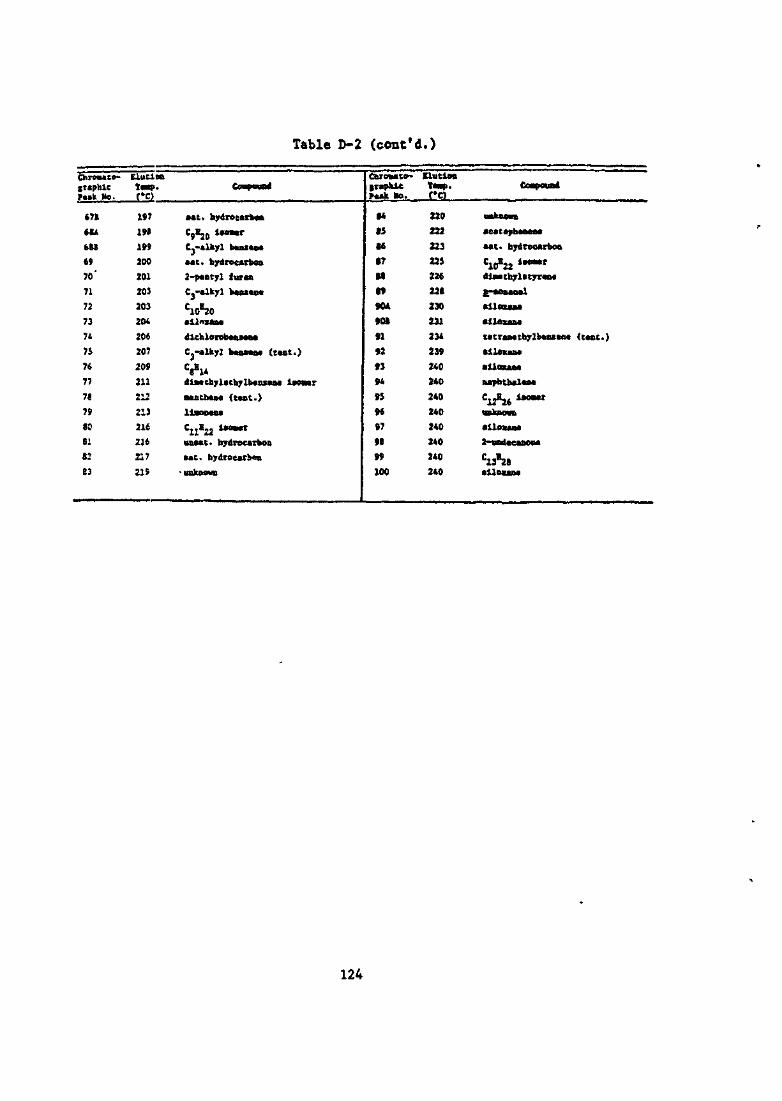
Table D-2 (cont'd.)
ChroMce-iraphlcptak No.
671
68A
681
69
70 "
71
72
73
74
7i
76
77
76
79
80
81
82
E3
UuCiooT«*p.CO
197
198
199
200
201
203
203
204
206
207
209
211
212
213
216
216
217
219
Covpouad
aat. hydrocarbon
CgEjg laoawr
C,-«lkyl bkniaoa
aat. hydrocarbon
2-pantyl furan
Cj-alkjrl bcuttM
C1CH20•llnunadlchlorobanaanaCj-alkyl bmaaM (cent.)CSH14A IAC cbylccby HVCOXWM ivoMtr
•aothaaa (taot.)
llaoDaoaC1,E,2 iaowtruaaat. hydrocarbon*at. hydrocarbon
•unknown
traphleraak to.
•4
85
86
67
H
•9
90A
90»
919293949596979899100
butlra
<%'
22022222322}226228230231234
239240
240
240
240
240
240
240
240
C-pc^
unknown
aeatopbaaona
aat. hydrocarbon
C10>22 i""1"diBathylatyran*
n-nonanalalloxan*alloxanatatraMthylbauao* (tant.)•llouna•lloxaaanapbtbalutaC12E26 i"a*t
unknownallouna2-nndaeaaoDa
C13E28alloxana
124
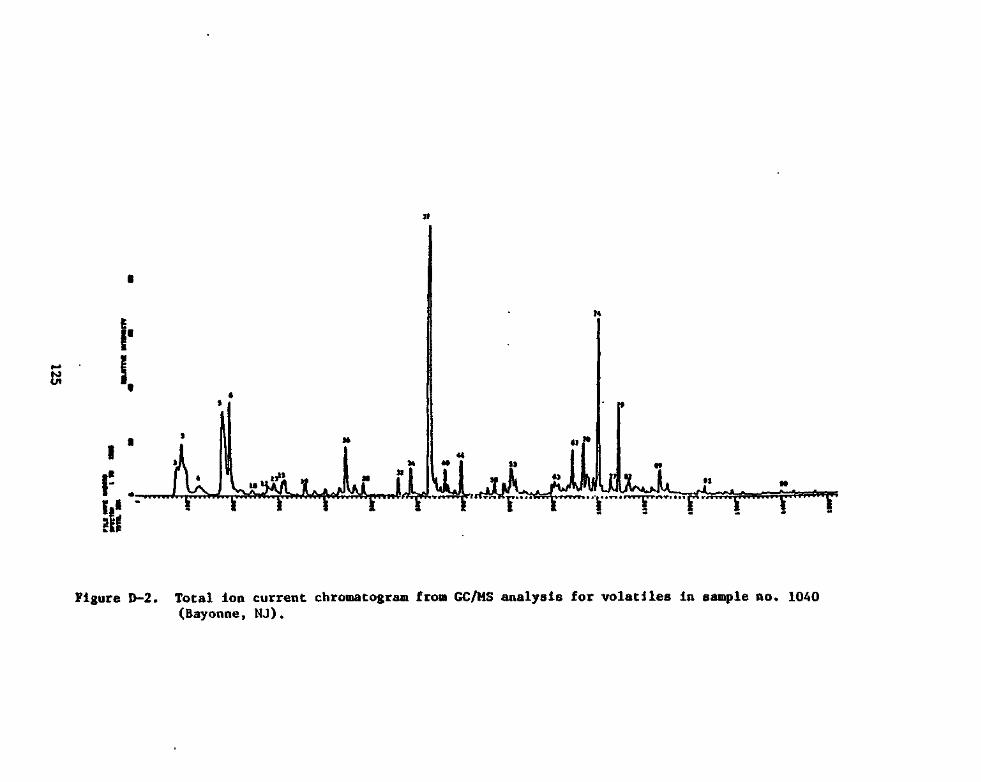
I1
I'.Ill I»T-» T • > • i ••• i iTTf • i »T»y«^'i^Tr> ••• rn
Figure D-2. Total Ion current chromatogram from GC/MS analysis for volatiles In sample no. 1040(Bayonne, HJ).
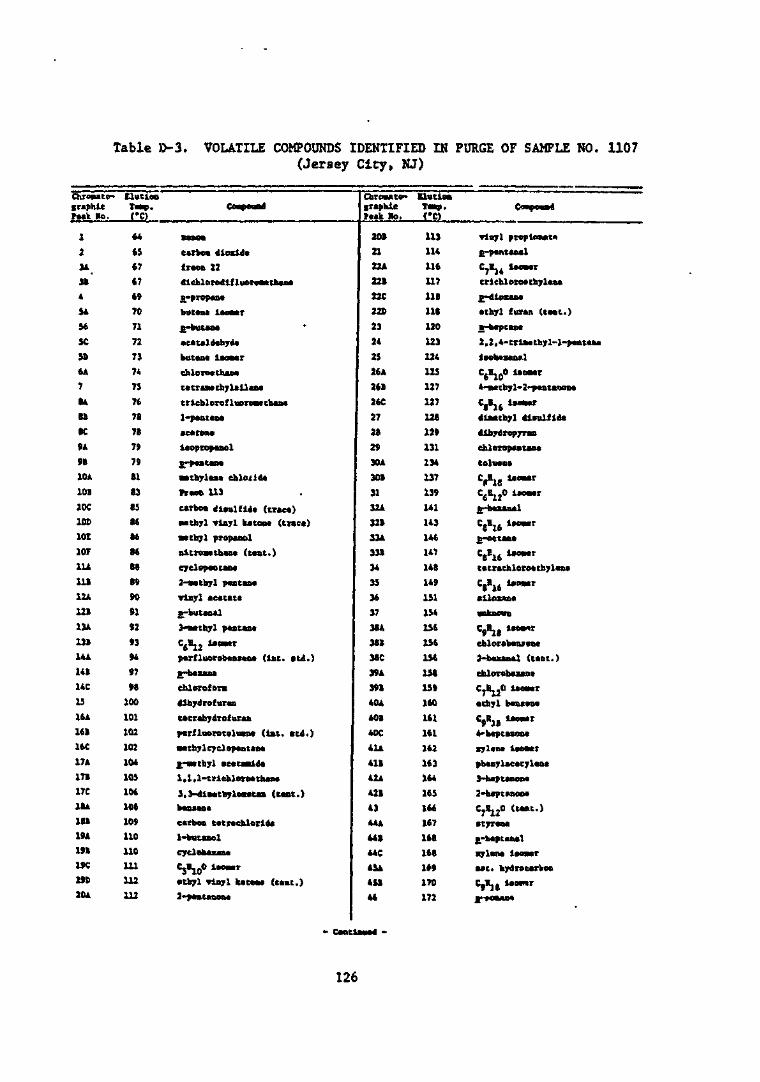
Table »-3. VOLATILE COMPOUNDS IDENTIFIED IN PURGE OF SAMPLE NO.(Jersey City, KJ)
1107
ChroBate-iraphlcPaak No.
1
2
3*
31
4
54
56
SC
36
6A
7
8*
81
8C
9A
91
10*
10B
IOC
IOC
101
lor11*in12*
121
13*
131
14*
141
14C
15
164
161
16C
17*
171
17C
IB*
181
19*
191
19C
19D
20*
Elutiealap.CC)
64
65
67
67
69
70
71
72
73
74
75
76
78
78
79
79
81
83
85
06
86
86
88
89
90
91
92
93
94
97
98
100
101
102
102
104
105
106
108
109
110
110
111
112
112
* -
SMM
carbon dloxld*
fraoa 22
dlchlorodlfluoroMtbua
£-propant
but«Di laoBtr
ja-butana
aeataldahydt
butwa l*oMr
chlorocthan*
tctraMtbjlaUau
trichlerof luoroai than*
1-pantao*
accent*
laopropanol
«~p«itan.
Mttyrlu* cbloild*
Tram 113
carbon dKulfldt (me*)•atbyl »tnyl Uton* (tract)
Bttbyl propwol
nitrowtlkut (teat.)
cyclopcs taa«2-Mtbyl putiaa
vlajrl aeatata
a-butaoal
3-«*cbyl pantant
C6B12 *«»"parfluorobuima (int. ltd.)
v-basu*
eblorofeiB
dibydrofuraa
Utrabydrofuran
pcrfluororoluaM (1st. ttd.)
MCbylcyclopaatana
£-»ttbyl acacnld*
1,1.1-trlchlerMtbaB*
3. 3-diB»tbylo»ta» (Mot.)buuaa
carbOB tctracblorld*
1-buunol
cyclobaian.
Cjlj^pO ivowr
•tbjl vlnjl kctoM (teat.)
2-p*BUBOB«
Chr ovate-graphicPeak Ho.
201
21
22*
221
22C
22D
23
24
25
26*
26B
26C
27
28
29
30*
30B
31
32*
321
33*
331
34
35
36
37
38*
381
38C
39*
391
40*
401
40C
41*
411
42*
421
43
44*
441
44C
AS*
451
46
Uutleatap.
113
114
116
117
118
118
120
123
124
125
127
127
128
129
131
134
137
139
141
143
146
147
148
149
151
154
156
156
156
158
159
160
161
161
162
163
164
165
166
167
168
168
169
170
172
Conpoiart
Yloyl proplonat*o-puntanalC7«14 *— «tt 1 chl oro» chjlaoa
E-dloian.
•tbyl furan (cunt.)
B-hnptaot
2.2,4- criM tbyl-l-pcBtaoa
lietwuiul
CtEloO l.o.r
4-Mcb7l-2~p«Bt«noBa
C8B16 1"°**r
dlMtbyl diaulfld*
dlhydropyran
cblorop«BCaoa
tOllMO*
Vie uo-r
C6E120 iaoMr
£-huanal
Vj6 i.*r
ji-octana
C8E16 t>OBtr
tatrachloro«tb>l«n«
Vl6 i*°**t
•lloxaa*
inkBCVB
CjHjj Ifomn
cblorobaaiao*
j-bcxaaal (teat.)
ehlorabuBJU
C7B12° U""r
•tbyl bm*»«
CjEJ8 iMMr
4-hcptaBOBi
ryl.n, IMMT
BbuylacatylaBt
J-hupcanon*
2-hcptnaoB*
C^jO (tut.)
•tyraw
B-hapiaBal
xylana I»OB«T
•at. byrtroearkoo
C.1L| laomr
..-««««
- Cootlauad -
126
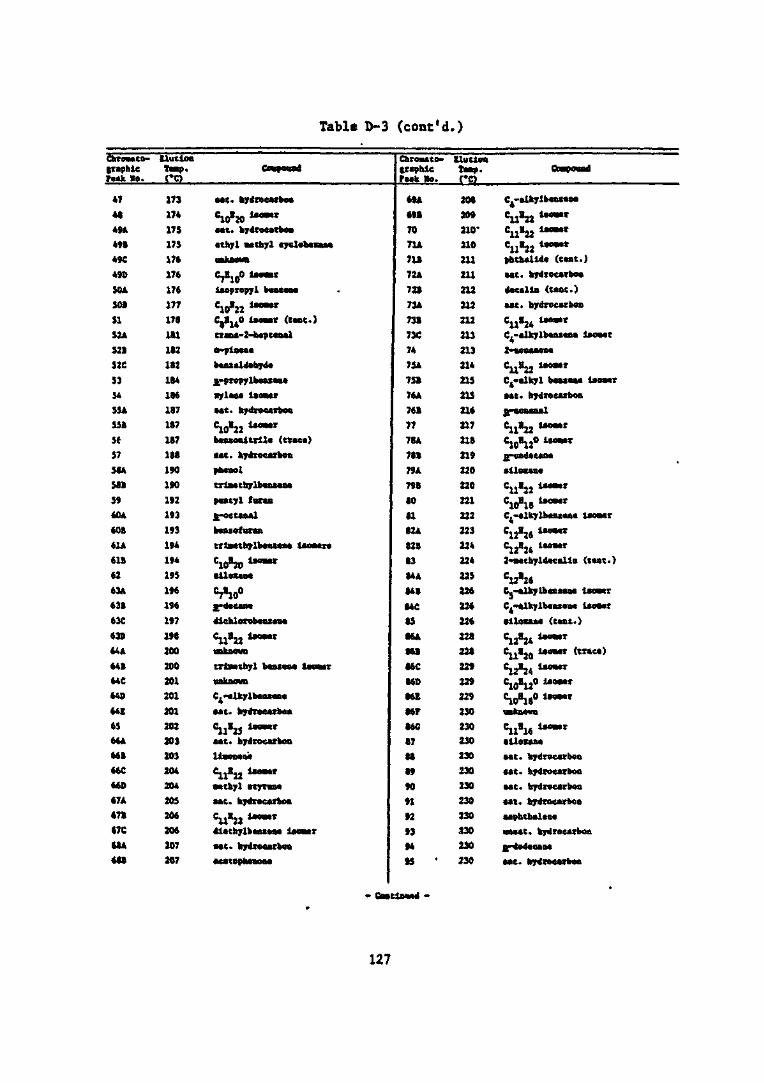
Table D-3 (cont'd.)
Chroaata-iraphic
47
4849*49B
49C
49D
SO*
SOB
SIS2A
52B
32C
S354
55*S5B
5«57
58*
S8B
5960*
608
61*
61B
62
63*63B
63C
63D64*
64B64C
64D
64E
6566*
66866C
66D47*
67B47C
68*
«8B
(lutlonTa».I*C)
173
174
175
17S176
176
176
177
178181
182
182184
186187187
187
188
190190
192193
193194194
193
196196
197
198
200
200
201201
201
202203203204
204
205206206
207207
CoapOUOd
•at. hydrocarbonC10iJO laoMraat. hydrocarbon
•thyl aathyl cyclobaaaaaBQk&OWB
C7H1()0 laaan
laoprepyl baaaanaC10H22 1*OB<rCjH140 laoaar (tact.)
tzana-2-baptanala-plaraa
busaldohydonrpropylbauua
xylana laoawraat. hydrocarbonC10»22 Uo*trbauonitrlla (tract)
•at. hydrocarbonphenol
triaatbylbauaaa
pantyl turaa£-octaaalbaniofuran
trfcatthylbaaxaaa laoMraC10B20 t*°-t•lluaaaC,,B_ _fl/ ±0o*4ccuMdichl orobtnxnt
C11H22 U<"*ronkaown
trl»tthyl baaiaoo iaontarunknovnC -alkylbantana
•at. hydrocarbonC11H23 ***"aat. hydrocarbonllaoa*n«
CjjHjj iaoa«r•a thyl ityranaMt. hydrocarbonC11H22 **"•dlathylbutana iaoatr
•at. hydrocarbonacatophanona
(raphlcPMk Mo.
69*
69B
7071*
71B
72*7 IB
73*
73B
73C74
75*7SB
76*76B
77
78*
78B
79*
79B
80
8182*
82B
8384*
84B
84C
86*
86B
86C
86D
86E
86F
86C
87
88
89
9091
92
9394
•5
llutlonTan.(*C)
208209
210-210
211
211
212
212
212
213
213214
215
215
216217
218
219220
220
221
222
223
224224
225
226
226
396•Av
228
228
229
229
229
230
230MO
230
230
230
230
230
MO230
230
CoBnooad
C4-.lk,lbu..«
Cll»22 lM-rC11H22 1"~rCll»22 l<0-*phthalld* (tut.)
•at. hydrocarbon
dacalla (taat.)aat. hydrocarbonC11B24 Uo—r
C -alkylbauu* laoaar
2-flonanonaC11H22 Uo— *C4-alkyl banaana iaowrMt. hydrocarbon
£-ooaaaalC11822 Uo-«C10»120 »— «n vadacana
allosanaC11H22 i'°"r
C10B18 «*" r
C -alkylbanxaaa laoaarClJHj6 laosarCUH:4 iaoMr2-atthyldacalln (tant.)
C12»26C.-alfcylba»ana lioacrC -alkylbonaana iaoaar
C12H24 * "C11H20 UOMI (««e')
C12H24 llo~rC10H12° """C10B18° 1>OMI
unknovnC11H16 Uc~r•llosana•at. hydrocarbon•at. hydrocarbon
•at. hydrocarbonaat. hydrocarbonaaphthalanaunaat. hydrocarbon
jg-dodacanaaat. hydrocarbon
• Coatlnatd -
127
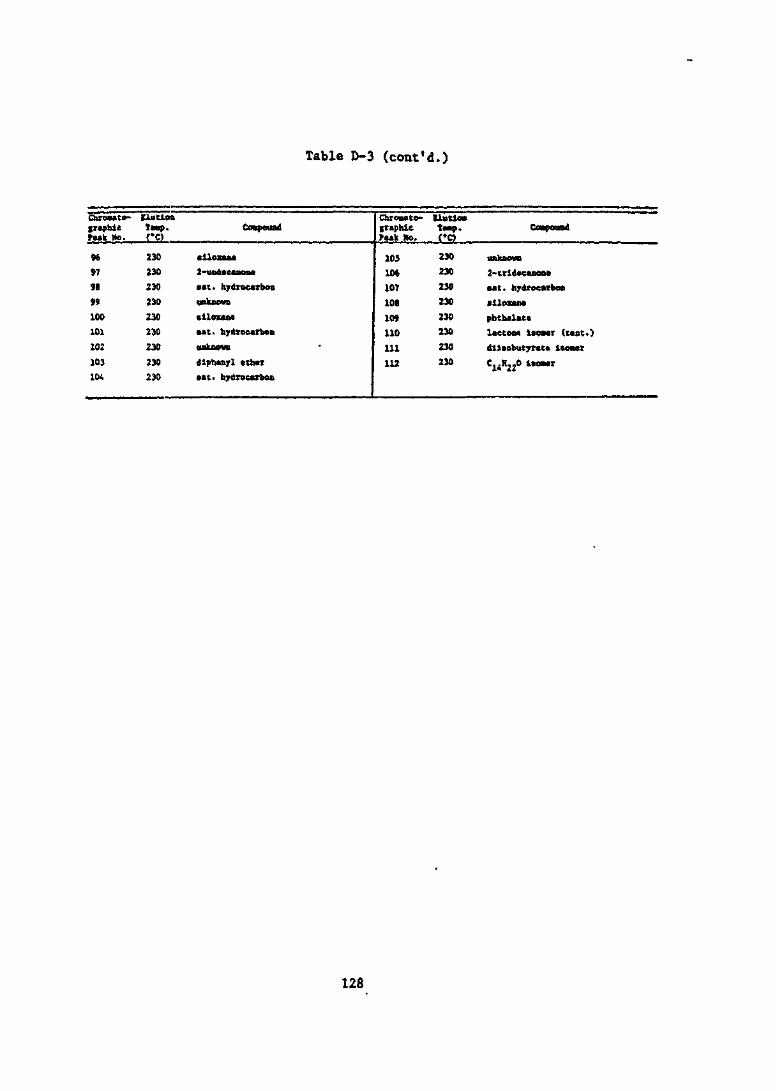
Table D-3 (cont'd.)
Chrouto-§«phicPt»k No.
96
97
98
99
100
101
102
103
101.
ElUtlOB
Co'
230
230
230
230
230
230
230
230
230
fc^d
•lloun*
2-undocuon*
•it. hydroorbon
unknovB
• llOXUM
•it. hydrocarbon
unknovn
diphuyl tthur
Mt. hydrocarbon
Chroiato-grmphlePuk Ho.
105
106
107
108
109
110
111
112
ElutionTap.CO
230
230
230
230
230
230
230
230
CCMBDOUBd
unkaovn
2-CrldKIAOM
•»t. hydrocirboo
vllouni
phth»l»te
Ittctoni ivoBtr (tint.)
dil»obutyr«t« itoacr
C14R22° 1>OMr
128
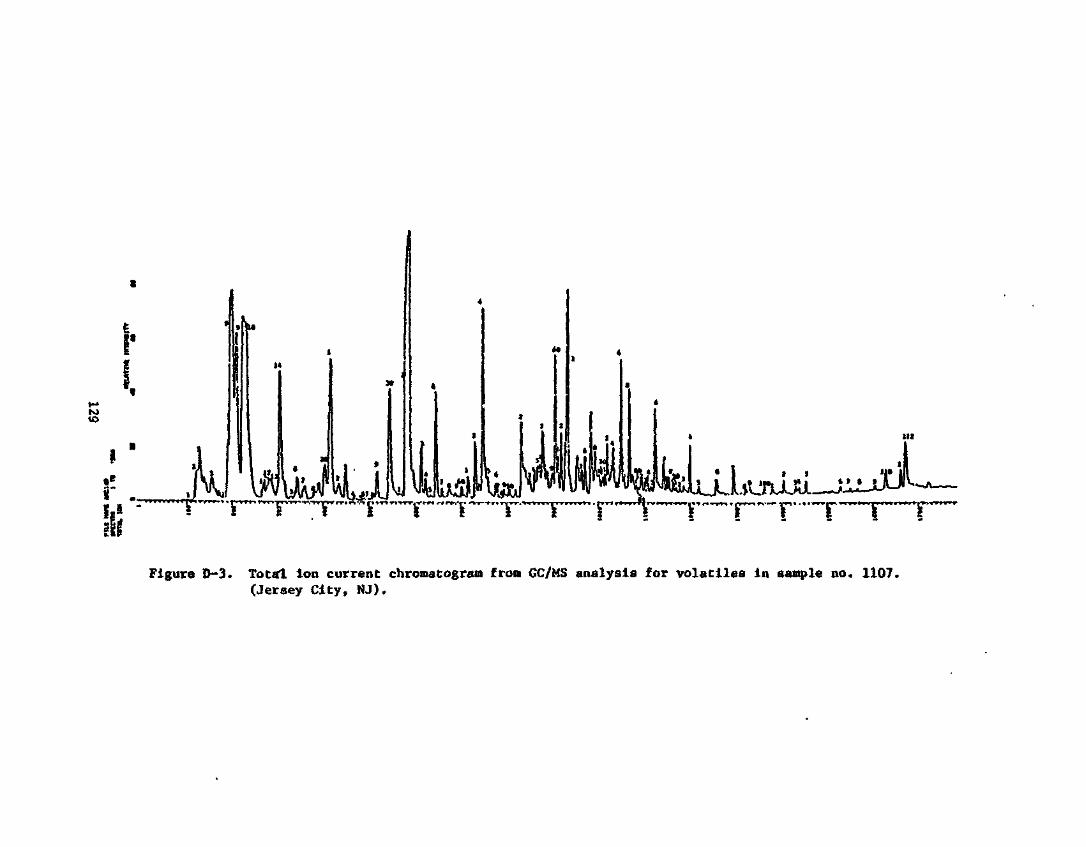
rt-fr* (-rrvrr> *-vf--rr*T<-»r-.^f < • •»>!< •FTI-TTI . £""•* rr^fwr »••
m
py,,.,.....,..,.™
Figure D-3. Total Ion current chroroatogram from GC/MS analysis for volatiles in sample no. 1107.(Jersey City, NJ).
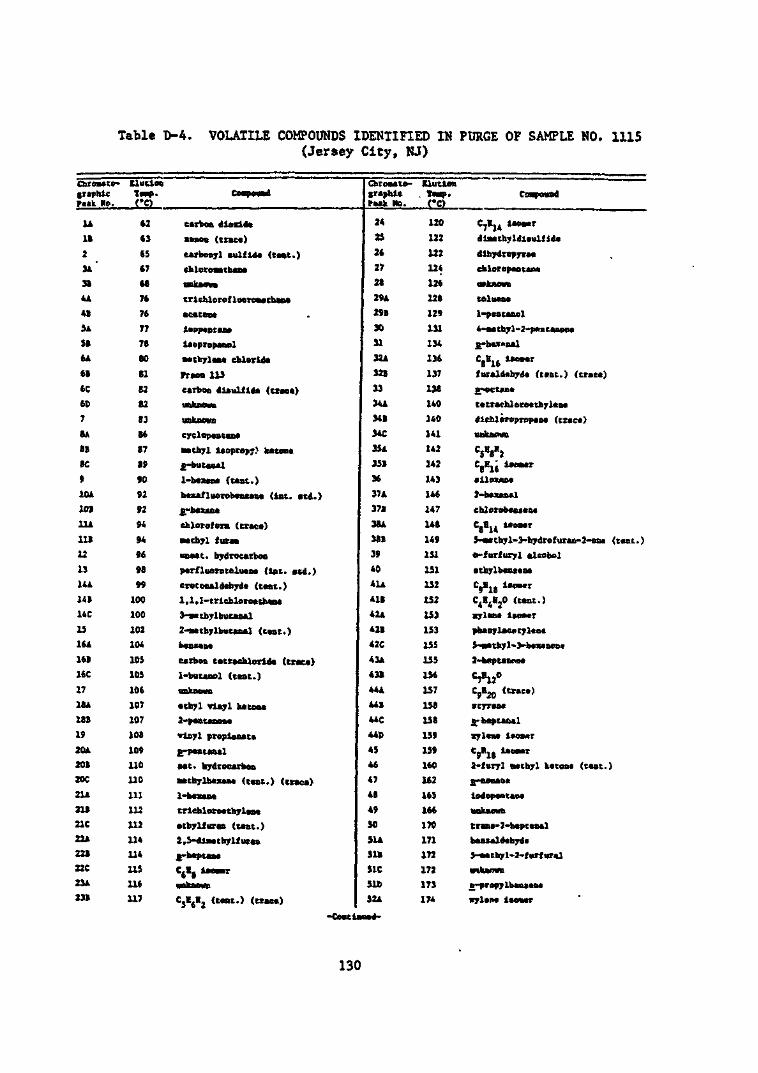
Table D-4. VOLATILE COMPOUNDS IDENTIFIED IN PITRGE OF SAMPLE NO.(Jersey City, NJ)
1115
ChroM to-graphicPtak No.
1A
11
2
SA'31
4A
41
SA
SI6A
61
6C
60
7
BA81
BC
9IDA
101
HA
111
12
13
14A
141
14C
15
16A
161
16C
17
18A
181
19
20A
201
20C
21A
211
21C
22A
221
22C
23A
231
Elutiet
ro'62
63
65
(7
68
76
76
77
78
80
81
62
82
83
86
87
89
90
92
92
94
94
96
98
99
100
100
102
104
103
103
106
107
107
JOB
109
110
11C
11111:112
11*
11*
115
116
117
Co^d
carbon dioxide
xanon (traca)
carbonyl aulflda (taat.)
chleroBathane
unknown
trlchlorofluoroMtbkBa
acataot
laopaataaa
laopropaaal
•athylaat ehlorlda
FraoB 113
carbon diaulilda (traca)
unknown
unknown
cyclopancaM
avthyl laoprep;? katont
B-butaaal
1-baxana (tant.)
htxanuorobauBae (int. atd.)
Bj-baunt
chloroform (tract)
•ethyl furan
uaaat. hydrocarbon
parfluorotBluana (1st. atd.)
erotonildahydt (taat.)
1 . 1 . 1-triehloroa thant
3-Mtbylbutaul
2-BttbylbvtauU (cast.)
bansent
carbon tatraehlortda (traca)
1-butanol (tant.)
unknown
athyl vinyl katont
2-ptntanont
vinyl propieaatt
g-pantanal
aat. hydrocarbon
••thylbexaat (tant.) (traca)
l-basana
trlehloroathylaaa
athylfuraa (taat.)
2.5-diMthylfuran
arbaptaaa
CjBj laoaar
unknown
CjEglj (tant.) (tract)
CbroMto-iraphicPaak Ha.
24
25
26
27
28
29A
291
30
3132A
321
33
34A
341
34C
ISA
331
36
37A
371
3BA
381
39
40
41A
411
42A
421
42C
43A
431
44A
441
we4*0
45
46
47
48
49
SO
S1A
511
SIC
SID
S2A
-Continute-
Clutlon. Ta«p.
CO
120
122
122
124
126
128
129
131134
136
137
138
140
140
141
142
142
143
146
147
148
149
151
151
152
1S2
133
153
155
155
156
157
158
158
159
159
160
162
163
166
170
171
172
172
173
17*
CiapouBd
C7EJ* Uo"* r
dlMthyldlaulfidt
dlhydropyran
chlorepantant
ORknovn
toluaoa
1-paatanol
4-*etbyl-2-pKntanom
s-buinal
C.B., iaavarB 10
furaldnhydt (taut.) (tract)
Bj-octant
tatrachlorotthyjiant
dlchloroproptnt (tract)
unknown
C5H8II2CjE^j laimrailouut2-haxan«lehlorobaniantC,E,4 iaoatr5-Mtbyl-3-hydrofuraD-2-ont (tant.)e-furfuryl alcoholathylba&tantC0Blg iioacrC^MjO (cant.)sylant laomtrphtBylMKCyltnt5~Mthyl-3-btunoBt2-b«pttnnM
C7B12°
SH20 <trmct)
atyrao*
b-htpttntl
ryltn* Iroacr
CjRlg iaomar
2-furyl attbyl kttont (tant.)
B-nonant
lodopantant
unknown
trani'2-baptanal
baataldthydi
S-Mtbyl»2-fnrfura,l
onknowB
v-propy Ibaniant
nylana laovtr
130
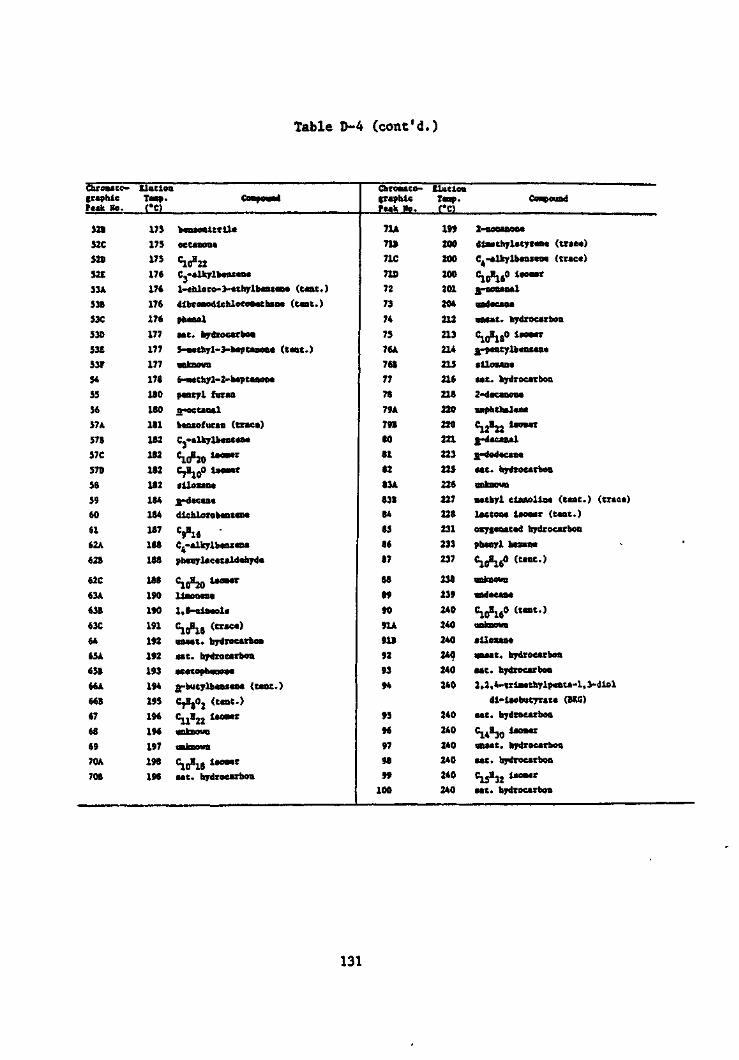
Table D-4 (cont'd.)
Chromato-fraphicFtak No.
52B
32C
52D
52E
53A
53B
53C
53D
53E
53F
54
55
56
57A
57B
57C
370
58
59
60
61
62A
62B
62C
63A
63B
63C
64
65A
65B
66A
66B
67
68
69
70A
70B
IlutloaTap.CO
175
175
175
176176
176
176
177
177
177
178
180
180
181
182
182
182
182
184
184
187
188
188
188
190
190
191
192
192
193
194
195
196
196
197
198
198
COBOOUaal
banaonUrUa
occaoont
C10H22Cj-alkylbtaxtna
l-chloro-3-*thylbaiat (tat. )
dibroBodlchloroMtbana (tat.)
phenol
•at. hydrocarbon
5-«thyl-3-haptaaou (tat.)
unknown
6-**thyl-2-btptanoat
patyl furan
o^oc canal
btnzofuran (tract)
Cj-alkylbtnaaa
Cfyf iao-r
•ilosant
g-dacana
dichlorobtncat
C9H16 'C^-alkylbaxaa
C10H20 U— rllaonant
l.B-clMolt
CjgBjj (tract)
anaat. hydrocarbon
•at. bydrocarboA
acatophanoaa
»-butylbaiua (tant.)
C^BgOj (ttnc.)
CUB22 lacnar
unknown
C10B18 lgo->r
aat. hydrocarbon
Chroaa to-graphicFtak No.
71A
711
71C
7U>
72
73
74
75
76A
76B
77
78
79A
79B
80
81
82
83A
83B
84
85
86
87
88
89
90
91A
91B
92
93
94
93
96
97
98
99
100
Elationlap.CO
199
200
200
200
201
204
212
US
214
215
U6
US
220
220
221
223
225
226
227
228
231
233
237
238
239
240
240
240
240
240
240
240
240
240
240
240
240
Conound
2-nonanona
diaithylttyrat (tract)
C4-alkylb«nitat (tract)
C10H16° 1*°-r
a-nonanal
undacana
unaat. hydrocarbon
lu 18n— pantylbtnaana
•Uoiant
•at. hydrocarbon
2-dtcanont
napfathalaat
C12H22 Iwmtr
n^dacanal
n^dodacant
•at. hydrocarbon
unknown
mathyl etanoltat (tut.) (tract)
lactont iao*«r (tant.)
oxyimatad hydrocarbon
phanyl baxaaa
unknown
nndacana
=10=16° <M"-)
allozan*anaat. hydrocarbon
•at. hydrocarbon
2.2,4- trlaathylpenta-1, 3-dlol
dl-laobutyrata (BKC)
aat. hydrocarbon
C14H30 lB81wr
unaat. hydrocarbon
aat. hydrocarbon
C13H32 *— «•at. hydrocarbon
131
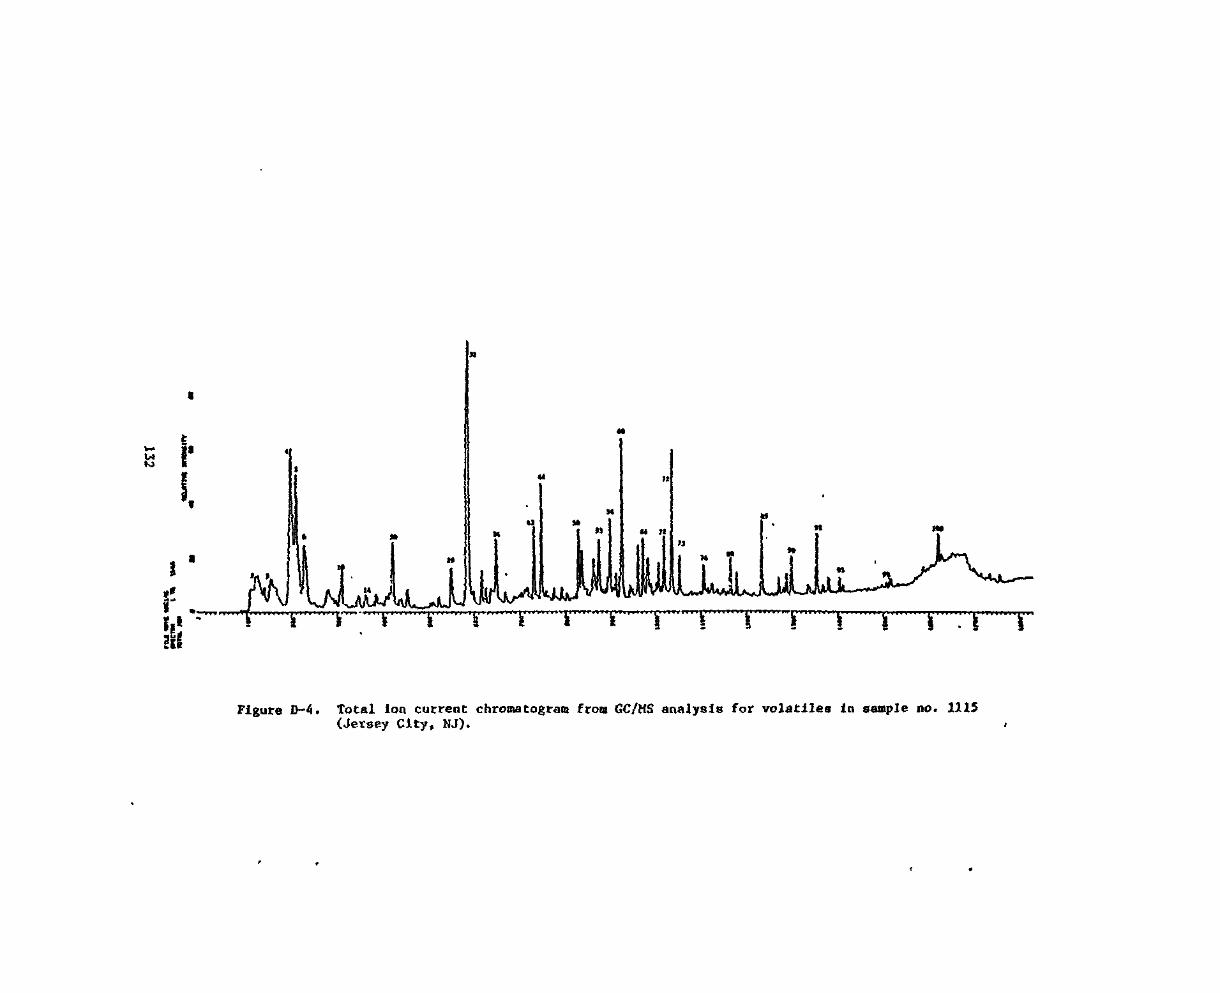
Figure D-4. Total ion current chromatogram from GC/MS analysis for volatiles in sample no. 1115(Jersey City, NJ).
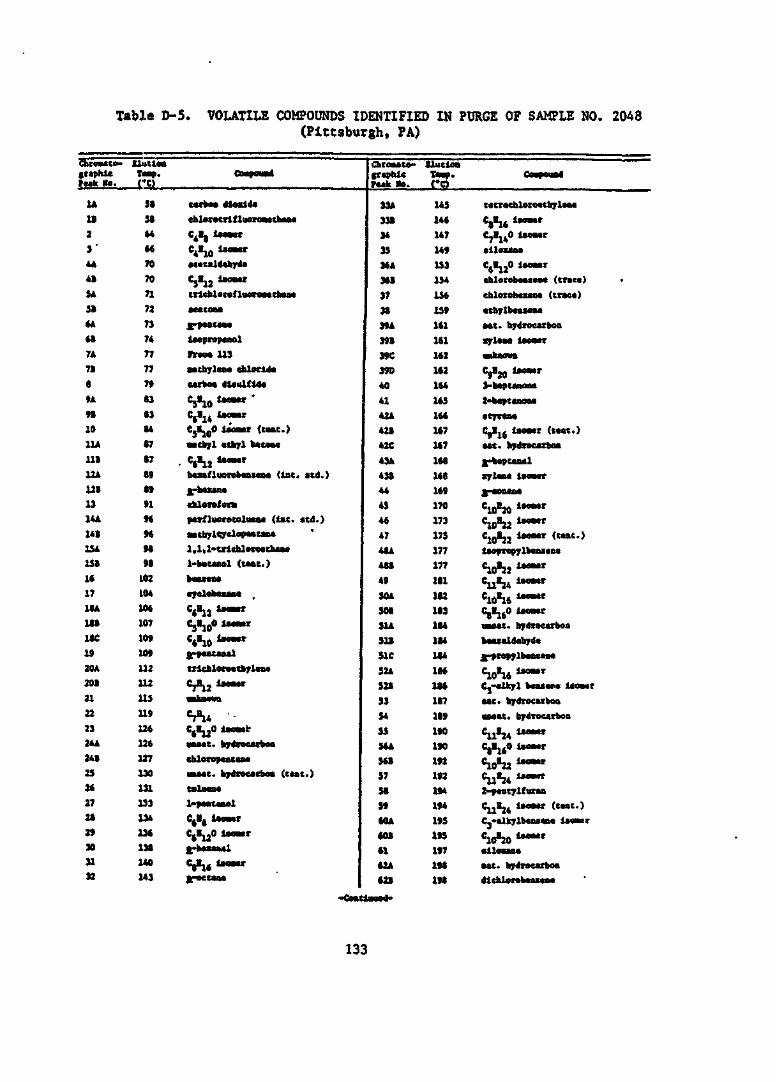
Table D-5. VOLATILE COMPOUNDS IDENTIFIED IN PURGE OF SAMPLE NO.(Pittsburgh, PA)
2048
Chroma to-graphic•uk No.
1A
11
2
3'AA41
SA
SI6A
617A
71
89A
91
1011A
11112A
1211314A
141ISA
1S116
1718A
181iac1920A
201
21
22
2324A
2*12526
2728
2930
3132
Uutlwtap.
58
5164
66
70
7071
7273
74
77
7779
S3
8384
87
87
89
8991
96
969698
102104
106107
109
109
112
112
113
119
126
126
127130
131
133134
136138140
143
Compound
carboa dloddaehlerocrlfluoramathaaa
C4H, iaomarC^Hyj laomtr
aeataldahyda
CS«12 Uo-r
trlehlorof luornma thi oaaeatooa
X-putaaa
laopropuol
fraon 113•athylaaa chlorlda
carboa dlaulfida
CjHj,, l.o«r '
Vu *-r*CjHjpO iaomar (tut.)
macbyl athyl tauoa
• C6"l2 ta""ha»fluorebaa*ua (int. ltd.)a-baxanachloroform
pmfluorocoluaaa (Int. atd.)•atbyHarcloputan.
1.1,1-WlcblaTMChaa*
1-butaaol (tue.)baasaoa
eyclebaxaaa
C6«12 U""CjHjoO 1— rC6«10 *— "D ' MPf^PT^
CTl CblOiTOV Cb vl V*M
CjHjj iaomar
•nknown
S*!*C6«12° *«»k
uaaat. bydrocarboa
cblerottaacan*•aaat. hydrocarboa (cut.)tolaaaa
1-pmataaol
V, Uo-'
Vl2° *— 'pbuanalC,lli taomart-octaaa
Chroma to-graphicFaak *».
33A
331
34
3536A
361
37
38
39A
398
39C390
40
41
42A
421
42C
43A
43144
4346
47
48A
481
49
50A
SOI
51A
311SICJAM
52A
321
S354
55
56A561
57
58S9
60A
601
61
62A421
UutlOB
?o'145
146
147
149
153154
156
159
161
161162
162164
165166
167
167
168
168
169170
173
175
177177
181
182
183184184!•£AO*
186
186
187
189
190
190
192192
19*
19*
195
195197
198111
C-pound
tatrachloroachylaoa
CjH16 Iaomar
C7»l*° lie"r
•lloiaaa
Vl2° 1<c-r
ohlorobaotaoa (tract)
cblotoheiana (traea)
athylbanm*
•at. bydrocarboo
•ylaaa laomtr
onkaomC,H20 laa«r
3-baptaoaoa
2-baptanooa
atyraaaCjHjj Iaomar (taat.)uc. hydrocarbon
pbaptanalxylaaa IIOMTg-aoaaaa
C10H,0 Lour
CI()HJJ laomar (tant.)
laopropylbanitoa
C.0ljj laomtr
Culj4 laomar
C10*16 1"m"CgHjjO laomarunaat. hydxecarboa
busaldabyda
C10H16 *•""C.-aikyl baaaarc laomtr
•at. hydrocarboa
oaaat. bydrocarboa
Cll"24 U""
Vl6° U— r
610H22 t"*"Cll«24 *— «2-f«ntylfuraaC11H24 laomar (tut.)C3-a4kylban*«na laomtr
ClAfl *""'alloxaaa
•at. bydrocarboadleblorobaaiaM
133
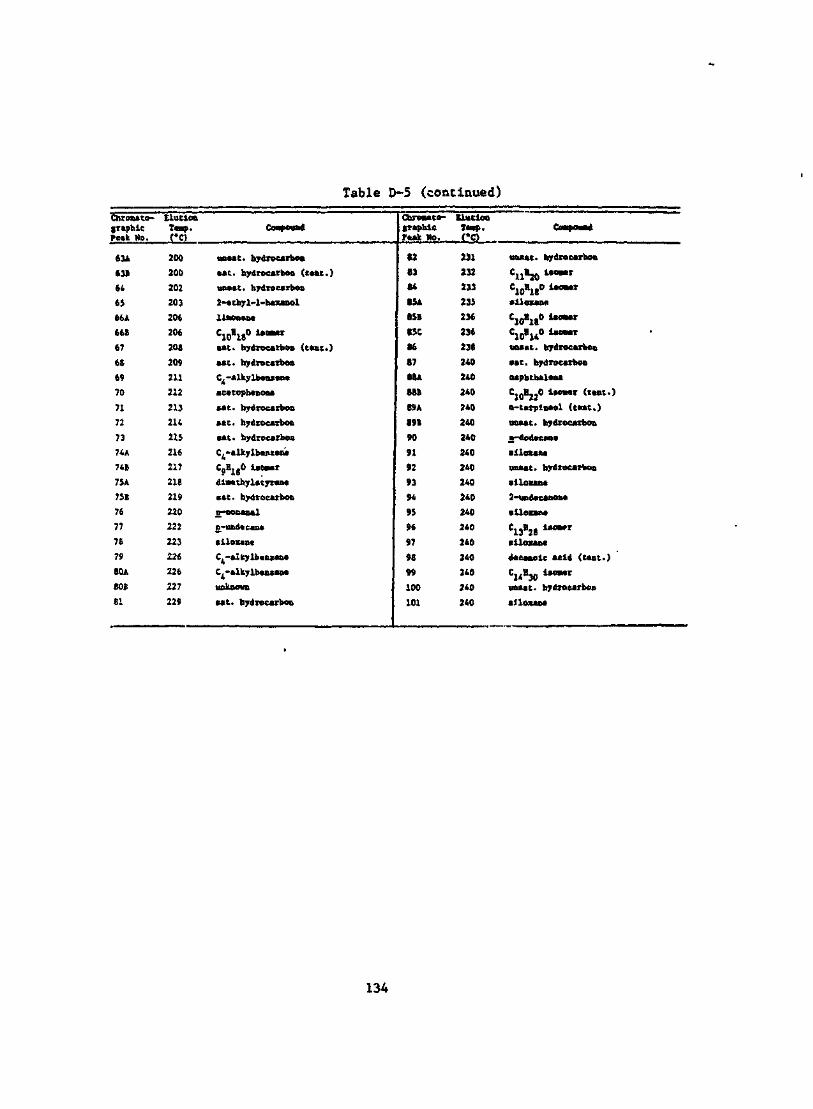
Table D-5 (continued)
Chronato-iraphicPeak No.
«3A
63B
6i
65
66A
66B
67
6S
69
70
71
72
73
74A
74B
75A
75E
76
77
78
79
BOA
80S
81
Elutlm
200
200
202
203
206
206
208
209
211
212
213
214
215
216
217
218
219
220
222
223
226
226
227
229
CoBpoimd
unaat. hydrocarbon
tat. hydrocarbon (teat.)
uoaat. hydrocarbon
2-*chyl-l-baxanol
ilaonan*
C10B180 Un*r
•at. hydrocarbon (teat.)
•at. hydrocarbon
C4-alkylb«nt«n»
acatophaooaa
•at. hydrocarbon
•at. hydrocarbon
•at. hydrocarbon
C^-alkylbanxnvt
C0Ei5° iaoaar
dlMthylatyrcna
aat. hydrocarbon
p-nocaaa.1
B-uodtcao.
•iloxane
C^-al ky Ibanxana
C^-alkylbaiunaunknown
•at. hydrocarbon
ChroHto-grapuieFcaV No.
82
83
84
B5A
KB
85C
86
87
88A
8BB
89A
89B
90
91
92
93
94
95
96
97
96
99
100
101
Slutlon
(*o'231
232
233
235
236
236
238
240
240
240
240
240
240
240
240
240
240
240
240
240
240
240
240
240
^-
unaat. hydrocarbon
C11B20 1M-r
C10B1«° ***»•HezaBii
CIOHlgO UOMT
Cic'l4° i*0ftr
unaat. hydrocarbon
•at. hydrocarbon
oapbthalau
C1()E220 i.o«r (..«.)
n~t*rpln»ol (tut.)
unaat. hydrocarbon
.B-dodacMt*
ailtntani
unaat. hydrocarbon
•lloxana
2-undacanonn
ailoxan*
C13B28 i"mrT
•iloxaot
dacanotc acid (tant.)
C»K30 Uol"r
unaat. hydrocarbon
alloxana
134
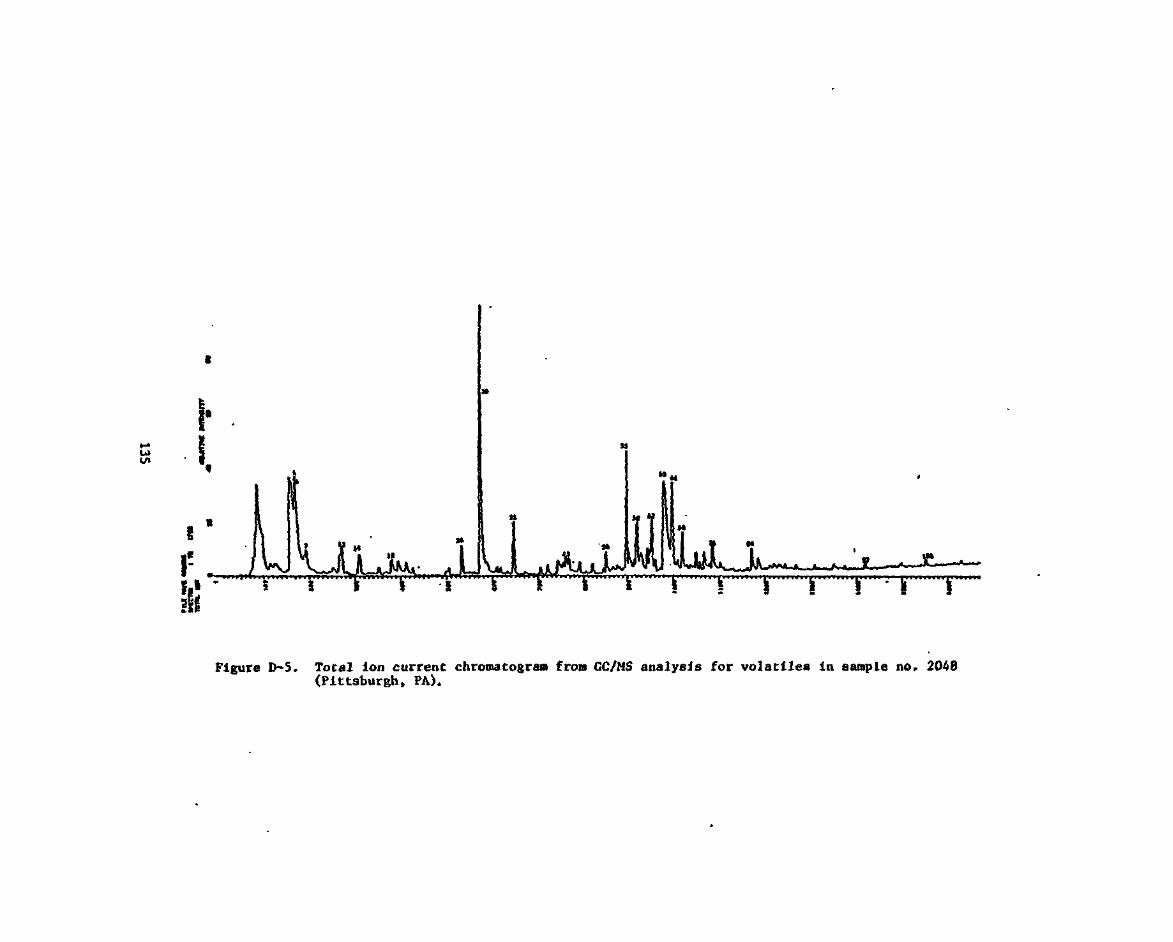
JLi i I I I I 7 I
Figure D-5. Total ion current chromatogram from GC/MS analysis for volatlles in sample no, 2048(Pittsburgh, PA).
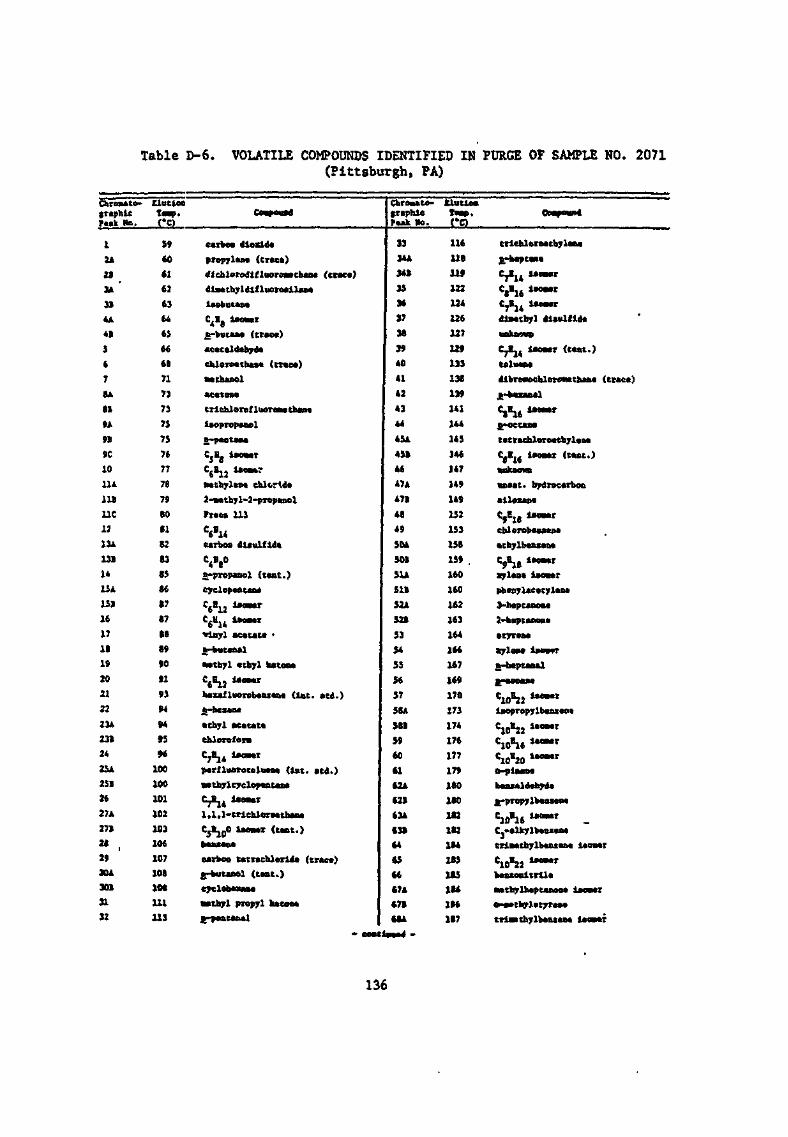
Table D-6. VOLATILE COMPOUNDS IDENTIFIED IN PURGE OF SAMPLE NO.(Pittsburgh, PA)
2071
ChroMto-traphlcPeek Da.
1
u
34
31
4A
41
3
6
7
8A
81
9A
91
9C
10
11*
111
11C
12
13*
13114
15A
151
16
17
18
19
20
21
22
23*
231
24
2iA
251
26
27A
271
28
29
30A
Ml
31
32
EluciaoTap.CC)
59
60
(1
63
64
65
66
68
71
73
73
75
75
76
77
78
79
80
81
82
83
85
86
87
87
88
89
90
91
93
94
94
95
96
100
100
101
102
103
106
107
108
108
111
113
CaqxMBd
carbon diexld*propylen* (tract)dichlorodlfluoreaBtbaae (trace)dla*thjrldlfluor<MllaMleobutaneC.E- laoaerb-bucaae (trace)acetaldefajdechlerocchaB* (trace)a* ChanelaeecwetriehloretluoTnaa f h»rieleopropaaela-peatanecjEe *"°»»r
CjHjj laoatr•ethylent chlcrUe2-«etbyl-2-propai>olFreon 113C6B»carboa dliulfldtc«He°a-propanol (cent.)cyclopentaneC6H12 *•-"C6H14 U- "vinyl aeetace •£-butaaalkethyl ethyl katoae
Via Ue~r
baxafluenbeuaiie (lac. acd.)
b-bCXUM
•Cbyl acacatechlerofera
IMrfluorocelueee (Int. atd.)••thrlcyelope&canet^ijt laoaar1 ,1 , } -trleblerea thaneCjB^ijO laoavr (tent.)Baaienacarbon tecraehlerld* (trace)fbutaaol (cent.)CTclobasaae•ethyl propjrl keton*e-peacaul
Chreaate-(raphleFeak *o.
33344348353637383940
41
42
43
44
45A
451
46
47*
471
48
49
504
501
51A
511
32A
521
53
54
335637
58A
581
59
(0
(1
(2A
(21
63*
(31
(4
(5
(t
(7A
(71
MA
KlutUnTea*.CO
116
118
119122124
126
127
129
133
138
139
141
144
145
146
147
149
149
152
153158
159 .
160
160
162
163164
166
167
169
170
173
174
176177
179
180
180
182182184
183
185186
186
187
C-p-d
erlchleroethyleui^-heptane
C7"l4 l— rCe"i6 t'°~I
diaechyl dlaulfldetaikamnC.BU laoaaT (tent.)toluenedlbrevoehloreMtbaae (trace)a-bexanalC(Elt lecwer£.oetaaetecrachleroetbrUneCgEu Inner (tent.)ttnkwmnuneac. hydrocarbon•lloxaneCfBia laoMr
echylbenxeo*C.K.. leoewrxylen* iaoavrph«oyl*eetylen»
2-heptanonaetyren*SjrlaB* laevrrB-heptanal
C*TI«~'iaapropjrlbeuent
10 22 **°**t
C10E20 tB™*r
baualdenyde£-prerj.ylben»en«C10B16 *— r .3
C10E22 i90^T
heucoBltrUeMtbylheptanane laoacra-Mthrlir^raiMtrie, thy Ibenien* leoMr
136

Table D-6 (continued)
•ChroMto-triphlcP«ak No.
688
691
698
70A
708
70C
70D
71
72A
728
72C
72D
73
74
7SA
758
76
77
78
79A
798
80
81
82
UutloaYap.
187
188
L88
190
190
190
191
192
192
193
193
194
194
196
196
197
199
201
203
205
205 .
207
208
210
Compound
Mt. hydrocarbon
•thyl n^caproac*
putylfuraa (e*nt.)baniofuran (dot.)
C4-alkylMU«MtrlMthylbnum* ia«*rphenol (txae<)•ilouo*C1QH22 laoMrdlchlorob*u«Munknown
C1(JHI4 laomr
Mt. hydrocarbonC10H16 lM-r <"«•>C10H16 1'°-r
Ct-«lkylb*ni«n*UmotMtM
unknown
Mt. hydrocarbonacatophcnon*C10H16 Uo~r
•at. hydrocarbonunknown
2-nonanoM
iraphicPuk Mo.
1384
85
86
87
88
89
90
91
92
93
94A
948
95
96
97
98A
988
99
100
101
102
103
104
Xlutlon
211
211
212
214
215
216
222
223
225
227
230
231
232
235
239
240
240
240
240
240
240
240
240
240
Coapomid
dlJMthylacyrm*Mt. hydrocarboncanncn* (ctnt.)•iloxan*•at. hydrocarbon••thyl eaprylac*
alloxan*caaphorC.-fl, .0 (tract) (tent.)
1U 10•lloxanatrlchlorob*niw< (tract)•thyl caprylat*
naphthaline£-dod«can*
wait, hydrocarbon (ttnt.)•Uouat2-und*caoon«Mt. hydrocarbon•at. hydrocarbon••thyl dccanoac*illoxan*C, /.H,n (ttnc.)14 30•thyl dacanoat*uoMt. hydrocarbon
137
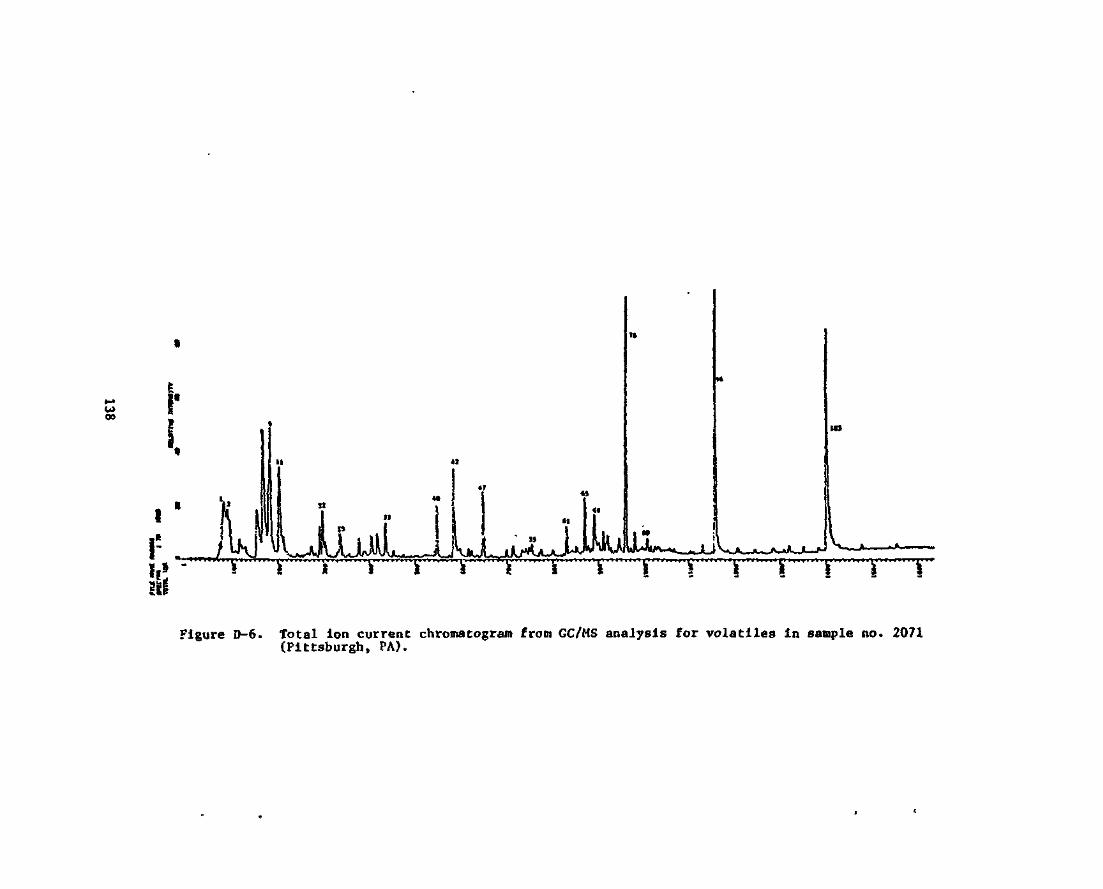
00
H
101
J|_A_A_jA_JL_JV
It k1 k1 i
Figure D-6. Total Ion current chromatogram from CC/MS analysis for volatiles in sample no. 2071(Pittsburgh, PA).
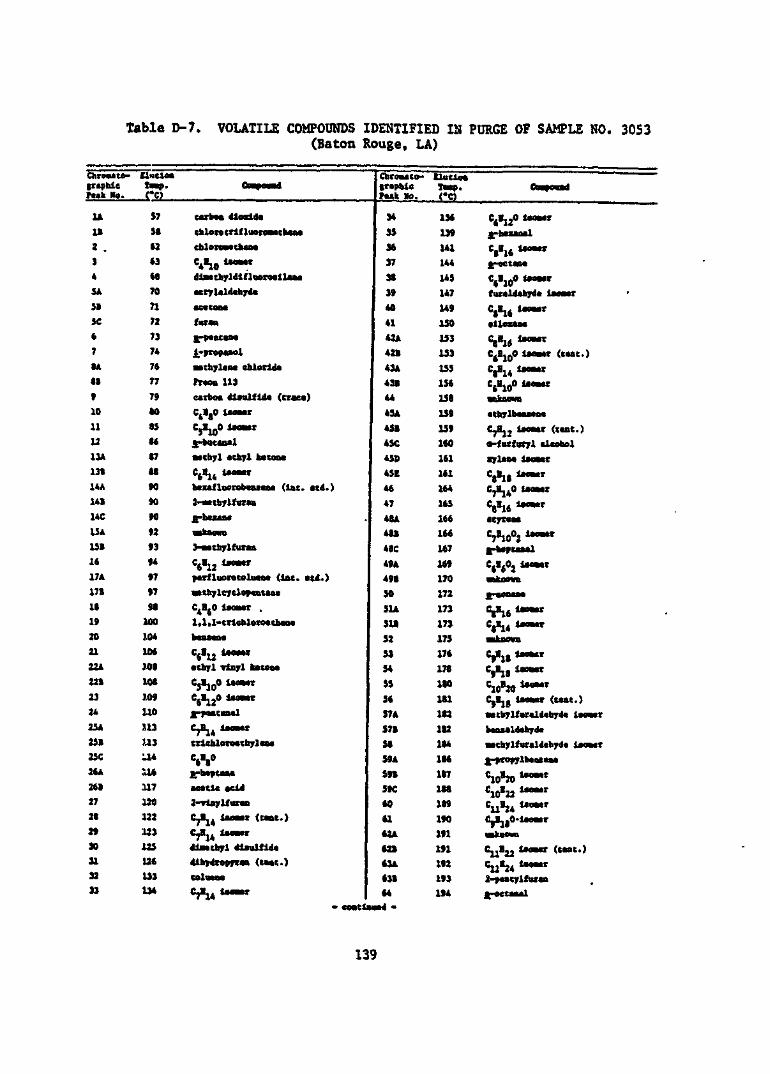
Table D-7. VOLATILE COMPOUNDS IDENTIFIED IN PURGE OF SAMPLE NO.(Baton Rouge, LA)
3053
ChroMte-iriphlef«*k No.
EluclooT«p.("0
Cbrom«Co-tripble
Ho. X£Lu112 .
34
SA
31
JC
6
7
SA
81
9
10
11
1213A
13B
14A
141
14C
UA151
16
17A
171
18
19
20
21
22A
221
23
24
25A
251
2SC
26A
261
27
28
29
30
31
32
33
37
38
62
63
68
70
71
72
73
74
76
77
79
80
85
86
87
88
9090909293
94
97
97
98
100
104
106
JOS
108
109
110
113
1.13
M4
,U6
117
120122m.123126
133134
enrben dioxlda
chlototrlfluoroMthaaa
cbloroMthaM
e4«10 ***"dlMthyldlfluoroillM*
•nto
furaa
|,-propanol
••thylaM chlorlda
frwn 113
urbon dlaulfld* (traca)CjHjO
y butu*l•tchyl *thyl katonaC6H14 U°-r
iMxafluorobauaaa (Int. ltd.)2-aathylfutaa
parfluorotoliMo* (Int. ltd.)
C4HjO laoMT .1.1,1-trlehloroathan*
kateo*C6»12•tbyi
ppaatvul£ B InOHAlT
trlenlorocthylcn*
C6>80
(tut.)
•eitle «cid
2-rlnylf
dlbydropfMB (tut.)
tola
34
33
36
37
38
39
40
41
42A
421
43A
431
44
43A
451
43C
459
45E
46
47
48A
481
48C
49*
491
30
5U
311
32
53
34
33
36
37*
371
38
39*
391
39C
60
61
62*
621
63*
631
64
coatlowtd -
136
139
141
144
145
147
149
150
153
153
153
156
158
139
159
160
161
161
164
165
166
166
167
169
170
172
173
173
175
176
178
180
181
182
182
184
187
188
189
190
191
191
192
193
194
C8«16£-oct«n«
C6810°fuMldibydc
Vu
v«C6H10°C8814C6H10°nknowi
(tut.)
((•at.)a-furfuryl alcohol
C8»18C7«a4(
Vl6
tMMT
(tint.)MCb7lfur«ld«07da IWMT
••tbylfurcldchyd* l*e»er
C10820C10B22
Cll»22CU«24
(int.)
139
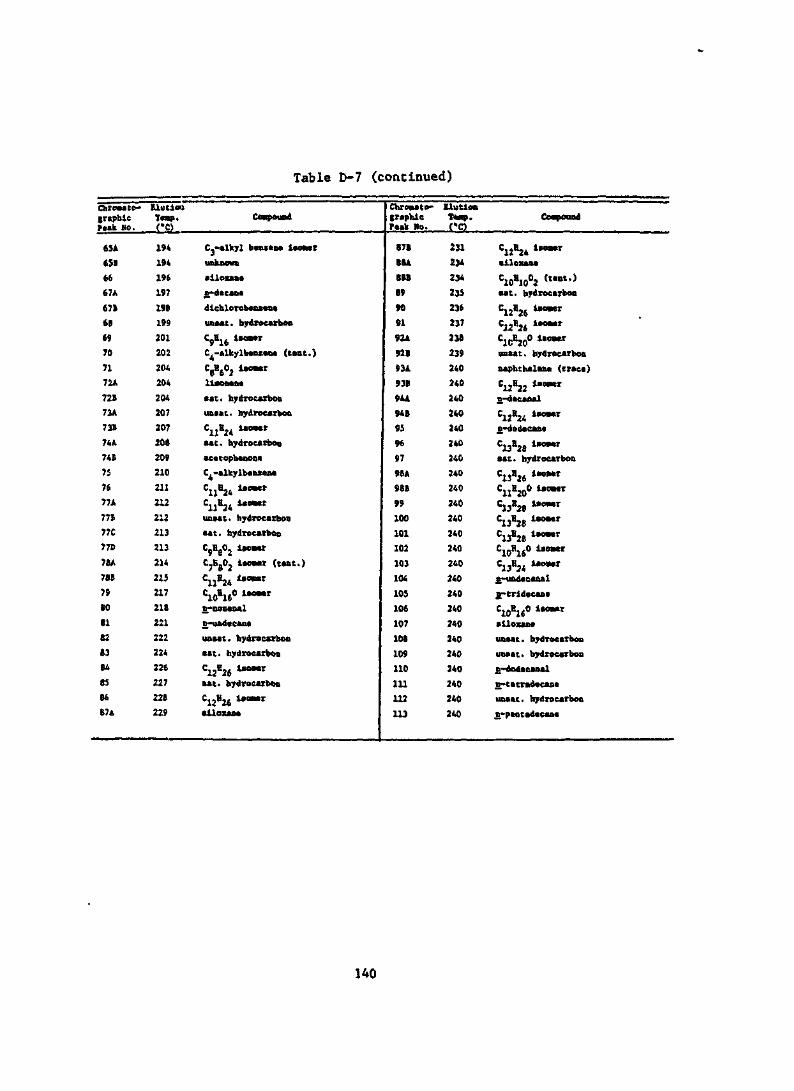
Table D-7 (continued)
Chrouto-fraphtcFiak No.
65A
651
66
67A
671
68
69
70
71
72A
72E
73A
73E
74A
74B
75
76
77A
77E
77C
77D
78A
78£
79
80
81
82
83
84
85
86
87*
ElutiouTa«p.CC)
194
194
196
197
198
199
201
202
204
204
204
207
207
208
209
210
211
212
212
213
213
214
215
217
218
221
222
224
226
227
228
229
CoBpound
C.-alkyl bwutM l«e*ar
unknown
ailoxatw
£-d*can*
dlchlerobanxanaunaat. hydrocarbon
C9H16 U0"r
C -alkylbcn»Dt (trat.)
CBH6°2 1'~'r
li»on*n«
aat. hydrocarbonun»at. hydrocarboncnE24 i— r
aat. hydrocarbonacitophanoni
C -alkylbancua
C11B24 1'°"-r
C11E24 i'°-'unMt. hydrocarbon
aat. hydrocarbon
C5Hg02 i«-r
C.E.D, I»OB*T (t*nt.)/ 0 *
C11H24 U<~r
C10E16° UC~r
n-Donanal
B-uadtcan*
unaat. hydrocarbon
aat. hydrocarbon
C12E26 Uo"r
•at. hydrocarbon
C12H26 1—r•lloxaiw
Chroaato-(raphicFaak Mo.
871
88A
888
89
90
91
92A
921
93A
931
94A
948
95
96
97
98A
981
99
100
101
102
103
104
105
106
107
108
109
110
111
112
113
KlutlonT«q>-(*C)
231
234
234
235
236
237
238
239
240
240
240
240
240
240
240
240
240
240
240
240
240
240
240
240
240
240
240
240
240
240
240
240
COBDOIud
C12E24 t§0"tr
•lloxan*
C10E10°2 ("Bt->•at. hydrocarbon
C12E26 Uo"er
C12E26 1W~r
C1CE20° l«"*r
unut. bydroearbonnaphthalant (tract)
C12H22 i"MT
£-d*eaoal
C12E24 ilol*r
n.-dodaeaD«
C13E28 ilHmI
•at. hydrocarbon
C13E26 itn*T
C11E20° i"»er
C13E28 Uo~r
C13H28 itml
C13E28 lBO"r
C10B16° Uo-«C13K24 tM~r
£-undacanaln-crldceaoiCIOEI«° Uoi-r•iloxa&c
unaat. hydrocarbon
unaat. bydroearbon
B.-dod»caaal
n.-tttrad»cantunaat. hydrocarbon
n.-p*otad*cana
140
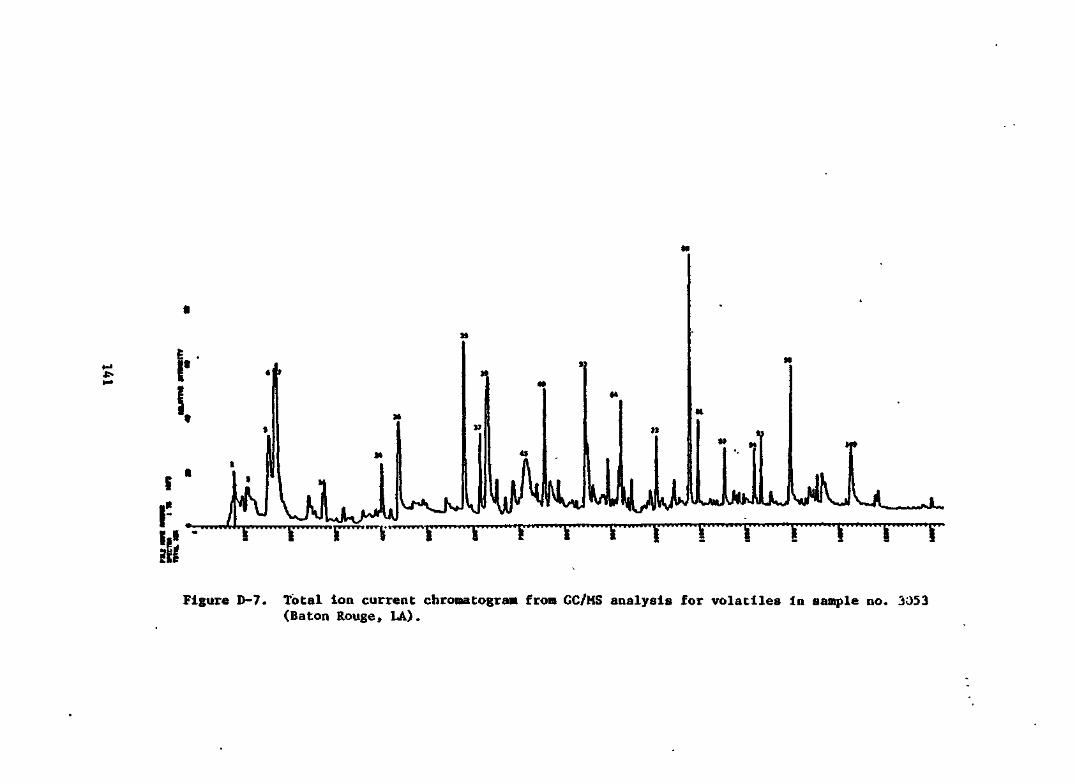
\-iil
*»
uJj*K uuuv I fc'T k' r k fc ' '1 i1 1"" fcill
Figure D-7. Total Ion current chroraatogram from GC/MS analysis for volatlles In sample no. 3053(Baton Rouge, LA).
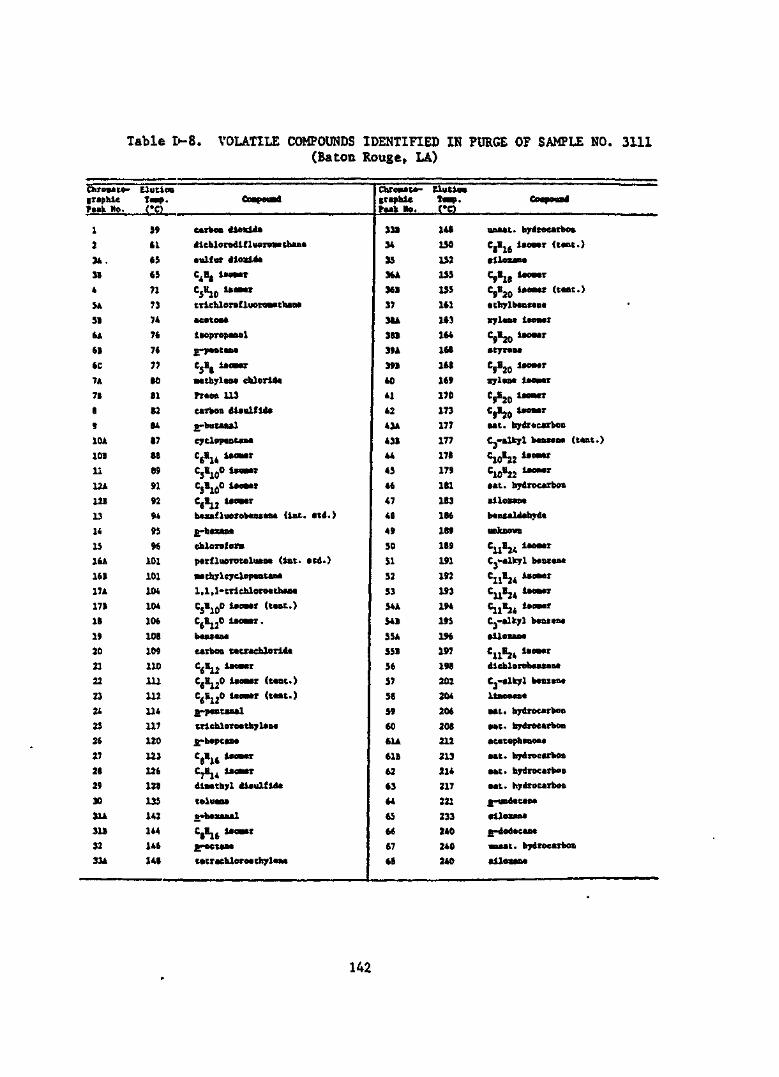
Table D-8. VOLATILE COMPOUNDS IDENTIFIED IN PURGE OF SAMPLE NO.(Baton Rouge, LA)
3111
Chrocato-iraphleFaak No.
1
2
3*.314
5*516*
61
6C7*
71
8
9
10*
101
11
12*
121
1314
1516*
161
17*
171
16
19
20
212223
242526
27
2629
30
3U
31132
33*
EluciooTa»p.CC)
59
61
6565
71
7J74
76
76
77
80
81
8284
87
88
89
91
92
94
95
96101
101
104104
106
108109
110
111112114
117
120
123
126
128
135142144
146
148
COBpOUBd
carbon dioxldadlchloredlfluoroMthana
•ulfur aioildaC^H, laoMT
C}KIO i(o>artrichaoroflueroaatbana
acatona
liopropanol
£-panta&*
CjEg iacwr•athylua chloriM
rraen 113carbon dlaulfida
2,-buuulcyclopaotana
C6H14 laoa»r
CjEJflO t«».r
C3H10° 1— "CjE12 Uowrhaxafluorebauau (int. atd.)
B-btSUI
chloroformparfluoretoluMMi (int. atd.)•aihjrl.eyclopan.tana
1.1,1-trichloroathana
CjE100 taomar (tut.)C6E12° i>0—r 'ban* anacarbon tatrachlorida
'."12 1«~r
CCE120 iaeawt (tut.)C£EI20 laoatr (tut.)
£-paBt»altrichloroathylan.ft-bapcana
C{EU iMwrC7E14 U- "dlaatbyl diaulflda
teluaaa5-ba«anal
C8E16 *— TD-octanatatrachloroa thylnna
Chrovato-
raak *>.
331
34
3536*
361
37
38*
381
39*
391
to41
42
43*
431
44
43
46
47
48
49
30
5152
5354*
541
55*
55156
57
58
59
6061*
611
62
6364
65
6667
»6
tlutionTa-p.CO
148
150
152155
155
161
163164
168
168
169
170
173
177
177
178179
181
183
186189
18S
191
192
193194
193
196
197
198
202204
206
208212
213214
217
221
233
240
240240
tapond
uoaat. hydrocarbon
C.B.. laoa*r (taut.)•iloxanaCyEjg IMMT
C$B20 iaoawr (tut.)•thylbaasaaaxylan* iaeaarC9E20 lM™r
atyrana
C9E20 U<mtr
xylao* laomrC9E2Q iaoa*rCjBjp UmurHt. hydrocarbon
C,-alkyl bauana (t«nt.)C10E22 i§c*tr
C1CH22 UoMr
•at. hydrocarbon
•llounabaualdahydt
ueknovnciAt 1>OI*r
Cj-alkyl bauan*
C11E24 1>on"C11E24 U— r
C11E24 1*OI*r
C,-alkyl banianaailosaaaC11E2* 1>cmr
dicblorobauana
Cj-alkyl banian*linoiiaaaaat.. hydrocarbon
Ht. hydrocarbon•eatepbanoDaHt. hydrocarbon
•at. hydrocarbonaat. hydrocarbonB-imdacaoa
•lleuoac-dodacantanaat. hydrocarbon
•tlesaaa
142
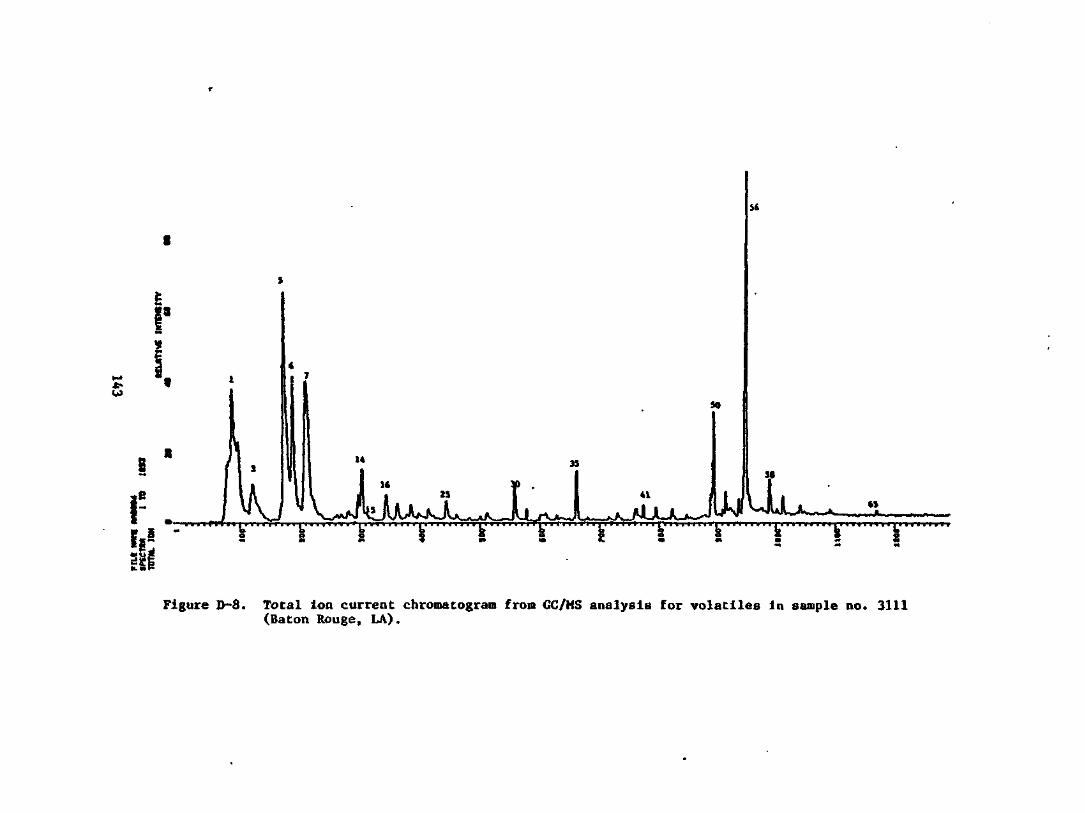
Figure D-8. Total Ion current chroroatogram from GC/MS analysis for volatiles In sample no. 3111(Baton Rouge, LA).
APPENDIX E
SEMIVOLATILE COMPOUNDS IDENTIFIED IN SELECTED
EXTRACTS OF MOTHER'S MILK
144
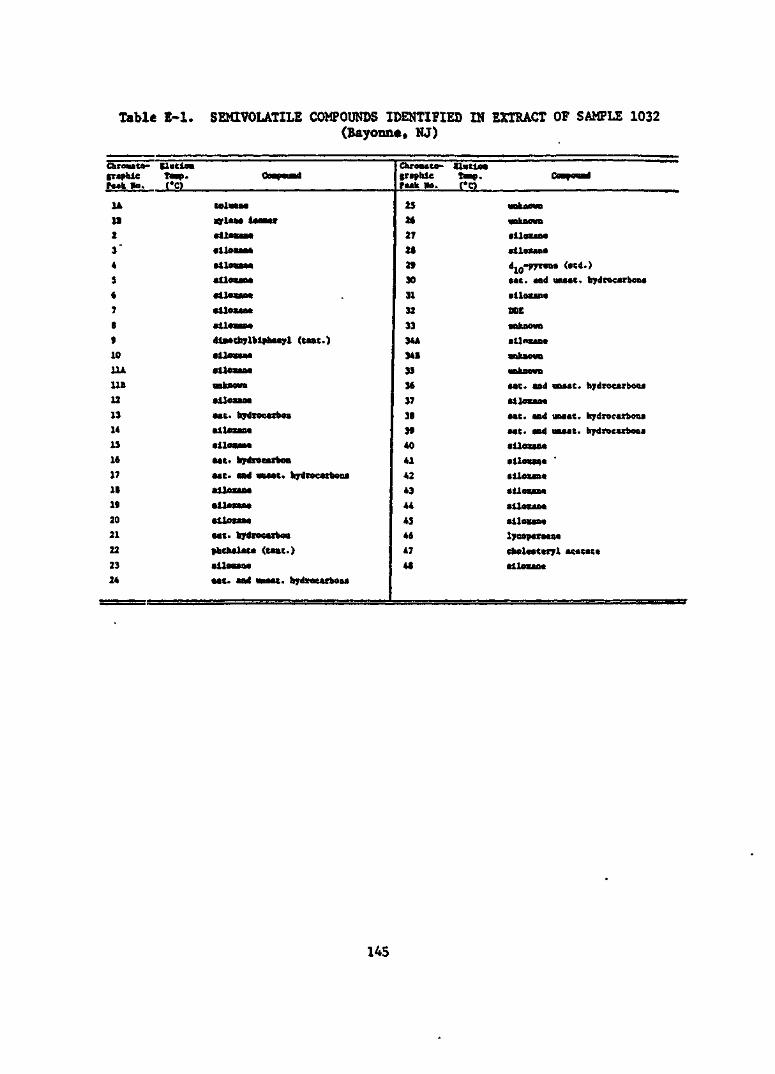
Table E-l. SEMIVOLATILE COMPOUNDS IDENTIFIED IN EXTRACT OF SAMPLE 1032(Bayonne, NJ)
Chrouto- Uucioa•raphlc Taap. CompoundPuk Ho. CC)
U
IS
2
3"
4
S
6
7
8
9
10
lit
11B
12
13
14
13
16
17
18
19
20
21
22
23
24
telum*01*aa laoMr•lloun*
•lloun*
•lloun*•lloun*•lloua*•lloua*•lloua*dlaatbylblpbuyl (teat.)•llouaa
•lloun*
unknown
•lloua*•at. hydrocarbon•lloun*•lloua*•at. hydrocarbon•at. and onaat. hydrocarbon*•ilffun-t•llosana•lloua*•at. hydrocarbonpathalac* (cant.)•lloua*•at. and uoaat. hydrocarbon*
Chrouta- Uutlongraphic TBBD. CiaifniiiwlPeak Mo. CC)
232627282930
3132
33
34A
341
3136
37
38
39
40
41
42
43
44
41
46
47
48
unknown
unknown
•lloun*
•llexaa*
d10-pyr*n* (ltd••t. *nd un**t.
•lloun*
DOE
unknown•llnua*
unknown
unknown
•at. and unaac.•lloua*
•at. aad uuat.Mt. and imut.•lloua*•lloun*•lloun*•lloun*•lloun*•lloun*
lyeop*ra*a*
.)hydrocarbon*
hydrocarbon*
hydrocarbon*
hydrocarbon*
ehol*at*ryl acatat*•lloun*
145
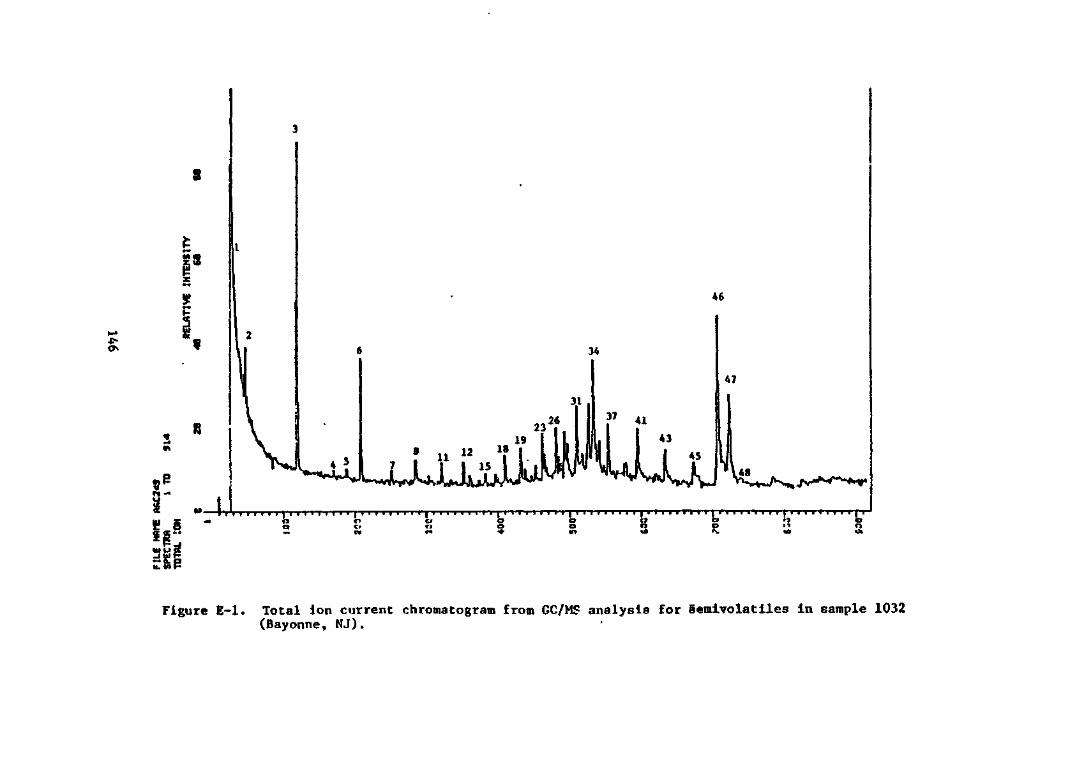
8
B S -"I"wuriK.
I,n
Figure E-l. Total ion current chrotnatogram from GC/MS analysis for Semlvolatiles in sample 1032(Bayonne, NJ).
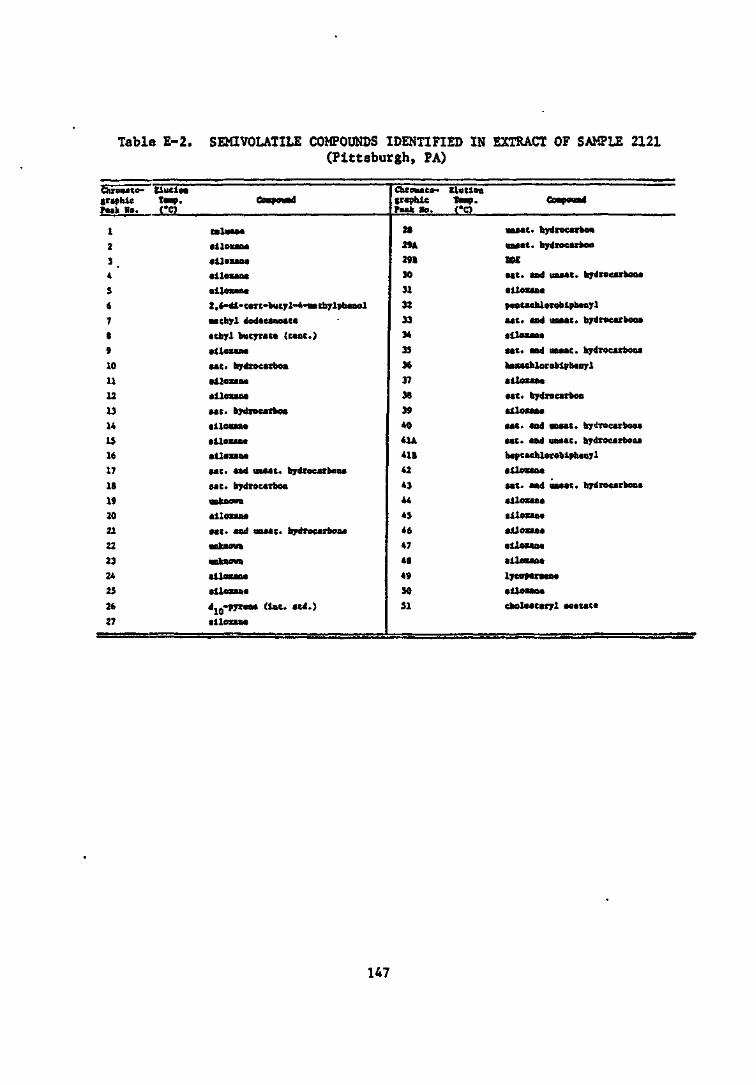
Table E-2. SEMIVOLATILE COMPOUNDS IDENTIFIED IN EXTRACT OF SAMPLE 2121(Pittsburgh, PA)
Chroaato- Cluclongraphic Tamp. Coopouadraak No. CO
1
234
s6
7t
9
10
11
12
1314
IS1617
18
1920
21
22
2324
25
26
27
taluaaa
alloxaaa
alloxanaallouaa
allouaa2 ,6-dl-tir c-buty 1-4-M chylphanol
•athyl dodacaaoata
athyl butyrata (tant.)
alloxana
Mt. hydrocarbon•lloxanaalloxaoa
MC. hydrocarbon•iloxana
alloxanaalloxana
MC. and unaat. hydrocarbona
oat. hydrocarbonunknown
alloxana
aat. and uaaat. hydrocarbonannkaovn
unknownalloxaoa
alloxana
d10-pyrana (Int. acd.)
alloxana
Chrouto- Uutlongraphic tap. Cua inimilraak Mo. CO
2829A
29B
30
31
323334
33
36
37
38
39
40
41*41B42
4344
4S
4647
48
49
30
SI
uaaat. hydrocarbon
taaat. hydrocarbon
»EMC. and uaaat. hydroearbona
alloxanapaacacbloroblpbanyl
aat. and unaat. hydrocarbona
alloxana
•at. and unaat. hydrocarbona
haxachlorobiphanyl
•lloxana•at. hydrocarbon
alloxanaaat. and unaat. hydrocarbon*
•at* and uaaat. hydrocarbooahaptaohloroblphanyl
alloxanaMt. aad unaac. hydrocarbona
alloxaaa•lloxana
•lloxana
alloxana
•lloxana
lycoparaana
alloxaaa
ebolaacaryl acatata
147
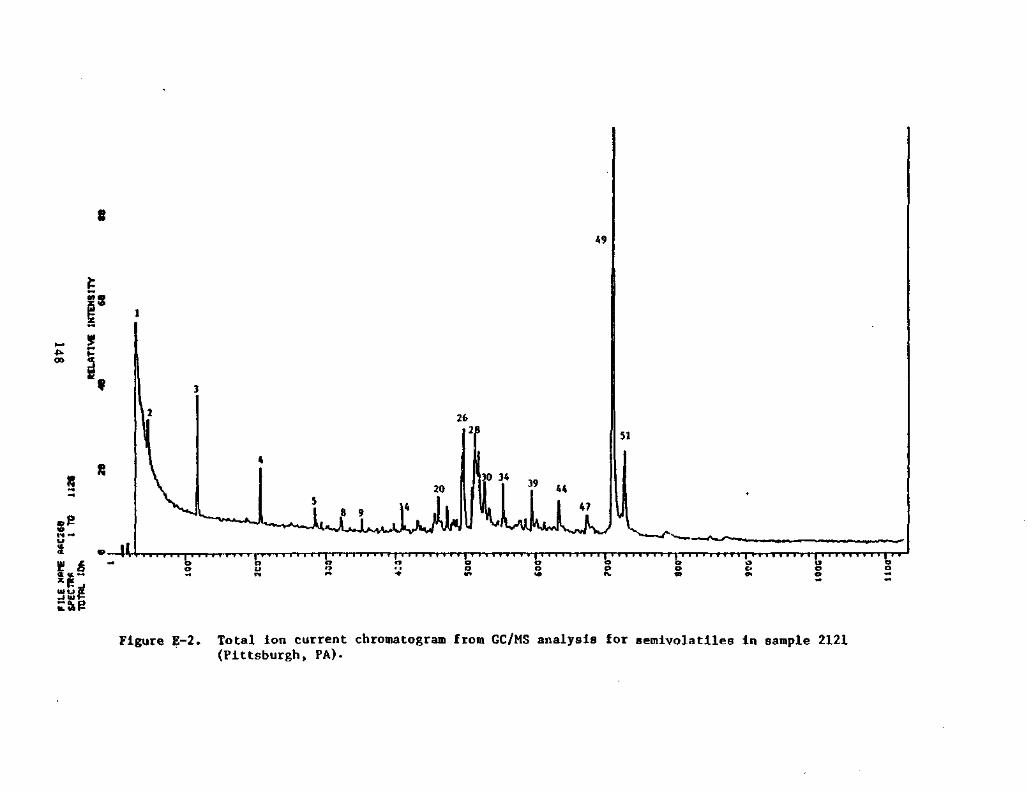
8
Figure E-2. Total ion current chromatogram from GC/MS analysis for Bemivolatiles in sample 2121(Pittsburgh, PA)-

Table E-3. SEMIVOLATILE COMPOUNDS IDENTIFIED IN EXTRACT OF SAMPLE 3095(Baton Rouge, LA)
Chroma CO- ilucioa(raphlc tap. CnapoumiF«ak Mo. (*C)
1t
34 "3
67J
9
10
1112
1314
151617
18
19202122
2324
252627A
271
28
2930
31
Mtbylcn* chlorid*tolwn*•llcxan*•ac. hydrocarbon•ac. hydrocarbon (tanc.)illoxuaaac. hydrocarbon (cane.) .
•lloxan*•ac. hydrocarbon (cane.)
•iloxaa*•ac. hydrocarbon•at. hydrocarbonunknown
unknownMC. hydrocarbon•lloxan*MC. hydrocarbon•Iloxaa*•ilexintMC. hydrocarbonaac. hydrocarbon-•lloxan*•lloxan*
•lloxan*MC. hydrocarbon•llosan*•ac. hydrocarbonunaac. hydrocarbonunknown
unknown•iloxaa*
•lloxan*
Chrouce- ilucioairaphle Top. ConpiiuDdP**k Mo. (*C)
3233*
33334
35
36*
361
37A
37>
38
39
4041
42
4344
45
46A
46B4748
4950A
5C1
51
5253A
533
54
5556
57
«10-W««•ac. hydrocarbonun*ac. hydrocarbonalloxan*DDE
unknownunaac. hydrocarbon
•llexan*unknown
MC. hydrocarbon (cane.)•lloxan*
uaaac. hydrocarbon (cane.)alloxan*
•ac. hydrocarbon (cane.)•lloxaea•ac. hydrocarbonMC. hydrocarbon
•ac. hydrocarbon•lloxan*•lloxan*•ac. hydrocarbon•Iloxaa* (ttnt.)•Iloxaa*•ac. hydrocarbon•ac. hydrocarbonlycop*ra«n*•lloxan*chol**csryl acccac*•lloxaA*
•at. hydrocarbonODJuown•iloxan*
149
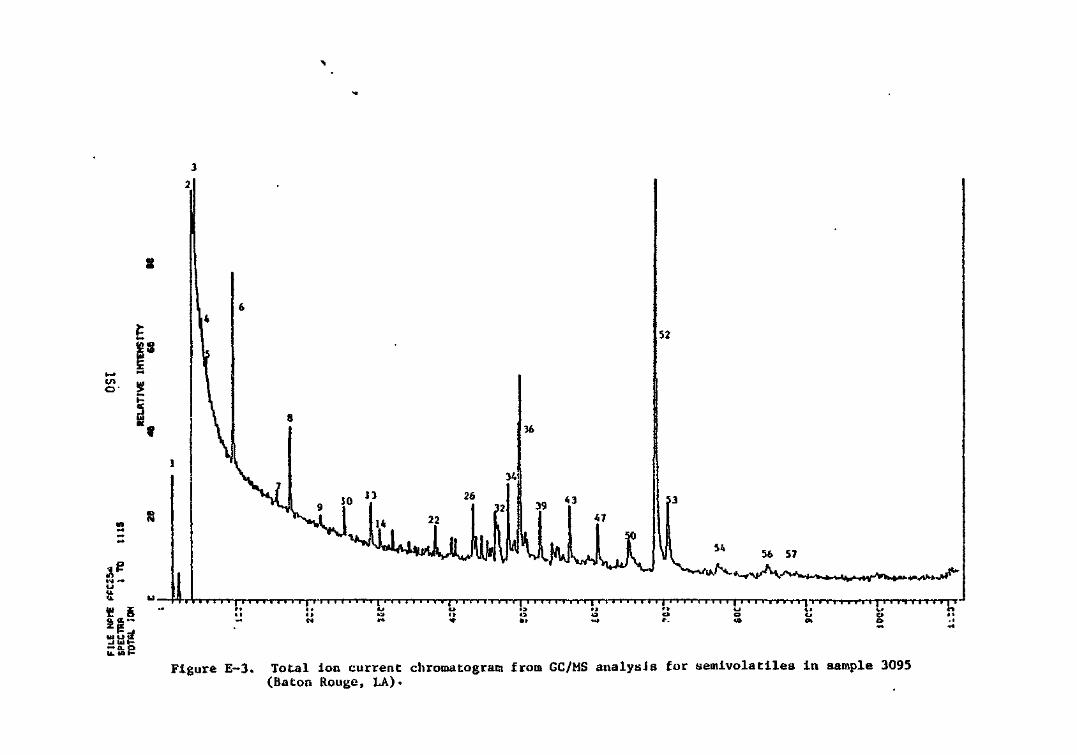
Figure E-3. Total Ion current chromatogram from GC/MS analyaJs for semlvolatilea in sample 3095(Baton Rouge, LA).
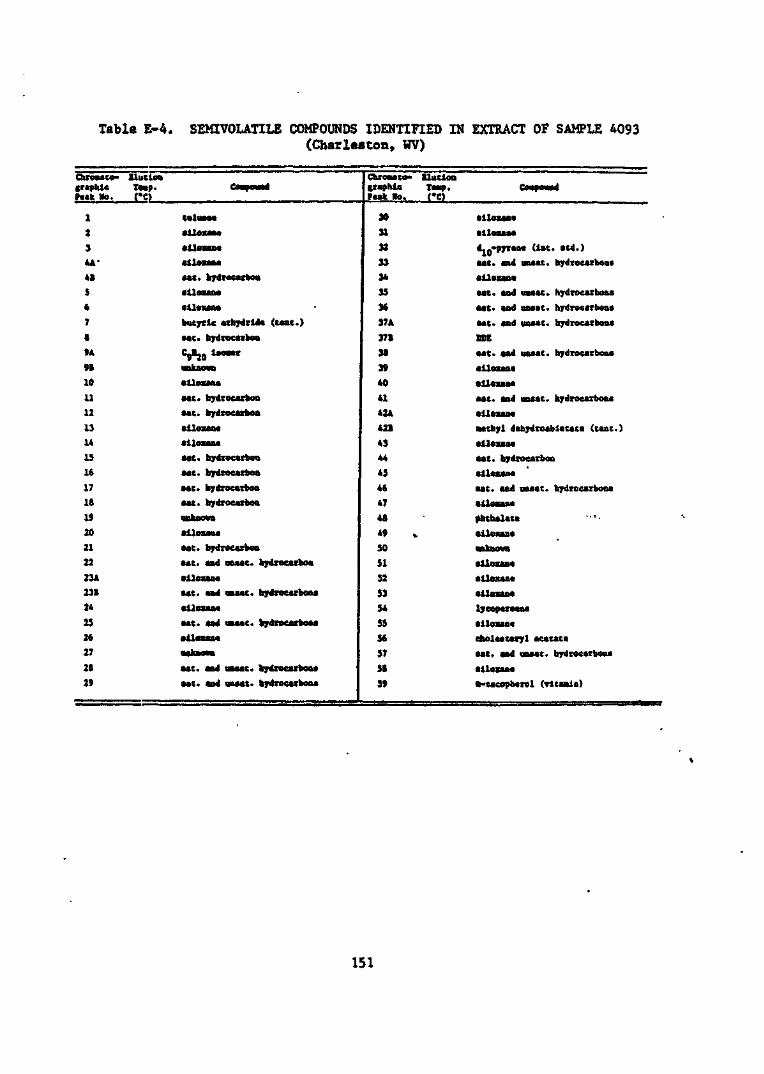
Table E:-4. SEMIVOLATILE COMPOUNDS IDENTIFIED IN EXTRACT OF SAMPLE 4093(Charleston, WV)
Chroaato- Clutlon(raphle Ta»p.Paak Mo. CO
1
2
34A-
41
5
67
8
9A9B
10
11
12
1314
15
16
17
IB
19
20
21
22
23A23B24
2627
28
29
Co -d
tolaaoa•iloxana•llooa*•lloua*•at. hydrocarbon•lloxaoa•lloxanabutyric arhydrlda (tut.)•at. hydrocarbon
CjHju laoaaronknovn•Uoxana
•at. hydrocarbon•at. hydrocarbon
•lloxana•lloxanaMt. hydrocarbonMt. hydrocarbon
Mt. hydrocarbon•at. hydrocarbonunknown•lloua*Mt. hydrocarbon
•at. and unaat. hydrocarbon•lloxanaMt. and mwat. hydrocarbon*•lloxana
MkBonnMt. and unaat. hydrocarbon*•at. and iBaat. hydrocarbon*
Chroaato- Uutloagraphic Tamp.Faak Ho. CO
30
3132
333*35
36
37A
371
38
39
40
4142A
421
4344
43
46
47
48
•950
SI52
S354
56
57
58
59
Coapoood
•lloua*•iloxanad1Q-pyrana (Int. ltd.)Mt. and unaat. hydrocarbon*•iloun*Mt. and unaat. hydrocarbon*Mt. and uuac. hydrocarbon*Mt. and uuat. hydrocarbon*DDEMt. and unaac. hydrocarbon*•lloxana•lloxana•at. and uaMt. hydrocarbon*•lloxan*Mthyl d*hydtoabl*tata (tant.)•lloxaoaMt. hydrocarbon•lloxan*ut. and unaac. hydrocarbon*•lloua*•hthalata•Uoxana
•nkaowa•lloxana•Uoxana
•Uoxan*lyeoparMna•lloxanacbolaataryl acatactMt. and unaat. hydrocarbona•llounatt-tacopb*rol (rltaxdn)
151
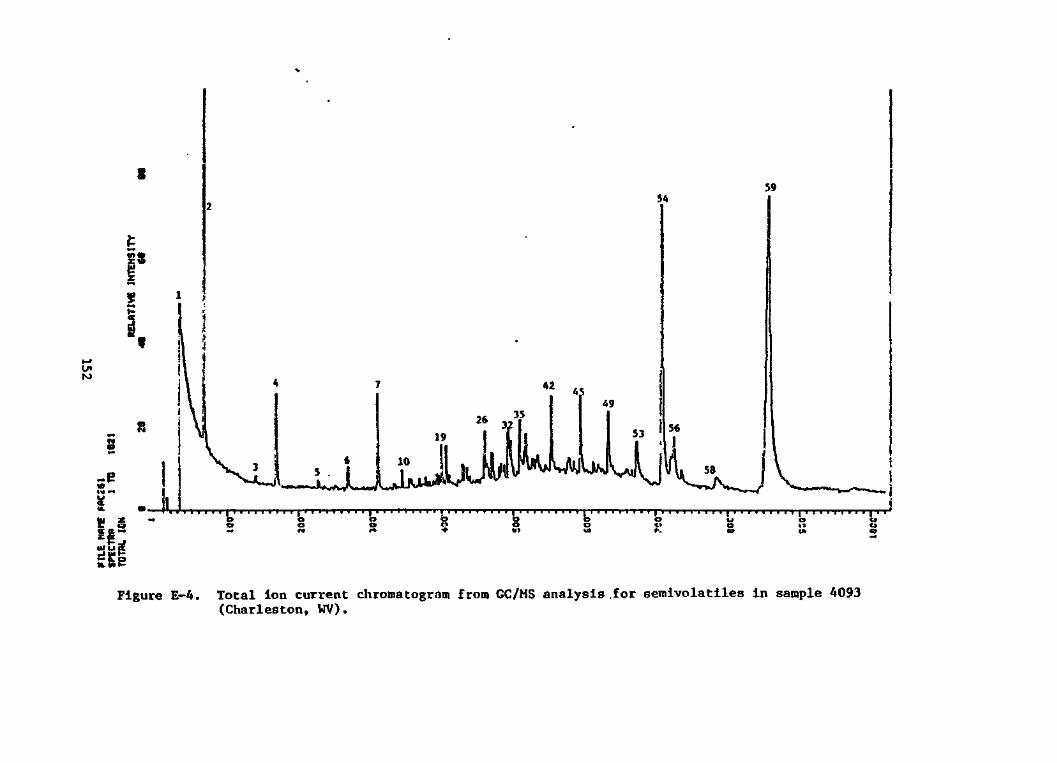
59
tnNJ
s
s
u. •_
* g -
10
&o
I 'uo
Figure E-4. Total ion current chromatogram from GC/MS analysis .for semlvolatiles in sample A093(Charleston, WV).
UNITED STATES DEPARTMENT OF COMMERCENational Taohnloal Information Sarvloa5285 Port Royal RoadSpringfield, Virginia 221 61OFFICE OF THE DIRECTOR
£> ' * s
. .
Doar ProfosTsional:
I wish I could tell you how much time and money the NTISAbstract. Newsletters could save you.
But, I can't. Because I don't know "now much time andmoney you unknowingly spend on costly research that actuallyduplicates the work of others. Yet this research informationis readily available to you when you know how to access it.
That's what NTIS Abstract Newsletters are all about.
NTIS Abstract Newsletters Summarize70,000 New Reports Annually
You see, NTIS .information specialists index, analyze,and categorize 70,000 new research documents a year. Eachreport is judged for its potential value For thousands ofcurrent subscribers. Then it is summarized in a briefabstract and published in one or more Newsletters. You receiveonly those abstracts oE interest to your professional field.
NTIS exists to help you find—and provide you with—research results and information. You'll know what you needto know—when you need tc know it—with NTIS Abstract Newsletters.
The Newsletters arc a speedy, comprehensive, economicalway for you to keep current on the latest research and to cutyour risk of duplicating work already available in a reportfrom NTIS.
Your Newsletters will suggest possible directions andstarting points for your own research. Knowing researchapplications of others will help you get more out of everyresearch dollar you invest.
Worldwide Sources
The NTIS collection also contains selected informationoa scientific and technical developments around the world.
NTIS is now actively expanding its sources of foreigntechnology to add to more than 300,000 foreign reportsalready on hand—including translated materials from theU.S.S.R., other Eastern European countries, Japan, and majorWestern countries.
Low Subscription Rate
By now, you may well be apprehensive over thecost of this remarkable Newsletter service. Ifso, you will bo pleasantly surprised to learnyou can subscribe to the Enorgy Abstract Newsletter,for example, for about $1.83 a weckl
NTIS is a unique self-supporting Government agency offeringeconomical information products and services on a cost-rocovery basis.
You Get Reports on Research NotPublished By Any Other Source
NTIS Abstract Newsletters let you know about allGovernment-sponsored research in your field. Each weekycu'll learn about research not reported or available fromany other source.
And when you spot a report you need, NTIS can provide itfor you in a matter of days, usually for about $14 in papercopy or only $4.50 in microfiche. Your Newsletters containa handy report order form for your convenience.
Annual Subject Index Included
Your subscription includes an Annual Subject Index togive permanent reference value to your Newsletter.
! II!) (iOVUKKMKNTl'UINTINtlOl'I'ICK. IWJ - 'IflL-OO')
Of course, your nubscriptiori is tax deductible as abusiness expense in most instances.
More than that, when you consider the wasted time andcostly mistakes the Newsletters; can help you avoid, youwill begin to appreciate what a practical investment NTISAbstract Newsletters really arc. For example:
• MANUFACTURING TECHNOLOGY: one of the newestNewsletters that meets industry's mostpressing need right now...brings news of thelatent research on robotics and CAD/CAM. $125*
• FOREIGN TECHNOLOGY: abstracts of latesttechnological and scientific research in allfields from Japan, United Kingdom, France,U.S.S.R., and countries all over the world.SPECIAL CHARTER RATE: $75*
• ENVIRONMENTAL POLLUTION S CONTROL: one ofthe most sought after Newsletters coveringair, noise, solid wastes, water, pesticides,radiation, health and safety and environ-mental impact statements. $95*
• ENERGY: brings you a wealth of informationon energy use; supply and demand; power andheat generation; energy policies, regulationsand studies; engines and fuels, and much more. $95*
• COMPUTERS, CONTROL, AND INFORMATION THEORY:important information, and lots of it, con-cerning this, one of the fastest growing andmost competitive industries worldwide. $95*
• MATERIAL SCIENCES: applicable to nearlyevery industry with abstracts touching on ahuge variety of processes and products. $80*
• MEDICINE & BIOLOGY: covers an enormous rangeof information from anatomy to zoology. Everyfacet of medicine and biology is touched upon. $75*
And any one of the abstracts in these Newsletters may bethe added element of success for your ongoing research, contractproposals, cost reduction efforts, and profits.
NTIS regularly publishes information not available elsewhere,and frequently brings you news of research before it appears inprofessional journals and magazines. You simply should not riskacting without benefit of complete, current information on what'shappening in Government-sponsored research in your field.
*0ne-year subscription rate (Over, please)

You need NTIS Abstract Newsletters and here's how toorder them.
Complete the order form at the bottom of this letter andmail it back today to the address below. You may use any ofthe options listed in order to pay for your subscription.
You are guaranteed satisfaction. If your Newslettersdo not satisfy you for any reason, you may cancel and receivea credit or refund for the balance of your subscriptions.
I invite you to subscribe today.
Sincerely,
Joseph F. CaponioActing Director
NTIS 5285 Port Royal RoadSpringfield, VA 22161 or Call (703) 487-4630
Please start my subscription to the following AbstrartNeius/ettens;
Special Offer Only:Foreign Technology-Save$15or$30-CharterRatc: 2yrs.$150 D (Reg. Rate $180)Charter Rate: 1 yr. $75 D (Reg. Rate $90)Additional subscriptions $25 each annually.
Name
Occupation.Company —Address —City/State/ZIP.
TitleD plus.
TitleD plus.
Cost
TOTAL
Other Titles:
additional subscriptions to this Newsletter $25 each
additional subscriptions to this Newsletter $25 each
D Charge to my Deposit Account NoD Here is my check to NTIS f or $D BUI meCharge to D American Express D VISA
D MasterCardCard NoExpires
Signature (required to validate order)
PR-733-34/83


![Page 236 Classify the triangle below A.Acute Triangle B.Obtuse Triangle C.Equiangular Triangle [Default] [MC Any] [MC All]](https://img.pdfslide.us/doc/110x75/5697bff71a28abf838cbef04/page-236-classify-the-triangle-below-aacute-triangle-bobtuse-triangle-cequiangular.jpg)


![[2015] UKUT 0631 (TCC) Appeal number: FTC/69/2014](https://img.pdfslide.us/doc/110x75/61b3ba2063426f62ee7d8fb0/2015-ukut-0631-tcc-appeal-number-ftc692014.jpg)