Embed Size (px)
Citation preview
cancers
Article
NUDT7 Loss Promotes KrasG12D CRC Development
Jinsoo Song 1,2, Sujeong Park 1, Jinjoo Oh 1, Deokha Kim 1, Ji Hyun Ryu 3 , Won Cheol Park 4,In-Jeoung Baek 5 , Xi Cheng 6,7 , Xin Lu 6,* and Eun-Jung Jin 1,2,*
1 Department of Biological Sciences, College of Natural Sciences, Wonkwang University, Iksan,Chunbuk 54538, Korea; [email protected] (J.S.); [email protected] (S.P.);[email protected] (J.O.); [email protected] (D.K.)
2 Integrated Omics Institute, Wonkwang University, Iksan, Chunbuk 54538, Korea3 Department of Carbon Convergence Engineering, College of Engineering, Wonkwang University, Iksan,
Chunbuk 54538, Korea; [email protected] Department of Surgery, Wonkwang University School of Medicine, Iksan, Chunbuk 54538, Korea;
[email protected] Asan Institute for Life Sciences, University of Ulsan College of Medicine, Seoul, 05505, Korea;
[email protected] Department of Biological Sciences, Boler-Parseghian Center for Rare and Neglected Diseases, Harper Cancer
Research Institute, University of Notre Dame, Notre Dame, IN 46556, USA; [email protected] Department of General Surgery, Ruijin Hospital, Shanghai Jiao Tong University School of Medicine,
Shanghai, 200025, China* Correspondence: [email protected] (X.L.); [email protected] (E.-J.J.); Tel.: +82-63-850-6192 (E.-J.J.);
Fax: +82-63-850-6197 (E.-J.J.)
Received: 29 October 2019; Accepted: 27 February 2020; Published: 2 March 2020�����������������
Abstract: Studies have suggested that dysregulation of peroxisomal lipid metabolism mightplay an important role in colorectal cancer (CRC) development. Here, we found thatKrasG12D-driven CRC tumors demonstrate dysfunctional peroxisomal β-oxidation and identifiedNudt7 (peroxisomal coenzyme A diphosphatase NUDT7) as one of responsible peroxisomal genes. InKrasG12D-driven CRC tumors, the expression level of Nudt7 was significantly decreased. Treatment ofazoxymethane/dextran sulfate sodium (AOM/DSS) into Nudt7 knockout (Nudt7−/−) mice significantlyinduced lipid accumulation and the expression levels of CRC-related genes whereas xenograftingof Nudt7-overexpressed LS-174T cells into mice significantly reduced lipid accumulation and theexpression levels of CRC-related genes. Ingenuity pathway analysis of microarray using the colonof Nudt7−/−and Nudt7+/+ mice treated with AOM/DSS suggested Wnt signaling as one of activatedsignaling pathways in Nudt7−/−colons. Upregulated levels of β-catenin were observed in the colons ofKrasG12D and AOM/DSS-treated Nudt7−/−mice and downstream targets of β-catenin such as Myc, Ccdn1,and Nos2, were also significantly increased in the colon of Nudt7−/−mice. We observed an increasedlevel of palmitic acid in the colon of Nudt7−/−mice and attachment of palmitic acid-conjugated chitosanpatch into the colon of mice induced the expression levels of β-catenin and CRC-related genes. Overall,our data reveal a novel role for peroxisomal NUDT7 in KrasG12D-driven CRC development.
Keywords: peroxisome; colorectal cancer; peroxisomal coenzyme A diphosphatase NUDT7 (NUDT7);palmitic acid; β-catenin
1. Introduction
Colorectal cancer (CRC) is one of the most common cancers, with over one million new casesdiagnosed worldwide each year. It is the third most common malignancy and the second mostcommon cause of cancer mortality [1]. Tumorigenesis of CRC involves a multi-step process through theaccumulations of genetic and epigenetic alterations. High-penetrance mutations of the mismatch repair
Cancers 2020, 12, 576; doi:10.3390/cancers12030576 www.mdpi.com/journal/cancers

Cancers 2020, 12, 576 2 of 18
genes (Mlh1, DNA mismatch repair protein Mlh1; Msh2, DNA mismatch repair protein Msh2; Msh6,DNA mismatch repair protein Msh6; Pms2, mismatch repair endonuclease Pms2; Apc, adenomatouspolyposis coli protein; Mutyh, adenine DNA glycosylase; Smad4, SMAD family member 4; Bmpr1A, bonemorphogenetic protein receptor type 1A; Stk11/Lkb1, serine-threonine kinase 11; Pten, phosphatase andtensin homolog; Axin2, axis inhibition protein 2; Pole, DNA polymerase epsilon, catalytic subunit; Pold1,DNA polymerase delta 1, catalytic subunit) have been reported as CRC predisposing factors [2]. Exomesequencing of common familial CRC suggested 11 novel candidate CRC susceptibility genes, includingUaca, Sfxn4, Twsg1, Psph, Nudt7, Znf490, Prss37, Ccdc18, Pradc1, Mrpl3, and Akr1c4, with rare truncatingvariants [3]. Although many molecular events have been identified, new molecules that play a role in thisprocess remain to be discovered, and are crucial for the development of improved therapeutic approaches.
Currently, in CRC, drugs either targeting angiogenesis (bevacizumab, aflibercept, andramucirumab) or targeting the epidermal growth factor receptor (EGFR; cetuximab and panitumumab)have been developed [4]. Cetuximab and panitumumab are both monoclonal antibodies directedagainst the extracellular domain of the EGFR and block the downstream RAS (Ras proto-oncogene,GTPase)-RAF (RF proto-oncogene serin/threonine-protein kinase)-MEK (mitogen-activated proteinkinase kinase 1)-ERK signaling pathway [5,6]. However, the clinical response of CRC to anti-EGFRAbs is poor for tumors with the Kirsten rat sarcoma viral oncogene homolog (Kras) mutation mostlyat codons 12, 13, or 61 [7,8], which are found in 40% of metastatic CRCs. Identifying the molecularpathogenic and regulatory processes of CRC with Kras mutation (Krasmut) will likely provide promisingstrategies for controlling Krasmut CRC. Thus, a deeper understanding of the molecular and geneticnetworks that control the initiation and progression of Krasmut CRC is essential.
Lipid metabolism, particularly fatty acid β-oxidation, is an essential process for cancer cellproliferation, differentiation, motility, and growth [9,10]. An appropriate ratio between saturated fattyacids (SFAs) and monounsaturated fatty acids (MUFAs) is required for proper membrane fluidityand cell function, and an increased amount of MUFAs has been observed in several cancers [11,12].Stearoyl-CoA (Coenzyme A) desaturase-1 (SCD1), the rate-limiting enzyme converting SFAs intoMUFAs, has been described to be upregulated in several types of human tumors and is known to becorrelated with malignant transformation, proliferation, and survival of cancer cells [13]. Acyl-CoAsynthetases (ACSs), the rate-limiting enzyme converting long chain fatty acids (LCFAs) to acyl-CoA,is also related to carcinogenesis [14]. A study demonstrated that the Kras-dependent regulation oflipid metabolism is a critical factor for lung tumorigenesis [15] and fatty acid-induced inflammatorymediators such as prostaglandin E2, leukotriene B4, interleukin 1β, and tumor necrosis factor α, areknown to act as stimulatory factors for cancer cell growth and proliferation [16].
In mammalian cells, peroxisome is the main subcellular organelle involved in the β-oxidationpathway, a key pathway for the breakdown of fatty acids [17,18]. In peroxisomes, the first step offatty acid oxidation is the conversion reaction of fatty acids into acyl-CoA. Peroxisomal β-oxidationmainly concerns very long chain fatty acids (VLCFAs, >C22) and branched fatty acids, as well as someprostaglandins and leukotrienes [19–21]. Even though the importance of peroxisome in the regulationof various cellular functions including lipid metabolism has emerged, our knowledge of the functionand role of peroxisomes is limited.
In this study, we evaluate the importance of peroxisomal function in KrasG12D CRC and identifyperoxisomal coenzyme A diphosphatase NUDT7 (NUDT7) as a potent tumor suppressor to restrictKrasG12D CRC progression.
2. Results
2.1. Peroxisomal Dysfunction Is Responsible for Dysregulation of Lipid Metabolism in KrasG12D CRC
To assess the alteration of lipid metabolism in KrasG12D CRC compared with KrasWT CRC, weanalyzed lipid reactive oxygen species (ROS) and lipid accumulation in KrasG12D CRC cells (SNU-407,SNU-C2A, and LS-174T) and KrasWT cells (COLO-320DM, HT29, and Caco2). The number of BODIPY

Cancers 2020, 12, 576 3 of 18
and lipid ROS-positive cells was significantly increased (average of 3.95-fold of KrasWT CRC cells and3.77-fold of KrasWT CRC cells in BODIPY and lipid ROS-positive cells, respectively) in KrasG12D CRCcells compared with those in KrasWT CRC cells (Figure 1A,B). The expression levels of genes in lipidmetabolism such as Abca1, Acsl1, Agpat1, Cd36, Fasn, Ldlr, Pparg, and Scd1, were dramatically increasedin KrasG12D CRC cells (Figure 1C). We also observed the upregulation of carnitine palmitoyltransferase-1(CPT1) (662.85-fold of KrasWT CRC tumor), fatty acid binding protein 4 (FABP4) (7.87-fold of KrasWT
CRC tumor), and SCD1 (5.1-fold of KrasWT CRC tumor) in KrasG12D CRC tumors (n = 4) compared withKrasWT CRC tumors (Figure 1D). Gene set enrichment analysis (GSEA) using GSE41258 (186 primarytumors compared with 54 normal colons) and GSE12398 (KrasG12D transfected Colo741 cells comparedwith KrasWT transfected Colo741 cells), showed decreased expression of peroxisome-related genes inKrasG12D CRC tumors (Figure 1E).
Cancers 2020, 12, 576 3 of 18
To assess the alteration of lipid metabolism in KrasG12D CRC compared with KrasWT CRC, we
analyzed lipid reactive oxygen species (ROS) and lipid accumulation in KrasG12D CRC cells (SNU-407,
SNU-C2A, and LS-174T) and KrasWT cells (COLO-320DM, HT29, and Caco2). The number of BODIPY
and lipid ROS-positive cells was significantly increased (average of 3.95-fold of KrasWT CRC cells and
3.77-fold of KrasWT CRC cells in BODIPY and lipid ROS-positive cells, respectively) in KrasG12D CRC
cells compared with those in KrasWT CRC cells (Figures 1A,B). The expression levels of genes in lipid
metabolism such as Abca1, Acsl1, Agpat1, Cd36, Fasn, Ldlr, Pparg, and Scd1, were dramatically
increased in KrasG12D CRC cells (Figure 1C). We also observed the upregulation of carnitine
palmitoyltransferase-1 (CPT1) (662.85-fold of KrasWT CRC tumor), fatty acid binding protein 4
(FABP4) (7.87-fold of KrasWT CRC tumor), and SCD1 (5.1-fold of KrasWT CRC tumor) in KrasG12D CRC
tumors (n = 4) compared with KrasWT CRC tumors (Figure 1D). Gene set enrichment analysis (GSEA)
using GSE41258 (186 primary tumors compared with 54 normal colons) and GSE12398 (KrasG12D
transfected Colo741 cells compared with KrasWT transfected Colo741 cells), showed decreased
expression of peroxisome-related genes in KrasG12D CRC tumors (Figure 1E).
Figure 1. Dysfunction of lipid metabolism in KrasG12D colorectal cancer (CRC) cells. (A) BODIPY
staining and (B) lipid reactive oxygen species (ROS) staining using KrasG12D and KrasWT cell lines.
Positive cells were counted for every 50 cells in 3 different fields at 400× magnification. Results shown
are representative of at least 3 independent experiments. Scale bars: 100 μm. (C) Expression level of
genes involved in lipid metabolism in KrasG12D CRC cells and presented as the fold change of KrasWT
CRC cells. Rn18s was used as an endogenous control. Results are representative of at least 3
independent experiments. (D) Immunohistochemical staining with CPT1, FABP4, and SCD1, and
positive cells were counted (n = 4). Scale bars: 100 μm. (E) GSEA analysis using GEO datasets (CRC
patient biopsy dataset, GSE41258 and KrasG12D transfected CRC cell line dataset, GSE12398). Values
are presented as means + SD. A two-tailed Student’s t-test was used for statistical analysis. * p ≤ 0.05,
** p < 0.01, *** p < 0.001, **** p < 0.0001.
To identify the factor responsible for peroxisomal lipid dysregulation in KrasG12D CRC, we
analyzed the expression levels of 94 peroxisomal genes listed in the peroxisome database [22] and
Figure 1. Dysfunction of lipid metabolism in KrasG12D colorectal cancer (CRC) cells. (A) BODIPYstaining and (B) lipid reactive oxygen species (ROS) staining using KrasG12D and KrasWT cell lines.Positive cells were counted for every 50 cells in 3 different fields at 400×magnification. Results shownare representative of at least 3 independent experiments. Scale bars: 100 µm. (C) Expression levelof genes involved in lipid metabolism in KrasG12D CRC cells and presented as the fold change ofKrasWT CRC cells. Rn18s was used as an endogenous control. Results are representative of at least3 independent experiments. (D) Immunohistochemical staining with CPT1, FABP4, and SCD1, andpositive cells were counted (n = 4). Scale bars: 100 µm. (E) GSEA analysis using GEO datasets (CRCpatient biopsy dataset, GSE41258 and KrasG12D transfected CRC cell line dataset, GSE12398). Valuesare presented as means + SD. A two-tailed Student’s t-test was used for statistical analysis. * p ≤ 0.05,*** p < 0.001, **** p < 0.0001.
To identify the factor responsible for peroxisomal lipid dysregulation in KrasG12D CRC, weanalyzed the expression levels of 94 peroxisomal genes listed in the peroxisome database [22] andperformed multiple t-tests. Among the genes tested, the expression level of Crat was significantlyincreased (p ≤ 0.05), whereas the expression level of Nudt7 was significantly decreased (p ≤ 0.05) inKrasG12D CRC cells (LS174T, SNU-407, and SNU-C2A) compared with KrasWT CRC cells (Caco2, HT29,and COLO-320DM) with different genetic backgrounds [23–25] (Figure S1). In human CRC tumors, the

Cancers 2020, 12, 576 4 of 18
expression levels of Nos2, Sod2, Acot2, Xdh, Acot1, Crat, Crot, Phyh, Sod1, and Hao1 were significantlyincreased (p ≤ 0.05), whereas the expression levels of Nudt7, Acsl5, Abcd3, Acsl3, Far1, Pex12, Rhoc, Acsl4,Ehhadh, Ech1, Dnajc10, Acaa1, Agps, Acsf3, Trim37, Pex6, and Hmgcl were significantly decreased (p ≤0.05) in KrasG12D CRC tumors (Figure S1B,C; including functional categories for these genes accordingto peroxisome database). Comparison of gene profiles showed that Crat was significantly increasedwhereas Nudt7 was significantly decreased both in KrasG12D CRC cells and KrasG12D CRC patientstumors (Figure S1A,B). The involvement of the carnitine system including Crat is well-known. Thecarnitine system alters the metabolic plasticity and supplies an energetic and biosynthetic demand ofcancer cells [26]. Higher carnitine O-acetyltransferase (CRAT) expression is also known to contribute tomaintaining a high metabolic plasticity in cancers and suppressing the carnitine system [27]. However,the function of Nudt7 in cancer has not been well studied. Analysis of GSE8671 (comparison between32 prospectively collected adenomas and normal mucosa from the same individuals) [28] also showeda significant decrease in Nudt7 in CRC (Figure 2A). We observed a drastic decrease in the level of Nudt7in KrasG12D CRC compared to KrasWT CRC tumors (Figure 2B).
Cancers 2020, 12, 576 4 of 18
performed multiple t-tests. Among the genes tested, the expression level of Crat was significantly
increased (p ≤ 0.05), whereas the expression level of Nudt7 was significantly decreased (p ≤ 0.05) in
KrasG12D CRC cells (LS174T, SNU-407, and SNU-C2A) compared with KrasWT CRC cells (Caco2, HT29,
and COLO-320DM) with different genetic backgrounds [23–25] (Figure S1). In human CRC tumors,
the expression levels of Nos2, Sod2, Acot2, Xdh, Acot1, Crat, Crot, Phyh, Sod1, and Hao1 were
significantly increased (p ≤ 0.05), whereas the expression levels of Nudt7, Acsl5, Abcd3, Acsl3, Far1,
Pex12, Rhoc, Acsl4, Ehhadh, Ech1, Dnajc10, Acaa1, Agps, Acsf3, Trim37, Pex6, and Hmgcl were
significantly decreased (p ≤ 0.05) in KrasG12D CRC tumors (Figure S1B,C; including functional
categories for these genes according to peroxisome database). Comparison of gene profiles showed
that Crat was significantly increased whereas Nudt7 was significantly decreased both in KrasG12D CRC
cells and KrasG12D CRC patients tumors (Figure S1A,B). The involvement of the carnitine system
including Crat is well-known. The carnitine system alters the metabolic plasticity and supplies an
energetic and biosynthetic demand of cancer cells [26]. Higher carnitine O-acetyltransferase (CRAT)
expression is also known to contribute to maintaining a high metabolic plasticity in cancers and
suppressing the carnitine system [27]. However, the function of Nudt7 in cancer has not been well
studied. Analysis of GSE8671 (comparison between 32 prospectively collected adenomas and normal
mucosa from the same individuals) [28] also showed a significant decrease in Nudt7 in CRC (Figure
2A). We observed a drastic decrease in the level of Nudt7 in KrasG12D CRC compared to KrasWT CRC
tumors (Figure 2B).
Figure 2. Decreased level of peroxisomal Nudt7 is observed in KrasG12D CRC dysregulation. (A)
Expression level of Nudt7 in CRC tumors using GSE8671 dataset and presented as the fold change
compared with normal. (B) Expression level of Nudt7 in tumors or adjacent non-tumor areas of
KrasG12D and KrasWT CRC. Rn18s was used as an endogenous control (n = 3). (C) NUDT7 expression
was analyzed via immunohistochemistry using tamoxifen-inducible Villin-CreERT2; Apcf/f; Trp53f/f;
tetO-LSL-KrasG12D mice (KrasOFF and KrasON) and human patients (KrasWT and KrasG12D). Positive cells
were counted for every 100 cells in 3 different fields at 200× magnification. Results are representative
of at least 3 independent experiments. Scale bars: 100 μm. Values are means + SD. An unpaired
Student’s t-test was used for statistical analysis. *** p < 0.001, **** p < 0.0001.
2.2. Dysregulation of Lipid Metabolism by Nudt7 Suppression Is Involved in Development and Progression
of KrasG12D CRC
To identify the functional role of Nudt7 in lipid homeostasis, we analyzed lipid accumulation
via modulation of Nudt7. Lipid accumulation and the number of BODIPY-positive cells (average of
0.2-fold with Nudt7 overexpression (Nudt7), 1.8-fold with Nudt7 knockdown (shNudt7) compared to
KrasG12D CRC cells), were significantly increased in KrasG12D CRC cell lines, SNU-407, and SNU-C2A,
and this increase was dramatically reduced by overexpression of Nudt7 (Figure S2). Knockdown of
Nudt7 into KrasWT Caco2 cells significantly increased the accumulation of medium chain fatty acids
(MCFAs), LCFAs, and VLCFAs (Figure S3A). The increased expression levels of lipogenic genes such
as Acaca, Cd36, Cpt1b, Fasn, Ldlr, Pparg, Scd1, and Vldlr by shNudt7 into KrasG12D cells, SNU-407 and
SNU-C2A (Figure S3B) were recovered by Nudt7 restoration. Moreover, increased levels of Abca1,
Acsl1, Agpat1, and Scd1 by KrasG12D overexpression (KrasG12D) into KrasWT Caco2 cells (Figure S4A) were
recovered by Nudt7 restoration. In a genetically engineered mouse model of inducible CRC, Villin-
Figure 2. Decreased level of peroxisomal Nudt7 is observed in KrasG12D CRC dysregulation.(A) Expression level of Nudt7 in CRC tumors using GSE8671 dataset and presented as the foldchange compared with normal. (B) Expression level of Nudt7 in tumors or adjacent non-tumor areas ofKrasG12D and KrasWT CRC. Rn18s was used as an endogenous control (n = 3). (C) NUDT7 expressionwas analyzed via immunohistochemistry using tamoxifen-inducible Villin-CreERT2; Apcf/f; Trp53f/f;tetO-LSL-KrasG12D mice (KrasOFF and KrasON) and human patients (KrasWT and KrasG12D). Positive cellswere counted for every 100 cells in 3 different fields at 200×magnification. Results are representative ofat least 3 independent experiments. Scale bars: 100 µm. Values are means + SD. An unpaired Student’st-test was used for statistical analysis. *** p < 0.001, **** p < 0.0001.
2.2. Dysregulation of Lipid Metabolism by Nudt7 Suppression Is Involved in Development and Progression ofKrasG12D CRC
To identify the functional role of Nudt7 in lipid homeostasis, we analyzed lipid accumulation viamodulation of Nudt7. Lipid accumulation and the number of BODIPY-positive cells (average of 0.2-foldwith Nudt7 overexpression (Nudt7), 1.8-fold with Nudt7 knockdown (shNudt7) compared to KrasG12D
CRC cells), were significantly increased in KrasG12D CRC cell lines, SNU-407, and SNU-C2A, and thisincrease was dramatically reduced by overexpression of Nudt7 (Figure S2). Knockdown of Nudt7 intoKrasWT Caco2 cells significantly increased the accumulation of medium chain fatty acids (MCFAs),LCFAs, and VLCFAs (Figure S3A). The increased expression levels of lipogenic genes such as Acaca,Cd36, Cpt1b, Fasn, Ldlr, Pparg, Scd1, and Vldlr by shNudt7 into KrasG12D cells, SNU-407 and SNU-C2A(Figure S3B) were recovered by Nudt7 restoration. Moreover, increased levels of Abca1, Acsl1, Agpat1,and Scd1 by KrasG12D overexpression (KrasG12D) into KrasWT Caco2 cells (Figure S4A) were recoveredby Nudt7 restoration. In a genetically engineered mouse model of inducible CRC, Villin-CreERT2,Apcf/f, Trp53f/f, and tetO-LSL-KrasG12D [29], the expression levels of CPT1, FABP4, and SCD1 (FigureS4B) were significantly upregulated whereas the expression level of Nudt7 was dramatically decreasedwhen KrasG12D was turned on (+DOX; KrasON; 0.51-fold of KrasOFF) (Figure 2C). The subcutaneousmouse model of KrasG12D cells, LS-174T, showed that overexpression of Nudt7 significantly decreased
Cancers 2020, 12, 576 5 of 18
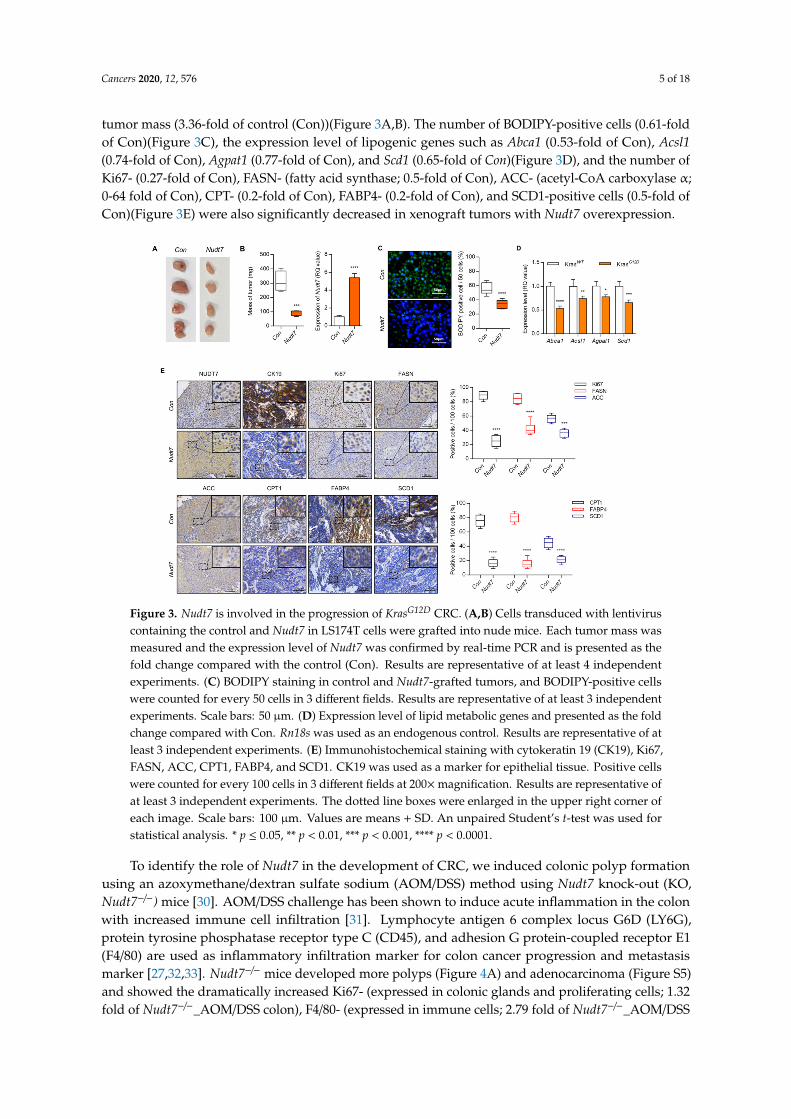
tumor mass (3.36-fold of control (Con))(Figure 3A,B). The number of BODIPY-positive cells (0.61-foldof Con)(Figure 3C), the expression level of lipogenic genes such as Abca1 (0.53-fold of Con), Acsl1(0.74-fold of Con), Agpat1 (0.77-fold of Con), and Scd1 (0.65-fold of Con)(Figure 3D), and the number ofKi67- (0.27-fold of Con), FASN- (fatty acid synthase; 0.5-fold of Con), ACC- (acetyl-CoA carboxylase α;0-64 fold of Con), CPT- (0.2-fold of Con), FABP4- (0.2-fold of Con), and SCD1-positive cells (0.5-fold ofCon)(Figure 3E) were also significantly decreased in xenograft tumors with Nudt7 overexpression.
Cancers 2020, 12, 576 5 of 18
CreERT2, Apcf/f, Trp53f/f, and tetO-LSL-KrasG12D [29], the expression levels of CPT1, FABP4, and SCD1
(Figure S4B) were significantly upregulated whereas the expression level of Nudt7 was dramatically
decreased when KrasG12D was turned on (+DOX; KrasON; 0.51-fold of KrasOFF) (Figure 2C). The
subcutaneous mouse model of KrasG12D cells, LS-174T, showed that overexpression of Nudt7
significantly decreased tumor mass (3.36-fold of control (Con))(Figure 3A,B). The number of
BODIPY-positive cells (0.61-fold of Con)(Figure 3C), the expression level of lipogenic genes such as
Abca1 (0.53-fold of Con), Acsl1 (0.74-fold of Con), Agpat1 (0.77-fold of Con), and Scd1 (0.65-fold of
Con)(Figure 3D), and the number of Ki67- (0.27-fold of Con), FASN- (fatty acid synthase; 0.5-fold of
Con), ACC- (acetyl-CoA carboxylase ; 0-64 fold of Con), CPT- (0.2-fold of Con), FABP4- (0.2-fold of
Con), and SCD1-positive cells (0.5-fold of Con)(Figure 3E) were also significantly decreased in
xenograft tumors with Nudt7 overexpression.
Figure 3. Nudt7 is involved in the progression of KrasG12D CRC. (A,B) Cells transduced with lentivirus
containing the control and Nudt7 in LS174T cells were grafted into nude mice. Each tumor mass was
measured and the expression level of Nudt7 was confirmed by real-time PCR and is presented as the
fold change compared with the control (Con). Results are representative of at least 4 independent
experiments. (C) BODIPY staining in control and Nudt7-grafted tumors, and BODIPY-positive cells
were counted for every 50 cells in 3 different fields. Results are representative of at least 3 independent
experiments. Scale bars: 50 μm. (D) Expression level of lipid metabolic genes and presented as the
fold change compared with Con. Rn18s was used as an endogenous control. Results are representative
of at least 3 independent experiments. (E) Immunohistochemical staining with cytokeratin 19 (CK19),
Ki67, FASN, ACC, CPT1, FABP4, and SCD1. CK19 was used as a marker for epithelial tissue. Positive
cells were counted for every 100 cells in 3 different fields at 200× magnification. Results are
representative of at least 3 independent experiments. The dotted line boxes were enlarged in the
upper right corner of each image. Scale bars: 100 μm. Values are means + SD. An unpaired Student’s
t-test was used for statistical analysis. * p ≤ 0.05, ** p < 0.01, *** p < 0.001, **** p < 0.0001.
To identify the role of Nudt7 in the development of CRC, we induced colonic polyp formation
using an azoxymethane/dextran sulfate sodium (AOM/DSS) method using Nudt7 knock-out (KO,
Nudt7−/−) mice [30]. AOM/DSS challenge has been shown to induce acute inflammation in the colon
Figure 3. Nudt7 is involved in the progression of KrasG12D CRC. (A,B) Cells transduced with lentiviruscontaining the control and Nudt7 in LS174T cells were grafted into nude mice. Each tumor mass wasmeasured and the expression level of Nudt7 was confirmed by real-time PCR and is presented as thefold change compared with the control (Con). Results are representative of at least 4 independentexperiments. (C) BODIPY staining in control and Nudt7-grafted tumors, and BODIPY-positive cellswere counted for every 50 cells in 3 different fields. Results are representative of at least 3 independentexperiments. Scale bars: 50 µm. (D) Expression level of lipid metabolic genes and presented as the foldchange compared with Con. Rn18s was used as an endogenous control. Results are representative of atleast 3 independent experiments. (E) Immunohistochemical staining with cytokeratin 19 (CK19), Ki67,FASN, ACC, CPT1, FABP4, and SCD1. CK19 was used as a marker for epithelial tissue. Positive cellswere counted for every 100 cells in 3 different fields at 200×magnification. Results are representative ofat least 3 independent experiments. The dotted line boxes were enlarged in the upper right corner ofeach image. Scale bars: 100 µm. Values are means + SD. An unpaired Student’s t-test was used forstatistical analysis. * p ≤ 0.05, ** p < 0.01, *** p < 0.001, **** p < 0.0001.
To identify the role of Nudt7 in the development of CRC, we induced colonic polyp formationusing an azoxymethane/dextran sulfate sodium (AOM/DSS) method using Nudt7 knock-out (KO,Nudt7−/−) mice [30]. AOM/DSS challenge has been shown to induce acute inflammation in the colonwith increased immune cell infiltration [31]. Lymphocyte antigen 6 complex locus G6D (LY6G),protein tyrosine phosphatase receptor type C (CD45), and adhesion G protein-coupled receptor E1(F4/80) are used as inflammatory infiltration marker for colon cancer progression and metastasismarker [27,32,33]. Nudt7−/− mice developed more polyps (Figure 4A) and adenocarcinoma (Figure S5)and showed the dramatically increased Ki67- (expressed in colonic glands and proliferating cells; 1.32fold of Nudt7−/−_AOM/DSS colon), F4/80- (expressed in immune cells; 2.79 fold of Nudt7−/−_AOM/DSS

Cancers 2020, 12, 576 6 of 18
colon), LY6G- (expressed immune cells; 2.47 fold of Nudt7−/−_AOM/DSS colon), and SCD1- (3.70fold of Nudt7−/−_AOM/DSS colon) positive cells in colons (Figure 4B,C). The increased levels ofperoxisomal coenzyme A diphosphatase 7 (NUDT7) and acyl-CoA oxidase 1 (ACOX1) expressed inthe epithelial cells and colonic glands in Nudt7+/+_AOM/DSS colon were significantly decreased inNudt7−/−_AOM/DSS colon (Figure 4C). The expression level of genes involved in CRC progression [34]and target genes of KrasG12D mutation [35,36] (Figure 4D,E) were also significantly increased in colonsof Nudt7−/− mice compared to the those of Nudt7+/+ _AOM/DSS mice.
Cancers 2020, 12, 576 6 of 18
with increased immune cell infiltration [31]. Lymphocyte antigen 6 complex locus G6D (LY6G),
protein tyrosine phosphatase receptor type C (CD45), and adhesion G protein-coupled receptor E1
(F4/80) are used as inflammatory infiltration marker for colon cancer progression and metastasis
marker [27,32,33]. Nudt7−/− mice developed more polyps (Figure 4A) and adenocarcinoma (Figure S5)
and showed the dramatically increased Ki67- (expressed in colonic glands and proliferating cells; 1.32
fold of Nudt7−/−_AOM/DSS colon), F4/80- (expressed in immune cells; 2.79 fold of Nudt7−/−_AOM/DSS
colon), LY6G- (expressed immune cells; 2.47 fold of Nudt7−/−_AOM/DSS colon), and SCD1- (3.70 fold
of Nudt7−/−_AOM/DSS colon) positive cells in colons (Figure 4B,C). The increased levels of
peroxisomal coenzyme A diphosphatase 7 (NUDT7) and acyl-CoA oxidase 1 (ACOX1) expressed in
the epithelial cells and colonic glands in Nudt7+/+_AOM/DSS colon were significantly decreased in
Nudt7−/−_AOM/DSS colon (Figure 4C). The expression level of genes involved in CRC progression
[34] and target genes of KrasG12D mutation [35,36] (Figures 4D,E) were also significantly increased in
colons of Nudt7−/− mice compared to the those of Nudt7+/+ _AOM/DSS mice.
Figure 4. AOM/DSS (azoxymethane/dextran sulfate sodium)-treated Nudt7−/− mice increases the
possibility of CRC development. (A) Mice were treated with AOM/DSS and polyp number was
counted. Scale bars: 2 cm. (B,C) Immunohistochemistry with hematoxylin and eosin (H&E), Ki67,
F4/80, LY6G, NUDT7, ACOX1, and SCD1 (n = 4) and positive cells were counted for every 100 cells in
3 different fields at 100× magnification in Nudt7+/+ and Nudt7−/− colons treated with AOM/DSS. Results
are representative of at least 3 independent experiments. Scale bars: 200 μm. (D,E) Transcriptional
levels of proliferation and inflammatory marker genes and KrasG12D target genes in Nudt7+/+ and
Nudt7−/− colons treated with AOM/DSS. Rn18s was used as an endogenous control. Results are
representative of at least 3 independent experiments. Values are means + SD. An unpaired Student’s
t-test was used for statistical analysis. * p ≤ 0.01, ** p < 0.01, **** p < 0.0001.
2.3. Increased Palmitic Acid Level by Nudt7 Suppression Is Responsible for CRC Development through
Activation of Wnt/β-Catenin Signaling
Figure 4. AOM/DSS (azoxymethane/dextran sulfate sodium)-treated Nudt7−/− mice increases thepossibility of CRC development. (A) Mice were treated with AOM/DSS and polyp number was counted.Scale bars: 2 cm. (B,C) Immunohistochemistry with hematoxylin and eosin (H&E), Ki67, F4/80, LY6G,NUDT7, ACOX1, and SCD1 (n = 4) and positive cells were counted for every 100 cells in 3 differentfields at 100× magnification in Nudt7+/+ and Nudt7−/− colons treated with AOM/DSS. Results arerepresentative of at least 3 independent experiments. Scale bars: 200 µm. (D,E) Transcriptional levelsof proliferation and inflammatory marker genes and KrasG12D target genes in Nudt7+/+ and Nudt7−/−
colons treated with AOM/DSS. Rn18s was used as an endogenous control. Results are representative ofat least 3 independent experiments. Values are means + SD. An unpaired Student’s t-test was used forstatistical analysis. * p ≤ 0.01, ** p < 0.01, *** p < 0.01, **** p < 0.0001.
2.3. Increased Palmitic Acid Level by Nudt7 Suppression Is Responsible for CRC Development throughActivation of Wnt/β-Catenin Signaling
Ingenuity pathway analysis (IPA), using microarray data of Nudt7+/+ and Nudt7−/−colons treatedwith AOM/DSS, suggested the Wnt/β-catenin signaling pathway as one of the upregulated pathways(Figure 5A) in Nudt7−/−colons challenged with AOM/DSS. IPA indicated the increase in the concentrationof lipids as an enriched molecular and cellular function in Nudt7−/−colons (Figure 5B). Significantlyincreased levels of Ctnnb1 (186 tumor vs. 54 normal; 1.55-fold) and decreased levels of Nudt7 (0.93-fold)were also observed in 7 KrasG12D cell lines (CL-40, Colo678, EB, IS1, IS3, LS174T, and TC71 cell line)compared with 12 KrasWT cell lines (Caco2, CL-34, Co115, Colo205, Colo320, HT29, KM12, NCI-H508,RKO, and SW48 cell line) and Bittner colons according to analysis of GSE41258 and Oncomine (Figure 5C).

Cancers 2020, 12, 576 7 of 18
We found that the expression level of β-catenin was significantly increased both in Nudt7−/−mice colonstreated with AOM/DSS and the patient colon of KrasG12D tumor (Figure 5D). The expression levelsof β-catenin target genes, such as Myc (3.3-fold of Nudt7+/+ mice colon), Ccnd1 (4.8-fold of Nudt7+/+
mice colon), Nos2 (2.2-fold of Nudt7+/+ mice colon), Mmp14 (2.5-fold of Nudt7+/+ mice colon), and Cd44(5.2-fold of Nudt7+/+ mice colon), were also significantly increased in Nudt7−/−mice colons comparedwith Nudt7+/+ mice colons (Figure 5E). Restoration of Nudt7 by tail-vein injection into Nudt7−/−micesignificantly reduced the development of adenoma observed in Nudt7−/−mice colons (Figure S6) andthe number of FABP4-, FASN-, Ki67-, CD45-, and SCD1-positive cells (Figure S6). Analysis of fattyacid composition using clinical adjacent normal (non-tumor) and CRC tissues as well as Caco2 cellstransfected with shCon or shNudt7 showed a significant increase in palmitic acid (PA) (Figure 6A andTable S1), suggesting the possible involvement of Nudt7 in the accumulation of PA. To investigate theinvolvement of PA in the activation of the Wnt/β-catenin signaling pathway induced by Nudt7, KrasWT
Caco2 cells were treated with PA. Exposure of PA into KrasWT Caco2 cells significantly increased thetranscription level of Ctnnb1 (Figure 6B and Figure S7B), suggesting that increased levels of palmiticacid by Nudt7 deficiency may be involved in the activation of the Wnt/β-catenin signaling pathway.
Cancers 2020, 12, 576 7 of 18
Ingenuity pathway analysis (IPA), using microarray data of Nudt7+/+ and Nudt7−/− colons treated
with AOM/DSS, suggested the Wnt/β-catenin signaling pathway as one of the upregulated pathways
(Figure 5A) in Nudt7−/− colons challenged with AOM/DSS. IPA indicated the increase in the
concentration of lipids as an enriched molecular and cellular function in Nudt7−/− colons (Figure 5B).
Significantly increased levels of Ctnnb1 (186 tumor vs. 54 normal; 1.55-fold) and decreased levels of
Nudt7 (0.93-fold) were also observed in 7 KrasG12D cell lines (CL-40, Colo678, EB, IS1, IS3, LS174T, and
TC71 cell line) compared with 12 KrasWT cell lines (Caco2, CL-34, Co115, Colo205, Colo320, HT29,
KM12, NCI-H508, RKO, and SW48 cell line) and Bittner colons according to analysis of GSE41258
and Oncomine (Figure 5C). We found that the expression level of β-catenin was significantly
increased both in Nudt7−/− mice colons treated with AOM/DSS and the patient colon of KrasG12D tumor
(Figure 5D). The expression levels of β-catenin target genes, such as Myc (3.3-fold of Nudt7+/+ mice
colon), Ccnd1 (4.8-fold of Nudt7+/+ mice colon), Nos2 (2.2-fold of Nudt7+/+ mice colon), Mmp14 (2.5-fold
of Nudt7+/+ mice colon), and Cd44 (5.2-fold of Nudt7+/+ mice colon), were also significantly increased
in Nudt7−/− mice colons compared with Nudt7+/+ mice colons (Figure 5E). Restoration of Nudt7 by tail-
vein injection into Nudt7−/− mice significantly reduced the development of adenoma observed in
Nudt7−/− mice colons (Figure S6) and the number of FABP4-, FASN-, Ki67-, CD45-, and SCD1-positive
cells (Figure S6). Analysis of fatty acid composition using clinical adjacent normal (non-tumor) and
CRC tissues as well as Caco2 cells transfected with shCon or shNudt7 showed a significant increase in
palmitic acid (PA) (Figure 6A and Table S1), suggesting the possible involvement of Nudt7 in the
accumulation of PA. To investigate the involvement of PA in the activation of the Wnt/β-catenin
signaling pathway induced by Nudt7, KrasWT Caco2 cells were treated with PA. Exposure of PA into
KrasWT Caco2 cells significantly increased the transcription level of Ctnnb1 (Figure 6B and S7B),
suggesting that increased levels of palmitic acid by Nudt7 deficiency may be involved in the
activation of the Wnt/β-catenin signaling pathway.
Figure 5. Suppression of Nudt7 increases -catenin signaling. (A) Canonical pathway was analyzed
using IPA software (Qiagen, Redwood, CA, USA) from microarray data of Nudt7+/+ and Nudt7−/−
colons treated with AOM/DSS. (B) Active z-score of disease and biological functions or molecular and
cellular functions were analyzed using IPA software. (C) GSEA analysis using GEO datasets (CRC
patient biopsy dataset, GSE41258 and KrasG12D mutation CRC cell line dataset, GSE97023) and
expression levels of Nudt7 and Ctnnb1. (D) Immunohistochemical staining with β-catenin and CK19
Figure 5. Suppression of Nudt7 increases β-catenin signaling. (A) Canonical pathway was analyzedusing IPA software (Qiagen, Redwood, CA, USA) from microarray data of Nudt7+/+ and Nudt7−/− colonstreated with AOM/DSS. (B) Active z-score of disease and biological functions or molecular and cellularfunctions were analyzed using IPA software. (C) GSEA analysis using GEO datasets (CRC patientbiopsy dataset, GSE41258 and KrasG12D mutation CRC cell line dataset, GSE97023) and expressionlevels of Nudt7 and Ctnnb1. (D) Immunohistochemical staining with β-catenin and CK19 and positivecell count in Nudt7+/+ and Nudt7−/− mice treated with AOM/DSS (n = 4; 100×magnification; scale bars:200 µm) and KrasG12D-derived CRC patient (n = 4; β-catenin, 100×magnification, scale bars: 200 µm;CK19, 200×magnification, scale bars: 100 µm) and positive cells were counted for every 100 cells in 3different fields. CK19 was used as a marker for epithelial tissue. Results are representative of at least3 independent experiments. The dotted line boxes were enlarged in the bottom left corner of eachimage. (E) Transcriptional levels of β-catenin target genes and presented as the fold change comparedwith Nudt7−/− mice. Rn18s was used as an endogenous control. Results are representative of at least 3independent experiments. Values are means + SD. An unpaired Student’s t-test was used for statisticalanalysis. * p ≤ 0.05, ** p < 0.01, *** p < 0.01, **** p < 0.0001.

Cancers 2020, 12, 576 8 of 18
Cancers 2020, 12, 576 8 of 18
and positive cell count in Nudt7+/+ and Nudt7−/− mice treated with AOM/DSS (n = 4; 100× magnification;
scale bars: 200 μm) and KrasG12D-derived CRC patient (n = 4; β-catenin, 100× magnification, scale bars:
200 μm; CK19, 200× magnification, scale bars: 100 μm) and positive cells were counted for every 100
cells in 3 different fields. CK19 was used as a marker for epithelial tissue. Results are representative
of at least 3 independent experiments. The dotted line boxes were enlarged in the bottom left corner
of each image. (E) Transcriptional levels of -catenin target genes and presented as the fold change
compared with Nudt7−/− mice. Rn18s was used as an endogenous control. Results are representative
of at least 3 independent experiments. Values are means + SD. An unpaired Student’s t-test was used
for statistical analysis. * p ≤ 0.05, ** p < 0.01, ** p < 0.01, **** p < 0.0001.
For further verification of the PA role in CRC development, we produced the chitosan film (Chi)
and chitosan/palmitate (Chi/PA) complex (Figure 6C) which was attached in the colon in Nudt7+/+
mice for a week. We observed a significantly increased number of polyps (Figure 6D). We observed
the increase in infiltration of inflammatory cells, a key feature of sporadic adenomatous colonic
polyps with an increased number of Ki67-, CD45-, β-catenin-, proliferating cell nuclear antigen
(PCNA)-, and F4/80-positive cells (Figure 6E) in the Chi/PA-attached Nudt7+/+ colon polyp. The
expression level of genes involved in CRC development and progression also increased in Chi/PA-
attached Nudt7+/+ colons (Figure 6F).
Figure 6. Accumulated palmitic acid is responsible for activation of β-catenin signaling. (A)
Lipidomics was applied and the expression level of palmitic acid (PA) was analyzed in CRC tumors
or shNudt7 introduced KrasWT CRC cells (left panel) (n = 4). The efficiency of shNudt7 was confirmed
using KrasWT CRC cells (right panel). (B) KrasWT Caco2 cells were introduced with Nudt7 or shNudt7 in
the presence of PA and the expression level of β-catenin was analyzed by real-time PCR and
represented as the fold change compared with the negative control (-palmitic acid/-shNudt7/-Nudt7).
Results are representative of at least 3 independent experiments. Rn18s was used as an endogenous
control. (C) Schematic diagram of generating Chi or Chi/PA film. (D) Chi or Chi/PA film was attached
in the colon of Nudt7+/+ mice for one week and polyp number was counted. Scale bars: 0.5 cm. (E)
Immunohistochemistry with H&E, NUDT7, Ki67, CD45, β-catenin, PCNA, and F4/80 (n = 5) colon-
Figure 6. Accumulated palmitic acid is responsible for activation of β-catenin signaling. (A) Lipidomicswas applied and the expression level of palmitic acid (PA) was analyzed in CRC tumors or shNudt7introduced KrasWT CRC cells (left panel) (n = 4). The efficiency of shNudt7 was confirmed using KrasWT
CRC cells (right panel). (B) KrasWT Caco2 cells were introduced with Nudt7 or shNudt7 in the presenceof PA and the expression level of β-catenin was analyzed by real-time PCR and represented as the foldchange compared with the negative control (-palmitic acid/-shNudt7/-Nudt7). Results are representativeof at least 3 independent experiments. Rn18s was used as an endogenous control. (C) Schematicdiagram of generating Chi or Chi/PA film. (D) Chi or Chi/PA film was attached in the colon of Nudt7+/+
mice for one week and polyp number was counted. Scale bars: 0.5 cm. (E) Immunohistochemistrywith H&E, NUDT7, Ki67, CD45, β-catenin, PCNA, and F4/80 (n = 5) colon-attached Chi or Chi/PAfilm. Results are representative of at least 3 independent experiments and for every 100 cells in 3different fields at 100×magnification. Scale bars: 200 µm. (F) Expression level of CRC-related genes incolon-attached Chi or Chi/PA film and represented as the fold change compared with colon-attachedChi film. Results are representative of at least 3 independent experiments. * p ≤ 0.05, ** p < 0.01, *** p <
0.01, **** p < 0.0001.
For further verification of the PA role in CRC development, we produced the chitosan film (Chi)and chitosan/palmitate (Chi/PA) complex (Figure 6C) which was attached in the colon in Nudt7+/+ micefor a week. We observed a significantly increased number of polyps (Figure 6D). We observed theincrease in infiltration of inflammatory cells, a key feature of sporadic adenomatous colonic polypswith an increased number of Ki67-, CD45-, β-catenin-, proliferating cell nuclear antigen (PCNA)-, andF4/80-positive cells (Figure 6E) in the Chi/PA-attached Nudt7+/+ colon polyp. The expression levelof genes involved in CRC development and progression also increased in Chi/PA-attached Nudt7+/+
colons (Figure 6F).
3. Discussion
Since lipid metabolism is known to be closely involved in various regulatory and developmentalsignaling pathways through regulation of cell growth and proliferation [37], it is not surprising thatlipogenic regulatory pathways are dysregulated in cancer. Among the cellular organelles involved in
Cancers 2020, 12, 576 9 of 18
lipid metabolism, our laboratory [38] previously suggested the importance of peroxisomes and theirinter-connection with mitochondria in maintaining lipid homeostasis. Other studies also suggest thatperoxisome plays a central role in cellular lipid metabolism, and particularly in fatty acid oxidation,which cannot be replaced by mitochondria [39,40]. β-oxidation of VLCFAs and branched chainfatty acids preferentially occurs in peroxisomes [41] and patients with peroxisomal disorders showincreased serum levels of VLCFAs and branched chain fatty acids [42,43]. Here, in CRC patients, wefound elevated levels of VLCFAs, suggesting the possible involvement of peroxisomal dysfunctionin the pathogenesis of CRC. We observed high levels of peroxisomal lipid ROS and dysregulation ofperoxisomal function in KrasG12D CRC cells compared with KrasWT CRC cells, suggesting that revealingand targeting the underlying mechanisms of peroxisomes in KrasG12D CRC could provide a possiblestrategy to develop effective therapeutic intervention against Kras-dependent malignancies.
To identify the possible responsible genes in dysregulation of lipid homoeostasis in KrasG12D CRC,transcriptomic analysis identified Nudt7, a peroxisomal gene. NUDT7 is known to mediate the cleavageof CoA, CoA ester, oxidized CoA to 3, 5-adenosine diphosphate (ADP) and 4-phosphopantetheine, andregulates CoA and acyl CoA levels in peroxisome [44,45]. Since the important role of CoA homeostasisin tumor growth and malignant progression has been suggested [46], NUDT7 may play an importantrole in cancer development by altering CoA pools. However, the exact function and role of NUDT7 hasnot been well studied. Here, we found that downregulation of Nudt7 leads to VLCFA accumulation,and overexpression of Nudt7 inhibits in vitro proliferation and in vivo xenograft tumor growth ofKrasG12D CRC cells. AOM/DSS-challenged Nudt7−/− colon exhibited significant increases in the numberof CD45-, F4/80-, and LY6G-positive cells suggesting Nudt7 deficiency may be attributed to the inducednumber of infiltration immune cells in the colon of AOM/DSS-treated mice. Nudt7 is importantin the recruitment of neutrophil and monocytes/macrophages to the inflammatory sites followingAOM/DSS challenge and may contribute to the induction of inflammatory cytokines, in line with ourfindings that show that Nudt7 deficiency stimulates inflammatory responses in mice and humans withosteoarthritis [30]. Moreover, Nudt7−/− mice showed a significantly more pronounced increase in theexpression levels of genes involved in the development of CRC, suggesting NUDT7 as a novel potenttumor suppressor for CRC.
Aberrant Wnt signaling is associated with many types of cancers [47,48] suggesting Wnt signalingis an attractive and effective target for therapeutic strategy. Activation of Wnt signaling is frequentlyobserved in human CRC patients [49,50]. Activation of Wnt signaling acts as a key oncogenic driver [32],which is crucial for stem cell maintenance in CRC [51]. The Adenomatous polyposis coli (Apc) tumorsuppressor gene interacts with β-catenin [52] and loss of function of Apc results in overactive T-cellfactor (TCF) 4/β-catenin signaling [53]. Other studies reported the crosstalk between Wnt/β-cateninand Ras-Erk pathways in the colorectal tumorigenesis [54,55]. Wnt signaling is involved in the stabilityof Ras through regulation of glycogen synthase kinas 3β-mediated Ras phosphorylation [56]. Inhepatocellular carcinoma, Wnt signaling modulates lipid homeostasis in a Ras-dependent manner [57].In this study, we found that Ras activity modulates the expression level of NUDT7 in an opposite manner,and decreased levels of NUDT7 deregulate lipid homeostasis by the upregulation of Wnt signaling.
Fatty acids can influence cell and tissue metabolism and function through the modulationof immunity, inflammation, and cell signaling [34,35]. Fatty acids are associated with diseaserisk and contribute to the development of pathological conditions [58,59]. The important role ofeicosanoids generated from cyclooxygenase and the lipoxygenase metabolism of arachidonic acid, ann-6 polyunsaturated fatty acid (PUFA), has been suggested in the development of CRC [60]. Here,we found that suppression of Nudt7 induced the accumulation of palmitic acid and this accumulatedpalmitic acid acted as a driver of Wnt signaling. In several cancers including melanoma, breast cancer,and prostate cancer, cancer cells can uptake, incorporate, and use the exogenous palmitic acid tofuel their pathogenicity [61]. Palmitic acid triggers a non-canonical autophagic response in humancancer cells [62,63]. Palmitic acid increases CRC growth via the modulation of β-adrenergic receptorexpression [64] or by modulation of Wnt signaling [65]. Several studies proposed the connection

Cancers 2020, 12, 576 10 of 18
of palmitic acid to cancer promotion/suppression via Wnt/β-catenin signaling [66]. However, theresponsible regulatory factor induced by palmitic acid has not been well studied. As a possibleregulatory factor, we found that palmitic acid altered the expression level of microRNA (miR)-32-5pand increased the level of miR-32-5p, stimulating Wnt/β-catenin signaling (Figure S7). Introduction ofPA into KrasWT Caco2 cells increased the expression level of miR-32-5p known as onco-miRs (FigureS7A) and introduction of miR-32-5p increased expression level of β-catenin (Figure S7B). Furthermore,we observed an increased level of miR-32-5p in CRC patient tumors and Nudt7−/− mice colons (FigureS7C). Several reports [67–69] suggested that PA is involved in tumorigenesis by modulating the levelof miRs. PA increases the invasiveness of pancreatic cancer cells by decreasing the level of miR-29c [70].However, the exact function and mechanism of miR-32-5p in CRC induced by suppression of Nudt7 iscurrently under study in our laboratory.
In summary, our data indicate that suppression of Nudt7 may be responsible for tumorigenicactivity of KrasG12D CRC through upregulation of Wnt/β-catenin signaling and accumulation of palmiticacid. Restoration of Nudt7 expression may be developed as a therapeutic strategy to treat patients withCRC, especially cases with KrasG12D mutation.
4. Materials and Methods
4.1. Clinical Samples
Tumor specimens were collected from colorectal cancer patients who underwent resection ofcolorectal tumors at Wonkwang University Hospital (Iksan, Korea). Sample collection was approved bythe Human Subjects Committee of Wonkwang University (Chunbuk, Korea, #WKUH 201401-BR-003).
4.2. Ethics Approval
All the animal experiments were conducted according to the protocol approved by the AnimalCare and Use Committee of Wonkwang University (#WKU-18-22). Human colon tissue collection wasapproved by the Human Subjects Committee of Wonkwang University Hospital and studies wereperformed in compliance with the institutional guidelines (#WKUH 201401-BR-003). Written informedconsent was obtained from all adult patients or at least one guardian of each patient prior to the startof the experiment.
4.3. Animals
The AOM/DSS mouse model [71] was used to examine the mechanisms of human colorectalcarcinogenesis. Eight-week-old C57BL/6 wild mice and Nudt7−/− mice [30] were injectedintraperitoneally with azoxymethane (AOM; 12.5 mg/kg, Sigma-Aldrich, Louis, MO, USA). Weused three cycles of feeding mice with 2% dextran sulfate sodium (DSS) in the drinking water for 5 days,which was replaced on day 6 with autoclaved drinking water without DSS for 5 days. After 30 days,mice were sacrificed, and colon tissues were collected. Nudt7 were cloned into pLenti-CMV-RFP-puro(Abm, Richmond, BC, Canada) lentiviral vector and introduced into the mice by tail-vein injectionof Nudt7. Tissue sections (formalin-fixed, paraffin-embedded) of mouse strain Villin-CreERT2; Apcf/f;Trp53f/f; tetO-LSL-KrasG12D were generous gifts from Drs. DePinho and Boutin [29].
4.4. Mouse Xenograft Model
Cancer cells (5 × 10⁵ cells/100 µL/site) were suspended in Matrigel Matrix (Corning, Corning,NY, USA), then subcutaneously injected into the flank of 6-week-old male nude mice (BALB/c-nude).Injected tumor size was measured every day with calipers. Four weeks after injection, tumors wereexcised from euthanized mice and the tumor mass and weight were measured.

Cancers 2020, 12, 576 11 of 18
4.5. Cell Culture
Six human colon cancer cell lines with documented Kras G12D mutations (KrasG12D), LS-174T,SNU-407, and SNU-C2A, and three Kras wild-type (KrasWT) colon cancer cells, Caco2, COLO-320DM,and HT29, were purchased from American Type Culture Collection (ATCC, Manassas, VA. USA) orKorea Cell Line Bank (KCLB, Seoul, Korea). Enriched cells were then cultured at sub-clonal density(1–10 cells/cm2) with complete growth medium of each cell line at 37 ◦C and 5% CO2 atmosphere.Caco2 was cultured in MEM medium (Gibco-Invitrogen, Waltham, MA, USA) supplemented with 20%FBS (Gibco-Invitrogen) at 37 ◦C and 5% CO2; LS-174T, SNU-407, SNU-C2A, HT-29, and COLO-320DMwere cultured in RPMI 1640 medium (Gibco-Invitrogen) with 10% FBS. For the palmitate treatments,cells were treated with 50 µM conjugated palmitate (Sigma-Aldrich) with 10% (w/v) fatty acid freeBSA (Sigma-Aldrich) in the DMEM medium. Cell lines used in silico analysis, in vitro, and in vivoexperiments, as listed in Table S2.
4.6. Plasmids and Lentiviral Packaging
Nudt7 expression vector was generated by cloning a Nudt7 coding sequence (CDS) in thepLenti-CMV-RFP-puro (Abm) lentiviral vector. Nudt7-specific shRNA was cloned in the pLKO.1-TRCcloning vector (Addgene, Watertown, MA, USA). Empty vector was used as a control. Lentivirus waspackaged in HEK293T cells using a Lentifectin (Abm) and concentrated using Lenti-X Concentrator(Clonetech, Mountain View, CA, USA).
4.7. Real-Time PCR
The real-time PCR was performed with RealMIX SYBR Kit, Hi-Rox (Geneer, Daejeon, Korea) in aStep One Plus Real-Time PCR System (Applied Biosystems, Beverly, MA, USA). The reaction mixtureswere incubated at 95 ◦C for 10 min followed by 40 cycles at 95 ◦C for 10 s, 57 ◦C for 10 s, and 72 ◦C for15 s. 18S ribosomal RNA (Rn18s) or actin beta (Actb) was used as the housekeeping gene. The primersequence used in this study is listed in Table S3. The fold change in the target genes was calculatedbased on 2∆∆Ct method [72].
4.8. Quantification of miRNA
For miRNA quantification analysis, the cDNA samples were synthesized using a Mir-X miRNAFirst Strand Synthesis Kit (Clonetech). Quantitative RT-PCR was performed using Mir-X qRT-PCRSYBR Kit (Clontech) and miR-32-5p-specific forward primer (Genolution) in a Step One Plus Real-TimePCR System. Quantitative RT-PCR conditions were used per the manufacturer’s protocols. Theexpression of miR-32-5p was normalized with U6 small nuclear RNA (endogenous control; Qiagen,Redwood, CA, USA).
4.9. Peroxisomal Gene Profiling
RNA isolated using RNAiso (TaKaRa, Shiga, Japan) was reverse-transcribed using the AccuRTGenomic DNA Removal Kit (Abm) and oligo dT primers according to the manufacturer’s protocol.The relative abundance of each gene was determined using RT-PCR with specific primers for 94peroxisomal genes. Actb and Rn18s were used as the endogenous control genes. Gene expression datawere analyzed and visualized using PermutMatrix software (version# 1.9.3). The primer sequenceused in this study is listed in Table S3.
4.10. Microarray Using RNA Isolated from Paraffin Section
Total RNA was extracted using a RecoverAllTotal Nucleic Acid Isolation kit (ThermoFisherScientific, Waltham, MA, USA) from FFPE (formalin-fixed paraffin-embedded) CRC samples ofNudt7+/+ and Nudt7−/− mice treated with AOM/DSS. mRNA expression analysis was performed withthe Affymetrix GeneChip Whole Transcript PLUS reagent method. cDNA was synthesized using a
Cancers 2020, 12, 576 12 of 18
GeneChip Whole Transcript Amplification Kit. Fragmented sense cDNA was biotin-labeled with TdT(terminal deoxynucleotidyl transferase) using the GeneChip WT Terminal Labeling Kit, and hybridizedto the Affymetrix GeneChip Mouse 2.0 ST Array for 16 h at 45 ◦C. The hybridized array was washed andstained on a GeneChip Fluidics Station 450 and scanned on a GCS3000 Scanner (Affymetrix, Waltham,MA, USA). Signal values were computed using the Affymetrix GeneChip Command Console software.
4.11. Lipid Accumulation and ROS Staining
To measure lipid accumulation, cells were fixed with 4% paraformaldehyde for 10 min. Afterwashing ice-cold 1× PBS, cells were stained with BODIPY or HCS LipidTOX Deep Red neutral lipidstain (ThermoFisher Scientific) for 10 min at room temperature. After PBS washing, cells were stainedwith DAPI (4’,6-diamidino-2-phenylindole) that was diluted in PBS. Stained cells were visualized andcaptured with the EVOS FL Auto Cell Imaging System (ThermoFisher Scientific).
4.12. Immunohistochemistry
Colon tissues were fixed in 10% neutral buffered formalin and paraffin-embedded after thedehydrate process. Paraffin-embedded tissue blocks were sliced into 5 µm sections for hematoxylin andeosin (H&E) staining and immunohistochemistry. The sections were deparaffinized, rehydrated, andantigen retrieval was performed using a pressure cooker with 0.01 M citrate buffer at pH 6.0. Intrinsicperoxidase activity was blocked using 1% hydrogen peroxide, and 10% normal goat serum (NGS;Vector Laboratories, Burlingame, CA, USA) was used for 1 h to block. The slides were then incubatedovernight at 4 ◦C. The following antibodies were used for immunohistochemistry overnight at 4 ◦C(1:200 dilution): ACC (acetyl-CoA carboxylase, Abcam, Cambridge, MA, USA), ACOX1 (acyl-CoAoxidase 1, Abcam), β-catenin (BD Biosciences, San Jose, CA, USA), Ki67 (proliferation marker proteinki-67, Abcam), CD45 (leukocyte common antigen, Abcam), CK19 (cytokeratin 19, epithelial marker,Abcam), CPT1 (carnitine palmitoyltransferase 1, Abcam), FABP4 (fatty acid binding protein, Abcam),FASN (fatty acid synthetase, Abcam), F4/80 (staining for macrophage, ThermoFisher Scientific), LY6G(lymphocyte antigen 6 complex locus G6D, staining for monocytes, granulocytes and neutrophils,ThermoFisher Scientific), PCNA (proliferating cell nuclear antigen, Abcam), and SCD1 (stearoyl-CoAdesaturase, Abcam). For mouse NUDT7 immunohistological detection, NUDT7 C-terminal specificpeptide (6–20 amino acids, GLPEPVRNNLIDDAK-C) was synthesized by Ab frontier (Seoul, Korea).After incubation with the horseradish peroxidase (HRP)-conjugated secondary antibody (Rabbit ormouse IgG-heavy and light chain antibody, 1:500 dilutions; Bethyl Laboratories, Montgomery, TX, USA)for 1 h at room temperature, antigen signals were detected using the ImmPACT® DAB Peroxidase(HRP) Substrate Kit (Vector Laboratories). All sections were counterstained with hematoxylin. Stainedcells were visualized and captured with the Leica Imaging System (Wetzlar, Germany). Positivestaining integrity was measured using IHC Profiler of Image J software (version 1.52a, NIH, Bethesda,MD, USA) [73,74].
4.13. Western Blot Analysis
Nuclear and cytoplasmic proteins were prepared using Nuclear/Cytosol Fractionation Kit(BioVision, Milpitas, CA, USA) and concentration was measured using the Pierce BCA Protein AssayKit (Pierce, Waltham, MA, USA). We electrophoresed 40 µg protein on SDS-PAGE gel and transferredto a nitrocellulose membrane (GE Healthcare Life Sciences, Pittsburgh, PA, USA). Membranes wereblocked with 5% skim milk in TBS-0.1% Tween 20 (TBS-T) overnight at 4 ◦C and immunoblottedwith the following antibodies (1:1000 dilution): β-catenin (Abcam), GAPDH (Bioworld Technology,Bloomington, MN, USA), and Histone-H3 (Cell Signaling Technology, Danvers, MA, USA) for 1 h atroom temperature. Then, membranes were incubated with the HRP-conjugated secondary antibody(1:2500 dilution) (α-Mouse, Enzo Lifesciences, Farmingdale, NY, USA; α-Rabbit, Enzo Lifesciences,Farmingdale, NY, USA) and the immunoreactive proteins were visualized with SuperSignal West PicoPLUS Chemiluminescent Substrate (ThermoFisher Scientific).
Cancers 2020, 12, 576 13 of 18
4.14. Preparation of Chitosan Films
Chitosan films were prepared using a solution casting method. Briefly, chitosan (100 mg) washydrated in 5 mL of 5 N HCl solution, and 45 mL of distilled and deionized water (DDW) were addedto the chitosan solution. After its complete dissolution, the chitosan was purified by dialysis (MWCO= 12–14 kDa, Spectra Por, Spectrum Chemical Mfg. Gardena, CA, USA) against DDW for 2 days. Thepurified chitosan solution was poured onto the Petri dishes (diameter: 35 mm, thickness: 10 mm)for solution casting. The chitosan films were fully dried at 40 ◦C for one day and maintained in amoisture-free desiccator until use. When we performed the experiments, the chitosan films weretreated with sodium hydroxide (NaOH) for 10 min and then were washed with 10 mM PBS solutionsseveral times.
4.15. Preparation of Chitosan/Palmitic Acid Composite Films (Chi/PA films)
To fabricate the Chi/PA films, the chitosan films were firstly prepared as described above. Themixture solutions of chitosan in water and palmitic acid in ethanol were poured onto the chitosanfilms. The solutions on the chitosan films were dried at 40 ◦C for one day and were maintained in amoisture-free desiccator until use. When Chi/PA films were treated with NaOH, the rigid structures offilms were destroyed and instantaneously transitioned into a hydrogel-like state.
4.16. Gas Chromatograph/Mass spectrometry (GC/MS) Spectrometry
Total lipids were extracted using a chloroform/methanol (2:1 v/v) mixture. The extracted lipids wereseparated on a Sep-Pak Silica Cartilage column (Waters, Milford, MA, USA) and were transmethylatedwith 0.5 M CH3ONa in methanol by heating in a sealed tube at 70 ◦C for 1 h under nitrogen. The fattyacid methyl esters were extracted with hexane. Subsequent GC/MS analysis was performed accordingto the standard protocol [75].
4.17. Statistical Analysis
Statistical comparisons were performed on GraphPad Prism software (Version 6.0, San Diego, CA,USA) using unpaired t-test, two-way ANOVA, and multiple t-test for multiple variable experiments.
5. Conclusions
Our data indicate that suppression of Nudt7 may be responsible for tumorigenic activity ofKrasG12D CRC through upregulation of Wnt/β-catenin signaling and accumulation of palmitic acid.Restoration of Nudt7 expression could be developed as a therapeutic strategy to treat patients withCRC, especially the cases with KrasG12D mutation.
Supplementary Materials: The following are available online at http://www.mdpi.com/2072-6694/12/3/576/s1,Figure S1: Decreased level of Nudt7 expression in KrasG12D tumor, Figure S2: Nudt7 is involved in lipid homeostasis,Figure S3: Dysregulation of lipid homeostasis is induced by Nudt7 deficiency, Figure S4: Dysregulation of lipidmetabolism in KrasG12D CRC, Figure S5: Development of adenocarcinoma in Nudt7−/−_AOM/DSS colon, Figure S6:Restoration of Nudt7 into Nudt7−/− mice reduces the expression levels of lipid metabolic and proliferation factors,Figure S7: Palmitic acid induced expression level of miR-32-5p and an increased level of miR-32-5p activatesWnt/β-catenin signaling, Table S1: Lipidomics analysis of CRC using gas chromatography/mass spectrometry(GC/MS), Table S2: List of cell lines used in this study, Table S3: List of real-time PCR primer used in this study.
Author Contributions: Conceptualization, E.-J.J.; data curation, J.S., S.P., J.O., and D.K.; formal analysis:J.S., funding acquisition, J.S. and E.-J.J.; investigation, J.S., X.C., and I.-J.B.; resources, W.C.P., I.-J.B., and J.H.R.;writing—original draft, E.-J.J. and X.L. All authors have read and agreed to the published version of the manuscript.
Funding: This work was supported by the National Research Foundation of Korea (NRF) grant funded by theKorean government (MSIP) (2019R1A2C2002157 and 2019R1I1A1A01041827). The authors gratefully thank PeterKim at the University of Toronto for valuable discussions.
Conflicts of Interest: The authors declare no potential conflicts of interest.

Cancers 2020, 12, 576 14 of 18
Abbreviations
ABCA1 ATP binding cassette subfamily A member 1 ACC Acetyl-CoA carboxylase α
ACSL1 Acyl-CoA synthetase long chain fatty acid member 1 AGPAT 1-acyl-glycerol-3-phosphate acyltransferaseAOM Azoxymethane CD36 Fatty acid translocaseCD45 Protein tyrosine phosphatase receptor type C CPT1 Carnitine palmitoyltransferaseCRC Colorectal cancer CK19 Cytokeratin 19DSS Dextran sulfate F4/80 Adhesion G protein-coupled receptor E1FABP4 Fatty acid binding protein 4 FASN Fatty acid synthaseKi67 Proliferation marker protein ki-67 KRAS Kirsten rat sarcoma viral oncogene homologLCFA Long chain fatty acid LDLR Low density lipoprotein receptorLY6G Lymphocyte antigen 6 complex locus G6D MUFA Mono-unsaturated fatty acidNUDT7 Peroxisomal coenzyme A diphosphatase NUDT7 PPARG Peroxisome proliferator activated receptor gammaSCD1 Stearoyl-CoA desaturase-1 SFA Saturated fatty acidVLCFA Very long chain fatty acid VLDLR Very low density lipoprotein receptor
References
1. Bhandari, A.; Woodhouse, M.; Gupta, S. Colorectal cancer is a leading cause of cancer incidence andmortality among adults younger than 50 years in the USA: A SEER-based analysis with comparison to otheryoung-onset cancers. J. Investig. Med. 2017, 65, 311–315. [CrossRef]
2. Esteban-Jurado, C.; Garre, P.; Vila, M.; Lozano, J.J.; Pristoupilova, A.; Beltran, S.; Abuli, A.; Munoz, J.;Balaguer, F.; Ocana, T.; et al. New genes emerging for colorectal cancer predisposition. World J. Gastroenterol.2014, 20, 1961–1971. [CrossRef] [PubMed]
3. Gylfe, A.E.; Katainen, R.; Kondelin, J.; Tanskanen, T.; Cajuso, T.; Hanninen, U.; Taipale, J.; Taipale, M.;Renkonen-Sinisalo, L.; Jarvinen, H.; et al. Eleven candidate susceptibility genes for common familialcolorectal cancer. PLoS Genet 2013, 9, e1003876. [CrossRef] [PubMed]
4. Martinelli, E.; De Palma, R.; Orditura, M.; De Vita, F.; Ciardiello, F. Anti-epidermal growth factor receptormonoclonal antibodies in cancer therapy. Clin. Exp. Immunol. 2009, 158, 1–9. [CrossRef] [PubMed]
5. Van Cutsem, E.; Kohne, C.H.; Hitre, E.; Zaluski, J.; Chang Chien, C.R.; Makhson, A.; D’Haens, G.; Pinter, T.;Lim, R.; Bodoky, G.; et al. Cetuximab and chemotherapy as initial treatment for metastatic colorectal cancer.N. Engl. J. Med. 2009, 360, 1408–1417. [CrossRef] [PubMed]
6. Peeters, M.; Price, T.J.; Cervantes, A.; Sobrero, A.F.; Ducreux, M.; Hotko, Y.; Andre, T.; Chan, E.; Lordick, F.;Punt, C.J.; et al. Randomized phase III study of panitumumab with fluorouracil, leucovorin, and irinotecan(FOLFIRI) compared with FOLFIRI alone as second-line treatment in patients with metastatic colorectalcancer. J. Clin. Oncol. 2010, 28, 4706–4713. [CrossRef] [PubMed]
7. Poehlmann, A.; Kuester, D.; Meyer, F.; Lippert, H.; Roessner, A.; Schneider-Stock, R. K-ras mutation detectionin colorectal cancer using the Pyrosequencing technique. Pathol. Res. Pract. 2007, 203, 489–497. [CrossRef]
8. Raponi, M.; Winkler, H.; Dracopoli, N.C. KRAS mutations predict response to EGFR inhibitors. Curr. Opin.Pharmacol. 2008, 8, 413–418. [CrossRef]
9. van de Wetering, M.; Sancho, E.; Verweij, C.; de Lau, W.; Oving, I.; Hurlstone, A.; van der Horn, K.; Batlle, E.;Coudreuse, D.; Haramis, A.P.; et al. The beta-catenin/TCF-4 complex imposes a crypt progenitor phenotypeon colorectal cancer cells. Cell 2002, 111, 241–250. [CrossRef]
10. Li, Z.; Kang, Y. Lipid Metabolism Fuels Cancer’s Spread. Cell Metab. 2017, 25, 228–230. [CrossRef]11. Maulucci, G.; Cohen, O.; Daniel, B.; Sansone, A.; Petropoulou, P.I.; Filou, S.; Spyridonidis, A.; Pani, G.; De
Spirito, M.; Chatgilialoglu, C.; et al. Fatty acid-related modulations of membrane fluidity in cells: detectionand implications. Free Radic. Res. 2016, 50, S40–S50. [CrossRef] [PubMed]
12. Ibarguren, M.; Lopez, D.J.; Escriba, P.V. The effect of natural and synthetic fatty acids on membrane structure,microdomain organization, cellular functions and human health. Biochim. Biophys. Acta 2014, 1838, 1518–1528.[CrossRef] [PubMed]
13. Igal, R.A. Stearoyl-CoA desaturase-1: A novel key player in the mechanisms of cell proliferation, programmedcell death and transformation to cancer. Carcinogenesis 2010, 31, 1509–1515. [CrossRef] [PubMed]

Cancers 2020, 12, 576 15 of 18
14. Currie, E.; Schulze, A.; Zechner, R.; Walther, T.C.; Farese, R.V., Jr. Cellular fatty acid metabolism and cancer.Cell Metab. 2013, 18, 153–161. [CrossRef] [PubMed]
15. Padanad, M.S.; Konstantinidou, G.; Venkateswaran, N.; Melegari, M.; Rindhe, S.; Mitsche, M.; Yang, C.;Batten, K.; Huffman, K.E.; Liu, J.; et al. Fatty Acid Oxidation Mediated by Acyl-CoA Synthetase Long Chain3 Is Required for Mutant KRAS Lung Tumorigenesis. Cell Rep. 2016, 16, 1614–1628. [CrossRef] [PubMed]
16. Yu, R.Z.; Lemonidis, K.M.; Graham, M.J.; Matson, J.E.; Crooke, R.M.; Tribble, D.L.; Wedel, M.K.; Levin, A.A.;Geary, R.S. Cross-species comparison of in vivo PK/PD relationships for second-generation antisenseoligonucleotides targeting apolipoprotein B-100. Biochem. Pharmacol. 2009, 77, 910–919. [CrossRef]
17. Poirier, Y.; Antonenkov, V.D.; Glumoff, T.; Hiltunen, J.K. Peroxisomal beta-oxidation–a metabolic pathwaywith multiple functions. Biochim. Biophys. Acta 2006, 1763, 1413–1426. [CrossRef]
18. Reddy, J.K.; Hashimoto, T. Peroxisomal beta-oxidation and peroxisome proliferator-activated receptor alpha:an adaptive metabolic system. Annu. Rev. Nutr. 2001, 21, 193–230. [CrossRef]
19. Stephen, R.L.; Gustafsson, M.C.; Jarvis, M.; Tatoud, R.; Marshall, B.R.; Knight, D.; Ehrenborg, E.; Harris, A.L.;Wolf, C.R.; Palmer, C.N. Activation of peroxisome proliferator-activated receptor delta stimulates theproliferation of human breast and prostate cancer cell lines. Cancer Res. 2004, 64, 3162–3170. [CrossRef]
20. Gou, Q.; Gong, X.; Jin, J.; Shi, J.; Hou, Y. Peroxisome proliferator-activated receptors (PPARs) are potentialdrug targets for cancer therapy. Oncotarget 2017, 8, 60704–60709. [CrossRef]
21. Youssef, J.; Badr, M. Peroxisome proliferator-activated receptors and cancer: challenges and opportunities.Br. J. Pharmacol. 2011, 164, 68–82. [CrossRef] [PubMed]
22. Schluter, A.; Fourcade, S.; Domenech-Estevez, E.; Gabaldon, T.; Huerta-Cepas, J.; Berthommier, G.; Ripp, R.;Wanders, R.J.; Poch, O.; Pujol, A. PeroxisomeDB: A database for the peroxisomal proteome, functionalgenomics and disease. Nucleic Acids Res. 2007, 35, D815–822. [CrossRef] [PubMed]
23. Oh, J.H.; Ku, J.L.; Yoon, K.A.; Kwon, H.J.; Kim, W.H.; Park, H.S.; Yeo, K.S.; Song, S.Y.; Chung, J.K.; Park, J.G.Establishment and characterization of 12 human colorectal-carcinoma cell lines. Int. J. Cancer 1999, 81,902–910. [CrossRef]
24. Ahmed, D.; Eide, P.W.; Eilertsen, I.A.; Danielsen, S.A.; Eknaes, M.; Hektoen, M.; Lind, G.E.; Lothe, R.A.Epigenetic and genetic features of 24 colon cancer cell lines. Oncogenesis 2013, 2, e71. [CrossRef]
25. Medico, E.; Russo, M.; Picco, G.; Cancelliere, C.; Valtorta, E.; Corti, G.; Buscarino, M.; Isella, C.; Lamba, S.;Martinoglio, B.; et al. The molecular landscape of colorectal cancer cell lines unveils clinically actionablekinase targets. Nat. Commun. 2015, 6, 7002. [CrossRef]
26. Melone, M.A.B.; Valentino, A.; Margarucci, S.; Galderisi, U.; Giordano, A.; Peluso, G. The carnitine systemand cancer metabolic plasticity. Cell Death Dis 2018, 9, 228. [CrossRef]
27. Valentino, A.; Calarco, A.; Di Salle, A.; Finicelli, M.; Crispi, S.; Calogero, R.A.; Riccardo, F.; Sciarra, A.;Gentilucci, A.; Galderisi, U.; et al. Deregulation of MicroRNAs mediated control of carnitine cycle in prostatecancer: Molecular basis and pathophysiological consequences. Oncogene 2017, 36, 6030–6040. [CrossRef]
28. Sabates-Bellver, J.; Van der Flier, L.G.; de Palo, M.; Cattaneo, E.; Maake, C.; Rehrauer, H.; Laczko, E.;Kurowski, M.A.; Bujnicki, J.M.; Menigatti, M.; et al. Transcriptome profile of human colorectal adenomas.Mol. Cancer Res. 2007, 5, 1263–1275. [CrossRef]
29. Boutin, A.T.; Liao, W.T.; Wang, M.; Hwang, S.S.; Karpinets, T.V.; Cheung, H.; Chu, G.C.; Jiang, S.; Hu, J.;Chang, K.; et al. Oncogenic Kras drives invasion and maintains metastases in colorectal cancer. Genes Dev.2017, 31, 370–382. [CrossRef]
30. Song, J.; Baek, I.J.; Chun, C.H.; Jin, E.J. Dysregulation of the NUDT7-PGAM1 axis is responsible forchondrocyte death during osteoarthritis pathogenesis. Nat. Commun. 2018, 9, 3427. [CrossRef]
31. Kitajima, S.; Takuma, S.; Morimoto, M. Changes in colonic mucosal permeability in mouse colitis inducedwith dextran sulfate sodium. Exp. Anim. 1999, 48, 137–143. [CrossRef] [PubMed]
32. Georgoudaki, A.M.; Prokopec, K.E.; Boura, V.F.; Hellqvist, E.; Sohn, S.; Ostling, J.; Dahan, R.; Harris, R.A.;Rantalainen, M.; Klevebring, D.; et al. Reprogramming Tumor-Associated Macrophages by AntibodyTargeting Inhibits Cancer Progression and Metastasis. Cell Rep. 2016, 15, 2000–2011. [CrossRef] [PubMed]
33. Ishigamori, R.; Komiya, M.; Takasu, S.; Mutoh, M.; Imai, T.; Takahashi, M. Osteopontin Deficiency SuppressesIntestinal Tumor Development in Apc-Deficient Min Mice. Int. J. Mol. Sci. 2017, 18, 1058. [CrossRef][PubMed]

Cancers 2020, 12, 576 16 of 18
34. Ducheix, S.; Peres, C.; Hardfeldt, J.; Frau, C.; Mocciaro, G.; Piccinin, E.; Lobaccaro, J.M.; De Santis, S.;Chieppa, M.; Bertrand-Michel, J.; et al. Deletion of Stearoyl-CoA Desaturase-1 From the Intestinal EpitheliumPromotes Inflammation and Tumorigenesis, Reversed by Dietary Oleate. Gastroenterology 2018, 155, 1524–1538.[CrossRef]
35. Kawaguchi, Y.; Hinoi, T.; Saito, Y.; Adachi, T.; Miguchi, M.; Niitsu, H.; Sasada, T.; Shimomura, M.;Egi, H.; Oka, S.; et al. Mouse model of proximal colon-specific tumorigenesis driven by microsatelliteinstability-induced Cre-mediated inactivation of Apc and activation of Kras. J. Gastroenterol. 2016, 51,447–457. [CrossRef]
36. Gouw, A.M.; Eberlin, L.S.; Margulis, K.; Sullivan, D.K.; Toal, G.G.; Tong, L.; Zare, R.N.; Felsher, D.W.Oncogene KRAS activates fatty acid synthase, resulting in specific ERK and lipid signatures associated withlung adenocarcinoma. Proc. Natl. Acad. Sci. USA 2017, 114, 4300–4305. [CrossRef]
37. Barrera, G.; Pizzimenti, S.; Dianzani, M.U. Lipid peroxidation: control of cell proliferation, cell differentiationand cell death. Mol. Aspects. Med. 2008, 29, 1–8. [CrossRef]
38. Kim, D.; Song, J.; Kang, Y.; Park, S.; Kim, Y.I.; Kwak, S.; Lim, D.; Park, R.; Chun, C.H.; Choe, S.K.; et al. Fis1depletion in osteoarthritis impairs chondrocyte survival and peroxisomal and lysosomal function. J. Mol.Med. (Berl) 2016, 94, 1373–1384. [CrossRef]
39. Kohlwein, S.D.; Veenhuis, M.; van der Klei, I.J. Lipid droplets and peroxisomes: key players in cellular lipidhomeostasis or a matter of fat–store ’em up or burn ’em down. Genetics 2013, 193, 1–50. [CrossRef]
40. Lodhi, I.J.; Semenkovich, C.F. Peroxisomes: a nexus for lipid metabolism and cellular signaling. Cell Metab.2014, 19, 380–392. [CrossRef]
41. Wanders, R.J.; Jansen, G.A.; Lloyd, M.D. Phytanic acid alpha-oxidation, new insights into an old problem: areview. Biochim. Biophys. Acta 2003, 1631, 119–135. [CrossRef]
42. Verhoeven, N.M.; Wanders, R.J.; Schor, D.S.; Jansen, G.A.; Jakobs, C. Phytanic acid alpha-oxidation:decarboxylation of 2-hydroxyphytanoyl-CoA to pristanic acid in human liver. J. Lipid. Res. 1997, 38,2062–2070. [PubMed]
43. Wierzbicki, A.S.; Lloyd, M.D.; Schofield, C.J.; Feher, M.D.; Gibberd, F.B. Refsum’s disease: a peroxisomaldisorder affecting phytanic acid alpha-oxidation. J. Neurochem. 2002, 80, 727–735. [CrossRef] [PubMed]
44. Bessman, M.J.; Frick, D.N.; O’Handley, S.F. The MutT proteins or "Nudix" hydrolases, a family of versatile,widely distributed, "housecleaning" enzymes. J. Biol. Chem. 1996, 271, 25059–25062. [CrossRef]
45. Dunn, C.A.; O’Handley, S.F.; Frick, D.N.; Bessman, M.J. Studies on the ADP-ribose pyrophosphatasesubfamily of the nudix hydrolases and tentative identification of trgB, a gene associated with telluriteresistance. J. Biol. Chem. 1999, 274, 32318–32324. [CrossRef]
46. Cai, L.; Sutter, B.M.; Li, B.; Tu, B.P. Acetyl-CoA induces cell growth and proliferation by promoting theacetylation of histones at growth genes. Mol. Cell 2011, 42, 426–437. [CrossRef]
47. Polakis, P. Wnt signaling and cancer. Genes Dev. 2000, 14, 1837–1851. [CrossRef]48. Polakis, P. Wnt signaling in cancer. Cold Spring Harb. Perspect. Biol. 2012, 4. [CrossRef]49. Dimitriadis, A.; Vincan, E.; Mohammed, I.M.; Roczo, N.; Phillips, W.A.; Baindur-Hudson, S. Expression of
Wnt genes in human colon cancers. Cancer Lett. 2001, 166, 185–191. [CrossRef]50. Holcombe, R.F.; Marsh, J.L.; Waterman, M.L.; Lin, F.; Milovanovic, T.; Truong, T. Expression of Wnt ligands
and Frizzled receptors in colonic mucosa and in colon carcinoma. Mol. Pathol. 2002, 55, 220–226. [CrossRef]51. de Sousa, E.M.; Vermeulen, L.; Richel, D.; Medema, J.P. Targeting Wnt signaling in colon cancer stem cells.
Clin. Cancer Res. 2011, 17, 647–653. [CrossRef] [PubMed]52. Clements, W.M.; Lowy, A.M.; Groden, J. Adenomatous polyposis coli/beta-catenin interaction and
downstream targets: altered gene expression in gastrointestinal tumors. Clin. Colorectal. Cancer 2003,3, 113–120. [CrossRef] [PubMed]
53. Sanchez-Tillo, E.; de Barrios, O.; Siles, L.; Cuatrecasas, M.; Castells, A.; Postigo, A. beta-catenin/TCF4 complexinduces the epithelial-to-mesenchymal transition (EMT)-activator ZEB1 to regulate tumor invasiveness. Proc.Natl. Acad. Sci. USA 2011, 108, 19204–19209. [CrossRef] [PubMed]
54. D’Abaco, G.M.; Whitehead, R.H.; Burgess, A.W. Synergy between Apc min and an activated ras mutation issufficient to induce colon carcinomas. Mol. Cell Biol. 1996, 16, 884–891. [CrossRef] [PubMed]
55. Janssen, K.P.; Alberici, P.; Fsihi, H.; Gaspar, C.; Breukel, C.; Franken, P.; Rosty, C.; Abal, M.; El Marjou, F.;Smits, R.; et al. APC and oncogenic KRAS are synergistic in enhancing Wnt signaling in intestinal tumorformation and progression. Gastroenterology 2006, 131, 1096–1109. [CrossRef] [PubMed]

Cancers 2020, 12, 576 17 of 18
56. Ahn, S.Y.; Yang, J.H.; Kim, N.H.; Lee, K.; Cha, Y.H.; Yun, J.S.; Kang, H.E.; Lee, Y.; Choi, J.; Kim, H.S.;et al. Anti-helminthic niclosamide inhibits Ras-driven oncogenic transformation via activation of GSK-3.Oncotarget 2017, 8, 31856–31863. [CrossRef]
57. Yao, Y.; Sun, S.; Wang, J.; Fei, F.; Dong, Z.; Ke, A.W.; He, R.; Wang, L.; Zhang, L.; Ji, M.B.; et al. Canonical WntSignaling Remodels Lipid Metabolism in Zebrafish Hepatocytes following Ras Oncogenic Insult. Cancer Res.2018, 78, 5548–5560. [CrossRef]
58. Veech, R.L. The therapeutic implications of ketone bodies: the effects of ketone bodies in pathologicalconditions: ketosis, ketogenic diet, redox states, insulin resistance, and mitochondrial metabolism.Prostaglandins Leukot. Essent. Fatty Acids 2004, 70, 309–319. [CrossRef]
59. Koo, S.H. Nonalcoholic fatty liver disease: molecular mechanisms for the hepatic steatosis. Clin. Mol. Hepatol.2013, 19, 210–215. [CrossRef]
60. Cabral, M.; Martin-Venegas, R.; Moreno, J.J. Role of arachidonic acid metabolites on the control ofnon-differentiated intestinal epithelial cell growth. Int. J. Biochem. Cell Biol. 2013, 45, 1620–1628. [CrossRef]
61. Louie, S.M.; Roberts, L.S.; Mulvihill, M.M.; Luo, K.; Nomura, D.K. Cancer cells incorporate and remodelexogenous palmitate into structural and oncogenic signaling lipids. Biochim. Biophys. Acta 2013, 1831,1566–1572. [CrossRef] [PubMed]
62. Niso-Santano, M.; Malik, S.A.; Pietrocola, F.; Bravo-San Pedro, J.M.; Marino, G.; Cianfanelli, V.; Ben-Younes, A.;Troncoso, R.; Markaki, M.; Sica, V.; et al. Unsaturated fatty acids induce non-canonical autophagy. EMBO J.2015, 34, 1025–1041. [CrossRef] [PubMed]
63. Tan, S.H.; Shui, G.; Zhou, J.; Li, J.J.; Bay, B.H.; Wenk, M.R.; Shen, H.M. Induction of autophagy by palmitic acidvia protein kinase C-mediated signaling pathway independent of mTOR (mammalian target of rapamycin).J. Biol. Chem. 2012, 287, 14364–14376. [CrossRef] [PubMed]
64. Fatima, S.; Hu, X.; Huang, C.; Zhang, W.; Cai, J.; Huang, M.; Gong, R.H.; Chen, M.; Ho, A.H.M.; Su, T.; et al.High-fat diet feeding and palmitic acid increase CRC growth in beta2AR-dependent manner. Cell Death Dis2019, 10, 711. [CrossRef]
65. Fujise, T.; Iwakiri, R.; Kakimoto, T.; Shiraishi, R.; Sakata, Y.; Wu, B.; Tsunada, S.; Ootani, A.; Fujimoto, K.Long-term feeding of various fat diets modulates azoxymethane-induced colon carcinogenesis throughWnt/beta-catenin signaling in rats. Am. J. Physiol. Gastrointest. Liver Physiol. 2007, 292, G1150–1156.[CrossRef]
66. Takada, R.; Satomi, Y.; Kurata, T.; Ueno, N.; Norioka, S.; Kondoh, H.; Takao, T.; Takada, S. Monounsaturatedfatty acid modification of Wnt protein: its role in Wnt secretion. Dev. Cell 2006, 11, 791–801. [CrossRef]
67. Tian, H.; Liu, C.; Zou, X.; Wu, W.; Zhang, C.; Yuan, D. MiRNA-194 Regulates Palmitic Acid-Induced Toll-LikeReceptor 4 Inflammatory Responses in THP-1 Cells. Nutrients 2015, 7, 3483–3496. [CrossRef]
68. Wolfson, B.; Lo, P.K.; Yao, Y.; Li, L.; Wang, H.; Zhou, Q. Impact of miR-140 Deficiency on Non-Alcoholic FattyLiver Disease. Mol. Nutr. Food Res. 2018, 62, e1800189. [CrossRef]
69. Yue, Q.; Zhao, C.; Wang, Y.; Zhao, L.; Zhu, Q.; Li, G.; Wu, N.; Jia, D.; Ma, C. Downregulation of growtharrestspecific transcript 5 alleviates palmitic acidinduced myocardial inflammatory injury through themiR26a/HMGB1/NFkappaB axis. Mol. Med. Rep. 2018, 18, 5742–5750. [CrossRef]
70. Binker-Cosen, M.J.; Richards, D.; Oliver, B.; Gaisano, H.Y.; Binker, M.G.; Cosen-Binker, L.I. Palmitic acidincreases invasiveness of pancreatic cancer cells AsPC-1 through TLR4/ROS/NF-kappaB/MMP-9 signalingpathway. Biochem. Biophys. Res. Commun. 2017, 484, 152–158. [CrossRef]
71. De Robertis, M.; Massi, E.; Poeta, M.L.; Carotti, S.; Morini, S.; Cecchetelli, L.; Signori, E.; Fazio, V.M. TheAOM/DSS murine model for the study of colon carcinogenesis: From pathways to diagnosis and therapystudies. J. Carcinog 2011, 10, 9. [CrossRef] [PubMed]
72. Livak, K.J.; Schmittgen, T.D. Analysis of relative gene expression data using real-time quantitative PCR andthe 2(-Delta Delta C(T)) Method. Methods 2001, 25, 402–408. [CrossRef] [PubMed]
73. Mane, D.R.; Kale, A.D.; Belaldavar, C. Validation of immunoexpression of tenascin-C in oral precancerousand cancerous tissues using ImageJ analysis with novel immunohistochemistry profiler plugin: Animmunohistochemical quantitative analysis. J. Oral. Maxillofac. Pathol. 2017, 21, 211–217. [CrossRef][PubMed]

Cancers 2020, 12, 576 18 of 18
74. Varghese, F.; Bukhari, A.B.; Malhotra, R.; De, A. IHC Profiler: an open source plugin for the quantitativeevaluation and automated scoring of immunohistochemistry images of human tissue samples. PLoS One2014, 9, e96801. [CrossRef] [PubMed]
75. Park, S.; Oh, J.; Kim, Y.I.; Choe, S.K.; Chun, C.H.; Jin, E.J. Suppression of ABCD2 dysregulates lipidmetabolism via dysregulation of miR-141:ACSL4 in human osteoarthritis. Cell Biochem. Funct. 2018, 36,366–376. [CrossRef]
© 2020 by the authors. Licensee MDPI, Basel, Switzerland. This article is an open accessarticle distributed under the terms and conditions of the Creative Commons Attribution(CC BY) license (http://creativecommons.org/licenses/by/4.0/).