Embed Size (px)
Citation preview
Nucleation and Growth Kinetics of PbS Quantum Dots in Oxide Glass: Spectroscopic andMicroscopic Studies in the Dilute Range
Swati Joshi,† Sabyasachi Sen,*,† and Patricia C. Ocampo‡
Department of Chemical Engineering and Materials Science, UniVersity of California, DaVis, andUniVersidad Auto´noma Metropolitana, Lab. Microscopı´a Electronica, col. Vicentina, C.P. 09340 Del.Iztapalapa, Me´xico D.F.
ReceiVed: NoVember 13, 2006; In Final Form: January 15, 2007
The kinetics of nucleation and growth of PbS nanocrystals or quantum dots in a boroaluminosilicate hostglass have been studied in the dilute range of the precipitating phase (∼2 wt % PbS) using infrared absorptionspectroscopy and transmission electron microscopy. The temperature dependence of the experimental steady-state nucleation rates have been found to be several orders of magnitude lower than the predictions based onthe classical nucleation theory. The induction times for nucleation at various temperatures are found to bemore than 2 orders of magnitude longer than the shear relaxation time scale of the host glass, although theaverage activation energies are found to be similar in both cases (∼200 kJ/mol). The growth curves at alltemperatures show an extremely sublinear time dependence of particle radiusr ∼ t0.15-0.20 indicating an earlyonset of ripening process which also results in a saturation in the nucleation rate. A strong deviation from thetypical scaling relations ofr ∼ t1/2 or t1/3 has been hypothesized to result from a growth mechanism based oncluster diffusion and attachment.
Introduction
Semiconductor nanocrystals or quantum dots (QDs) havereceived considerable attention in the past few years becauseof their unique optical and electronic properties and greatadvances in the area of synthesis have been observed as well.1-7
QDs of a variety of semiconductors have shown potential forwide ranging applications in the areas of biosensors, light-emitting diodes (LEDs), lasers, and photovoltaic cells.8-12 Thestrong commercial interests have revived fundamental researchin the field with the primary aim of obtaining better controlover the size of the dots and hence their properties. The noveland unique application of QDs are based on the quantumconfinement effect which results in size dependent propertiesthat vary considerably from the properties of the correspondingbulk material. QDs of the IV-VI semiconductors namely PbS,PbSe, and PbTe are excellent candidates for studying the strongquantum confinement limit as they show a much higher degreeof confinement compared to most II-VI and III-V nanocrys-tals.13 Owing to the large electron and hole Bohr radii (∼10-20 nm), the strong confinement regime can easily be accessedfor both the charge carriers.13 Therefore, a potential advantageof studying these systems is the possibility of achieving strongquantum confinement with relatively large particles such thatthe detrimental effects of the surface properties are minimized.Several approaches toward synthesis of IV-VI QDs have beenexplored so far including precipitation from liquid solution,solid-phase precipitation, molecular beam epitaxy (MBE) andmetallorganic vapor-phase epitaxy (MVPE).2,4-7,14While liquid-phase synthesis and MBE can yield fairly narrow size distribu-tions, one of the simplest preparation route still remains solid-phase precipitation of QDs in glassy hosts via thermal treatmentsor ceramming.7,11,15,16 Synthesis of QDs by nucleation and
growth in glasses is particularly attractive as it is an inexpensiveand relatively easy way to form quantum dots with excellentsize control. In addition, the formability of the glassy host allowsfabrication of devices in the bulk, planar and fiber forms.11,17
Glasses are also better alternative to polymers as hosts becauseof their chemical inertness, durability and hermeticity. II-VIQD doped glasses, prepared via this method have long beencommercially used as sharp cutoff color filters.18
However, the fundamental mechanisms of nucleation andgrowth of QDs in glassy hosts are not well understood. Thisinformation is necessary in order to be able to engineer the size-distribution of QDs in glasses for targeted applications. More-over, experimental studies of the kinetics of nucleation andgrowth of crystalline phases in glassy matrix, so far, have largelybeen limited to glass-ceramic systems where a major chemicalcomponent undergoes crystallization during heat treatment.19-22
On the other hand, little is known about the nucleation andcrystallization of minor or trace components in glassy hosts,such as that encountered in the case of non-oxide QDs in oxideglass hosts. In this paper we report the results of an experimentalstudy of the kinetics of nucleation and growth of PbS QDs inan oxide glass. The applicability of the classical theories ofnucleation and growth has been tested against these results.
Experimental Section
Sample Synthesis.A PbS-doped Na-Ca-boroaluminosili-cate host glass of composition (in weight %) 56% SiO2, 6.33%Al2O3, 17.3% B2O3, 9.63% Na2O, 8.71% CaO, and 2% PbSwas prepared by melt quenching method. Reagent-grade Na2-CO3, B2O3, CaCO3, Al2O3, SiO2, and PbS were used as startingmaterials. As PbS is relatively volatile compared to the oxides,it was necessary to add excess PbS to the batch to compensatefor the volatilization losses. The excess amount was optimizedby trial and error to obtain∼2 wt % of PbS dissolved in the
† University of California, Davis.‡ Universidad Auto´noma Metropolitana.
4105J. Phys. Chem. C2007,111,4105-4110
10.1021/jp067519n CCC: $37.00 © 2007 American Chemical SocietyPublished on Web 02/24/2007
final glass which was subsequently confirmed by electron probemicroanalyses of the latter.
The starting materials were mixed together thoroughly andmelted for a period of 2 h in silica crucibles at 1200°C in anelectrically heated furnace. The melt was then poured to formthin slabs, which were subsequently annealed at 500°C. Thestarting glass was found to have a straw-yellow color. Theviscosity of this glass was measured over a temperature rangeof 540 to 718°C using the standard beam bending technique.
Small samples of dimension 1 cm× 1 cm× 2 mm were cutfrom the slab of glass and heat-treated for nucleation and growthof PbS QDs in the glass. Glass samples were nucleated at
temperatures ranging between 550 and 625°C for times rangingfrom 30 min to several days for nucleation studies. Subsequently,each of the nucleated glass samples was subjected to a shortgrowth treatment at 700°C for 10 min, in order to grow thenanocrystals sufficiently large (∼ 6 nm) for experimentalobservation. Samples for the growth-kinetics studies weretypically nucleated at 575°C for 6 h and QDs were grown attemperatures between 625 and 700°C for various lengths oftime ranging from a few minutes to several hours. Glass sampleswith colors ranging from dark yellow to dark brown wereobtained depending on the temperature and time scale chosenfor the nucleation and growth heat treatments.
Optical Absorption Spectroscopy.The heat-treated 2-mm-thick QD-containing glass samples were polished and optical-absorption spectra of these samples were collected in thetransmission mode using a Bruker Vertex 70 Fourier-TransformInfrared (FT-IR) spectrometer in the near-IR range (900-2000nm). Correlations between the diameter of QDs and the energiesof transition between various electron and hole energy levelsare well-known for PbS and PbSe from recent studies ofelectronic band structure calculations.23 These correlations wereused to determine the average size of the PbS QDs in the glasssamples, directly, from the energy of the absorption peak ofthe 1s-1s electron-hole transition in the near-IR range. Inaddition, the area under the 1s-1s absorption peak, over asmoothly varying local background, was used to obtain a relativemeasure of the number density of the PbS nuclei in these glasses.It may be noted in this regard that the optical oscillator strengthand therefore the absorption intensity in the nanosized limit isexpected to be dependent on the size of the QDs. However, thesize of the PbS QDs in the samples studied here varies over anarrow range (between∼ 6 and 8 nm, vide infra). Thereforethe size effect on the absorption intensity has been assumed tobe insignificant in these samples.
Transmission Electron Microscopy.Select samples of PbS-QD containing glasses were studied with transmission electronmicroscopy (TEM) to obtain the absolute number-density ofthe QDs and their size distribution statistics. TEM samples wereprepared by ion milling. A Carl Zeiss EM910 microscope wasused for bright field (BF) imaging at an operating voltage of80 keV. Approximately three to five BF images were taken fromdifferent areas of the same sample. The absolute number-
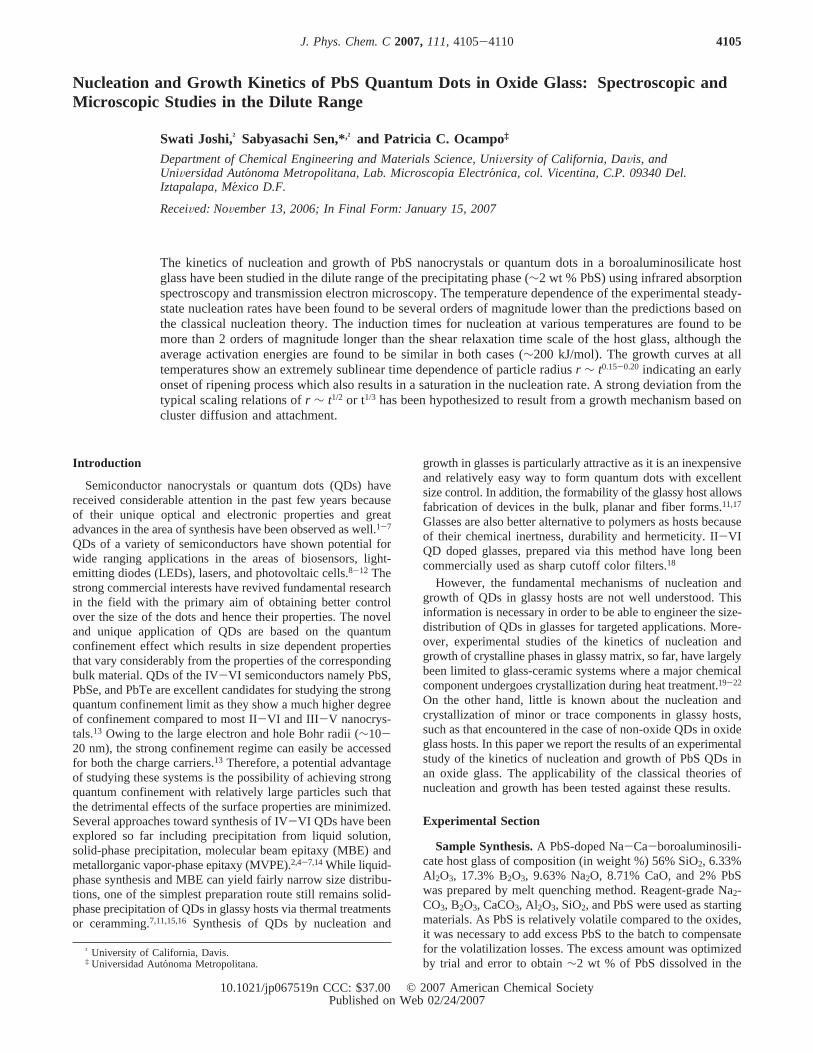
Figure 1. Typical optical absorption spectra of glasses containing PbSQDs nucleated at 550°C for 96 h and grown at 675°C for 0.75, 1.33,1.75, 2.25, and 4.5 h (from bottom to top). The arrows indicate theposition of the absorption peak in each spectrum corresponding to the1s-1s electron-hole transition. The corresponding diameters of theQDs are shown alongside each arrow. The sharp, closely spaced set ofpeaks at∼1400 nm, which is common to all spectra, are vibrationalovertones of O-H stretching in hydroxyl groups present on the surfaceand in the bulk of the glass.
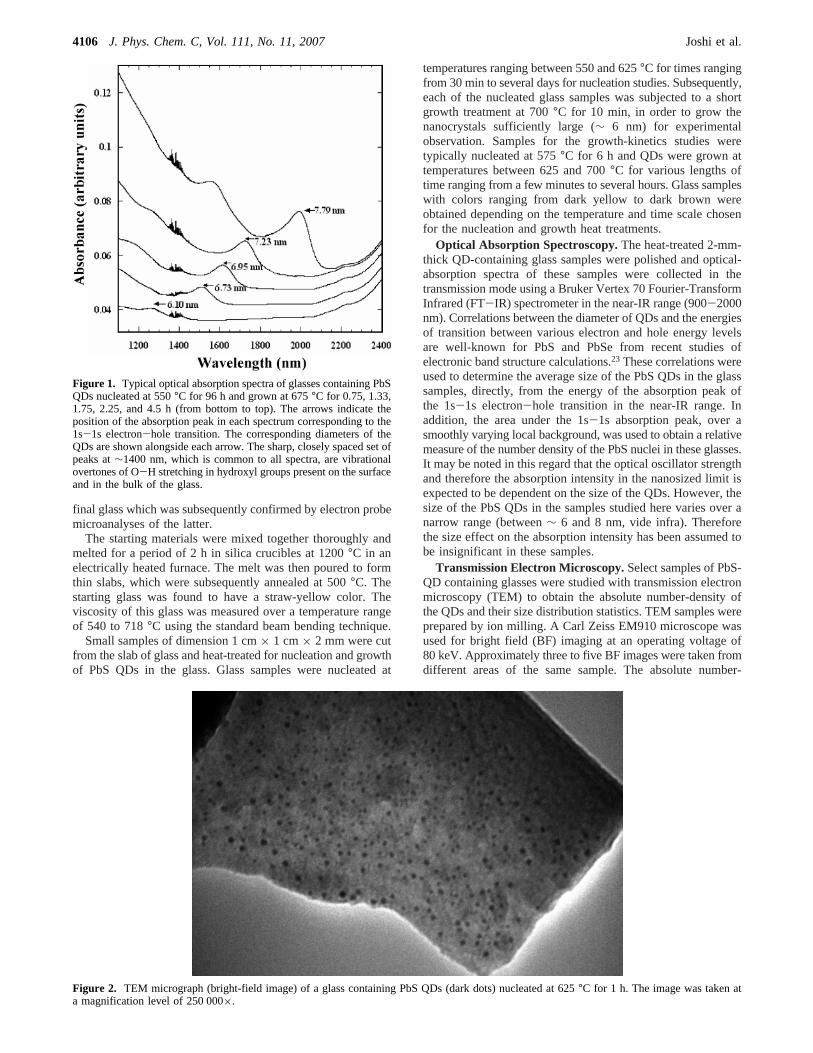
Figure 2. TEM micrograph (bright-field image) of a glass containing PbS QDs (dark dots) nucleated at 625°C for 1 h. The image was taken ata magnification level of 250 000×.
4106 J. Phys. Chem. C, Vol. 111, No. 11, 2007 Joshi et al.
densities of the QDs were obtained directly from these BFimages and were averaged for each sample. These absolutenumber-densities were then used to convert the relative number-densities of QDs in other samples, measured by opticalabsorption spectroscopy, into absolute ones.
Results
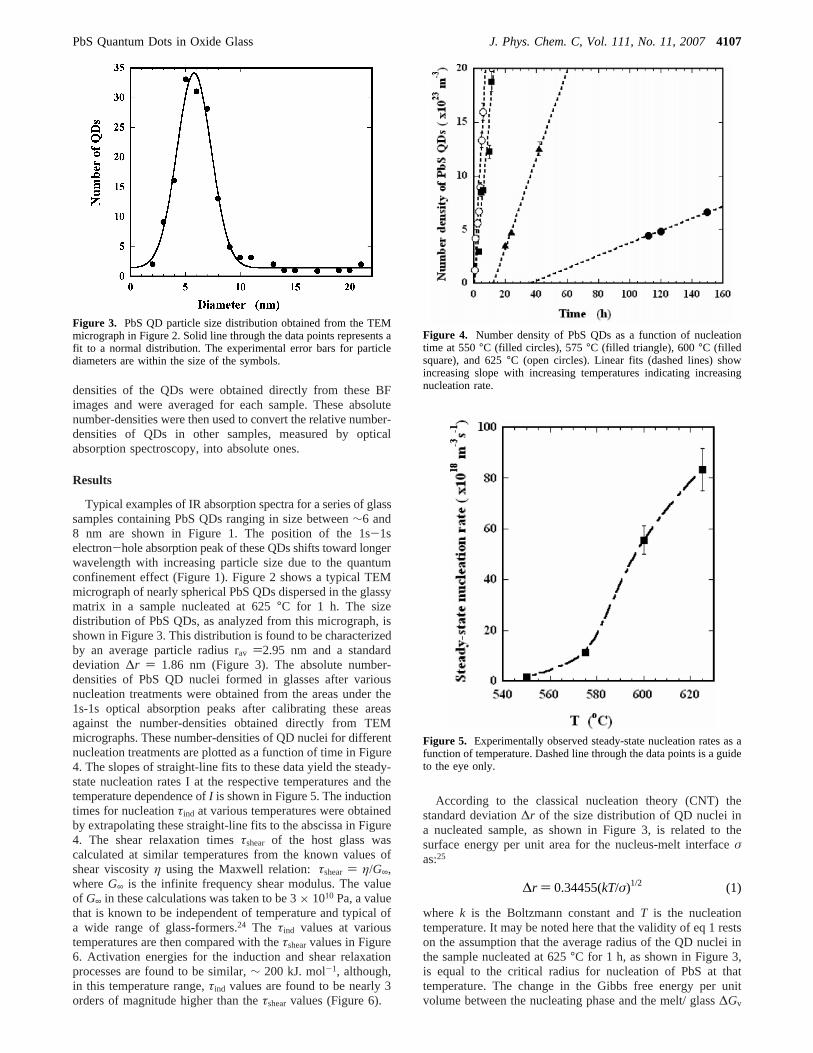
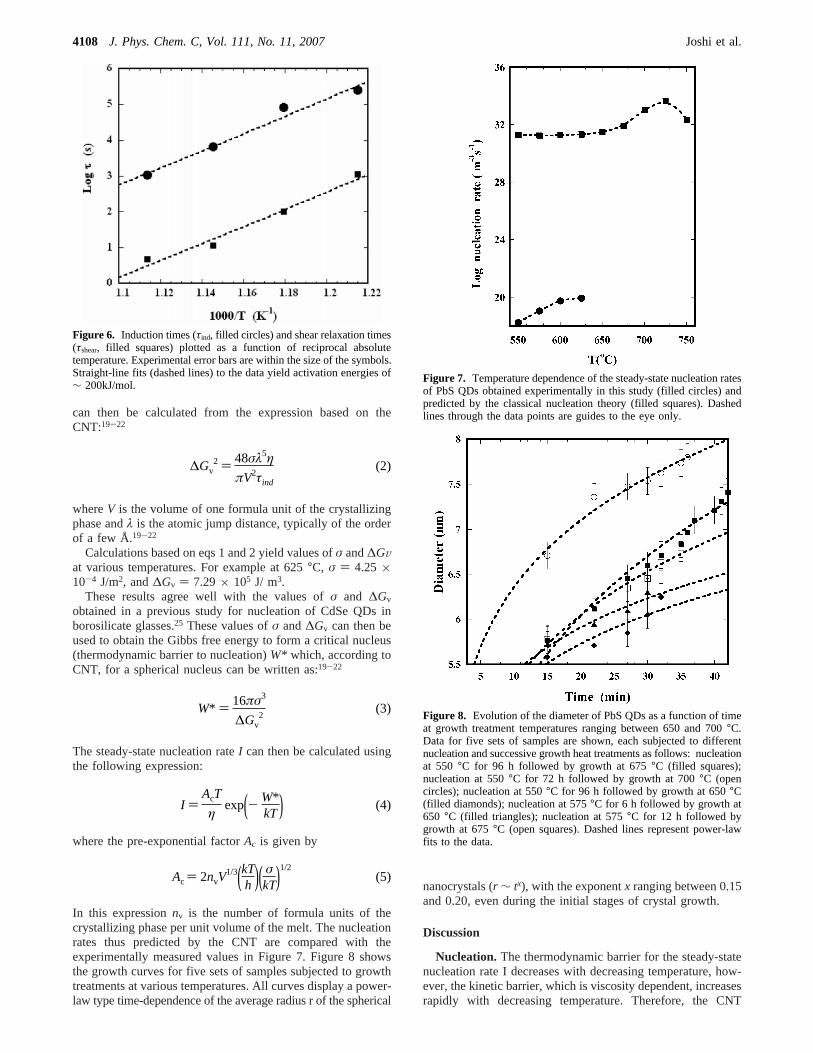
Typical examples of IR absorption spectra for a series of glasssamples containing PbS QDs ranging in size between∼6 and8 nm are shown in Figure 1. The position of the 1s-1selectron-hole absorption peak of these QDs shifts toward longerwavelength with increasing particle size due to the quantumconfinement effect (Figure 1). Figure 2 shows a typical TEMmicrograph of nearly spherical PbS QDs dispersed in the glassymatrix in a sample nucleated at 625°C for 1 h. The sizedistribution of PbS QDs, as analyzed from this micrograph, isshown in Figure 3. This distribution is found to be characterizedby an average particle radius rav )2.95 nm and a standarddeviation ∆r ) 1.86 nm (Figure 3). The absolute number-densities of PbS QD nuclei formed in glasses after variousnucleation treatments were obtained from the areas under the1s-1s optical absorption peaks after calibrating these areasagainst the number-densities obtained directly from TEMmicrographs. These number-densities of QD nuclei for differentnucleation treatments are plotted as a function of time in Figure4. The slopes of straight-line fits to these data yield the steady-state nucleation rates I at the respective temperatures and thetemperature dependence ofI is shown in Figure 5. The inductiontimes for nucleationτind at various temperatures were obtainedby extrapolating these straight-line fits to the abscissa in Figure4. The shear relaxation timesτshear of the host glass wascalculated at similar temperatures from the known values ofshear viscosityη using the Maxwell relation:τshear ) η/G∞,whereG∞ is the infinite frequency shear modulus. The valueof G∞ in these calculations was taken to be 3× 10¹⁰ Pa, a valuethat is known to be independent of temperature and typical ofa wide range of glass-formers.24 The τind values at varioustemperatures are then compared with theτshearvalues in Figure6. Activation energies for the induction and shear relaxationprocesses are found to be similar,∼ 200 kJ. mol-1, although,in this temperature range,τind values are found to be nearly 3orders of magnitude higher than theτshearvalues (Figure 6).
According to the classical nucleation theory (CNT) thestandard deviation∆r of the size distribution of QD nuclei ina nucleated sample, as shown in Figure 3, is related to thesurface energy per unit area for the nucleus-melt interfaceσas:25
where k is the Boltzmann constant andT is the nucleationtemperature. It may be noted here that the validity of eq 1 restson the assumption that the average radius of the QD nuclei inthe sample nucleated at 625°C for 1 h, as shown in Figure 3,is equal to the critical radius for nucleation of PbS at thattemperature. The change in the Gibbs free energy per unitvolume between the nucleating phase and the melt/ glass∆Gv
Figure 3. PbS QD particle size distribution obtained from the TEMmicrograph in Figure 2. Solid line through the data points represents afit to a normal distribution. The experimental error bars for particlediameters are within the size of the symbols.
Figure 4. Number density of PbS QDs as a function of nucleationtime at 550°C (filled circles), 575°C (filled triangle), 600°C (filledsquare), and 625°C (open circles). Linear fits (dashed lines) showincreasing slope with increasing temperatures indicating increasingnucleation rate.
Figure 5. Experimentally observed steady-state nucleation rates as afunction of temperature. Dashed line through the data points is a guideto the eye only.
∆r ) 0.34455(kT/σ)1/2 (1)
PbS Quantum Dots in Oxide Glass J. Phys. Chem. C, Vol. 111, No. 11, 20074107
can then be calculated from the expression based on theCNT:19-22
whereV is the volume of one formula unit of the crystallizingphase andλ is the atomic jump distance, typically of the orderof a few Å.19-22
Calculations based on eqs 1 and 2 yield values ofσ and∆GVat various temperatures. For example at 625°C, σ ) 4.25 ×10⁻⁴ J/m2, and∆Gv ) 7.29× 10⁵ J/ m3.
These results agree well with the values ofσ and ∆Gv
obtained in a previous study for nucleation of CdSe QDs inborosilicate glasses.25 These values ofσ and∆Gv can then beused to obtain the Gibbs free energy to form a critical nucleus(thermodynamic barrier to nucleation)W* which, according toCNT, for a spherical nucleus can be written as:19-22
The steady-state nucleation rateI can then be calculated usingthe following expression:
where the pre-exponential factorAc is given by
In this expressionnv is the number of formula units of thecrystallizing phase per unit volume of the melt. The nucleationrates thus predicted by the CNT are compared with theexperimentally measured values in Figure 7. Figure 8 showsthe growth curves for five sets of samples subjected to growthtreatments at various temperatures. All curves display a power-law type time-dependence of the average radius r of the spherical
nanocrystals (r ∼ tx), with the exponentx ranging between 0.15and 0.20, even during the initial stages of crystal growth.
Discussion
Nucleation. The thermodynamic barrier for the steady-statenucleation rate I decreases with decreasing temperature, how-ever, the kinetic barrier, which is viscosity dependent, increasesrapidly with decreasing temperature. Therefore, the CNT
Figure 6. Induction times (τind, filled circles) and shear relaxation times(τshear, filled squares) plotted as a function of reciprocal absolutetemperature. Experimental error bars are within the size of the symbols.Straight-line fits (dashed lines) to the data yield activation energies of∼ 200kJ/mol.
∆Gv2 ) 48σλ5η
πV2τind
(2)
W* ) 16πσ3
∆Gv2
(3)
I )AcT
ηexp(- W*
kT) (4)
Ac ) 2nvV1/3(kT
h )( σkT)1/2
(5)
Figure 7. Temperature dependence of the steady-state nucleation ratesof PbS QDs obtained experimentally in this study (filled circles) andpredicted by the classical nucleation theory (filled squares). Dashedlines through the data points are guides to the eye only.
Figure 8. Evolution of the diameter of PbS QDs as a function of timeat growth treatment temperatures ranging between 650 and 700°C.Data for five sets of samples are shown, each subjected to differentnucleation and successive growth heat treatments as follows: nucleationat 550 °C for 96 h followed by growth at 675°C (filled squares);nucleation at 550°C for 72 h followed by growth at 700°C (opencircles); nucleation at 550°C for 96 h followed by growth at 650°C(filled diamonds); nucleation at 575°C for 6 h followed by growth at650 °C (filled triangles); nucleation at 575°C for 12 h followed bygrowth at 675°C (open squares). Dashed lines represent power-lawfits to the data.
4108 J. Phys. Chem. C, Vol. 111, No. 11, 2007 Joshi et al.
predicts a maximum in the temperature-dependence of thesteady-state nucleation rate, which is evident in Figure 7. Theexperimentally obtained I values show an increasing trend withincreasing temperature up to 625°C. A maximum in I (T) couldnot be observed due to interference with crystal growth attemperatures beyond 625°C (Figure 5). These steady-statenucleation rates are several orders of magnitude higher thanthose typical of homogeneous nucleation of oxide crystal phasesin oxide glasses.19-22 Such high nucleation rates for PbS QDsis consistent with the low interfacial energy for the PbS-oxideglass interface (∼4 × 10⁻⁴ J/m2), which is orders of magnitudesmaller than the energies characteristic of oxide crystal-glassinterfaces (∼2 × 10⁻¹ J/m2).19-22 Clearly an understanding ofthe compositional dependence of surface energies is critical indesigning host glass compositions that would give rise to largenucleation rates for QDs as well as highly stable QD-glassinterfaces. It is also interesting to note that the experimentalnucleation rates for PbS QDs are several orders of magnitudelower than those predicted by CNT (Figure 7). This observationis in contrast with the case of nucleation of oxide crystal phasesin oxide glasses and liquids where previous studies have shownthat the experimental rates are several orders of magnitudehigher than the rates predicted by the CNT.19-22 The sourcesof such large discrepancy between experiment and theory arenot well understood to date. However, consideration of a diffuseand/or rough crystal nucleus-glass interface instead of theoriginal assumption of a sharp and smooth interface has beenshown to be effective in accounting for the discrepancy.22,26
Another interesting observation that can be made from Figure7 is that the temperatureTmax corresponding to the maximumin I(T) as predicted by the CNT is located at∼ 725°C whereasthe experimentalI(T) curve displays a plateau at∼ 625 °C.This saturation in the experimentalI(T) at ∼100 °C below theTmax predicted by the CNT is likely to be due to an early onsetof the ripening process (vide infra) owing to the small initialconcentration of the nucleating PbS phase in the system. Asdiscussed below, the experimental results of the growth kineticsof the PbS QDs further corroborate with this hypothesis.
Growth. The growth curves for the PbS QDs display anr(t)∼ t0.15-0.20dependence at early stages of crystal growth (Figure8). Crystal growth in the initial stages from glass/melt isexpected to be a diffusion-controlled process where the radiusof the spherical particles is expected to scale with timet asr(t)∼ t1/2. The Ostwald ripening follows this stage at longer timeswhere the larger particles can only continue to grow at theexpense of the smaller particles that start to redissolve backinto the melt. During the Ostwald ripening stage the particlegrowth assumes at1/3 time-dependencer(t) ∼ t1/3 according tothe classical Lifshitz-Slyozov-Wagner (LSW) theory.27,28
Therefore, the strongly sub-linear time dependence observedhere indicates an onset of ripening during very early stages ofthe growth of PbS QDs, although the growth exponent issignificantly smaller than that (∼0.33) characteristic of theOstwald ripening process. A quick onset of ripening is consistentwith the low initial concentration of the crystallizing component(∼2 wt % PbS), which implies that the Pb and S required forparticle growth are depleted from the glass/melt during veryearly stages of growth thus, forcing the system into the ripeningregime.
Growth exponents smaller than 1/2 and 1/3 have beenreported in literature for systems in which particles grow as aresult of diffusion and attachment of clusters of atoms insteadof single atoms.29,30 In such systems phenomenologically thediffusion coefficient of these atomic clustersDs is considered
to be dependent on the size of the clusters and Ds ) D1s-γ
where D1 is the diffusion coefficient for a monomer (s ) 1).Therefore, during ripening stage, the larger sized clusters diffuseslowly and hence grow primarily by consuming smaller clustersin their vicinity. This mechanism differs from the traditionalLSW theory as the latter inherently assumes single particle oratom-by-atom diffusion and attachment for crystal growth.29,30
Simulations based on the cluster diffusion and attachment modelhave reported growth exponents as low as 0.20, i.e., values thatare significantly close to the growth exponents observed in thisstudy. Therefore, cluster diffusion and attachment appears tobe the controlling mechanism for the growth of the PbS QDsin the oxide host glass/melt. This hypothesis is consistent withthe fact that at a typical growth temperature of∼700 °C theviscosity of the boroaluminosilicate host glass/melt is∼108 Pa.s.Such low viscosities may indeed allow for transport andattachment of multi-atom clusters in the melt, which, asdiscussed above, would control the ripening of the PbS QDs.
Finally, the strong similarity in the activation energies forthe shear-relaxation and nucleation induction processes indicatethat viscous flow is the fundamental time controlling step forthe atomic transport necessary for nucleation of the PbS QDs(Figure 6). This result is consistent with the Kaschiev’s transienttime formalism of homogeneous nucleation, which suggestsclose similarity between the diffusion processes involved innucleation and viscous flow.31 However, it should be noted thatthe induction times for nucleation are nearly 3 orders ofmagnitude longer than the shear-relaxation times (Figure 6).This result implies that although diffusion and viscous flowcontrol the fundamental step for atomic transport, the nucleationprocess involves additional structural rearrangements over lengthand time scales longer than those involved in the shear relaxationof the melt. Similar observations ofτind . τshearhave also beenmade in a number of previous studies of nucleation in a widevariety of silicate glass-ceramic systems.22
Summary
The kinetics of nucleation and growth of PbS QDs have beeninvestigated in an oxide glass host doped with∼2 wt % PbS.The steady-state nucleation rates obtained from CNT predictionsare found to be several orders of magnitude higher than theexperimentally obtained values. The induction timescales ofnucleation shows the same activation energy as the shear-relaxation process. However, the significantly longer inductiontimescales indicate that even though the fundamental rate-controlling step of the atomic transport process required fornucleation is similar to that of viscous flow, additional structuralrearrangements occur in the glass prior to the onset of nucleation.The growth of the PbS QDs show a t0.15-0.16 dependence of theparticle radius indicating an early onset of the ripening processwhich may be a hallmark of the crystallization and growthkinetics of minor or trace components in glasses and liquids.In addition such a form of the growth law is attributed to agrowth process controlled by size-dependent cluster diffusionand attachment.
Acknowledgment. This work was supported by the NationalScience Foundation under Grant No. DMR-0603933.
References and Notes
(1) Banyai, L.; Koch, S.Semiconductor Quantum Dots; WorldScientific: Singapore, 1993.
(2) Burda, C.; Chen, X.; Narayanan, R.; El-Sayed, M. A.Chem. ReV.2005, 105, 1025.
PbS Quantum Dots in Oxide Glass J. Phys. Chem. C, Vol. 111, No. 11, 20074109
(3) Masumoto, Y.; Masumoto, Y.; Takagahara, T.SemiconductorQuantum Dots; Springer: New York, 2006.
(4) Murray, C. B.; Norris, D. J.; Bawendi, M. G.J. Am. Chem. Soc.1993, 115, 8706.
(5) Arakawa, Y.; Yariv, A.IEEE Quant. J. Electron.1986, QE-22,1887.
(6) Martucci, A.; Fick, J.; LeBlanc, S. M.; LoCascio, M.; Hache, A.J.Non-Cryst. Solids2004, 345 346, 639.
(7) Borrelli, N. F.; Smith, D. W.J. Non-Cryst. Solids,1994, 80, 25.(8) Murphy, C. J.; Coffer, J. L.Applied Spectroscopy2002, 16A, 56.(9) Klimov, V. I.; Mikhailovsky, A. A.; Su, Xu; Malko, A.; Holling-
sworth, J. A.; Leatherdale, C. A.; Eisler, H. J.; Bawendi, M. G.Science2000, 290, 314.
(10) Michalet, X.; Pinaud, F.; Lacoste, T. D.; Dahan, M.; Bruchez, M.P.; Alivisatos, A. P.; Weiss, S.Single Mol.2001, 4, 261.
(11) Auxier, J. M.; Morrell, M. M.; West, B. R.; Honkanen, S.;Schulzgen, A.; Peyghambarian, N.; Sen, S.; Borrelli, N. F.Appl. Phys. Lett.2004, 85, 6098.
(12) Schaller, R. D.; Klimov, V. I.Phys. ReV. Lett. 2004, 92, 186601.(13) Wise, F. W.Acc. Chem. Res.2000, 33, 773.(14) Petruska, M. A.; Malko, A. V.; Voyles, P. M.; Klimov, V. I.AdV.
Mater. 2003, 15, 610.(15) Barbosa, L. C.; Reynoso, V. C. S.; de Paula, A. M.; de Oliveira,
C. R. M.; Alves, O. L.; Craievich, A. F.; Marotti, R. E.; Brito Cruz, C. H.;Cesar, C. L.Journal of Non-Crystalline Solids1997, 219, 205.
(16) Lipovskii, A. et al.Appl. Phys. Lett.1997, 71, 3406.(17) Auxier, J. M.; Honkanen, S.; Schu¨lzgen, A.; Morrell, M. M.; Leigh,
M.; Sen, S.; Borrelli, N. F.; Peyghambarian, N.J. Opt. Soc. Am. B.2006,23, 1037.
(18) Remillard, J. T.; Wang, H.; Webb, M. D.; Steel, D. G.IEEE J.Quantum Electron.1989, 25, 408.
(19) Weinberg, M. C.; Zanotto, E. D.J. Non-Cryst. Solids1989, 108,99.
(20) James, P. F.J. Non-Cryst. Solids1985, 73, 517.(21) Zanotto, E. D.; James, P. F.J. Non-Cryst. Solids1985, 74, 373.(22) Sen, S.; Mukerji, T.J. Non-Cryst. Solids1999, 246, 229.(23) Kang, I.; Wise, F. W.J. Opt. Soc. Am. B1997, 14, 1632.(24) Farnan, I.; Stebbins, J. F.Science1994, 265, 1206.(25) Liu, L. C.; Risbud, S. H.J. Appl. Phys.1990, 68, 28.(26) Granasy, L. Thermochim. Acta. 1996, 280-281, 83.(27) Marqusee, J. A.; Ross, J.J. Chem. Phys.1983, 79, 373.(28) Lifshitz, E. M.; Slyozov, V. V.;J. Phys. Chem. Solids1961, 19,
35.(29) Jensen, P.; Barabasi, A. L.; Arralde, H. L.; Havlin, S.; Stanley, H.
E. Phys. ReV. B. 1994, 50, 15316.(30) Moldovan, D.; Yamakov, V.; Wolf, D.; Phillpot, S. R.,Phys. ReV.
Lett. 2002, 89, 206101.(31) Kaschiev, D.Surf. Sci.1969, 14, 209.
4110 J. Phys. Chem. C, Vol. 111, No. 11, 2007 Joshi et al.


![Temperature‐dependent Nucleation and Growth of Dendrite‐Free … · nucleation, chronoamperometry has been used to model heterogeneous nucleation behavior.[10] Therefore, we further](https://img.pdfslide.us/doc/110x75/5ecedb8e0e2bd5210370ca09/temperatureadependent-nucleation-and-growth-of-dendriteafree-nucleation-chronoamperometry.jpg)