Embed Size (px)
Citation preview
Nucleation studies in the Martian atmosphere
A. Maattanen, H. Vehkamaki, and A. LauriDivision of Atmospheric Sciences, Department of Physical Sciences, University of Helsinki, Helsinki, Finland
S. MerikallioSpace Research, Finnish Meteorological Institute, Helsinki, Finland
J. Kauhanen, H. Savijarvi, and M. KulmalaDivision of Atmospheric Sciences, Department of Physical Sciences, University of Helsinki, Helsinki, Finland
Received 15 June 2004; revised 18 November 2004; accepted 1 December 2004; published 5 February 2005.
[1] We developed models for unary nucleation of water and carbon dioxide in the Martianatmosphere. Both homogeneous and heterogeneous nucleation on dust particles werestudied. Our models are based on classical theory. We compare results of differentadsorption approaches. Heterogeneous nucleation on the abundant dust particles seems tobe the primary mechanism of both H2O and CO2 cloud formation in the Martianatmosphere. Heterogeneous nucleation is obtained at a saturation ratio of about 1.18 forH2O and 1.32 for CO2. Homogeneous nucleation is not likely to occur since it wouldrequire high supersaturations. We use our models to study nucleation as a function ofheight at different locations on Mars where ice fog or clouds have been observed. H2O icenucleation results are in good agreement with surface fog observations and previous modelstudies. CO2 ice nucleation simulations in the polar hood cloud areas suggest that negativetemperature perturbations caused by, e.g., adiabatic cooling in orographic waves or inconvective plumes are required for the formation of CO2 clouds.
Citation: Maattanen, A., H. Vehkamaki, A. Lauri, S. Merikallio, J. Kauhanen, H. Savijarvi, and M. Kulmala (2005), Nucleation
studies in the Martian atmosphere, J. Geophys. Res., 110, E02002, doi:10.1029/2004JE002308.
1. Introduction
[2] The Martian atmosphere is thin, cold, and dry butpresents similar meteorological phenomena as the atmo-sphere on Earth. The planet also exhibits similar seasons(though longer) and diurnal variations (though stronger) asthose found on Earth. Dust is abundant on Mars and one ofthe most visible phenomena are the global dust storms thatquasi-regularly cover the entire planet with a red veil.Clouds formed by both carbon dioxide and water icecrystals have been observed in the Martian atmosphere bysatellite as well as by telescope. Clouds and dust areconnected via the capability of dust particles to functionas cloud condensation nuclei.[3] The aim of this study was to find a consistent way of
analyzing cloud particle formation under Martian condi-tions. We worked on the first step of cloud formation,nucleation, and used classical nucleation theory, whichhas been examined theoretically by, for instance, Lazaridiset al. [1991] and Kulmala et al. [2001]. Several theoreticalstudies on the formation of clouds on Mars have previouslybeen conducted [Michelangeli et al., 1993; Colaprete et al.,1999; Wood, 1999; Inada, 2002]. Our models include thetwo major nucleating substances, H2O and CO2, and wehave also taken into account the nonisothermal effects that
become important when the gas involved is a major con-stituent of the atmosphere. We used temperature and mois-ture profiles acquired from the Mars Climate Database(MCD) [Lewis et al., 1999] and the one-dimensional (1-D)model of Savijarvi [1999] and Savijarvi et al. [2004] in anattempt to model nucleation in locations where surface fogor cloud formation have been observed, as in the MarsPathfinder landing area [Schofield et al., 1997] and theMemnonia region [Briggs et al., 1977]. The Mars Path-finder entry profile was used as by Colaprete et al.[1999] to investigate cloud formation. Polar hood cloudareas were also investigated using atmospheric profilesobtained from the MCD. Results were compared withobservations and other model studies.
2. Theory and Model Descriptions
2.1. Homogeneous Nucleation Theory
[4] Stable clusters (large enough for their growth to bethermodynamically favored) of molecules form directlyfrom the vapor phase with homogeneous nucleation. Thefree energy of formation of a spherical cluster with radius ris given by the Gibbs-Thompson equation
DFhom ¼ � 4pr3
3vikT ln S þ 4pr2s; ð1Þ
where vi = mm/ri is the molecular volume in the condensedphase, mm the mass of a molecule, ri the density of the
JOURNAL OF GEOPHYSICAL RESEARCH, VOL. 110, E02002, doi:10.1029/2004JE002308, 2005
Copyright 2005 by the American Geophysical Union.0148-0227/05/2004JE002308$09.00
E02002 1 of 12
condensed phase, T the temperature, k the Boltzmannconstant, s the surface tension, and S the saturation ratio. Adetailed description of the theory is given by Volmer [1939],Fletcher [1958], Keesee [1989], and Pruppacher and Klett[1997]. The critical free energy of formation
DFhom* ¼ 16pv2i s3
3 kT ln Sð Þ2ð2Þ
and the radius of the critical cluster
r* ¼ 2viskT ln S
ð3Þ
are obtained from the zero-point of the derivative of theGibbs-Thompson equation (equation (1)).[5] The classical homogeneous nucleation rate (as new
particles per unit volume and unit time) is given by
Jhom ¼ fdTZhombhom* c1;v exp�DFhom*
kT
� �
¼ fdTDFhom*
3pkTn�2
� �1=2
4pr*2ffiffiffiffiffiffiffiffiffiffiffiffikT
2pmm
s !c21;v exp
�DFhom*
kT
� �;
ð4Þ
which describes the collision rate of vapor molecules withnuclei of critical size. The term in the first brackets is theZeldovich factor Zhom = DF�
hom
3pkTn�2
� �1=2
, where n* is the number ofmolecules in the critical cluster. The Zeldovich factoraccounts for the difference between critical cluster con-centration in the nucleating vapor and equilibrium vaporand break-up of critical clusters. fdT is the nonisothermalcoefficient which will be described in section 2.4. c1,v is thevapor concentration (number of monomers in the vaporphase). bhom* = c1,v4pr*
2ffiffiffiffiffiffiffiffiffikT
2pmm
qis the rate at which monomers
collide with a critical cluster.
2.2. Heterogeneous Nucleation Theory Usedin the Models
[6] Heterogeneous nucleation describes the nucleation ofcritical clusters on a substrate, which on Mars is theubiquitous and abundant airborne mineral dust. When aspecies nucleates on a substrate, the surface energy permolecule is reduced, thus enabling an equilibrium clusterwith a certain amount of molecules to have a larger radius ofcurvature. The nucleating vapor forms a cap that makescontact with the underlying surface at an angle q, which canbe determined from mechanical equilibrium in terms ofinterfacial energies
m ¼ cos q ¼sCN=v � sCN=i
si=v; ð5Þ
where si/j is the interfacial tension between phases i and j,CN the condensation nucleus, v the vapor, and i the ice. Fora given contact parameter m, the free energy of formation ofa critical cluster on a spherical substrate is reduced from the
homogeneous case (equation (2)) by a factor f [Fletcher,1958]:
2f ¼ 1þ 1� Xm
g
� �3
þ X 3 2� 3X � m
g
� �þ X � m
g
� �3" #
þ 3X 2mX � m
g� 1
� �; ð6Þ
where g = (1 + X2 � 2Xm)1/2 and X = rCN/r*, the latter beinga size parameter giving the ratio of the radius of the CN(rCN) to the radius of the critical cluster. For heterogeneousnucleation, there are several ways that the nucleation ratecan be calculated. In the next sections, two cases will bereviewed.2.2.1. Heterogeneous Nucleation by Surface Diffusion[7] The surface diffusion approach for heterogeneous
nucleation describes nucleation as a process where gasmolecules (pressure pv = c1,vkT) collide with the CN andadhere to it. Diffusion on the surface then causes themonomers to form clusters of different sizes which maygrow to the critical size. The surface concentration of themonomers, c1,s, is described at steady-state calculated fromthe incoming and outgoing molecule fluxes [Pruppacherand Klett, 1997]
c1;s ¼pv
2pmmkTð Þ1=2nexp DFdes=kT½ �; ð7Þ
where n is the vibrational frequency of the molecule on thesurface and DFdes the energy for surface desorption. Theheterogeneous nucleation rate (per CN surface area persecond, units m�2 s�1) can be expressed in the followingform [Keesee, 1989]:
Jhet ¼ fdTZhetbhetc1;s exp�DFhet*
kT
� �
¼ fdT1ffiffiffif
p Zhom2pdnr* sin qc21;s exp�DFsd � f DFhom*
kT
� �
¼ fdTZhomkTdr* sin qffiffiffi
fp
nmm
c21;v exp2DFdes � DFsd � f DFhom*
kT
� �;
ð8Þ
where DFsd is the energy for surface diffusion and d themean jump distance of a molecule. The term bhet is theproduct of the number of adsorbed water molecules inposition to join the germ (2pr*sinqdc1,s) and the frequencyn exp �DFsd
kT
� �with which the adsorbed molecule will jump
to join the germ.[8] Zhom, the Zeldovich factor, is exactly the same as in
the case of homogeneous nucleation. This formulationassumes that the number of molecules in the heterogeneouscritical cluster (nhet* ) is obtained from that in the homoge-neous cluster (nhom* ) by multiplying with the factor f(equation (6)) to relate the free energies of the clusters,resulting in the 1/
ffiffiffif
pin the formula of Jhet (equation (8)).
This assumption is only true for nucleation occurring on aplanar substrate. In the following, we derive a coefficientthat should be used for calculating nhet* from nhom* whennucleation takes place on a curved surface. Fletcher [1958]derived the volume of the embryo formed on a curved
E02002 MAATTANEN ET AL.: NUCLEATION ON MARS
2 of 12
E02002
surface in the heterogeneous case (Fletcher’s equation (4))which, using relations (5)–(9) of Fletcher [1958], can bewritten in the form
Vhet* ¼ 1
3pr3 2þ 3
1� Xm
g
� �� 1� Xm
g
� �3
�X 3
2� 3X � m
g
� �þ X � m
g
� �3 !!
; ð9Þ
where g, X, and m are as in equation (6). Thus we can derivea coefficient f
n* = (nhet* /nhom* ) = (Vhet* /Vhom* ) to be used forcalculating n* for heterogeneous nucleation on a curvedsurface. With Vhom* = (4/3)pr*3, we get
fn* ¼ 1
4
2þ 3
1� Xm
g
� �� 1� Xm
g
� �3
� X 3 2� 3X � m
g
� �þ X � m
g
� �3 !!
: ð10Þ
Now the Zeldovich factor Zhet for heterogeneous nucleationcan be described with the help of Zhom for the homogeneouscase as
Zhet ¼f DFhom*
3pkT fn*nhom* �2
!1=2
¼ffiffiffif
p
fn*
DFhom*
3pkTnhom*2
� �1=2
¼ffiffiffif
p
fn*
Zhom:
ð11Þ
With this definition, we get the heterogeneous nucleationrate
Jhet ¼ fdTZhetkTdr* sin q
nmm
c21;v exp2DFdes � DFsd � f DFhom*
kT
� �;
ð12Þ
where Zhet is the new formulation (equation (11)), includingboth f and f
n*, and f also appears in the exponential term asin equation (8).[9] In the cases we studied with a monodisperse 1 mm CN
distribution, the difference between formulae (8) and (12)(i.e., the difference between 1=
ffiffiffif
pand
ffiffiffif
p=f
n*) is notnumerically significant. In the following simulations, weuse the curved surface formulation, which is important toinclude in heterogeneous nucleation models, especiallyconsidering a small CN with a strong surface curvature.2.2.2. Heterogeneous Nucleation by DirectVapor Deposition[10] The direct vapor deposition approach, compared with
the previously described surface diffusion approach, takesinto account only the monomer collisions hitting andadhering directly to the surface of the embryo on the CN.[11] The approach used by, for example, Inada [2002]
largely follows the formulation described here, the equa-tions for the critical cluster free energy DF*, the radius r*,and the reduction factor f being the same as in equations (2),(3), and (6). Note that also when assuming direct vapordeposition we need to know the equilibrium concentrationof critical clusters per substrate surface area, which has the
form c1,s exp�f DFhom*
kT
� , and thus the monomer concentra-
tion on the surface, c1,s, is needed. In the study of Inada[2002], it is assumed that the entire surface of the CN iscovered with a monolayer, the thickness of which is thediameter of one monomer,
c1;s ¼2ri
vi; ð13Þ
where ri is the radius and vi the volume of a monomer, andthe nucleation rate per CN surface area per second is
Jhet ¼ Zhetbhetc1;s exp�DFhet*
kT
� �
¼ pr*2Zhetpvffiffiffiffiffiffiffiffiffiffiffiffiffiffiffiffiffi2pmmkT
p c1;s exp�f DFhom*
kT
� �; ð14Þ
where bhet = pr*2pv �
=ffiffiffiffiffiffiffiffiffiffiffiffiffiffiffiffiffi2pmmkT
p �is the rate of vapor
molecule collision with the cup-shaped embryo, with thecap surface area approximated by pr*2.
2.3. Thermodynamic Data
[12] For modeling one-component nucleation, the follow-ing thermodynamic data are required: saturation vaporpressure of the nucleating substance ps, density of thenucleated phase ri, surface tension or surface energy s,molecular weight mm, and molecular heat capacity cp, andfor heterogeneous nucleation also the contact angle q (or thecontact parameter m = cosq) between the substrate and thecondensation nucleus (CN), energies for surface diffusionDFsd and desorption DFdes, mean jump distance d, andvibrational frequency n of the molecule on the surface. Thevalues used for these data and the related references arepresented in Table 1.[13] For Martian substances, satisfactory data exist for
water since ice nucleation at high altitudes in Earth’satmosphere can be considered an analog to the water icenucleation on Mars. However, because we lack knowledgeabout the exact composition of Martian dust particles, thebest terrestrial analog for use in measurements of heteroge-neous parameters is unknown.[14] For CO2, to our knowledge, only one set of measure-
ments for nucleation in Martian conditions has been done todate [Glandorf et al., 2002]. In their measurements,Glandorfet al. [2002] observed CO2 nucleation on several sites on a1 cm2 water film during some seconds measuring thesaturation ratio at the same time. They defined this criticalnucleation rate as 1 cm�2s�1 and deducted the contactparameter from the results using classical nucleation theory.However, we have not presumed the dust particles to bealready covered with water, or the water ice particles to act ascondensation nuclei. Thus we had to evaluate the contactparameter between CO2 and mineral dust. Comparing theresults of Glandorf et al. [2002] with the derived contactparameters of water on mineral dust, we decided to use theirvalue of m = 0.952 also for nucleation of CO2 on dust. Wereproduced the results of the experiment of Glandorf et al.[2002] with our model quite well; this will be brieflydiscussed in section 3.2.[15] With H2O, we used the value m = 0.97 evaluated by
Wood [1999], which is close to the value of m = 0.975
E02002 MAATTANEN ET AL.: NUCLEATION ON MARS
3 of 12
E02002
applied by Inada [2002] and based on Michelangeli et al.[1993]. In the comparison with Inada [2002], we used theirvalue. Colaprete et al. [1999] had used a value of m = 0.95,an average of the results of Michelangeli et al. [1993]. Forthe desorption and surface diffusion energies DFdes andDFsd, we used values taken from Wood [1999, and refer-ences therein] for CO2 and from Seki and Hasegawa [1983]for H2O.
2.4. Nonisothermal Effects
[16] Our models include nonisothermal effects whichbecome important when the nucleating species forms themajority of the atmosphere, as is the case for CO2 on Mars(constituting 95.3% of the atmosphere). The nonisothermalcoefficient is also calculated for water in our simulations,although the effect is not expected to be significant.[17] The dimensionless nonisothermal factor fdT describes
the reduction in the nucleation rate compared with theclassical isothermal case [Feder et al., 1966] when theamount of the inert carrier gas is very small and the nucleatingspecies is abundant. With only a small amount of carriergas, the forming clusters warm up significantly since thecollisions of the nucleating gas are far more frequent thanthose of the inert gas molecules. Thus the heat of conden-sation is not effectively transported away from the cluster,and the cluster heats up. As a final consequence, thenucleation rate is slowed down by a factor fdT (0 < fdT < 1).It is defined as
fdT ¼ b2
b2 þ q2; ð15Þ
where b describes the energy lost in collisions with gasmolecules and q the energy gained with the moleculesacquired to the cluster [Feder et al., 1966]. The non-isothermal coefficient is a function of temperature and theratio of the nucleating gas and the inert carrier gas. We donot use a constant, average value for the coefficient, unlikeWood [1999], who obtained a value of 0.006 for CO2, butcalculate it in the model during the simulations. The valuesobtained for fdT in our simulations vary between 0.966 and1.0 for H2O in the temperature range 107–200 K andbetween 1.3 10�2 and 3.3 10�2 for CO2 in thetemperature range 100–147 K. The difference of factor 10to the result of Wood [1999] is difficult to trace due to lack
of sufficient background information on his approach to theproblem. We derived our coefficient independently usingthe theory of Feder et al. [1966] and the atmosphericcomposition included in our model (95.3% CO2).
2.5. Presentation of Nucleation Rate
[18] For homogeneous nucleation, the traditional way ofpresenting the nucleation rate is in units cm�3 s�1 describ-ing how many new particles are formed per unit time andunit volume. For heterogeneous nucleation, the conventionis not well established and many different forms are used.Using the same units as for homogeneous nucleation is notvery practical since the amount of condensation nuclei inthe unit volume is critical and should also be known.Options for presenting J are, for example, to give thenumber of forming critical clusters per 1) unit area ofcondensation nuclei in unit time (m�2 s�1) or 2) per particle(condensation nucleus) in unit time (s�1). Also the nucle-ation probability
P ¼ 1� exp �Jhettð Þ; ð16Þ
which describes the probability for one condensationnucleus to nucleate within some nucleation time t [see,e.g., Lazaridis et al., 1992], can be used. We decided to useboth the nucleation rate per particle (units s�1) and thenucleation probability with nucleation time of 10�3 s topresent our results of heterogeneous nucleation. Note that inthis way of presenting J the number of CN is not directlyseen in the value of J or P. Figure 1 shows two dust profiles(CN concentrations for t = 0.1, used in our study, and t =0.4, moderate dust load) representative of Mars outside duststorms. The dust profiles are defined using the formulationof Conrath [1975] and will be discussed also in section 4.The number of activated CN is the product of CNconcentration and the nucleation rate per particle shown inlater figures. Note also that since the maximum value of P isunity P in the figures stays constant after reaching that valueon the axis.
2.6. Differences Between Theories
[19] We have now described two ways of calculating theheterogeneous nucleation rate. Here, we discuss briefly themain differences between the theories and why we haveselected surface diffusion as our technique.
Table 1. Parameters for Basic Cases of Homogeneous and Heterogeneous Nucleation
Parameter Symbol CO2 H2O
Contact parameter m 0.952 [Glandorf et al., 2002] 0.97 [Wood, 1999]Energy of adsorption, J molecule�1
DFdes 3.25 10�20 [Zent and Quinn, 1995] 2.9 10�20 [Seki and Hasegawa, 1983]Energy of surface diffusion, J molecule�1
DFsd 3.25 10�21 [Seki and Hasegawa, 1983] 2.9 10�21 [Seki and Hasegawa, 1983]Saturation vapor pressure, Pa psat [Kasting, 1991] [Buck, 1981]Surface energy, J m�2 s 0.080 [Wood, 1999] 0.106 [Pruppacher and Klett, 1997]Ice density, kg m�3 rice 1600.0 [Wood, 1999] [Pruppacher and Klett, 1997]Molecular heat capacity, J K�1 cv 6.166e�23 calculated 4.66e�23 calculatedVibrational frequency of the molecule, s�1 n 2.9 1012 [Sanford and Allamandola, 1990] 1.0 1013 [Pruppacher and Klett, 1997]Jumping distance of the molecule, m d 4.0 10�10 [Wood, 1999] 3.2 10�10 [Pruppacher and Klett, 1997]Dust optical depth t 0.1 [Wood, 1999]CN number density at the surface, m�3 NCN 1.3 106 [Wood, 1999]Atmospheric pressure, Pa patm 600.0Temperature range, K Trange 100 � Trange � 300
E02002 MAATTANEN ET AL.: NUCLEATION ON MARS
4 of 12
E02002
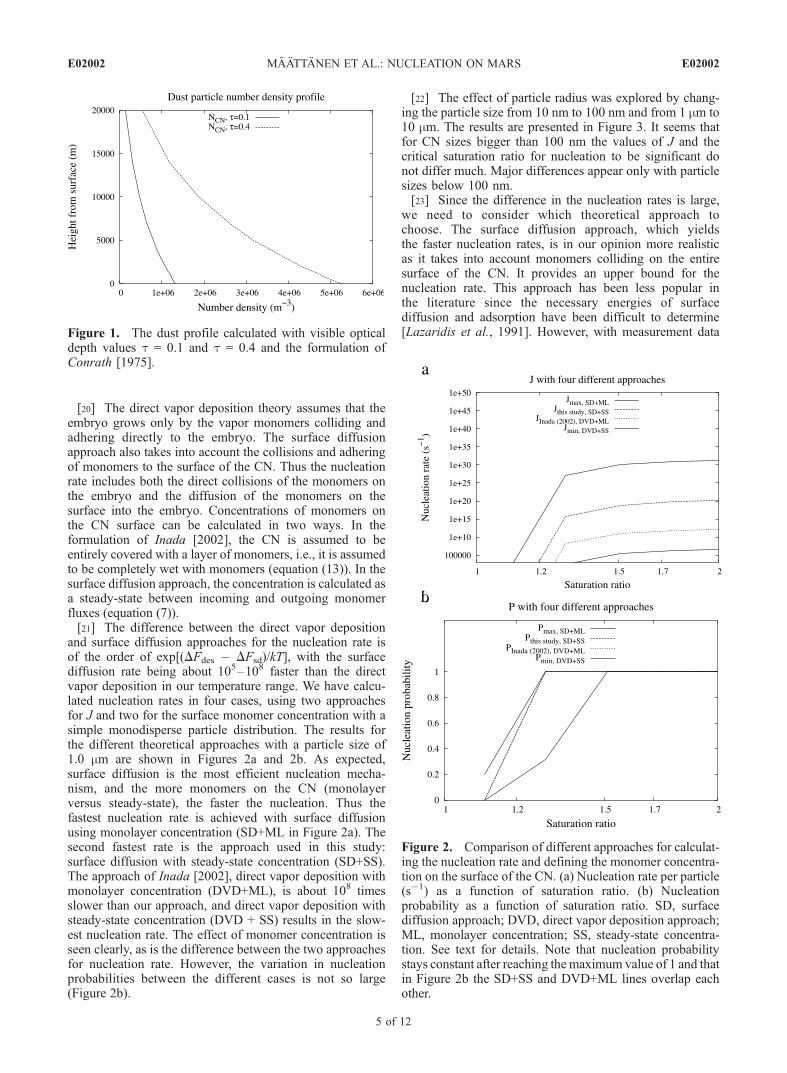
[20] The direct vapor deposition theory assumes that theembryo grows only by the vapor monomers colliding andadhering directly to the embryo. The surface diffusionapproach also takes into account the collisions and adheringof monomers to the surface of the CN. Thus the nucleationrate includes both the direct collisions of the monomers onthe embryo and the diffusion of the monomers on thesurface into the embryo. Concentrations of monomers onthe CN surface can be calculated in two ways. In theformulation of Inada [2002], the CN is assumed to beentirely covered with a layer of monomers, i.e., it is assumedto be completely wet with monomers (equation (13)). In thesurface diffusion approach, the concentration is calculated asa steady-state between incoming and outgoing monomerfluxes (equation (7)).[21] The difference between the direct vapor deposition
and surface diffusion approaches for the nucleation rate isof the order of exp[(DFdes � DFsd)/kT], with the surfacediffusion rate being about 105–108 faster than the directvapor deposition in our temperature range. We have calcu-lated nucleation rates in four cases, using two approachesfor J and two for the surface monomer concentration with asimple monodisperse particle distribution. The results forthe different theoretical approaches with a particle size of1.0 mm are shown in Figures 2a and 2b. As expected,surface diffusion is the most efficient nucleation mecha-nism, and the more monomers on the CN (monolayerversus steady-state), the faster the nucleation. Thus thefastest nucleation rate is achieved with surface diffusionusing monolayer concentration (SD+ML in Figure 2a). Thesecond fastest rate is the approach used in this study:surface diffusion with steady-state concentration (SD+SS).The approach of Inada [2002], direct vapor deposition withmonolayer concentration (DVD+ML), is about 108 timesslower than our approach, and direct vapor deposition withsteady-state concentration (DVD + SS) results in the slow-est nucleation rate. The effect of monomer concentration isseen clearly, as is the difference between the two approachesfor nucleation rate. However, the variation in nucleationprobabilities between the different cases is not so large(Figure 2b).
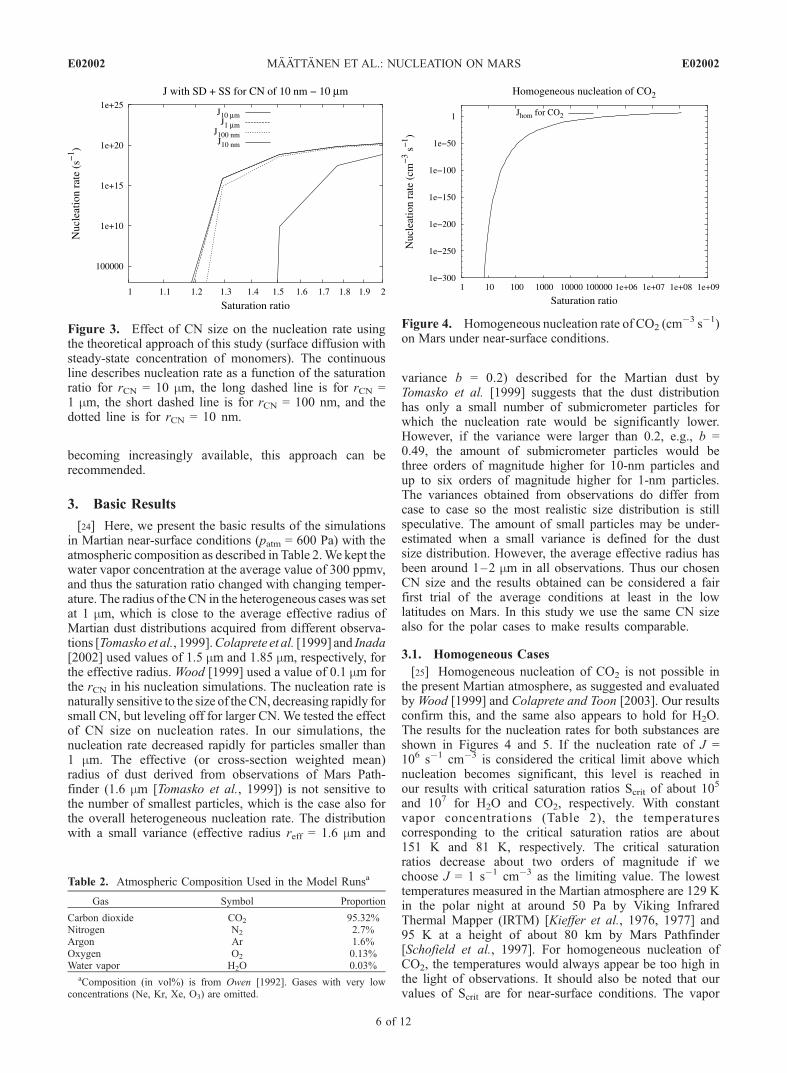
[22] The effect of particle radius was explored by chang-ing the particle size from 10 nm to 100 nm and from 1 mm to10 mm. The results are presented in Figure 3. It seems thatfor CN sizes bigger than 100 nm the values of J and thecritical saturation ratio for nucleation to be significant donot differ much. Major differences appear only with particlesizes below 100 nm.[23] Since the difference in the nucleation rates is large,
we need to consider which theoretical approach tochoose. The surface diffusion approach, which yieldsthe faster nucleation rates, is in our opinion more realisticas it takes into account monomers colliding on the entiresurface of the CN. It provides an upper bound for thenucleation rate. This approach has been less popular inthe literature since the necessary energies of surfacediffusion and adsorption have been difficult to determine[Lazaridis et al., 1991]. However, with measurement dataFigure 1. The dust profile calculated with visible optical
depth values t = 0.1 and t = 0.4 and the formulation ofConrath [1975].
Figure 2. Comparison of different approaches for calculat-ing the nucleation rate and defining the monomer concentra-tion on the surface of the CN. (a) Nucleation rate per particle(s�1) as a function of saturation ratio. (b) Nucleationprobability as a function of saturation ratio. SD, surfacediffusion approach; DVD, direct vapor deposition approach;ML, monolayer concentration; SS, steady-state concentra-tion. See text for details. Note that nucleation probabilitystays constant after reaching the maximum value of 1 and thatin Figure 2b the SD+SS and DVD+ML lines overlap eachother.
E02002 MAATTANEN ET AL.: NUCLEATION ON MARS
5 of 12
E02002
becoming increasingly available, this approach can berecommended.
3. Basic Results
[24] Here, we present the basic results of the simulationsin Martian near-surface conditions (patm = 600 Pa) with theatmospheric composition as described in Table 2.We kept thewater vapor concentration at the average value of 300 ppmv,and thus the saturation ratio changed with changing temper-ature. The radius of the CN in the heterogeneous cases was setat 1 mm, which is close to the average effective radius ofMartian dust distributions acquired from different observa-tions [Tomasko et al., 1999].Colaprete et al. [1999] and Inada[2002] used values of 1.5 mm and 1.85 mm, respectively, forthe effective radius. Wood [1999] used a value of 0.1 mm forthe rCN in his nucleation simulations. The nucleation rate isnaturally sensitive to the size of theCN, decreasing rapidly forsmall CN, but leveling off for larger CN. We tested the effectof CN size on nucleation rates. In our simulations, thenucleation rate decreased rapidly for particles smaller than1 mm. The effective (or cross-section weighted mean)radius of dust derived from observations of Mars Path-finder (1.6 mm [Tomasko et al., 1999]) is not sensitive tothe number of smallest particles, which is the case also forthe overall heterogeneous nucleation rate. The distributionwith a small variance (effective radius reff = 1.6 mm and
variance b = 0.2) described for the Martian dust byTomasko et al. [1999] suggests that the dust distributionhas only a small number of submicrometer particles forwhich the nucleation rate would be significantly lower.However, if the variance were larger than 0.2, e.g., b =0.49, the amount of submicrometer particles would bethree orders of magnitude higher for 10-nm particles andup to six orders of magnitude higher for 1-nm particles.The variances obtained from observations do differ fromcase to case so the most realistic size distribution is stillspeculative. The amount of small particles may be under-estimated when a small variance is defined for the dustsize distribution. However, the average effective radius hasbeen around 1–2 mm in all observations. Thus our chosenCN size and the results obtained can be considered a fairfirst trial of the average conditions at least in the lowlatitudes on Mars. In this study we use the same CN sizealso for the polar cases to make results comparable.
3.1. Homogeneous Cases
[25] Homogeneous nucleation of CO2 is not possible inthe present Martian atmosphere, as suggested and evaluatedbyWood [1999] and Colaprete and Toon [2003]. Our resultsconfirm this, and the same also appears to hold for H2O.The results for the nucleation rates for both substances areshown in Figures 4 and 5. If the nucleation rate of J =106 s�1 cm�3 is considered the critical limit above whichnucleation becomes significant, this level is reached inour results with critical saturation ratios Scrit of about 10
5
and 107 for H2O and CO2, respectively. With constantvapor concentrations (Table 2), the temperaturescorresponding to the critical saturation ratios are about151 K and 81 K, respectively. The critical saturationratios decrease about two orders of magnitude if wechoose J = 1 s�1 cm�3 as the limiting value. The lowesttemperatures measured in the Martian atmosphere are 129 Kin the polar night at around 50 Pa by Viking InfraredThermal Mapper (IRTM) [Kieffer et al., 1976, 1977] and95 K at a height of about 80 km by Mars Pathfinder[Schofield et al., 1997]. For homogeneous nucleation ofCO2, the temperatures would always appear be too high inthe light of observations. It should also be noted that ourvalues of Scrit are for near-surface conditions. The vapor
Figure 3. Effect of CN size on the nucleation rate usingthe theoretical approach of this study (surface diffusion withsteady-state concentration of monomers). The continuousline describes nucleation rate as a function of the saturationratio for rCN = 10 mm, the long dashed line is for rCN =1 mm, the short dashed line is for rCN = 100 nm, and thedotted line is for rCN = 10 nm.
Table 2. Atmospheric Composition Used in the Model Runsa
Gas Symbol Proportion
Carbon dioxide CO2 95.32%Nitrogen N2 2.7%Argon Ar 1.6%Oxygen O2 0.13%Water vapor H2O 0.03%
aComposition (in vol%) is from Owen [1992]. Gases with very lowconcentrations (Ne, Kr, Xe, O3) are omitted.
Figure 4. Homogeneous nucleation rate of CO2 (cm�3 s�1)
on Mars under near-surface conditions.
E02002 MAATTANEN ET AL.: NUCLEATION ON MARS
6 of 12
E02002
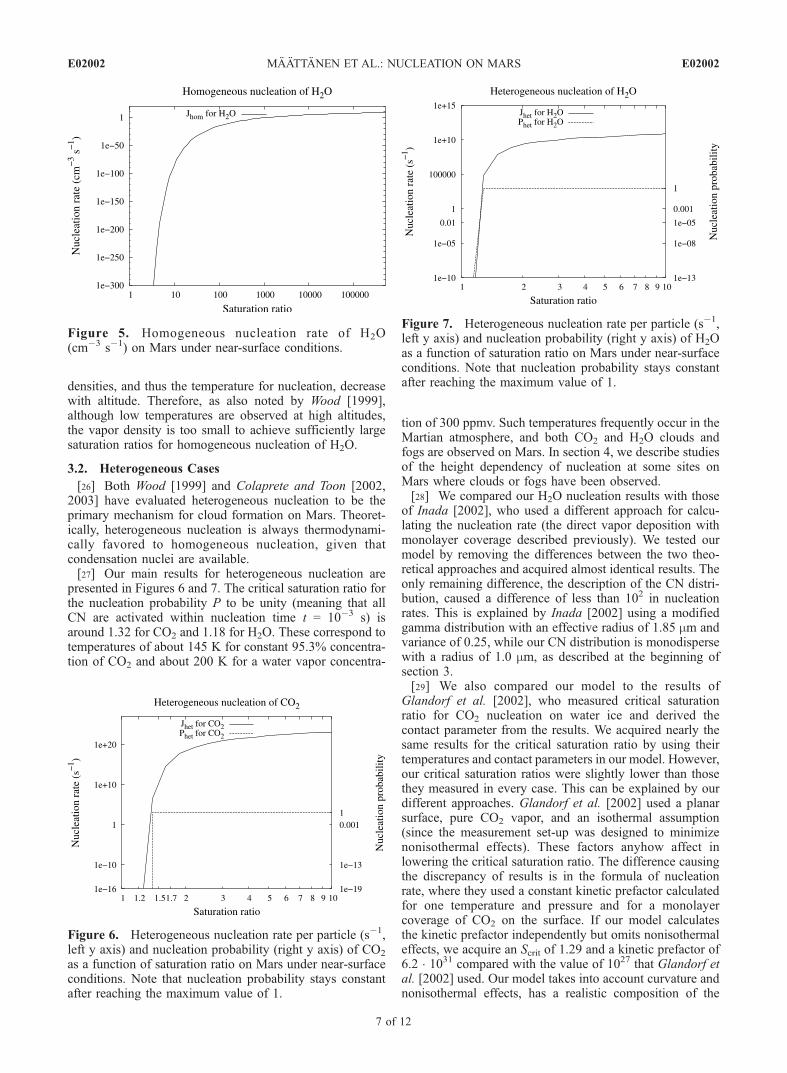
densities, and thus the temperature for nucleation, decreasewith altitude. Therefore, as also noted by Wood [1999],although low temperatures are observed at high altitudes,the vapor density is too small to achieve sufficiently largesaturation ratios for homogeneous nucleation of H2O.
3.2. Heterogeneous Cases
[26] Both Wood [1999] and Colaprete and Toon [2002,2003] have evaluated heterogeneous nucleation to be theprimary mechanism for cloud formation on Mars. Theoret-ically, heterogeneous nucleation is always thermodynami-cally favored to homogeneous nucleation, given thatcondensation nuclei are available.[27] Our main results for heterogeneous nucleation are
presented in Figures 6 and 7. The critical saturation ratio forthe nucleation probability P to be unity (meaning that allCN are activated within nucleation time t = 10�3 s) isaround 1.32 for CO2 and 1.18 for H2O. These correspond totemperatures of about 145 K for constant 95.3% concentra-tion of CO2 and about 200 K for a water vapor concentra-
tion of 300 ppmv. Such temperatures frequently occur in theMartian atmosphere, and both CO2 and H2O clouds andfogs are observed on Mars. In section 4, we describe studiesof the height dependency of nucleation at some sites onMars where clouds or fogs have been observed.[28] We compared our H2O nucleation results with those
of Inada [2002], who used a different approach for calcu-lating the nucleation rate (the direct vapor deposition withmonolayer coverage described previously). We tested ourmodel by removing the differences between the two theo-retical approaches and acquired almost identical results. Theonly remaining difference, the description of the CN distri-bution, caused a difference of less than 102 in nucleationrates. This is explained by Inada [2002] using a modifiedgamma distribution with an effective radius of 1.85 mm andvariance of 0.25, while our CN distribution is monodispersewith a radius of 1.0 mm, as described at the beginning ofsection 3.[29] We also compared our model to the results of
Glandorf et al. [2002], who measured critical saturationratio for CO2 nucleation on water ice and derived thecontact parameter from the results. We acquired nearly thesame results for the critical saturation ratio by using theirtemperatures and contact parameters in our model. However,our critical saturation ratios were slightly lower than thosethey measured in every case. This can be explained by ourdifferent approaches. Glandorf et al. [2002] used a planarsurface, pure CO2 vapor, and an isothermal assumption(since the measurement set-up was designed to minimizenonisothermal effects). These factors anyhow affect inlowering the critical saturation ratio. The difference causingthe discrepancy of results is in the formula of nucleationrate, where they used a constant kinetic prefactor calculatedfor one temperature and pressure and for a monolayercoverage of CO2 on the surface. If our model calculatesthe kinetic prefactor independently but omits nonisothermaleffects, we acquire an Scrit of 1.29 and a kinetic prefactor of6.2 1031 compared with the value of 1027 that Glandorf etal. [2002] used. Our model takes into account curvature andnonisothermal effects, has a realistic composition of the
Figure 5. Homogeneous nucleation rate of H2O(cm�3 s�1) on Mars under near-surface conditions.
Figure 6. Heterogeneous nucleation rate per particle (s�1,left y axis) and nucleation probability (right y axis) of CO2
as a function of saturation ratio on Mars under near-surfaceconditions. Note that nucleation probability stays constantafter reaching the maximum value of 1.
Figure 7. Heterogeneous nucleation rate per particle (s�1,left y axis) and nucleation probability (right y axis) of H2Oas a function of saturation ratio on Mars under near-surfaceconditions. Note that nucleation probability stays constantafter reaching the maximum value of 1.
E02002 MAATTANEN ET AL.: NUCLEATION ON MARS
7 of 12
E02002
atmosphere, and calculates the kinetic prefactor for eachtemperature and pressure. If these differences are eliminatedfrom our model, we get values closer to theirs, but theaverage critical saturation ratio remains lower, 1.32 com-pared with their 1.34.
4. Nucleation as a Function of Height in theMartian Atmosphere and Comparison WithOther Models and Observations
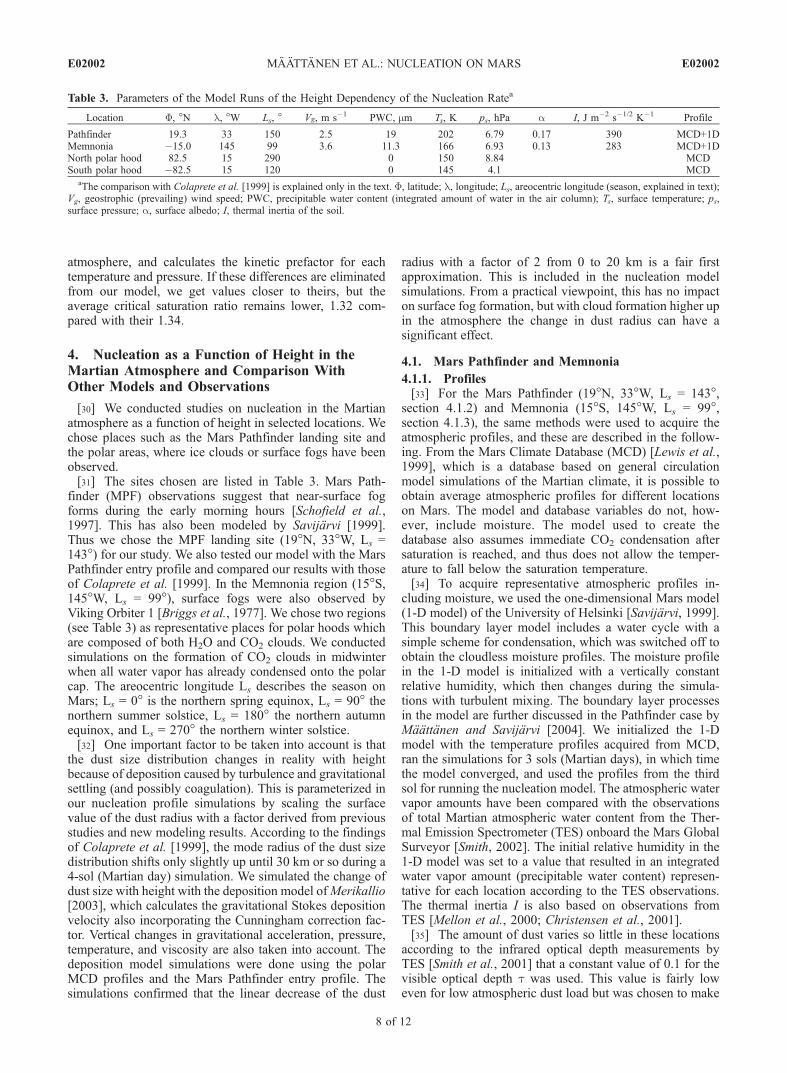
[30] We conducted studies on nucleation in the Martianatmosphere as a function of height in selected locations. Wechose places such as the Mars Pathfinder landing site andthe polar areas, where ice clouds or surface fogs have beenobserved.[31] The sites chosen are listed in Table 3. Mars Path-
finder (MPF) observations suggest that near-surface fogforms during the early morning hours [Schofield et al.,1997]. This has also been modeled by Savijarvi [1999].Thus we chose the MPF landing site (19N, 33W, Ls =143) for our study. We also tested our model with the MarsPathfinder entry profile and compared our results with thoseof Colaprete et al. [1999]. In the Memnonia region (15S,145W, Ls = 99), surface fogs were also observed byViking Orbiter 1 [Briggs et al., 1977]. We chose two regions(see Table 3) as representative places for polar hoods whichare composed of both H2O and CO2 clouds. We conductedsimulations on the formation of CO2 clouds in midwinterwhen all water vapor has already condensed onto the polarcap. The areocentric longitude Ls describes the season onMars; Ls = 0 is the northern spring equinox, Ls = 90 thenorthern summer solstice, Ls = 180 the northern autumnequinox, and Ls = 270 the northern winter solstice.[32] One important factor to be taken into account is that
the dust size distribution changes in reality with heightbecause of deposition caused by turbulence and gravitationalsettling (and possibly coagulation). This is parameterized inour nucleation profile simulations by scaling the surfacevalue of the dust radius with a factor derived from previousstudies and new modeling results. According to the findingsof Colaprete et al. [1999], the mode radius of the dust sizedistribution shifts only slightly up until 30 km or so during a4-sol (Martian day) simulation. We simulated the change ofdust size with height with the deposition model ofMerikallio[2003], which calculates the gravitational Stokes depositionvelocity also incorporating the Cunningham correction fac-tor. Vertical changes in gravitational acceleration, pressure,temperature, and viscosity are also taken into account. Thedeposition model simulations were done using the polarMCD profiles and the Mars Pathfinder entry profile. Thesimulations confirmed that the linear decrease of the dust
radius with a factor of 2 from 0 to 20 km is a fair firstapproximation. This is included in the nucleation modelsimulations. From a practical viewpoint, this has no impacton surface fog formation, but with cloud formation higher upin the atmosphere the change in dust radius can have asignificant effect.
4.1. Mars Pathfinder and Memnonia
4.1.1. Profiles[33] For the Mars Pathfinder (19N, 33W, Ls = 143,
section 4.1.2) and Memnonia (15S, 145W, Ls = 99,section 4.1.3), the same methods were used to acquire theatmospheric profiles, and these are described in the follow-ing. From the Mars Climate Database (MCD) [Lewis et al.,1999], which is a database based on general circulationmodel simulations of the Martian climate, it is possible toobtain average atmospheric profiles for different locationson Mars. The model and database variables do not, how-ever, include moisture. The model used to create thedatabase also assumes immediate CO2 condensation aftersaturation is reached, and thus does not allow the temper-ature to fall below the saturation temperature.[34] To acquire representative atmospheric profiles in-
cluding moisture, we used the one-dimensional Mars model(1-D model) of the University of Helsinki [Savijarvi, 1999].This boundary layer model includes a water cycle with asimple scheme for condensation, which was switched off toobtain the cloudless moisture profiles. The moisture profilein the 1-D model is initialized with a vertically constantrelative humidity, which then changes during the simula-tions with turbulent mixing. The boundary layer processesin the model are further discussed in the Pathfinder case byMaattanen and Savijarvi [2004]. We initialized the 1-Dmodel with the temperature profiles acquired from MCD,ran the simulations for 3 sols (Martian days), in which timethe model converged, and used the profiles from the thirdsol for running the nucleation model. The atmospheric watervapor amounts have been compared with the observationsof total Martian atmospheric water content from the Ther-mal Emission Spectrometer (TES) onboard the Mars GlobalSurveyor [Smith, 2002]. The initial relative humidity in the1-D model was set to a value that resulted in an integratedwater vapor amount (precipitable water content) represen-tative for each location according to the TES observations.The thermal inertia I is also based on observations fromTES [Mellon et al., 2000; Christensen et al., 2001].[35] The amount of dust varies so little in these locations
according to the infrared optical depth measurements byTES [Smith et al., 2001] that a constant value of 0.1 for thevisible optical depth t was used. This value is fairly loweven for low atmospheric dust load but was chosen to make
Table 3. Parameters of the Model Runs of the Height Dependency of the Nucleation Ratea
Location F, N l, W Ls, Vg, m s�1 PWC, mm Ts, K ps, hPa a I, J m�2 s�1/2 K�1 Profile
Pathfinder 19.3 33 150 2.5 19 202 6.79 0.17 390 MCD+1DMemnonia �15.0 145 99 3.6 11.3 166 6.93 0.13 283 MCD+1DNorth polar hood 82.5 15 290 0 150 8.84 MCDSouth polar hood �82.5 15 120 0 145 4.1 MCD
aThe comparison with Colaprete et al. [1999] is explained only in the text. F, latitude; l, longitude; Ls, areocentric longitude (season, explained in text);Vg, geostrophic (prevailing) wind speed; PWC, precipitable water content (integrated amount of water in the air column); Ts, surface temperature; ps,surface pressure; a, surface albedo; I, thermal inertia of the soil.
E02002 MAATTANEN ET AL.: NUCLEATION ON MARS
8 of 12
E02002
all of our simulations comparable (for the basic cases, thisvalue was chosen from the work of Wood [1999]). Dust isincluded in the 1-D model only in the radiative part anddescribed with the help of visible optical depth. The verticalprofile t(z) is as defined by Conrath [1975] (Figure 1). Inthe layer closest to the surface, the number density of dustparticles is defined as NCN = t/(QpH) (1/rCN2 ), where t isthe dust optical depth, Q the Mie extinction coefficient (2.42[Wood, 1999]), H the scale height (10 km [Wood, 1999]),and rCN the radius of the dust particles.[36] We ran the nucleation models on each 1-D model
level, getting profiles of nucleation rates ((J, z) -plots) as aresult, which were then compared with fog observations inthe Pathfinder and Memnonia cases.[37] For the Pathfinder case, we also present a compari-
son with Colaprete et al. [1999] using their Mars Pathfinderentry profile, which was not modified in any way.4.1.2. Mars Pathfinder[38] The results for the Mars Pathfinder Lander are shown
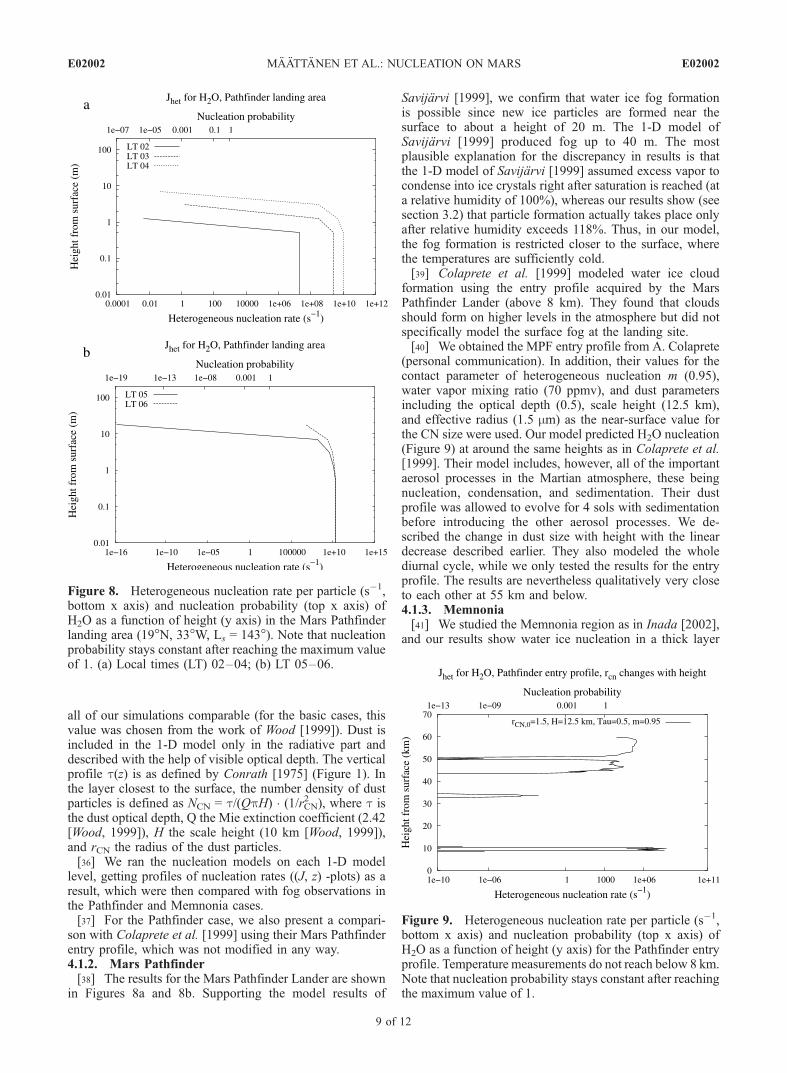
in Figures 8a and 8b. Supporting the model results of
Savijarvi [1999], we confirm that water ice fog formationis possible since new ice particles are formed near thesurface to about a height of 20 m. The 1-D model ofSavijarvi [1999] produced fog up to 40 m. The mostplausible explanation for the discrepancy in results is thatthe 1-D model of Savijarvi [1999] assumed excess vapor tocondense into ice crystals right after saturation is reached (ata relative humidity of 100%), whereas our results show (seesection 3.2) that particle formation actually takes place onlyafter relative humidity exceeds 118%. Thus, in our model,the fog formation is restricted closer to the surface, wherethe temperatures are sufficiently cold.[39] Colaprete et al. [1999] modeled water ice cloud
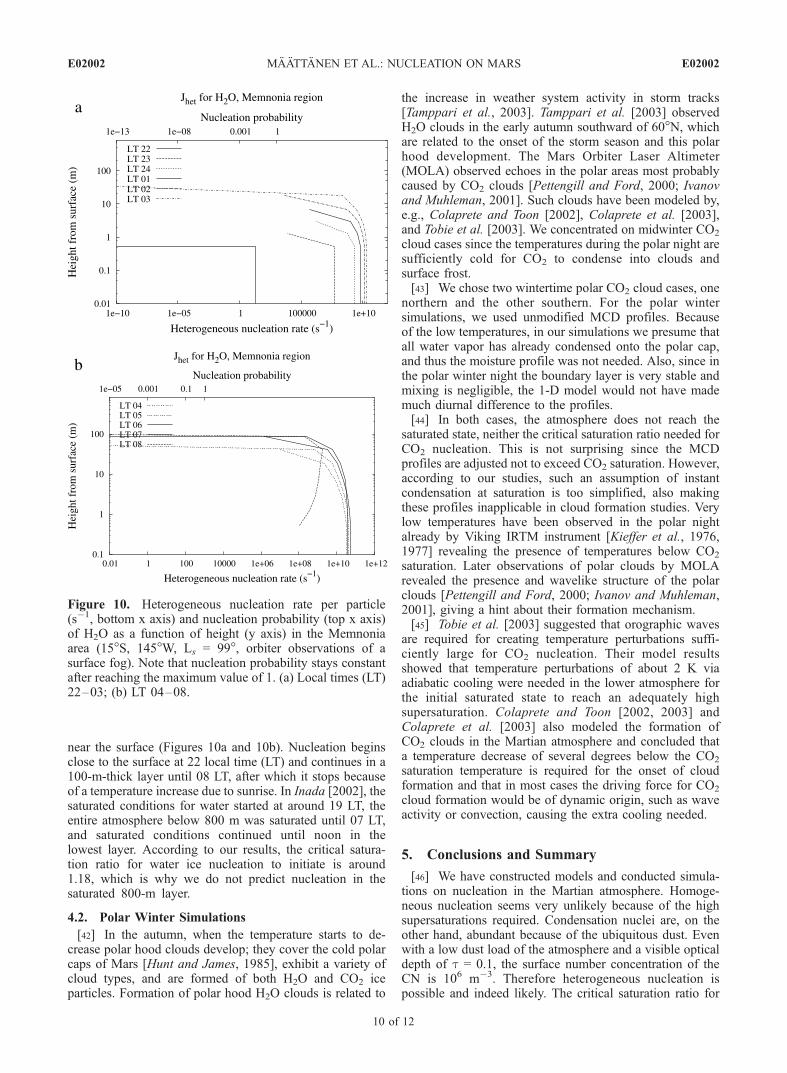
formation using the entry profile acquired by the MarsPathfinder Lander (above 8 km). They found that cloudsshould form on higher levels in the atmosphere but did notspecifically model the surface fog at the landing site.[40] We obtained the MPF entry profile from A. Colaprete
(personal communication). In addition, their values for thecontact parameter of heterogeneous nucleation m (0.95),water vapor mixing ratio (70 ppmv), and dust parametersincluding the optical depth (0.5), scale height (12.5 km),and effective radius (1.5 mm) as the near-surface value forthe CN size were used. Our model predicted H2O nucleation(Figure 9) at around the same heights as in Colaprete et al.[1999]. Their model includes, however, all of the importantaerosol processes in the Martian atmosphere, these beingnucleation, condensation, and sedimentation. Their dustprofile was allowed to evolve for 4 sols with sedimentationbefore introducing the other aerosol processes. We de-scribed the change in dust size with height with the lineardecrease described earlier. They also modeled the wholediurnal cycle, while we only tested the results for the entryprofile. The results are nevertheless qualitatively very closeto each other at 55 km and below.4.1.3. Memnonia[41] We studied the Memnonia region as in Inada [2002],
and our results show water ice nucleation in a thick layer
Figure 8. Heterogeneous nucleation rate per particle (s�1,bottom x axis) and nucleation probability (top x axis) ofH2O as a function of height (y axis) in the Mars Pathfinderlanding area (19N, 33W, Ls = 143). Note that nucleationprobability stays constant after reaching the maximum valueof 1. (a) Local times (LT) 02–04; (b) LT 05–06.
Figure 9. Heterogeneous nucleation rate per particle (s�1,bottom x axis) and nucleation probability (top x axis) ofH2O as a function of height (y axis) for the Pathfinder entryprofile. Temperature measurements do not reach below 8 km.Note that nucleation probability stays constant after reachingthe maximum value of 1.
E02002 MAATTANEN ET AL.: NUCLEATION ON MARS
9 of 12
E02002
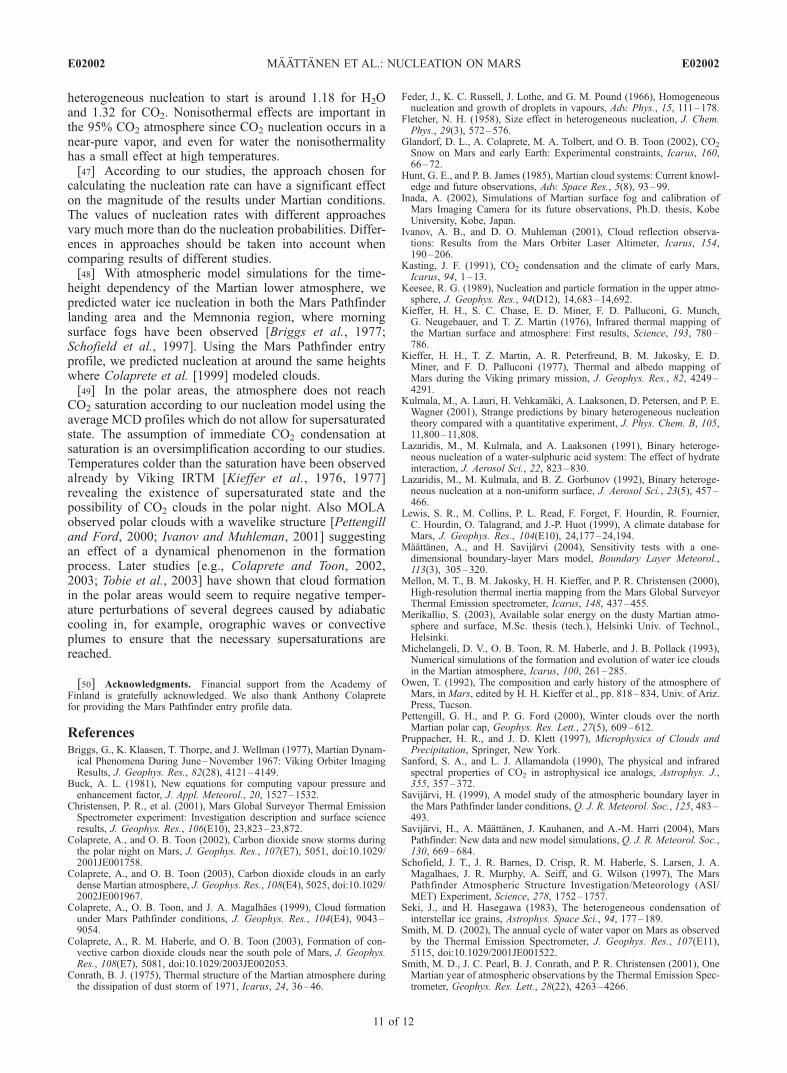
near the surface (Figures 10a and 10b). Nucleation beginsclose to the surface at 22 local time (LT) and continues in a100-m-thick layer until 08 LT, after which it stops becauseof a temperature increase due to sunrise. In Inada [2002], thesaturated conditions for water started at around 19 LT, theentire atmosphere below 800 m was saturated until 07 LT,and saturated conditions continued until noon in thelowest layer. According to our results, the critical satura-tion ratio for water ice nucleation to initiate is around1.18, which is why we do not predict nucleation in thesaturated 800-m layer.
4.2. Polar Winter Simulations
[42] In the autumn, when the temperature starts to de-crease polar hood clouds develop; they cover the cold polarcaps of Mars [Hunt and James, 1985], exhibit a variety ofcloud types, and are formed of both H2O and CO2 iceparticles. Formation of polar hood H2O clouds is related to
the increase in weather system activity in storm tracks[Tamppari et al., 2003]. Tamppari et al. [2003] observedH2O clouds in the early autumn southward of 60N, whichare related to the onset of the storm season and this polarhood development. The Mars Orbiter Laser Altimeter(MOLA) observed echoes in the polar areas most probablycaused by CO2 clouds [Pettengill and Ford, 2000; Ivanovand Muhleman, 2001]. Such clouds have been modeled by,e.g., Colaprete and Toon [2002], Colaprete et al. [2003],and Tobie et al. [2003]. We concentrated on midwinter CO2
cloud cases since the temperatures during the polar night aresufficiently cold for CO2 to condense into clouds andsurface frost.[43] We chose two wintertime polar CO2 cloud cases, one
northern and the other southern. For the polar wintersimulations, we used unmodified MCD profiles. Becauseof the low temperatures, in our simulations we presume thatall water vapor has already condensed onto the polar cap,and thus the moisture profile was not needed. Also, since inthe polar winter night the boundary layer is very stable andmixing is negligible, the 1-D model would not have mademuch diurnal difference to the profiles.[44] In both cases, the atmosphere does not reach the
saturated state, neither the critical saturation ratio needed forCO2 nucleation. This is not surprising since the MCDprofiles are adjusted not to exceed CO2 saturation. However,according to our studies, such an assumption of instantcondensation at saturation is too simplified, also makingthese profiles inapplicable in cloud formation studies. Verylow temperatures have been observed in the polar nightalready by Viking IRTM instrument [Kieffer et al., 1976,1977] revealing the presence of temperatures below CO2
saturation. Later observations of polar clouds by MOLArevealed the presence and wavelike structure of the polarclouds [Pettengill and Ford, 2000; Ivanov and Muhleman,2001], giving a hint about their formation mechanism.[45] Tobie et al. [2003] suggested that orographic waves
are required for creating temperature perturbations suffi-ciently large for CO2 nucleation. Their model resultsshowed that temperature perturbations of about 2 K viaadiabatic cooling were needed in the lower atmosphere forthe initial saturated state to reach an adequately highsupersaturation. Colaprete and Toon [2002, 2003] andColaprete et al. [2003] also modeled the formation ofCO2 clouds in the Martian atmosphere and concluded thata temperature decrease of several degrees below the CO2
saturation temperature is required for the onset of cloudformation and that in most cases the driving force for CO2
cloud formation would be of dynamic origin, such as waveactivity or convection, causing the extra cooling needed.
5. Conclusions and Summary
[46] We have constructed models and conducted simula-tions on nucleation in the Martian atmosphere. Homoge-neous nucleation seems very unlikely because of the highsupersaturations required. Condensation nuclei are, on theother hand, abundant because of the ubiquitous dust. Evenwith a low dust load of the atmosphere and a visible opticaldepth of t = 0.1, the surface number concentration of theCN is 106 m�3. Therefore heterogeneous nucleation ispossible and indeed likely. The critical saturation ratio for
Figure 10. Heterogeneous nucleation rate per particle(s�1, bottom x axis) and nucleation probability (top x axis)of H2O as a function of height (y axis) in the Memnoniaarea (15S, 145W, Ls = 99, orbiter observations of asurface fog). Note that nucleation probability stays constantafter reaching the maximum value of 1. (a) Local times (LT)22–03; (b) LT 04–08.
E02002 MAATTANEN ET AL.: NUCLEATION ON MARS
10 of 12
E02002
heterogeneous nucleation to start is around 1.18 for H2Oand 1.32 for CO2. Nonisothermal effects are important inthe 95% CO2 atmosphere since CO2 nucleation occurs in anear-pure vapor, and even for water the nonisothermalityhas a small effect at high temperatures.[47] According to our studies, the approach chosen for
calculating the nucleation rate can have a significant effecton the magnitude of the results under Martian conditions.The values of nucleation rates with different approachesvary much more than do the nucleation probabilities. Differ-ences in approaches should be taken into account whencomparing results of different studies.[48] With atmospheric model simulations for the time-
height dependency of the Martian lower atmosphere, wepredicted water ice nucleation in both the Mars Pathfinderlanding area and the Memnonia region, where morningsurface fogs have been observed [Briggs et al., 1977;Schofield et al., 1997]. Using the Mars Pathfinder entryprofile, we predicted nucleation at around the same heightswhere Colaprete et al. [1999] modeled clouds.[49] In the polar areas, the atmosphere does not reach
CO2 saturation according to our nucleation model using theaverage MCD profiles which do not allow for supersaturatedstate. The assumption of immediate CO2 condensation atsaturation is an oversimplification according to our studies.Temperatures colder than the saturation have been observedalready by Viking IRTM [Kieffer et al., 1976, 1977]revealing the existence of supersaturated state and thepossibility of CO2 clouds in the polar night. Also MOLAobserved polar clouds with a wavelike structure [Pettengilland Ford, 2000; Ivanov and Muhleman, 2001] suggestingan effect of a dynamical phenomenon in the formationprocess. Later studies [e.g., Colaprete and Toon, 2002,2003; Tobie et al., 2003] have shown that cloud formationin the polar areas would seem to require negative temper-ature perturbations of several degrees caused by adiabaticcooling in, for example, orographic waves or convectiveplumes to ensure that the necessary supersaturations arereached.
[50] Acknowledgments. Financial support from the Academy ofFinland is gratefully acknowledged. We also thank Anthony Colapretefor providing the Mars Pathfinder entry profile data.
ReferencesBriggs, G., K. Klaasen, T. Thorpe, and J. Wellman (1977), Martian Dynam-ical Phenomena During June–November 1967: Viking Orbiter ImagingResults, J. Geophys. Res., 82(28), 4121–4149.
Buck, A. L. (1981), New equations for computing vapour pressure andenhancement factor, J. Appl. Meteorol., 20, 1527–1532.
Christensen, P. R., et al. (2001), Mars Global Surveyor Thermal EmissionSpectrometer experiment: Investigation description and surface scienceresults, J. Geophys. Res., 106(E10), 23,823–23,872.
Colaprete, A., and O. B. Toon (2002), Carbon dioxide snow storms duringthe polar night on Mars, J. Geophys. Res., 107(E7), 5051, doi:10.1029/2001JE001758.
Colaprete, A., and O. B. Toon (2003), Carbon dioxide clouds in an earlydense Martian atmosphere, J. Geophys. Res., 108(E4), 5025, doi:10.1029/2002JE001967.
Colaprete, A., O. B. Toon, and J. A. Magalhaes (1999), Cloud formationunder Mars Pathfinder conditions, J. Geophys. Res., 104(E4), 9043–9054.
Colaprete, A., R. M. Haberle, and O. B. Toon (2003), Formation of con-vective carbon dioxide clouds near the south pole of Mars, J. Geophys.Res., 108(E7), 5081, doi:10.1029/2003JE002053.
Conrath, B. J. (1975), Thermal structure of the Martian atmosphere duringthe dissipation of dust storm of 1971, Icarus, 24, 36–46.
Feder, J., K. C. Russell, J. Lothe, and G. M. Pound (1966), Homogeneousnucleation and growth of droplets in vapours, Adv. Phys., 15, 111–178.
Fletcher, N. H. (1958), Size effect in heterogeneous nucleation, J. Chem.Phys., 29(3), 572–576.
Glandorf, D. L., A. Colaprete, M. A. Tolbert, and O. B. Toon (2002), CO2
Snow on Mars and early Earth: Experimental constraints, Icarus, 160,66–72.
Hunt, G. E., and P. B. James (1985), Martian cloud systems: Current knowl-edge and future observations, Adv. Space Res., 5(8), 93–99.
Inada, A. (2002), Simulations of Martian surface fog and calibration ofMars Imaging Camera for its future observations, Ph.D. thesis, KobeUniversity, Kobe, Japan.
Ivanov, A. B., and D. O. Muhleman (2001), Cloud reflection observa-tions: Results from the Mars Orbiter Laser Altimeter, Icarus, 154,190–206.
Kasting, J. F. (1991), CO2 condensation and the climate of early Mars,Icarus, 94, 1–13.
Keesee, R. G. (1989), Nucleation and particle formation in the upper atmo-sphere, J. Geophys. Res., 94(D12), 14,683–14,692.
Kieffer, H. H., S. C. Chase, E. D. Miner, F. D. Palluconi, G. Munch,G. Neugebauer, and T. Z. Martin (1976), Infrared thermal mapping ofthe Martian surface and atmosphere: First results, Science, 193, 780–786.
Kieffer, H. H., T. Z. Martin, A. R. Peterfreund, B. M. Jakosky, E. D.Miner, and F. D. Palluconi (1977), Thermal and albedo mapping ofMars during the Viking primary mission, J. Geophys. Res., 82, 4249–4291.
Kulmala, M., A. Lauri, H. Vehkamaki, A. Laaksonen, D. Petersen, and P. E.Wagner (2001), Strange predictions by binary heterogeneous nucleationtheory compared with a quantitative experiment, J. Phys. Chem. B, 105,11,800–11,808.
Lazaridis, M., M. Kulmala, and A. Laaksonen (1991), Binary heteroge-neous nucleation of a water-sulphuric acid system: The effect of hydrateinteraction, J. Aerosol Sci., 22, 823–830.
Lazaridis, M., M. Kulmala, and B. Z. Gorbunov (1992), Binary heteroge-neous nucleation at a non-uniform surface, J. Aerosol Sci., 23(5), 457–466.
Lewis, S. R., M. Collins, P. L. Read, F. Forget, F. Hourdin, R. Fournier,C. Hourdin, O. Talagrand, and J.-P. Huot (1999), A climate database forMars, J. Geophys. Res., 104(E10), 24,177–24,194.
Maattanen, A., and H. Savijarvi (2004), Sensitivity tests with a one-dimensional boundary-layer Mars model, Boundary Layer Meteorol.,113(3), 305–320.
Mellon, M. T., B. M. Jakosky, H. H. Kieffer, and P. R. Christensen (2000),High-resolution thermal inertia mapping from the Mars Global SurveyorThermal Emission spectrometer, Icarus, 148, 437–455.
Merikallio, S. (2003), Available solar energy on the dusty Martian atmo-sphere and surface, M.Sc. thesis (tech.), Helsinki Univ. of Technol.,Helsinki.
Michelangeli, D. V., O. B. Toon, R. M. Haberle, and J. B. Pollack (1993),Numerical simulations of the formation and evolution of water ice cloudsin the Martian atmosphere, Icarus, 100, 261–285.
Owen, T. (1992), The composition and early history of the atmosphere ofMars, inMars, edited by H. H. Kieffer et al., pp. 818–834, Univ. of Ariz.Press, Tucson.
Pettengill, G. H., and P. G. Ford (2000), Winter clouds over the northMartian polar cap, Geophys. Res. Lett., 27(5), 609–612.
Pruppacher, H. R., and J. D. Klett (1997), Microphysics of Clouds andPrecipitation, Springer, New York.
Sanford, S. A., and L. J. Allamandola (1990), The physical and infraredspectral properties of CO2 in astrophysical ice analogs, Astrophys. J.,355, 357–372.
Savijarvi, H. (1999), A model study of the atmospheric boundary layer inthe Mars Pathfinder lander conditions, Q. J. R. Meteorol. Soc., 125, 483–493.
Savijarvi, H., A. Maattanen, J. Kauhanen, and A.-M. Harri (2004), MarsPathfinder: New data and new model simulations, Q. J. R. Meteorol. Soc.,130, 669–684.
Schofield, J. T., J. R. Barnes, D. Crisp, R. M. Haberle, S. Larsen, J. A.Magalhaes, J. R. Murphy, A. Seiff, and G. Wilson (1997), The MarsPathfinder Atmospheric Structure Investigation/Meteorology (ASI/MET) Experiment, Science, 278, 1752–1757.
Seki, J., and H. Hasegawa (1983), The heterogeneous condensation ofinterstellar ice grains, Astrophys. Space Sci., 94, 177–189.
Smith, M. D. (2002), The annual cycle of water vapor on Mars as observedby the Thermal Emission Spectrometer, J. Geophys. Res., 107(E11),5115, doi:10.1029/2001JE001522.
Smith, M. D., J. C. Pearl, B. J. Conrath, and P. R. Christensen (2001), OneMartian year of atmospheric observations by the Thermal Emission Spec-trometer, Geophys. Res. Lett., 28(22), 4263–4266.
E02002 MAATTANEN ET AL.: NUCLEATION ON MARS
11 of 12
E02002
Tamppari, L. K., R. W. Zurek, and D. A. Paige (2003), Viking-era diurnalwater-ice clouds, J. Geophys. Res., 108(E7), 5073, doi:10.1029/2002JE001911.
Tobie, G., F. Forget, and F. Lott (2003), Numerical simulation of the winterpolar wave clouds observed by Mars Global Surveyor Mars Orbiter LaserAltimeter, Icarus, 164, 33–49.
Tomasko, M. G., L. R. Loose, M. Lemmon, P. H. Smith, and E. Wegryn(1999), Properties of dust in the Martian atmosphere from the Imager onMars Pathfinder, J. Geophys. Res., 104(E4), 8987–9007.
Volmer, M. (1939), Kinetik der Phasenbildung, Von Theodor Steinkopff,Dresden, Germany.
Wood, S. E. (1999), Nucleation and growth of CO2 ice crystals in theMartian atmosphere, Ph.D. thesis, Univ. of Calif., Los Angeles.
Zent, A. P., and R. C. Quinn (1995), Simultaneous adsorption of CO2 andH2O under Mars-like conditions and application to the evolution of theMartian climate, J. Geophys. Res., 100, 5341–5349.
�����������������������J. Kauhanen, M. Kulmala, A. Lauri, A. Maattanen, H. Savijarvi, and
H. Vehkamaki, Division of Atmospheric Sciences, Department of PhysicalSciences, University of Helsinki, P.O. Box 64, Helsinki, FIN-00014Finland. ([email protected])S. Merikallio, Space Research, Finnish Meteorological Institute, P.O. Box
503, Helsinki, FIN-00101 Finland.
E02002 MAATTANEN ET AL.: NUCLEATION ON MARS
12 of 12
E02002