Embed Size (px)
Citation preview
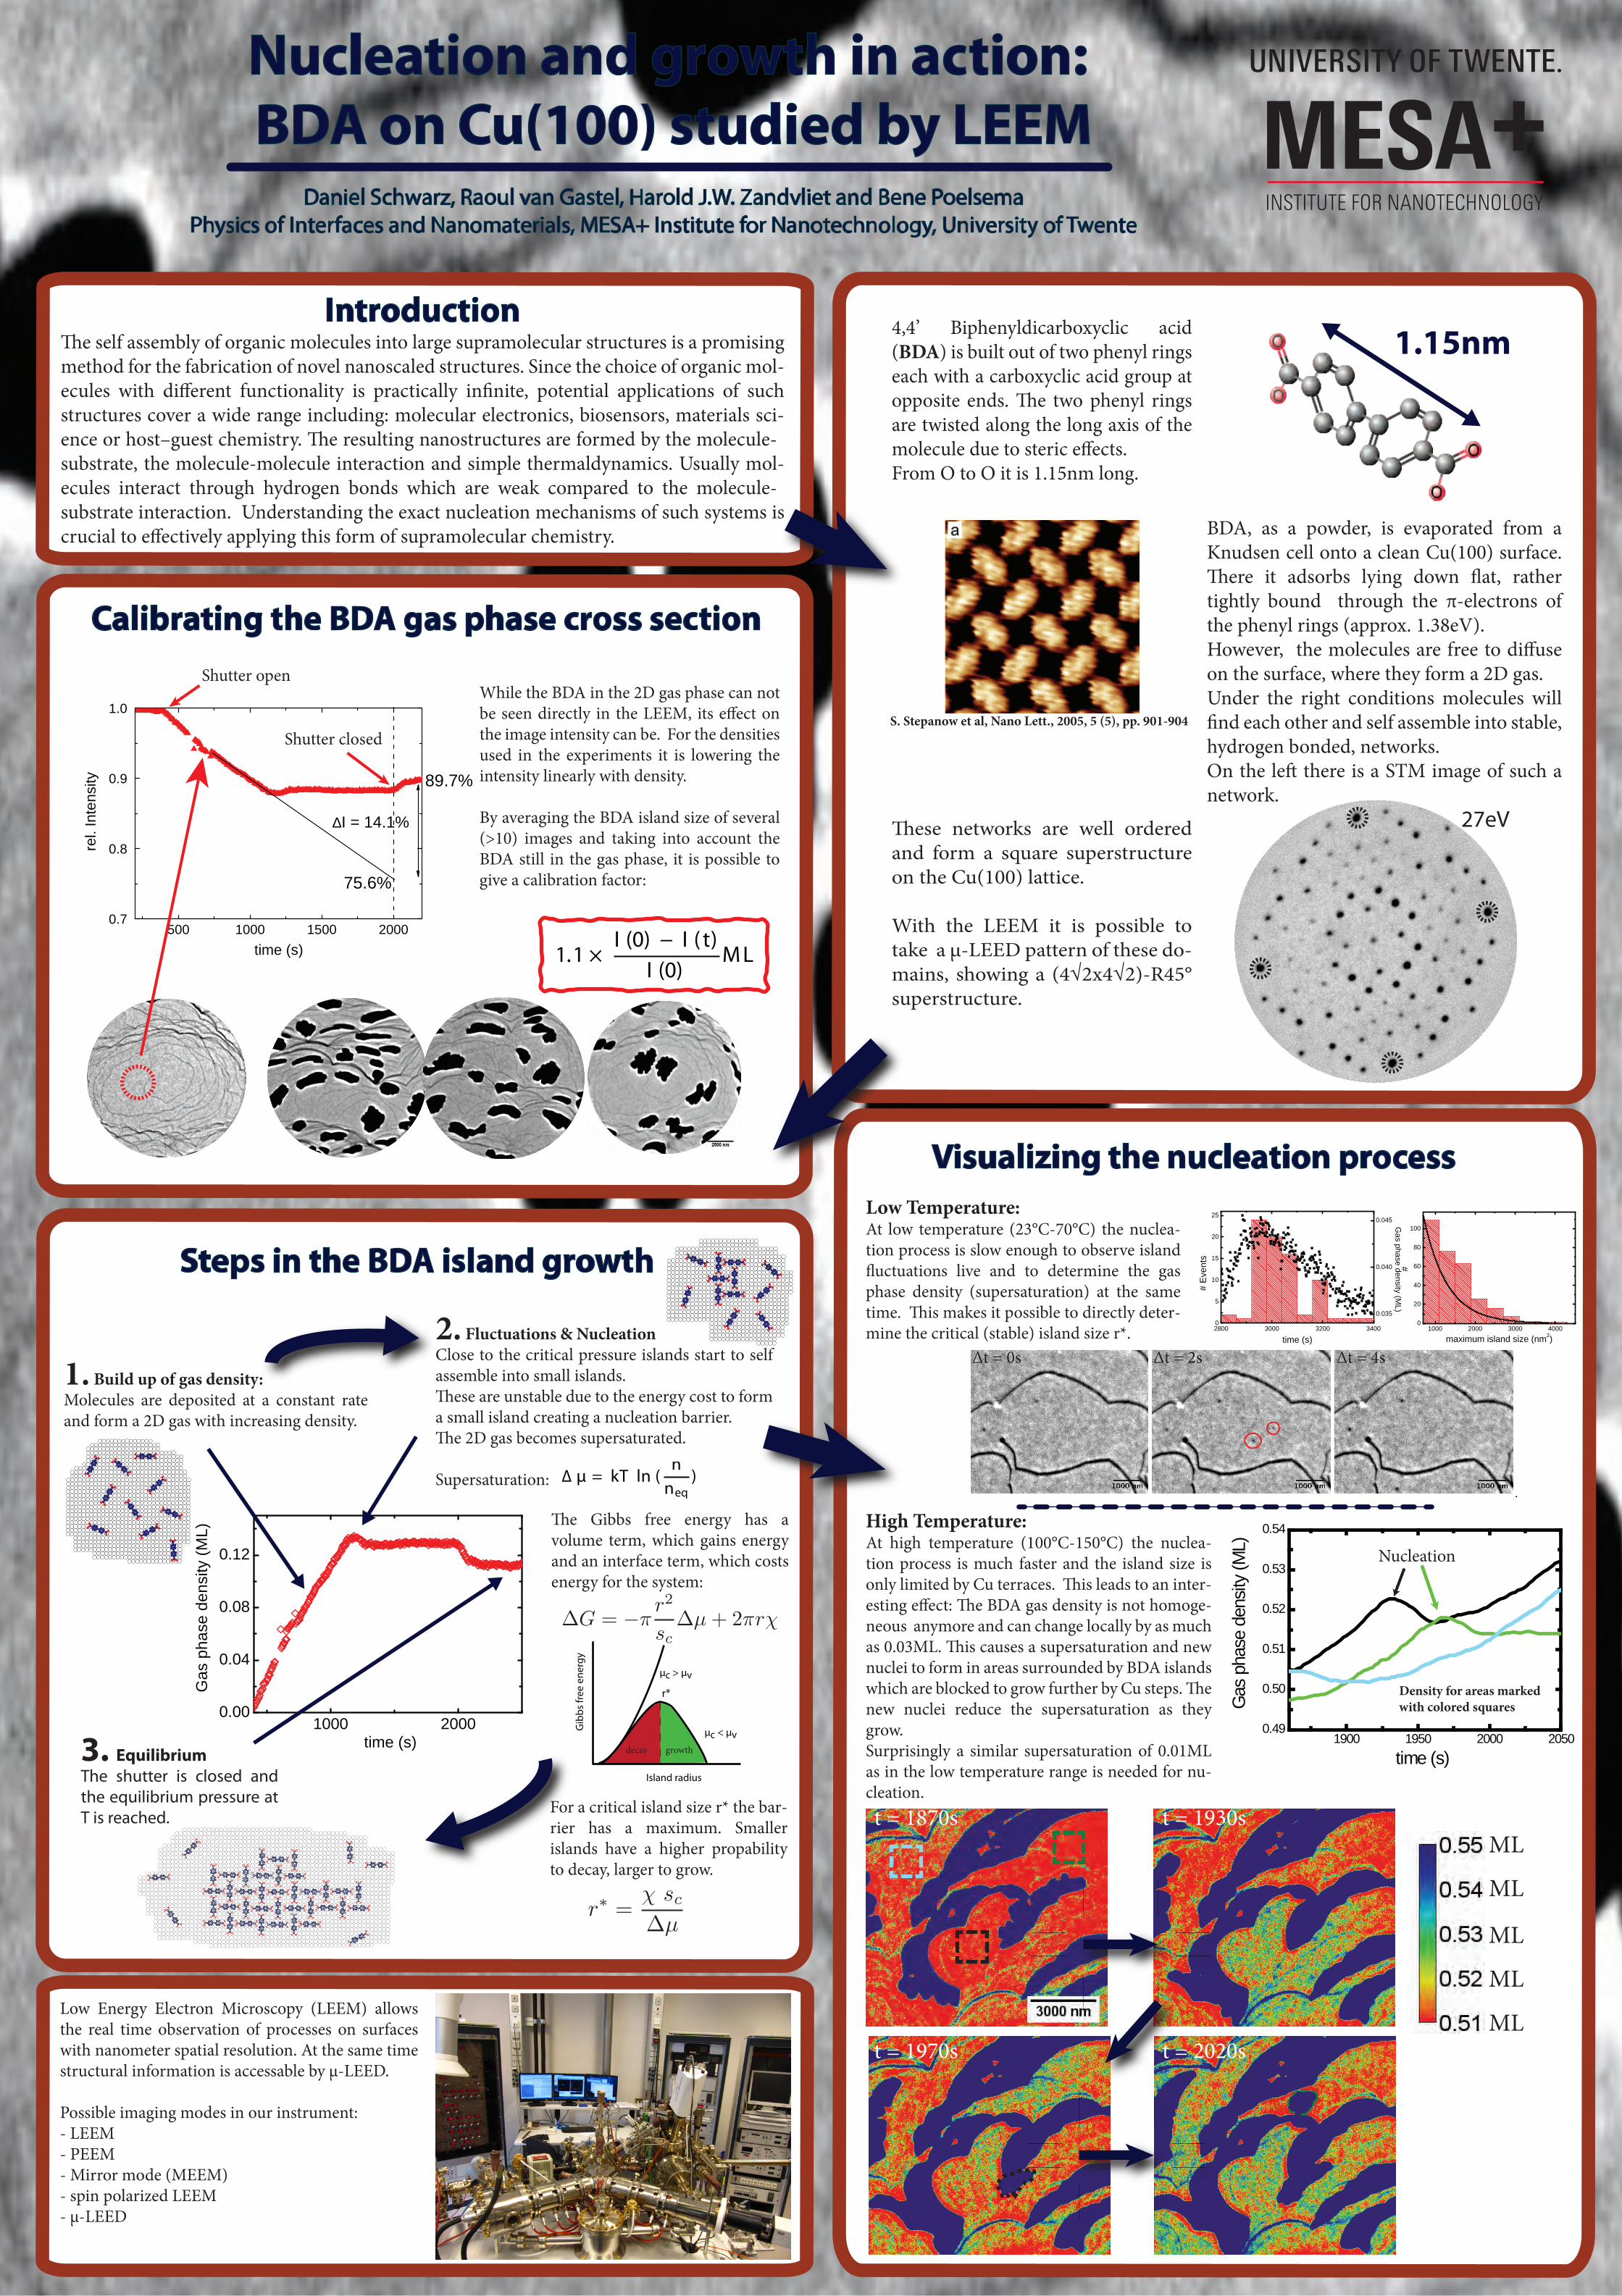
High Temperature:At high temperature (100°C-150°C) the nuclea-tion process is much faster and the island size is only limited by Cu terraces. �is leads to an inter-esting e�ect: �e BDA gas density is not homoge-neous anymore and can change locally by as much as 0.03ML. �is causes a supersaturation and new nuclei to form in areas surrounded by BDA islands which are blocked to grow further by Cu steps. �e new nuclei reduce the supersaturation as they grow.Surprisingly a similar supersaturation of 0.01ML as in the low temperature range is needed for nu-cleation.
Introduction�e self assembly of organic molecules into large supramolecular structures is a promising method for the fabrication of novel nanoscaled structures. Since the choice of organic mol-ecules with di�erent functionality is practically in�nite, potential applications of such structures cover a wide range including: molecular electronics, biosensors, materials sci-ence or host–guest chemistry. �e resulting nanostructures are formed by the molecule-substrate, the molecule-molecule interaction and simple thermaldynamics. Usually mol-ecules interact through hydrogen bonds which are weak compared to the molecule-substrate interaction. Understanding the exact nucleation mechanisms of such systems is crucial to e�ectively applying this form of supramolecular chemistry.
4,4’ Biphenyldicarboxyclic acid (BDA) is built out of two phenyl rings each with a carboxyclic acid group at opposite ends. �e two phenyl rings are twisted along the long axis of the molecule due to steric e�ects.From O to O it is 1.15nm long.
1.15nm
BDA, as a powder, is evaporated from a Knudsen cell onto a clean Cu(100) surface. �ere it adsorbs lying down �at, rather tightly bound through the π-electrons of the phenyl rings (approx. 1.38eV). However, the molecules are free to di�use on the surface, where they form a 2D gas.Under the right conditions molecules will �nd each other and self assemble into stable, hydrogen bonded, networks. On the le� there is a STM image of such a network.
S. Stepanow et al, Nano Lett., 2005, 5 (5), pp. 901-904
�ese networks are well ordered and form a square superstructure on the Cu(100) lattice.
With the LEEM it is possible to take a µ-LEED pattern of these do-mains, showing a (4√2x4√2)-R45° superstructure.
Low Energy Electron Microscopy (LEEM) allows the real time observation of processes on surfaces with nanometer spatial resolution. At the same time structural information is accessable by µ-LEED.
Possible imaging modes in our instrument:- LEEM- PEEM- Mirror mode (MEEM)- spin polarized LEEM- µ-LEED
500 1000 1500 20000.7
0.8
0.9
1.0
rel.
Inte
nsity
time (s)
75.6%
89.7%
∆I = 14.1%
Calibrating the BDA gas phase cross section
While the BDA in the 2D gas phase can not be seen directly in the LEEM, its e�ect on the image intensity can be. For the densities used in the experiments it is lowering the intensity linearly with density.
By averaging the BDA island size of several (>10) images and taking into account the BDA still in the gas phase, it is possible to give a calibration factor:
Shutter open
Shutter closed
1.1 ×I (0) − I ( t)
I (0)ML
Steps in the BDA island growth
1. Build up of gas density:Molecules are deposited at a constant rate and form a 2D gas with increasing density.
1000 20000.00
0.04
0.08
0.12
Gas
pha
se d
ensi
ty (M
L)
time (s)
2. Fluctuations & NucleationClose to the critical pressure islands start to self assemble into small islands. �ese are unstable due to the energy cost to form a small island creating a nucleation barrier. �e 2D gas becomes supersaturated.
Supersaturation:
�e Gibbs free energy has a volume term, which gains energy and an interface term, which costs energy for the system:
For a critical island size r* the bar-rier has a maximum. Smaller islands have a higher propability to decay, larger to grow.
3. EquilibriumThe shutter is closed and the equilibrium pressure at T is reached.
Daniel Schwarz, Raoul van Gastel, Harold J.W. Zandvliet and Bene PoelsemaPhysics of Interfaces and Nanomaterials, MESA+ Institute for Nanotechnology, University of Twente
Visualizing the nucleation processLow Temperature:At low temperature (23°C-70°C) the nuclea-tion process is slow enough to observe island �uctuations live and to determine the gas phase density (supersaturation) at the same time. �is makes it possible to directly deter-mine the critical (stable) island size r*.
Nucleation and growth in action: BDA on Cu(100) studied by LEEM
∆ µ = kT ln (nneq
)
Gib
bs fr
ee e
nerg
y
Island radius
r*
µc > µv
µc < µv
0.035
0.040
0.045
2800 3000 3200 34000
5
10
15
20
25
#
Eve
nts
time (s)
Gas phase density (M
L)
1000 2000 3000 40000
20
40
60
80
100
#
maximum island size (nm2)
decay growth
Δt = 0s Δt = 2s Δt = 4s
ML
ML
ML
ML
ML
1900 1950 2000 20500.49
0.50
0.51
0.52
0.53
0.54
Gas
pha
se d
ensit
y (M
L)
time (s)
Nucleation
t = 1870s t = 1930s
t = 1970s t = 2020s
27eV
Density for areas markedwith colored squares