Embed Size (px)
Citation preview

Nuclear Power Plants and Sustainability by
Timo Martti Heikki Koivumäki
Thesis MSc in Sustainable Energy
December 2010

Nuclear Power Plants and Sustainability
Timo Martti Heikki Koivumäki
Thesis submitted to the School of Science and Engineering at Reykjavik University in partial fulfillment
of the requirements for the degree of MSc in Sustainable Energy
December 2010 Supervisors: Ágúst Valfells, Supervisor Associate Professor, Reykjavik University Haraldur Óskar Haraldsson, Supervisor Assistant Professor, Reykjavik University Examiner: Guðrun Arnbjörg Sævarsdóttir Assistant Professor, Reykjavik University

Abstract Background Sustainability is one of the most important concepts of the future, while being major
issue in fossil fuel driven electricity generation sector. Nuclear power plants do not emit large
amounts of greenhouse gases, but are they any better than fossil-fueled power plants in terms of
sustainability? This question is answered in this thesis by literature review.
Results Nuclear power plants can provide cheap electricity, with smaller amount of global
problems than fossil-fueled power plants. In the future, as nuclear power plant technology is
moving forward, more advanced technologies will be available. These new technologies will bring
nuclear power plants close to sustainable electricity generation. However, nuclear power is not
the solution to cover the electricity demand in long term. There are energy forms available, which
are more sustainable, while problem lies in missing or too expensive technology.
Conclusion With only flawed options to provide electricity for the next hundred years, using
nuclear power is the most sustainable path to fully sustainable world.

Nuclear Power Plants and Sustainability
Timo Martti Heikki Koivumäki
Thesis submitted to the School of Science and Engineering at Reykjavik University in partial fulfillment
of the requirements for the degree of MSc in Sustainable Energy
December 2010
Student: Timo Martti Heikki Koivumäki Supervisors: Ágúst Valfells Haraldur Óskar Haraldsson Examiner: Guðrun Arnbjörg Sævarsdóttir

i
Table of Contents
Table of Contents i
List of Figures v
List of Tables vi
List of Constants and Variables vii
Introduction 1
1 Basic Nuclear Physics 2
1.1 Terminology 2
1.2 Units and dimensions 3
1.3 Forces in the nucleus 3
1.4 Decay 6
1.4.1 Half-life 7
1.4.2 Alpha decay 7
1.4.3 Beta decay 7
1.4.4 Gamma decay 8
1.4.5 Relevance to nuclear reactors 8
1.5 Fission 9
1.5.1 Fission energies 9
1.5.2 Fission products 9
1.5.3 Emitted neutrons 10
1.5.4 Cross sections 11
1.5.5 Neutron fate calculations 15
1.5.6 Energy content of fissile material 17
1.6 Radiation measurements 19
1.6.1 Biological effects of radiation 21
2 Front-end of nuclear fuel cycle 22
2.1 Materials 22
2.1.1 Uranium 22
2.1.2 Thorium 23
2.2 Uranium resources 23

ii
2.2.1 Price 23
2.2.2 Geological distribution of resources 25
2.3 Production of uranium 27
2.4 Consumption 28
2.5 From the ground to nuclear reactor 29
2.5.1 Mining and milling 29
2.5.2 Refining and Conversion 30
2.5.3 Fuel Fabrication 33
3 Introduction to technology 34
3.1 Cyclic process 34
3.1.1 Rankine cycle 34
3.1.2 Limitations for heat engines 35
3.2 Nuclear Reactor engineering 36
3.2.1 Nuclear reactor engineering basics 36
3.3 Past technology (Generation I) 39
3.4 Current technology (Gen II) 40
3.4.1 PWR 40
3.4.2 BWR 45
3.4.3 RBMK 47
3.4.4 PHWR/CANDU 50
3.4.5 AGR 52
3.4.6 FBR 53
3.5 Current situation 57
3.6 Technology for near future (Gen III and Gen III+) 57
3.6.1 Third generation 57
3.6.2 PBMR 59
3.6.3 Developments in the near future 59
3.7 Future technology 60
3.7.1 Generation IV 60
3.7.2 Traveling Wave Reactor 60
4 Back-End fuel cycle 63
4.1 Waste classification 63
4.1.1 High Level Waste 64
iii
4.1.2 Intermediate Level Waste 64
4.1.3 Low level waste 65
4.1.4 Very low level waste 65
4.1.5 Very short lived waste 65
4.1.6 Exempt waste 65
4.2 Nuclear power plant fuel after use 65
4.2.1 After the reactor 66
4.2.2 Back-end fuel cycle choices 67
5 Economics 75
5.1 Choosing between energy sources 75
5.2 Review of past consumption 78
5.3 Assessment of future growth 81
5.3.1 Estimating the future consumption 81
5.3.2 CO2 problem 84
5.4 Electricity price in future 89
5.5 Levelized cost calculations 91
5.5.1 Capital costs 92
5.5.2 Operation and maintenance costs 93
5.5.3 Fuel costs 93
5.5.4 Levelized cost for nuclear power plant produced electricity 96
6 Sustainability and Nuclear sector 97
6.1 What is sustainable energy production? 97
6.2 Fixed variables of sustainability assessment 97
6.2.1 Security of supply 98
6.2.2 Growth 101
6.3 Goals 101
6.3.1 Sustainability in the long term 102
6.4 Assessment of available technologies 102
6.4.1 Sustainability assessment of base-line electricity technology today 103
6.4.2 Comparing sustainability of technologies available 107
6.4.3 Comparing sustainability in near future 108
6.5 Technologies with absolute sustainability 109
6.5.1 Solar energy 109

iv
6.5.2 Wind energy 110
6.5.3 Other options 111
6.5.4 Required development in other components of electricity generation chain 113
6.6 Pathway to sustainability 115
7 Conclusion 117
8 Bibliography 119
v
List of Figures
FIGURE 1.1: STABLE AND RADIOACTIVE ATOMS ........................................................................................................................ 5
FIGURE 1.2, CURVE OF BINDING ENERGY .................................................................................................................................. 6
FIGURE 1.3: DISTRIBUTION OF FISSION PRODUCTS ................................................................................................................. 10
FIGURE 1.4: CROSS SECTIONS FOR URANIUM-235 .................................................................................................................. 12
FIGURE 1.5: FISSION CROSS SECTIONS FOR URANIUM-235, URANIUM-238 AND PLUTONIUM-239 ...................................... 13
FIGURE 1.6: CAPTURE CROSS SECTIONS FOR THORIUM-232 AND URANIUM-238.................................................................. 14
FIGURE 1.7: THE REPRODUCTION FACTOR K ........................................................................................................................... 17
FIGURE 2.1: HISTORICAL PRICES FOR URANIUM ..................................................................................................................... 24
FIGURE 2.2: HISTORICAL SPOT PRICES FOR URANIUM ............................................................................................................ 25
FIGURE 2.3: DISTRIBUTION OF URANIUM RESOURCES BY COUNTRY ...................................................................................... 26
FIGURE 2.4: DISTRIBUTION OF THORIUM RESOURCES BY COUNTRY ...................................................................................... 27
FIGURE 2.5: URANIUM PRODUCTION OF 2007 BY COUNTRY .................................................................................................. 27
FIGURE 2.6: ANNUAL PRODUCTION OF URANIUM .................................................................................................................. 28
FIGURE 2.7: URANIUM DEMAND BY REGION 2007 ................................................................................................................. 29
FIGURE 2.8: ANNUAL ENRICHMENT CAPACITY BY COUNTRY 2007 IN TSWU .......................................................................... 33
FIGURE 3.1: RANKINE CYCLE .................................................................................................................................................... 35
FIGURE 3.2: PRESSURIZED WATER REACTOR ........................................................................................................................... 41
FIGURE 3.3: PWR REACTOR CROSS-SECTION ........................................................................................................................... 42
FIGURE 3.4: HORIZONTAL CROSS SECTION OF PWR CORE ...................................................................................................... 43
FIGURE 3.5: CYCLIC PROCESS IN BWR ...................................................................................................................................... 45
FIGURE 3.6: BWR REACTOR ..................................................................................................................................................... 45
FIGURE 3.7: BWR FUEL ASSEMBLY EXAMPLE ........................................................................................................................... 46
FIGURE 3.8: RBMK-1000 .......................................................................................................................................................... 48
FIGURE 3.9: PRIMARY CYCLE OF CANDU REACTOR .................................................................................................................. 51
FIGURE 3.10: SCHEMATIC OF AGR ........................................................................................................................................... 53
FIGURE 3.11: LIQUID METAL FAST BREEDER REACTOR ............................................................................................................ 55
FIGURE 3.12: "POOL"-TYPE LMFBR .......................................................................................................................................... 56
FIGURE 3.13: TRAVELING WAVE REACTOR............................................................................................................................... 61
FIGURE 4.1: WASTE CLASSIFICATION ....................................................................................................................................... 64
FIGURE 4.2: PARTS OF USED FUEL ........................................................................................................................................... 70
FIGURE 4.3: CLASSIFICATION OF FISSION PRODUCTS .............................................................................................................. 72
FIGURE 4.4: BACK-END FUEL CYCLE CHOICES, WITH WORLDWIDE APPROXIMATED QUANTITIES .......................................... 74
FIGURE 5.1: CONSUMPTION AND PRODUCTION, FINLAND 2009 ............................................................................................ 76
FIGURE 5.2: CONSUMPTION AND PRODUCTION, SWEDEN 2009 ............................................................................................ 76
FIGURE 5.3: CONSUMPTION AND PRODUCTION DURING ONE WEEK TIME PERIOD HOURS .................................................. 77

vi
FIGURE 5.4: HISTORICAL WORLD ELECTRICITY CONSUMPTION .............................................................................................. 78
FIGURE 5.5: ELECTRICITY GENERATION BY SOURCE IN 2007 ................................................................................................... 79
FIGURE 5.6: ELECTRICITY GENERATION BY REGION ................................................................................................................. 80
FIGURE 5.7: HISTORICAL ENERGY CONSUMTION, CHINA AND INDIA ...................................................................................... 80
FIGURE 5.8: HDI AND ANNUAL ELECTRICTY USE PER CAPITA .................................................................................................. 83
FIGURE 5.9: CO2 EMISSIONS BY SOURCE AND BY FUEL 2006 (WRI, 2010) .............................................................................. 85
FIGURE 5.10: CO2 EMISSIONS BY REGION ................................................................................................................................ 85
FIGURE 5.11: CO2 EMISSIONS BY COUNTRY ............................................................................................................................. 86
FIGURE 5.12: HISTORICAL ELECTRICITY PRICES FOR CONSUMERS .......................................................................................... 90
FIGURE 5.13: HISTORICAL ELECTRICITY PRICES FOR INDUSTRY ............................................................................................... 90
FIGURE 6.1: RESOURCES LEFT WITH CURRENT RATE OF USE IN YEARS ................................................................................... 99
FIGURE 6.2: DISTRIBUTION OF COAL ..................................................................................................................................... 100
FIGURE 6.3: DISTRIBUTION OF NATURAL GAS ....................................................................................................................... 100
List of Tables
TABLE 1.1: DECAY EXAMPLES ..................................................................................................................................................... 7
TABLE 1.2: THRESHOLD ENERGIES ............................................................................................................................................. 9
TABLE 2.1: URANIUM CONCENTRATIONS CLASSES .................................................................................................................. 22
TABLE 2.2: URANIUM RESOURCES 2005 AND 2007 BY PRICE .................................................................................................. 23
TABLE 3.1:MODERATING POTENTIALS OF DIFFERENT MATERIALS .......................................................................................... 38
TABLE 3.2:POSSIBLE RADIOACTIVE SUBSTANCES ON BWR TURBINE ....................................................................................... 47
TABLE 3.3:OPERATING POWER PLANTS BY DESIGN 2010 ........................................................................................................ 57
TABLE 3.4: POWER PLANTS UNDER CONSTRUCTION BY DESIGN, 2010 ................................................................................... 60
TABLE 5.1: ENERGY DEMAND IN 2050 IN PERCENTS OF DEMAND TODAY .............................................................................. 84
TABLE 5.2: ESTIMATED COSTS OF FRONT-END URANIUM FUEL CYCLE .................................................................................... 95
TABLE 5.3: LEVELIZED COSTS (€ CENTS /KWH) ......................................................................................................................... 96

vii
List of Constants and Variables
E = energy
m= mass
c = speed of light in vacuum = 299,792,458 m/s
= charge of proton = J
= electric constant ≈
r = distance between two particles
= vacuum of permittivity = MeV * fm
= mass of neutrons
m(aX) = atomic mass of the nucleus
Zm(1H) = proton and electron masses grouped together using 1H
,
= tax fraction
= capacity factor
= overnight capital cost of the plant
= price of money
= inflation
= time of construction of plant in years
= plant life time
= annual O&M costs per kilowatt
=cost of fuel per kilogram
= thermodynamic efficiency of the plant
= burnup of discharged fuel

1
Introduction
Wealth of humankind is closely related to energy. The progress and the welfare of a society have
always relied on supply of energy in convenient form. This has led to positive developments to
advance technology for energy utilization but also to conflict over limited resources.
Total generation of electrical energy in 2009 was 20093.6TWh. Approximately 14% of this
electricity was produced with 438 nuclear power plants, while electricity produced using fossil
fuel amounted to 68%. Nuclear power and fossil fuels accounted for 82% of the whole electricity
production, while this generation has been criticized heavily. The major problem of the nuclear
power industry is waste management and safety related issues, while coal is a huge source of
greenhouse gas emissions and air pollution. Both can therefore be seen as non-sustainable
energy forms. In the case of coal fired power plant, this assessment is easy to do: it emits huge
amounts of unwanted gases in to the atmosphere, uses vast amounts of nonrenewable resources
(coal) to produce electricity and has rather low efficiency per kilogram of coal. On the other hand,
nuclear power may or may not be looked at as non-sustainable, depending on the type of the
power plant and the choices in fuel cycle. The concern of this paper is first to introduce the
nuclear power plant and fuel cycle principles to the reader and then assess the sustainability of
the nuclear power plant.
The Structure of this thesis is as follows; in first chapter most important aspects of nuclear
physics for nuclear plant technology are explained. In the second chapter the source-end of
nuclear fuel cycle is introduced. Current and future technologies are presented in third chapter
with reasonable detail. The most problematic question is addressed in the fourth chapter, which
is devoted to the nuclear waste management. Chapter five concerns the economics of nuclear
plants and has a comparison with other feasible technologies. The sixth chapter is devoted to
assessment of sustainability.
2
1 Basic Nuclear Physics
The word “atom” was coined by Democritus 2400 years ago. He hypothesized matter being
formed out of small indivisible building blocks, which he called “atoms”. Not until early in the past
century was this theory validated; it is possible to divide matter in small pieces in such a way that
when divided further, it is not the same matter anymore. The atom is then made from protons,
neutrons and electrons. (Krane, 1988)
1.1 Terminology
The protons and neutrons (nucleons) constitute the nucleus (size & mass). The fundamental
charged particle in the nucleus is called proton, while the charge of proton is chosen to be
positive. The number of protons in the atom is depicted with the letter Z. The simplest atom,
hydrogen, has only 1 proton (Z=1), but it is not charged by nature. Hence, there has to be some
other particle outside of the nucleus to nullify the charge. This particle is electron; very small
(mproton = 1837 melectron), negatively charged particle in an orbit around the nucleus. The neutron
is a neutral particle in the nucleus and therefore it is not affected by the Coulomb forces, which is
a very important feature of the neutron. A neutron weighs slightly more than a proton, but the
difference (0,1%) is so small that it can be disregarded. (Krane, 1988)
The weight of the atom, the total mass number (number of nucleons, protons and neutrons, in the
nucleus), is referred to by the letter A. For a hydrogen atom, this is also 1 (A=1). Indicating
specific nuclear species, notation of
could be used. However, most of the time notation AX is
used, for example 235U. (Krane, 1988)
The difference between hydrogen 1H, Deuterium 2H and Tritium 3H is the neutron count. Atoms
with the same number of protons, but different neutron number, are said to be isotopes. Isotopes
share the chemical properties, but their nuclear properties are different. For example, uranium
has 10 different isotopes (mass numbers from 232 to 241). Many of these isotopes can be only
made through nuclear reactions and they decay quickly towards more stable form. These isotopes
are called radioisotopes. (Krane, 1988)

3
1.2 Units and dimensions
Useful length in the nuclear level is a femtometer (fm), which is m (Suppes & Storvick,
2007). Diameters range from 1 fm for a proton, and neutron, to 7 fm of the heaviest nuclei
(Suppes & Storvick, 2007). By contrast, the average diameter of atom is close to m,
more than 25,000 times the size of nucleus, while most of this space is taken up by the electron
orbit. (Suppes & Storvick, 2007). (Krane, 1988).
Time scales in the nuclear world vary greatly. Some nuclei decay to form another nucleus on the
time order of 10-20 seconds. There are however vast number of nuclei with lifetimes of minutes or
hours, but sometimes lifetimes can be more than millions of years or longer for stable elements.
(Krane, 1988)
Energies in the nuclear level are measured with million electron volts (MeV), where 1 eV1 is the
energy gained by single unit of electronic charge when accelerated through a potential difference
of one volt. (Krane, 1988)
The unified atomic mass unit, u, is the measurement of mass in the nuclear level. It is defined so
that 12C weights 12 u, making one nucleon weigh 1 u. When reactions and decays are analyzed, it
is easier to have mass energies to work with, rather than mass itself. This is done by using
Einstein's famous formula
(1) E=mc²,
When using unified mass units the conversion can be done using factor of 1 u = 931.502 MeV.
(Krane, 1988)
1.3 Forces in the nucleus
The proton is a charged particle and therefore under influence of the Coulomb force. Every
nucleus should “explode” due to the Coulomb force, but there is a force which holds it together.
1 J

4
This force is called nuclear force and it affects every nucleon in the nucleus. As neutrons have no
charge, they are strongly pulled towards each other by the nuclear force, without any
counteracting force. They act as glue to the nucleus, holding it together. The nuclear force is very
strong, but it also acts over very short distance; about 1 fm. As the nuclear force has very short
range, it is possible to disintegrate the nucleus if enough energy is inserted into it. This property
of nucleus is used when fission of nucleus is induced. (Krane, 1988)
Coulomb potential can be calculated with equation
(2)
,
which gives the result of 1.44MeV2 in case of potential between two protons. Nuclear force has to
nullify this force to keep the nucleus together.
The binding energy of a nucleus is the difference in mass energies between a nucleus and its
individual building parts (neutrons and protons). If proton and electron masses are grouped
together, binding energy can be written as
(3) B=[Zm(1H) + – m(aX)]c² .
For example, this calculation done for uranium-238 would result a reading of 623 MeV, which is
about 7.6 MeV per nucleon. For comparison, the result for iron (Fe-56) is 250 MeV. When the
nuclear force is greater than the Coulomb force, the atom is stable. The nuclear force increases
linearly with A, but Coulomb force increases faster, close to Z². Hence, the ratio of nucleons,
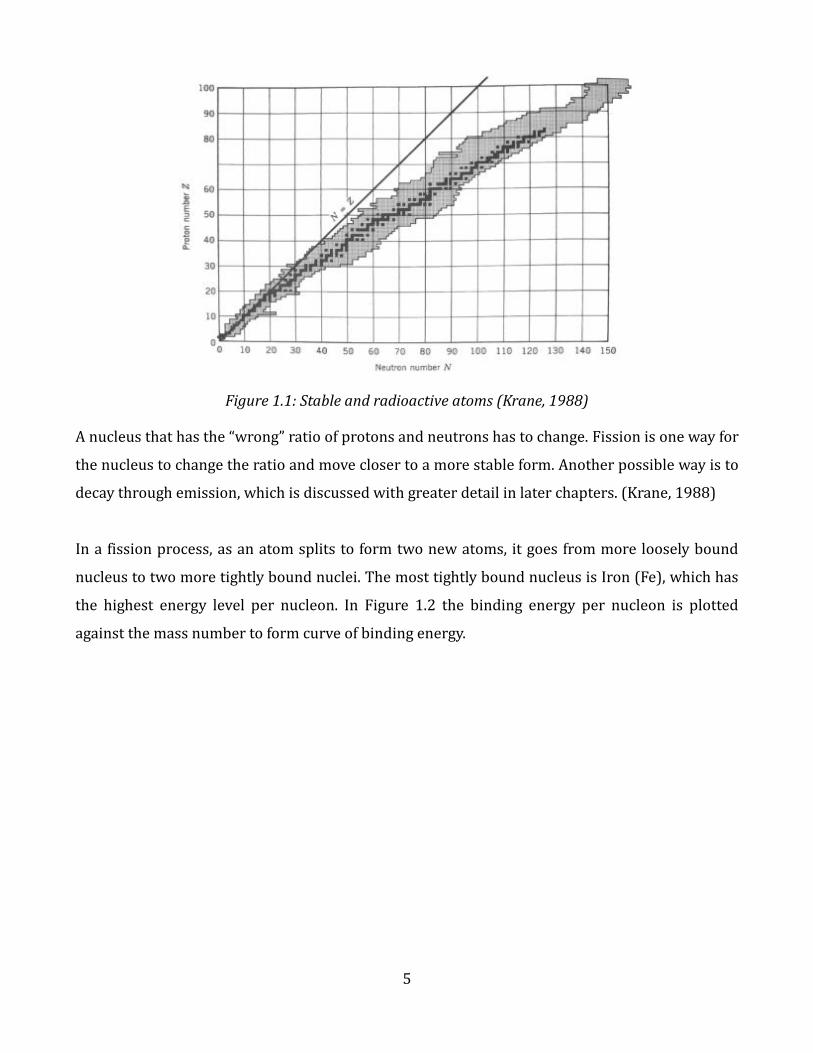
protons and neutrons, determines the stability of the nucleus. In Figure 1.1, proton number is
plotted against neutron number, showing stable atoms in black and radioactive atoms in grey.
2
5
Figure 1.1: Stable and radioactive atoms (Krane, 1988)
A nucleus that has the “wrong” ratio of protons and neutrons has to change. Fission is one way for
the nucleus to change the ratio and move closer to a more stable form. Another possible way is to
decay through emission, which is discussed with greater detail in later chapters. (Krane, 1988)
In a fission process, as an atom splits to form two new atoms, it goes from more loosely bound
nucleus to two more tightly bound nuclei. The most tightly bound nucleus is Iron (Fe), which has
the highest energy level per nucleon. In Figure 1.2 the binding energy per nucleon is plotted
against the mass number to form curve of binding energy.

6
From Figure 1.2 few things can be seen:
1) The most tightly bound atoms are around mass number 56.
2) By moving towards this mass number, energy can be released.
3) The amount of energy released is the difference between energy per nucleon: if two
hydrogen atoms with mass number 2 would undergo fusion, the energy release would be
very big compared to the size of the atoms.
4) The energy release from fission of uranium-235 to two more tightly bound atoms does
not seem to have huge potential when compared to fusion. However, as it will be seen, the
energy released from one fission process with uranium-235 is very large due to large
number of nucleons.
1.4 Decay
In this chapter, three decay types are discussed. These are alpha decay, beta decay and gamma
decay. Although spontaneous fission is one possible way for the atom to go to a lower energy
level, it is very rare and not discussed in this section. Transuranic elements Fm-256 (half-life
2.6h) and Cf-254 (half-life 60.5 days) can be used as example of an atom that fissions
Figure 1.2, curve of binding energy (Krane, 1988)
7
spontaneously. Induced fission is presented in next section of this chapter.
1.4.1 Half-life
The activity of radioactive substance decreases exponentially with time. This phenomenon is
statistical by nature. It is not possible to tell when an individual atom will decay, but as a sample,
it is possible to tell when half of the atoms in the sample have disintegrated to more stable form.
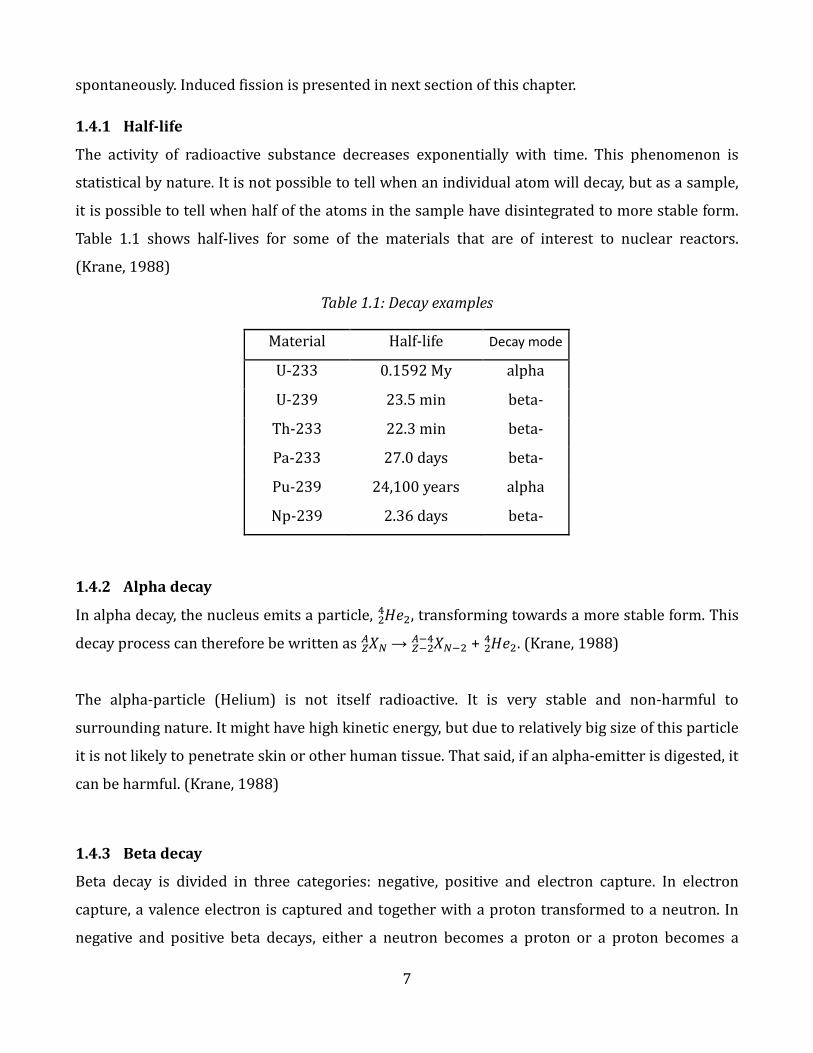
Table 1.1 shows half-lives for some of the materials that are of interest to nuclear reactors.
(Krane, 1988)
Table 1.1: Decay examples
Material Half-life Decay mode
U-233 0.1592 My alpha
U-239 23.5 min beta-
Th-233 22.3 min beta-
Pa-233 27.0 days beta-
Pu-239 24,100 years alpha
Np-239 2.36 days beta-
1.4.2 Alpha decay
In alpha decay, the nucleus emits a particle,
, transforming towards a more stable form. This
decay process can therefore be written as
→
+
. (Krane, 1988)
The alpha-particle (Helium) is not itself radioactive. It is very stable and non-harmful to
surrounding nature. It might have high kinetic energy, but due to relatively big size of this particle
it is not likely to penetrate skin or other human tissue. That said, if an alpha-emitter is digested, it
can be harmful. (Krane, 1988)
1.4.3 Beta decay
Beta decay is divided in three categories: negative, positive and electron capture. In electron
capture, a valence electron is captured and together with a proton transformed to a neutron. In
negative and positive beta decays, either a neutron becomes a proton or a proton becomes a

8
neutron, respectively, with emission of an electron or a positron. With these processes atom can
have the same mass number (A) and slide down or up in the table of nuclear properties. This
emitted particle is called beta-particle. These processes can thus be written:
n → p + e⁻ + antineutrino negative beta decay (b⁻)
p → n + e⁺ + neutrino positive beta decay (b⁺)
p + e⁻ → n electron capture
If differences in mass energies of the states are known, energy release in negative beta decay
process can be calculated. For example, when Bi-210 decays to Po-210 released energy amounts
to 1.161MeV. Energy is in the form of kinetic energy in the electron and therefore can contribute
in the substance as heat. (Krane, 1988)
As the electron has very small mass, even with high velocities, it cannot penetrate solids. A
window or plastic cover stops beta-particles effectively. Similarly to alpha-particles, beta particle
can potentially be harmful, if digested. (Krane, 1988)
1.4.4 Gamma decay
Gamma decay differs from the other decay modes by not emitting a charged particle from the
nucleus. Gamma-rays are photons; they are short energetic waves, similar to x-rays and visible
light. Emission of gamma-ray happens usually after fission, alpha decay, beta decay or other
nuclear reaction. (Krane, 1988)
Gamma-radiation is more harmful to humans as it is able to penetrate as much as two meters of
concrete. Gamma rays are more powerful than x-rays and pose similar problems when time of
exposure to gamma-radiation is long. (Krane, 1988)
1.4.5 Relevance to nuclear reactors
Many heavy nuclei decay through alpha decay process, but even though alpha decay is important,
in nuclear reactor the fission products usually have excess amount of neutrons. Due to this,
fission products usually decay through beta decay. As mentioned, gamma-decay is usually
involved in decay- or fission-process and therefore very common in nuclear reactor. All of these
decay processes contribute by generating heat, as seen also in used nuclear fuel, which continues

9
to produce heat after taken from a nuclear reactor. (Krane, 1988)
1.5 Fission
The relative strength of the Coulomb force and the nuclear force decides the fate of the atom. A
single neutron can enter the nucleus to change this ratio and potentially change the forces in such
a way that the nucleus fissions or decays to another element. In practice, only neutron can enter
the nucleus as it is electrically neutral. The proton, is charged and therefore it is hard to get it
collide with the nucleus.
1.5.1 Fission energies
In its natural state, energy has to be added to the nucleus to produce fission. In the case of the
uranium-235, 6.2 MeV has to be added to uranium-236 to have a fission process. Table 1.2 shows
the threshold energy and the amount of energy that one neutron brings into different materials.
Table 1.2: Threshold energies (Krane, 1988)
Material Threshold energy Energy added by neutron Difference
Thorium-232 7.5 MeV 5.4 MeV -2.1 MeV
Uranium-238 7.0 MeV 5.5 MeV -1.5 MeV
Uranium-235 6.2 MeV 6.5 MeV +0.3 MeV
Uranium-233 6.0 MeV 7.0 MeV +1.0 MeV
Plutonium-239 5.0 MeV 6.6 MeV +1.6 MeV
Naturally, materials which have positive difference are fissile materials. (U.S Department of
Energy, 1993)
1.5.2 Fission products

10
As induced fission occurs, the atom disintegrates into two smaller pieces. It would be expected
that both of these fission products to have similar A, but this is not the case. The fission product
mass distribution is closer to 2/3 and 1/3. The average sizes of fission products are therefore A1
= 95 and A2 = 140. This distribution, which has major implications for the composition of nuclear
waste, is shown in Figure 1.3.
As it is seen from Figure 1.3, the two peaked distribution has to be symmetric: for every light
particle coming out of the fission-process, there has to be a heavy particle. It is known that two
peaked distribution of the fission products is property of low-energy fission. In high energy
induced fission processes, the masses of products from fission seem to have a single peaked
distribution. (Krane, 1988)
1.5.3 Emitted neutrons
One very important part of induced fission is the capability to have a chain reaction. A chain
reaction is possible, when there are neutrons available to induce fission themselves and continue
Figure 1.3: Distribution of fission products (Krane, 1988)
11
the chain.
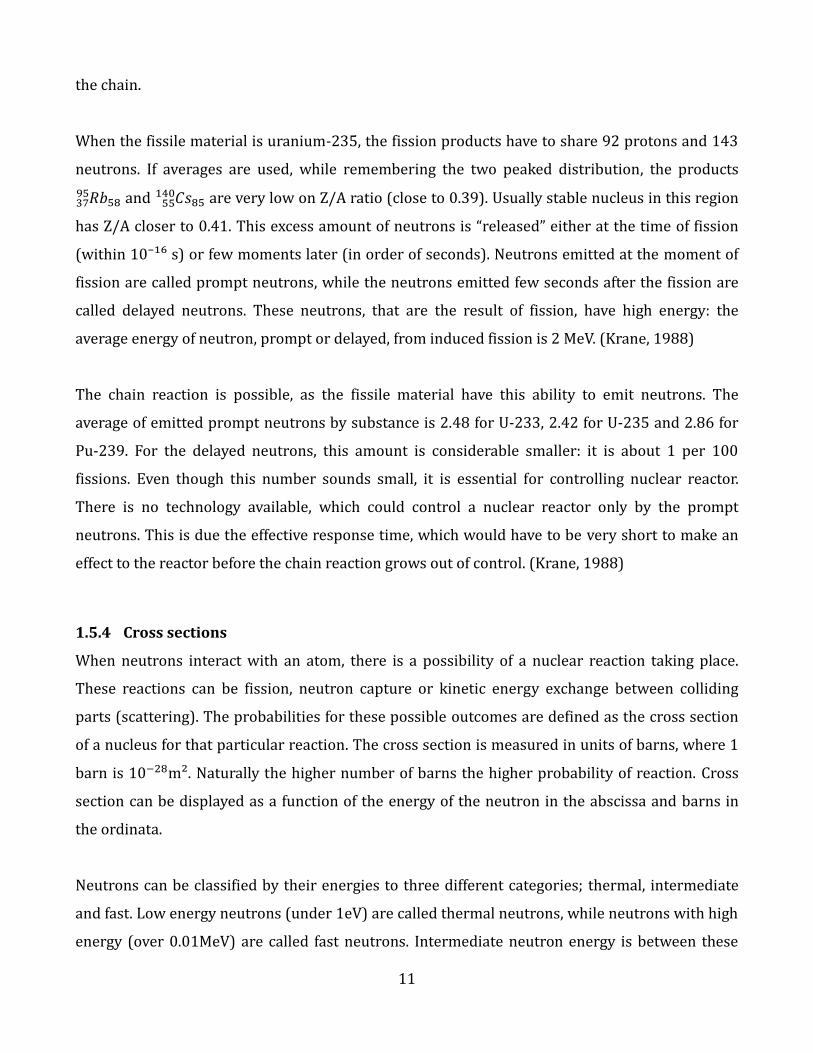
When the fissile material is uranium-235, the fission products have to share 92 protons and 143
neutrons. If averages are used, while remembering the two peaked distribution, the products
and
are very low on Z/A ratio (close to 0.39). Usually stable nucleus in this region
has Z/A closer to 0.41. This excess amount of neutrons is “released” either at the time of fission
(within 10⁻¹⁶ s) or few moments later (in order of seconds). Neutrons emitted at the moment of
fission are called prompt neutrons, while the neutrons emitted few seconds after the fission are
called delayed neutrons. These neutrons, that are the result of fission, have high energy: the
average energy of neutron, prompt or delayed, from induced fission is 2 MeV. (Krane, 1988)
The chain reaction is possible, as the fissile material have this ability to emit neutrons. The
average of emitted prompt neutrons by substance is 2.48 for U-233, 2.42 for U-235 and 2.86 for
Pu-239. For the delayed neutrons, this amount is considerable smaller: it is about 1 per 100
fissions. Even though this number sounds small, it is essential for controlling nuclear reactor.
There is no technology available, which could control a nuclear reactor only by the prompt
neutrons. This is due the effective response time, which would have to be very short to make an
effect to the reactor before the chain reaction grows out of control. (Krane, 1988)
1.5.4 Cross sections
When neutrons interact with an atom, there is a possibility of a nuclear reaction taking place.
These reactions can be fission, neutron capture or kinetic energy exchange between colliding
parts (scattering). The probabilities for these possible outcomes are defined as the cross section
of a nucleus for that particular reaction. The cross section is measured in units of barns, where 1
barn is m². Naturally the higher number of barns the higher probability of reaction. Cross
section can be displayed as a function of the energy of the neutron in the abscissa and barns in
the ordinata.
Neutrons can be classified by their energies to three different categories; thermal, intermediate
and fast. Low energy neutrons (under 1eV) are called thermal neutrons, while neutrons with high
energy (over 0.01MeV) are called fast neutrons. Intermediate neutron energy is between these

12
two. (U.S Department of Energy, 1993).
In first of three cross section figures (1.4) uranium-235 cross sections are displayed: scattering,
fission, and capture cross sections are plotted against neutron energy. Below it, in Figure 1.5
fission cross sections for 238U, 239Pu and 235U are shown. In Figure 1.6 neutron capture cross
sections for uranium-238 and thorium-232 are displayed.
Figure 1.4: cross sections for uranium-235 (National Nuclear Data Center, 2009)
As explained before, the kinetic energy of a neutron needed to induce fission process in uranium-
235 is zero. At higher energy scattering comes more probable than fission. Only elastic scattering
is shown in the figure as the cross section for inelastic scattering is considerable lower. In an
elastic process, all energy remains in form of kinetic energy (Krane, 1988). In an inelastic process
some energy is changed to internal process of other or both colliding particles (Krane, 1988).
13
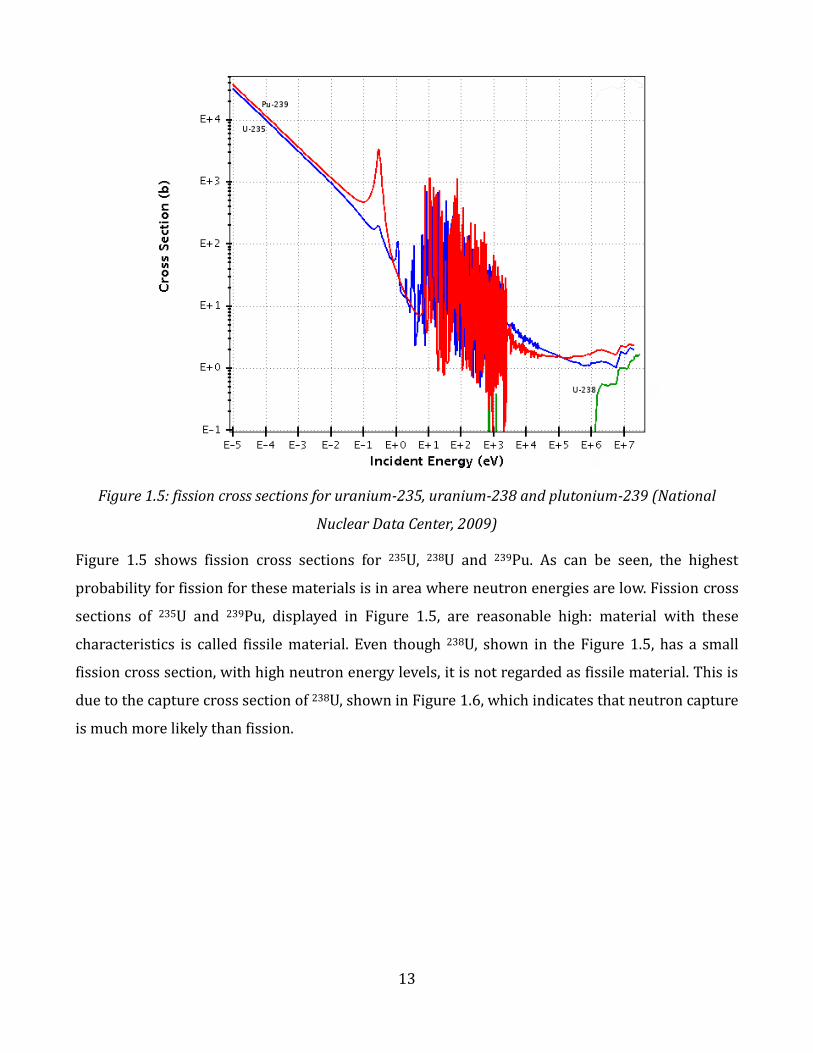
Figure 1.5: fission cross sections for uranium-235, uranium-238 and plutonium-239 (National
Nuclear Data Center, 2009)
Figure 1.5 shows fission cross sections for 235U, 238U and 239Pu. As can be seen, the highest
probability for fission for these materials is in area where neutron energies are low. Fission cross
sections of 235U and 239Pu, displayed in Figure 1.5, are reasonable high: material with these
characteristics is called fissile material. Even though 238U, shown in the Figure 1.5, has a small
fission cross section, with high neutron energy levels, it is not regarded as fissile material. This is
due to the capture cross section of 238U, shown in Figure 1.6, which indicates that neutron capture
is much more likely than fission.

14
Figure 1.6: capture cross sections for thorium-232 and uranium-238 (National Nuclear Data Center,
2009)
The capture cross sections for 238U and 232Th are relatively large in high energy neutron region
(over 0.01MeV). 238U and 232Th in Figure 1.6 are important, because when capturing neutron,
they transform to 239Pu and 233U, respectively. This transmutation has now changed the
previously non-fissile material to fissile material. Material which has this ability to capture and
then mutate to fissile material is called fertile material. (Krane, 1988)
As mentioned before, there are three regions; thermal neutron region, intermediate energy
region and fast neutron region. Because neutrons emitted during fission process have 2 MeV of
energy on average, they have to be slowed down if the desired region of interaction is any other
than fast region. This manipulation is called moderation. The high resonance region in Figure 1.6
in intermediate neutron energies is worth noting as they affect the running of a conventional
nuclear reactor by capturing neutrons when they are moderated to produce thermal neutrons.
15
1.5.5 Neutron fate calculations
When a nuclear reactor is producing heat, the amount of neutrons should be “just right”. If there
are not enough neutrons at the right energy level, the reactor will shut down due to neutron
deficit. In the case of too many neutrons at the right energy level, reactions will grow
exponentially with the number of excess neutrons available. Mathematically, this can be defined
as neutron reproducing factor k. When k is exactly 1, reactor is said to be critical. If k>1 it is
supercritical and k<1 subcritical. To describe the reproducing factor k, the fate of neutrons has to
be put in mathematical terms.
Let’s assume that chain reaction grows in turns, so that we have a first generation of neutrons,
then second and so on. N is the amount of thermal neutrons in the first generation. If ν is defined
to be the average number of fast neutrons produced from one fission process, the second
generation maximum of fast neutrons is νN. In reality, this is not possible to achieve; neutrons are
captured or they leak out of the reactor.
The probability of a thermal neutron inducing a fission process can be calculated if the material
and the cross sections for this material are known. is defined to be the average number of fission
neutrons produced by original thermal neutron. If every fission process produces ν neutrons on
average, it is clear that < ν since not every neutron causes fission. If cross sections for fission are
marked by and absorption is represented by , equation 4 can be written3:
(4)
If the material used in a reactor is uranium, it can be natural uranium or enriched uranium. As
natural uranium has low amount of fissile material, it can be manipulated to accommodate more
fissile atoms. This process to increase amount of fissile atoms in uranium is called enrichment.
For example, uranium used in commercial reactor is approximately 95% of 238U and 5% of 235U.
The following calculation is made assuming 95%-5% division of 238U and 235U. The cross section
for thermal neutron fission is 584 b for 235U and 0 b for 238U. The capture cross section is 97 b for
235U and 2.75 b for 238U. With this data, cross sections for this material can be calculated.
3
presents relative probability for a neutron to cause fission

16
Fission of 235U produces 2.42 neutrons on average. Now equation 4 can be used to calculate . In
this composition of fuel is 1.927. If natural uranium is used (99.28 of 238
U and 0.72 of 235
U), this
value is 1.33. It is evident from these numbers that if natural uranium used, the neutron economy
has to be very good, with enriched material there is more “room” to lose neutrons and still have
critical reactor. (Krane, 1988)
The first generation of N thermal neutrons has now produced N fast neurons. There is small
cross section for fission in 238U, about 1b. This factor has to be added and it is represented by ε,
which has value about 1.03 in natural uranium. Hence, there is now Nε of second generation fast
neutrons. To reduce the energies of neutrons, they have to be moderated. Because of resonance
capture region of 238U, the neutrons have to go from high energy to low energy without being in
contact with uranium. Therefore fuel and moderator cannot be mixed. If graphite is used as
moderator, 100 collisions involving neutron and 12C are needed to achieve low energy neutrons.
In practice, to achieve this many collisions, a neutron has to travel 19 cm in graphite to become
thermal. Even though a neutron is travelling through the moderator and coming out as thermal
neutron, resonance region capture cannot be fully eliminated and it has to be accounted for in the
calculations. This factor is marked by ρ and has a value of 0.9. There is also possibility of capture
in graphite (0.0034b) or in other elements of reactor. Zircaloy is usually used in fuel cladding,
because of the low cross section, but there are fission products and other possible substances for
neutron absorption. Thermal utilization factor f is the variable added to the equation to
accommodate this loss. It has typically value of 0.9. (Krane, 1988)
Taking this into account the N thermal neutrons of the 1st generation have now produced ερfN
themal neutrons in the 2nd
generation. Equation now represents the amount of neutrons available for
fission in an infinite reactor. When leakage of fast and thermal neutrons is added, and
respectively, reproduction factor can be written
(5)
This calculation is crude example, but it can be made more accurate by calculating every variable
17
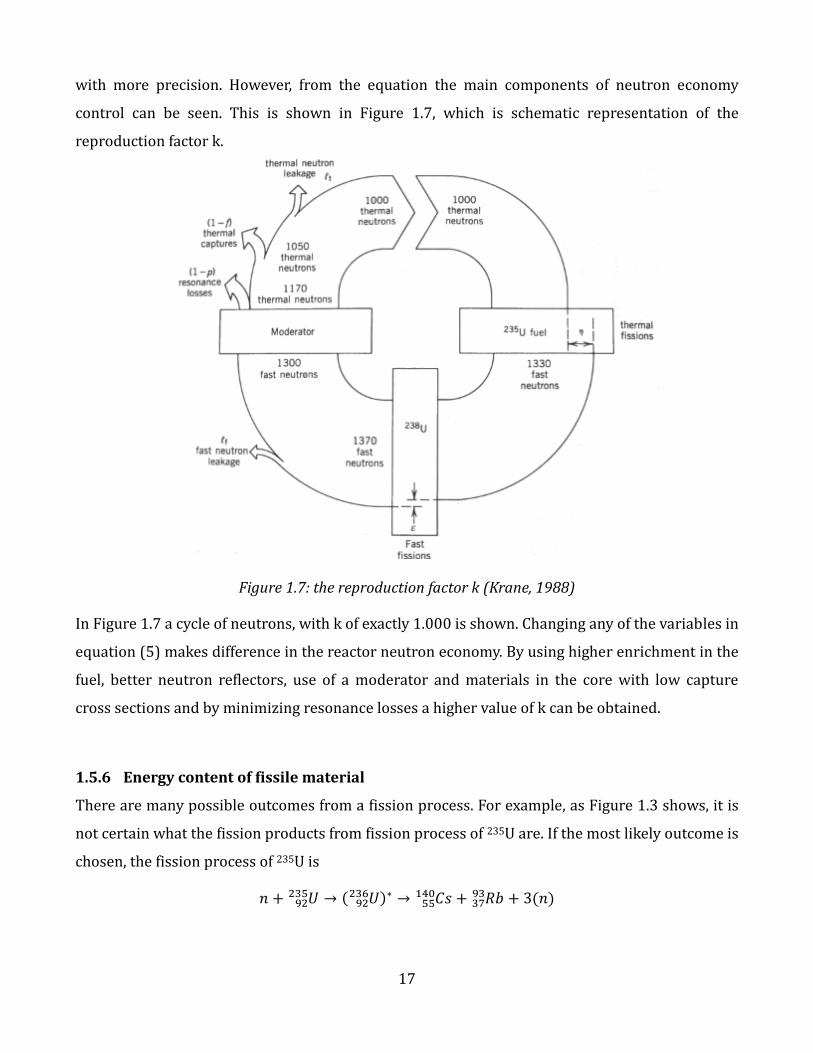
with more precision. However, from the equation the main components of neutron economy
control can be seen. This is shown in Figure 1.7, which is schematic representation of the
reproduction factor k.
Figure 1.7: the reproduction factor k (Krane, 1988)
In Figure 1.7 a cycle of neutrons, with k of exactly 1.000 is shown. Changing any of the variables in
equation (5) makes difference in the reactor neutron economy. By using higher enrichment in the
fuel, better neutron reflectors, use of a moderator and materials in the core with low capture
cross sections and by minimizing resonance losses a higher value of k can be obtained.
1.5.6 Energy content of fissile material
There are many possible outcomes from a fission process. For example, as Figure 1.3 shows, it is
not certain what the fission products from fission process of 235U are. If the most likely outcome is
chosen, the fission process of 235U is
18
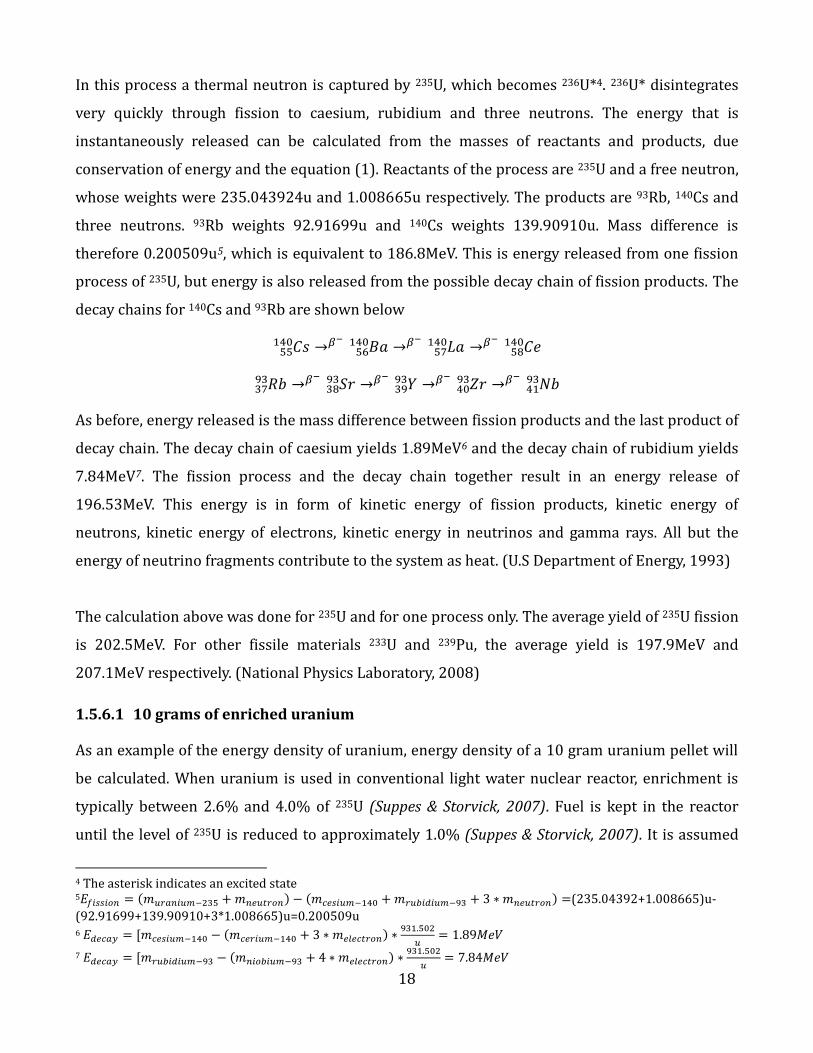
In this process a thermal neutron is captured by 235U, which becomes 236U*4. 236U* disintegrates
very quickly through fission to caesium, rubidium and three neutrons. The energy that is
instantaneously released can be calculated from the masses of reactants and products, due
conservation of energy and the equation (1). Reactants of the process are 235U and a free neutron,
whose weights were 235.043924u and 1.008665u respectively. The products are 93Rb, 140Cs and
three neutrons. 93Rb weights 92.91699u and 140Cs weights 139.90910u. Mass difference is
therefore 0.200509u5, which is equivalent to 186.8MeV. This is energy released from one fission
process of 235U, but energy is also released from the possible decay chain of fission products. The
decay chains for 140Cs and 93Rb are shown below
As before, energy released is the mass difference between fission products and the last product of
decay chain. The decay chain of caesium yields 1.89MeV6 and the decay chain of rubidium yields
7.84MeV7. The fission process and the decay chain together result in an energy release of
196.53MeV. This energy is in form of kinetic energy of fission products, kinetic energy of
neutrons, kinetic energy of electrons, kinetic energy in neutrinos and gamma rays. All but the
energy of neutrino fragments contribute to the system as heat. (U.S Department of Energy, 1993)
The calculation above was done for 235U and for one process only. The average yield of 235U fission
is 202.5MeV. For other fissile materials 233U and 239Pu, the average yield is 197.9MeV and
207.1MeV respectively. (National Physics Laboratory, 2008)
1.5.6.1 10 grams of enriched uranium
As an example of the energy density of uranium, energy density of a 10 gram uranium pellet will
be calculated. When uranium is used in conventional light water nuclear reactor, enrichment is
typically between 2.6% and 4.0% of 235U (Suppes & Storvick, 2007). Fuel is kept in the reactor
until the level of 235U is reduced to approximately 1.0% (Suppes & Storvick, 2007). It is assumed
4 The asterisk indicates an excited state 5 (235.04392+1.008665)u-
(92.91699+139.90910+3*1.008665)u=0.200509u 6
7
19
that in the start uranium pellet has 4.0% enrichment and 1.0% enrichment at the end, thus 0.3
grams of 235U are “burned”.
The average amount of energy per fission is known and in 0.3 grams of 235U has approximately
235U atoms8. A rough estimate about the energy of this 10 gram pellet is 24.937MJ.
Oil has energy density of 46.3MJ/kg, so 10 grams of oil has 463KJ of potential energy. Nuclear
reactor fuel has therefore 53 times the energy content by weight compared to oil. Since uranium
is much heavier than oil, this difference is even greater when comparing by volume.
1.6 Radiation measurements
Radioactivity is a property of an element that decays to form another element of isotope. This
spontaneous change in the structure of the atom usually accompanied by the emission of alpha or
beta particle and/or gamma rays. The rate at which the material is decaying is called the activity
of the material. This activity is measured in curies, one curie being 37 billion disintegrations per
second. (Suppes & Storvick, 2007)
Nuclear radiation is often called ionizing radiation. This is because nuclear radiation can ionize
atoms by interaction between radiation and electrons. The volume of ionized atoms produced
depends on the energy of the emission. For example, it takes 34 eV to produce one ion in air, so a
1-MeV gamma-ray can produce about 30,000 ions. (Krane, 1988)
Exposure to radiation is therefore connected to 1) how fast the emitting material is
disintegrating, 2) how much energy is involved in this disintegration and 3) distance from the
radiating source. The effect of the exposure also depends on the energy absorption of the
material that is exposed to radiation. The standard for measuring effects of radiation in different
materials is called “absorbed dose” and marked with D. It is defined as energy deposited in
absorbing material per unit mass of material. The SI unit for absorbed dose is gray (Gy). A more
commonly used unit is rad, one rad equaling to 0.01Gy. (Krane, 1988)
8

20
When discussing decay processes in the decay section of this chapter, it was mentioned that
alpha-particles have very low penetrating energy, beta-particles have longer paths and gamma-
rays are stopped only by few meters of concrete. An alpha-particle gives up its energy, and stops,
in rather short distance (Krane, 1988). This energy release is therefore rapid and large (Krane,
1988). On the contrary, beta-particles and gamma-rays give up their energy in longer period of
time, losing energy steadily before stopping (Krane, 1988). Hence, for a biological system, 1 rad
of alpha-radiation is far more dangerous than same amount of gamma- or beta-radiation (Krane,
1988). The quality factor (QF) is used to measure how much energy of given type of radiation is
deposited per unit path length (Krane, 1988). Radiation that deposits small amounts of energy
per unit path length has low QF and radiation that deposits large amounts of energy per unit path
length has a high QF (Krane, 1988).
The damage caused by radiation to biological system depends on the absorbed dose (D) and the
quality factor (QF) of the radiation. Multiplying these two factors results in a “dose equivalent”,
which is measured in rems (roentgen equivalent man), when D is in rads, and in sieverts (Sv),
when D is in Gy. (Krane, 1988)
The International Commission on Radiation recommends that annual whole-body absorbed dose
is under 0.5 rems per year for public and 5 rem for those who work with radiation (Krane, 1988).
Radiation seen on earth is not completely man made. Natural background sources, such as
naturally occurring radioactive isotopes and cosmic rays equal to about 0.1-0.2 rems per year
(Krane, 1988). Natural exposure levels also vary greatly from place to other, depending on the soil
and the elevation of the location (U.S. NRC, 2004). From manmade sources, a typical chest x-ray is
about 0.05 rems, dental x-ray is about 0.002 rems and industrial activities add up to 0.003 rems
(U.S. NRC, 2004). Consumer products, like smoke detectors, tobacco, fertilizer and luminous
watch dials make another 0.001 rems (U.S. NRC, 2004). Natural background radiation contributes
approximately 82% of exposure and medical procedures account for the rest (U.S. NRC, 2004).
Total average radiation exposure for citizen of United States was 0.036 rems (U.S. NRC, 2004).

21
1.6.1 Biological effects of radiation
It is hard to detect effects of small radiation doses, because there are too many variables that
affect the health of an individual (U.S. NRC, 2004). Cancers that develop as a result of radiation
are indistinguishable from cancers that are not related to radiation (U.S. NRC, 2004). It is known
that there is a high possibility of death if exposed to short-term dose of 100 rems, but the effects
of long-term low-level doses are still not known (Krane, 1988).
In case of exposure to radiation, atoms are ionized and they may change the chemical structure of
biological cell. Three possible outcomes from a change in the cell are: 1) the cell repairs itself,
leaving no damage to be seen, 2) the cell dies and is replaced by normal biological process, 3) the
cell repairs itself incorrectly, resulting a biophysical change. (U.S. NRC, 2004)
High radiation doses are deadly to cells, while low doses can damage or alter DNA, the genetic
code of the cell. High doses are capable of killing great amount of cells at one time, so that the cell
repair system is not able to repair the damage, resulting in damage to organs or tissues triggering
Acute Radiation Syndrome. Every individual has a different response to high radiation dose and
therefore it is hard to say what amount of radiation is lethal for a human being. However, it is
thought that a dose to the whole body of 350-500 rems in a period of minutes to a few hours will
result in death for 50% of the population receiving this dose. Effects of low doses, fewer than 10
rems during years, do not cause immediate problems for human body. The problems will be
accounted in cell level and problems might surface after 5 to 20 years. (U.S. NRC, 2004)
22
2 Front-end of nuclear fuel cycle
2.1 Materials
2.1.1 Uranium
Uranium (U) is a metal, found in rocks and seawater (WNA, 2009). It has 92 protons and has
twenty five isotopes, from 217U to 242U (Hammond, 2000). Uranium is a rare metal, earth’s crust
containing 1,6ppm of uranium (Kaye & Laby, 2008). It is the 44th abundant element in the crust,
leaving behind elements like silver, cadmium and tin (Kaye & Laby, 2008). It can be found as a
part of numerous minerals, such as uraninite, carnonite, autinite, uranophane, davidite and
tobernite (Hammond, 2000). It also occurs in phosphate rock, lignite and monazite sands, which
are the most important sources for uranium metal (Hammond, 2000).
Uranium metal is a silvery-white, dense material with a melting point of 1135˚c. It is little bit
softer than steel and reacts easily with oxygen. Naturally occurring uranium contains isotopes
234, 235 and 238. By weight, natural uranium is composed of 0.0055% of 234U, 0.720% of 235U
and 99.2745% of 238U. Uranium is radioactive, although the most abundant isotope 238 has a
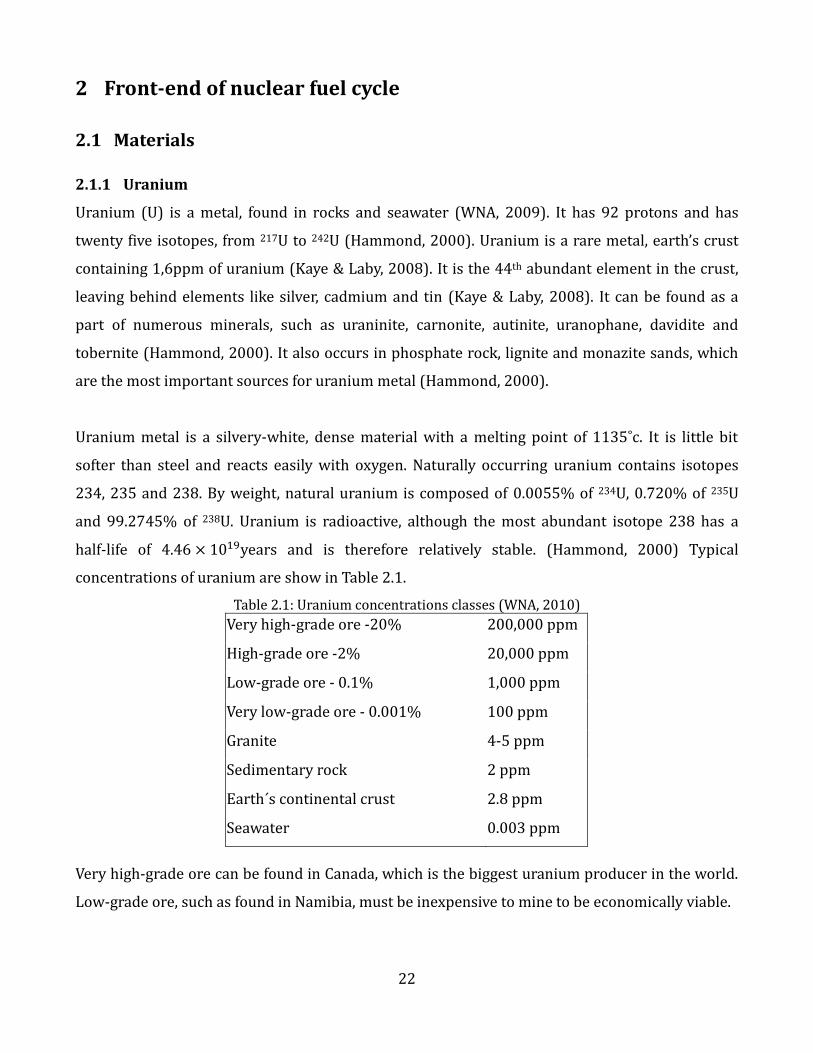
half-life of years and is therefore relatively stable. (Hammond, 2000) Typical
concentrations of uranium are show in Table 2.1.
Table 2.1: Uranium concentrations classes (WNA, 2010)
Very high-grade ore -20% 200,000 ppm
High-grade ore -2% 20,000 ppm
Low-grade ore - 0.1% 1,000 ppm
Very low-grade ore - 0.001% 100 ppm
Granite 4-5 ppm
Sedimentary rock 2 ppm
Earth´s continental crust 2.8 ppm
Seawater 0.003 ppm
Very high-grade ore can be found in Canada, which is the biggest uranium producer in the world.
Low-grade ore, such as found in Namibia, must be inexpensive to mine to be economically viable.
23
2.1.2 Thorium
Thorium (Th) is a silvery-gray metal, which is air-stable. It occurs in nature in a form of thorite
and thorianite. Thorium has melting point of 1750˚c and it is considered to be about three times
more abundant than uranium. Twenty seven isotopes can be found, with atomic masses of 212 to
237. Every isotope is radioactive. Thorium found in nature has 90 protons and 142 neutrons.
232Th has half-life of years. (Hammond, 2000)
As thorium is not yet used in a commercial nuclear reactor and is relatively abundant, thorium
resources are not discussed in high detail in this paper.
2.2 Uranium resources
It is obvious that the price of uranium, or any other scarce substance, is the main variable when
making decisions about exploring and mining. If the price of uranium is under $80 per kilogram,
recoverable resources are said to be about 4 456 000 tons (NEA, 2008). With a higher price, $130
per kilogram, these resources are said to be 5 469 000 tons (NEA, 2008). Total undiscovered
resources are speculated to be about 10 500 000 tons (NEA, 2008). It is therefore relevant to also
discuss the price of uranium, when discussing resources.
The Nuclear Energy Agency’s (NEA) “Red Book” has divided resources in to three categories:
recoverable under the price of $130, $80 or $40 per kilogram. Identified resources increase with
price as can be seen from Table 2.2.
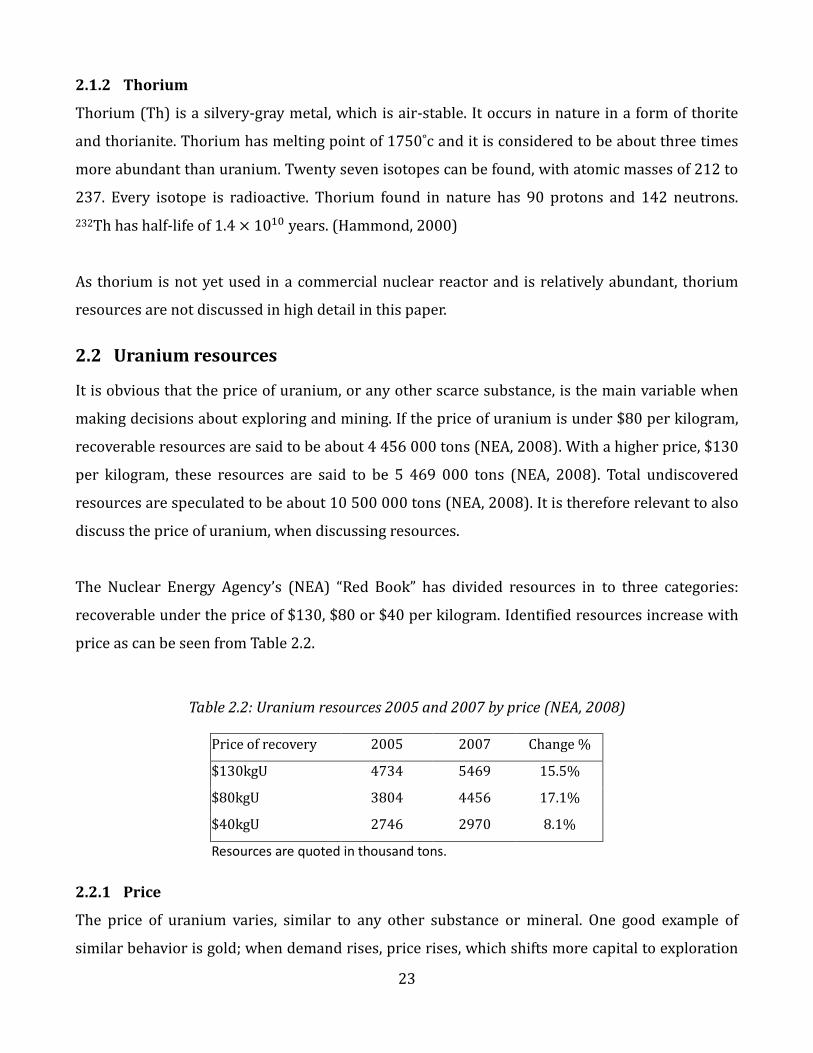
Table 2.2: Uranium resources 2005 and 2007 by price (NEA, 2008)
Price of recovery 2005 2007 Change %
$130kgU 4734 5469 15.5%
$80kgU 3804 4456 17.1%
$40kgU 2746 2970 8.1%
Resources are quoted in thousand tons.
2.2.1 Price
The price of uranium varies, similar to any other substance or mineral. One good example of
similar behavior is gold; when demand rises, price rises, which shifts more capital to exploration

24
and mining of deposits, that were uneconomical before. Figure 2.1 shows the real price9 of
uranium up to the year 2007 from different sources.
Figure 2.1: Historical prices for uranium (NEA, 2008)
Figure 2.1 is from long term contract prices. Two trends are easily seen from the figure; a trend of
slow price decrease from 1980 to 2002 and a trend of rapid increase in price from 2002 onwards.
Figure 2.2 shows uranium spot prices for the time period roughly from end of 2001 to end of
2007.
9 In 2007 dollars.
25
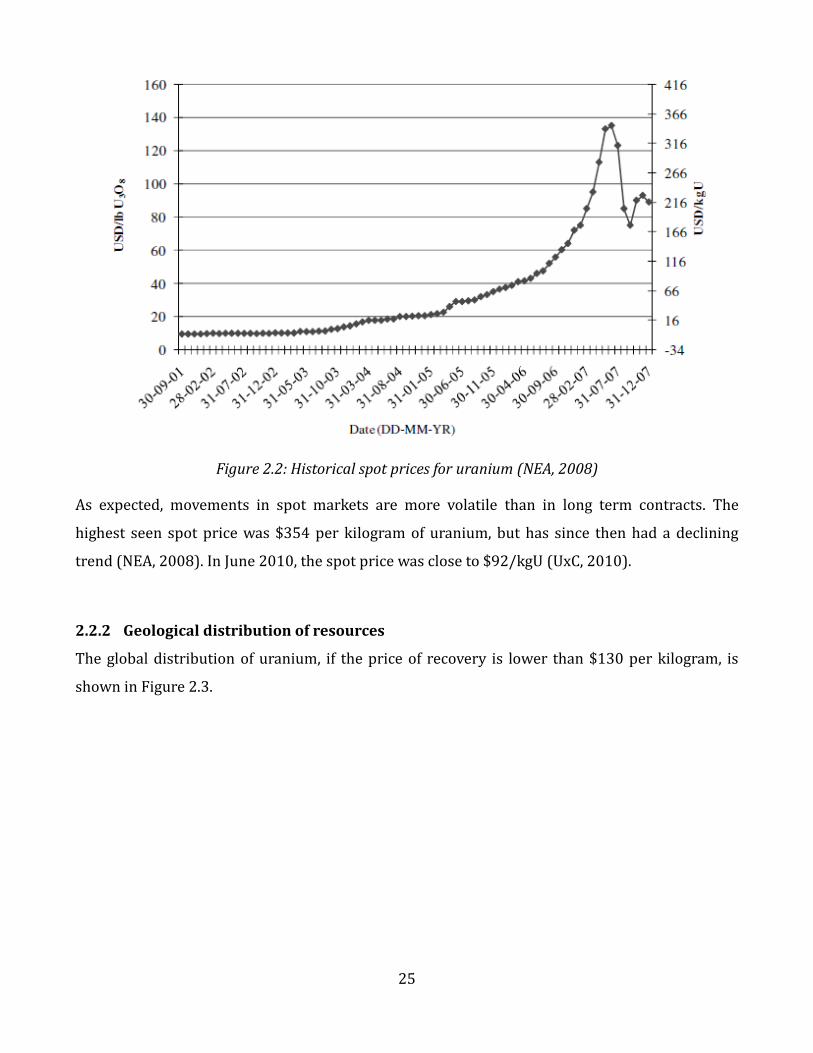
Figure 2.2: Historical spot prices for uranium (NEA, 2008)
As expected, movements in spot markets are more volatile than in long term contracts. The
highest seen spot price was $354 per kilogram of uranium, but has since then had a declining
trend (NEA, 2008). In June 2010, the spot price was close to $92/kgU (UxC, 2010).
2.2.2 Geological distribution of resources
The global distribution of uranium, if the price of recovery is lower than $130 per kilogram, is
shown in Figure 2.3.

26
Figure 2.3: Distribution of uranium resources by country (NEA, 2008)
As seen in Figure 2.3, 76% of all identified uranium reserves are located in seven countries. This
has an effect, as security of supply is important when dealing with any energy related issue.
However, the difference between nuclear fuel and fossil fuel is the energy density. It is fairly easy
to store big amounts of nuclear fuel for long periods of time. As will be seen in chapter 4, one
power plant consumes 23.4 tons of nuclear fuel in year on average. It is therefore possible to
transport nuclear fuel enough for ten years of production in five big trucks.
2.2.2.1 Thorium
Identified thorium resources are presented by location in Figure 2.4.
Australia; 23%
Kazakhstan; 15%
Russia; 10%
Canada; 8%
South Africa; 8%
United States; 6%
Brazil; 6%
Namibia; 5%
Niger; 5%
Ukraine; 4%
Other; 4%Uzbekistan; 2% India; 1,3% China; 1,2%

27
Figure 2.4: Distribution of thorium resources by country (NEA, 2008)
As in uranium reserves, a small number of countries hold the majority of all reserves. 83% of all
reserves are held by six countries, Australia having biggest reserves in both, uranium and
thorium.
2.3 Production of uranium
In 2007, 20 different countries were producing uranium, yielding a total production of 43 328
tons. Six of these countries were producing less than 100 tons of uranium. These six countries,
France, Germany, Hungary, Iran, Pakistan and Romania are listed under others in Figure 2.5.
Figure 2.5: Uranium production of 2007 by country (NEA, 2008)
Australia18%
USA16%
Turkey13%India
12%
Brazil12%
Venezuela12%
Norway5%
Egypt4%
Russia3%
Greenland2%
Canada2%
Others1%
Canada23%
Australia18%
Kazakhstan17%
Namibia9%
Niger8%
Russia8%
Uzbekistan5%
United States
5%
Ukraine2%
China2%
South Africa2%
Brazil1%
Czech Republic1%
India1%
Others0,46%

28
Once again, a small number of countries contribute 83% of all the production in the world.
Canada, Australia and Kazakhstan are producing over half (58%) of the uranium. Annual
production is presented in Figure 2.6 below.
Figure 2.6: Annual production of uranium (tons of uranium) (NEA, 2008)
Australia’s production has been decreasing, as mines have been experiencing difficulties. Canada
has had reduced output from mines, but Kazakhstan has increased production, yielding larger
production in 2007 than the year before.
Ownership of the uranium mines is mostly in the hand of domestic producers. Domestic mining
companies controlled 71.3% of the 2006 production. 46.2% of these companies were state
owned. Altogether 56.9% of the companies were privately owned, in both, domestic and non-
domestic sectors.
2.4 Consumption
Worldwide generation of electricity with nuclear power in 2007 was 2675.08TWh. Uranium
needed for this generation was 66 500 tons. Regional uranium demand is shown in Figure 2.7.
Canada Canada Canada Canada
Australia AustraliaAustralia Australia
Kazakhstan KazakhstanKazakhstan Kazakhstan
Namibia NamibiaNamibia
NamibiaNiger Niger
NigerNiger
Russia RussiaRussia
RussiaOthers Others
OthersOthers
0
5000
10000
15000
20000
25000
30000
35000
40000
45000
50000
2004 2005 2006 2007
ton
s o
f u
ran
ium

29
Figure 2.7: Uranium demand by region 2007 (NEA, 2008)
Western European demand was 27% of world uranium production in year 2007. However, it has
a generation capacity that equals 31% of world capacity. The reason for Western Europe having
smaller demand than installed capacity is due to the use of the closed fuel cycle. In North America
the open fuel cycle is used. These different fuel cycles are discussed more closely together with
nuclear waste in later chapter.
2.5 From the ground to nuclear reactor
The chain between uranium in deposits on the ground and uranium entering a nuclear reactor
can be divided in four parts; mining and milling, refining and conversion, enrichment and finally
fuel fabrication. Naturally, in cases where natural uranium or thorium is used, there is no need for
enrichment process.
2.5.1 Mining and milling
Natural uranium is mined in open-pit or underground mines (Lochbaum, 1996). The mineral that
is most commonly mined is called uraninite (pitchblende), which contains UO2, UO3 and other
materials like thorium oxide (ThO2) (MSoA, 2010). Uranium can be mined also in other forms, in
case it is economically feasible (Lochbaum, 1996). The principle uranium source is found in
sandstone beds. (Lochbaum, 1996)
Mining can be done conventionally by mining the ore and then shipping/transferring it to a
Western Europe
27%
North America37%
East Asia20%
Central, Eastern & South East
Europe14%
Central & South America
1%
Middle East, Central &
South East Asia1%
Africa0,42%

30
milling process or it can be done with process called in situ leaching (ISL).
2.5.1.1 Milling
Ore is ground and crushed, then treated with either sulfuric acid or sodium carbonate solution,
which dissolves uranium from the ore. This process is called leaching. Uranium, which is now
dissolved, is separated from solid waste by either using solvent extraction or an ion exchange
technique. It is then calcined to remove excess water, producing an end product of uranium
concentrate. This concentrate is called yellowcake and contains 70-90% of U3O8 by weight.
(Lochbaum, 1996)
2.5.1.2 ISL
In situ leaching is a similar leaching process to that used in a conventional milling chain, but as
the name suggest, it is done at the the location of sandstone deposit. Suitable leach is chosen and
then injected in to the sandstone. Dissolved uranium is then recovered through production wells.
The leach is usually sulfuric acid. (IAEA, 2001)
Conventional underground and open-pit mining contributed 57% of world uranium in 2009. In
situ leaching had a share of 36%, the rest of the uranium was produced as a by-product while
mining other materials. (WNA, 2010)
2.5.2 Refining and Conversion
Yellowcake (U3O8) is not used in nuclear power plants and the concentration of 235U in yellowcake
is lower than required in light water reactors. Therefore it needs to be refined and converted to a
form that it easy to enrich. This form is uranium hexafluoride (UF6). Uranium hexafluoride is
desired because it sublimates at low temperature (52.8˚c) and because fluoride has only one
stable isotope found in nature. (Lochbaum, 1996)
To produce uranium hexafluoride from yellowcake, it is transformed to uranyl nitrate solution,
usually diethyl ether or n-tributyl phosphate. This is done by treating yellowcake with nitric acid.
The pure uranyl nitrate is made to molten uranyl nitrate salt and converted to uranium trioxide
(UO3) from there by heating it in a furnace. It is treated with hydrogen gas in a fluidized bed with

31
high temperature (593.3˚c) to produce uranium dioxide (UO2). A fluidized bed is used again,
when hydrogen fluoride is reacting with UO2 to form uranium tetrafluoride. UF4 is placed in
elevated temperature and exposed to fluorine gas to produce UF6. UF6 is then ready for
enrichment. (Lochbaum, 1996)
The whole process can be written as U3O8+2H2=3UO2+2H2O
UO2+4HF=UF4+2H2O
UF4+F2=UF6 (WHO, 2001)
2.5.2.1 Enrichment
As discussed in the basics of nuclear physics, the neutron fate is depends on reactor structure and
fuel enrichment due to effective cross section of fuel (equation 4). Therefore, fuel enrichment has
a large effect on neutron economy. This is the main reason for the enrichment process.
The material entering the enrichment facility is composed 99.2745% of 238UF6 and 0.720% of
235UF6. The reason for using fluoride is now clearer; there cannot be different fluoride isotopes in
the molecule, as is the only available isotope. Hence, variation of weight of the molecule
depends only on the uranium atom. They can be separated by three different processes: gaseous
diffusion, gas centrifuge enrichment and laser enrichment.
2.5.2.1.1 Gaseous diffusion
The average velocity of gas molecules at given temperature is inversely proportional to their
mass. This property is used in gaseous diffusion, where gas is pumped through a chamber divided
into two sections by a thin membrane. This membrane has millions of small holes per cm2. The
pressure on the other side of the membrane is slightly lower and the speed of lighter molecules
(235UF6) is greater so they will hit this membrane more frequently. Therefore, they have higher
probability to hit a hole and go through to other side. (Lochbaum, 1996)
The difference in weight of uranium isotopes is small, meaning that this process has to be done
over and over again to produce enough enrichment. (Lochbaum, 1996)
2.5.2.1.2 Centrifuge
In centrifuge enrichment UF6 is put in to centrifuge, a cylinder where rotor spins the gas. In high

32
speed, heavier molecules (238UF6) are closer to the wall of centrifuge due centrifugal force, thus
separating these two uranium isotopes. The capacity of centrifuge is a function of rotor speed,
length of the rotor and the mass difference of uranium isotopes. The speed required can be close
to speed of sound. (Makhijani, Chalmers, & Smith, 2004)
While it is possible to produce higher enrichment using centrifuges rather than gaseous diffusion,
this process has to be also repeated to produce high enrichment. (Makhijani, Chalmers, & Smith,
2004)
2.5.2.1.3 Laser enrichment
Laser enrichment relies on powerful lasers, which can selectively ionize 235 isotopes. After
ionizing, positively charged molecules are separated from the stream (Makhijani, Chalmers, &
Smith, 2004).
2.5.2.1.4 Enrichment capacity
Currenly, 12 countries have ability to enrich uranium. Two of them are using gaseous diffusion
and 9 have chosen to enrich via centrifuges. China is a special case, as it has capacity to produce
enriched uranium with both techniques. (Falk & Bodman, 2007)
The capacity to enrich 235U percentage is measured in Separative Work Units (SWU)10. SWU
required to enrich uranium depends on the input and the output enrichment level. 100.000 –
200.000 SWU are required to produce high enough enrichment for annual fuel load of a
conventional light water reactor from natural uranium. Currenlty, worldwide annual capacity is
48 730 000 SWU. Capacity is divided roughly half and half between gaseous diffusion and
centrifuges. Figure 2.8 shows the countries and their enrichment capacity in both technologies in
tSWU. (Falk & Bodman, 2007)
10
,
where P = mass of the product W = mass of the waste F = mass of the feedstock (Cohen, 1951)

33
Figure 2.8: Annual enrichment capacity by country 2007 in tSWU (Falk & Bodman, 2007)
2.5.3 Fuel Fabrication
In a fuel fabrication plant, UF6 is transformed back to UO2. UO2 is molded into ceramic pellets and
then placed in a fuel element. Each fuel element is a tube, made usually out of zircaloy, sealed at
both ends with zircaloy plugs. The fuel elements are placed in a fuel assembly, which is made to fit
to the reactor. Fuel assemblies can differ in length, number of fuel elements, control rod
placement and other factors. From the fuel fabrication plant, fuel is shipped to the plant, where it
can be stored in dry storage or in spent fuel storage, before entering the reactor. (Lochbaum,
1996)
China1000
Russia15000
UK3400
Netherlands2900Germany
1800Japan1250
Iran250
Brazil120
India5
Pakistan5
France10800
United States11300
34
3 Introduction to technology
Energy released from fission processes manifests as thermal energy in the core of a nuclear
power plant. A nuclear power plant typically converts thermal energy from the core to electricity
using the Rankine cycle.
3.1 Cyclic process
In a heat engine, temperature changes in a working fluid are used to produce mechanical work in
a turbine. The mechanical work produced with this cycle is turned into electricity with a
generator. The maximum theoretical efficiency (Carnot efficiency ) that a heat engine can
achieve is
where T1 represents the temperature of heat source and T2 temperature of cold source. For
example, a nuclear power plant using cold sea water (6˚c) for cooling and a maximum
temperature of 300˚c for the working fluid, would have maximum efficiency of 51,3%11. It can be
immediately seen that efficiency has a major effect on the fuel consumption in nuclear power
plant. The other big issue to remember is thermal pollution that these big power plants are
“dumping” to nature. (Tester, Drake, Driscoll, Golay, & Peters, 2005) For example, a 1000MW
nuclear power plant with thermal efficiency of 32% requires 25.3m3 of 6˚c cooling water every
second.
The Carnot cycle is an ideal cycle, working only as a concept. It is not possible to build such
engine as it is not possible to have an engine working perfectly without heat losses or losses due
friction. Thus the efficiency of real heat engines is always lower than the Carnot efficiency. (Tester,
Drake, Driscoll, Golay, & Peters, 2005)
3.1.1 Rankine cycle
The Rankine cycle is heat engine cycle used widely in large installations, like coal-fired power
plants, nuclear power plants, geothermal power plants, biomass-fired power plants and even
solar power plants (Tester, Drake, Driscoll, Golay, & Peters, 2005). The main components of a
Rankine cycle in a nuclear power plant are shown in Figure 3.1.
11

35
Figure 3.1: Rankine cycle
Figure 3.1 presents the Rankine cycle in pressurized water reactor, as there is primary heat
exchanger to be seen. In the case of boiling water reactor, the core of nuclear power plant would
be in contact with working fluid. This difference will be discussed with greater detail later in this
chapter.
3.1.2 Limitations for heat engines
As the Rankine cycle works under the principles set by Carnot, it would be most effective to make
the temperature difference as high as possible to achieve high efficiency. In many cases, both T1
and T2 are fixed. For example, chemical properties of coal decide how much energy in the form of
heat you can produce from coal. At the same time, the cold reservoir temperature cannot be easily
controlled. This is due to the high volumes in water consumption and the impossibility of cooling
reservoir temperature being lower than the ambient temperature.
This is not the case with nuclear power plants, as the heat source is completely controllable.
Therefore it would be possible to get very high efficiency, as high as 81%12. However, it is obvious
that there are limitations. The most important limitations are presented by the working fluid
used. Higher temperatures in liquids mean higher pressure levels, which in turn make
12 Having heat source of 1200˚c and cold temperature of 6˚c would equal to 81% efficiency using Carnot cycle.

36
requirements for machinery bigger. Liquid metals can be used, but high temperature liquid metal,
which can be very corrosive, is also expensive to work with. Other issues with using
unconventional materials are related to the safety of the design. Similar problems are seen with
gas-cooled reactors. The main variable for choosing the working fluid is the price of the system
and balancing it with the output. New combinations are being brought to the markets, as material
scientists and nuclear power plant designers are working to provide solutions.
3.2 Nuclear Reactor engineering
3.2.1 Nuclear reactor engineering basics
To have a working nuclear reactor, three main parts are needed: a fuel, cooling system and a
controlling device. At the moment, most of the nuclear reactors in the world also have fourth
element, a moderator used to slow down the fission neutrons.
3.2.1.1 Fuel
As presented in chapter one under cross sections, the choice of fuel determines the design of the
reactor. Some materials have a large fission cross section in the thermal region and some have a
large capture cross section in the fast neutron region. For example, 235U is suitable for thermal
neutrons. 232Th, in the other hand, is suitable when fast neutrons are used: it can first capture a
neutron and then mutate to fissile material. The fuel choice therefore controls the main design
characteristics of a nuclear reactor.
3.2.1.2 Cooling system
Heat produced by fission and decay processes in the reactor has to be removed to run the
Rankine cycle. If this is not done properly, the temperature in the core will rise steadily eventually
causing a meltdown of the core. The choice of coolant is connected to the design of the reactor: A
reactor using fast neutrons cannot any use coolant that has an atomic weight close to the
neutrons weight and/or has a high capture cross section due to the possibility of slowing down
the neutrons. Coolants can be gases, liquids or even liquid metals, but they have to have large heat
capacity. Depending on the design, the following materials are used currently or are going to be
used in near future in commercial reactors: water, heavy water, sodium, helium and carbon
dioxide. (Krane, 1988)
An important term related to the coolant is the void coefficient. It is very significant for water
37
cooled reactors that operate near the saturation point of water. The void coefficient is defined as a
change in reactivity (reproduction factor) per percent of change in void volume in the coolant. It
can be positive, negative or zero. If positive, the change in reactivity is positive when more
bubbles appear in the coolant increasing the power of the reactor. If the void coefficient is
negative, the effect is opposite; voids in the coolant reduce reactivity and the power of reactor.
The void coefficient can be zero, meaning that there is no change in reactivity if voids form in the
coolant. (U.S Department of Energy, 1993)
3.2.1.3 Controlling devices
The amount of neutrons available at given time span in neutron producing system is called
neutron flux. The neutron flux can be defined as total path length covered by all neutrons in a
selected area13. Neutron flux inside of nuclear reactor and reactor power are directly
proportional, as the probabilities (cross sections) and macroscopic measurements of the reactor
are not changing. Only level of available fissile material is changing slowly, and therefore it does
not affect the day-to-day operation of reactor. (U.S Department of Energy, 1993)
To control the neutron flux, a material that captures neutrons is needed. Cadmium, boron, indium
and silver are widely used in conventional nuclear reactors for neutron capture due to their large
neutron capture cross section. (Krane, 1988)
The mechanism used to control the reactor is very similar between different designs: rods, made
out of suitable material are moved in or out of the reactor thus increasing or decreasing the
absorbing material present. Control rods can be divided into three categories by their purpose: 1)
Shim rods: used for coarse control (removing/releasing large amounts of neutrons), 2) regulating
rods: used for fine adjustments, 3) safety rods, used for very fast shutdown. If safety rods are
inserted in the reactor it shut downs immediately. This is called “scramming” (scram) of the
reactor. (U.S Department of Energy, 1993)
Using control rods to control the reactor, the reactor is not working at optimal level: when reactor
is controlled using control rods, the “burning” of the fuel can be uneven and therefore this control
method is flawed (El-Wakil, 1984). A more efficient way to control the reactor is to dissolve
13 For example, neutron flux is a product of neutron density
and neutron velocity
.

38
boron, or other high capture cross section material, in the coolant and limit the neutron flux
evenly inside the reactor (El-Wakil, 1984). This control method, called chemical shim, presents
problems due to higher reactivity margin in the reactor. Higher reactivity margin means that to
make a change to present situation, more rods have to be inserted in or retracted from the
reactor. This is due the now higher amount of capturing ability in the coolant: when rods are
pushed in to the reactor, it displaces coolant and the change in effective material is smaller.
3.2.1.4 Moderator
If a reactor is to be run in the thermal neutron region the fast fission neutrons (averaging 2 MeV)
must be slowed down. A perfect moderator would then be as close as the weight of a neutron as
possible, have a low capture cross section, have a large scattering cross section, be cheap and
readily available, have high density and be chemically stable (Krane, 1988).
In Table 3.1 below potential moderator materials are shown. The moderating ratio equals
materials slowing down potential divided with absorption cross section. A high moderating ratio
means better moderator.
Table 3.1:Moderating potentials of different materials (U.S Department of Energy, 1993)
Material Number of collisions to thermalize Moderating ratio Light water (H2O) 19 62
Heavy water (D2O) 35 4830
Helium 42 51 Beryllium 86 126
Boron 105 0.00086 Carbon 114 216
Ordinary water satisfies many of the requirements for a good moderator, but it has relatively high
capture cross section for neutrons. This is the reason for the rather low moderating ratio for
ordinary water. Heavy water (D2O) on other hand has a low capture cross section, and therefore it
has a very high moderating ratio. However, it is not very easily obtainable and therefore not
cheap. If deuterium captures a neutron it becomes tritium, which is radioactive and harmful for
biological systems, presenting an additional problem (Krane, 1988). Carbon has also been used
to moderate neutrons, but as the carbon atom is 12 times heavier than neutron, there has to be
more moderating material than if, for example, light water is used as moderator. This is a problem
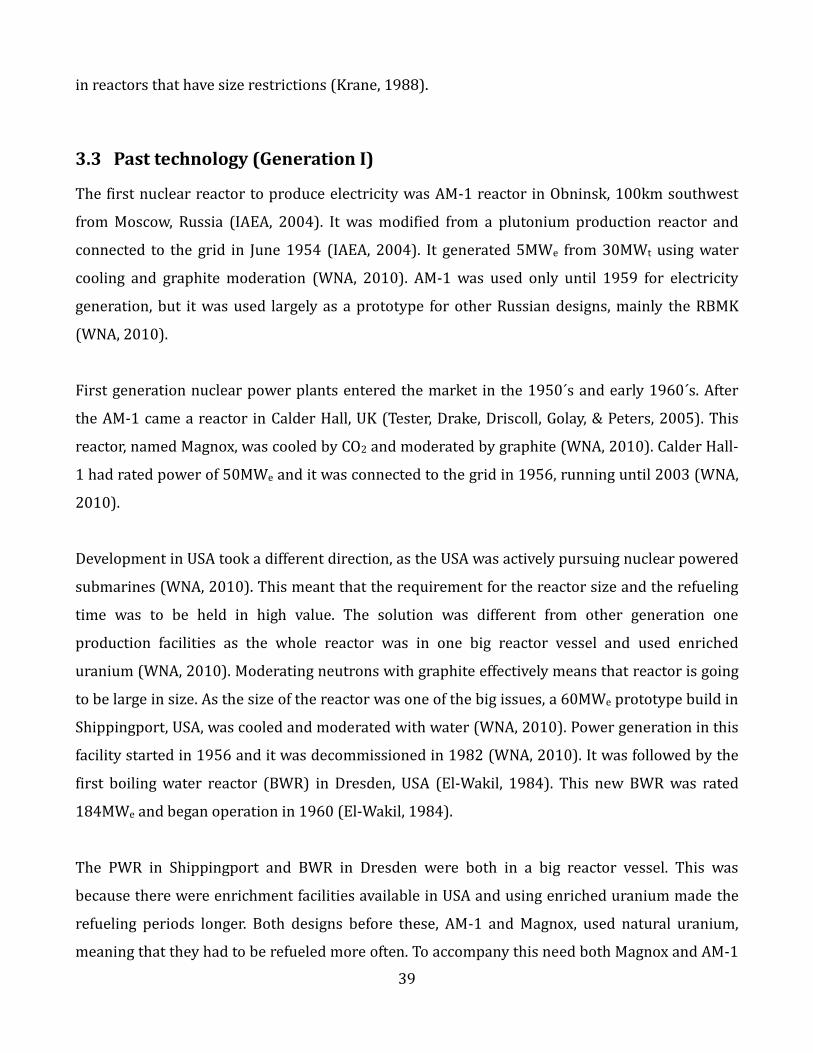
39
in reactors that have size restrictions (Krane, 1988).
3.3 Past technology (Generation I)
The first nuclear reactor to produce electricity was AM-1 reactor in Obninsk, 100km southwest
from Moscow, Russia (IAEA, 2004). It was modified from a plutonium production reactor and
connected to the grid in June 1954 (IAEA, 2004). It generated 5MWe from 30MWt using water
cooling and graphite moderation (WNA, 2010). AM-1 was used only until 1959 for electricity
generation, but it was used largely as a prototype for other Russian designs, mainly the RBMK
(WNA, 2010).
First generation nuclear power plants entered the market in the 1950´s and early 1960´s. After
the AM-1 came a reactor in Calder Hall, UK (Tester, Drake, Driscoll, Golay, & Peters, 2005). This
reactor, named Magnox, was cooled by CO2 and moderated by graphite (WNA, 2010). Calder Hall-
1 had rated power of 50MWe and it was connected to the grid in 1956, running until 2003 (WNA,
2010).
Development in USA took a different direction, as the USA was actively pursuing nuclear powered
submarines (WNA, 2010). This meant that the requirement for the reactor size and the refueling
time was to be held in high value. The solution was different from other generation one
production facilities as the whole reactor was in one big reactor vessel and used enriched
uranium (WNA, 2010). Moderating neutrons with graphite effectively means that reactor is going
to be large in size. As the size of the reactor was one of the big issues, a 60MWe prototype build in
Shippingport, USA, was cooled and moderated with water (WNA, 2010). Power generation in this
facility started in 1956 and it was decommissioned in 1982 (WNA, 2010). It was followed by the
first boiling water reactor (BWR) in Dresden, USA (El-Wakil, 1984). This new BWR was rated
184MWe and began operation in 1960 (El-Wakil, 1984).
The PWR in Shippingport and BWR in Dresden were both in a big reactor vessel. This was
because there were enrichment facilities available in USA and using enriched uranium made the
refueling periods longer. Both designs before these, AM-1 and Magnox, used natural uranium,
meaning that they had to be refueled more often. To accompany this need both Magnox and AM-1

40
were built in such a way that they could be refueled during production. (WNA, 2010)
3.4 Current technology (Gen II)
Nuclear power plants, which are in use today, have been mostly built from 1960 to 1980 (WNA,
2010). Reactors built at this time are called generation II, as they have been designed using data
gotten from first generation power plants or were completely new designs using the possibilities
made by technological advances and increased knowledge of the subject. These power plant
designs are presented in this chapter with reasonable detail. We will look at the following design
types: Pressurized Water Reactor (PWR), Boiling Water Reactor (BWR), Reactor Bolshoi
Moshchnosti Kanalny (Russian: Реактор Большой Мощности Канальный, „High Power
Channel-type Reactor“, RBMK), CANadian Deuterium Uranium (CANDU), Advanced Gas-cooled
Reactor (AGR) d Fast Breeder Reactor (FBR).
3.4.1 PWR
Pressurized-water reactors use neutrons in the thermal region, while slightly enriched (2.6%-
4.0% of 235U) uranium is used as fuel (Suppes & Storvick, 2007). Using thermal neutrons requires
a neutron moderator. In the PWR this moderator is light water, which is also used as working-
fluid. Chemical-shim control (diluting neutron absorber to coolant) can also be used in PWR, to
make sure of the even “burn” in fuel rods (El-Wakil, 1984).
A PWR nuclear power plant is composed from two loop series, the primary loop and working-
fluid loop. In both loops, the working-fluid is light water. The nuclear reactor is cooled in primary
loop, while the working-fluid loop is cooling down the primary loop and bringing this heat to
turbine. Simplified schematic arrangement of a PWR power plant cycle is presented in Figure 3.2.

41
Figure 3.2: Pressurized water reactor
The working-fluid loop on the right side of Figure 3.2 is basically a normal Rankine cycle,
generating electricity from temperature difference between the condenser and heat exchanger.
The pressure in this loop is lower than it is in primary loop, to achieve boiling in the heat
exchanger (El-Wakil, 1984).
3.4.1.1 Primary loop
The Primary loop (on the left side of Figure 3.2) has five main parts: a pump, reactor, steam
generator (heat exchanger) and pressurizer. Depending on the reactor, this system might have
two to four independent loops of steam generator and main coolant pumps operating parallel to
each other. Steam generators are tall and thin metal structures that weigh around 330 tons. A
typical U-type steam generator can be 20 meters tall and have diameter of 4.2 meters. The main
pumps are usually large pumps designed to handle large volumes, pressures and temperatures. In
the primary loop, there is only one pressurizer, attached to one of the parallel loops. (El-Wakil,
1984)

42
3.4.1.2 Reactor
Figure 3.3: PWR reactor cross-section (U.S. EIA, 2000)
In Figure 3.3 the reactor cross section of PWR is displayed. The whole reactor vessel is filled with
water. The core is of the open type, as the fuel assemblies are in direct contact with coolant.
Inside the reactor vessel, there is a thermal shield and core barrel. The grid itself is surrounded
with a core baffle in such a way, that there is no flow outside of the fuel assemblies.

43
Figure 3.4: Horizontal cross section of PWR core
3.4.1.3 Coolant and moderator
In a typical PWR, water enters the vessel from inlet nozzles in the top of the reactor. A reactor has
usually 2 inlet nozzles per 500 MW. The coolant flows first downwards through the annulus
between the core barrel and the reactor vessel wall, cooling down the thermal shield on both
sides. After this it flows upwards in the reactor, picking up heat from fuel. The coolant exits the
vessel from the top and does not boil in any situation, thus requiring high pressure. (El-Wakil,
1984)
The fuel assemblies are in direct contact with water. Design of the spaces between fuel rods in
fuel assemblies are such that when water flows in these gaps, neutrons are moderated via
collisions with water molecules (U.S Department of Energy, 1993). This combination of coolant
and moderator offers a very large negative void-coefficient. If water boils and forms voids, the
coolants effectiveness decreases. However, at the same time moderating material is missing,
causing less moderation and reduction in the fission rate. In this sense, PWR is very safe to use, as
it cannot produce heat without the coolant.
3.4.1.4 Fuel
Fuel rods are made out of UO2 pellets, which are roughly 0.9cm in diameter and 1.5 cm long. The
pellets are sealed in cladding tube made of zircalloy, with sufficient space left to accommodate
gaseous fission products and thermal expansion. Fuel rods are attached to a subassembly,
typically composed of 180 fuel rods and 16 control rods. The control rods are attached to a

44
control rod assembly, which is in turn attached to the control rod controlling mechanisms of the
reactor. (El-Wakil, 1984)
Fuel is loaded in to the reactor so that the centre of the reactor houses fuel with the lowest
enrichment (El-Wakil, 1984). This is to minimize the neutron loss, as the neutron flux is at
highest in the middle of the reactor.
3.4.1.5 Control rods
Control rods are attached to the fuel assemblies and, when the reactor is producing heat, control
rods are lifted upwards from the reactor. Aforementioned materials for control rods are used, for
example a PWR control rod can be composed of 80% silver, 15% indium and 5% cadmium (El-
Wakil, 1984). Control rod assemblies are connected to the control mechanism by an
electromagnet (El-Wakil, 1984). In the case of internal power failure, which would also mean
failure of main cooling pumps, the control rods would automatically drop into reactor, effectively
scramming the reactor.
3.4.1.6 Pressurizer
As the pressure in the primary loop has to be high (around 155 bar), a device that controls the
pressure in the loop is needed. This device is the pressurizer. Liquids are practically
incompressible, making small changes in the volume of the coolant very dangerous. If the coolant
is very close to its saturation point and the volume increases there is a danger of flash boiling of
the coolant (El-Wakil, 1984). As steam has very low heat capacity compared to water and it has
higher volume, flash boiling in the reactor could break fuel rods and possibly jam control rods. If
chemical-shim is used to control the reactor, it is added to the coolant in the pressurizer.
3.4.1.7 VVER
Vodo-Vodyanoi Energetichesky Reactor (Russian: Водо-водяной энергетический реактор,
„Water-Water Energetic Reactor“, VVER) is Russian a design with similar characteristics as the
western PWR. There are differences in the control systems and general design. Old versions of
VVER(VVER-440 V230 and V213) have six coolant loops with vertical steam generators, in
contrast with western plants that have horizontal steam generators. The newer version, VVER-
1000, has four coolant loops with passive safety and containment systems usually seen in third
generation western plants. The fuel and control rod design resembles western PWR’s. VVER’s
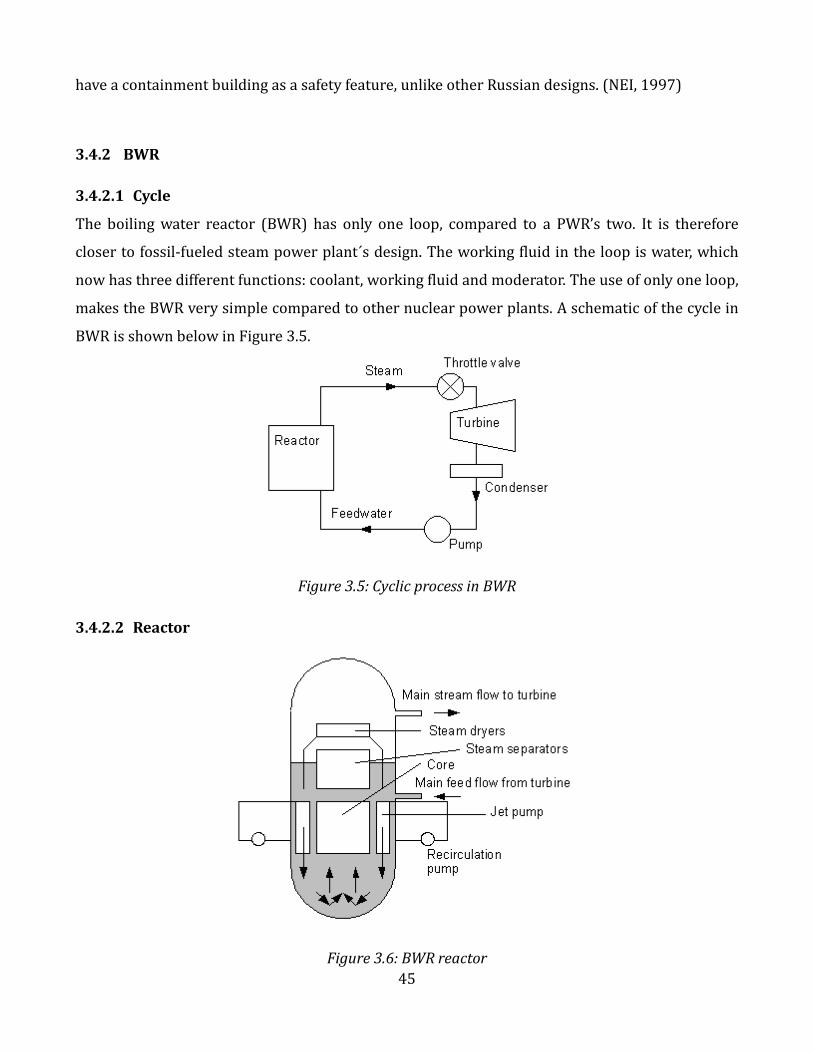
45
have a containment building as a safety feature, unlike other Russian designs. (NEI, 1997)
3.4.2 BWR
3.4.2.1 Cycle
The boiling water reactor (BWR) has only one loop, compared to a PWR’s two. It is therefore
closer to fossil-fueled steam power plant´s design. The working fluid in the loop is water, which
now has three different functions: coolant, working fluid and moderator. The use of only one loop,
makes the BWR very simple compared to other nuclear power plants. A schematic of the cycle in
BWR is shown below in Figure 3.5.
Figure 3.5: Cyclic process in BWR
3.4.2.2 Reactor
Figure 3.6: BWR reactor

46
In Figure 3.6 above, a typical boiling water reactor is shown. Feedwater enters the reactor in the
middle, from where it is pushed towards the bottom of the reactor. It flows upwards through the
fuel elements in the core receiving heat. In the top of the core, water is in the form of a very wet
mixture of vapor and liquid. Vapor is separated from the liquid after which it flows to the turbine,
does work and then flows back to the reactor through a condenser. Liquid water at the top of the
reactor flows towards to the sides of the reactor and then down. This process takes place either
via natural or forced convection. A reactor, of this type, rated 1000MW has inner diameter of
around 6.4 meters and is about 22 meter tall. (El-Wakil, 1984)
Recirculation pumps play an important role in the reactor control. In the case of increased power
production, the flow in the recirculation loop is increased. This increases the flow through the
core, which in turn increases the amount of liquid in the core. As mentioned before, the
moderation capabilities of liquid water and water vapor are very different. More liquid in the core
increases moderation, which increases the power output of the reactor. (El-Wakil, 1984)
3.4.2.3 Fuel elements and control rods
The fuel elements of a BWR are similar to the ones used in a PWR. However, they are more likely
to be in smaller assemblies, 7x7 or 8x8, compared to PWR’s 14x14. In the BWR, fuel assemblies
are not in direct contact with water and do not contain control rods. They are placed in their own
fuel channels, which are made of Zircaloy-4. (El-Wakil, 1984) In Figure 3.7 below, four fuel
channels are shown, with fuel assembly of size 7x7. (El-Wakil, 1984)
Figure 3.7: BWR fuel assembly example
The main difference between BWR and PWR control rod design is that in the BWR control rods
enter the reactor from the bottom, as opposed to the PWR, where control rods move down to the
reactor. This is due to the voids forming closer to the top of reactor in the BWR, lowering the
reactivity in that region. Moderation is better in the area where water is in liquid form, in this

47
case the bottom of the reactor. To achieve sufficient control in an emergency, control rods have to
be inserted upwards, below to the reactor. The control rods are in cruciform shape, as seen in
Figure 3.7, and fitted so that they enter the space between individual fuel channels. The control
rod is made of stainless steel tubes, which contain the absorptive material. (El-Wakil, 1984)
3.4.2.4 Radioactivity in the turbine
In the BWR, the working fluid for the turbine has been in direct contact with the reactor. To
remove the possibility that radioactive material reach the turbine, mineral content of the working
fluid is kept low (below 1 ppm). However, it is possible that either hydrogen or one of isotopes of
oxygen capture a neutron and transform to radioactive material. Most important materials and
their reaction paths for turbine radioactivity are shown below in Table 3.2.
Table 3.2:Possible radioactive substances on BWR turbine
Material Abundance Reaction Final state Decay, half-life
1H 99,99% Capture 2H stable
16O 99,76% 16O + n > 16N + 1H 16N beta-, 7.13s
17O 0,04% 17O + n > 17N + 1H 17N beta-, 4.17s
18O 0,20% Capture 19O beta-, 26.9s
3.4.3 RBMK
3.4.3.1 Reactor
Reactor Bolshoi Moshchnosti Kanalny (Russian: Реактор Большой Мощности Канальный,
„High Power Channel-type Reactor“, RBMK) is a Russian-design nuclear reactor. RBMK was the
reactor type operating in Chernobyl-4, which was destroyed in an accident in April 1986. The
design itself is close to western BWR, but the core is not submerged in water. Water flows through
the core in pressure tubes, a unique design (IAEA, 1992). The reactor is attached to Rankine cycle,
like in a BWR. Out of the two main designs, RBMK-1000 and RBMK-1500, only RBMK-1000’s are
currently still producing (WNA, 2010). A schematic of a RBMK reactor is shown in Figure 3.8.

48
Figure 3.8: RBMK-1000
The RBMK is water cooled and moderated with graphite. The fuel assemblies are in their own
pressure tubes, which are each about 7 meters long. Each channel is individually cooled and the
pressurized water is allowed to boil in the channels. There are about 1660 vertical holes in the
core, which are separated by graphite (Snell & Howieson, 1991). These holes house either control
rods or fuel assemblies (Snell & Howieson, 1991). As mentioned before, use of graphite as a
moderator makes the reactor fairly large (height 7 meters, diameter of 11.8 meters) (IAEA, 1992).
There are problems related to this big size, mostly because it can act as two or more reactors
attached to each other, rather than one big one: small changes in the reactivity in some part of the
core might have big effects on power elsewhere in the reactor (IAEA, 1992). A high void
coefficient also contributes to this problem, which is the result of the two moderators, water and
graphite. If the cooling water boils in a western PWR, reactivity is lowered because of the lowered
moderation. This does not apply in a RBMK, which has water only for cooling. If the water boils,
moderation stays the same due to the use of graphite. As water vapor has lower heat capacity and
larger specific volume than liquid, only reactor cooling is affected if the cooling water boils in the
pressure tubes. The RBMK does not have a containment building; the reactor is built on a heavy
49
plate, acting as a lower shield, and contained with an upper shield, which is a 2000 ton cover
plate (IAEA, 1992). Below the reactor are ‘bubbler pools’ which serve as pressure suppression
pools, and all the pipes are in boxes that are said to be “leak tight” (Snell & Howieson, 1991).
As graphite burn at high temperature, there is no oxygen present in the reactor. The atmosphere
inside the reactor is produced by gas circulation of helium (70-90%) and nitrogen (10-30%). This
gas also works as a heat bridge between the graphite and the pressure tube. (Russian Academy of
Science, Nuclear Safety Institute, 1993)
3.4.3.2 Cycle
The RBMK-1000 has two coolant loops, which each cool the half of the reactor. Both loops have
four primary coolant pumps, of which three are used in normal use (IAEA, 1992). Each loop
therefore has one back up pump. Each of these pumps has a capacity of 5500-12000
(normally water flow is 8000
) and they push the water to individual pressure channels,
which have control valve to optimize cooling (IAEA, 1992). There are two steam separators, one
for each loop (IAEA, 1992). A RBMK reactor has two turbines, one for each cycle (Snell &
Howieson, 1991).
3.4.3.3 Fuel elements and control rods
The pressure tube design has one major advantage; it can be refueled when it is on-line (IAEA,
1992). The fuel elements are formed of uranium oxide pellets housed in zircaloy (Elemash, 2004).
One fuel assembly is made out of 18 fuel elements (Elemash, 2004). The uranium pellets have
slight enrichment, approximately 2.6% (Elemash, 2004).
The control and safety rods are inserted into the reactor from above and from below. There are
24 shortened control rods inserted from below. The rest of the safety and control rods are of
normal size and inserted from above. The design of the control rods is unconventional: a 4.5
meters long graphite displacer is situated at the end of a “telescope”, which is attached to the
control rod. When the control rod is fully retracted, the graphite displacer sits in the center of the
reactor, as the “telescope” is 1.25 long. With this design, there is a “positive scram effect”, making
the control rods more effective. This is readily understood, as the control rod displaces graphite,
rather than water which is close to the boiling point: Thus moderation is decreased at the same

50
time that absorption is increased after the control rod is inserted. (IAEA, 1992)
The control rod design, and the speed that it could be inserted, played a big part in the Chernobyl
accident. After the accident control rod insertion mechanism was changed, shortening the
insertion time to the whole core from 18 seconds to 12-14 seconds (Russian Academy of Science,
Nuclear Safety Institute, 1993).
3.4.4 PHWR/CANDU
Pressurized Heavy Water Reactors, as the name suggests, use heavy water instead of ordinary
light water as a moderator and/or coolant. The thermodynamic and chemical characteristics are
almost the same as for light water, but the neutron absorption cross section for heavy water is
considerably smaller. Pressure/temperature combinations are similar to light water reactors, but
as seen in Table 3.1, using heavy water as moderator, double amount of collisions with neutrons
are needed to reduce energy levels of neutrons in appropriate level. (El-Wakil, 1984)
The main advantage of heavy water relates thus to the neutron flux; as the absorption to the
moderator is lowered, greater neutron flux can be achieved. A higher neutron flux means that
some other loss factor can be smaller. Usually this is the enrichment rate of uranium. Therefore
heavy water reactors usually run with natural uranium. (El-Wakil, 1984)
The drawbacks of heavy water reactors include larger reactor size and the production of tritium.
If heavy water (deuterium) captures a neutron, it becomes tritium, which is radioactive and
harmful to biological systems. Producing heavy water is an expensive process and as one reactor
might need close to 300 tons of heavy water; this is seen in investment costs of a PHWR facility,
making it a less interesting choice for potential buyers. (El-Wakil, 1984)
Canada has concentrated on developing a pressurized heavy water reactor, called CANDU
(CANadian Deuterium Uranium). CANDU reactors are used today around the world, in countries
like China and Romania. Most of the other Pressurized Heavy Water Reactors are CANDU
derivatives, mainly found in India (WNA, 2010). The following chapter describes CANDU in higher
detail.
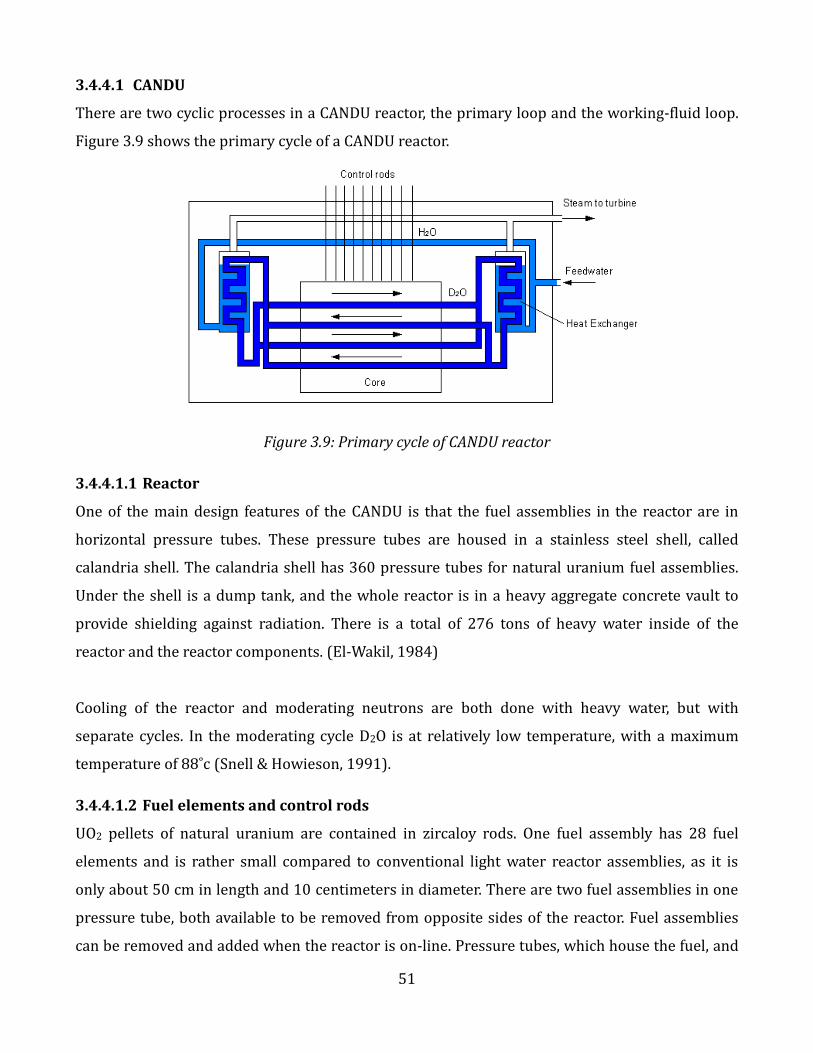
51
3.4.4.1 CANDU
There are two cyclic processes in a CANDU reactor, the primary loop and the working-fluid loop.
Figure 3.9 shows the primary cycle of a CANDU reactor.
Figure 3.9: Primary cycle of CANDU reactor
3.4.4.1.1 Reactor
One of the main design features of the CANDU is that the fuel assemblies in the reactor are in
horizontal pressure tubes. These pressure tubes are housed in a stainless steel shell, called
calandria shell. The calandria shell has 360 pressure tubes for natural uranium fuel assemblies.
Under the shell is a dump tank, and the whole reactor is in a heavy aggregate concrete vault to
provide shielding against radiation. There is a total of 276 tons of heavy water inside of the
reactor and the reactor components. (El-Wakil, 1984)
Cooling of the reactor and moderating neutrons are both done with heavy water, but with
separate cycles. In the moderating cycle D2O is at relatively low temperature, with a maximum
temperature of 88˚c (Snell & Howieson, 1991).
3.4.4.1.2 Fuel elements and control rods
UO2 pellets of natural uranium are contained in zircaloy rods. One fuel assembly has 28 fuel
elements and is rather small compared to conventional light water reactor assemblies, as it is
only about 50 cm in length and 10 centimeters in diameter. There are two fuel assemblies in one
pressure tube, both available to be removed from opposite sides of the reactor. Fuel assemblies
can be removed and added when the reactor is on-line. Pressure tubes, which house the fuel, and

52
coolant tubes are separated with CO2 or nitrogen filled voids. (El-Wakil, 1984)
The control rods are pushed into the reactor from above, perpendicular to the fuel elements. 11
extra shutoff rods protect the reactor, as well as the possibility to dump the moderator from the
reactor. This is possible, as there are two heavy water cycles in the reactor and losing moderator
heavy water does not remove the heavy water for cooling. (El-Wakil, 1984)
Since the neutron flux in HWR is higher due to less absorption, natural uranium (non-enriched
uranium) can be used. Spent nuclear fuel in a CANDU reactor has also been used (WNN, 2010). In
addition of easier front-end fuel cycle, proliferation concerns are smaller. This is because of the
smaller amount of 235U in the fuel, which leads to a smaller amount of fission products per fuel
assembly. Naturally, the CANDU reactor, as any other reactor using natural uranium, has to be
refueled more often.
3.4.5 AGR
Advanced Gas-cooled Reactor (AGR) is a British design, based on Magnox reactors (El-Wakil,
1984). AGR reactors use graphite as a moderator and CO2 as coolant (El-Wakil, 1984). However, it
uses enriched uranium, as opposed to Magnox, which could work on natural uranium. It is two
loop design; the Rankine cycle is attached to the AGR-reactor-cycle to generate electricity (El-
Wakil, 1984). Figure 3.10 is crude illustration of AGR reactor.

53
Figure 3.10: Schematic of AGR
The AGR core is surrounded by graphite, which acts as a graphite reflector. The core itself is a
stack of 12 graphite blocks, which house 308 fuel channels and 81 control rod channels. The
Control rods are inserted to the reactor from above. Fuel assemblies are in their own channels
and therefore it is possible to refuel the reactor when it is on-line. One fuel assembly contains
eight fuel elements made from UO2 pellets, enclosed in the stainless steel tubes. Uranium is
enriched to 2.6% and the total fuel load in a reactor is 122.5 tons. (El-Wakil, 1984)
3.4.6 FBR
As the name suggests, fast breeder reactors use fast neutrons. From Figure 1.5, one can see that
the cross section for fission appears to be relatively low. Also absorption cross sections (Figure
1.6) indicate that it would be better to use thermal neutrons even for trying to breed fissile
material from fertile material. However, when moderating neutrons from average 2 MeV to
thermal region is seen in neutron flux; the neutron losses are higher. This can be seen from
equation 5.
In current fast breeders, 238U is used as the fertile material, which undergoes a decay series to
become 239Pu in 2.4 days.
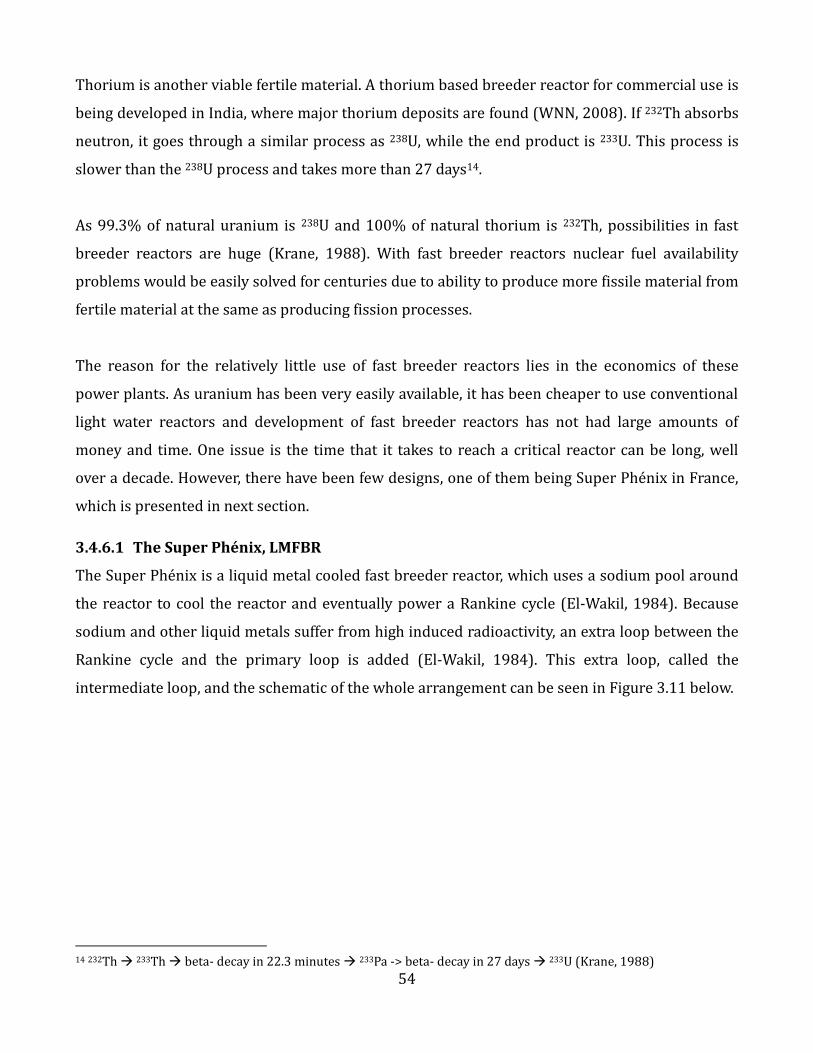
54
Thorium is another viable fertile material. A thorium based breeder reactor for commercial use is
being developed in India, where major thorium deposits are found (WNN, 2008). If 232Th absorbs
neutron, it goes through a similar process as 238U, while the end product is 233U. This process is
slower than the 238U process and takes more than 27 days14.
As 99.3% of natural uranium is 238U and 100% of natural thorium is 232Th, possibilities in fast
breeder reactors are huge (Krane, 1988). With fast breeder reactors nuclear fuel availability
problems would be easily solved for centuries due to ability to produce more fissile material from
fertile material at the same as producing fission processes.
The reason for the relatively little use of fast breeder reactors lies in the economics of these
power plants. As uranium has been very easily available, it has been cheaper to use conventional
light water reactors and development of fast breeder reactors has not had large amounts of
money and time. One issue is the time that it takes to reach a critical reactor can be long, well
over a decade. However, there have been few designs, one of them being Super Phénix in France,
which is presented in next section.
3.4.6.1 The Super Phénix, LMFBR
The Super Phénix is a liquid metal cooled fast breeder reactor, which uses a sodium pool around
the reactor to cool the reactor and eventually power a Rankine cycle (El-Wakil, 1984). Because
sodium and other liquid metals suffer from high induced radioactivity, an extra loop between the
Rankine cycle and the primary loop is added (El-Wakil, 1984). This extra loop, called the
intermediate loop, and the schematic of the whole arrangement can be seen in Figure 3.11 below.
14 232Th 233Th beta- decay in 22.3 minutes 233Pa -> beta- decay in 27 days 233U (Krane, 1988)

55
Figure 3.11: Liquid Metal Fast Breeder Reactor
In both, the primary and the intermediate loop, the working-fluids are liquid metal, such as
sodium or NaK (Natrium-Potassium alloy) (El-Wakil, 1984). Reactor in LMFBR power plant can
be conventional “pipe”-type, which is very similar to normal PWR design, or “pool” type, which is
used in Super Phénix. “Pool” design is presented below in Figure 3.12.
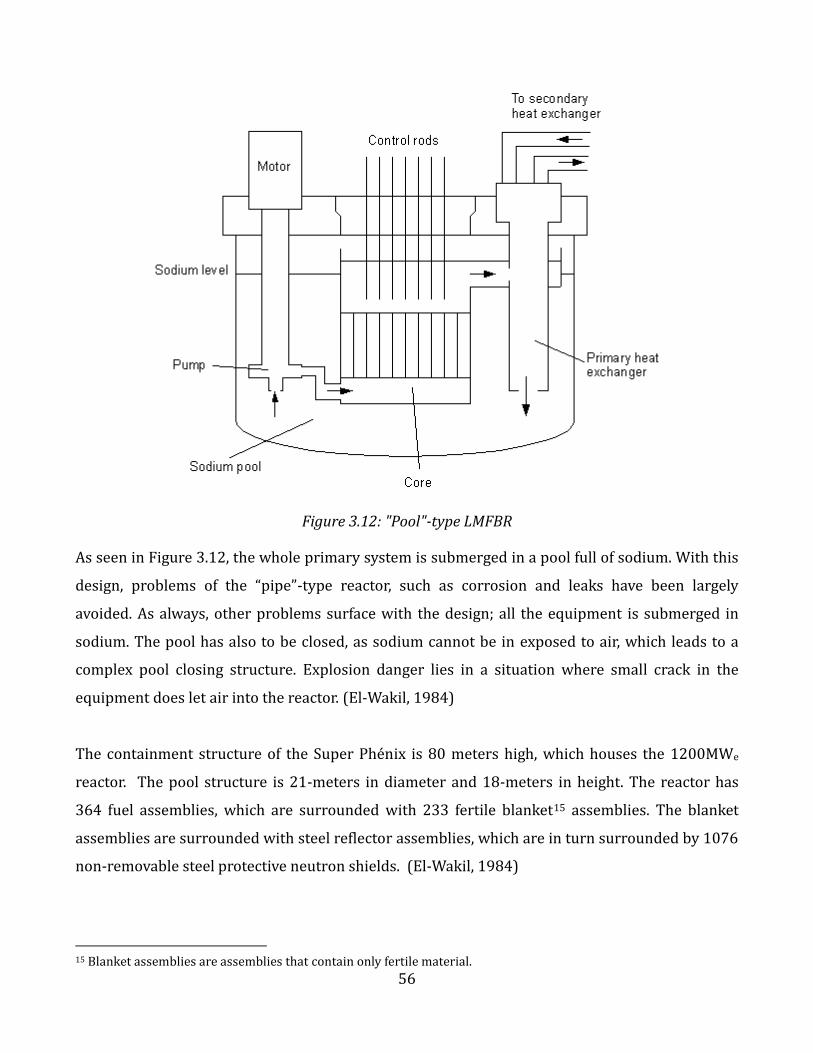
56
Figure 3.12: "Pool"-type LMFBR
As seen in Figure 3.12, the whole primary system is submerged in a pool full of sodium. With this
design, problems of the “pipe”-type reactor, such as corrosion and leaks have been largely
avoided. As always, other problems surface with the design; all the equipment is submerged in
sodium. The pool has also to be closed, as sodium cannot be in exposed to air, which leads to a
complex pool closing structure. Explosion danger lies in a situation where small crack in the
equipment does let air into the reactor. (El-Wakil, 1984)
The containment structure of the Super Phénix is 80 meters high, which houses the 1200MWe
reactor. The pool structure is 21-meters in diameter and 18-meters in height. The reactor has
364 fuel assemblies, which are surrounded with 233 fertile blanket15 assemblies. The blanket
assemblies are surrounded with steel reflector assemblies, which are in turn surrounded by 1076
non-removable steel protective neutron shields. (El-Wakil, 1984)
15 Blanket assemblies are assemblies that contain only fertile material.

57
3.4.6.1.1 Fuel elements and control rods
The 364 fuel assemblies are made of stainless steel and contain 271 fuel rods each. Fuel rod is a
5.4 meters long tube, filled with mixed oxide (PuO2 + UO2) fuel. (El-Wakil, 1984)
There are 21 control rod assemblies that have multiple functions, from shutdown to control. They
are withdrawn from the core depending on the fuel burn-up, but never completely. Emergency
shutdown rods are distributed evenly between the control rod assemblies. The main absorber in
the control rods is boron carbide. (El-Wakil, 1984)
3.5 Current situation
There are 438 operating nuclear reactors in the world today. Together their production capacity
is 369GWe. In Table 3.3 below these reactors are shown, grouped by their design.
Table 3.3:Operating power plants by design 2010 (WNA, 2010)
Model # Capacity MW PWR 218 207725 BWR 87 76358 PWR/VVER 48 35368 CANDU 21 14554 RBKM 11 10175 AGR 14 8380 PHWR 24 8016 ABWR 5 6435 Magnox 4 1414 FBR 2 806 Other 4 48 438 369279
As seen from the Table 3.3, PWR is the most common design by a large margin. Almost half of all
the nuclear power plants are PWR’s and generate over the half of nuclear energy produced is
from PWR based plants.
3.6 Technology for near future (Gen III and Gen III+)
3.6.1 Third generation
Third generation (and third generation +) nuclear reactors are going to be started in near future,
10 to 20 years from now. These designs include European Pressurized Water Reactor (EPR),

58
Advanced CANDU Reactor (ACR-1000), Advanced Boiling Water Reactor (ABWR), Economic
Simplified Boiling Water Reactor (ESBWR) and AP1000, which is generation three pressurized
water reactor. All of these designs are almost completed and approved by governments and ready
to be built.
AP1000 and EPR are both plants built on design of a PWR. AP1000 is from designed by
Westinghouse, promising more economic competitiveness, easier and more efficient operation
and an improved passive safety system (Westinghouse, 2007). Passive safety systems in the
AP1000 include valves that go to safeguard positions automatically in case of power loss and
great amount of using natural forces to drive safety systems, removing the need for large support
network of diesel generators (Westinghouse, 2007). 18-month refueling cycle, capacity factor of
93%, and five year building period are also promised (Westinghouse, 2007). Similar promises are
given by EPR produced by Areva. Capacity factor of 92%, 17% saving on used fuel per MWh, 15%
reduction on long lived actinides, 14% better thermal efficiency and possibility of using MOX-
fuels in reactor promises that EPR should deliver (AREVA, 2004). Nominal output from AP1000 is
1117MWe and 1600MWe from EPR design (Westinghouse, 2007) (AREVA, 2004). Two EPR units
are currently being built, one in Finland and the other one in France (WNA, 2010). AP1000’s have
been ordered by China, and the construction is supposed to start in 2013 (WNA, 2010).
The ACR-1000 is designed to be an improvement to CANDU reactors. It is a 1200MWe reactor
with the same essential features of horizontal fuel assemblies and low temperature heavy water
moderator that are present in previous CANDU designs. The big difference is the coolant, which is
now light water. This brings the investment cost down, as about 2/3 of the heavy water needed
were in cooling system of previous CANDU designs. (AECL, 2009)
ABWR, Advanced Boiling Water Reactor, is an older design, now being built by consortium of
General Electric and Hitachi (GE Hitachi, 2008). The first ABWR started operation in 1996 (GE
Hitachi, 2008). It is an improved design of conventional BWR, the difference mostly being in
improved safety, reduction of capital and O&M costs, better performance and shorter
construction time (GE Hitachi, 2008). The ESBWR, Economic Simplified Boiling Water Reactor, is
a next step from the ABWR. The main characteristics are shared with BWR and ABWR, but
simplification, standardization, passive safety, flexibility and improved economics are main goals

59
of the design. Output from ABWR is in the range of 1350-1460MWe and 1550MWe from the
ESBWR (GE Hitachi, 2008) (Hinds & Maslak, 2006).
Of the aforementioned designs only the ABWR is said to be generation III. The other designs are
classified as generation III+. Difference between these two classifications mainly comes from the
level of safety equipment. In Generation III+ more equipment is passive and therefore works
automatically without external energy to the system.
3.6.2 PBMR
A completely different design from any other is the pebble bed modular reactor. This reactor type
is cooled with gas (Tester, Drake, Driscoll, Golay, & Peters, 2005). Helium has been used in
German design called THTR-300 (El-Wakil, 1984). The fuel is covered with graphite, which works
as a moderator. It is in the form of a ball, roughly size of a tennis ball (El-Wakil, 1984). Fuel is
placed randomly in the core and coolant runs through the core in the voids made by fuel spheres
(El-Wakil, 1984).
An advantage for this design is the possibility to refuel the reactor constantly while it is on-line.
This can be done by pneumatic machinery, which drops the fuel in to the core. At the same time
used fuel can be taken from the bottom of the reactor with a tube. Some designs also include
passive safety features, such as natural convection of cooling gas (Tester, Drake, Driscoll, Golay, &
Peters, 2005).
This design is close to being used in commercial power plants, but recent projects have had
financial issues (WNN, 2009).
3.6.3 Developments in the near future
Table 3.4 presents power plants that are currently being built by design.

60
Table 3.4: Power plants under construction by design, 2010 (WNA, 2010)
Model # Capacity MW PWR 33 23577 VVER 12 11326 ABWR 3 4058 Unknown 2 2000 APR 1 1350 FBR 2 1190 PHWR 3 1096 56 44597
Almost all of the nuclear power plants, which are being built at the moment, are generation II.
However, two generation III+ are included in numbers for PWR. These are both European
Pressurized Water power plants. The first to be ready is the one in Finland, which is rated at
1600MWe (WNA, 2010). The other one is being built in France and has nameplate capacity of
1650MWe (WNA, 2010).
3.7 Future technology
3.7.1 Generation IV
Generation four is the next step that is going to be taken with conventional nuclear power plant
design. The main goals are improved sustainability, improved safety and reliability, better
economics and proliferation resistance. Proposed future designs are; 1) Very High Temperature
Gas Reactor (VHTR), 2) Gas-cooled Fast Reactor (GFR), 3) Supercritical Water Reactor (SCWR), 4)
Sodium Fast Reactor (SFR), 5) Lead-alloy Fast Reactor (LFR) and 6) Molten Salt Reactor (MSR).
Many of these designs are already tested, but more research and development work is needed,
before they can be deployed in larger scale. (U.S. DOE, 2002)
3.7.2 Traveling Wave Reactor
The main problems in a conventional nuclear reactor, like in a PWR, revolve around fuel.
Availability of fuel, cost of the enrichment process, proliferation, waste disposal and costs of this
cycle are problems still to be solved. One technology that tries to minimize these problems is the
previously presented FBR technology. Similar fast neutron technology is used in Traveling-Wave
Reactors (TWR), with the difference that the fissile material is used immediately upon creation

61
(Weaver, Gilleland, Ahlfeld, Whitmer, & Zimmerman, 2010).
The fuel in a TWR is composed solely from fertile material and even used nuclear fuel from
conventional light water reactors can be used. A seed region, with relatively high enrichment, is
placed in the one end of the fuel. The neutron flux from fission processes in this region enters the
fertile fuel region, producing fissile material. As time passes, the seed region is depleted, and the
„wave“ has moved forward to the region that is full of newly created fissile atoms. Hence, there
are three different regions in TWR reactor; 1) Depleted region: unconverted fertile fuel, some
unburned fissile material and fission products. 2) Fission region, and 3) Fertile material region.
Figure 3.13: Traveling Wave Reactor
The speed of the wave is depends mainly on the neutron flux and the used fertile material(238U or
232Th). The designed speed of the wave is typically few centimeters per month. As the reactor is
working with fast neutrons, water cannot be used as a coolant. Similar design as a FBR is
therefore needed; the reactor is cooled with sodium and an intermediate loop is necessary to
avoid radioactivity in the water of the Rankine cycle (Weaver, Gilleland, Ahlfeld, Whitmer, &
Zimmerman, 2010).
Terrapower LLC has proposed a pool type, sodium cooled TWR providing 1000MWe nameplate
capacity. The reactor core is roughly 3.6 meters times 5.1 meters and situated below a gas
plenum, which contains gaseous fission products. Fuel elements are placed in a hexagonal fuel
assembly and sit in the core in such a way that coolant is able to flow length of the fuel pins and

62
the wave travels perpendicular to the pins. The control rods are of similar design as in other
nuclear reactors, boron carbide is chosen to be the absorbing material. Control and safety rods
follow the wave, so that controlling the reactor is easy. With this design, 60 years core life-span
without refueling is achieved. (Weaver, Gilleland, Ahlfeld, Whitmer, & Zimmerman, 2010).
The traveling wave reactor is old concept. Even a fully automated reactor buried 300 meters
underground has been proposed (Teller, Ishikawa, & Wood, 1996). The use of natural convection
and a neutron absorber that absorbs more when temperature is risen would make an
underground plant very convenient (Teller, Ishikawa, & Wood, 1996). However, even without
these possible properties, the TWR has obvious good features: first and foremost it produces
higher energy yield from same amount of fuel. For 1GW power plant, TWR could use up to one
tenth of the fuel needed to power a conventional nuclear power plant (Weaver, Gilleland, Ahlfeld,
Whitmer, & Zimmerman, 2010). Use of “leftovers” from other power plants and no refueling make
this proposed reactor type very intriguing.
The problems are similar for any other new technology; without test reactors or added money to
development, design will never be competitive with more familiar technology of light water
reactors. However, computer simulations have been very promising for TWR’s (Teller, Ishikawa, &
Wood, 1996) (Weaver, Gilleland, Ahlfeld, Whitmer, & Zimmerman, 2010). Fundraising for
designing and building TWR in USA has also gone well, making the future more promising for
TWR (WNN, 2010).

63
4 Back-End fuel cycle
The front-end of a nuclear fuel cycle was discussed earlier in chapter 2. After the fuel assemblies
leave the fuel fabrication facilities they enter the pools in the nuclear site (OECD, 1994). They are
stored in the pool until they are required in the reactor.
This chapter addresses the back end of the fuel cycle, which poses a large problem with regard to
sustainability. This is due to the radioactivity of the spent fuel leaving the reactor. This radioactive
waste material is classified by IAEA in 6 categories.
4.1 Waste classification
Nuclear reactors, used in power plants, are not the only source of radioactive material. Therefore
radioactive material could be divided into categories with different classification properties.
Radiological properties, chemical properties, physical properties and biological properties are
few examples of classifying variables. In this paper, as nuclear reactor waste is the main concern,
the IAEA standard is used to divide material into categories by radiological properties (IAEA,
2009). This standard divides radioactive material into six different classes: high level waste
(HLW), intermediate level waste (ILW), low level waste (LLW), Very Low Level Waste (VLLW),
Very Short Lived Waste (VSLW) and Exempt Waste (EW). (IAEA, 2009).
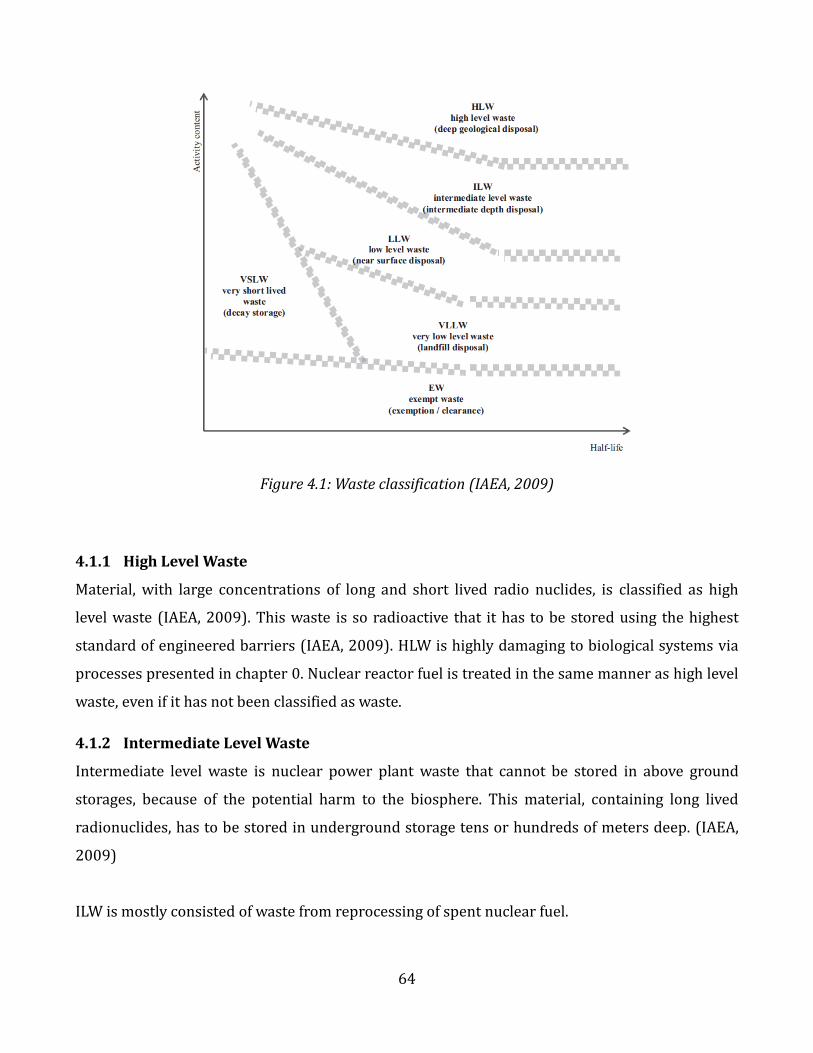
64
Figure 4.1: Waste classification (IAEA, 2009)
4.1.1 High Level Waste
Material, with large concentrations of long and short lived radio nuclides, is classified as high
level waste (IAEA, 2009). This waste is so radioactive that it has to be stored using the highest
standard of engineered barriers (IAEA, 2009). HLW is highly damaging to biological systems via
processes presented in chapter 0. Nuclear reactor fuel is treated in the same manner as high level
waste, even if it has not been classified as waste.
4.1.2 Intermediate Level Waste
Intermediate level waste is nuclear power plant waste that cannot be stored in above ground
storages, because of the potential harm to the biosphere. This material, containing long lived
radionuclides, has to be stored in underground storage tens or hundreds of meters deep. (IAEA,
2009)
ILW is mostly consisted of waste from reprocessing of spent nuclear fuel.

65
4.1.3 Low level waste
Waste material with lower levels of radioactivity and a smaller amount of long lived radionuclides
is classified as low level waste (IAEA, 2009). Low level waste can be stored above ground and
does not require shielding during normal handling or transport (IAEA, 2009). Depending on the
regulatory body and institutional control, time period boundaries for ILW and LLW can be set
(IAEA, 2009). This, however, can vary between location and design of facility (IAEA, 2009). LLW
can potentially be harmful, if the time of exposure is long.
Tools used in nuclear facility are an example of low level waste.
4.1.4 Very low level waste
Very low level waste is radioactive material that is slightly over clearance limit of “non-
radioactive material” (IAEA, 2009). VLLW can occur from decommissioning of nuclear facilities or
from processes connected to natural radionuclides, such as mining (IAEA, 2009). Engineered
disposal might be needed, depending of the regulatory body (IAEA, 2009). As the radioactivity is
close to the natural level, it is not harmful.
4.1.5 Very short lived waste
Very short lived waste has radionuclides with relatively short half-lives. It has to be stored for a
period of time, until it can be handled like conventional waste. Gaseous waste and waste from
medical applications is usually recognized as VSLW. (IAEA, 2009)
4.1.6 Exempt waste
Exempt waste has so small amount of radionuclides that it can be handled as normal waste and
does not require any action from regulatory body. This waste can be disposed used conventional
ways, using landfill or recycling. (IAEA, 2009)
4.2 Nuclear power plant fuel after use
Light water reactors use fuel enriched up to 4% and use fuel up to the point where fuel has only
1% enrichment. The amount of enrichment, and ability to use this fuel, is related to the reactor
design. Usually fuel stays in the reactor for three years, averaging burn up of 792 MWh per
kilogram (MIT, 2003).

66
The refueling cycle in a conventional 1000MW PWR and BWR is usually 18 months. In every
cycle, 35-40 tons of spent fuel is discharged from the reactor (Lochbaum, 1996). On average this
is 23.4 metric tons per year per 1000MW reactor (Lochbaum, 1996). On average, this fuel enters
the reactor as uranium enriched approximately to 3.3% and leaves the reactor as spent fuel,
containing 94.6% of 238U, 1.0% of 235U, 0.9% of 239Pu, 3.4% of fission products and 0.1% of
transuranic elements. The fission products are characterized by the double peaked distribution
(Figure 1.3). Substances, which are not wanted in the reactor, with high neutron capture cross
section are also present in fission products. These substances are called neutron poisons.
Neutron poisons make the operation of a reactor more challenging and represent danger to
biosphere when removed from reactor. Xenon-135 and samarium-149 are examples of such a
materials (U.S Department of Energy, 1993).
As the fission products decay, they produce heat and emit radiation. Problems arise, if fission
products are not contained. For example, there are some products that are still causing problems
resulting from Chernobyl accident. For example, caesium and strontium are close to potassium
and calcium by chemical properties and therefore taken into plants and living organisms (NEA,
2002).
4.2.1 After the reactor
A spent fuel assembly generates about 0.035% of its rated power output after 20 years from
moment it has been taken from the core. Therefore it has to be stored in a place where decay heat
can be removed and where sufficient shielding towards radiation is available. Even after 150 days
of storage, an average PWR fuel assembly emits over 2,000,000 curies of radioactivity. Decay heat
from spent fuel decreases exponentially, but as the initial heat and radiation generated by decay
processes are large, they have to be stored with necessary precaution. This storage method is the
spent fuel pool, where assemblies cool down, depending on reactor type, from 40 to 60 years.
(Lochbaum, 1996)
The spent fuel pool is made from reinforced concrete, which holds a rack for spent fuel. It takes
care of circulating water to remove decay heat and captures fission products that are in gaseous
form. As water works as a shield against radiation, and the spent fuel assemblies have to be

67
submerged, the depth of the used fuel pool is usually over 12 meters. They are of rectangular
design, while the size varies with the used fuel assembly and the amount of storage needed.
(Lochbaum, 1996)
From spent fuel pools, after sufficient time, spent fuel assemblies are either shipped to
reprocessing (closed fuel cycle) or to long-term storage (open fuel cycle).
4.2.2 Back-end fuel cycle choices
Spent fuel is classified as HLW and then treated accordingly. There is a limited amount of choices
for removing this material from biosphere. One proposed option would be to send it to space, but
as quantities are rather large, this option is not financially viable. Another option would be to
bury this waste so deep underground that it is not in touch with the biosphere. This solution,
putting waste in long-term storage where it is disconnected from living organisms, is called once-
through nuclear fuel cycle, or open fuel cycle. The open fuel cycle is actively looked into in few
countries like Finland, Sweden and United States.
Spent fuel can be also seen as a source of valuable material. As mentioned before, spent fuel
contains large amount of 238U and some fissile material (235U and 239Pu). Plutonium and uranium
can be used as a fuel in nuclear reactor, if produced to mixed oxide fuel (MOX). However, all of
these valuable materials are attached to potentially dangerous fission products that have to be
first removed. A chemical process called PUREX (Plutonium URanium Extraction) is available for
removing plutonium and uranium from waste. A fuel cycle that recycles uranium and plutonium
is called closed fuel cycle and it is used in several countries like France and Japan.
Transporting nuclear material is a difficult task. Transport containers, made from concrete and
lead, weighing up to 110 tons fully loaded are used to ship used fuel bundles (Lochbaum, 1996).
These containers have able to be safe even in accident situations and therefore they have very
strict requirements. For example, transport caskets used in Finland have to be able to cope with
30 minutes of 800˚c, drop from 9 meters to unforgiving ground and an hour in 200 meters
underwater (Posiva, 2009).
The choice between fuel cycles at the moment comes down to economics. In France, new nuclear

68
fuel, through uranium mining, costs 0.68 cents per kWh, while fuel produced through
reprocessing costs 0.9 cents per kWh (Suppes & Storvick, 2007). However, in the future, more
weight will hopefully be put on environment issues and solving of nuclear waste problem than
financial issues. This development would make reprocessing option more financially sound, while
being more environmentally friendly, as will be seen in next section. In next section current
conditions of future solutions and situation today for once-through and closed cycle are
discussed.
4.2.2.1 Once-through (long-term storage)
In a once-through cycle, uranium is mined from the ground, used in a nuclear reactor and then
put in to long-term storage for hundred thousands of years while radioactivity levels are over
reasonable limit.
A suitable place for long-term storage provides barriers to make sure that the nuclear waste is
isolated from the biosphere. It has to be noted that long-term storage is not an eternal place for
isolation, rather than isolation for long enough time with small enough breaches of barriers. One
of the problems of this method is to find a suitable area, if large volumes must be stored. Other
problems include questions about the world fifty thousand years from now. With this timescale,
even questions about what language to use when writing information on storage capsules, need
consideration (SKB, 2009).
4.2.2.1.1 Long-term storage solution in Finland
The storage facility itself is in two main parts: the encapsulation plant above ground and the
repository under the ground. Waste from all five reactors in Finland is sealed into copper
canisters and lowered into the bedrock of Olkiluoto, Finland, nearly 400 meters under the
surface. The concept of storage is from Sweden, called KBS-3, and it is result of work in SKB
(Swedish Nuclear Fuel and Waste Management Co). (Posiva, 2009)
The storage concept is based on three protective barriers to provide sufficient isolation (SKB,
2009). These barriers are a copper capsule, bentonite-clay and the crystalline bedrock (SKB,
2009). The ceramic form of used fuel itself is one protective barrier, as there is a gas-proof metal
surface and uranium inside the fuel elements is in form of solid substance which is not easily
dissolved in water (Posiva, 2009).
69
4.2.2.1.1.1 Canisters
The canisters have been through rigorous testing. The final product is a canister that is
mechanically and chemically very durable. It will stay closed at least 100 000 years in the bedrock
(Posiva, 2009). The first five outside centimeters are copper and it is estimated that it will take
more than one hundred thousand years of corrosion to get through (Posiva, 2009). The inner
part is made of cast iron, which is durable and tough. It is designed to be strong enough to
withstand earthquakes or the pressure of a large glacier (Posiva, 2009). To store all the waste
from Finland’s five reactors, 5500 tons altogether throughout their lifetimes, 2800 canisters are
needed. Every canister is 1,05m wide, but the height of the canister depends on the reactor that is
supplying the waste: in Finland’s five reactors, three different types of fuel bundles are used.
(Posiva, 2009)
4.2.2.1.1.2 Filling the canisters in encapsulation plant
After drying, used fuel is set in to the canisters in an above-ground facility, where the used fuel
arrives in a transport-canister. When the canister is loaded, it is filled with argon-gas and sealed
with an inner cap. The outer cap is placed on the canister and welded with electronic beam-
welding. Finally the tightness of the canister is checked with x-rays and ultrasound. (Posiva,
2009)
4.2.2.1.1.3 Repository
The final deposition tunnels are at a depth of 400 meters from sea level, in the bedrock of
Olkiluoto, Finland. Tunnels are drilled into the bedrock, which will house the canisters. The
underground facility has three main parts: the final deposition tunnels, the main tunnels and
underground technical facilities. (Posiva, 2009) As mentioned before, all the waste of these five
reactors is encapsulated and lowered into this facility. 2800 canisters have to be stored during 90
years and as 20 canisters are stored in one tunnel, the final length of the tunnels will add up to 42
kilometers. The area needed for this amount of tunnels is approximately 2-3 square kilometers.
(Posiva, 2009)
4.2.2.1.1.4 Timetable and economics
Nuclear reactor operators hope to start using the facility in 2020. It is thought that the facility will
be filled by 2112 and it could be closed in 2120 (Posiva, 2009). The cost of the complete facility is
approximately 3 billion euros. The costs are covered in the price of electricity and collected by
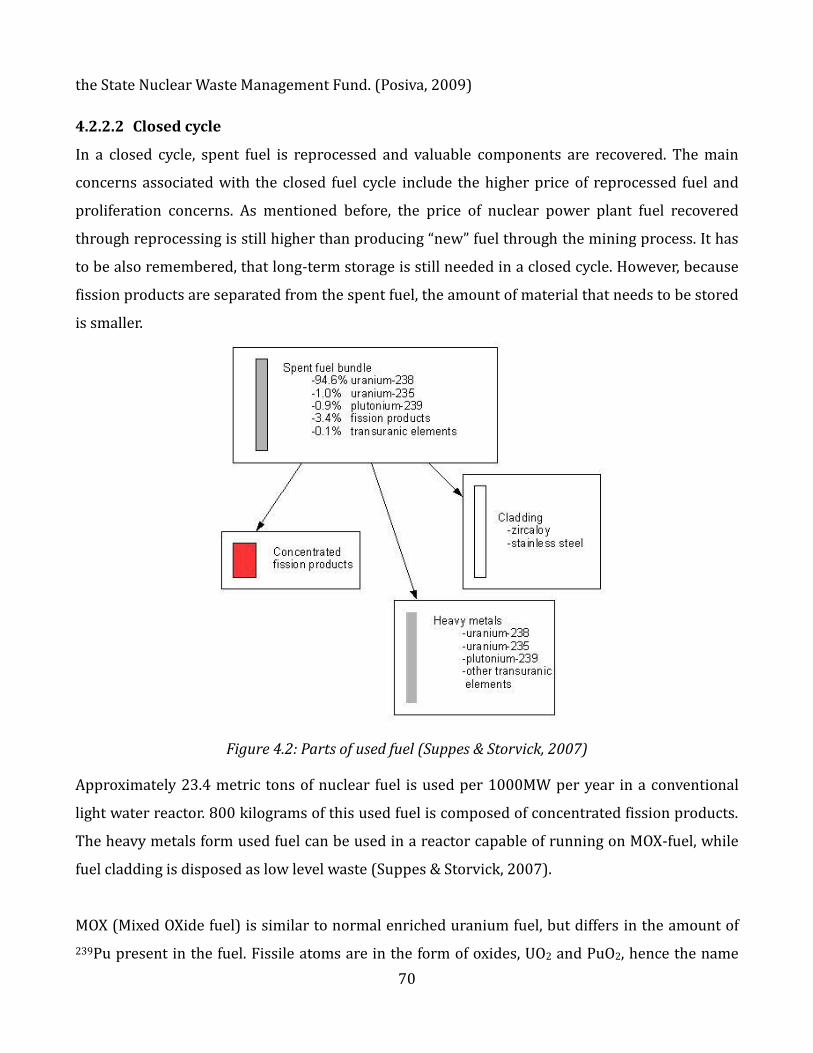
70
the State Nuclear Waste Management Fund. (Posiva, 2009)
4.2.2.2 Closed cycle
In a closed cycle, spent fuel is reprocessed and valuable components are recovered. The main
concerns associated with the closed fuel cycle include the higher price of reprocessed fuel and
proliferation concerns. As mentioned before, the price of nuclear power plant fuel recovered
through reprocessing is still higher than producing “new” fuel through the mining process. It has
to be also remembered, that long-term storage is still needed in a closed cycle. However, because
fission products are separated from the spent fuel, the amount of material that needs to be stored
is smaller.
Figure 4.2: Parts of used fuel (Suppes & Storvick, 2007)
Approximately 23.4 metric tons of nuclear fuel is used per 1000MW per year in a conventional
light water reactor. 800 kilograms of this used fuel is composed of concentrated fission products.
The heavy metals form used fuel can be used in a reactor capable of running on MOX-fuel, while
fuel cladding is disposed as low level waste (Suppes & Storvick, 2007).
MOX (Mixed OXide fuel) is similar to normal enriched uranium fuel, but differs in the amount of
239Pu present in the fuel. Fissile atoms are in the form of oxides, UO2 and PuO2, hence the name

71
mixed oxide fuel.
The oldest process for extracting fissile atoms from spent fuel is called PUREX. PUREX was
developed during the Second World War, to provide plutonium for nuclear weapons. There are
newer and more complicated processes, namely UREX, UREX+ and SuperPUREX. (Suppes &
Storvick, 2007)
4.2.2.2.1 PUREX
A preparation step is needed for transforming the fuel into such a form that it can be reprocessed.
In western reactors fuel bundles are largely made out zircaloy, which has to be stripped from the
fuel bundles to leave only fuel. Mechanical shearing is used to cut the fuel assemblies to short
lengths. Helium (if it was used during manufacture of the fuel assembly) and fission product
gases have to be collected in this step, while long lived radioactive of iodine is given special
attention. (Suppes & Storvick, 2007)
The next step is to dissolve the fuel metal oxides containing fission products, uranium and
plutonium in nitric acid. The stainless steel and zircaloy pieces from the fuel assemblies do not
dissolve and are separated from the nitric acid solution, washed to remove all of the other
products and packaged as low-level radioactive waste. The nitric acid solution pH is adjusted to
ensure that uranium and plutonium are in the most favorable oxidation states for extraction. A
small fraction of the fuel does not dissolve in nitric acid: these residues vary depending on the
fuel characteristics, the time the fuel is used and the procedure used to dissolve the fuel. Residue
solids will be radioactive and require special handling, especially if the spent fuel has aged less
than ten years. (Suppes & Storvick, 2007)
After the fuel has dissolved, it enters the extraction phase. In the extraction phase, liquid is mixed
until it goes into aqueous phase. Now uranium and plutonium can be separated and moved to
organic TBP(TriButyl Phosphate) phase and the minor actinides and fission product metals are
left in the aqueous phase. (Suppes & Storvick, 2007)
Further processing can be performed on the mixture of uranium and plutonium, leaving the
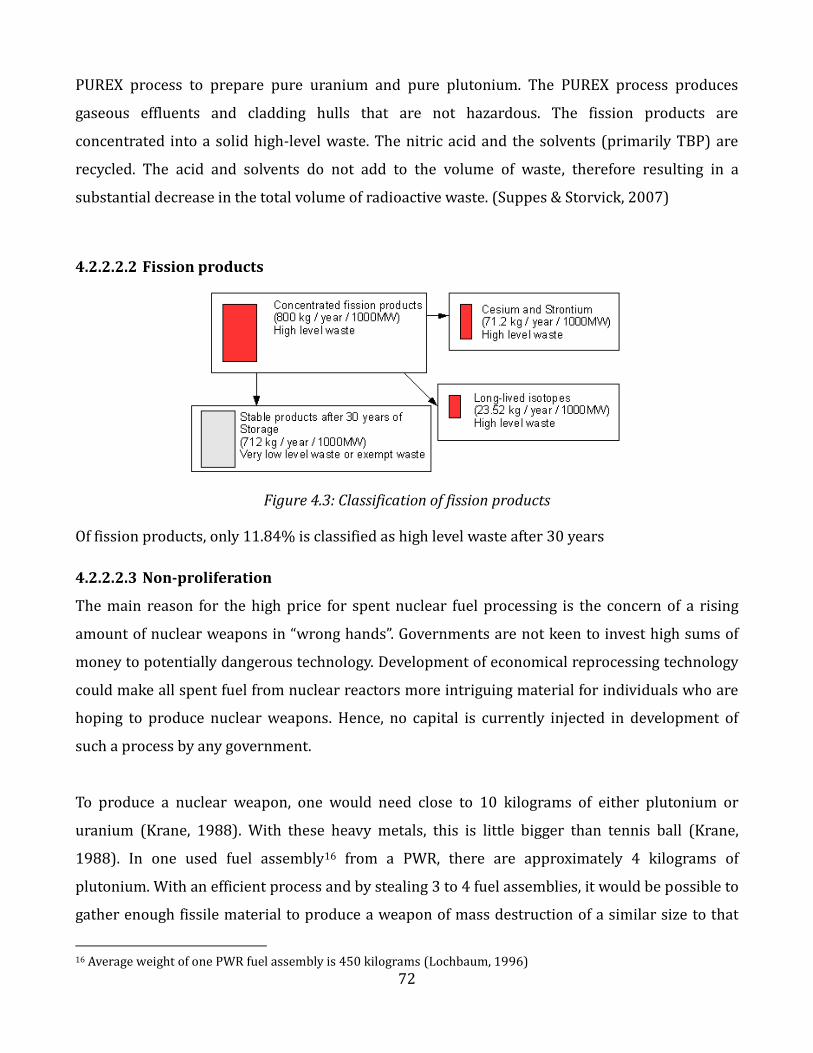
72
PUREX process to prepare pure uranium and pure plutonium. The PUREX process produces
gaseous effluents and cladding hulls that are not hazardous. The fission products are
concentrated into a solid high-level waste. The nitric acid and the solvents (primarily TBP) are
recycled. The acid and solvents do not add to the volume of waste, therefore resulting in a
substantial decrease in the total volume of radioactive waste. (Suppes & Storvick, 2007)
4.2.2.2.2 Fission products
Figure 4.3: Classification of fission products
Of fission products, only 11.84% is classified as high level waste after 30 years
4.2.2.2.3 Non-proliferation
The main reason for the high price for spent nuclear fuel processing is the concern of a rising
amount of nuclear weapons in “wrong hands”. Governments are not keen to invest high sums of
money to potentially dangerous technology. Development of economical reprocessing technology
could make all spent fuel from nuclear reactors more intriguing material for individuals who are
hoping to produce nuclear weapons. Hence, no capital is currently injected in development of
such a process by any government.
To produce a nuclear weapon, one would need close to 10 kilograms of either plutonium or
uranium (Krane, 1988). With these heavy metals, this is little bigger than tennis ball (Krane,
1988). In one used fuel assembly16 from a PWR, there are approximately 4 kilograms of
plutonium. With an efficient process and by stealing 3 to 4 fuel assemblies, it would be possible to
gather enough fissile material to produce a weapon of mass destruction of a similar size to that
16 Average weight of one PWR fuel assembly is 450 kilograms (Lochbaum, 1996)

73
used in Hiroshima in 1944.
Another possible way to use spent nuclear fuel in warfare is to produce so called dirty-bomb.
With a dirty-bomb the explosive power of the bomb is not of interest. The Interest lies in
producing radiation problems in a large area. This can be done by, for example, obtaining “fresh”
fission products and spreading these products via a conventional explosion. Producing such a
device is not hard, but it should be hard is to obtain large quantities of radioactive material.
4.2.2.3 Comparing these two choices
The problematic issue of spent fuel management can be handled in two ways. The simple one,
which is at the same time more proliferation-safe, is to bury all waste deep in the ground. This
solution is used in Finland, where spent fuel can also be retrieved from the storage (Posiva,
2009). This is to say that it is possible to also retrieve spent fuel from repository with relative
ease (Posiva, 2009).
A more complicated option is to reprocess the waste and use the parts that are reusable. This also
means that magnitude of uranium mining would be smaller in the future, but comes with the
problems of proliferation. However, as the high level waste is now minimized, the amount of
highly dangerous material is a fraction of the amount in first solution. Almost 70% of nuclear
power plants in the world rely either on PWR or BWR technology. Assuming that all power plants
produce the same amount of waste per 1000MW, yearly amounts of high level waste that have to
be handled can be calculated. This calculation is presented in Figure 4.4 below.

74
Figure 4.4: Back-end fuel cycle choices, with worldwide approximated quantities
Even though the numbers are rough estimates, the magnitude of the problem is obvious. Adding
to the problem is the fact that in some countries the waste problem has not been assessed at all.
For example, in USA spent fuel has been sitting in spent fuel pools from the start of the nuclear
power plant era in the late 1960’s (Lochbaum, 1996). In Figure 4.4 numbers were presented for
one year, but the problem has to be solved for 30 past years and years to be come. It is very clear,
that this is the main issue of future nuclear power plant industry.

75
5 Economics
From the viewpoint of economics, energy can be seen in two different ways: It can be seen as a
commodity or as a service. It can be bought and sold like a commodity with a uniform price
through the markets. However, as electricity, it has to be produced at the same time as it is
consumed and it cannot be sold twice. There are therefore two different energy forms in this
sense: energy which in form of fuel that can be stored easily without wear and tear
(commodities) and electricity (service). In this thesis, it is seen mostly as a service as it is sold to
customer as electricity. In this chapter the economics of nuclear power are discussed and
compared to other available sources.
5.1 Choosing between energy sources
Economic factors are always the major deciding factor for energy sources. However, as world has
become very “small”, information, commodities and even large amounts of workforce can easily
be moved from China to Sweden in a relatively short time. With this in mind it seems illogical that
the way electricity is produced differs greatly between countries. It would be understandable if
France and Guatemala had completely different energy sectors, but why is there huge difference
between neighboring countries such as Germany and France?
To answer this question, variables in economics have to be discussed. Geography is the obvious
one: what kind of topography does an area have, is there sufficient thermal gradient for
geothermal usage, are there rivers that can be used, how many sunny days does this area have in
a year, what kind of wind speed can be found, is there coal, uranium or thorium in this area?
Another big factor is the politics in the area, which comes down to question of what do people in
this area appreciate. Usually governments encourage investment in local resources and
industries. Hence, if there is an industry that produces parts for coal plants, the fact that building
a coal plant can boost local industry might “out-weigh” the disadvantages of the plant. Similarly
the history of accidents and other variables that are kept in the minds of people affects choices
through the politics in the area. A third major factor is the demand. Below, in Figure 5.1,
electricity demand and production in Finland is shown for the year 2009.
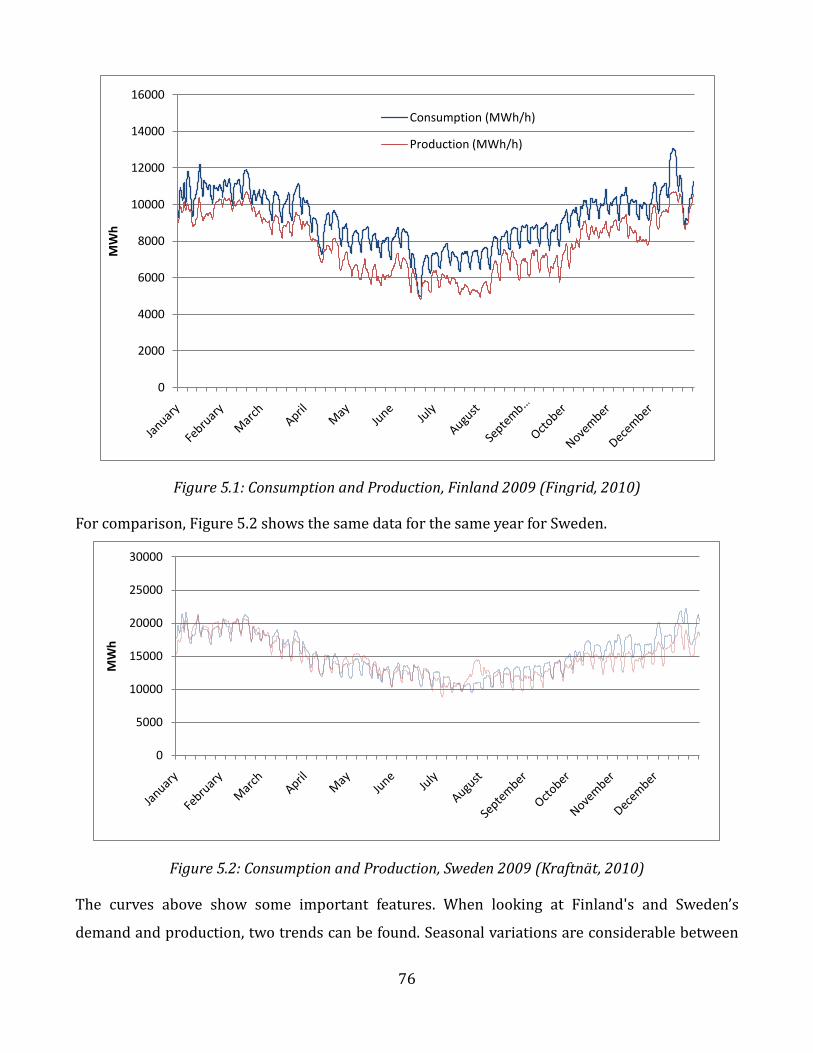
76
Figure 5.1: Consumption and Production, Finland 2009 (Fingrid, 2010)
For comparison, Figure 5.2 shows the same data for the same year for Sweden.
Figure 5.2: Consumption and Production, Sweden 2009 (Kraftnät, 2010)
The curves above show some important features. When looking at Finland's and Sweden’s
demand and production, two trends can be found. Seasonal variations are considerable between
0
2000
4000
6000
8000
10000
12000
14000
16000
MW
hConsumption (MWh/h)
Production (MWh/h)
0
5000
10000
15000
20000
25000
30000
MW
h
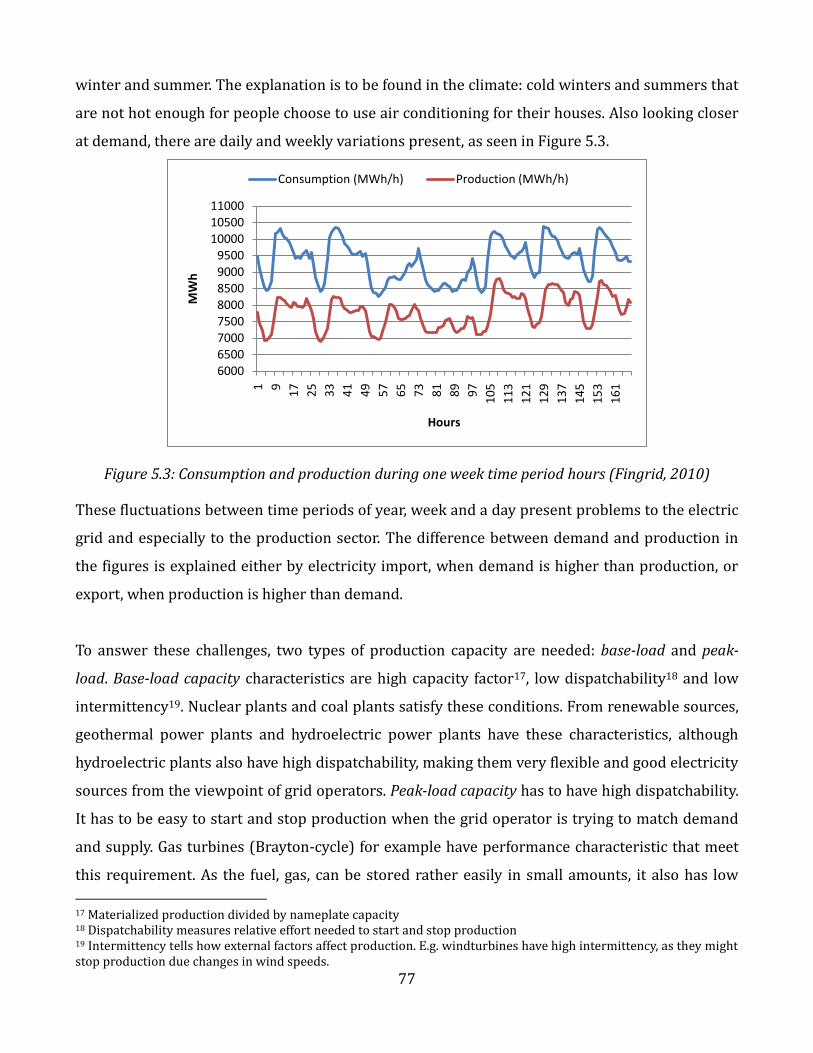
77
winter and summer. The explanation is to be found in the climate: cold winters and summers that
are not hot enough for people choose to use air conditioning for their houses. Also looking closer
at demand, there are daily and weekly variations present, as seen in Figure 5.3.
Figure 5.3: Consumption and production during one week time period hours (Fingrid, 2010)
These fluctuations between time periods of year, week and a day present problems to the electric
grid and especially to the production sector. The difference between demand and production in
the figures is explained either by electricity import, when demand is higher than production, or
export, when production is higher than demand.
To answer these challenges, two types of production capacity are needed: base-load and peak-
load. Base-load capacity characteristics are high capacity factor17, low dispatchability18 and low
intermittency19. Nuclear plants and coal plants satisfy these conditions. From renewable sources,
geothermal power plants and hydroelectric power plants have these characteristics, although
hydroelectric plants also have high dispatchability, making them very flexible and good electricity
sources from the viewpoint of grid operators. Peak-load capacity has to have high dispatchability.
It has to be easy to start and stop production when the grid operator is trying to match demand
and supply. Gas turbines (Brayton-cycle) for example have performance characteristic that meet
this requirement. As the fuel, gas, can be stored rather easily in small amounts, it also has low
17 Materialized production divided by nameplate capacity 18 Dispatchability measures relative effort needed to start and stop production 19 Intermittency tells how external factors affect production. E.g. windturbines have high intermittency, as they might stop production due changes in wind speeds.
60006500700075008000850090009500
100001050011000
1 9
17
25
33
41
49
57
65
73
81
89
97
10
5
11
3
12
1
12
9
13
7
14
5
15
3
16
1
MW
h
Hours
Consumption (MWh/h) Production (MWh/h)
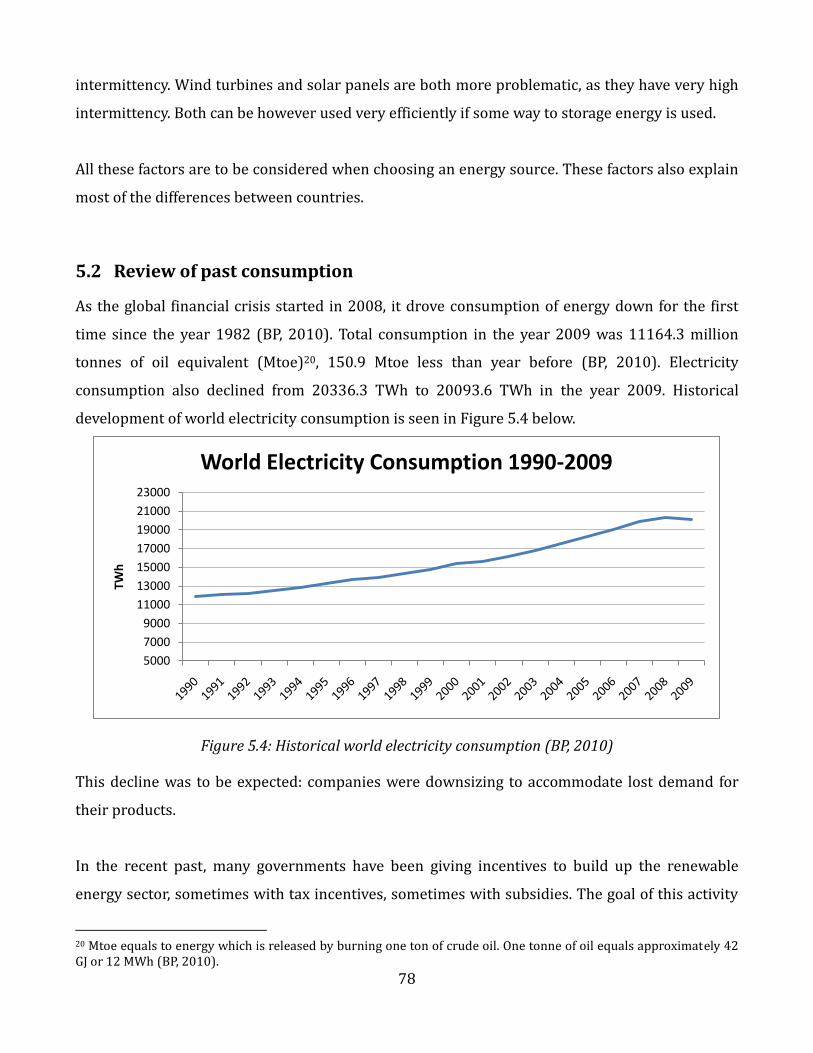
78
intermittency. Wind turbines and solar panels are both more problematic, as they have very high
intermittency. Both can be however used very efficiently if some way to storage energy is used.
All these factors are to be considered when choosing an energy source. These factors also explain
most of the differences between countries.
5.2 Review of past consumption
As the global financial crisis started in 2008, it drove consumption of energy down for the first
time since the year 1982 (BP, 2010). Total consumption in the year 2009 was 11164.3 million
tonnes of oil equivalent (Mtoe)20, 150.9 Mtoe less than year before (BP, 2010). Electricity
consumption also declined from 20336.3 TWh to 20093.6 TWh in the year 2009. Historical
development of world electricity consumption is seen in Figure 5.4 below.
Figure 5.4: Historical world electricity consumption (BP, 2010)
This decline was to be expected: companies were downsizing to accommodate lost demand for
their products.
In the recent past, many governments have been giving incentives to build up the renewable
energy sector, sometimes with tax incentives, sometimes with subsidies. The goal of this activity
20 Mtoe equals to energy which is released by burning one ton of crude oil. One tonne of oil equals approximately 42 GJ or 12 MWh (BP, 2010).
5000
7000
9000
11000
13000
15000
17000
19000
21000
23000
TWh
World Electricity Consumption 1990-2009

79
is to make renewable energy more competitive by moving either the supply curve or the demand
curve. For example, giving tax incentives makes the production cheaper, hence moving the supply
curve “down”: for a given price there is now more supply than before. However, there is one way
to produce electricity which is so much cheaper than anything else: coal. This manifests in
relative high percentage of coal use in worldwide electricity production. In Figure 5.5, the
electricity production of the world is presented by source and below that, Figure 5.6, by region.
Figure 5.5: Electricity generation by source in 2007 (IEA, 2010)
From four of the major technologies used to produce electricity, two have ability to respond peak-
load requirements: hydro and gas. The relative small percentage of hydro is explained with low
maximum potential.
Coal41%
Other3%
Hydro15%
Nuclear14%
Gas21%
Oil6%

80
Figure 5.6: Electricity generation by region (BP, 2010)
The two big growing markets, India and China, have to be given a more detailed look. In these two
markets the sharp rise in energy demand has to be accommodated in production. Figure 5.7
shows China's and India's growth in electricity consumption.
Figure 5.7: Historical energy consumtion, China and India
When an area or country has increased demand for electricity or energy, both base load and peak
load capacity has to be grown to provide this energy. In big markets, like India and China, a small
change in demand means that the capacity needed to accommodate this change might equal to 20
0
5000
10000
15000
20000
19
90
19
91
19
92
19
93
19
94
19
95
19
96
19
97
19
98
19
99
20
00
20
01
20
02
20
03
20
04
20
05
20
06
20
07
20
08
20
09
TWh
Asia Pacific
Africa
Middle East
Europe & Eurasia
S. & Cent. America
North America
0
500
1000
1500
2000
2500
3000
3500
4000
19
90
19
91
19
92
19
93
19
94
19
95
19
96
19
97
19
98
19
99
20
00
20
01
20
02
20
03
20
04
20
05
20
06
20
07
20
08
20
09
TWh
China
India

81
GW rise in average load (base load) and a 3 GW in peak load. The choice between different energy
sources are dictated by factors discussed earlier in “choice of energy source”-section. Already it
can be seen that currently only few technologies are capable of providing big increases in base
load, when the economics factor is prominently in the mind of decision maker. Namely, these
technologies are coal, gas, nuclear and hydroelectric.
5.3 Assessment of future growth
People tend to want more than they have, regardless of the starting point: life can always be made
better from individual viewpoint. All western economies rely on this concept and the future
planning is done with growth in mind. But what dictates the growth, what are the variables in
macroeconomics, which lead to growth? One widely used model in a neo-classical framework is
Solow´s growth model (Solow, 1956). The implications of this model in the long term are that the
growth is a result of two variables, growth in population and technological progress (Solow,
1956).
The world population is growing and by 2050 the population is expected to be 9 billion (UN,
2009). As explained above, the rational choice of human being is always to try to achieve higher
standard of living. This drives the technological progress. Both of the factors that were needed to
have growth are now fulfilled. This applies even if we stay at this standard of living in the western
world that we have right now and wait for the other countries to catch up. Big markets like China
and India are driving growth in the world today.
5.3.1 Estimating the future consumption
The connection between production of goods and services in the economy and energy usage is
called the energy intensity of the economy. In its most basic form for long term it can be defined
as
Energy intensity is a ratio, which tells how much energy was used per given one unit of output. It
82
is obvious that if the energy used stays the same and economy is growing, the energy intensity
has to constantly get lower. It is also immediately clear that there are diminishing marginal
returns: for every invested amount of money we get less improvement than the last time with the
same invested amount. This is because it is harder to make things more and more energy
efficient. Even China, which has had very inefficient production capacity, have been problems
with meeting the goals that they have set (Chen & Aizhu, 2010).
Future GDP can be estimated assuming a growth rate. Assuming a certain declining rate for
energy intensity, the value for energy intensity can be obtained. With this method, estimation of
future energy consumption can be calculated.
Another estimate is offered by an MIT study from 2003 in which an estimate for future energy use
was made by assuming different growth rates in energy use per capita. There is a correlation
between the United Nations Human Development Index (HDI) and energy use per capita.
Therefore, if individual countries are given their own growth rates of population and energy use,
an estimate for the world can be obtained. In Figure 5.8, the HDI of various countries is plotted
against energy use per capita. Vertical line at 4000KWh divides countries roughly in two parts,
countries where per capita energy use is growing slowly and countries that will be experiencing
faster growth. (MIT, 2003)

83
Figure 5.8: HDI and annual electricty use per capita (MIT, 2003)
There are now two estimates that can be made: First, the level of energy intensity and economic
growth rate can be assumed, giving an estimate of energy usage for a country. Second, the
estimate from MIT calculated through growth rates in energy use per capita. These estimates are
given for China, India and 28 developed countries21.
Average growths in the energy use through to year 2050 for these countries were 162.8%, as
calculated through energy intensity assumptions, and 196.9% as estimated in the MIT report. In
Table 5.1, the results are presented as growth percent of energy use.
21 Australia, Austria, Belgium, Canada Czech Republic, Denmark, Finland, France, Germany, Greece, Hong Kong, Iceland, Ireland, Italy, Japan, Korea Republic, Netherlands, New Zealand, Norway, Portugal, Singapore, Slovakia, Spain, Sweden, Switzerland, United Kingdom and United States.

84
Table 5.1: Energy demand in 2050 in percents of demand today
Neutral Optimistic Pessimistic MIT
Developed countries 162.8 102.85 256.48 196.9
China 250.51 158.27 394.66 464.02
India 216.36 136.7 340.87 1000
Three different scenarios were created by assuming different rates of decline for energy intensity.
An annual average growth 2.2% of GDP was used for developed countries, 6% for India and
China. The assumption of GDP growth does not change between scenarios, the only variable is the
growth rate of energy intensity. In the “neutral” scenario an 1.5% decline rate in energy intensity
was used. The optimistic scenario has a relatively high decline rate of 2.5%, and the pessimistic
scenario has a decline rate of 0.5%. Using these numbers, the energy intensity was 50.66% of the
2010 level in the year 2050 for the normal scenario, 32% for the optimistic scenario and 79.81%
for the pessimistic scenario.
From these estimates it can be seen that future demand for electricity is likely to be 100% - 400%
higher than it is today. Using energy intensity calculations, it is easy to say that even with modest
growth in economies, energy intensity has to be reduced to one third of the 2010 level in 2050 to
keep the energy usage close to today's levels.
If one assumes that car fleets around the world will make a slow transition to electric vehicles,
the form of energy that is needed will change from fossil fuels, leading to even greater demand for
electricity.
5.3.2 CO2 problem
Global warming and climate change have been in increased media attention in the past 10-20
years, and the impact of greenhouse gas emissions have became common knowledge. As a result
of this, CO2 problem is in political priorities for coming centuries.

85
5.3.2.1 CO2 by the source
The link between energy and emissions is obvious. Figure 5.9 presents the how global emissions
are divided between sources.
Figure 5.9: CO2 emissions by source and by fuel 2006 (WRI, 2010) (IEA, 2010)
Energy related GHG emissions make up to 75% of the global emissions in the year 2006. Oil is
massive contributor to GHG, but coal and peat contribute together even more than oil.
5.3.2.2 CO2 by region
Figure 5.10: CO2 emissions by region (BP, 2010)
Asia Pacific43%
North America22%
Europe & Eurasia
22%
Middle East6%
S. & Cent. America
4%
Africa3%

86
Figure 5.111: CO2 emissions by country (BP, 2010)
As seen in Figure 5.10 and Figure 5.111 a few big emitters contribute the bulk of GHG´s The 17
biggest emitters emit over 75% of world’s CO2 emissions. Another thing to note is the small
amount of CO2 emissions from Africa.
5.3.2.3 Solving CO2 problem
Growth in the energy demand and the need for reducing greenhouse gases poses a difficult
problem. Aging nuclear power plant fleet in countries like USA, where no new nuclear power
plants have been built from late 1980’s to present day, contribute to this problem. When old
reactors go off-line permanently, there is no capacity to fill this void (MIT, 2003). This wave of
“phasing out nuclear power” is mostly a result of the Chernobyl accident, which led to a change in
the political environment. Countries like Germany and Sweden are currently overturning these
decisions due to a need for CO2-free energy has arisen (Demarest, 2010) (Göteborgs-Posten,
2010).
To reduce emissions, there are a few possible solutions: increasing the efficiency in energy
generation and use, using CCS (carbon capture and storage) techniques and growth in the nuclear
China24%
US19%
India5%
Russian Federation
5%
Japan4%
Germany3%
South Korea2%Canada
2%
Iran2%
Saudi Arabia2%
United Kingdom
2%
South Africa2%
Mexico1% Italy
1%
Brazil1%
France1% Other
24%

87
power sector or in the renewable energy sector. (MIT, 2003)
5.3.2.3.1 Increasing efficiency
Increasing efficiency in generation and use of electricity is a concept similar to decreasing energy
intensity. For example, changing more efficient turbines to coal plant or producing more energy
efficient televisions, both increase the efficiency and lower the energy intensity. Limitations to
efficiency set a maximum gain from these measures.
5.3.2.3.2 CCS
Carbon capture and storage is a process where CO2 is usually collected from flue gas (Herzorg &
Golomb, 2004). Other means are possible, but they can be used only when new CO2-emitting
plants are built (Herzorg & Golomb, 2004), and therefore are not as interesting for the short term.
A 1000 MW coal fired power plant emits 6-8Mt of CO2 in a year and a natural gas combined cycle
3-4Mt of CO2 in a year (Herzorg & Golomb, 2004). More advanced 1000MW coal fired power plant
with post combustion capture devices produces over 10Mt of CO2 in a year, which are now
captured (MIT, 2007). The difference between CO2 emissions of old plants and new plants comes
from lowered efficiency (MIT, 2007). An obvious problem concerning storage is the magnitude of
emissions: the world's coal power plants emitted over 12221Mt of CO2 in total during 2007 (IEA,
2010). There are projects where CO2 is injected deep into the ground, one of them being Statoil's
Sleipner project. This 100 million dollar project has been running since 1996 injecting 8 million
tonnes of CO2 to the ground in its first 11 years of operation (Statoil, 2009). One may assume,
optimistically, that now, when the technology is known, it is possible to inject at 5 times the rate
of the Sleipner project to date. This equals 3.6 Mt of CO2 per year. With this amount of injection
per platform, if all CO2 from coal plants is to be captured and injected, almost 3400 of such
platforms would be needed.
5.3.2.3.3 More nuclear and renewable energy
The best solution for slowing down climate change would be to stop using fossil fuels. In the
transport sector, this means electric cars and in the electricity generation sector this means using
energy sources that emit little or no CO2. To remove all fossil fuels from Figure 5.5, they have to be
displaced with growing sectors of renewable energy and nuclear. Hydroelectric generation is the

88
biggest renewable electricity generator, contributing 15% of global electricity production in
2007, while other renewable energy sources22 add 3% and nuclear energy 14% (REN21, 2008).
Increasing any of these three options over the average growth rate will displace current fossil fuel
generation and therefore solve GHG problem.
5.3.2.4 CO2 emissions from nuclear power plants
It is obvious that there are CO2 emissions from every power plant that is built as well as from
operation of that power plant.
5.3.2.4.1 Emissions related to plant materials
For example, 900kg of CO2 are released for every 1000kg of concrete produced
(Mahasenan;Smith;& Humphreys, 2003). In Olkiluoto, Finland, a generation III nuclear power
plant is being built. The complete power plant at Olkiluoto requires 250 000 cubic meters of
concrete (Repo, 2005). This volume of concrete is accompanied by release of 0.54Mt of CO2. This
release can be divided by the lifetime of the plant (60 years), making CO2 emissions from the
nuclear power plant fairly low (9000 tons per year). Compared to new coal power plant with CCS
(10Mt per year) this number is negligible.
5.3.2.4.2 Emissions related to nuclear power plant operation
Most of the CO2 emissions from nuclear power plant operation are from the nuclear fuel cycle.
This is obvious, as the front-end nuclear fuel cycle involves five energy demanding steps,
presented in chapter 2. However, there is debate going on about the amount of CO2 these
processes produce. MIT in their study of nuclear power did not discuss CO2 emissions from fuel
cycle at all, while on the other hand Storm van Leeuwen and Smith approximate these emissions
to be 332g of CO2/kWh for complete fuel cycle when low to very low grade ore (0.1%-0.001%) is
used (MIT, 2003) (Smith & Storm van Leeuwen, 2008). It is immediately clear, that the higher the
amount of uranium in the ore, the lower the emissions from mining and milling processes.
Storm van Leeuwen and Smith approximate emissions for complete fuel cycle to be 115g of
22 Geothermal, wind, solar, modern biomass and biofuels.
89
CO2/kWh when low grade uranium is used and 332g of CO2/kWh when ore with 0.013% grade is
used (Smith & Storm van Leeuwen, 2008). These values have received a lot of critique, for
example from World Nuclear Association (WNA, 2009).
AEA Technology Environment has produced a complete life cycle analysis for Torness nuclear
power station in United Kingdom. The fuel for this power plant comes from Olympic dam mine,
Australia, which has very low grade uranium available (0.028%). Olympic dam has multi-mineral
ore, making it feasible to mine this very low grade uranium. Even with this very low grade
uranium, Torness nuclear power plant has emissions of 6.85g of CO2/kWh (AEA, 2006).
Vattenfall has produced similar life cycle analysis for their power plant in Forsmark, Sweden, and
show numbers close to 6g of CO2/kWh for complete fuel cycle (Vattenfall, 1999).
Martin Taylor estimates that one nuclear power plant, with nameplate capacity of 1300MW, has
emissions of 38300 tons of CO2 per year. With capacity factor of 85%, this equals approximately
to 4g of CO2/kWh. (Taylor, 1997)
While article from Storm van Leeuwen and Smith is widely cited, it cannot be treated as the
absolute truth. With all the critique towards these high numbers and due to the values from
Forsmark, Torness and estimation from Taylor, CO2 emissions from complete nuclear fuel cycle
are regarded in this paper as very low.
5.4 Electricity price in future
Increased demand for electricity will drive prices upward. In Figure 5.12 below, historical
consumer prices for electricity are presented for three areas: EU15, United Kingdom and Finland.

90
Figure 5.12: Historical electricity prices for consumers (Eurostat, 2010)
In the absence of large changes in economic activity, the variance in consumer electricity prices is
rather small. This is expected, as the small changes in economy do not affect individual electricity
use. In case of commercial electricity users, changes in economic activity change the production
of individual companies, resulting in change in energy demand. Electricity producers try to
negate this effect by offering long term contracts, which reduce the fluctuations in electricity
demand by industries. Industry electricity prices for same period of time and for same economic
areas are shown in Figure 5.13
Figure 5.13: Historical electricity prices for industry (Eurostat, 2010)
It is obvious that industries that consume large quantities of electricity pay a lower price, due to
0,0000
0,0200
0,0400
0,0600
0,0800
0,1000
0,1200
0,1400
0,1600
0,1800
Euro
s/K
Wh
EU15
United Kingdom
Finland
0,0000
0,0200
0,0400
0,0600
0,0800
0,1000
0,1200
Euro
s/K
Wh
EU15
United Kingdom
Finland

91
the long term contracts. Another notable effect which can be seen from Figures 5.12 and 5.13 is
that the growth period, which started in early 2000’s, affects the price of electricity in both
sectors. Increased demand raises the price and supply responds to that rise, as seen in the
decrease in consumer prices after the year 2007. Building up the electricity production industry
in electricity is fairly slow process. It cannot respond very fast to increased demand and the long
term contracts done by industries relying on electricity, no price decrease is yet seen for industry
electricity prices in Figure 5.13. As Figure 5.12 and 5.13 show, there are variations in prices in
both markets. If supply of electricity would be very fast to react to increases and decreases in
demand, it would be expected that the variance in price would be small.
In both sectors, Finland has reasonably flat prices. This is explained by differences in domestic
markets between Finland and the EU15 and shows that the electricity markets were not
completely connected. In the future it is expected that the whole EU area will have more uniform
prices for households and for industry.
Nuclear power will stay competitive if prices stay at similar levels as in the past decades and no
other technology makes a breakthrough. Enhanced geothermal could be one of these emerging
technologies that will offer renewable energy with lower price and produce large quantities of
electricity. It is very hard to estimate the future price level. Even though the demand will rise
steadily, increase of supply is dependent on politics, technological advances and the economic
situation.
The CO2 neutrality of nuclear power might also provide an advantage for the nuclear industry.
5.5 Levelized cost calculations
The price of electricity from a power plant can be divided in three factors: capital costs, operation
and maintenance costs (O&M costs), and fuel costs23. Naturally, capital costs are the biggest of
these three. Fuel costs cover 15 to 25 percent of total generation costs with 5 percent real
discount rate (OECD, 1994). Compared to 40-60 percent in coal and 70-80 in gas, fuel costs are
relatively low in nuclear power (OECD, 1994). This is due to the huge energy intensity of nuclear
23 All costs have been changed from nominal prices to real prices using consumer price index.

92
fuel.
In the following estimations, a modest rate of inflation of 2.2% is assumed. The annual price of
money, interest on capital for every year, is estimated to be high, 12%, and taxes are 30%. The
power plant has nameplate capacity of 1500MWe, lifetime of 60 years and pessimistic building
time of 5 years. Nuclear power plants in the United States achieved average capacity factor of
89.82% during 9 years, from 2000 to 2008 (EIA, 2008). This in mind, capacity factor of 90% is
chosen.
5.5.1 Capital costs
Real overnight construction costs24,25, for a nuclear power plant vary between 841.2€/kWe26 and
1966€/kWe27 (OECD, 2005). The MIT study (2003) estimated a price of 1566€/kWe by reviewing
different sources. Another study conducted by Tarjanne & Rissanen (2000) estimated
1760€/kWe overnight costs. Reasonable estimates for overnight costs would then be from
1000€/kWe to 2000€/kWe. Three scenarios are chosen, pessimistic 2000€/kWe, optimistic
1000€/kWe and neutral 1500€/kWe.
To calculate the price of electricity from capital costs, the following equation is used.
(6)
,
With capital costs of 1000€/kWe, 1500€/kWe and 2000€/kWe, equation 6 gives result of 0.0330
€/kWh, 0.0495€/kWh and 0.0659€/kWh, respectively.
To compare this result with other technology, the same calculation for wind yields up to
0.0812€/kWh28.
24 Overnight construction costs are defined as the sum of all building costs of the plant spent instantaneously 25 If costs are in US dollars, the exchange rate used is average of July 2010, 0.783286
(X-Rates, 2010)
26 1000MW VVER power plant built in Czech Republic 27 1330MW ABWR power plant built in Japan 28 Wind capacity factor is 25%. Building time is one year and price is 900€/kW. (Morthorst, 2001)
93
5.5.2 Operation and maintenance costs
After the initial investment has been made and the nuclear power plant is ready to start
producing electricity, maintenance is needed between planned intervals. Also wages of plant
workers and spare parts has to be paid for. These expenses are accounted for in operation and
maintenance costs (O&M costs). Data based on actual numbers provided by nuclear power plant
companies shows that annual O&M costs fluctuate between 40.3€/kWe and 71.6€/kWe (OECD,
2005). Therefore, 40€/kWe is chosen to represent optimistic scenario, 56€/kWe a neutral
scenario and 72€/kWe a pessimistic scenario. Equation 7 is used to compute how O&M costs
contribute to the price of electricity
(7)
,
In the pessimistic situation, the additional price from operation and maintenance of the plant is
0.0151€/kWh. In the neutral scenario this number is 0.0118€/kWh and 0.0084€/kWh in the
optimistic scenario.
To provide perspective, wind power usually has O&M costs from 0.012€/kWh to 0.015€/kWh
(Morthorst, 2001).
5.5.3 Fuel costs
It is more complicated to estimate fuel costs in nuclear power plants than in conventional fossil
fuel plants. This is due to the rather complicated process of uranium mining, milling, conversion,
enrichment and fuel fabrication. With reactors that are capable of using natural uranium, this
process is closer to one used to provide fuel to coal plant. Like coal, uranium is available ready
from the ground, but still has to be processed before use.
Unlike other technologies, used fuel has to be processed. This is back-end fuel cycle can be done
using either of two options: fuel has to be reprocessed or put in long-term storage.
5.5.3.1 Front-end fuel prices
Front-end fuel cycle is the way for uranium from the ground to find itself in the nuclear reactor.
These steps are mining and milling, conversion, enrichment and fuel fabrication. Prices for these
processes are presented below.
94
As seen in chapter 2, uranium prices have been fluctuating heavily during last 20 years. The
lowest price in long term contracts has been close to 15.67€/kgU, while the highest price has
been as high as 78€/kgU. The price today is close to 35.2€/kgU, but as nuclear power is
experiencing new interest due to the carbon dioxide problem, price is more likely to rise than
decline even though advances in technology have been increasing the amount of recoverable
uranium at low prices. (OECD, 1994)
Yellowcake (U3O8) has to be converted to uranium hexafluoride before it can be enriched. This
conversion costs approximately 10.28€/kgU (OECD, 1994).
Enrichment capacity is measured in separative work units (SWU). 200.000 to 300.000 SWU’s was
needed to produce one load of enriched fuel for a light water reactor. The approximate price for
one SWU is 137.91€ (OECD, 1994).
As nuclear reactor fuel assemblies are not uniform in size, weight or material, there are huge
differences between costs of producing fuel elements and putting them in fuel assemblies. An
average value of 344.79€/kgU for fuel fabrication is adopted for this text, while prices range from
250.75€/kgU to 501.50€/kgU. (OECD, 1994)
5.5.3.1.1 Cost of front-end fuel cycle for one kilogram of uranium
To produce one kilogram of enriched uranium, 8.9 kilograms of natural uranium are needed.
There are losses especially in the enrichment process, but also in the conversion process. When
8.9 kgU are brought to the conversion facility, only 7.5kgU is transformed to UF6. From this
amount of UF6, 7.3 SWU are needed to produce one kilogram of enriched uranium. In a fuel
fabrication plant, this enriched uranium, still in the form of uranium hexafluoride, is transformed
back to UO2 and inserted into the fuel cladding.

95
Table 5.2: Estimated costs of front-end uranium fuel cycle (WNA, 2009)
Uranium 8.9kgU 35.2€/kg 313€
Conversion 7.5kgU 10.28€/kg 77€
Enrichment 7.3SWU 137.91€/SWU 1006€
Fuel fabrication kgU 344.79€/kgU 345€
1741€
The estimated price of one kilogram of enriched material ready to be put into the reactor is
1741€. This is the price of front-end cycle. Adding to the price is either disposal to long-term
storage or reprocessing.
5.5.3.2 Back-end fuel cycle costs
Reprocessing option costs can be divided among spent fuel transport, reprocessing (including
disposal of LLW and ILW) and disposal of HLW. Prices of these phases are 50€/kg, 720€/kg and
90€/kg, respectively. This amounts to 860€/kg of spent fuel. If reprocessing of fuel is chosen as
the back-end cycle, the estimated price for full fuel cycle is 2601€/kgU. (OECD, 1994)
Another option is to look at the spent fuel as a waste and put it into long term storage. Transport
to an interim storage site is the first part of the long-term storage option, with an approximate
price of 230€/kg. The second part is to encapsulate the fuel and store it. As the second part has a
cost of 610€/kg, the costs for long-term storage are 830€/kg. With long-term storage, the full fuel
cycle cost is 2571.91€/kgU. (OECD, 1994)
In Finland, long-term storage facilities cost is 545€/kg, so the approximation of 610€/kgU is
pessimistic, but nonetheless close to the truth.
5.5.3.3 Cost of whole fuel cycle
The additional cost of fuel to the price of electricity is obtained from
(8)
Another variables are the same, while the thermodynamic efficiency of 31% is chosen and
burnup is assumed to be 45.000 megawatt days per metric tons.

96
Depending on the chosen back-end fuel cycle option, fuel costs add up to either 0.0129€/kWh
with long-term waste disposal or 0.0136€/kWh with spent fuel reprocessing.
5.5.4 Levelized cost for nuclear power plant produced electricity
With these crude approximations downside and upside scenarios were estimated. In the worst
possible situation and using reprocessing of nuclear fuel, the price of electricity is 0.0947€/kWh.
The best case scenario would allow production of electricity at price 0.0543€/kWh, while
disposing spent fuel in long-term storage facility.
Table 5.3: Levelized costs (€ cents /kWh)
Optimistic Neutral Pessimistic
Capital costs 3,297 4,946 6,595
O&M costs 0,842 1,178 1,515
Total with disposal option 5,429 7,414 9,4
Total with fuel reprocessing 5,503 7,488 9,474
Using these assumptions, the levelized price is relatively high. Two major contributors are the
interest rate and the building time. If the plant is built in 4 years and the interest rate were 5%,
the price would be 0.0325€/kWh for the best case scenario with long-term disposal and
0.0513€/kWh for the worst case with reprocessing. OECD presents similar results, for example in
Finland, the price of electricity would be 0.0285€/kWh (OECD, 2005).

97
6 Sustainability and Nuclear sector
6.1 What is sustainable energy production?
The Brundtland report defines sustainable development in the following way:
“Sustainable development is development that meets the needs of present without compromising the
ability of future generations to meet their own needs. It contains within it two key concepts:
- the concept of ‘needs’, in particular the essential needs of the world’s poor, to which
overriding priority should be given; and
- the idea of limitations imposed by the state of technology and social organization on the
environment’s ability to meet present and future needs” (UN WCED, 1987)
The message of this widely used report is to leave the same possibilities for next generation that
previous generation left to you. Using a strict interpretation, this would mean that a very small
amount of human activity really complies with this goal. It becomes even more complicated when
considering the needs of future generations. Previous generations, who lived hundred years ago,
could probably not see what materials are currently valuable. Therefore, in the absolute
interpretation, only strict conservation would be sustainable.
The most pressing aspect of sustainability is to ensure preservation of life-sustaining things, eg.
cultivatable soil, fresh air and biodiversity. Due to global effects of GHG´s, CO2 can be seen more
dangerous to humankind than local toxic waste problem as local pollution is pollution limited to
certain area, but global effects are seen everywhere. Therefore preventing global pollution has to
be more important task than preventing local pollution. Another important aspect of
sustainability is to try to use minimal amounts of precious materials, like uranium, but it cannot
be in the top of the importance list. Next generations would probably be more interested of
preserving air and cultivatable soil than depleting earth of materials like uranium, lithium, silicon
or even coal.
6.2 Fixed variables of sustainability assessment
Security of supply and economic growth can be seen as problems while moving towards more
fully sustainable world. However, the stance of this paper is to take these variables as given and

98
therefore not consider them in the assessment29. As explained in economics chapter, growth of
economies is very hard to slow down. Choosing to have decline in GDP´s of the world or stopping
population growth would most likely lead to more chaotic societies, which would be harder to
control. If society cannot be controlled with a government, it is likely that the situation will be
less sustainable. One example of this behavior is destroying of rainforests by individuals who are
trying to acquire cultivable soil.
Similar situation is surrounding security of supply. The stance is taken that more sustainable
society has security of supply, as it is affecting the stability of societies with same results than in
suppressing growth. Security of supply and growth are reviewed shortly below.
6.2.1 Security of supply
Removing electricity from economic area would cause major problems to the people of this area.
Hence, it is important that electricity, or energy as general, is available. As the world is divided in
to economic clusters, one big question is the distribution of resources. The underlying question
therefore is not “are there enough resources” but rather “are there enough resources to supply for
a certain economic unit”. However, also in short term, supply has to be secured. Currently using
wind turbines, or solar panels, interfere with this goal, as they have high intermittency. Therefore
only coal, gas, hydro and nuclear can be seen as possible options today.
6.2.1.1 Resources
Assuming, that coal, gas and uranium are each used at the same rate that they are currently
consumed, resources are depleted as shown Figure 6.1 below.
29 One might ask that would it more sustainable in the long term to limit the population of the world or cut the GDP´s in half. However, these questions are out of scope of this paper and it is therefore not discussed with greater detail.
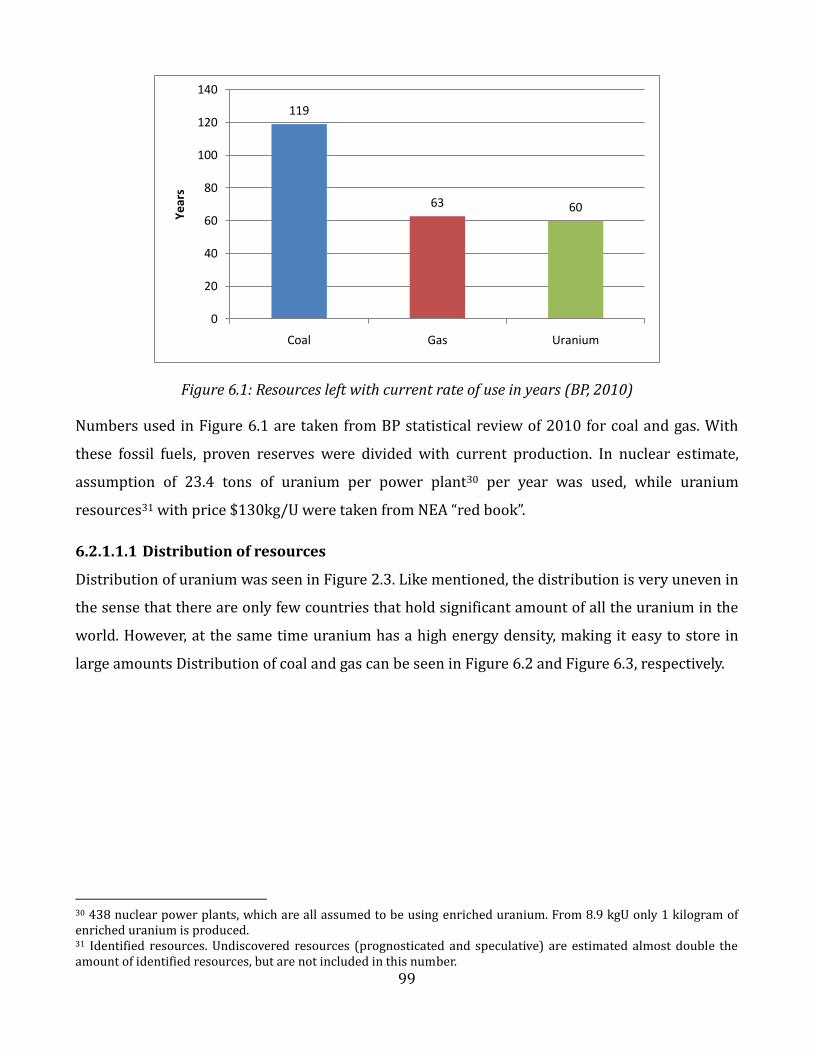
99
Figure 6.1: Resources left with current rate of use in years (BP, 2010)
Numbers used in Figure 6.1 are taken from BP statistical review of 2010 for coal and gas. With
these fossil fuels, proven reserves were divided with current production. In nuclear estimate,
assumption of 23.4 tons of uranium per power plant30 per year was used, while uranium
resources31 with price $130kg/U were taken from NEA “red book”.
6.2.1.1.1 Distribution of resources
Distribution of uranium was seen in Figure 2.3. Like mentioned, the distribution is very uneven in
the sense that there are only few countries that hold significant amount of all the uranium in the
world. However, at the same time uranium has a high energy density, making it easy to store in
large amounts Distribution of coal and gas can be seen in Figure 6.2 and Figure 6.3, respectively.
30 438 nuclear power plants, which are all assumed to be using enriched uranium. From 8.9 kgU only 1 kilogram of enriched uranium is produced. 31 Identified resources. Undiscovered resources (prognosticated and speculative) are estimated almost double the amount of identified resources, but are not included in this number.
119
63 60
0
20
40
60
80
100
120
140
Coal Gas Uranium
Ye
ars

100
Figure 6.2: Distribution of coal (BP, 2010)
Figure 6.3: Distribution of natural gas (BP, 2010)
As seen for figures above, distribution of fossil fuels is more “fair” than distribution of nuclear
fuel. It has to be noted that not all economical clusters have fossil fuels or nuclear power plant
fuel available and therefore security of supply issues have to be overcome by every economic
Total North America; 29,8%
Total S. & Cent. America; 1,8%
Total Europe & Eurasia; 33,0%
Total Middle East; 4,0%
Total Asia Pacific; 31,4%
Total North America; 4,9%
Total S. & Cent. America;
4,3%
Total Europe & Eurasia; 33,7%
Total Middle East; 40,6%
Total Africa; 7,9% Total Asia
Pacific; 8,7%
101
cluster individually.. Economies controlling uranium at this moment are fairly peaceful and run by
stable democracies, making it relatively easy to acquire during the next 60 years. However, it is
hard to predict the future developments, resulting in uncertainty and possible problem of
security of supply.
6.2.2 Growth
As discussed in economics chapter, the human population is expected to grow to 9 billion people
during the next 50 years (UN, 2009). While growth in population itself will provide a huge
increase in demand, a general rise in living standards will result even steeper economic growth.
However, as seen in many other sectors in economics, best driver for new innovations is growing
demand. Thus the question arises; is growing demand per se a bad thing? It is obvious that
knowledge of the results of actions is important. Research and development are therefore to be
held in high value. Hence, stance in this paper is that growth is a fixed variable and therefore not
discussed further.
6.3 Goals
If interpretation that phenomena affecting in global scale are the most important thing to
prevent, what is the order of other goals? Is it more sustainable to use resources and avoid
leaving waste behind or try to preserve resources and leave undesired waste to generations to
come? For example, given two options to generate electricity, where other option will deplete all
the material rather fast and the other will only leave vast amount of local waste, which options is
more sustainable? In this paper it is chosen so that material is not as expensive as waste: world is
better off with low amount of material than high amounts of material and waste.
Therefore, goals are set to be
1) To produce environmentally harmful results that affect in global scale as little as
possible.
2) To leave as little local pollution as possible.
3) To use resources in a way that valuable materials provided by nature are not
depleted.

102
Assessment of sustainability can be in absolute or relative terms. For absolute sustainability the
Brundtland report is followed to the letter. No harmful results in global scale at all, no waste and
no use of material of any kind. On the other hand, relative sustainability is discussed when two
technologies are compared to each other.
6.3.1 Sustainability in the long term
The long term goal of sustainability has to be none other than a fully sustainable electricity
production chain. There are energy sources that allow this goal to be reached. Technological
advances relating to economical wind and solar energy will no doubt bring us to a fully
sustainable electricity production chain, given enough time. These options are hopefully available
in near future. Further into the future, nuclear fusion power plant is likely to be one possible
technology that can be used. However, this option is relatively far away, comparing to wind and
solar energy.
From the vast amount of technologies available to provide electricity, only few selected ones can
provide it today at the needed rate. Hopefully, as power plants are renewed, technological
advances will let us rely more and more on fully sustainable options.
Thus, the problem is to decide on what energy technology to use on the way to a fully sustainable
future.
6.4 Assessment of available technologies
As explained, world will require base-load electricity in near future. Currently world electricity
generation chain is not even close to being sustainable. However, if the goal in energy sector is to
one day provide electricity via sustainable methods, the journey to this point should also be done
the most sustainable way possible.
In this chapter, base-load electricity technology is reviewed from sustainability viewpoint. As
hydro-electric is relative sustainable, it is not discussed in this section.
103
6.4.1 Sustainability assessment of base-line electricity technology today
6.4.1.1 Nuclear
6.4.1.1.1 Nuclear fuel cycle and sustainability
A nuclear power plant is not generally regarded as a sustainable power plant. The major problem,
waste management, makes it hard to see that this electricity production process would ever be
sustainable.
6.4.1.1.1.1 Front-end fuel cycle
Goal number three requires production method, which does not use high amounts of earth
resources. Nuclear fuel cycle does not comply with this goal, due to the fact that uranium is scarce
material on earth, as explained in chapter 2. The CO2 emissions from front-end fuel cycle are
under debate, as discussed in section 5.3.2.4.2. The stance of small emissions (4-6g of CO2/kWh)
was chosen due to life cycle analyses from Forsmark and Torness power plants.
Major contributor to this problem is the low amount of fissile material in mined uranium. From
8.9 kilos of uranium, on average only 1 kilo end up in enriched fuel assembly, due to the
enrichment process. Depleted uranium, which is a byproduct of enrichment process, is
accumulating in the back yards of enrichment facilities. While it is not a waste, it is not very useful
metal either. For USA only, 700,000 metric tons of depleted uranium is to be found (Fahey, 2003).
If this uranium is piled in to stacks 1 meter tall, this amount of depleted uranium is enough to
cover over five soccer fields32. It can be, however, used as ammunition and other applications
requiring heavy materials, mainly because it is denser than lead. While this uranium is fertile
material, it is hopefully used in breeder reactors in the future.
6.4.1.1.1.2 Back-end fuel cycle
Waste, a non-wanted product, is always against sustainability. If a service or product could be
offered without leaving any local waste, it would be more sustainable. Nuclear power plant waste
is even more problematic, as it is dangerous to people and bio-sphere as explained in section
1.6.1. The amount of waste left behind depends on the chosen fuel cycle. Fuel cycles and their
outcomes were presented in chapter for back-end fuel cycle. Both of these fuel cycles inflict with
32 Soccer field is normally sized 105 meters * 68 meters, while density of uranium is approximately 19 tons per m3 (Elert & Mirochnik, Density of Uranium, 2006).

104
goal number two. Chemicals used in reprocessing can be recycled; making reprocessing itself
rather sustainable.
6.4.1.1.2 Possible effects of nuclear power plants in global scale
The most important goal, number one, means that possible actions that are harmful in global
scale, would be used the least. Problems arising from nuclear fuel cycle do affect only locally, but
there are situations where nuclear power plant could potentially affect globally: proliferation and
accidents.
6.4.1.1.3 Proliferation
As discussed shortly in back-end fuel cycle chapter, reprocessing technology capable of removing
plutonium-239 and uranium-235 leftovers from used nuclear fuel in “wrong” hands would lead to
proliferation. It is also possible to break into reprocessing factories and steal nuclear grade
material. Nuclear bomb technology is well known and does not require sophisticated equipment,
thus this option have to be considered in when discussing sustainability. For example, Burma is
trying to enter the small community of nations that possess nuclear weapons, while Pakistan and
allegedly North Korea already belong to this group (BBC, 2010).
Other method for producing harm to large area is to use so called dirty-bomb. This, also as
discussed earlier in chapter 4, does not involve any knowledge or technology. By stealing used
fuel from nuclear power plant and using conventional explosives, it is possible to spread
radioactive fission products over a large area. While this is problem affecting local scale, breaking
goal number two, it can also be seen to produce harm in global scale, due to 2nd order effects. For
example, dirty bomb in one of the world financial capitals would most likely to be able to cause
major implications around the world. To cause pollution in similar magnitude than Chernobyl did
in 1986, almost a complete fuel load of a nuclear reactor would have to be detonated, which
would be logistically extremely hard task.
Smuggling of nuclear materials is not uncommon. Past ten years have seen smuggling of nuclear
grade material and natural uranium, in such a countries as India, Congo, Moldova, Turkey and
Slovakia (BBC, 2007) (BBC, 2002) (BBC, 2010) (BBC, 2007) (BBC, 2001).
105
6.4.1.1.4 Accidents
Chernobyl accident in 1986 can be used as an example of global scale problem, caused by nuclear
power plant. Similarly to a dirty-bomb, fission products were released to atmosphere and to
surrounding nature, affecting biosphere far away from the power plant. Probability of similar
accident happening again is small, but it has to be accounted for, as it makes nuclear power less
sustainable.
In United States, probability for serious reactor accident is 1 to 10.000 reactor-years (MIT, 2003).
Currently world nuclear power plant fleet is at 438 power plants, so with these probabilities
there is one serious accident in 22.8 years. As mostly reactors in United States are second
generation design, this probability is expected to lower in the future, while third and fourth
generation power plant designs, presented in chapter 3, are built. Claims from designers of these
new power plants suggest that probability for newer nuclear power plants would be close to 1 in
100.000 reactor-years (MIT, 2003).
6.4.1.2 Fossil fuels
The baseline electricity production in the world today relies on coal and gas. Both of these
options are depleting fossil fuel deposits around the earth with ever increasing pace. This is an
infliction of goal number three. This effect, while there are huge amounts of coal and gas to be
found in earth’s crust, is similar to nuclear power and uranium. Although it has to be remembered
that uranium has higher energy density than fossil fuels.
6.4.1.2.1 Emissions from coal and gas
Main problem of these fuels was discussed in chapter 5. CO2 emissions are by far biggest problem
of electricity production today. The Stern Review projects 20% decrease in global GDP in worst
case scenario, if this problem is not addressed properly (Stern, 2006). Even bigger issue is the
effect of these emissions to the first goal of sustainability. Emissions from any coal plant in any
country, affect the globe as a whole. Generation using coal or gas to provide electricity is not
leaving the next generation the same possibilities to consume.
When CO2 is not taken into consideration gas is relatively clean fuel. Natural gas is almost pure
methane, which during perfect combustion produces only heat, CO2 and water (Tester, Drake,

106
Driscoll, Golay, & Peters, 2005).
In contrast with natural gas, coal produces vast amount of harmful substances during
combustion: nitrous oxides (NOX), sulfur oxides (SOX) and ash. Ash is mostly composed of silicon,
aluminum, iron, calcium and other materials that are deposited in the coal (Tester, Drake, Driscoll,
Golay, & Peters, 2005). Not surprisingly there is also thorium and uranium to be found in these
materials (Gabbard, 1993). Even though the amount of uranium and thorium in coal are small,
1.3ppm and 3.2ppm, respectively, the problem lies in the huge amount of coal that is burned
every year (Gabbard, 1993). Approximate value of coal combusted in year 1982 is 2800 million
tons (Gabbard, 1993). Result of this use of coal there is now 3640 tons of uranium and 8960 tons
of thorium in the ash piles near coal fired power plants (Gabbard, 1993). Irony can be found in
the possibility to produce more electricity from uranium in the ashes, than was produced during
combustion of the coal (Gabbard, 1993).
6.4.1.2.2 Is it possible to have sustainable electricity production from coal or gas?
Sulfur oxides can be removed from coal. Scrubbers can be installed to coal fired power plants to
remove unwanted products from flue gas. Carbon capture and sequestration (CCS) technologies
can be added to remove CO2. Problem of sequestration remains. One of the possible solutions
would be injecting CO2 to the oil wells similarly to previously mentioned Sleipner project.
Magnitude of this solution is, however, huge: even if every oil well in the world would be filled
with CO2, only 5% of yearly CO2 emissions would be stored. (Tester, Drake, Driscoll, Golay, &
Peters, 2005)
Using scrubbers and effective CCS system would produce more sustainable coal or gas plant. If all
the unwanted combustion products could be captured, both gas and coal power plants would find
themselves in similar situation that nuclear power plant sector is. Fuel cycle would start from
mining the coal and end to problem with combustion products. At the same time the price of
electricity produced this way would rise as this technology is new and relative expensive. And
still interfere with goal number two and three.

107
6.4.2 Comparing sustainability of technologies available
6.4.2.1 Goal number one: harmful effects in global scale
As discussed, emissions from coal- and gas-based electricity production are mainly affecting the
world negatively in global scale. This is due to the CO2 problem that they pose to the environment.
The troublesome effects that come with producing electricity in nuclear power plants are not
global. However, the problems that are as a result of disregarding safety instructions or result of
outside force that is not controllable by nuclear power plant operators (eg. terrorism threat), can
be seen as a global problem. Due to this, coal can be assessed to have large infliction of goal
number one. Gas has similar problem, although not equally large. Nuclear power plants impose
very little problems worldwide.
6.4.2.2 Goal number two: amount of local waste left behind
Coal power plants leave behind big “mountains” of ash, which contains very harmful materials
(Gabbard, 1993). Nuclear power plants, if using open fuel-cycle, leave 24 tons of used fuel behind
per reactor year, approximately 8641 tons altogether. Both of these amounts are assessed as
medium amount of waste. By comparison, harmful chemicals, like flame-retardants, which are
bad for brain development of infants, are produced 200 000 tons a year (UNEP, 2010). Difference
between radioactive material and harmful chemicals of this nature is that radioactive material
will someday be non-harmful, while poisonous chemicals will stay poisonous. Gas-fired power
plant does not leave any waste behind, if wastes accumulated during operation are zero.
6.4.2.3 Goal number three: effects on resources
Operating nuclear power plants have large effect on resources, which was seen in Figure 6.1. This
is mainly due to the losses in enrichment process because of the low fissile material level in
natural uranium. Fast neutron reactors, like TWR or breeder-reactors, can multiply the amount of
energy produced from the same resources. TWR, discussed with greater detail in section 3.7.2,
need only one fuel load and is able to use spent nuclear fuel. FBR´s, discussed more closely in
section 3.4.6, on the other hand have refueling times 60 times longer than conventional light
water reactors.
With crude approximations in Figure 6.1, it can be said that, nuclear power will have highest
effect on resources while coal and gas have slightly smaller effect.
108
6.4.3 Comparing sustainability in near future
If CCS and scrubbing technologies are deployed vastly and nuclear power plant technology
moving forward at the same pace, in 20 years previous comparison would be changed.
6.4.3.1 Goal number one: harmful effects in global scale
With CCS technology in both fossil fuel options would remove the global harm that they inflict at
the moment. Similarly problems in proliferation and risk of possible accident would be lowered
in nuclear power plants via new technology introduced in this area. These new power plant
designs show better management of neutron flux and more passive safety techniques like
negative void coefficient or cooling systems based on natural convection rather than cooling
pumps.
6.4.3.2 Goal number two: amount of local waste left behind
If new nuclear power plant technology is used and even TWR or FBR technologies are deployed,
the amount of waste left behind from nuclear power plants is reduced greatly. This would mean
greater appliance with goal number two with nuclear power plants. In hypothetical case of using
only TWR or FBR technologies, it is likely that uranium mining industry would decline to non-
existent level. As mentioned before, TWR can work solely on used nuclear power plant fuel, which
is not scarce (WNN, 2010). A fast breeder reactor on the other hand can produce approximately
60 times the generation from the same amount of fuel than conventional nuclear power plant. It
is immediately clear, that even though the amount of radioactive material is basically the same no
matter which technology is used, the lower amount of potential fuel mixed with radioactive
fission products is better. Long term storage of used nuclear fuel can be seen as huge waste in this
sense.
It is completely different case for fossil fuel fired power plants. As mentioned before, even though
CCS technology removes GHG’s from atmosphere, it does not “destroy” them. They are now
similar problem than nuclear waste given that storing of this waste is easier than nuclear waste,
while it has to be remembered that carbon dioxide itself is not dangerous to living organisms.
Goal number two is not complied with, making coal and gas bad solutions in this sense.
6.4.3.3 Goal number three: effects on resources
Injecting R&D capital to TWR and FBR technologies would make uranium last longer. However,
109
this is not expected to be helping in 20 years. It also has to be remembered that thorium is one
solution that has not been discussed, which is three time more abundant than uranium. As
mentioned, if every nuclear power plant would be changed to FBR or TWR type of reactor in next
20 years, the need for mined uranium would decline sharply.
If no more coal or gas plants are built, the rate of use does not change. There is no technology that
would make the amount of fossil fuel used smaller.
6.5 Technologies with absolute sustainability
Solar and wind energy, are conceptually close to being fully sustainable. The difference between
fully sustainable and renewable energy is made in the Brundtland report: renewable energy does
not remove any “fuel” from use of next generation, but may use other given resources in an un-
sustainable manner. For example, bio-fuels are renewable, but not sustainable, due to the other
implications connected to production of this fuel. The technology level is not high enough to
provide all of world electricity from fully sustainable means but rising demand will push these
technologies forward.
6.5.1 Solar energy
Energy coming from the sun to the earth is equal to 1,356W/m2 in the upper atmosphere. The
solar incident provided by this energy fluctuates between 0W/m2 and 1,050W/m2, depending on
season, weather, latitude and time of day. In the United States, energy that is displayed as solar
incident solar energy is estimated at 11.368.400TWh each year. This amount is 400 times larger
than the total primary energy consumed in USA in year 200233. (Tester, Drake, Driscoll, Golay, &
Peters, 2005)
It is obvious that all this energy cannot be retrieved. The efficiency of any machinery cannot reach
100 percent and land is needed for another uses. Electricity is produced from solar energy using
to major technologies, concentrated solar power (CSP) and photovoltaic systems (PV).
CSP is a fundamentally sound technology, but without future upside. It is basically a heat engine,
where sunlight is concentrated with mirrors to a thermal energy collector. Big applications of this 33 Primary energy consumption in the USA was 28421TWh in 2009 (Tester, Drake, Driscoll, Golay, & Peters, 2005).

110
technology can reach up to a size of 200MWe. Efficiency of these power plants is generally from 8
to 18%. (Tester, Drake, Driscoll, Golay, & Peters, 2005)
Photovoltaic systems are more interesting devices: there is no thermodynamic power cycle
attached to this technology. A photovoltaic plate will produce electricity directly from radiation,
removing the need for moving parts. However, the materials used to produce these circuits are
currently expensive, making them a less interesting option for large applications. Efficiencies
seen today in PV systems are ranging from 2 to 20%, but as material science keeps improving,
both efficiency and price will be more attractive in the future. It has to be remembered that there
is an upper limit to this efficiency as only some part of solar radiation can be transformed to
electricity via PV or CSP. (Tester, Drake, Driscoll, Golay, & Peters, 2005)
In the USA 11.190 TWh34 were used in the year 2009. If use of PV system with efficiency of 15% is
assumed, covering the whole country with PV plates would produce 1.705.260 TWh of electricity.
Hence, to produce the complete demand would require land area of 0.66% of USA to be covered
with PV plates. Naturally, expecting rise in efficiency, doubling the efficiency would halve the need
for land. As the United States is a large country with a very low population density it seems to be
an easy task to provide electricity by solar energy, even though consumption per capita is one of
the highest in the world.
While the numbers used are crude estimates and rather unrestricting assumptions are used, it is
easy to see that vast amounts of electricity can produced with energy from the sun. However,
intermittency remains as a problem and therefore solar-energy is not yet ready to provide bigger
portion of world energy.
6.5.2 Wind energy
Electricity is generated from wind by a wind turbine. Wind turbine technology has two main
characteristics Betz-limit35 is the highest possible efficiency and the power per area is
proportional to the cube of velocity36. One implication of this equation37 is that power-wise it
34 38.19 Quads (LLNL, 2010)
35
36
,

111
would be better to have very high wind speeds for a short period of time, rather than medium
wind speeds all the time. However, to store large amounts of energy in spikes is hard. Therefore it
might be better to have relatively steady wind speeds all the time. It is also intuitive that wind
speeds are higher in areas that have little to no obstacles in the ground and that in higher altitude
higher wind speeds are present.
From this it can be seen that, plains and especially the sea would offer the most interesting
location for wind farm. The technology is not ready for deployment far offshore, but it is known
that there is huge potential in wind. Obvious problem in offshore wind is high price, which is the
result of insufficient technology. More research and development is required to lower the price
and to bring this technology available for use. The installed capacity of wind turbines in the world
was approximately 95GW in year 2007, while the world’s biggest wind farm was located in Texas,
USA, with capacity of 781.5MW (REN21, 2008) (O'Grady, 2009).
If the high wind in great plains region in midwest United States would be fully built to house
maximum amount of wind turbines, it is approximated that electricity generated would cover half
of the use in USA today (Tester, Drake, Driscoll, Golay, & Peters, 2005). However, in future, it will
be more feasible to build wind farms offshore, as the land requirement for large wind farms can
be quite large. For example, the world’s biggest wind farm in Texas takes roughly area of 405 km2
(O'Grady, 2009).
While wind can provide fully sustainable electricity production, similarly to solar energy,
intermittency is a problem and therefore it conflicts with sustainability goal number one.
6.5.3 Other options
Hydro-electric dams are the biggest renewable electricity source today, while 15% of world
electricity is produced this way. 15% equals to 2600 TWh of electricity, while the theoretical
potential worldwide production is 9000TWh (Tester, Drake, Driscoll, Golay, & Peters, 2005). Large
where A = area of turbine = air density = wind speed 37 While remembering Betz-limit, the maximum amount of energy that can be collected from wind is
112
area needed for a dam is a political issue and a biological problem. Due to this it is very unlikely
that hydro-electric dams will ever be used to their full potential.
Biomass fired power plant can be seen as renewable, as they are carbon neutral: burning biomass
will release CO2, but growing this biomass capture CO2 from atmosphere. Rankine cycle is chosen
to produce electricity from the heat provided by biomass, making these power plants resemble
coal-fired power plants. Biomass plants are not sustainable, when use of land and effects on
biosphere are taken under consideration: biomass is competing for fertile land with food
production. Another aspect is that burning biomass removes degradable material from the
ground, causing loss of fertile land and erosion. There are, however, some future possibilities that
could make biomass be changed from renewable to sustainable as algae is used to produce bio-
fuel (Chisti, 2007). Compared to solar or wind, biomass is rather complicated and requires great
amounts of land to gather enough biomass. They have however one major advantage, which is
that they are fully controllable and therefore have very low intermittency.
Geothermal energy, especially enhanced geothermal energy (EGS) has potential, but it does come
with a high price tag. There are several places around the world, where geothermal energy is very
usable, one of them being Iceland. EGS-systems could provide 100GWe of base-load electricity by
2050, but it is in question that is this too little too late (MIT, 2006). Is wind or solar energy more
convenient in 40 years, as they do not inflict any thermal pollution, nor they are not as
complicated as geothermal power plants? Sustainability of geothermal power plants can also be
questioned, due to first law of thermodynamics.
Nuclear power plants are highly complex structures, opposed to wind or PV. Thermal pollution
and the need of fuel are also making “passive” power plants more competitive from sustainability
point of view. One advantage that nuclear power plants have over solar, wind and hydro is the
energy intensity. As world population continues growing with increasing pace, situation where
space is more valuable than any material is possible. Solar, wind and hydro production take vast
amounts of space, while, even when mining is counted for, nuclear power plants take
considerably less space. When breeder reactors, TWR’s or even fusion power plants are available,
there are no mining required, making this advantage even bigger. Some of the other available
options also share this quality of limited space use, namely EGS and fossil fuel plants.
113
6.5.4 Required development in other components of electricity generation chain
Intermittency and fluctuations, in wind- or solar-based generation, pose extra requirements on
other components in generation chain, mainly to the electricity grid. Due to difference between
demand and supply, energy storage technologies are also required. These technologies can make
intermittent energy sources, solar and wind energy, more sustainable.
6.5.4.1 Electricity grid
There is no worldwide energy grid. This is due to situation when electricity grids where built,
they were only meant to cover the economic area that they were providing electricity to. When
obvious benefits of free trade were discovered, western world started to connect electricity grids
together to achieve bigger and therefore more stable networks.
It is apparent, that this development of bigger grids has started from nations that are closest to
each other politically, historically and socially. One of these examples is Scandinavia. As electricity
can be transferred without big losses and very fast, every owner of wind turbine farm in Spain is
willing to sell electricity to Poland, if they can get higher price. This is also one of the main goals
of EU, which is hoped to be solved by set of directives, mainly Directive 2009/72/EC in third
energy package. This evolution of electric grids should be nurtured throughout the world.
6.5.4.2 Energy storage
6.5.4.2.1 Batteries
Lithium battery technology today achieves energy density from 100 to 150Wh/kg, while the
future potential with lithium batteries lies closer to 2500Wh/kg (Scrosati & Garche, 2010). Even
though when discussing applications related to electricity grids, it is not interesting to talk about
the weight of these batteries, the potential in energy density has to be noted.
With today's battery technology, biggest “grid stabilizer” system has nameplate capacity of 44MW
(A123 Systems, 2010). If the nameplate capacity of this stabilization system is 44MW, the
maximum that of the system is 44MWh/hour. To put this ability in context, let's consider
following example: Finland decides that no other than electricity produced via fully sustainable
options is to be used. Electric grid is connected to Sweden and Russia, but electricity imported is
not considered to be fully sustainable. Capacity to cover this demand is fulfilled with building
114
wind turbines and PV systems to provide electricity for whole country. However, if there is no
wind or sun to be seen at the hour of highest consumption, consumed electricity has to be
provided by the energy storage systems. When chosen storage system is batteries, they have to be
able to release 13917MWh during this hour (Figure 5.1).
If energy density of lithium batteries will rise closer to the potential, battery which has now
44MW capacity would have capacity of 704MW in the future. Naturally, these systems are
extremely expensive at the moment. If there are no constraints to progress, research and
development fueled by the increasing demand will drive the price down, making these solutions
more competitive. One possible constraint can be the availability of materials needed to produce
great amounts of these batteries or the harm caused to biological systems by these batteries.
However, only the production and assembly phases contribute to the problems, if collection and
recycling phases are efficient and done in large scales (Van den Bossche, Vergels, Van Mierlo,
Matheys, & Van Autenboer, 2006).
Both problems that were mentioned to be possible problems to employment of great amount of
lithium batteries are present. Mass production of lithium carbonate, which is used as cathode in
the battery, is not environmentally friendly (Tahil, 2008). Lithium, although found in small
amounts in all igneous rocks, is concentrated geologically to lithium triangle in borders of
Argentina, Bolivia and Chile (Hammond, 2000) (Tahil, 2008). In this location 70% of worlds
lithium is found and it is approximated that world lithium resources will cover only small fraction
of the demand (Tahil, 2008).
Biological batteries and other new technologies may also emerge and offer bigger capacities with
lower price or nanotechnology may reduce sufficiently the amount lithium needed (Cartwright,
2009) (Armand & Tarascon, 2008).
6.5.4.2.2 Other storage options
Pumped hydropower, compressed air, synthetic fuels (like hydrogen) and flywheels are other
possible technologies to storage energy. Difference between these options and batteries are the
relative complexity. While pumped hydro can compete with simplicity and efficiency, batteries are
more efficient, simpler and take less space than mentioned other options.

115
However, as discussion of price of any of these possible solutions is disregarded due the
impossibility of project the technological progress, there is always room for new and improved
energy storage technologies.
Any of these solutions can be used alone or in any combination in future. However, as it is
presented, there are problems to be solved. While problems are addressed, base-load electricity
has to be provided and development efforts in this field held in high value.
6.6 Pathway to sustainability
Absolute sustainability in electricity generation chain can be achieved, as the world is offering
resources like wind and sun. While life-cycle analysis can reveal that wind and sun are not
completely sustainable energy forms, the resources certainly are fully sustainable. To but this in
the framework set by the rules discussed earlier, using sun and wind does not: 1) pose threat in
global scale, 2) leave behind any local waste (including waste heat) or 3) deplete any resources.
Electricity generation of the world can be said to sustainable, when all the electricity used in the
world is provided by these two, with other fully sustainable options. To achieve this point, battery
technology and grid technology has to be developed to sustain sources with high intermittency.
Battery technology and grid development should therefore be number one priority, while
offshore wind technology and upgrading the efficiency of PV systems would also have to be high
on priority list.
As technology does not yet make this situation possible, solutions between today and fully
sustainable future is needed. Electricity has to be provided between these two points of time and
optimally this electricity is produced with smaller possible infliction to sustainability, leaving as
much as possible to next generations. It was mentioned earlier that demand is one of the best
drivers of progress. With this in mind, governmental bodies play big role in steering this progress.
The use of nuclear power as base load provide cannot slow down the use of sustainable energy
sources. If nuclear power is used and no capital is injected in development of solar and wind for
base-load use, world will phase similar questions about sustainability only years to come.
There are no good solutions, only solutions which are flawed. These solutions were put in order

116
by sustainability earlier. It is obvious, that while fully sustainable options are superior towards
nuclear power plants, nuclear power plants are better solution than fossil fuel plants. Therefore,
optimal path to sustainability is through nuclear power plant fleet, which provides steady base-
load electricity, while wind power and solar power are developed as electricity sources. Battery
technology and worldwide energy grid is a problem also to be assessed, to offer the flexibility
needed when intermittent sources are used.
117
7 Conclusion
A nuclear power plant is a big and complex structure, with two main parts: nuclear reactor to
produce heat from chosen material by nuclear fission and cyclic process to produce electricity
from heat. Due to this complexity, it is expensive and harder to manage than coal-fired power
plant or hydroelectric dam. It is not the cleanest energy source, having problems with waste
management. It is not the dirties one either, having an advantage in zero carbon dioxide
emissions and possibility of producing huge amounts of electricity, leaving relative small amounts
of waste to future generations.
Nuclear technology sector is on the new rise due to the fight against emissions of greenhouse
gases. Currently limited research and development budgets will hopefully grow, providing new
technologies, with reduction in waste, increase in safety and proliferation resistance, and higher
electricity yield. In this paper, technologies used in the world today were in the spotlight, mostly
because sustainability for the next 100 years is attached to technologies used and built today.
Some new technologies, mainly traveling wave reactor (TWR) was showcased, as it is currently
one of the most interesting technologies from the viewpoint of sustainability. Fusion was not
discussed, as it is not seen as a technology for near future.
Economics projections show, that energy need in the future is larger than it is today and will
likely grow by 100%-400% until 2050. Energy intensities of societies are declining, while more
energy efficient machinery and appliances are invented. However, there is more machinery and
appliances used per capita than before. No reason can be found to expect change in this trend.
Another big issue is the growth of population, which creates demand for electricity. In economics
chapter, these issues were discussed and it was shown that demand for base-load capacity will
grow. Problems related to renewable fuel sources were reviewed followed by conclusion that it is
not possible in near future to provide the world with sufficient amount of solar or wind energy. At
the same time fossil fuel sources have their own problems with CO2 emissions. One solution
would be to use nuclear power plants to provide electricity. Nuclear power plants are CO2-neutral
and they are competitive in price of electricity, as shown in levelized cost calculations.
Technologies which provide sustainability in absolute terms were reviewed, while relative
118
sustainability of current technologies was also shown. Minimal effects to global scale were
deemed as number one sustainability goal. Goal number two was to leave as little as possible
local waste behind. Third goal was not to deplete the resources of the world. While it is obvious
that nuclear power plant is not sustainable in absolute terms, it was competitive against other
base-load capacity providing power plants. The main reason for this assessment of better
sustainability was due to the high emissions from competitors, which was infringement of the
first goal or, if CCS were used, goal number two.
Nuclear power is not perfect solution, as seen in amounts of waste left behind. In one year,
approximately 8641.1 tons of radioactive waste is produced. With reprocessing, this amount can
be reduced, but large political barriers have to be removed to minimize amount of waste. It is
amazing that technologies like FBR have not been used due to political pressure. Providing capital
to this sector would develop more sustainable nuclear energy sector. In the future nuclear fission
can be brought very close to absolute sustainability with breeder-reactors and traveling wave
reactors, which minimize the need of large scale mining, produce very little waste and pose very
little threat in global scale. Nuclear fusion, which is still decades away, is another way to generate
electricity from nuclear reactions. While, as a concept, it does not produce waste at all and the
threat in global scale is smaller than in fission power plants, many issues still remain to be solved.
Main challenges in nuclear fusion lie in development of technology.
Fully sustainable world has to be the number one goal in the energy sector. This goal can be
reached with use of wind and solar and having worldwide smart grid with energy storage option.
Until this is possible, energy has to be provided. From given choices, nuclear power plant is the
most sustainable.
119
8 Bibliography
A123 Systems. (2010, August 10). A123 Systems Solidifies Leadership Position in Delivery of
Lithium Ion Technology for the Power Grid With Order of 44MW of Smart Grid Stabilization
Systems (SGSS(TM)). Retrieved September 21, 2010, from A123 Systems Web site:
http://ir.a123systems.com/releasedetail.cfm?ReleaseID=498155
AEA. (2006). Carbon footprint of the nuclear fuel cycle (Torness).
AECL. (2009). Advanced CANDU Reactor ACR-1000.
AREVA. (2004). EPR.
Armand, M., & Tarascon, J.-M. (2008). Building Better Batteries. Nature, vol 451 .
Australian Government BoM. (2009). Greenhouse effect and Climate Change.
BBC. (2010, June 4). Burma 'trying to build nuclear weapon'. Retrieved September 21, 2010, from
BBC News: http://www.bbc.co.uk/news/10236381
BBC. (2007, March 8). DR Congo 'uranium ring smashed'. Retrieved September 21, 2010, from
BBC News: http://news.bbc.co.uk/2/hi/africa/6432363.stm
BBC. (2007, November 29). Slovak raid nets 'bomb' uranium. Retrieved September 21, 2010, from
BBC News: http://news.bbc.co.uk/2/hi/europe/7119172.stm
BBC. (2010, August 24). Smuggled uranium-238 seized in Moldova. Retrieved September 21,
2010, from BBC News: http://www.bbc.co.uk/news/world-europe-11074645
BBC. (2002, September 30). Turkish police seize smuggled uranium. Retrieved September 21,
2010, from BBC News: http://news.bbc.co.uk/2/hi/europe/2286597.stm
BBC. (2001, August 27). Uranium smugglers caught in India. Retrieved September 21, 2010, from
BBC News: http://news.bbc.co.uk/2/hi/south_asia/1512077.stm
Benoy, P. J. (2010). India Em'Power'er. Chennai Business School.
Betz, A. (1920). Das Maximum der theoretisch möglichen Ausnutzung des Windes durch
120
Windmotoren. Zeitschrift fur das gesamte Turbinewesen , 307-309.
BP. (2010). Statistical Review of World Energy 2010. British Petroleum .
Cartwright, J. (2009, April 2). Biological battery powers up. Retrieved September 21, 2010, from
Chemisty world: http://www.rsc.org/chemistryworld/News/2009/April/02040902.asp
Chen, E., & Aizhu, C. (2010, May 6). China's Energy Intensity Rises 3.2 pct in Q1. Retrieved August
5, 2010, from Reuters: http://in.reuters.com/article/idINTOE64500C20100506
Chisti, Y. (2007). Biodiesel from microalgae. Biotechnology Advances 25 , 294-306.
Cohen, K. P. (1951). The Theory of Isotope Separation as Applied to the Large-scale Production of
U235. New York: McGraw-Hill.
Demarest, R. (2010, January 22). Government promises decision on nuclear power by summer.
Retrieved August 5, 2010, from Deutsche Welle: http://www.dw-
world.de/dw/article/0,,5156440,00.html
EIA. (2008). Annual Energy Review.
Elemash. (2004). RBMK-1000 and RBMK-1500 nuclear fuel. Retrieved July 19, 2010, from
Elemash Web Site: http://www.elemash.ru/en/production/Products/NFCP/RBMK/
Elert, G., & Jones, K. (1999). Density of Concrete. Retrieved August 5, 2010, from The Physics
Factbook: http://hypertextbook.com/facts/1999/KatrinaJones.shtml
Elert, G., & Mirochnik, M. (2006). Density of Uranium. Retrieved November 1, 2010, from The
Physics Factbook: http://hypertextbook.com/facts/2006/MichaelMirochnik.shtml
El-Wakil, M. M. (1984). Powerplant technology. McGraw-Hill.
Eurostat. (2010, August 11). Statistics Database. Retrieved August 11, 2010, from Eurostat :
http://epp.eurostat.ec.europa.eu/portal/page/portal/energy/data/database
Fahey, D. (2003). Facts, Myths and Propaganda in the Debate Over Depleted Uranium.
Falk, J., & Bodman, R. (2007). Uranium Enrichment.

121
Fingrid. (2010, August 4). Sähkön kulutus ja tuotanto. Retrieved August 4, 2010, from Fingrid:
http://www.fingrid.fi/portal/suomeksi/sahkomarkkinat/sahkon_kulutus_ja_tuotanto/#
Gabbard, A. (1993). Coal combustion: Nuclear Resource or Danger. Oak Ridge Nation Laboratory
Review, Vol. 26, Nro 3&4 .
GE Hitachi. (2008). Advanced Boiling Water Reactor (ABWR).
Göteborgs-Posten. (2010, June 18). Ja till ny kärnkraft. Retrieved August 5, 2010, from Göteborgs-
Posten: http://www.gp.se/nyheter/sverige/1.393694-ja-till-ny-karnkraft
Hammond, C. R. (2000). The Elements.
Hepburn, C. (2007). Carbon Trading: A Review of the Kyoto Mechanisms. The Annual Review of
Environment and Resources , 375-93.
Herzorg, H., & Golomb, D. (2004). Carbon Capture and Storage from Fossil Fuel Use.
Hinds, D., & Maslak, C. (2006). Next-generation nuclear energy: The ESBWR.
IAEA. (2009). Classification of Radioactive Waste. Vienna.
IAEA. (2004, June 24). From Obninsk Beyond: Nuclear Power Conference Looks to Future.
Retrieved July 14, 2010, from International Energy Agency:
http://www.iaea.org/NewsCenter/News/2004/obninsk.html
IAEA. (1992). INSAG-7, The Chernobyl Accident: Updating of INSAG-1, a report by the
international nuclear safety advisory group. Vienna.
IAEA. (2001). Manual of acid in situ leach uranium mining technology.
IEA. (2010). Key World Energy Statistics 2009.
Kaye & Laby. (2008). Abundances of the elements. Retrieved October 13, 2010, from Kaye & Laby:
Tables of Physical and Chemical Constants:
http://www.kayelaby.npl.co.uk/chemistry/3_1/3_1_3.html
Kraftnät. (2010, August 4). Elstatistic för hela Sverige. Retrieved August 4, 2010, from Svenska

122
Kraftnät: http://www.svk.se/Energimarknaden/El/Statistik/Rad2/
Krane, K. S. (1988). Introductory Nuclear Physics. John Wiley & Sons, Inc.
LLNL. (2010). U.S Energy flow charts. Retrieved December 4, 2010, from Lawrence Livermore
National Laboratory:
https://flowcharts.llnl.gov/content/energy/energy_archive/energy_flow_2009/LLNL_US_Energy
_Flow_2009.png
Lochbaum, D. A. (1996). Nuclear Waste Disposal Crisis. Tulsa, Oklaholma: PennWell Publishing
Company.
Mahasenan, N., Smith, S., & Humphreys, K. (2003). The Cement Industry and Global Climate
Change: Current and Potential Future Cement Industry CO2. International Conference on
Greenhouse Gas Control Technologies, (pp. 995-1000). Kyoto.
Makhijani, A., Chalmers, L., & Smith, B. (2004). Uranium Enrichment.
MIT. (2007). The Future of Coal - Options for Carbon-constrained World.
MIT. (2006). The Future of Geothermal Energy.
MIT. (2003). The Future of Nuclear Power.
Morthorst, P. E. (2001). Wind Energy - the Facts, Volume 2, Costs and Prices.
MSoA. (2010). Handbook of Mineralogy. Retrieved July 27, 2010, from Mineralogical Society of
America: http://www.handbookofmineralogy.org/pdfs/uraninite.pdf
National Nuclear Data Center. (2009, October). Sigma Periodic Table Browse. Retrieved July 12,
2010, from National Nuclear Data Center: http://www.nndc.bnl.gov/sigma/index.jsp
National Physics Laboratory. (2008). Nuclear fission and fusion, and neutron interactions.
Retrieved July 13, 2010, from Kaye & Laby, Tables of Physical & Chemical Constants:
http://www.kayelaby.npl.co.uk/atomic_and_nuclear_physics/4_7/4_7_1.html
NEA. (2002). Chernobyl - Assessment of Radiological and Health Impacts.

123
NEA. (2008). Uranium 2007 - Resources, Production and Demand.
NEI. (1997). Source book - Soviet-Designed Nuclear Power Plants in Russia, Ukraine, Lithuania,
Armenia, the Czech Republic, the Slovak Republic, Hungary and Bulgaria. Washington D.C.
OECD. (2005). Projected Costs of Generating Electricity.
OECD. (1994). The Economics of Nuclear Fuel Cycle. Paris.
O'Grady, E. (2009, October 1). E.ON completes world's largest wind farm in Texas. Retrieved
September 18, 2010, from Reuters.com:
http://www.reuters.com/article/idUSN3023624320091001
Parliamentery Office of Science and Technology. (2006, October). Carbon Footprint of Electricity
Generation. Postnote .
Posiva. (2009). Loppusijoitus. Retrieved August 10, 2010, from Posiva web site:
http://www.posiva.fi/loppusijoitus
REN21. (2008). Renewables 2007; Global Status Report.
Repo, H. (2005, September 29). Olkiluoto on onnenpotku betoniyrityksille. Retrieved August 5,
2010, from Tekniikka & talous: http://www.tekniikkatalous.fi/rakennus/article34506.ece
Russian Academy of Science, Nuclear Safety Institute. (1993). Russian RBMK Reactor Design
Information. Moscow.
Scrosati, B., & Garche, J. (2010). Lithium Batteries: Status, prospects and future. Journal of Power
Sources , 2419-2430.
SKB. (2009). Vår metod för slutförvar. Retrieved August 10, 2010, from Svensk
Kärnbränslehantering AB web site: http://www.skb.se/Templates/Standard____14883.aspx
Smith, P., & Storm van Leeuwen, J. W. (2008, February). Nuclear Power - the Energy Balance.
Retrieved December 21, 2010, from stormsmith.nl: http://www.stormsmith.nl/
Snell, V. G., & Howieson, J. Q. (1991). Chernobyl - A Canadian Perspective.

124
Solow, R. M. (1956). A contribution to the Theory of Economic Growth. Quarterly Journal of
Economics (The MIT Press) 70 (1) , 65-94.
Statoil. (2009, September 12). Sleipner Vest. Retrieved August 6, 2010, from Statoil:
http://www.statoil.com/en/technologyinnovation/protectingtheenvironment/carboncapturean
dstorage/pages/carbondioxideinjectionsleipnervest.aspx
Stern, N. (2006). Stern Review on Economics of Climate Change.
Suppes, G. J., & Storvick, T. S. (2007). Sutainable Nuclear Power. Elsevier Academic Press.
Tahil, W. (2008). The Trouble with Lithium 2, Under the Microscope. Martainville, France:
Meridian International Research.
Taylor, M. (1997). Greenhouse Gases and Nuclear Fuel Cycle: What Emissions? IAEA Bulletin 39/2
.
Teller, E., Ishikawa, M., & Wood, L. (1996). Completely Automated Nuclear Reactors for Long-Term
Operation.
Tester, J. W., Drake, E. M., Driscoll, M. J., Golay, M. W., & Peters, W. A. (2005). Sustainable Energy.
Cambridge, Massachusetts: The MIT Press.
Tol, R. S., & Yohe, G. W. (2006). A Review of Stern Review. World Economics, Vol. 7, No. 4 .
U.S Department of Energy. (1993). DOE Fundamentals Hanbook, Nuclear Physics and Reactor
Theory, Vol 1 of 2. Washington D.C.
U.S Department of Energy. (1993). DOE Fundamentals Hanbook, Nuclear Physics and Reactor
Theory, Vol 2 of 2. Washington D.C.
U.S. DOE. (2002). A Technology Roadmap for Generation IV Nuclear Energy Systems. U.S DOE
Nuclear Research Advisory Committee and the Generation IV International Forum.
U.S. EIA. (2000). Pressurized-Water Reactor and Reactor Vessel . Retrieved July 14, 2010, from U.S
Energy Information Administration:
http://www.eia.doe.gov/cneaf/nuclear/page/nuc_reactors/pwr.html

125
U.S. NRC. (2004). Biological Effects of Radiation.
UN WCED. (1987). Our Common Future. Oxford University Press.
UN. (2009). World Population Prospects. Population Newsletter .
UNEP. (2010). UNEP Yearbook: Harmful Substances and Hazardous Waste.
UxC. (2010, June 28). UxC Nuclear Fuel Price Indicators. Retrieved July 25, 2010, from The Ux
Consulting Company: http://www.uxc.com/review/uxc_Prices.aspx
Van den Bossche, P., Vergels, F., Van Mierlo, J., Matheys, J., & Van Autenboer, W. (2006). SUBAT: An
assessment of sustainable battery technology. Journal of Power Sources 162 , 913-919.
Vattenfall. (1999). Vattenfall´s Life Cycle Studies of Electricity.
Weaver, K. D., Gilleland, J., Ahlfeld, C., Whitmer, C., & Zimmerman, G. (2010). A Once-Through Fuel
Cycle for Fast Reactors. Journal of Engineering for Gas Turbines and Power, Vol. 132 .
Westinghouse. (2007). AP1000.
WHO. (2001). Depleted Uranium - Sources, Exposure and Health Effects. Geneva.
WNA. (2009, July). Energy Balances and CO2 Implications. Retrieved December 21, 2010, from
World Nuclear Association web site: http://www.world-nuclear.org/info/inf100.html
WNA. (2010, November 10). Fast Neutron Reactors. Retrieved November 18, 2010, from World
Nuclear Association website: http://www.world-nuclear.org/info/inf98.html
WNA. (2010). Nuclear Reactor Database. Retrieved July 14, 2010, from World Nuclear
Association: http://world-nuclear.org/NuclearDatabase/Default.aspx?id=27232
WNA. (2010, June). Outline History of Nuclear Energy. Retrieved July 14, 2010, from World
Nuclear Association: http://www.world-nuclear.org/info/inf54.htm
WNA. (2009, September). Supply of Uranium. Retrieved July 25, 2010, from World Nuclear
Association: http://www.world-nuclear.org/info/inf75.htm

126
WNA. (2010, May). World Uranium Mining. Retrieved July 27, 2010, from World Nuclear
Association: http://www.world-nuclear.org/info/inf23.htm
WNN. (2010, March 24). Chinese Candu reactor trials uranium reuse . Retrieved August 27, 2010,
from World Nuclear News: http://www.world-nuclear-
news.org/newsarticle.aspx?id=27401&terms=candu%20china
WNN. (2008, December 02). India outlines nuclear power ambitions . Retrieved July 21, 2010,
from World Nuclear News: http://www.world-nuclear-news.org/newsarticle.aspx?id=23898
WNN. (2010, June 18). New investors for TerraPower. Retrieved July 22, 2010, from World
Nuclear News: http://www.world-nuclear-news.org/newsarticle.aspx?id=27910
WNN. (2009, September 11). PBMR postponed . Retrieved July 21, 2010, from World Nuclear
News: http://www.world-nuclear-news.org/NN-PBMR_postponed-1109092.html
World Nuclear News. (2010, 5 6). California moves to ban once-through cooling . Retrieved 7 13,
2010, from World Nuclear News: http://www.world-nuclear-
news.org/newsarticle.aspx?id=27676
WRI. (2010). CAIT: Climate Analysis Indicators Tool. Retrieved August 6, 2010, from World
Resources Institute: http://cait.wri.org/
X-Rates. (2010, August 12). Monthly Average Graph (Euro, American Dollar) 2010. Retrieved
August 12, 2010, from x-rates.com: http://www.x-rates.com/d/EUR/USD/hist2010.html