Embed Size (px)
Citation preview

Nuclear magnetic resonance visualization of anomalous flow in cone-and-platerheometryMelanie M. Britton and Paul T. Callaghan
Citation: Journal of Rheology (1978-present) 41, 1365 (1997); doi: 10.1122/1.550846 View online: http://dx.doi.org/10.1122/1.550846 View Table of Contents: http://scitation.aip.org/content/sor/journal/jor2/41/6?ver=pdfcov Published by the The Society of Rheology Articles you may be interested in Viscoelastic flow in a 3D square/square contraction: Visualizations and simulations J. Rheol. 52, 1347 (2008); 10.1122/1.2982514 Obtaining the shear rate profile of steady laminar tube flow of Newtonian and non-Newtonian fluids from nuclearmagnetic resonance imaging and laser Doppler velocimetry data J. Rheol. 46, 351 (2002); 10.1122/1.1446881 Nuclear magnetic resonance imaging investigation of sedimentation of concentrated suspensions in non-Newtonian fluids J. Rheol. 42, 1419 (1998); 10.1122/1.550895 A simplified method for accuracy estimation of nuclear magnetic resonant imaging Rev. Sci. Instrum. 69, 3300 (1998); 10.1063/1.1149113 Anomalous Lateral Migration of a Rigid Sphere in Torsional Flow of a Viscoelastic Fluid J. Rheol. 28, 381 (1984); 10.1122/1.549773
Redistribution subject to SOR license or copyright; see http://scitation.aip.org/content/sor/journal/jor2/info/about. Downloaded to IP: 86.173.235.69 On: Fri, 02 May 2014
19:30:33
Nuclear magnetic resonance visualization of anomalousflow in cone-and-plate rheometry
Melanie M. Britton and Paul T. Callaghana)
Department of Physics, Massey University, Palmerston North,New Zealand
(Received 16 May 1997; final revision received 28 July 1997)
Synopsis
We demonstrate the use of nuclear magnetic resonance~NMR! microscopy to image the velocitydistribution for fluids sheared within the gaps~4° and 7°! of cone-and-plate rheometers. Thesemeasurements employ a specially constructed rheogoniometer, which fits within the NMR probesystem. While the uniform shear rate assumption is verified in the case of simple Newtonian andnon-Newtonian fluids, a range of anomalous behavior~apparent slip, shear banding, and fracture! isobserved in other systems, including wormlike surfactants, semidilute solutions of 18 MDapolyacrylamide, and dispersed silica in silicone grease. ©1997 The Society of Rheology.@S0148-6055~97!00206-X#
I. INTRODUCTION
Cone-and-plate rheometry is the leading technique used for the study of the nonlinearviscosity of complex fluids under shear. There are a number of reasons why this particu-lar geometry is favored. First, it is well known that the shear stress is highly uniformacross the gap. Second, it is generally assumed that the shear rate is uniform across thegap, although this uniformity is a delicate point, which does not follow directly from theequations of motion. Third, the practical implementation is convenient, allowing bothshear and normal stress measurements as well as observation of the gap via opticalmethods.
There are some complications in the application of this device. For example, purelyazimuthal flow is possible only in first order, and both inertial and elastic terms inequations of motion can lead to secondary circulation. Furthermore, while stress may bemeasured directly, an estimation of flow in the gap is normally obtained through infer-ence of measured parameters, namely, the rotation rate and the gap angle. In this article,we shall question the underlying assumption of shear-rate uniformity by means of atechnique of flow visualization, which is noninvasive and which permits direct velocitymeasurement at microscopic resolution. Using this method of nuclear magnetic resonance~NMR! microscopy, we shall demonstrate here that in the case of some fluids, extremecaution is needed in interpreting shear rate in terms of a simple picture of uniform rate ofstrain. We shall demonstrate that far from being uniform, the shear rate may exhibit ahigh degree of heterogeneity in fluids whose underlying constitutive behavior is stronglynonlinear.
a!Corresponding author.
© 1997 by The Society of Rheology, Inc.J. Rheol. 41~6!, November/December 1997 13650148-6055/97/41~6!/1365/22/$10.00
Redistribution subject to SOR license or copyright; see http://scitation.aip.org/content/sor/journal/jor2/info/about. Downloaded to IP: 86.173.235.69 On: Fri, 02 May 2014
19:30:33
For a number of years, deviations from normal flow, such as slip@Magnin and Piau~1990!; Magnin and Piau~1987!#, fracture @Hutton ~1965!#, and secondary flow@Giesekus~1967!; Giesekus~1965!; McKinley et al. ~1995!#, have been investigated inthe cone-and-plate system. Such effects may be inferred indirectly, such as via a loss inshear stress where slip is believed to be present, or via direct optical observation offracture. We shall be concerned here not only with slip, but also with significant devia-tions from uniformity in the velocity gradient, an effect which is exceedingly difficult todetect by optical means.
The effects of steady slip, or apparent slip, can be compensated for in Couette flowmeasurements@Brunn et al. ~1996!# and capillary flow @Cohen and Metzner~1985!;Muller-Mohnssenet al. ~1987!# by including an allowance for the high-shear boundarylayer via a parameter known as the slip velocity, and mathematical treatments are avail-able which specifically deal with this correction@Mooney~1931!; Oldroyd ~1956!#. Suchcorrections are not at all straightforward in the cone and plate@Brunn et al. ~1996!#. Forthis apparatus, an alternative strategy would be to prevent the onset of slip by usinggrooved surfaces. Unfortunately, this method has associated complications. For example,the cone angle becomes uncertain, and an assumption must be made that the fluid in thegrooves is stationary, thus, forming a boundary surface with the tops of the ridges. Itwould be altogether more desirable if the precise distribution of velocity could be mea-sured within the rheometer under conditions where wall slip may be a factor complicatingestimation of the shear rate under which stress was being measured.
The second main anomaly found in cone-and-plate flow concerns fracture. Whilefracture is a phenomenon normally associated with tension, it may also arise underconditions of shear. Shear fracture was first observed in polydimethylsiloxane~pdms! ofvarying molecular weights by Hutton~1963, 1965!, who observed a fall in shear stressbeyond a critical shear rate. Visual observation of shear fracture has been reported in asample of carbopol 934@Magnin and Piau~1990!#, a poly~acrylic acid! gel, in greasesformed by dispersion of silica particles in pdms@Magnin and Piau~1987!# and in abrine/laponite XLG solution@Pignonet al. ~1996!#. In all these cases, the fluids exhibit-ing fracture also exhibited marked yield stress character in their flow curves.
The third main irregularity is secondary flow, which marks a deviation from laminarazimuthal flow, such that radial and polar components of velocity become significant. Itis a feature of the cone-and-plate geometry that the equations of motion do not permit anexact solution involving azimuthal flow alone. However, provided that the shear rate issufficiently small, such deviations can generally be ignored. The rate at which theseeffects become important depends on the precise constitutive properties of the fluid. ForNewtonian fluids, inertial effects are the primary cause of secondary flow@Fewell andHellums~1977!; King and Waters~1970!; Walters and Waters~1968!# taking the form ofvortices normal to the direction of shear. It is generally believed@Olagunju~1993!# thatthe use of small cone angles (< 4°) inhibits secondary flow in Newtonian fluids. Thesituation for non-Newtonian fluids is not so straight forward where elastic behavior maydrive secondary flow at shear rates much lower than those at which such effects arise dueto inertial terms alone. Theoretical studies@Giesekus~1967!; Walters and Waters~1968!#have predicted weak secondary flow, made up of one or two radial vortices, even in thesmall gap angle limit@Olagunju~1993!#. Experimental observation of secondary flow hasbeen made by Giesekus~1967, 1965!, for both Newtonian and non-Newtonian fluids, ina large-angled cone-and-plate system using direct optical examination. In that study ofsecondary flow, Giesekus used a solution of polyacrylamide in water and glycerol. Fur-ther information concerning the influence of elastic and inertial effects on flow stabilitycan be found in reviews by Larson~1992! and Shaqfeh~1996!.
1366 BRITTON AND CALLAGHAN
Redistribution subject to SOR license or copyright; see http://scitation.aip.org/content/sor/journal/jor2/info/about. Downloaded to IP: 86.173.235.69 On: Fri, 02 May 2014
19:30:33
Other flow irregularities include turbulent vortices formed at the edge of the fluid inthe gap, effects which are apparently quite different in nature to ordered secondary flow.Such edge effects have been observed by Kulicke and co-workers in polyacrylamidesolutions @Kulicke et al. ~1982!; Kulicke and Porter~1979!; Kulicke and Wallbaum~1985!# and polystyrene/decalin solutions@Kulicke et al. ~1979!#.
There exists yet another class of shear behavior, of particular interest in the case offluids that exhibit inflected flow curves. In particular, we shall be concerned with systemswhose underlying constitutive behavior is such that the stress first rises with increasingshear rate, but then exhibits a region where the stress decreases once a critical shear rateis exceeded. Such behavior cannot persist to indefinitely high rates of strain~because, forexample, a Newtonian solvent may be present!, and so, the flow curve is expected to bedouble valued, in the sense that two shear rates may be consistent with a given stress.This intrinsic behavior must be distinguished from the measured flow curve. In cone-and-plate measurements ofs(g), such fluids typically exhibit a plateau in the applied stressbeyond the critical rate of strain,gc . Examples include wormlike surfactant solutions@Cates and Candau~1990!# and certain high molecular weight polymeric liquids@Doi andEdwards~1987!#. Observation of this phenomenon in polymeric liquids has been some-what elusive due to the necessity for a highly monodispersed system. The really inter-esting question concerns the possibility that differing rates of strain may coexist withinthe gap of a cone-and-plate rheometer at a given rotation speed, and hence, at a givenstress. Such a phenomenon is termed ‘‘shear banding’’ and is to be distinguished fromthe phenomenon of fracture or slip in that the variation of shear rate may, in principle, bequite widely distributed across the fluid within the gap rather than confined to a narrowinterface.
The methods used in the detection of deviation from normal, azimuthal flow at con-stant shear rate, fall into two main categories: indirect interpretation of rheological mea-surements and direct visualization. The first method was adopted by Hutton~1963, 1965!in studying shear fracture and by Kulicke and co-workers@Kulicke and Wallbaum~1985!# on their study of flow irregularities. Earlier, Kulicke and co-workers@Kulickeet al. ~1979!; Kulicke and Porter~1979!# used optical visualization methods to study flowirregularities. By observing the fluid at the edge of the gap, the appearance and progressof vortices was measured and photographed. Similarly, the observations of slip andfracture in yield stress fluids made by Magnin and Piau~1987, 1990! were by visualmeans. They simply marked the exterior surface of the fluid with a straight line ofpowder, which extended onto the side of the cone and the plate. Following brief shearingof the fluid, the nature of flow in the gap was deduced from the deformation of thismarker line. Giesekus~1965, 1967! injected dye into the fluid, and the streamlines ofsecondary flow were observed. More recently, Dudgeon and Wedgewood~1997! haveused laser Doppler anemometry to study flow irregularities in a cone-and-plate rheom-eter.
Both of these approaches to determining flow within the gap have limitations. Deduc-tion from bulk rheological measurements~for example, stress versus shear rate measure-ment! relies on an integration of shear properties over the entire sample. Such integralproperties do not lend themselves to unique and unambiguous interpretation. While flowvisualization represents a more direct approach to the determination of flow, those opticalmethods, which rely on observation via the edge of the fluid, provide only partial insight,while flow visualization based on stained streamline observation or scattering from par-ticles is limited both because of the difficulty in depth resolution, and because of potentialperturbation of the fluid by injected dye or scattering centers. The technique of nuclearmagnetic resonance imaging@Mansfield and Morris~1982!# has been recently shown to
1367NMR VISUALIZATION OF CONE-AND-PLATE FLOW
Redistribution subject to SOR license or copyright; see http://scitation.aip.org/content/sor/journal/jor2/info/about. Downloaded to IP: 86.173.235.69 On: Fri, 02 May 2014
19:30:33
offer distinct advantages in studying fluid motion in a precise and noninvasive manner,especially under steady-state flow conditions@Callaghanet al. ~1988!#. In particular,NMR velocity imaging has been used to investigate flow in rheology in both pipe@Al-tobelli et al. ~1991!; Xia and Callaghan~1991!# and Couette geometries@Rofe et al.~1994!#. To our knowledge, we are the first to use this method to study flow in a cone-and-plate rheometer@Britton and Callaghan~1997!#, although we note that NMR spec-troscopy has been used to obtain NMR spectra for molecules undergoing shear in acone-and-plate gap. The aim of these studies has been to gain insight regarding chaindeformation and alignment in sheared polymer melts@Nakataniet al. ~1990!# and liquidcrystals @Grabowski and Schmidt~1994!; Lukascheket al. ~1995!; Lukascheket al.~1996!#. Under circumstances where the shear rate is nonuniform within the gap, suchspectroscopic investigations will suffer from the same ambiguities as other methodsrelying on integration of fluid properties from across the gap.
We shall show here that NMR flow imaging can provide a unique window on localfluid behavior. Our test of the uniform shear-rate assumption will cover a range of fluids,including those with Newtonian, non-Newtonian shear thinning, and stress–plateau char-acteristics. We shall show here that in the case of those fluids exhibiting unusual flowcurves, quite unusual velocity distributions may exist within the gap.
II. NMR VELOCITY IMAGING
NMR imaging has the great advantage of being able to be used to examine systemsnoninvasively. While the spatial resolution of NMR microscopy is modest compared toother techniques such as particle or optical microscopy, this technique is able to providespatially resolved information concerning chemical and physical properties, includingprecise velocity profiles. NMR microscopy also has comparatively low sensitivity, afactor which limits both the spatial resolution and the speed of measurement. A well-designed experiment must trade off the available signal-to-noise ratio between these tworequirements. For the flow studies used in this paper, high spatial and velocity resolutionis required and, as a consequence, the measurement of the velocity distribution is quiteslow, requiring on the order of 30 min. In our work, therefore, steady-state flow isrequired. We stress, however, that other approaches are possible. For example, unsteady,turbulent flow can be monitored with a temporal resolution of around 100 ms using echoplanar imaging techniques@Kose ~1992!#, but these techniques are quite unsuitable inNMR microscopy due to their much reduced sensitivity. Having said that, we shall showthat even with our steady-state requirements, the method of Fourier analysis, which weemploy, will allow us to gain insight regarding the stability of the flow, and, in particular,to gauge whether fluctuations are present over characteristic time scales.
The principles behind NMR imaging~magnetic resonance imaging! and velocity mea-surement are considered in depth elsewhere@Callaghan~1991!#, and only an overviewwill be provided here. In magnetic resonance imaging a magnetic-field gradient is appliedto a sample, which allows the spins to be spatially located. The precessional frequency~v! of the nuclear spin is dependent on the local magnetic-field gradient (G): v(r )5 gG•r , where r represents the nuclear spatial coordinates. The signal acquired is
written as
S~k! 5 E E E r~r !exp@i~2pk–r !#dr , ~1!
wherer~r ! is the nuclear-spin density, andk is the reciprocal space dimension conjugateto r , given byk 5 (2p)21gGt, wheret is the time evolution. The nuclear-spin density
1368 BRITTON AND CALLAGHAN
Redistribution subject to SOR license or copyright; see http://scitation.aip.org/content/sor/journal/jor2/info/about. Downloaded to IP: 86.173.235.69 On: Fri, 02 May 2014
19:30:33
is then found by acquiring the signal over a volume ofk space and performing an inverseFourier transformation. In practice, reconstruction is performed in two dimensions, usingstandard pulse sequences to selectively excite a plane of spins.
By applying two narrow gradient pulses, of durationd and separationD, with agradient strengthg, the phase shifts will then arise, not from spin position, but from spindisplacement over the time scale ofD. The echo amplitude is given by the equationbelow:
ED~q! 5 E PS~R,D!exp@i~2pq•R!#dR. ~2!
The average propagatorPS(R,D) is the probability that a spin-bearing molecule willmove by a displacementR in the timeD, and, for simple Brownian motion, is Gaussianin shape. The reciprocal space vectorq is defined by (2p)21ggd, and is conjugate toR@Callaghan~1991!#. The well-known Stejskal–Tanner~1965! relationship can be derivedfrom Eq. ~2! and for narrow gradient pulses is
ED 5 exp~24p2q2DD!, ~3!
whereD is the molecular self-diffusion coefficient andq is the magnitude ofq. Self-diffusion results in a spread of spin phases and leads to echo attenuation. It is importantto note that any motion resulting in phase spreading will lead to such attenuation. Inconsequence, the echo is sensitive not only to molecular self-diffusion but to any disper-sive motion whatsoever.
By contrast, net motion in one direction, such as would be associated with a meanvelocity of the molecules, results in a net phase shift in the echo. Such information iseasily extracted by means of Fourier analysis. In particular, inverse Fourier transforma-tion of Eq.~2! with respect toq will reconstruct the average propagator,PS(R,D). Whencombined withk-space imaging, the echo signal is localized so that
S~k,q! 5 E r~r !ED~q,r !exp@i~2pk•r !#dr . ~4!
In practice, we applyq along one direction only and will, therefore, be concerned onlywith displacements ofR along that axis, which we labelZ. Double inverse Fouriertransformation with respect tok andq yields the propagator,PS(Z,D), for every pixel inthe image. This net propagator is a convolution of those propagators, which would resultfrom dispersion (D) and mean flow alone so that its width is (2DD)1/2, while its dis-placement along theZ axis isvD wherev is the velocity component along this axis. Ourimage analysis software is used to obtain these parameters directly so that diffusion andvelocity maps can be constructed automatically.
III. EXPERIMENTAL
The factors of natural abundance and high gyromagnetic ratio make the proton theideal nucleus to be used where high sensitivity is required. All NMR experiments werecarried out using the proton NMR signal from hydrogen atoms present in the variousmolecular species present, but predominantly in the solvent molecules. We used a BrukerAMX300 NMR spectrometer equipped with a specialized microimaging attachment. Therheogoniometer was designed and built in our laboratory. A photograph of the cone-and-plate apparatus is shown in Fig. 1~a! along with a schematic diagram in Fig. 1~b!. It fitswithin the rf and gradient coil assembly~the ‘‘probe’’!, which is situated inside the bore
1369NMR VISUALIZATION OF CONE-AND-PLATE FLOW
Redistribution subject to SOR license or copyright; see http://scitation.aip.org/content/sor/journal/jor2/info/about. Downloaded to IP: 86.173.235.69 On: Fri, 02 May 2014
19:30:33
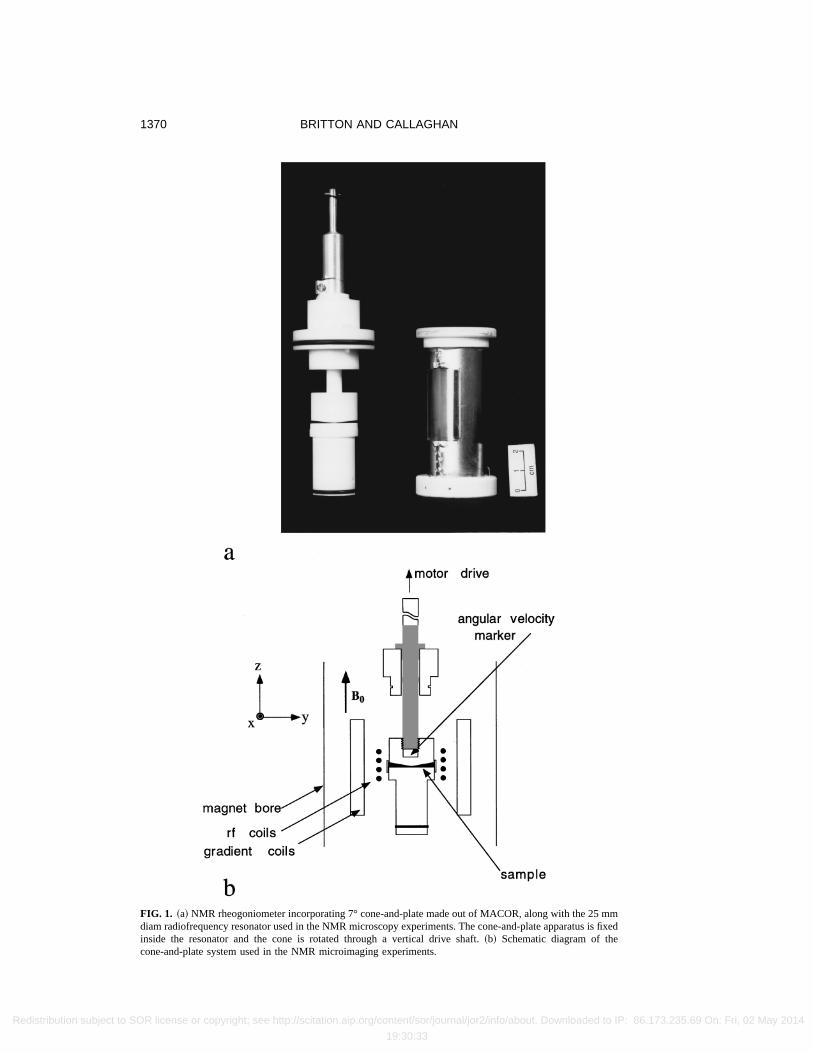
FIG. 1. ~a! NMR rheogoniometer incorporating 7° cone-and-plate made out of MACOR, along with the 25 mmdiam radiofrequency resonator used in the NMR microscopy experiments. The cone-and-plate apparatus is fixedinside the resonator and the cone is rotated through a vertical drive shaft.~b! Schematic diagram of thecone-and-plate system used in the NMR microimaging experiments.
1370 BRITTON AND CALLAGHAN
Redistribution subject to SOR license or copyright; see http://scitation.aip.org/content/sor/journal/jor2/info/about. Downloaded to IP: 86.173.235.69 On: Fri, 02 May 2014
19:30:33
of a 7 T superconducting magnet. The cone is driven by a motor and gearbox locatedabove the magnet and connected to the cone via a long shaft down the magnet bore.
Because the cone and plate is placed in a strong magnetic field, and is subjected topulsed magnetic-field gradients, and because we require transparency to rf fields, we arelimited in the types of materials that can be used for its construction. In particular, thematerial must be nonmetallic and NMR ‘‘invisible.’’ We have chosen to use the machin-able glass composite material MACOR~Corning, New York!, along with glass andTeflon for some components. In all experiments, the cone was made from MACOR whileboth MACOR and glass plates were used so as to investigate any effects arising fromdifferences in plate materials. The diameter of the cone and plate was 24 mm in eachcase. Two cone angles were used: 4° and 7°. A range of step-down gearboxes areavailable to connect the 1.8° stepper motor to the drive shaft. The frequency of this motorwas controlled by the spectrometer and could be driven both clockwise and anticlock-wise. A small amount of marker fluid could be placed into a cavity in the cone in orderto obtain an independent NMR estimate of the cone velocity.
Shearing experiments were carried out using a variety of fluids including water, sili-cone grease, polystyrene in decalin, polyacrylamide in water, and an aqueous solution ofthe wormlike surfactant, cetylpyridinium chloride/sodium salicylate. The polystyrene~Mw 5 0.6 MDa, Mw /Mn 5 1.10! was obtained from Polymer Laboratories~Shrop-shire, U.K.! and the polyacrylamide~Mw 5 18 MDa, polydispersed! from Polysciences,Inc. ~Warrington, PA!. The polystyrene/decalin solution was 11.5 g dl21, while a3 g dl21 aqueous solution of polyacrylamide was made up using distilled deionized wa-ter. A 4% solution of the wormlike surfactant was made up with 100 mmol cetylpyri-dinium chloride ~CPyCl! ~Aldrich! and 60 mmol sodium salicylate~NaSal! ~Aldrich!using distilled deionized water. Silicone grease~‘‘rhodorsil’’ ! was obtained from Rhoˆne–Poulenc~Rhone, France!. The experiments using water alone were carried out in order toprovide a Newtonian reference. This water~but not that used in the solutions referred toabove! was doped with CuSO4 ~0.1%! to reduce the protonT1 relaxation time, and thus,reduce experiment duration. The polymer solutions were allowed to reach equilibriumover a couple of weeks, and the wormlike surfactant solution, over a few days.
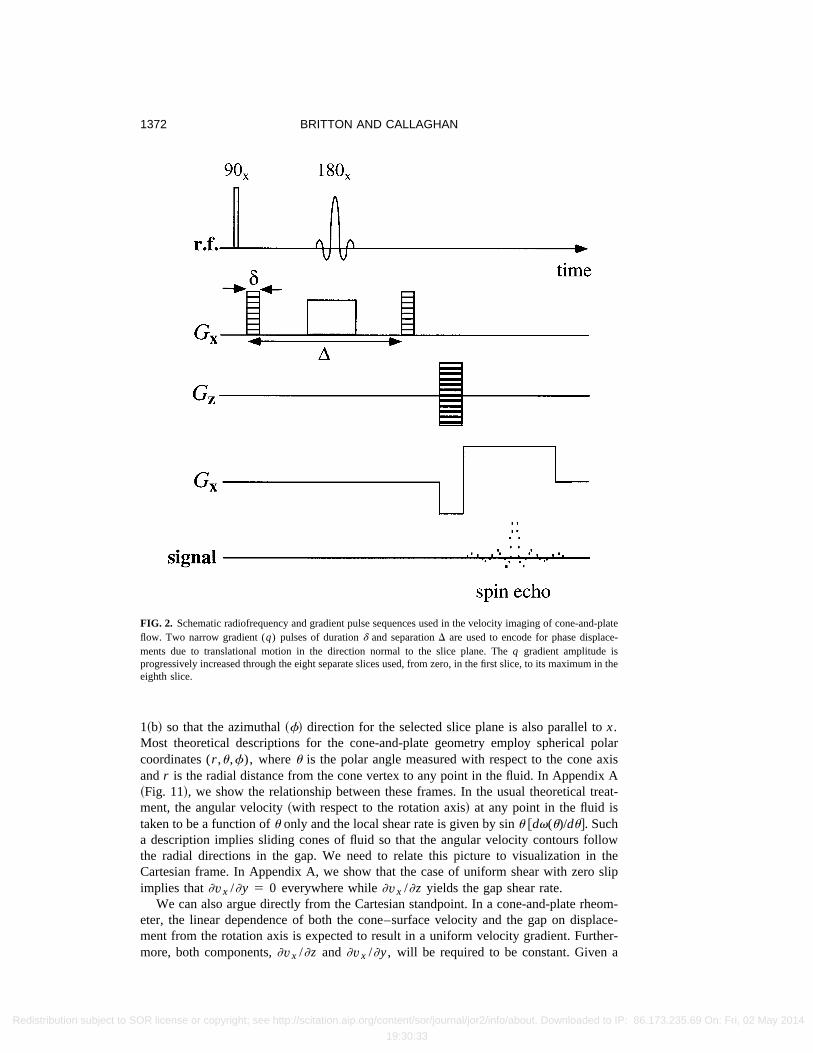
All experiments were carried out at 25 °C using temperature control. This was ofparticular importance for the wormlike surfactant, which has a phase change at 19 °C. Apulsed gradient spin-echo imaging sequence@Callaghan~1991!# was used, with a nega-tive read precursor to limit any diffusive attenuation, as shown in Fig. 2. Thez gradientwas aligned with the axis of rotation, and the velocity profile for a slice normal to theplate was obtained, with the velocity encoding in the slice normal (x) direction. Pulsedurations~d! and preparation times~D! were between 1.5 and 2.5 and 15 and 30 ms,respectively, and a repetition time of 1 s was used. The velocity maps comprised a 1283128 pixel array with a field of view of 25 mm and slice thickness of 2 mm. To increasethe spatial resolution across the gap~the z direction!, the strength of thez gradient wascorrespondingly increased to yield either a threefold or sixfold increase in gain. A proton~spin-density! image obtained for the wormlike surfactant, with six times gain, is shownin Fig. 3.
IV. RESULTS
A. Uniform shear
The NMR apparatus utilizes magnetic-field gradients whose directions are orthogonalin a Cartesian reference frame. In consequence, the primary velocity maps are collectedin Cartesian space. In our experiment, this Cartesian frame is oriented as shown in Fig.
1371NMR VISUALIZATION OF CONE-AND-PLATE FLOW
Redistribution subject to SOR license or copyright; see http://scitation.aip.org/content/sor/journal/jor2/info/about. Downloaded to IP: 86.173.235.69 On: Fri, 02 May 2014
19:30:33
1~b! so that the azimuthal~f! direction for the selected slice plane is also parallel tox.Most theoretical descriptions for the cone-and-plate geometry employ spherical polarcoordinates (r ,u,f), whereu is the polar angle measured with respect to the cone axisandr is the radial distance from the cone vertex to any point in the fluid. In Appendix A~Fig. 11!, we show the relationship between these frames. In the usual theoretical treat-ment, the angular velocity~with respect to the rotation axis! at any point in the fluid istaken to be a function ofu only and the local shear rate is given by sinu @dv(u)/du#. Sucha description implies sliding cones of fluid so that the angular velocity contours followthe radial directions in the gap. We need to relate this picture to visualization in theCartesian frame. In Appendix A, we show that the case of uniform shear with zero slipimplies that]vx /]y 5 0 everywhere while]vx /]z yields the gap shear rate.
We can also argue directly from the Cartesian standpoint. In a cone-and-plate rheom-eter, the linear dependence of both the cone–surface velocity and the gap on displace-ment from the rotation axis is expected to result in a uniform velocity gradient. Further-more, both components,]vx /]z and ]vx /]y, will be required to be constant. Given a
FIG. 2. Schematic radiofrequency and gradient pulse sequences used in the velocity imaging of cone-and-plateflow. Two narrow gradient (q) pulses of durationd and separationD are used to encode for phase displace-ments due to translational motion in the direction normal to the slice plane. Theq gradient amplitude isprogressively increased through the eight separate slices used, from zero, in the first slice, to its maximum in theeighth slice.
1372 BRITTON AND CALLAGHAN
Redistribution subject to SOR license or copyright; see http://scitation.aip.org/content/sor/journal/jor2/info/about. Downloaded to IP: 86.173.235.69 On: Fri, 02 May 2014
19:30:33
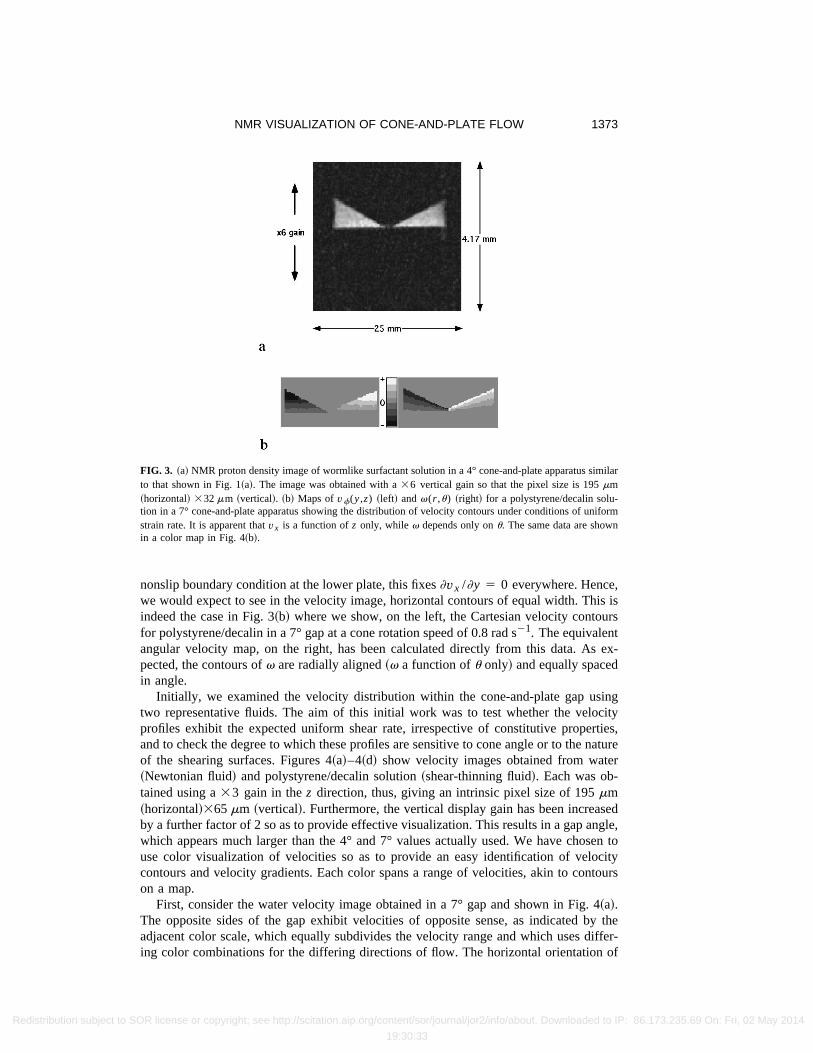
nonslip boundary condition at the lower plate, this fixes]vx /]y 5 0 everywhere. Hence,we would expect to see in the velocity image, horizontal contours of equal width. This isindeed the case in Fig. 3~b! where we show, on the left, the Cartesian velocity contoursfor polystyrene/decalin in a 7° gap at a cone rotation speed of 0.8 rad s21. The equivalentangular velocity map, on the right, has been calculated directly from this data. As ex-pected, the contours ofv are radially aligned~v a function ofu only! and equally spacedin angle.
Initially, we examined the velocity distribution within the cone-and-plate gap usingtwo representative fluids. The aim of this initial work was to test whether the velocityprofiles exhibit the expected uniform shear rate, irrespective of constitutive properties,and to check the degree to which these profiles are sensitive to cone angle or to the natureof the shearing surfaces. Figures 4~a!–4~d! show velocity images obtained from water~Newtonian fluid! and polystyrene/decalin solution~shear-thinning fluid!. Each was ob-tained using a33 gain in thez direction, thus, giving an intrinsic pixel size of 195mm~horizontal!365mm ~vertical!. Furthermore, the vertical display gain has been increasedby a further factor of 2 so as to provide effective visualization. This results in a gap angle,which appears much larger than the 4° and 7° values actually used. We have chosen touse color visualization of velocities so as to provide an easy identification of velocitycontours and velocity gradients. Each color spans a range of velocities, akin to contourson a map.
First, consider the water velocity image obtained in a 7° gap and shown in Fig. 4~a!.The opposite sides of the gap exhibit velocities of opposite sense, as indicated by theadjacent color scale, which equally subdivides the velocity range and which uses differ-ing color combinations for the differing directions of flow. The horizontal orientation of
FIG. 3. ~a! NMR proton density image of wormlike surfactant solution in a 4° cone-and-plate apparatus similarto that shown in Fig. 1~a!. The image was obtained with a36 vertical gain so that the pixel size is 195mm~horizontal! 332mm ~vertical!. ~b! Maps ofvf(y,z) ~left! andv(r ,u) ~right! for a polystyrene/decalin solu-tion in a 7° cone-and-plate apparatus showing the distribution of velocity contours under conditions of uniformstrain rate. It is apparent thatvx is a function ofz only, while v depends only onu. The same data are shownin a color map in Fig. 4~b!.
1373NMR VISUALIZATION OF CONE-AND-PLATE FLOW
Redistribution subject to SOR license or copyright; see http://scitation.aip.org/content/sor/journal/jor2/info/about. Downloaded to IP: 86.173.235.69 On: Fri, 02 May 2014
19:30:33
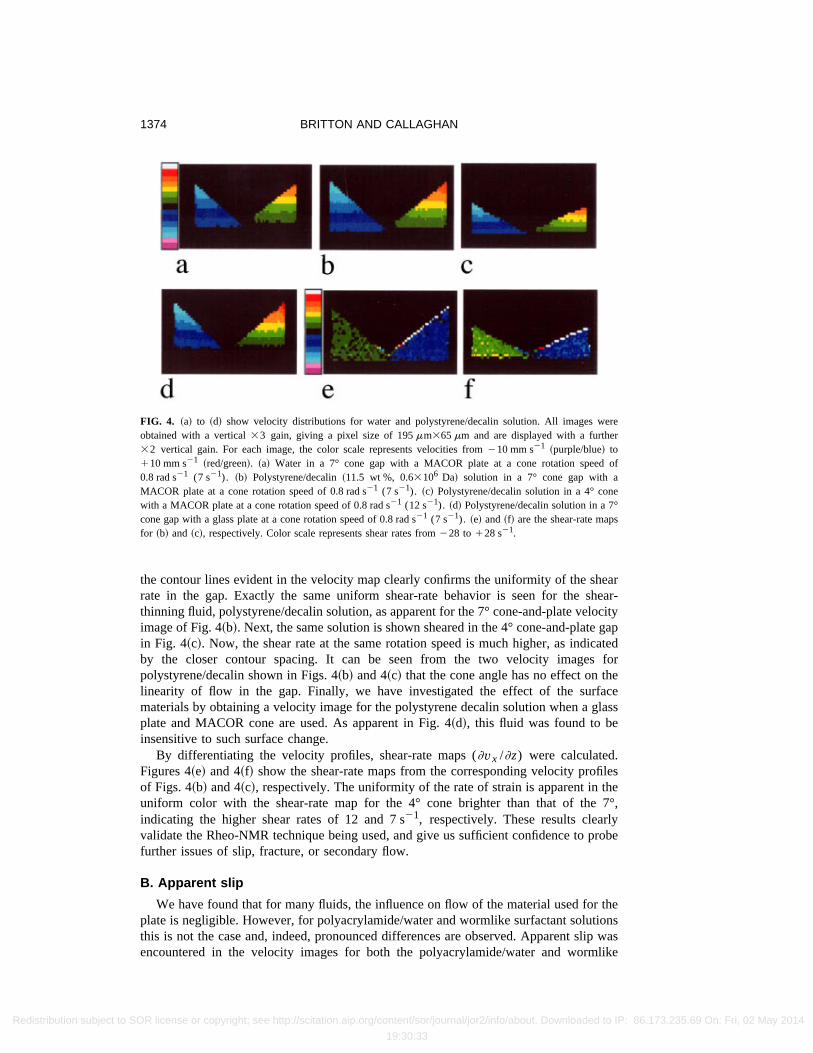
the contour lines evident in the velocity map clearly confirms the uniformity of the shearrate in the gap. Exactly the same uniform shear-rate behavior is seen for the shear-thinning fluid, polystyrene/decalin solution, as apparent for the 7° cone-and-plate velocityimage of Fig. 4~b!. Next, the same solution is shown sheared in the 4° cone-and-plate gapin Fig. 4~c!. Now, the shear rate at the same rotation speed is much higher, as indicatedby the closer contour spacing. It can be seen from the two velocity images forpolystyrene/decalin shown in Figs. 4~b! and 4~c! that the cone angle has no effect on thelinearity of flow in the gap. Finally, we have investigated the effect of the surfacematerials by obtaining a velocity image for the polystyrene decalin solution when a glassplate and MACOR cone are used. As apparent in Fig. 4~d!, this fluid was found to beinsensitive to such surface change.
By differentiating the velocity profiles, shear-rate maps (]vx /]z) were calculated.Figures 4~e! and 4~f! show the shear-rate maps from the corresponding velocity profilesof Figs. 4~b! and 4~c!, respectively. The uniformity of the rate of strain is apparent in theuniform color with the shear-rate map for the 4° cone brighter than that of the 7°,indicating the higher shear rates of 12 and 7 s21, respectively. These results clearlyvalidate the Rheo-NMR technique being used, and give us sufficient confidence to probefurther issues of slip, fracture, or secondary flow.
B. Apparent slip
We have found that for many fluids, the influence on flow of the material used for theplate is negligible. However, for polyacrylamide/water and wormlike surfactant solutionsthis is not the case and, indeed, pronounced differences are observed. Apparent slip wasencountered in the velocity images for both the polyacrylamide/water and wormlike
FIG. 4. ~a! to ~d! show velocity distributions for water and polystyrene/decalin solution. All images wereobtained with a vertical33 gain, giving a pixel size of 195mm365mm and are displayed with a further32 vertical gain. For each image, the color scale represents velocities from210 mm s21 ~purple/blue! to110 mm s21 ~red/green!. ~a! Water in a 7° cone gap with a MACOR plate at a cone rotation speed of0.8 rad s21 (7 s21). ~b! Polystyrene/decalin~11.5 wt %, 0.63106 Da! solution in a 7° cone gap with aMACOR plate at a cone rotation speed of 0.8 rad s21 (7 s21). ~c! Polystyrene/decalin solution in a 4° conewith a MACOR plate at a cone rotation speed of 0.8 rad s21 (12 s21). ~d! Polystyrene/decalin solution in a 7°cone gap with a glass plate at a cone rotation speed of 0.8 rad s21 (7 s21). ~e! and~f! are the shear-rate mapsfor ~b! and ~c!, respectively. Color scale represents shear rates from228 to 128 s21.
1374 BRITTON AND CALLAGHAN
Redistribution subject to SOR license or copyright; see http://scitation.aip.org/content/sor/journal/jor2/info/about. Downloaded to IP: 86.173.235.69 On: Fri, 02 May 2014
19:30:33
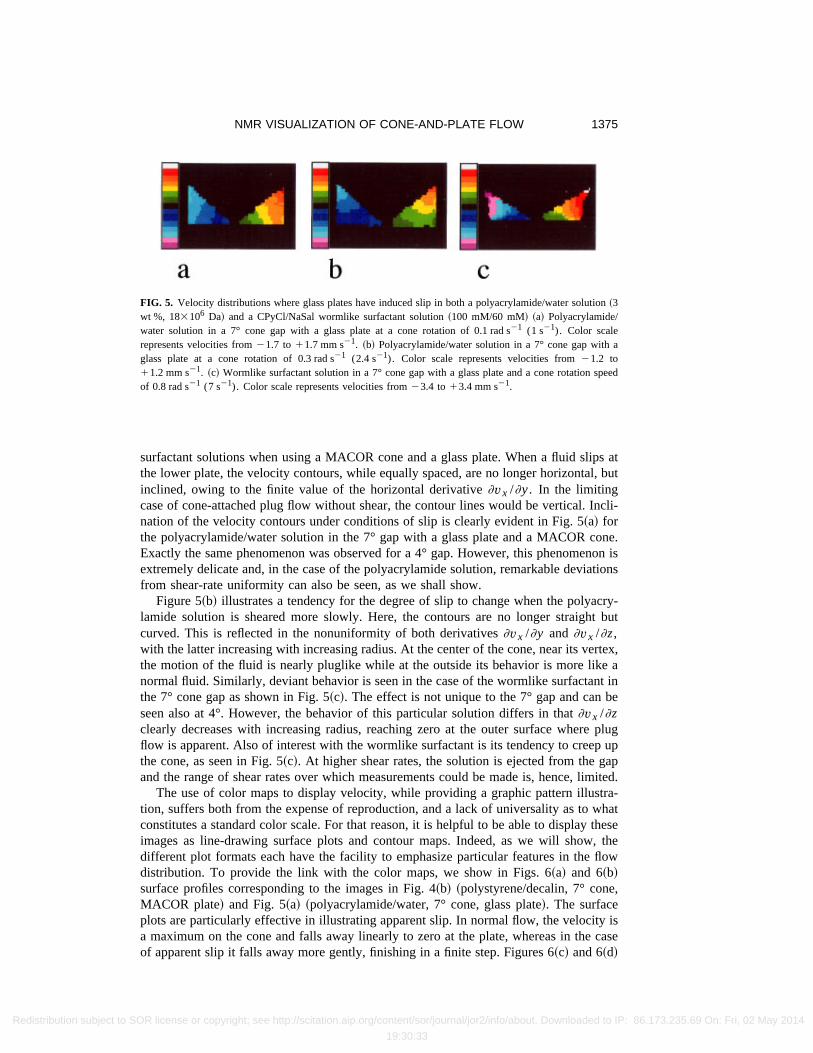
surfactant solutions when using a MACOR cone and a glass plate. When a fluid slips atthe lower plate, the velocity contours, while equally spaced, are no longer horizontal, butinclined, owing to the finite value of the horizontal derivative]vx /]y. In the limitingcase of cone-attached plug flow without shear, the contour lines would be vertical. Incli-nation of the velocity contours under conditions of slip is clearly evident in Fig. 5~a! forthe polyacrylamide/water solution in the 7° gap with a glass plate and a MACOR cone.Exactly the same phenomenon was observed for a 4° gap. However, this phenomenon isextremely delicate and, in the case of the polyacrylamide solution, remarkable deviationsfrom shear-rate uniformity can also be seen, as we shall show.
Figure 5~b! illustrates a tendency for the degree of slip to change when the polyacry-lamide solution is sheared more slowly. Here, the contours are no longer straight butcurved. This is reflected in the nonuniformity of both derivatives]vx /]y and ]vx /]z,with the latter increasing with increasing radius. At the center of the cone, near its vertex,the motion of the fluid is nearly pluglike while at the outside its behavior is more like anormal fluid. Similarly, deviant behavior is seen in the case of the wormlike surfactant inthe 7° cone gap as shown in Fig. 5~c!. The effect is not unique to the 7° gap and can beseen also at 4°. However, the behavior of this particular solution differs in that]vx /]zclearly decreases with increasing radius, reaching zero at the outer surface where plugflow is apparent. Also of interest with the wormlike surfactant is its tendency to creep upthe cone, as seen in Fig. 5~c!. At higher shear rates, the solution is ejected from the gapand the range of shear rates over which measurements could be made is, hence, limited.
The use of color maps to display velocity, while providing a graphic pattern illustra-tion, suffers both from the expense of reproduction, and a lack of universality as to whatconstitutes a standard color scale. For that reason, it is helpful to be able to display theseimages as line-drawing surface plots and contour maps. Indeed, as we will show, thedifferent plot formats each have the facility to emphasize particular features in the flowdistribution. To provide the link with the color maps, we show in Figs. 6~a! and 6~b!surface profiles corresponding to the images in Fig. 4~b! ~polystyrene/decalin, 7° cone,MACOR plate! and Fig. 5~a! ~polyacrylamide/water, 7° cone, glass plate!. The surfaceplots are particularly effective in illustrating apparent slip. In normal flow, the velocity isa maximum on the cone and falls away linearly to zero at the plate, whereas in the caseof apparent slip it falls away more gently, finishing in a finite step. Figures 6~c! and 6~d!
FIG. 5. Velocity distributions where glass plates have induced slip in both a polyacrylamide/water solution~3wt %, 183106 Da! and a CPyCl/NaSal wormlike surfactant solution~100 mM/60 mM! ~a! Polyacrylamide/water solution in a 7° cone gap with a glass plate at a cone rotation of 0.1 rad s21 (1 s21). Color scalerepresents velocities from21.7 to 11.7 mm s21. ~b! Polyacrylamide/water solution in a 7° cone gap with aglass plate at a cone rotation of 0.3 rad s21 (2.4 s21). Color scale represents velocities from21.2 to11.2 mm s21. ~c! Wormlike surfactant solution in a 7° cone gap with a glass plate and a cone rotation speedof 0.8 rad s21 (7 s21). Color scale represents velocities from23.4 to 13.4 mm s21.
1375NMR VISUALIZATION OF CONE-AND-PLATE FLOW
Redistribution subject to SOR license or copyright; see http://scitation.aip.org/content/sor/journal/jor2/info/about. Downloaded to IP: 86.173.235.69 On: Fri, 02 May 2014
19:30:33
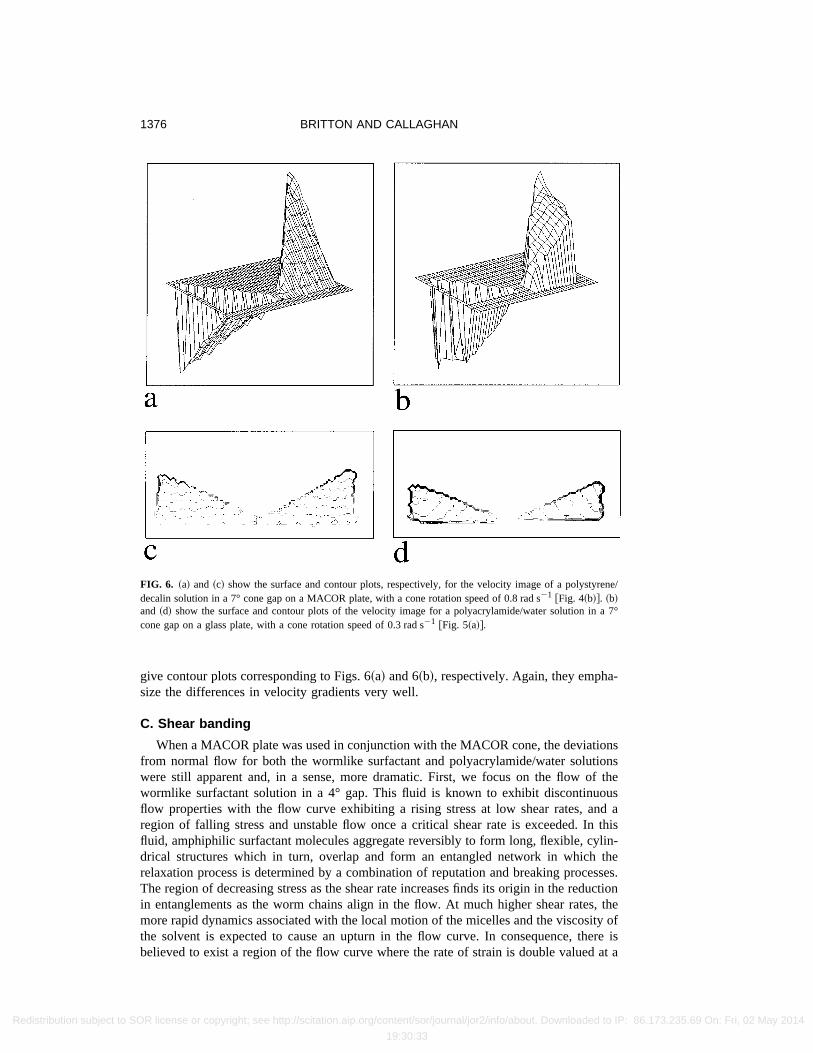
give contour plots corresponding to Figs. 6~a! and 6~b!, respectively. Again, they empha-size the differences in velocity gradients very well.
C. Shear banding
When a MACOR plate was used in conjunction with the MACOR cone, the deviationsfrom normal flow for both the wormlike surfactant and polyacrylamide/water solutionswere still apparent and, in a sense, more dramatic. First, we focus on the flow of thewormlike surfactant solution in a 4° gap. This fluid is known to exhibit discontinuousflow properties with the flow curve exhibiting a rising stress at low shear rates, and aregion of falling stress and unstable flow once a critical shear rate is exceeded. In thisfluid, amphiphilic surfactant molecules aggregate reversibly to form long, flexible, cylin-drical structures which in turn, overlap and form an entangled network in which therelaxation process is determined by a combination of reputation and breaking processes.The region of decreasing stress as the shear rate increases finds its origin in the reductionin entanglements as the worm chains align in the flow. At much higher shear rates, themore rapid dynamics associated with the local motion of the micelles and the viscosity ofthe solvent is expected to cause an upturn in the flow curve. In consequence, there isbelieved to exist a region of the flow curve where the rate of strain is double valued at a
FIG. 6. ~a! and ~c! show the surface and contour plots, respectively, for the velocity image of a polystyrene/decalin solution in a 7° cone gap on a MACOR plate, with a cone rotation speed of 0.8 rad s21 @Fig. 4~b!#. ~b!and ~d! show the surface and contour plots of the velocity image for a polyacrylamide/water solution in a 7°cone gap on a glass plate, with a cone rotation speed of 0.3 rad s21 @Fig. 5~a!#.
1376 BRITTON AND CALLAGHAN
Redistribution subject to SOR license or copyright; see http://scitation.aip.org/content/sor/journal/jor2/info/about. Downloaded to IP: 86.173.235.69 On: Fri, 02 May 2014
19:30:33
given stress. Measurements of stress versus rate of strain using a cone-and-plate rheom-eter indicate a stress plateau as the apparent shear rate is increased, but the underlyingdetails of the shear-rate distribution are not at all clear. In this paper, we wish to dem-onstrate the complexity of this problem and the need for velocimetry tests such as thoseoutlined here, if mechanical measurements of the nonlinear viscosity are to be properlyinterpreted. The implications for the condensed matter physics of wormlike micelle so-lutions have been discussed elsewhere@Britton and Callaghan~1997!#.
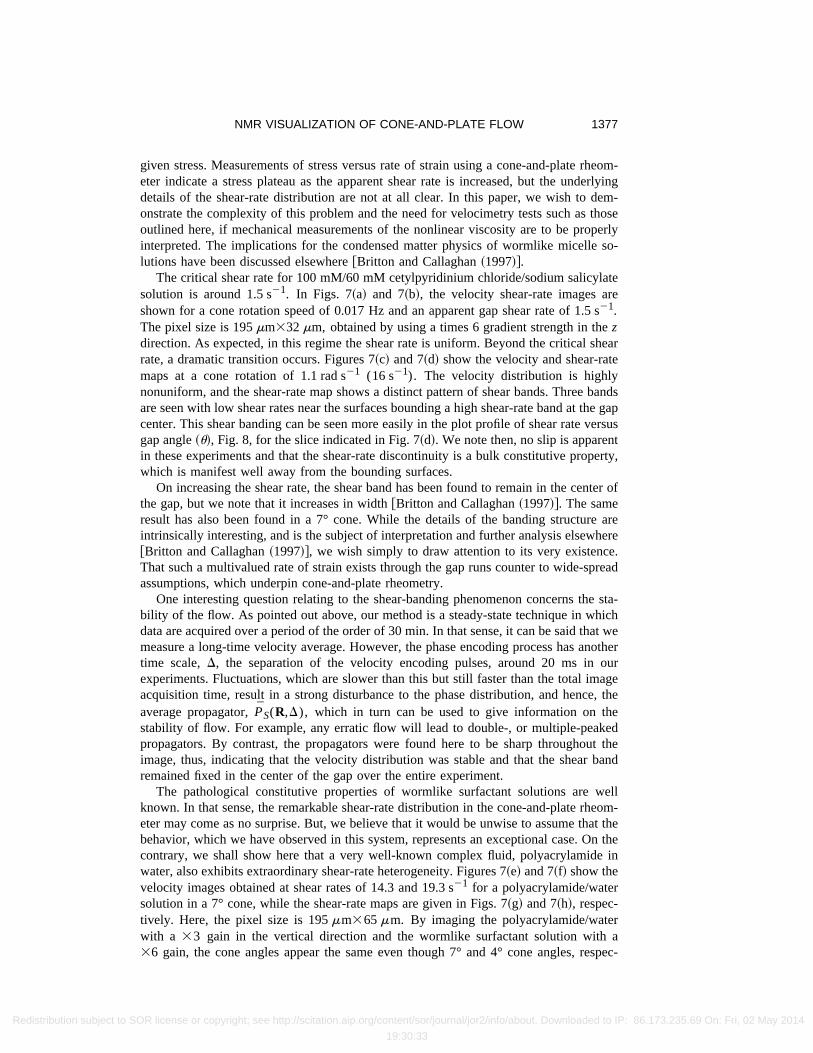
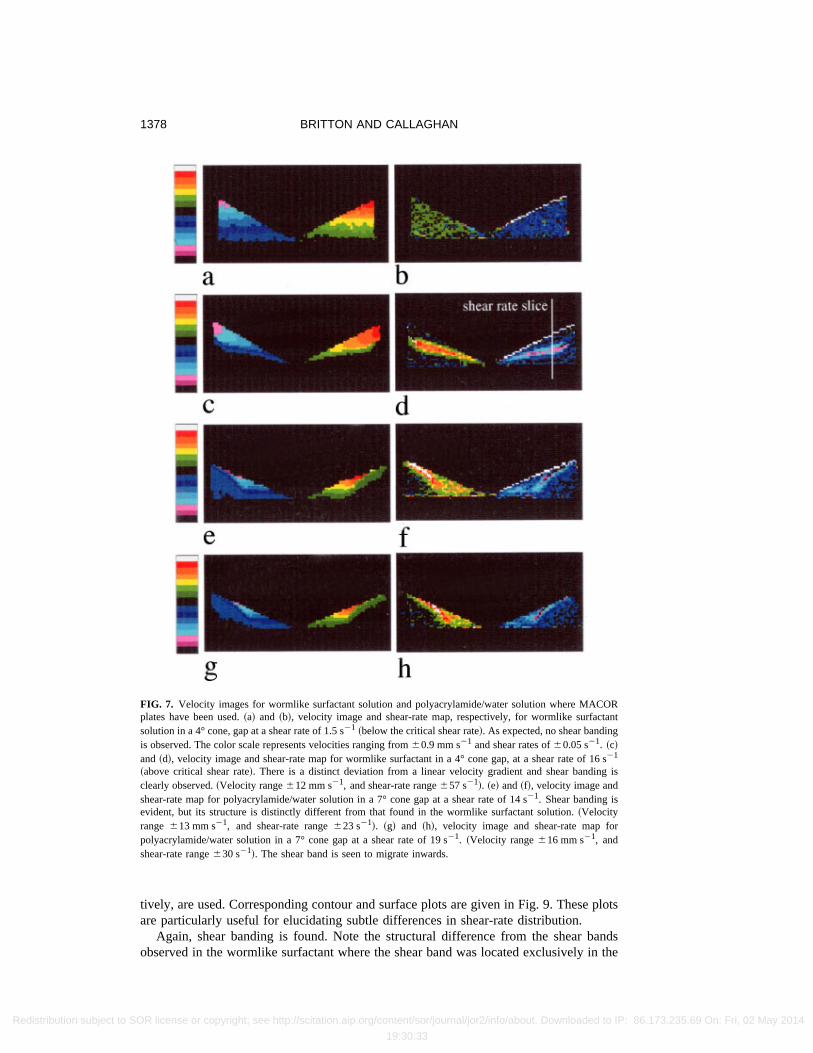
The critical shear rate for 100 mM/60 mM cetylpyridinium chloride/sodium salicylatesolution is around 1.5 s21. In Figs. 7~a! and 7~b!, the velocity shear-rate images areshown for a cone rotation speed of 0.017 Hz and an apparent gap shear rate of 1.5 s21.The pixel size is 195mm332mm, obtained by using a times 6 gradient strength in thezdirection. As expected, in this regime the shear rate is uniform. Beyond the critical shearrate, a dramatic transition occurs. Figures 7~c! and 7~d! show the velocity and shear-ratemaps at a cone rotation of 1.1 rad s21 (16 s21). The velocity distribution is highlynonuniform, and the shear-rate map shows a distinct pattern of shear bands. Three bandsare seen with low shear rates near the surfaces bounding a high shear-rate band at the gapcenter. This shear banding can be seen more easily in the plot profile of shear rate versusgap angle~u!, Fig. 8, for the slice indicated in Fig. 7~d!. We note then, no slip is apparentin these experiments and that the shear-rate discontinuity is a bulk constitutive property,which is manifest well away from the bounding surfaces.
On increasing the shear rate, the shear band has been found to remain in the center ofthe gap, but we note that it increases in width@Britton and Callaghan~1997!#. The sameresult has also been found in a 7° cone. While the details of the banding structure areintrinsically interesting, and is the subject of interpretation and further analysis elsewhere@Britton and Callaghan~1997!#, we wish simply to draw attention to its very existence.That such a multivalued rate of strain exists through the gap runs counter to wide-spreadassumptions, which underpin cone-and-plate rheometry.
One interesting question relating to the shear-banding phenomenon concerns the sta-bility of the flow. As pointed out above, our method is a steady-state technique in whichdata are acquired over a period of the order of 30 min. In that sense, it can be said that wemeasure a long-time velocity average. However, the phase encoding process has anothertime scale,D, the separation of the velocity encoding pulses, around 20 ms in ourexperiments. Fluctuations, which are slower than this but still faster than the total imageacquisition time, result in a strong disturbance to the phase distribution, and hence, theaverage propagator,PS(R,D), which in turn can be used to give information on thestability of flow. For example, any erratic flow will lead to double-, or multiple-peakedpropagators. By contrast, the propagators were found here to be sharp throughout theimage, thus, indicating that the velocity distribution was stable and that the shear bandremained fixed in the center of the gap over the entire experiment.
The pathological constitutive properties of wormlike surfactant solutions are wellknown. In that sense, the remarkable shear-rate distribution in the cone-and-plate rheom-eter may come as no surprise. But, we believe that it would be unwise to assume that thebehavior, which we have observed in this system, represents an exceptional case. On thecontrary, we shall show here that a very well-known complex fluid, polyacrylamide inwater, also exhibits extraordinary shear-rate heterogeneity. Figures 7~e! and 7~f! show thevelocity images obtained at shear rates of 14.3 and 19.3 s21 for a polyacrylamide/watersolution in a 7° cone, while the shear-rate maps are given in Figs. 7~g! and 7~h!, respec-tively. Here, the pixel size is 195mm365mm. By imaging the polyacrylamide/waterwith a 33 gain in the vertical direction and the wormlike surfactant solution with a36 gain, the cone angles appear the same even though 7° and 4° cone angles, respec-
1377NMR VISUALIZATION OF CONE-AND-PLATE FLOW
Redistribution subject to SOR license or copyright; see http://scitation.aip.org/content/sor/journal/jor2/info/about. Downloaded to IP: 86.173.235.69 On: Fri, 02 May 2014
19:30:33
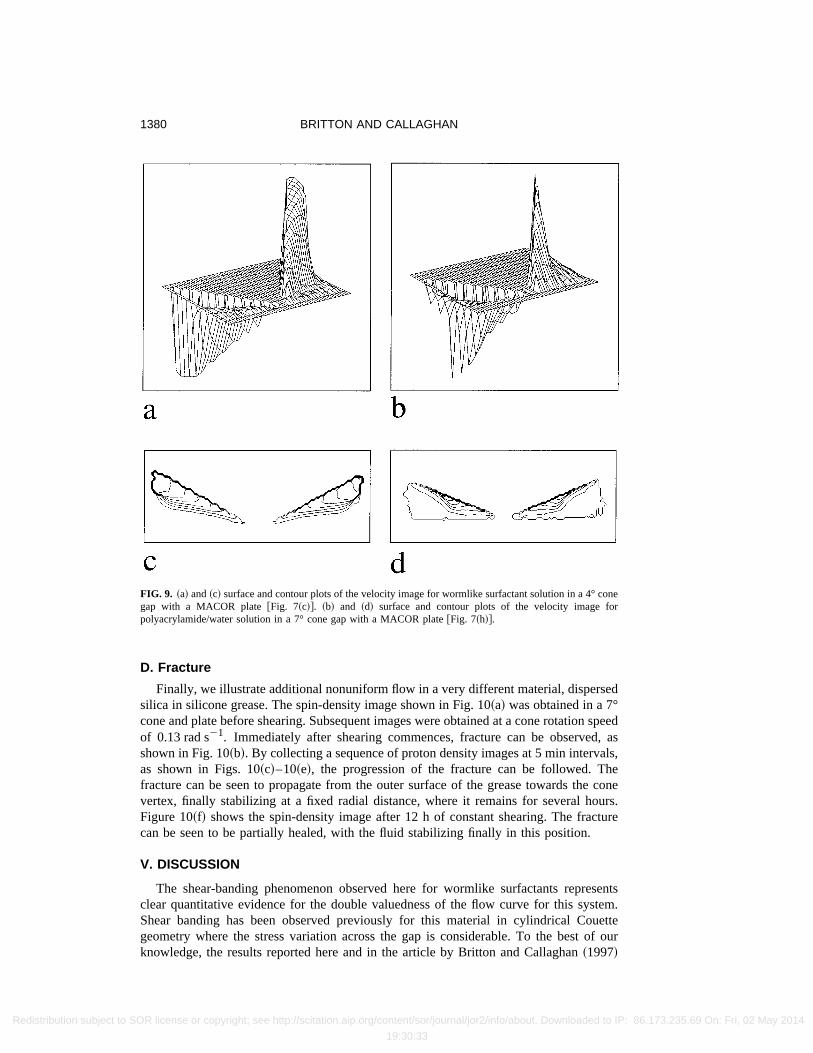
tively, are used. Corresponding contour and surface plots are given in Fig. 9. These plotsare particularly useful for elucidating subtle differences in shear-rate distribution.
Again, shear banding is found. Note the structural difference from the shear bandsobserved in the wormlike surfactant where the shear band was located exclusively in the
FIG. 7. Velocity images for wormlike surfactant solution and polyacrylamide/water solution where MACORplates have been used.~a! and ~b!, velocity image and shear-rate map, respectively, for wormlike surfactantsolution in a 4° cone, gap at a shear rate of 1.5 s21 ~below the critical shear rate!. As expected, no shear bandingis observed. The color scale represents velocities ranging from60.9 mm s21 and shear rates of60.05 s21. ~c!and~d!, velocity image and shear-rate map for wormlike surfactant in a 4° cone gap, at a shear rate of 16 s21
~above critical shear rate!. There is a distinct deviation from a linear velocity gradient and shear banding isclearly observed.~Velocity range612 mm s21, and shear-rate range657 s21!. ~e! and~f!, velocity image andshear-rate map for polyacrylamide/water solution in a 7° cone gap at a shear rate of 14 s21. Shear banding isevident, but its structure is distinctly different from that found in the wormlike surfactant solution.~Velocityrange 613 mm s21, and shear-rate range623 s21!. ~g! and ~h!, velocity image and shear-rate map forpolyacrylamide/water solution in a 7° cone gap at a shear rate of 19 s21. ~Velocity range616 mm s21, andshear-rate range630 s21!. The shear band is seen to migrate inwards.
1378 BRITTON AND CALLAGHAN
Redistribution subject to SOR license or copyright; see http://scitation.aip.org/content/sor/journal/jor2/info/about. Downloaded to IP: 86.173.235.69 On: Fri, 02 May 2014
19:30:33
fluid. In the polyacrylamide solution, the shear band is located on the surface of the conein the outer regions of the fluid, and within the fluid, closer to the center of the gap. Thisradial dependence is remarkable and runs counter to the symmetry of the shear andnormal stress terms resulting, in first order, from the equation of motion. This associationbetween the cone surface and the shear band in polyacrylamide solutions represents asignificant difference from the behavior observed in wormlike surfactants, where theband is located entirely within the bulk of the fluid, and at unique polar angleu ofroughly midgap location. By contrast, the polyacrylamide band is complex in shape,contacting the upper surface at some particular radial position,r c , and then distinctlyinclining into the fluid towards midgap and smaller radii, until it eventually disperses toresult in a region of uniform, albeit higher shear rate, across the gap near the cone vertex.A second difference concerns the change in the position of the shear band in polyacry-lamide solution as the shear rate changes. With increasing shear rate, the shear bandmigrates further into the gap, with the cone–contact radius,r c becoming progressivelysmaller. At the lowest shear rate at which shear banding is observed~approximately7 s21!, this contact point is at its furthest extent from the cone vertex. Again, by studyingthe propagators, we find that the shear band is stable and fixed when in the fluid. How-ever, when the band touches the cone, the propagators begin to show double peaks, thus,indicating a slight instability in this region.
FIG. 8. Shear-rate profile along a line as indicated in Fig. 7~d!. The shear rate is calculated from the parametersof the velocity imaging experiment.
1379NMR VISUALIZATION OF CONE-AND-PLATE FLOW
Redistribution subject to SOR license or copyright; see http://scitation.aip.org/content/sor/journal/jor2/info/about. Downloaded to IP: 86.173.235.69 On: Fri, 02 May 2014
19:30:33
D. Fracture
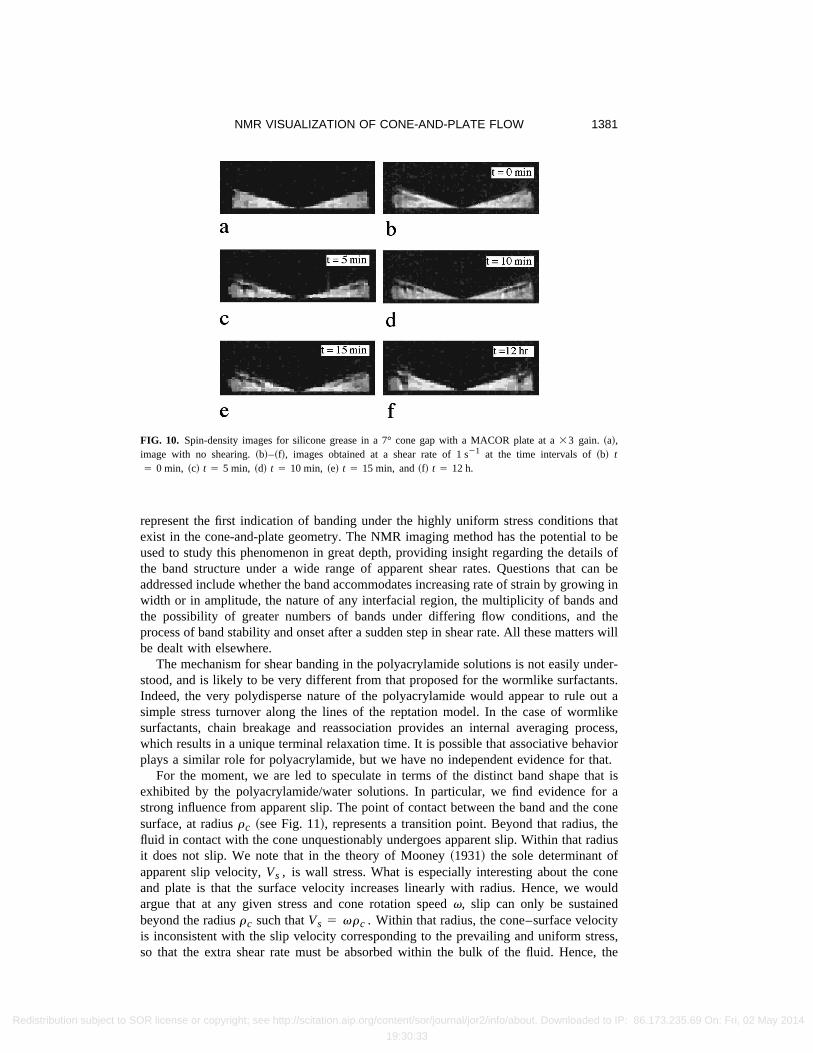
Finally, we illustrate additional nonuniform flow in a very different material, dispersedsilica in silicone grease. The spin-density image shown in Fig. 10~a! was obtained in a 7°cone and plate before shearing. Subsequent images were obtained at a cone rotation speedof 0.13 rad s21. Immediately after shearing commences, fracture can be observed, asshown in Fig. 10~b!. By collecting a sequence of proton density images at 5 min intervals,as shown in Figs. 10~c!–10~e!, the progression of the fracture can be followed. Thefracture can be seen to propagate from the outer surface of the grease towards the conevertex, finally stabilizing at a fixed radial distance, where it remains for several hours.Figure 10~f! shows the spin-density image after 12 h of constant shearing. The fracturecan be seen to be partially healed, with the fluid stabilizing finally in this position.
V. DISCUSSION
The shear-banding phenomenon observed here for wormlike surfactants representsclear quantitative evidence for the double valuedness of the flow curve for this system.Shear banding has been observed previously for this material in cylindrical Couettegeometry where the stress variation across the gap is considerable. To the best of ourknowledge, the results reported here and in the article by Britton and Callaghan~1997!
FIG. 9. ~a! and~c! surface and contour plots of the velocity image for wormlike surfactant solution in a 4° conegap with a MACOR plate@Fig. 7~c!#. ~b! and ~d! surface and contour plots of the velocity image forpolyacrylamide/water solution in a 7° cone gap with a MACOR plate@Fig. 7~h!#.
1380 BRITTON AND CALLAGHAN
Redistribution subject to SOR license or copyright; see http://scitation.aip.org/content/sor/journal/jor2/info/about. Downloaded to IP: 86.173.235.69 On: Fri, 02 May 2014
19:30:33
represent the first indication of banding under the highly uniform stress conditions thatexist in the cone-and-plate geometry. The NMR imaging method has the potential to beused to study this phenomenon in great depth, providing insight regarding the details ofthe band structure under a wide range of apparent shear rates. Questions that can beaddressed include whether the band accommodates increasing rate of strain by growing inwidth or in amplitude, the nature of any interfacial region, the multiplicity of bands andthe possibility of greater numbers of bands under differing flow conditions, and theprocess of band stability and onset after a sudden step in shear rate. All these matters willbe dealt with elsewhere.
The mechanism for shear banding in the polyacrylamide solutions is not easily under-stood, and is likely to be very different from that proposed for the wormlike surfactants.Indeed, the very polydisperse nature of the polyacrylamide would appear to rule out asimple stress turnover along the lines of the reptation model. In the case of wormlikesurfactants, chain breakage and reassociation provides an internal averaging process,which results in a unique terminal relaxation time. It is possible that associative behaviorplays a similar role for polyacrylamide, but we have no independent evidence for that.
For the moment, we are led to speculate in terms of the distinct band shape that isexhibited by the polyacrylamide/water solutions. In particular, we find evidence for astrong influence from apparent slip. The point of contact between the band and the conesurface, at radiusrc ~see Fig. 11!, represents a transition point. Beyond that radius, thefluid in contact with the cone unquestionably undergoes apparent slip. Within that radiusit does not slip. We note that in the theory of Mooney~1931! the sole determinant ofapparent slip velocity,Vs , is wall stress. What is especially interesting about the coneand plate is that the surface velocity increases linearly with radius. Hence, we wouldargue that at any given stress and cone rotation speedv, slip can only be sustainedbeyond the radiusrc such thatVs 5 vrc . Within that radius, the cone–surface velocityis inconsistent with the slip velocity corresponding to the prevailing and uniform stress,so that the extra shear rate must be absorbed within the bulk of the fluid. Hence, the
FIG. 10. Spin-density images for silicone grease in a 7° cone gap with a MACOR plate at a33 gain. ~a!,image with no shearing.~b!–~f!, images obtained at a shear rate of 1 s21 at the time intervals of~b! t5 0 min, ~c! t 5 5 min, ~d! t 5 10 min, ~e! t 5 15 min, and~f! t 5 12 h.
1381NMR VISUALIZATION OF CONE-AND-PLATE FLOW
Redistribution subject to SOR license or copyright; see http://scitation.aip.org/content/sor/journal/jor2/info/about. Downloaded to IP: 86.173.235.69 On: Fri, 02 May 2014
19:30:33

inwards inclination and ultimate dissipation of the band forr , rc . We note that themigration of the contact radiusrc to smaller values as the cone-rotation speed is in-creased is completely consistent with such a picture.
Curiously, the silicone grease also exhibits a behavior, which is radially dependent,with fracture exiting beyond a minimum radius but not inside. While this behavior isclearly very different from that apparent in the polyacrylamide/water solutions, it ishighly suggestive of effects associated with absolute velocity magnitudes rather than theirderivative, the shear rate, alone.
VI. CONCLUSION
NMR flow visualization has the great advantage that it offers good spatial resolution,it is noninvasive, and it does not rely on the existence of tracer particles or introducedscattering centers. It does, however, require a specially constructed rheogoniometer,which fits within the NMR magnet and rf probe, and is limited by the need to avoid theuse of metallic rheometer surfaces.
We have demonstrated just such a ‘‘rheo-NMR’’ system here and have shown thatNMR microscopy can provide useful insight regarding the steady-state velocity profilewithin a cone-and-plate rheometer. In particular, we have demonstrated this method offlow visualization under conditions of uniform shear rate, apparent slip, shear banding,and fluid fracture.
The shear-banding phenomena observed here are dramatic. Furthermore, they are notconfined to complex fluids commonly associated with nonmonotonic flow properties,such as the wormlike surfactant systems. We have shown that shear banding is alsopresent in the flow of polyacrylamide solution within the cone-and-plate gap. Thisanomalous flow, in what is a common system used in rheometric studies, contradicts theusual assumption made in mechanical rheometry that the shear rate within the gap isuniform and given byv/tana. These results serve to emphasize that flow visualization isessential if the results of nonlinear viscosity determination by mechanical rheometry areto be sensibly determined.
There exist other class of phenomena, which are amenable to study using this newmethod. For example, one might investigate the degree to which corrugations in the coneor plate surface can inhibit apparent slip. The method has the potential to provide newinsight regarding secondary flow. By trading off spatial resolution in one dimension it ispossible, in principle, to greatly increase the speed of velocity encoding, thus, allowingthe study of flow instability within the rheometer gap.
ACKNOWLEDGMENT
The authors are grateful to the New Zealand Foundation for Research, Science andTechnology for funding support.
APPENDIX A
Figure 11 shows a schematic diagram of the cone-and-plate coordinate system. Apoint in the fluid is defined by spherical polar (r ,u,f), cylindrical polar (r,z,f), orCartesian (x,y,z) coordinates, wherer 5 y 5 r sinu and z 5 r cosu. The azimuthalcomponent of the fluid velocity,vf , is identical tovx , and the local fluid angularvelocity is v 5 vf /r. In the usual treatmentv~u!, the azimuthal velocity isr sinuv(u) 5 rv(u), and the local shear rate,g, is 2sinu(dv/du), which, for no slip
1382 BRITTON AND CALLAGHAN
Redistribution subject to SOR license or copyright; see http://scitation.aip.org/content/sor/journal/jor2/info/about. Downloaded to IP: 86.173.235.69 On: Fri, 02 May 2014
19:30:33
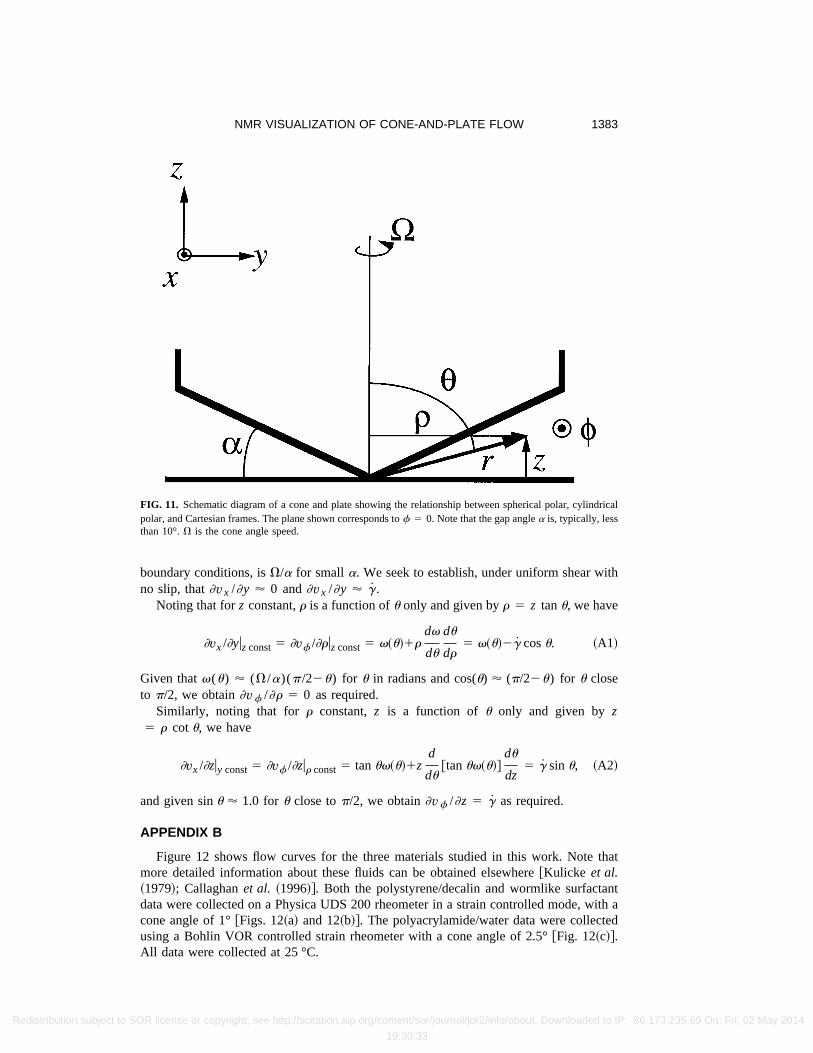
boundary conditions, isV/a for smalla. We seek to establish, under uniform shear withno slip, that]vx /]y ' 0 and]vx /]y ' g.
Noting that forz constant,r is a function ofu only and given byr 5 z tanu, we have
]vx /]yuz const5 ]vf /]ruz const5 v~u!1rdv
du
du
dr5 v~u!2g cosu. ~A1!
Given thatv(u) ' (V/a)(p/22u) for u in radians and cos(u) ' (p/22u) for u closeto p/2, we obtain]vf /]r 5 0 as required.
Similarly, noting that forr constant,z is a function of u only and given byz5 r cotu, we have
]vx /]zuy const5 ]vf /]zur const5 tanuv~u!1zd
du@tanuv~u!#
du
dz5 g sinu, ~A2!
and given sinu ' 1.0 for u close top/2, we obtain]vf /]z 5 g as required.
APPENDIX B
Figure 12 shows flow curves for the three materials studied in this work. Note thatmore detailed information about these fluids can be obtained elsewhere@Kulicke et al.~1979!; Callaghanet al. ~1996!#. Both the polystyrene/decalin and wormlike surfactantdata were collected on a Physica UDS 200 rheometer in a strain controlled mode, with acone angle of 1°@Figs. 12~a! and 12~b!#. The polyacrylamide/water data were collectedusing a Bohlin VOR controlled strain rheometer with a cone angle of 2.5°@Fig. 12~c!#.All data were collected at 25 °C.
FIG. 11. Schematic diagram of a cone and plate showing the relationship between spherical polar, cylindricalpolar, and Cartesian frames. The plane shown corresponds tof 5 0. Note that the gap anglea is, typically, lessthan 10°.V is the cone angle speed.
1383NMR VISUALIZATION OF CONE-AND-PLATE FLOW
Redistribution subject to SOR license or copyright; see http://scitation.aip.org/content/sor/journal/jor2/info/about. Downloaded to IP: 86.173.235.69 On: Fri, 02 May 2014
19:30:33
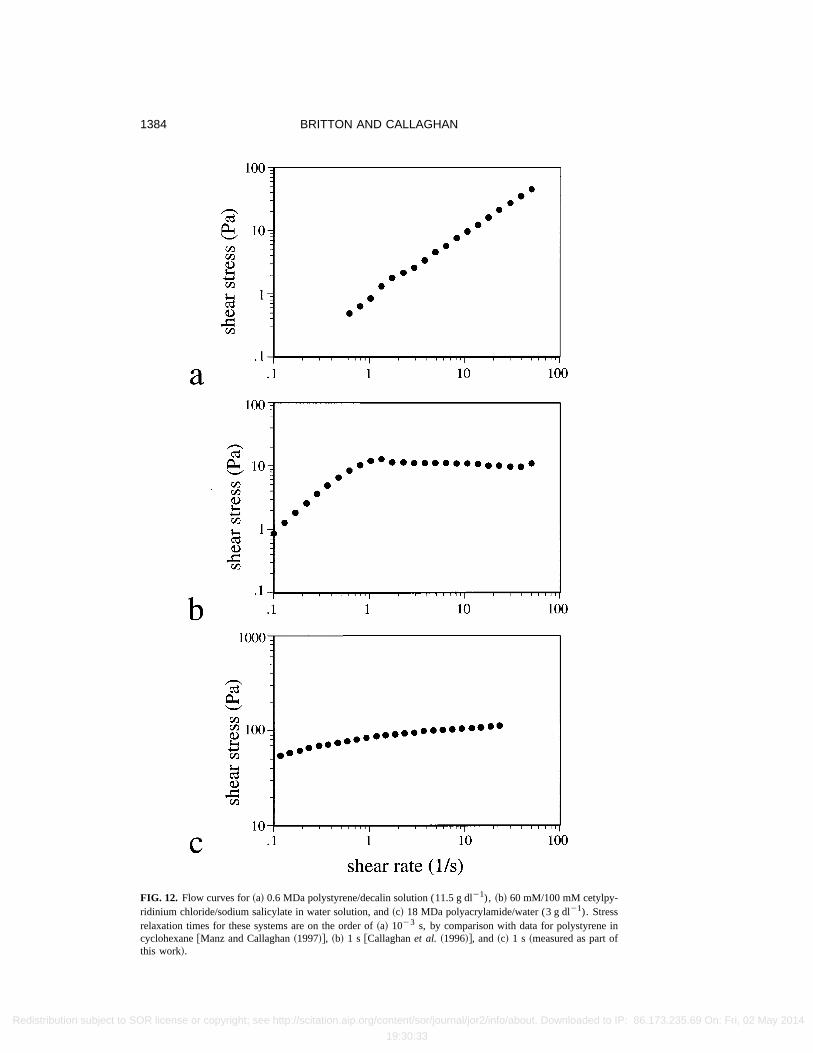
FIG. 12. Flow curves for~a! 0.6 MDa polystyrene/decalin solution (11.5 g dl21), ~b! 60 mM/100 mM cetylpy-ridinium chloride/sodium salicylate in water solution, and~c! 18 MDa polyacrylamide/water (3 g dl21). Stressrelaxation times for these systems are on the order of~a! 1023 s, by comparison with data for polystyrene incyclohexane@Manz and Callaghan~1997!#, ~b! 1 s @Callaghanet al. ~1996!#, and~c! 1 s ~measured as part ofthis work!.
1384 BRITTON AND CALLAGHAN
Redistribution subject to SOR license or copyright; see http://scitation.aip.org/content/sor/journal/jor2/info/about. Downloaded to IP: 86.173.235.69 On: Fri, 02 May 2014
19:30:33
References
Altobelli, S. A., R. C. Givler, and E. Fukushima, ‘‘Velocity and Concentration Measurements of Suspensionsby Nuclear Magnetic Resonance,’’ J. Rheol.35, 721–734~1991!.
Britton, M. M. and P. T. Callaghan, ‘‘Two-Phase Shear Band Structures at Uniform Stress,’’ Phys. Rev. Lett.78, 4930–4933~1997!.
Brunn, P., M. Mueller, and S. Bschorer, ‘‘Slip of complex fluids in viscometry,’’ Rheol. Acta35, 242–251~1996!.
Callaghan, P. T.,Principles of Nuclear Magnetic Resonance Microscopy~Oxford University Press, Oxford,1991!.
Callaghan, P. T., M. E. Cates, C. J. Rofe, and J. B. A. F. Smeulders, ‘‘A study of the ‘spurt effect’ in wormlikemicelles using nuclear magnetic resonance microscopy,’’ J. Phys II6, 375–393~1996!.
Callaghan, P. T., C. D. Eccles, and Y. Xia, ‘‘NMR Microscopy of Dynamic Displacements:k-space andq-space imaging,’’ J. Phys. E21, 820–822~1988!.
Cates, M. E. and S. J. Candau, ‘‘Statics and dynamics of worm-like surfactant solutions,’’ J. Phys.: Condens.Matter 2, 6869–6892~1990!.
Cohen, Y. and A. B. Metzner, ‘‘Apparent slip flow of polymer solutions,’’ J. Rheol.29, 67–102~1985!.Doi, M. and S. F. Edwards,The Theory of Polymer Dynamics~Oxford University Press, Oxford, 1987!.Dudgeon, D. J. and L. E. Wedgewood, ‘‘Laser Doppler measurements of flow in a cone-and-plate rheometer
and the effect of cone misalignment,’’ Rheol. Acta36, 28–37~1997!.Fewell, M. E. and J. D. Hellums, ‘‘The Secondary Flow of Newtonian Fluids in Cone-and-Plate Viscometers,’’
Trans. Soc. Rheol.21, 535–565~1977!.Giesekus, H., ‘‘Die Sekundaerstroemung in einer Kegel-Platte-Anordnung: Abhaengigkeit von der Rotations-
geschwindigkeit bei verschiedenen Polymersystemen,’’ Rheol. Acta6, 339–353~1967!.Giesekus, H., ‘‘Sekendaerstroemungen in Viskoelastischen Fluessigkeiten bei Stationaerer und Periodischer
Bewegung,’’ Rheol. Acta4, 85–101~1965!.Grabowski, D. A. and C. Schmidt, ‘‘Simultaneous Measurement of Shear Viscosity and Director Orientation of
a Side-Chain Liquid–Crystalline Polymer by Rheo-NMR,’’ Macromolecules27, 2632–2634~1994!.Hutton, J. F., ‘‘Fracture of Liquids in Shear,’’ Nature~London! 200, 646–649~1963!.Hutton, J. F., ‘‘The fracture of liquids in shear: the effects of size and shape,’’ Proc. R. Soc. London, Ser. A
287, 222–239~1965!.King, M. J. and N. D. Waters, ‘‘The Effect of Secondary Flows in the use of a Rheogoniometer,’’ Rheol. Acta
9, 164–170~1970!.Kose, K., ‘‘Visualisation of Local Shearing Motion in Turbulent Fluids using Echo-planar imaging,’’ J. Magn.
Reson.96, 596–603~1992!.Kulicke, W. M., H. E. Jeberien, H. Kiss, and R. S. Porter, ‘‘Visual Observation of Flow Irregularities in
Polymer Solutions at Theta-Conditions,’’ Rheol. Acta18, 711–716~1979!.Kulicke, W. M., R. Kniewske, and J. Klein, ‘‘Preparation, Characterisation, Solution Properties and Rheologi-
cal Behaviour of Polyacrylamide,’’ Prog. Polym. Sci.8, 373–468~1982!.Kulicke, W. M. and R. S. Porter, ‘‘Irregularities in Steady Flow for non-Newtonian Fluids Between Cone-and-
Plate,’’ J. Polym. Sci.23, 953–965~1979!.Kulicke, W. M. and U. Wallbaum, ‘‘Determination of First and Second Normal Stress Differences in Polymer
Solutions in Steady Shear Flow and Limitations Caused by Flow Irregularities,’’ Chem. Eng. Sci.40,961–972~1985!.
Larson, R. G., ‘‘Instabilities in viscoelastic flows,’’ Rheol. Acta31, 213–263~1992!.Lukaschek, M., D. A. Grabowski, and C. Schmidt, ‘‘Shear-Induced Alignment of a Hexagonal Lyotropic Liquid
Crystals as Studied by Rheo-NMR,’’ Langmuir11, 3590–3594~1995!.Lukaschek, M., S. Muller, A. Hansenhindl, D. A. Grabowski, and C. Schmidt, ‘‘Lamellar lyomesophases under
shear as studied by deuterium nuclear magnetic resonance,’’ Colloid Polym. Sci.274, 1–7 ~1996!.Magnin, A. and J. M. Piau, ‘‘Cone-and-Plate Rheometry of Yield Stress Fluids. Study of an Aqueous Gel,’’ J.
Non-Newtonian Fluid Mech.36, 85–108~1990!.Magnin, A. and J. M. Piau, ‘‘Shear Rheometry of Fluids with a Yield Stress,’’ J. Non-Newtonian Fluid Mech.
23, 91–106~1987!.Mansfield, P. and P. G. Morris,NMR Imaging in Biomedicine~Academic, New York, 1982!.Manz, B. and P. T. Callaghan, ‘‘NMR investigations of self-diffusion and shear thinning for semi-dilute
polymer solutions near the de-mixing transition,’’ Macromolecules30, 3309–3316~1997!.McKinley, G. H., A. Oztekin, J. A. Byars, and R. A. Brown, ‘‘Self-similar spiral instabilities in elastic flows
between a cone and a plate,’’ J. Fluid Mech.285, 123–164~1995!.Mooney, M., ‘‘Explicit Formulas for Slip Fluidity,’’ J. Rheol.2, 210–222~1931!.Muller-Mohnssen, H., H. P. Lobl, and W. Schauerte, ‘‘Direct determination of apparent slip for a ducted flow
of polyacrylamide solutions,’’ J. Rheol.31, 323–336~1987!.Nakatani, A. I., M. D. Poliks, and E. T. Samulski, ‘‘NMR Investigation of Chain Deformation in Sheared
Polymer Fluids,’’ Macromolecules23, 2686–2692~1990!.
1385NMR VISUALIZATION OF CONE-AND-PLATE FLOW
Redistribution subject to SOR license or copyright; see http://scitation.aip.org/content/sor/journal/jor2/info/about. Downloaded to IP: 86.173.235.69 On: Fri, 02 May 2014
19:30:33
Olagunju, D. O., ‘‘Asymptotic analysis of the finite cone-and-plate flow of a non-Newtonian fluid,’’ J. Non-Newtonian Fluid Mech.50, 289–303~1993!.
Oldroyd, J. G., ‘‘Non-Newtonian flow of liquids and solids,’’ inRheology, Theory and Applications, edited byF. R. Eirich ~Academic, New York, 1956!, Vol. 1, pp. 653–682.
Pignon, F., A. Magnin, and J. M. Piau, ‘‘Thixotropic colloidal suspensions and flow curves with minimum:Identification of flow regimes and rheometric consequences,’’ J. Rheol.40, 573–587~1996!.
Rofe, C. J., R. K. Lambert, and P. T. Callaghan, ‘‘Nuclear Magnetic Resonance Imaging of Flow for aShear-Thinning Polymer in Cylindrical Couette Geometry,’’ J. Rheol.38, 875–887~1994!.
Shaqfeh, E. S. G., ‘‘Purely elastic instabilities in viscoelastic flows,’’ Annu. Rev. Fluid Mech.28, 129–185~1996!.
Stejskal, E. O. and J. E. Tanner, ‘‘Spin Diffusion Measurements: Spin Echoes in the Presence of a TimeDependent Field Gradient,’’ J. Chem. Phys.42, 288–292~1965!.
Walters, K. and N. D. Waters, ‘‘On the use of rheogoniometer. Part I-steady shear,’’ inPolymer Systems:Deformation and Flow, edited by R. E. Wetton and R. W. Whorlow~Macmillan, London, 1968!, pp.211–235.
Xia, Y. and P. T. Callaghan, ‘‘Study of Shear Thinning in High Polymer Solution using Dynamic NMRMicroscopy,’’ Macromolecules24, 4777–4786~1991!.
1386 BRITTON AND CALLAGHAN
Redistribution subject to SOR license or copyright; see http://scitation.aip.org/content/sor/journal/jor2/info/about. Downloaded to IP: 86.173.235.69 On: Fri, 02 May 2014
19:30:33