Embed Size (px)
Citation preview

NUCLEAR MAGNETIC RESONANCE BASED CHARACTERIZATION OF THE
PROTEIN BINDING POCKET USING HYPERPOLARIZED LIGAND
A Thesis
by
HLAING ZAYAR MIN
Submitted to the Office of Graduate and Professional Studies of Texas A&M University
in partial fulfillment of the requirements for the degree of
MASTER OF SCIENCE
Chair of Committee, Christian Hilty
Committee Members, Emile Schweikert Li Liu Head of Department, David H. Russell
August 2014
Major Subject: Chemistry
Copyright 2014 Hlaing Zayar Min

ii
ABSTRACT
In the drug design process, the structural determination of the protein-ligand
binding interface and understanding how the drug binds to the target protein at the
protein binding pocket is essential. In the past few years, Dynamic Nuclear Polarization
(DNP) combined with Nuclear Magnetic Resonance (NMR) has emerged as a new tool
for studying interactions between different molecules. In this study, the DNP-NMR
technique was employed for characterization of the protein binding pocket through
binding of the hyperpolarized ligand to the protein. Trypsin and benzamidine were
chosen as models for the protein and the ligand because the binding of benzamidine to
trypsin is well-known.
Several enhanced NMR signals of trypsin appeared from the binding of
hyperpolarized benzamidine to trypsin. A significant finding was that those trypsin
signals were non-uniformly enhanced when compared with the trypsin signals in the
conventional (non-hyperpolarized) NMR spectrum, suggesting that a specific region of
the protein, most likely the protein-binding pocket proximal to the bound hyperpolarized
ligand, is selectively polarized. The polarization transfer process was described
mathematically by fitting model equations to the enhanced signal intensities of both the
protein and the ligand. A fit parameter was evaluated, which assuming the presence of a
single spin on protein and ligand can be interpreted as a cross-relaxation rate (σDNP), that
can provide spatial information between the two spins.

iii
Saturation Transfer Difference (STD)-NMR was employed as an independent
method to measure the protein-ligand interaction. The fit parameters in the STD-NMR
equations, the dissociation constant (KD) and a cross-relaxation rate (σSTD), were
evaluated. KD determined from STD-NMR was consistent with the KD values reported in
the literatures, suggesting that STD-NMR data is reliable. σSTD evaluated from STD-
NMR was compared with σDNP evaluated from the DNP-NMR and found to be similar in
magnitude.

iv
ACKNOWLEDGEMENTS
I would like to thank my advisor, Dr. Hilty, and my committee members, Dr.
Schweikert and Dr. Liu, for their guidance and support throughout the course of this
academic journey.
I also want to extend my gratitude to the contributors of this project: Haifeng
Zeng (past group member), Giridhar Sekar and Youngbok Lee (past group member).
Thanks also go to my group members, friends and colleagues and the department
faculty and staff for making my time at Texas A&M University a fabulous experience.

v
NOMENCLATURE
NMR Nuclear Magnetic Resonance
DNP Dynamic Nuclear Polarization
STD Saturation Transfer Difference
3D Three Dimensional
kDa Kilo Daltons
NOE Nuclear Overhauser Effect
CIDNP Chemically Induced Dynamic Nuclear Polarization
OP Optical Pumping
PHIP Parahydrogen Induced Polarization
DMSO Dimethyl Sulfoxide
TEMPOL 4-hydroxy-2,2,6,6-tetramethylpiperidine-1-oxyl
UV Ultraviolet
ICT Isothermal Calorimetric Titration
KD Dissociation Constant

vi
TABLE OF CONTENTS
Page
ABSTRACT ....................................................................................................................... ii
ACKNOWLEDGEMENTS ............................................................................................. iv
NOMENCLATURE .......................................................................................................... v
TABLE OF CONTENTS .................................................................................................. vi
LIST OF FIGURES ........................................................................................................ viii
LIST OF TABLES ........................................................................................................... ix
1. INTRODUCTION ......................................................................................................... 1
1.1 Sensitivity of NMR .................................................................................... 2 1.2 Theoretical background on DNP ................................................................ 3 1.3 DNP-NMR methods for study of chemical and biological systems ......... 6 1.4 Nuclear Overhauser Effect (NOE) ............................................................ 7 1.5 Saturation Transfer Difference NMR (STD-NMR) ................................ 11
2. EXPERIMENTAL METHODS .................................................................................. 15
2.1 DNP-NMR experimental setup and method ............................................ 15 2.2 DNP-NMR pulse program ....................................................................... 19 2.3 DNP-NMR spectra and data processing ................................................... 20 2.4 STD-NMR pulse program ........................................................................ 21
3. RESULTS AND DISCUSSION ................................................................................. 22
3.1 Selectively enhanced NMR resonances in DNP-NMR ............................ 22 3.2 Comparison of the DNP-NMR and STD-NMR spectrum ...................... 24 3.3 Analysis of different peaks in STD-NMR ............................................... 27 3.4 Signal buildup in the time-resolved DNP-NMR spectra .......................... 29 3.5 Evaluation of the cross-relaxation rate (σDNP) in DNP-NMR .................. 34 3.6 Analysis of STD-NMR data ..................................................................... 36 3.7 Determination of spin-lattice relaxation time (T1) .................................. 40 3.8 Evaluation of STD-NMR data .................................................................. 43

vii
3.9 Determination of KD with Isometric Calorimetric Titration (ICT) ......... 48 3.10 Comparison between DNP-NMR and STD-NMR ................................. 50
4. SUMMARY AND CONCLUSION ............................................................................ 51
REFERENCES ................................................................................................................ 54

viii
LIST OF FIGURES
FIGURE Page
1 Scheme illustrating solid effect DNP ............................................................... 5
2 Energy level diagram showing spin populations in a two spin system ............ 7
3 Relaxation pathways in an irradiated two spins system .................................... 8
4 Illustration of the STD-NMR experiment ....................................................... 12 5 DNP-NMR pulse sequence ............................................................................. 19 6 Mathematically defined baseline for the peak ................................................ 20 7 1D stacked proton NMR spectra from the DNP-NMR experiment ............... 23 8 Comparison of trypsin spectrum from different experiments ........................ 25 9 STD signal at different saturation frequencies ............................................... 28 10 Polarization signal of trypsin and benzamidine in DNP experiment ............. 30 11 Proton signal build-up for different enhanced peaks ..................................... 35 12 Determination of T1(s) for pure benzamidine in H2O solvent ....................... 40 13 Determination of T1(s) for pure benzamidine in D2O solvent ....................... 41 14 Determination of T1(s) for trypsin in H2O solvent ......................................... 42 15 Determination of T1(s) for trypsin in D2O solvent ......................................... 43 16 The binding isotherm of STD-AF initial growth rates method ...................... 46 17 Determination of KD with ITC experiment .................................................... 49

ix
LIST OF TABLES
TABLE Page 1 Quantitative DNP-NMR experiment with DMSO suppression showing
different experimental conditions with D2O solvent injection ....................... …17 2 Quantitative DNP-NMR experiment with DMSO suppression showing
different experimental conditions with H2O solvent injection ...................... …18 3 Quantitative DNP-NMR experiment showing fit parameters with D2O solvent injection ............................................................................................. …33 4 Quantitative DNP-NMR experiment showing fit parameters with H2O solvent injection ............................................................................................ …33 5 The fit parameters evaluated from STD-NMR .................................................. 47

1
1. INTRODUCTION
Protein interactions with small molecules play a pivotal role in a wide variety of
cellular processes. Enzyme-substrate, receptor-neurotransmitter and antibody-antigen
interactions are a few examples of cellular processes involving interaction between
proteins and small molecules. Drugs are designed and developed based on the
knowledge of the substrate structure and the enzyme-substrate interaction. They are
responsible for inhibiting the target enzyme or protein functions. An early and important
step in drug design is identifying the binding interaction between protein and ligand by
means of a fast screening of a wide variety of compound libraries. Such a task needs to
be carried out efficiently. However, the affinities of promising lead compounds are
typically low, requiring further chemical modification of the ligands. Targeted chemical
modification requires the knowledge of detailed structural information of the protein
binding pocket and the bound ligand.1,2 The ligand binding component (ligand epitope)
can be mapped through studies of the ligand resonances known as ligand-observed
NMR.1–6 Analysis of the protein resonances is required to obtain structural information
of the protein and the protein binding pocket.1,2 A number of solution NMR
spectroscopic methods have been developed for investigation of the interactions between
proteins and small molecules. Saturation Transfer Difference (STD) NMR has been
widely used for studying binding between the proteins and the small molecules7 and
determining their binding association constant. Triple resonance protein-observed NMR
spectroscopy has been a powerful method for structural determination of large proteins

2
(>17 kDa). Triple resonance experiments include correlations among three types spins
(1H, 13C and 15N), thereby requiring the use of the isotope labels 13C and 15N.4,5
In this study, DNP-NMR spectroscopy is applied for the investigation of the
interaction of the protein with its hyperpolarized inhibitor ligand and characterization of
the protein binding pocket by analysis of selectively enhanced protein NMR resonances.
Trypsin and benzamidine are chosen as models for the protein and the ligand, since the
binding of benzamidine to trypsin at the specific protein binding pocket is well-known.8–
15 The DNP-NMR technique is based on 1D time-resolved 1H NMR studies of protein
signal. DNP enables the analysis of enhanced trypsin signal due to the polarization
transfer from hyperpolarized benzamidine. The polarization transfer rate determined
from the DNP-NMR technique is compared to the cross-relaxation rate obtained from
the conventional STD-NMR method. Analysis of selectively enhanced protein NMR
resonances would in future studies be expected to eventually lead to identification of the
amino acids residing in the protein binding pocket directly interacting with the
hyperpolarized ligand.
1.1 Sensitivity of NMR
NMR spectroscopy has low sensitivity (signal to noise ratio) due to the small
energy gaps between the nuclear spin states. Due to its low sensitivity, NMR techniques
typically require the use of high concentration samples and long measurement time. A
number of techniques have been developed to improve the sensitivity in NMR in the past
several decades. One major improvement was the development of Fourier Transform
NMR which enhanced the sensitivity by approximately 100 fold compared to continuous

3
wave NMR.16 To put these into perspective, an increase in the magnetic field from
400MHz (9.4T) NMR to 900MHz (21.1T) NMR provides approximately 3-4 times
improvement in sensitivity according to the proportional relationship between the signal
to noise ratio (SNR) and a power of the magnetic field (Bo3/2).17 In the past, a number of
hyperpolarization techniques, namely, chemically induced dynamic nuclear polarization
(CIDNP)18, optical pumping (OP)19 and parahydrogen induced polarization (PHIP)20,21
came into existence. In CIDNP, polarization is produced as a result of a thermal or
photochemical reaction.18 In OP, circularly polarized light is used to polarize the
electron spin in alkali metal atoms, and polarization is then transferred from the electron
spin of alkali metal atoms to the nuclear spin of noble gas.19 In PHIP, parahydrogen is
the source of polarization and transfers its polarization to unsaturated compounds with
addition reaction or to small organic molecules which, along with parahydrogen,
coordinate with the metal center.20,21 However, the applicability of these
hyperpolarization techniques is limited to certain molecules. Unlike these techniques,
dynamic nuclear polarization (DNP) can be used to polarize almost any molecule. DNP
enables signal enhancement from a few hundreds to ten thousands fold.22
1.2 Theoretical background on DNP
At typical magnetic fields, nuclear spins are approximately equally populating
upper and lower energy levels, with a slight excess of population at the lower energy
level at thermal equilibrium and, thus, there is little or no polarization (relative
population difference between the lower and upper energy level) of the nuclear spins
which leads to the low NMR signal intensity. A method of increasing the NMR signal

4
intensity by artificially creating a large population difference between two energy levels
is called hyperpolarization of the nuclear spins. Hence, DNP technique artificially
generates the polarization of the nuclear spins.
The general working principle of DNP is based on the transfer of polarization
from electron spins to nuclear spins by microwave irradiation.23 For a liquid state
sample, the polarization transfer from the polarized electron to the nuclear spin occurs
via the Overhauser effect.23–25 The solid effect is a two-spin process of transferring the
polarization from an electron spin to a nuclear spin for a sample with paramagnetic
centers (such as free radicals).24 The solid effect occurs in solid state samples. In our
experiments, the sample containing the ligand, free radicals and glass-forming agents
was frozen to a solid inside a DNP polarizer where the process of the polarization
transfer from an electron spin to a nuclear spin occurs. Other mechanisms such as cross
effect26 or thermal mixing26 are known to cause polarization transfer to a nuclear spin
under certain conditions such as a high concentration of free radicals.26
5
Figure 1. Scheme illustrating solid effect DNP. A nuclear spin (I=1/2) and an electron
spin (S=1/2) dipole-coupled at thermal equilibrium to be perturbed using microwave
irradiation at the transition frequency (ωe-ωn).24 α represents the spin state at the lower
energy level and β the spin state at the upper energy level. Subscripts e and n symbolize
electron and nuclear spins, respectively. ωn and ωe represent the transition frequency for
a nuclear spin and an electron spin, respectively. The size of the black circle represents
the population. Note that figure is not drawn to scale.
Figure 1 shows an energy level diagram at the thermal equilibrium for a nuclear
and electron spin coupled via the dipolar interaction. The transitions with higher energy
are due to the electron spin, and those with lower energy due to the nuclear spin. The
size of gray spheres, which is not drawn to scale, represents the populations. Excitation
of the αnβe spin state to the βnαe spin state with the microwave together with the
relaxation of the αnβe spin state to the αnαe spin state results in the larger population
difference between the nuclear spin states (βnαe and αnαe).

6
In the dissolution DNP method, the sample containing paramagnetic centers and
glass-forming solvent is prepared at room temperature. The glass-forming solvent (e.g
water/ethanol, water/glycerol or water/DMSO) is used to ensure the function of a
homogeneous solid so that diffusion of polarization can take place effectively.25 The
polarization is introduced to the sample after it is frozen to a solid state at approximately
1.4 K. Owing to their high gyromagnetic ratio (γe/γH~660), electron spins are almost
completely polarized at 1.4 K and at a magnetic field of 3.34 T. The transition (ωe-ωn) is
then irradiated with microwaves to hyperpolarize the nuclear spins (αnαe and βnαe)
(Figure 1).
1.3 DNP-NMR methods for study of chemical and biological systems
Recently, dynamic nuclear polarization (DNP)-NMR techniques have emerged as
a tool for time-resolved studies of interactions between different molecules.27–29
Polarization of molecules with DNP results in significant enhancement of the signals,
thereby enabling real-time analysis of the signal of polarized molecules and of the
molecules interacting with polarized molecules. A number of studies showed that time-
resolved NMR spectra can be obtained with rapid injection of polarized molecules from
DNP for studying transient processes and elucidating reaction mechanism involving
short-lived reaction intermediates.30 Although the dissolution DNP-NMR method has
primarily been employed for polarization of small molecules, a recent study showed that
time-resolved high-resolution NMR spectra of polypeptides can be acquired with the
polarization of polypeptides using DNP.31 In the work described here, a ligand (small
molecule) was hyperpolarized in DNP, and rapidly injected into the NMR tube
7
preloaded with the protein sample inside the NMR spectrometer. The time-dependent
process of signal transfer to protein was monitored by the NMR instrument. The time-
resolved signal buildup and decay of the ligand and the protein was fitted into the model
equations describing the polarization signal transfer process.
1.4 Nuclear Overhauser Effect (NOE)
NOE is the change in the intensity of a spin (I) when the population of another
spin (S) coupled to spins (I) is perturbed.
Figure 2. Energy level diagram showing spin populations in a two spin system. The
diagram on the left shows the spin states of the dipolar-coupled spin system (S and I)
and their population at Boltzmann equilibrium. The diagram on the right shows the state
of the same spin system as a result of the saturation on spin S before NOE occurs.
NOE can be mathematically described as o
o
I I
I
where I is the signal intensity of
spin I upon perturbation of spin S and Io is the signal intensity of spin I in the absence of
8
perturbation. The NOE value can be obtained by analysis of the change in intensity of
spin (I) that couples with the spin (S) via the dipolar interaction. Dipolar interaction is
the disturbance of the magnetic field of one nuclear spin by the magnetic field of the
other spin.
The diagram on the left of figure 2 shows the equilibrium population of a spin
system involving spin S and spin I, which are in close spatial proximity and coupled via
the dipolar interaction. The diagram on the right illustrates the changes in the population
of different spin states upon saturation of the spin. These two transitions denoted by I or
S represent the spin (I) transition and the spin (S) transition. N represents the size of the
population of a particular spin state. There are four different possible spin states denoted
by αα, αβ, βα and ββ. Different spin states occupy different energy levels. +∆ symbol
represents the population surplus and -∆ represents the population deficit. When spin (S)
is saturated with a selective irradiation, the populations across the (S) transitions become
equalized. The signal intensity of spin (S) decreases or vanishes after saturation.
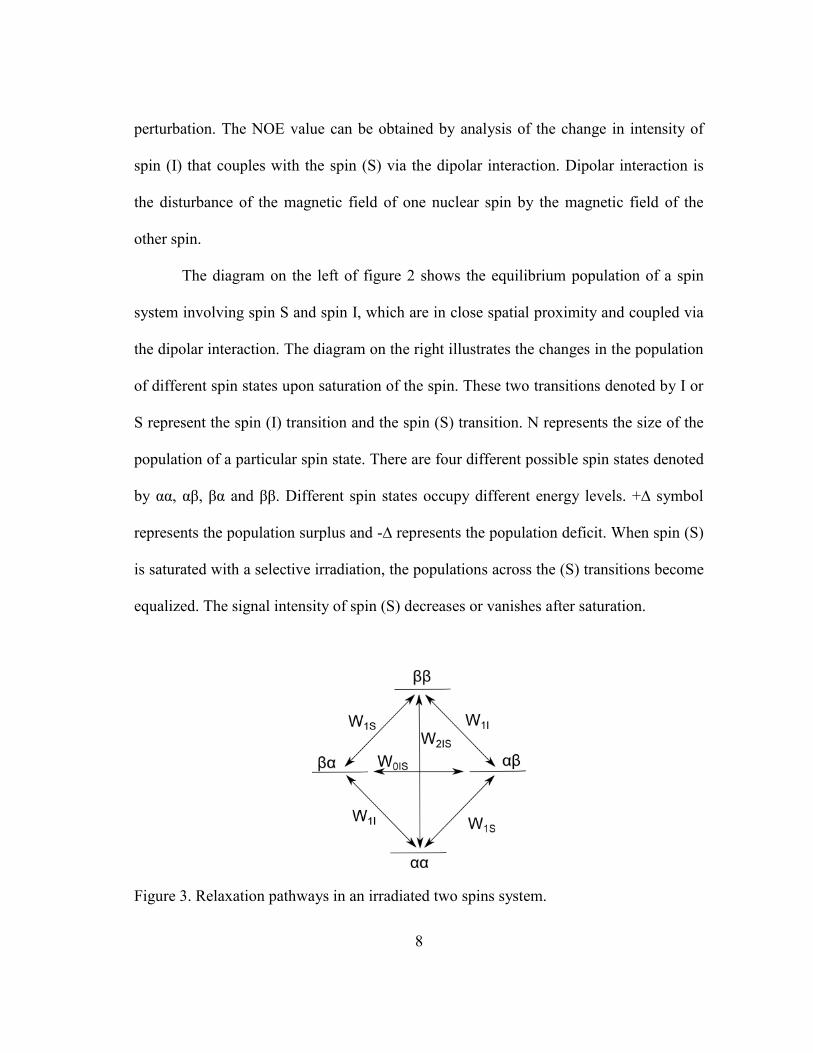
Figure 3. Relaxation pathways in an irradiated two spins system.

9
There are six relaxation pathways for the coupled sp
in system. W denoted with subscript 1 represent T1 relaxation pathways, whereas
W donated with subscript IS represents the cross-relaxation pathways. Double quantum
transition W2IS and zero quantum transition W0IS are cross-relaxation pathways mainly
responsible for NOE. The difference between the two is defined as the cross-relaxation
rate (σ). Whether the NOE value is positive or negative depends on whether W2IS or
W0IS is dominant. When the double quantum (W2IS) relaxation pathway is dominant (the
NOE value is positive), there will be a larger population difference for spin (I) than there
is at equilibrium. As a result, a larger intensity of spin (I) can be observed. Conversely,
when zero quantum (W0IS) relaxation is dominant, the population difference becomes
smaller and the signal intensity of spin (I) decreases accordingly. For a large molecule
such as a protein, W0IS (zero quantum transition) is more probable and, thus, negative
NOE can be expected.
The steady-state NOE equation ( o
o
I I
I
) described above is derived from the
Solomon Equations. Solomon equations describe the evolution of spins towards the
equilibrium after the spins are perturbed.32
00 0
z
IS z IS z
d I IR I I S S
dt
(I.1)
where 2 4
0 1 2 62 { (0) 3 ( ) 6 (2 )}4
HIS IS I IS IS IS H IS H
IS
R W W W J J Jr
and
2 4
2 0 6 {6 (2 ) (0)}4
HIS IS IS IS H IS
IS
W W J Jr

10
Iz and Sz represent the magnitude of the z component of magnetization (z-
magnetization) of the coupled spins I and S respectively.33 Subscript (0) on the spin
labels denotes the Boltzmann equilibrium state. Note that perturbation is applied on the
spin S. Under the static magnetic field, the magnetic dipole moment of individual spins
is aligned along the z-direction at the Boltzmann equilibrium. The total magnetic dipole
moment created by an ensemble of the spins is defined as the z-magnetization.
The magnitude of z-magnetization of spins at the steady state is dictated by the
longitudinal relaxation rate (RIS) and the cross-relaxation rate (σIS). RIS and σIS are
dependent upon the spectral density J(ω) which describes how much power the local
fluctuating magnetic field caused by random tumbling molecules can supply to induce a
transition of a particular frequency ω. In other words, it is a measure of the probability of
the transition at a particular frequency ω. The spectral density J at a particular frequency
ω is expressed by34–36:
2 2
2( )(1 )
c
c
J
(I.2)
where 34
3c
r
kT
Spectral density J is dependent on the correlation time τc, which is a function of viscosity
(η), the molecular mass (r) and the temperature (T).
Solving the steady state Solomon equation (i.e. 0 0zd I I
dt
) upon a complete
saturation of the perturbed spin (S) (i.e. 0zS ) yields 37,38

11
0 0
0 0
z IS
IS
I I S
I R I
(I.3)
Since the proton spin population difference under the Boltzmann equilibrium
condition is proportional to the gyromagnetic ratio of the proton, the ratio of the
magnetization of spin S to that of spin I can be given by37,38:
,0
0 ,
1H S
H I
S
I
(I.4)
Therefore, it follows that the fraction of the change in the signal intensity of spin I
interacting with perturbed spin S can be expressed as37,38:
0
0
z IS
IS
I I
I R
(I.5)
This equation shows that the observed NOE signal intensity of spin I is the result
of cross-relaxation.39
It can be noted in the equation (I.5) that the cross-relaxation rate (σ) shows
dependence on the inverse sixth power of the distance between the two coupled spins.
Hence, the proximity of the two coupled spins can be quantified from the measurement
of σ value.
Saturation Transfer Difference NMR (STD-NMR) which is described in detail in
the next section is based on the NOE effect between the saturated spin of the protein and
the spin of the ligand.
1.5 Saturation Transfer Difference NMR (STD-NMR)
STD-NMR spectroscopy has been widely used as a ligand-based NMR technique
for (i) detection of the binding interaction between the protein and the ligand, (ii)

12
determination of a dissociation constant (KD) 40 and (iii) mapping of the ligand epitope
(determination of orientation and structural components of ligand at the site of
binding).41–46 STD exploits the steady-state Nuclear Overhauser Effect (NOE) which is
the transfer of magnetization (Mz) (to be specific “saturation” signal in STD-NMR) from
the perturbed spin (protein proton spin) to another spin (ligand proton spin) in close
proximity through the dipolar interaction at the steady state.
Figure 4. Illustration of the STD-NMR experiment. The top figure shows the
perturbation (saturation) of the protein spin. The bottom figure shows the change in the
signal intensity of the ligand as a result of its interaction with the saturated protein.
In the STD-NMR method, the signal intensities of the spins are observed when
the populations of the spins are at the steady-state. Experimentally, the protein proton
spin is selectively perturbed (saturated) with irradiation of the so-called the on-resonance
13
frequency. The signal intensity of the ligand (I) observed at the on-resonance condition
is compared with the signal intensity of the ligand (Io) observed under the off-resonance
condition from a reference spectrum. The difference between on-resonance and off-
resonance spectrum (Io-I) provides qualitative information about the extent of the
binding between the protein and the ligand. The binding strength can be quantitatively
evaluated from the STD-NMR experiment. In the STD-NMR protein-ligand titration
experiment, fitting the mathematical model equation of STD-AF with the STD-NMR
experimental data generates the dissociation constant (KD), which is a measure of the
binding affinities between ligand and protein.
In addition, information on the proximity of different proton spins of the ligand
to the protein can also be deduced from the variation of the STD signals with the
elimination of the effect due to variation in relaxation rates of different proton spins.
Stronger STD signals are interpreted as a shorter distance between ligand and receptor
protons. This interpretation arises from the distance dependence of the NOE signal
transfer process. Hence, mapping the ligand epitope at the binding site (identifying
which parts of the ligand are involved in the binding interface) can be accomplished with
the STD-NMR method.4,47–49
STD amplification factor (STD-AF) can be mathematically defined as 48,50:
0
0
[Ligand][Protein]
satI ISTD AF
I
(I.6)
The STD method has its limitations in terms of application. The STD method is not
suitable for strongly binding ligands with KD approximately <1 nM since the STD ligand

14
signal intensity is reduced when strongly binding ligands are used. A long residence time
of the strong binder ligands at the protein binding site results in the fast relaxation of the
ligand bound to the protein and, thus, loss of the signal. 3,51 On the other hand, the
population of ligand-receptor complex decreases for weakly binding ligands having KD >
LT, (LT-total ligand concentration), resulting in the attenuation and disappearance of the
STD effect. The KD range within which the STD-NMR method can be applied is
approximately 10-3 > KD > 10-8 M. 3,51
There are several advantages to using the STD-NMR method. First, it only requires a
low concentration of protein (~1 µM).52,53 The population of the saturated ligand builds
up during the period of the sustained irradiation. Since the ligand exchange typically
takes place rapidly, a small amount of protein can generate an amplified amount of
saturated ligand.49 Second, STD-NMR is an ideal method to use with large protein
masses, (>30000 Da). Owing to its large rotational correlation time τc, large protein
enables an efficient signal propagation within itself via spin-diffusion and, thus,
enhances signal transfer to the ligand. Another advantage is that signal contribution from
the free-state does not need to be corrected for the observed signal intensity, since the
observed signal is a result of bound ligands or ligands that have already bound to the
receptor. That, thus, simplifies the data interpretation and reduction.3

15
2. EXPERIMENTAL METHODS
2.1 DNP-NMR experimental setup and method
18 µL of 510 mM benzamidine and 2 µL of 150 mM TEMPOL free-radical in
80%v (99.9% [D6] DMSO) and 20%v D2O underwent hyperpolarization in a
HyperSense system (Oxford instruments, Abingdon, U.K.) by irradiating a 100 mW
power at 94.005 GHz frequency for 30 min, at a temperature 1.4 K. Hyperpolarized
samples were dissolved by a stream of heated 50 mM potassium phosphate buffer
solvent at pH 7.0 and automatically loaded into an injection loop. The initial 450 µL of
sample solution in the loop representing an estimated 40% of benzamidine (estimated by
HPLC) was injected into a 5 mm NMR tube containing 25 µL of 2.4 mM trypsin
dissolved in 50 mM potassium phosphate preinstalled in a 400MHz NMR spectrometer
(Bruker Biospin, Billerica, MA).54 The reaction time assigned for the first NMR
spectrum from the start of the interaction between trypsin and benzamidine was
estimated to be the sum of half of the injection time (0.215 s), the stabilization time (0.1
s) and the time for all the initial pulse sequence events (0.255 s) prior to the beginning of
the FID acquisition. The estimated final concentration after dissolution in the NMR tube
was 118 µM for trypsin (concentration estimated using UV) and 7.7 mM for
benzamidine (concentration estimated using HPLC).
Upon injection of the hyperpolarized benzamidine into the trypsin sample,
multiple spectra of the sample containing a mixture of tryspin and benzamidine were
taken with a series of fixed small flip angle (15o) excitations. The correction factor e-λt
(where λ was calculated to be -0.18 using the small flip angle)54 was applied to

16
compensate for the decrease in the size of the z-magnetization for the same small flip
angle with each subsequent scan. After a small 15o flip angle pulse, 1638 data points
were collected over 0.128 s. The time interval between each scan was 0.2 s.54
The final concentrations of trypsin in the NMR tube at the end of the DNP
experiment were determined based on the total volume (475 µL) of sample in the NMR
tube obtained after injection of hyperpolarized benzamidine solutions on the initial 25
µM of trypsin stock solution preloaded in the NMR tube. The concentration of the
trypsin stock solution was measured with UV spectrophotometry, using the extinction
coefficient 37650 M-1cm-1.55
The concentration of benzamidine in the NMR sample with trypsin in the DNP-
NMR experiment was determined based on the concentration of pure benzamidine
solution in the NMR tube in the control DNP-NMR experiment, since the same
experimental conditions including injection parameters were set in both experiments.
The concentration of benzamidine was determined with HPLC.
In optimizing the dissolution DNP-injection system, the following
conditions/issues have to be considered. A fast injection system to transport the
polarized sample to the NMR tube is essential to minimize the loss of polarization
signal. A long enough waiting time to allow for stabilization of the sample after injection
is also required to obtain NMR resonances with a narrow line-width. Injection by
application of high pressure can cause bubble formation in the NMR tube which can
give rise to issues such as line-width broadening and spectra distortion. On the other
hand, injection with low pressure can lead to poor mixing between polarized sample and

17
preloaded sample. Therefore, the balance of all of these conditions has to be achieved for
acquiring quality spectra.
Table 1. Quantitative DNP-NMR experiment with DMSO suppression showing different
experimental conditions with D2O solvent injection
DN
P Ex
perim
ent #
stab
iliza
tion
time
(ms)
half
inje
ctio
n tim
e (m
s)
puls
e se
quen
ce b
efor
e ac
quis
ition
(ms)
time
for 1
st d
ata
poin
t (m
s)
Tim
e be
twee
n ea
ch sc
an (m
s)
tota
l vol
ume
in N
MR
tube
(µL)
initi
al c
onc
of tr
ypsi
n /P
rote
in S
tock
(mM
)
[P],c
onc
of tr
ypsi
n in
NM
R tu
be (µ
M)
initi
al c
onc
of b
enza
mid
ine
(mM
)
[L],
conc
of b
enza
mid
ne in
NM
R tu
be (µ
M)
pb (f
ract
ion
of b
ound
liga
nd),K
D=8
0 µM
3121 0.1 0.255 0.127 0.482 0.2 475 2.24 118.0028 500 6100 0.019 3101 0.1 0.255 0.127 0.482 0.2 475 2.24 118.0028 500 6100 0.019 3131 0 0.255 0.127 0.382 0.2 475 2.24 118.0028 500 6100 0.019 3241 0 0.255 0.127 0.382 0.2 475 2.55 134.447 500 6900 0.019 3261 0 0.255 0.127 0.382 0.2 475 2.55 134.447 500 6900 0.019 2651 0.1 0.205 0.127 0.432 0.2 475 2.5 131.5789 500 10557 0.0124
* Time for the 1st data point=stabilization time + ½ injection time + pulse seq. time
prior to acquisition

18
*pb (fraction of bound ligand) is needed to evaluate the fit parameters in DNP model
shown in section 3.4. pb was calculated using the formula56
2t t t[ ] [ ] ([ ] [ ] ) (4[ ] [ ] )
2[ ]t D t D t
b
t
P L K P L K P Lp
L
Table 2. Quantitative DNP-NMR experiment with DMSO suppression showing different
experimental conditions with H2O solvent injection
DN
P Ex
perim
ent #
stab
iliza
tion
time
(ms)
half
inje
ctio
n tim
e (m
s)
puls
e se
quen
ce b
efor
e ac
quis
ition
(ms)
time
for 1
st d
ata
poin
t (m
s)
Tim
e be
twee
n ea
ch sc
an (m
s)
tota
l vol
ume
in N
MR
tube
(µL)
initi
al c
onc
of tr
ypsi
n /P
rote
in S
tock
(mM
)
[P],c
onc
of tr
ypsi
n in
NM
R tu
be (µ
M)
initi
al c
onc
of b
enza
mid
ine
(mM
)
[L],
conc
of b
enza
mid
ne in
NM
R tu
be (µ
M)
pb (f
ract
ion
of b
ound
liga
nd),K
D=8
0 µM
3331 0 0.255 0.127 0.482 0.2 475 2.55 134.447 500 7800 0.017 3341 0 0.255 0.127 0.482 0.2 475 2.55 134.447 500 7800 0.017 3361 0 0.255 0.127 0.382 0.2 475 2.55 134.447 500 7800 0.017 3321 0 0.255 0.127 0.382 0.2 475 2.55 134.447 500 7800 0.017
19
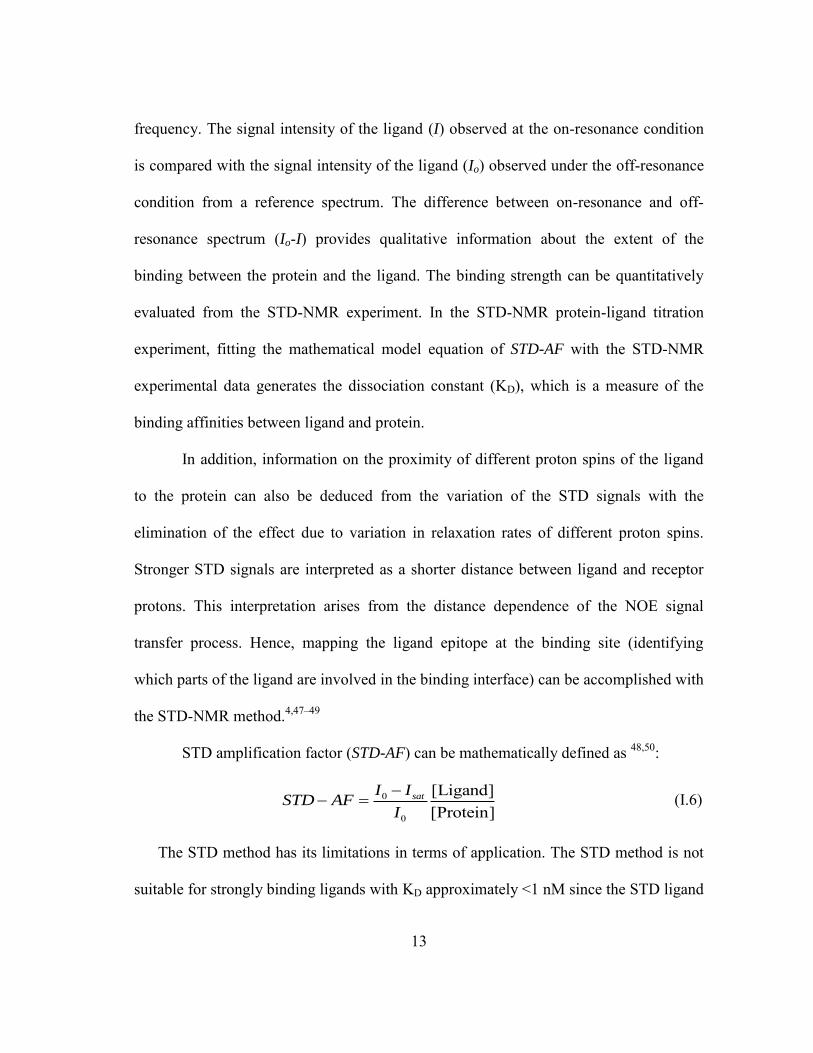
2.2 DNP-NMR pulse program
The DNP-NMR experiments were measured using small flip angle (α) pulses.
Different time steps involved in the experiment were shown in figure 5. The transfer of
polarized sample from the polarizer was carried out using the home-built sample injector
for a transfer time (tt) shown in figure 5. Sample mixing occurred at the half of the
injection time (ti). A waiting (stabilization) time (ts).
Figure 5. DNP-NMR pulse sequence29
Solvent suppression was achieved by selective excitation of water and dimethyl
sulfoxide (DMSO) proton residue in D6-DMSO dissolution solvent. The water solvent
and DMSO solvent were selectively suppressed, since the resonance frequency
difference between water and the nearest resonance of interest was approximately 1100
Hz. The first spectrum was acquired using six EBURP2 shaped π/2 pulses to suppress
water resonance at 4.7 ppm and DMSO at 2.7 ppm dephased by randomized pulsed field
gradients Gx, Gy or Gz.30 Later scans were preceded by three EBURP2 shaped π/2 pulses,

20
each of which was dephased by randomized pulse field gradients Gx, Gy or Gz.
2.3 DNP-NMR spectra and data processing
An exponential window function with a line broadening of 10 Hz was applied
before Fourier transformation using the TOPSPIN 3.1 program (Bruker Biospin,
Billerica, MA) for NMR spectra from DNP experiments.54
Figure 6. Mathematically defined baseline for the peak. The mathematical function (red
color) was used to define the baseline subtracted from the original spectrum. The image
shows the display as seen in the Matlab software interface during data processing.
The DNP spectra from initial experiments (not shown here) showed that the
neighboring water and the proton DMSO solvent peaks overlapped with the selectively

21
enhanced trypsin peak at 1.2 ppm. Therefore, the effect of neighboring peaks has to be
removed prior to integration of the selectively enhanced trypsin signals to obtain an
accurate signal intensity. Integration of the selectively enhanced peak of trypsin and
benzamidine peak was carried out in MATLAB (The MathWorks, Natick, MA). The
functions (a+b/(x−xo)) and (a+b∗(x−xo)) were used to define the baseline for the
selectively enhanced signal of trypsin and hyperpolarized benzamidine signal
respectively to remove the baseline effect of the neighboring peaks.
However, the spectra from the newer experiments were free from the large
neighboring proton DMSO residue peaks. A straight- line function baseline was
manually defined for both trypsin and benzamidine peak in Topspin software. A typical
range of the straight line baseline for trypsin was approximately between 3 ppm to -1
ppm. The model equation fitting (shown in section 3.4) was performed in Mathematica
(Wolfram Research, Champaign, IL).
2.4 STD-NMR pulse program
For the STD experiments, a pseudo 2D pulse program (stddiffesgp.3) installed on
the Bruker software was used to acquire the on and off resonance spectra. On-resonance
irradiation was set to 1.2 ppm and off-resonance irradiation was set to 14 ppm. A train of
90o Gaussian-shaped saturation pulses was applied for a duration of 100 ms. 180o shaped
pulse using excitation sculpting with gradients for the duration of 2 ms was applied for
the water solvent suppression and suppression of residual DMSO in D6-DMSO. In
different experiments, a total number of scans ranging from 96 to 192 was acquired. A
larger number of scans was applied for samples with a low concentration of ligand.

22
3. RESULTS AND DISCUSSION
3.1 Selectively enhanced NMR resonances in DNP-NMR
Trypsin and benzamidine were chosen as models for protein and ligand since the
binding of benzamidine to trypsin at the specific binding site has already been known
and their dissociation constants have been reported in the literatures.8–11 Benzamidine
was hyperpolarized on its proton nuclei in the solid state by DNP, dissolved and
transferred to a nonpolarized solution of trypsin in the NMR spectrometer.
Hyperpolarized signal was transferred from benzamidine to trypsin when benzamidine
binds to trypsin.
Figure 7 shows that the protein NMR signals were selectively enhanced through
binding of the hyperpolarized ligand. in DNP-NMR. Polarization signal was transferred
from benzamidine to trypsin when benzamidine binds to trypsin.

23
Figure 7. 1D stacked proton NMR spectra in the DNP-NMR experiment. (a)
hyperpolarized benzamidine with trypsin, (b) hyperpolarized benzyl alcohol with
trypsin, (c) hyperpolarized [D6]DMSO/D2O with trypsin, (d) hyperpolarized
[D6]DMSO/D2O with no trypsin and, (e) non-polarized benzamidine with trypsin by
injection of benzamidine in D6-DMSO/D2O without polarization into trypsin loaded
NMR tube [mock injection DNP experiment]
The selective signal enhancement of trypsin with hyperpolarized benzamidine
was pronounced at 1.2 ppm and 4 ppm as shown in figure 7 (a). Other less pronounced
enhanced signals were observed approximately at 3.6 ppm, 3.3 ppm, 2.2 ppm and -0.8

24
ppm. With hyperpolarized benzyl alcohol, there is no enhancement of the trypsin signal
in figure 7 (b). An enhancement due to non-specific interaction between protein and the
solvent was also found to be negligible in figure 7 (c). We used the control experiment
using the polarized solvent (D6-DMSO/D2O) only without trypsin in figure 7 (d) to show
that the small signal at 2.7 ppm shown in figure 7 (b) and (c) is not due to the non-
specific interaction between the protein and the ligand but to the proton residue of D6-
DMSO solvent. In the experiment with no polarization of benzamidine with trypsin
shown in figure 7 (e), no enhancement of trypsin signal was observed.
3.2 Comparison of the DNP-NMR and STD-NMR spectrum
The three spectra in figure 8 represent the spectra of trypsin from different
experiments.

25
Figure 8. Comparison of trypsin spectrum from different experiments. (a) shows
enhanced trypsin proton NMR signal with polarization of benzamidine in the DNP-NMR
experiment as in figure 7. (b) shows the plot of the fractional change in the ligand signal
intensity versus trypsin saturation frequency using benzamidine (400 µM) and trypsin
(80 µM) in the STD-NMR experiment with the saturation time of 20 s. (c) shows 1D
proton conventional/non-hyperpolarized NMR spectrum of trypsin.
In parallel to the DNP-NMR experiment shown in figure 7 and figure 8 (a), we
conducted the STD experiment in which trypsin was selectively saturated at a series of
on-resonance frequencies within a wide range of proton frequency of interest shown in
figure 8 (b). An array of on-resonance frequencies were chosen to ensure that saturation
at a continuous spectrum of frequencies is achieved. The plot of the fractional change in

26
the ligand signal intensity ((I0L−IL)/I0L) or fractional STD enhancement versus the on-
resonance frequency for the saturation is shown in figure 8 (a). In general, the shorter the
saturation time that is employed, the weaker the STD signal that is obtained. Therefore,
we can expect that the STD signal with a longer saturation time would be associated
with less error. It can be noted that the DNP-NMR spectrum of trypsin in figure 8 (a) is
different from the conventional 1D NMR spectrum of trypsin in figure 8 (c). That
suggests the signal enhancement is of the local protein binding pocket to which
hyperpolarized benzamidine binds, rather than the signal enhancement of the entire
protein region. The maximum signal occurs at the two frequencies 1.2 ppm and 4.0 ppm.
The spectrum in figure 8 (a) was calibrated as follows. Immediately after the
polarization experiment (the acquisition of the DNP-NMR spectrum), a non-
hyperpolarized spectrum was taken. DMSO proton residual solvent peak in the non-
hyperpolarized spectrum is calibrated against DMSO proton residual peak of the similar
sample. In figure 8 (b) and (c), chemical shifts of the sample were calibrated against
those of (4,4-dmethyl-4-silapentane-1-sulfonic acid) DSS present in similar standard
samples. The benzamidine peaks in the sample and standard sample were then matched
and set to the same frequency.
The comparison of the selectively enhanced protein spectra (a single scan)
obtained from DNP-NMR experiment with the STD ligand spectra constructed from a
set of STD-NMR measurements across the wide range of protein frequencies suggests
that the two experiments are symmetrical. The symmetry of the two experiments is not
unexpected since, in DNP-NMR, the polarization signal transfers from the

27
hyperpolarized ligand to the protein binding sites, whereas the saturation signal transfers
from the protein binding sites to the ligand in STD-NMR.
There are significant advantages of the DNP-NMR method over the STD-NMR
method. The comparison of Figure 8 (a) and (b) shows that the signal intensity profile
obtained with the DNP-NMR method provides a much better resolution than the profile
obtained from the STD-NMR experiment. In addition, the experimental and signal-
processing time in the DNP-NMR experiment is on the time scale of a few seconds to
several seconds after a hyperpolarization period of 30 min, whereas the experimental
time and signal-processing time for the STD-NMR experiment takes from several days
to a few weeks.
3.3 Analysis of different peaks in STD-NMR
The STD signal ((Io−I)/Io) at different protein saturation frequencies was
acquired using different saturation times shown in figure 9. The STD signal acquired
with shorter saturation times has a much lower signal to noise ratio and is associated
with more errors than the signal obtained using a longer saturation time.

28
Figure 9. STD signal at different saturation frequencies. Spectra stacked for different
saturation times: 20 s, 3 s, 2 s and 1s respectively from top to bottom, using benzamidine
(400 µM) and trypsin (80 µM)
The saturation signal is a function of both the cross-relaxation rate (σ) and the
auto-relaxation rate (ρ) of spins. Different spins (ligand spins in the STD experiment)
that receive the signal from the perturbed spins (saturated protein spins in the STD
experiment) can relax back to equilibrium at different auto-relaxation rates. Similarly,
different spins can receive signal from the perturbed spins and their cross-relaxation
rates (σ) can vary with their proximity to the perturbed spins. Theoretically, different
spins with a different resonance frequency can reach the steady-state at different
saturation times due to different environments they are in (i.e. they can have different σ

29
and ρ values). A rational choice of a proper saturation time would be to find the
saturation time when spins reach the steady-state.
The frequency of the maximum peaks slightly changes when compared at
different saturation times shown in the figure 9 of section 3.3, perhaps, due to the errors
arising from the signal intensity measurement at shorter saturation times. Therefore, the
most rational choice of the proper saturation time would be the longest saturation time
(20 s in this experiment) that allows for the STD signal with the least amount of errors.
An alternative explanation for the slight unidirectional shift in the frequency of the
maximum peaks with the progression of saturation time is that different spins with very
similar frequencies could have different saturation buildup times and, thus, display
maximum saturation signal at different saturation times.
3.4 Signal buildup in the time-resolved DNP-NMR spectra
With the DNP experiments, the polarization signal decay of the ligand and that of
protein polarized due to cross-relaxation with the hyperpolarized ligand during the
transient period was studied. The transient period lasted for several seconds until the
polarization reaches the Boltzmann equilibrium. The equation for the evolution of the
hyperpolarized signal (Iz) towards the Boltzmann equilibrium is shown in the literature.
Time-dependent evolution of the hyperpolarized signal (Iz) towards the Boltzmann equilibrium is given in the literature.29

30
Figure 10. Polarization signal of trypsin and benzamidine in DNP experiment. (a) shows
the expanded picture of a series of 1D proton NMR spectra showing protein transferred
signal at 1.2 ppm; the integral of ligand in (b) and the integral of protein from 1 ppm to
1.3 ppm in (c) as a function of time. Integrals of ligand and protein were fitted with
model equations. The water solvent resonance was selectively suppressed by EBURP2
shaped π/2 pulses of 20 ms duration.
The protein and the ligand were assumed as two coupled spins (one spin for the
protein (P) and one spin for the ligand (L)) in derivation of the model equations
representing the NMR signal intensities of the protein and the ligand.

31
The model equations for the ligand signal ( Ls ) and the protein signal ( Ps ) are
given by57
( ) Lr t
L LHs t s e
(III.1)
*( ) ( )( )L P L P
br t r t r t r t
DNPLH LHP
L P L P
e e s e e p ss t
r r r r
(III.2)
rL=pf ρLf+ pb ρLP and rP= p ρP+ p1 ρPL, are averages of auto-relaxation rates
weighed with concentration fractions, whereas σ∗= σDNP pb is the cross-relaxation rate
weighed with concentration fraction (pb) which represents the fraction of bound form of
the ligand, and p and p1 represent the fractions of free and and bound form of the protein.
σ stands for the cross-relaxation rate between ligand proton and protein proton. The
parameters ρ labeled with the subscripts (LP) and (PL) represent the auto-relaxation
rates of the ligand when bound to the protein and of the protein when bound to ligand
respectively. It can be noted that the protein signal is proportional to the cross-relaxation
rate ( ), the fraction of the bound ligand ( bp ) and the initial signal intensity of the
ligand (LHs ).
Multiple spectra were taken with a series of fixed small flip angle (15o)
excitations.54 Before fitting was performed, the signal intensity values were multiplied
with the correcting term (e-λt) to compensate for the signal loss with each subsequent
scan from applying a fixed small flip angle. The value for the parameter λ (-0.18) was
calculated from the small flip angle and the time interval between each scan (0.2 s).54
Equations (III.1) and (III.2) were used to fit the experimental data from DNP.

32
Figure 10 (a) shows a series of the selectively enhanced protein signal at
approximately 1.2 ppm from multiple scans taken during a transient period of a few
seconds. Since the interaction between hyperpolarized ligand and protein occurs prior to
the acquisition of the first NMR spectrum, nonzero enhanced signal intensity of protein
was observed in the first spectrum in figure 10 (b). As time progresses, the protein signal
intensity increases initially as the protein accumulates polarization signal from
hyperpolarized ligand and reaches the maximum signal approximately at 1 s and starts to
decrease until the protein proton spins reach the Boltzmann equilibrium. For
hyperpolarized ligand, the polarization signal intensity decreases exponentially as
predicted by the model equations.
The initial signal intensity of the ligand (sLH) and the apparent relaxation rate of
the ligand (rL) were first determined by fitting the data for the signal intensity of the
ligand to the equation III.1 (in the bottom left trace of figure 10). These two parameters
were set to known values in the equation (III.2) which is used to fit the data for the
signal intensity of protein. The equation for the protein signal intensity generates the
relaxation rate of protein (rP) and cross-relaxation rate (σDNP). Fraction of bound ligand
(pb) shown in section 2.1, Table 1 and 2 was calculated using the KD value obtained from
STD experiment in section 3.9.

33
Table 3. Quantitative DNP-NMR experiment showing fit parameters with D2O solvent
injection
Experiment # sLH (A.U.) rL(s-1) rP(s-1) σDNP (s-1) 3121 88100000 0.23 2.34 -0.114 3101 88100000 0.23 3.47 -0.098 3131 115000000 0.17 2.43 -0.079 3241 91700000 0.18 2.44 -0.094 3261 879000000 0.23 2.36 -0.086 2651 144000000 0.18 1.44 -0.112
Average 0.203333333 2.413333 -0.097 Standard Deviation 0.029439203 0.643915 0.0139
Table 4. Quantitative DNP-NMR experiment showing fit parameters with H2O solvent
injection
Experiment # sLH (A.U.) rL(s-1) rP(s-1) σDNP (s-1) 3331 93196600 0.307 2.503 -0.061 3341 63980740 0.339 2.727 -0.090 3361 93708601 0.285 2.795 -0.067 3321 72718116 0.266 3.186 -0.075
Average 0.29925 2.80275 -0.073 Standard Deviation 0.031352 0.284329 0.013
The integral of the resonance corresponding to the phenyl group of benzamidine
was analyzed for the signal intensity of the ligand. For the signal intensity of the protein,
the selectively enhanced trypsin resonance at approximately 1.2 ppm is analyzed in the
DNP method. The apparent relaxation rate of ligand (rL) is 0.203±0.029 s−1. The average
value of σDNP and rP evaluated from the DNP-NMR experiments based on six
experiments using D2O solvent is -0.097±0.014 s−1 and 2.413±0.644 s−1 respectively as

34
shown in table 3. The average value of σDNP and rP obtained using H2O solvent is -
0.073±0.013 s−1 and 2.803±0.284 s−1
shown in table 4.
σDNP (-0.097 s-1) obtained using D2O solvent shown in table 3 is larger than σDNP
(-0.073 s-1) in H2O solvent condition shown in table 4. The viscosity effect appears to
play a role for the difference in the two σDNP values obtained with H2O and D2O solvent
conditions.
3.5 Evaluation of the cross-relaxation rate (σDNP) in DNP-NMR
Signal buildup and decay of the protein and ligand towards Boltzmann’s
equilibrium was analyzed. Time-resolved signal intensity data provided a good fit with
the model equations indicating that signal is transferred via NOE from the
hyperpolarized ligand to the protein. That entailed determination of the fit parameters
including the cross-relaxation rate (σDNP) between the protein and the ligand from the
model equation.

35
Figure 11. Proton signal build-up for different enhanced peaks. [1.2 ppm (σDNP= -0.114
s-1, rP= 2.34 s-1), 3.55 ppm (σDNP= -0.089 s-1, rP= 2.79 s-1), 4 ppm (σDNP= -0.092 s-1, rP=
3.19 s-1)]. rP is the apparent relaxation rate of the protein used in the DNP model
equations explained in section 3.4.
Figure 11 shows that different spins generate the maximum signal at
approximately 1.2 s. Beyond the maximum signal, their signal intensities decrease at a
longer time. The purpose of this analysis was to extract information about the cross-
relaxation rate (σDNP) and an apparent relaxation rate (rP) for each enhanced peak. The fit
parameters, the cross-relaxation rate (σDNP) and the apparent relaxation rate of the
protein (rp), were evaluated using the two equations (III.1) and (III.2) shown in section

36
3.4 and determined to be (-0.114 s-1, 2.34 s-1), (-0.089 s-1, 2.79 s-1) and (-0.092 s-1, 3.19
s-1) for each resonance 1.2 ppm, 3.55 ppm and 4 ppm, respectively. Those values were
obtained from one experiment (Experiment # 3121) shown in table 3.
The comparison of the cross-relaxation rates (σDNP) shows similar values for
different selectively enhanced peaks. The transferred polarization signals of different
protein proton spins reach the maximum approximately at 1 s from the time of the initial
contact between the protein and the hyperpolarized ligand discussed in section 3.4. At
the maximum, the rate of polarization signal transferred to the protein equals the rate of
loss of the polarization signal of the protein due to its spin relaxation. It can also be
noted in the figure that the polarization signals of different protein spins decay
approximately at similar rates.
3.6 Analysis of STD-NMR data
In the STD-NMR method, the cross-relaxation rate (σSTD) obtained from STD-
NMR is evaluated to be compared with σDNP. STD exploits the steady-state Nuclear
Overhauser Effect (NOE) which is the transfer of magnetization (Mz) (to be specific
“saturation”) from the perturbed spin (protein proton spin) to another spin (ligand proton
spin) through dipolar interaction.10 The equation defining the saturation transfer
difference amplification factor (STD-AF) can be expressed as3:
[ ][ ]
o STD
D
LSTD AF
L K
(IV.1)
The free ligand concentration [L] can be approximated as the total ligand concentration
[Lt], since the concentration of the bound ligand is much smaller than that of the free

37
ligand for the typical range of ligand concentrations used in STD experiments. The
equation (IV.1) enables determination of two fit parameters (αSTD) and (KD) from STD-
NMR titration experiments using different concentrations of ligand for a fixed
concentration of protein.2 αSTD represents the maximum STD-AF when all the protein
molecule are saturated with the ligand at an infinite ligand concentration (i.e.
[ ] [ ][ ] [ ] [ ]D
L PL
L K P PL
which is the fraction of protein bound to the ligand approaches 1).
KD represents the dissociation constant.
The general Solomon equations describing the evolution of perturbed spin
towards equilibrium assume that the two spins are always bound. Equations (IV.2 and
IV.3) describe the Solomon equations in the idealized case in which one protein spin and
one ligand spin only is assumed and the two spins are assumed to be in either free or
bound state. The populations of free and bound state are dictated by the kinetic exchange
equilibrium. The equations (IV.2) and (IV.3) can be readily applied for the two spin
system involving kinetic exchange as in the case of the protein and ligand spin system.
The equations describing the evolution of the magnetization of the bound ligand (ILb)
and the free ligand (ILf) with consideration of the kinetic exchange (koff and kon) between
the protein and the ligand can be expressed as: 42,58
0 0( )LbLb Lb off Lb Lb on Lf Pb
dII k I k I qI
dt (IV.2)
(IV.3)
0 ( [ ] )Lf
Lf Lf on Lf Lf off Lb
dII k P I k I
dt

38
ρLb and ρLf represent the relaxation rate (1/T1) of the bound ligand and free
ligand. I0Eb is the magnetization of the protein at the Boltzmann thermal equilibrium. The
symbols (I) designated with the subscript (0) indicate the z-magnetization at the
Boltzmann equilibrium. I0Lf and ILf represent the off-resonance and on-resonance signal
intensities of the free ligand. Off-resonance (reference) condition refers to the
Boltzmann Equilibrium. It can be noted that the notation (Io) used earlier for the off-
resonance ligand signal intensity represents the cumulative ligand signal intensity
(I0Lf+I0Lb). Similarly, the on-resonance ligand signal intensity (I) represents the
cumulative on-resonance intensity (ILf+ILb). I0Pb symbolizes the on-resonance bound
protein signal intensity. The fractional intensity change in the free ligand (I0Lf−ILf/I0Lf) on
saturation of protein was shown to be proportional to the cross-relaxation rate with the
approximation of high ligand excess and the assumption that the off-rate is much faster
than the relaxation rate of the bound ligand. The chemical exchange rates, koff and kon,
are defined as the off-rate constant (rate of dissociation of the bound state (PL)) and the
on-rate constant (rate of association of the free states (P) and (L)) according to the
association/dissociation equilibrium. q is defined as transferred magnetization rate which
is the summation over the whole protein of the protein-ligand cross-relaxation (σ)
multiplied with the fractional saturation of the protein protons (fPb) (i.e. q=-∑σPL fPb)
where fPb=((I-Io)/Io) and σPL is the cross-relaxation term between a protein spin and a
ligand spin.
Solving the above coupled differential equations at the steady state condition
with the assumption that the concentration of the free ligand is much larger than that of

39
the bound ligand generates the following equation (IV.4) (shown in the supporting
information of the literature42).
00
PbLf Lf
Lf
qII I
(IV.4)
In our case, we only consider the protein spins that are fully saturated so that fPb=
-1. In addition, we assume all the saturated protein spins as one spin and all saturated
ligand spins as one spin so that we use the cross-relaxation term (σ) between the two
interacting spins so that q=σ I0Pb represents the thermal equilibrium spin population of
the bound protein. Rearranging the equation (IV.4) with (I0Pb/I0Lf=[PL]/[Lt]) and
[ ] [ ][ ][ ]
t t
D t
L PPL
K L
, and incorporation of additional assumptions described above gives:42
0max
0
[ ] ' [ ][ ] [ ]
tLf Lf
tLf Lf D
I I L LSTD AF
I P L K
(IV.5)
Io and I shown in (IV.1) can be approximated as I0Lf and ILf since the free ligand
population is much larger than the bound ligand concentrations in STD experiments.
Similarly, the experimental [L]t value is approximately used for [L]. The relaxation rate
of the free ligand (ρLf) can be determined from an independent inversion-recovery
experiment.2
0max,
0
[ ][ ]
t STDLf Lfel
tLf Lf
I I LSTD AF
I P
(IV.6)
At an excess ligand concentration, the equation (IV.5) can be expressed as the
equation (IV.6). The maximum STD-AF signal (STD-AFmax,el) obtained at the saturation
equilibrium condition and an excess ligand concentration shown in (IV.6) represents the

40
parameter σSTD divided by the relaxation rate of the free ligand (ρLf). The saturation
equilibrium is reached after a sufficient protein saturation time is employed (~5 times
T1).
3.7 Determination of spin-lattice relaxation time (T1)
The inversion-recovery experiment was performed to evaluate ρLf (1/T1) necessary for
the analysis of STD-NMR data. The initial state of the spins was created by a 180o hard
pulse followed by a variable delay time (τ) during which the z-magnetization recovers
from 180o. Subsequently, a 90o
pulse was applied to measure the z-magnetization (Mz).
The pulse sequence is repeated using an incremental delay time (τ). 59–61
Figure 12. Determination of T1(s) for pure benzamidine in H2O solvent. The plot of
intensity of benzamidine aromatic ring proton resonance representing Mz as a function of
the time delay (τ). Mz= Mo·(1−2exp(−τ/T1)) is used to determine the fit parameters T1
and Mo.

41
T1 for pure benzamidine in H2O solvent is evaluated to be 3.57 s from the
inversion-recovery experiment shown in figure 12.
Figure 13. Determination of T1(s) for pure benzamidine in D2O solvent. The plot of
intensity of benzamidine aromatic ring proton resonance representing Mz as a function of
the time delay (τ). Mz= Mo·(1−2exp(−τ/T1)) is used to determine the fit parameters T1
and Mo.
T1 for pure benzamidine in D2O solvent is evaluated to be 6.62 s from the
inversion-recovery experiment shown in figure 13.

42
Figure 14. Determination of T1(s) for trypsin in H2O solvent. Trypsin (1 mM) with
benzamidine (10 mM) sample in pure H2O solvent. T1 for the trypsin peak (i.e. the spins
within the range [1.11 ppm-1.22 ppm]) representative of the polarized spins in the DNP-
NMR was evaluated to be 0.40 s.
T1 for pure benzamidine in H2O solvent is evaluated to be 0.40 s from the
inversion-recovery experiment shown in figure 14.

43
Figure 15. Determination of T1(s) for trypsin in D2O solvent. Trypsin (1 mM) with
benzamidine (10 mM) sample in pure D2O solvent.
T1 for the trypsin peak (i.e. the spins within the range [1.11 ppm-1.22 ppm])
representative of the polarized spins in the DNP-NMR was measured in the inversion-
recovery experiment shown in figure 15. T1 for pure benzamidine in D2O solvent is
evaluated to be 0.45 s.
3.8 Evaluation of the cross-relaxation rate (σSTD) in STD-NMR
STD-AF value is influenced by the saturation time. In the case of a long
saturation time, a ligand molecule that has already received saturation via its interaction
with the saturated protein can rebind to the same or another protein molecule. The

44
macroscopic STD-AF signal can be underestimated due to the rebinding process at long
saturation times. The saturated ligand molecules receive significantly less saturation
upon re-binding than upon binding the first time.
The determination of the initial growth rates from the plot of STD-AF as a
function of saturation time using the equation (V.1) can be used to obtain the corrected
STD values (STD-AFo) for each ligand concentration.47,62 The slope method yields an
accurate signal build-up information by only accounting for the STD signal buildup at
early saturation times when there are many unsaturated free ligand molecules to bind to
saturated protein molecules. It is also applied for removing the different T1 biases arising
from each individual proton spin within a particular ligand to give the STD values
representative of the proximity of each proton spin to the protein spin.48,63
max- ( ) - [1 - exp(- )]sat sat satSTD AF t STD AF k t (V.1)
STD-AFmax and ksat in the equation (V.1)43,48 were also denoted as (σ/ρ) and ρ
respectively in the supporting information section of the literature1, where σ is an
apparent cross-relaxation rate and ρ is an apparent relaxation rate. σ and ρ are dependent
upon concentration of the sample.
Different saturation times (tsat) (1, 3, 5, 10, 20 s) were used to construct STD
buildup curves and obtain the slope for each benzamidine concentration using a fixed
trypsin concentration of 15.7 µM. Fitting of the equation (V.1) generates ksat and STD-
AFmax for each ligand concentration.

45
Figure 16. The binding isotherm of STD-AF initial growth rates method. (a) shows the
growth rates of STD-AF as a function of saturation times using a fixed trypsin
concentration of 15.7 µM. (b) For each ligand concentration, the buildup curve is fitted
with the analogous form of the equation (V.1) to obtain the initial slopes, STD-AFo, (c)
These initial slope values (STD-AFo) are plotted as a function of benzamidine
concentration to generate a Langmuir isotherm from which STD-AFomax= 0.395 s-1 and
KD= 81 µM were evaluated using the analogous form of the equation (IV.1) where
STD-AFomax represents the initial slope at an excess ligand concentration. Note: The
same stock solutions of trypsin and benzamidine were used to prepare the solutions of
trypsin and benzamidine solution mixture for each measurement in this STD-NMR
protein-ligand titration experiment. The exact concentration in the stock solutions was
determined with UV spectrophotometry.

46

47
Plotting the STD-AFo values from the slope (STD-AFmax ksat) as a function of
each ligand concentration generates a Langmuir hyperbolic curve which can be fitted
with the equation using the approximation that the total ligand concentration [L]o is
equal to free ligand concentration [L].
The experimental data from the STD-NMR experiment exhibits a significant
error at high ligand concentrations due to the very weak intrinsic STD signal at high
ligand concentrations.
Table 5. The fit parameters evaluated from STD-NMR
KD (µM) STD-AFo
max (s-1) 81 0.395
As shown in table 5, STD-AFo
max was determined to be 0.395 s-1 using the
equation (IV.1). STD-AFo
max from the slope method can be compared to -σSTD obtained
from (STD-AFmax,el.ρLf) shown in equation (IV.6) if the protein saturation buildup
reached the steady state immediately following the saturation.

48
According to the literatures,8–11 the KD values evaluated from a variety of
methods and instruments typically vary approximately from 18 µM to 150 µM with
different experimental conditions such as the type of buffer, concentration of buffer, salt
concentration and pH. The KD value is consistent with those reported in the literature8–
10,59 and the ITC method suggests the reliability of the results from the STD method.
3.9 Determination of KD with Isometric Calorimetric Titration (ICT)
Isothermal Calorimetric Titration (ICT) method was employed to independently
determine KD and compare it with KD obtained from the STD-NMR method as a way to
ensure the reliability of the STD-NMR method. Titration of trypsin with benzamidine
was carried out using Tris buffer containing 10 mM CaCl2 at pH 7.0 and 25o C. The data
(K) represents the association equilibrium constant (i.e. 1/KD). KD is determined to be
45.2 µM which is comparable to (81 µM) obtained from the STD-NMR method.

49
Figure 17. Determination of KD with ITC experiment. The top figure shows the power
output (µcal/sec) to maintain the reference temperature as a function of time and the
bottom figure shows the heat generated due to titration as a function of the molar ratio of
total benzamidine to trypsin respectively.
50
3.10 Comparison between DNP-NMR and STD-NMR
The STD-NMR method is based on the steady-state NOE caused by two
opposing effects. The NOE build-up of the ligand from binding with the saturated
protein is counteracted by T1 longitudinal relaxation of the spins of the saturated ligand
bringing them back to the Boltzmann equilibrium.
With DNP-NMR experiments, we studied the transient phenomena associated
with the longitudinal relaxation of hyperpolarized spins of the ligand, the transfer of
magnetization from the ligand to the protein and the longitudinal relaxation of the
transferred signal back to the Boltzmann equilibrium.
In both the DNP-NMR and STD-NMR method applied in this study, the cross-
relaxation rate (σDNP or σSTD) represents an average σ value between a group of spins
(approximated as one spin based on the models) at the binding pocket and a group of
ligand spins (approximated as one spin based on the models).
Hyperpolarization with DNP enables the generation of sufficient signal with a
single scan. With the DNP-NMR method, σDNP can be obtained in a single experiment
which takes as little as 5 s of the NMR measurement time.

51
4. SUMMARY AND CONCLUSION
In this study, we attempted to probe the protein binding pocket by investigating
the transfer of polarization from the ligand to the protein binding pocket.
DNP-NMR experiments showed that the polarization signal of the
hyperpolarized ligand transferred to the protein, specifically the protein binding pocket
region. The non-uniform signal enhancement of the protein resonances suggests that the
protein region where the hyperpolarized ligand binds to may be selectively polarized.
Previous research on the polarization transfer from the protein ligand binding interaction
was concerned with mapping the ligand epitope via analysis of the enhanced ligand
proton signals.29 Although recent research on the spectral analysis was performed with
hyperpolarized small protein or peptides, the observed protein NMR signals of the
hyperpolarized proteins were directly amplified thermal NMR signals of the proteins
themselves.64 This study was focused on analysis of the selectively enhanced signals of a
protein, trypsin, that receives polarization from interacting with the hyperpolarized
ligand.
The comparison of the selectively enhanced protein spectra (a single scan)
obtained from DNP-NMR experiment with the STD ligand spectra constructed from a
set of STD-NMR measurements across the wide range of frequencies suggests that the
two experiments were symmetrical. The symmetry of the two experiments was expected,
since in DNP-NMR, the polarization signal transfers from the hyperpolarized ligand to
the protein binding site, whereas the saturation signal transfers from the protein binding
site to the ligand in STD-NMR. DNP-NMR spectra obtained from the single scan show a

52
much higher signal resolution and require less time (a few seconds of measurement time
after 30 minutes of hyperpolarization period) compared to the STD ligand spectra, which
typically require from at least a day to several days for scanning saturation frequency.
Model equations were used to mathematically describe the process of
polarization signal transfer from the ligand to the protein. The cross-relaxation rate (σ)
was evaluated by fitting the model equations into experimental data, the selectively
enhanced signal intensity of the protein and the signal intensity of hyperpolarized ligand
as a way to obtain a quantitative measurement of signal transfer. The σDNP value (-
0.073±0.013 s−1) evaluated from the DNP-NMR method. STD-AFo
max from the slope
method could approximately represent -σSTD obtained from (STD-AFmax,el.ρLf) if the
protein saturation buildup reached the steady state immediately following the saturation.
In such a case, the σSTD value would be on the order of -0.4 s-1. The influence of the
relaxation of polarized spins due to dipolar interaction with other nearby spins within the
protein could play a role in defining the numerical values. However, additional
theoretical work may yield a more precise interpretation of these parameters.
Another fit parameter KD evaluated from the STD-NMR method (81 µM) was
compared with the KD value (45.2 µM) obtained from an independent ITC method and
the two KD values were shown to be in reasonable agreement, suggesting that the
experimental data obtained with STD-NMR method is reliable.
The NMR spectrum of the trypsin in the DNP-NMR spectrum after polarization
transfer from hyperpolarized ligand is different from the non-hyperpolarized spectrum of
trypsin. Trypsin peaks are selectively enhanced at approximately 4 ppm, 3.6 ppm, 3.3

53
ppm, 1.2 ppm and -0.8 ppm. It can be inferred from this experimental observation that
the enhanced trypsin signals represent the signal enhancement of the amino acid residues
located in the protein binding pocket. Therefore, the present work may in the future be
extended for the detailed structural identification of the protein binding pocket.3

54
REFERENCES
1. Mizukoshi, Y. et al. An accurate pharmacophore mapping method by NMR
spectroscopy. Angew. Chem.-Int. Ed. 51, 1362–1365 (2012).
2. Dalvit, C. et al. Identification of compounds with binding affinity to proteins via
magnetization transfer from bulk water. J. Biomol. NMR 18, 65–68 (2000).
3. Peng, J. W., Moore, J. & Abdul-Manan, N. NMR experiments for lead generation in
drug discovery. Prog. Nucl. Magn. Reson. Spectrosc. 44, 225–256 (2004).
4. Meyer, B. & Peters, T. NMR Spectroscopy techniques for screening and identifying
ligand binding to protein receptors. Angew. Chem. Int. Ed. 42, 864–890 (2003).
5. Chen, A. & Shapiro, M. J. NOE Pumping: A novel NMR technique for
identification of compounds with binding affinity to macromolecules. J. Am. Chem.
Soc. 120, 10258–10259 (1998).
6. Pellecchia, M. et al. Perspectives on NMR in drug discovery: a technique comes of
age. Nat. Rev. Drug Discov. 7, 738–745 (2008).
7. Mandal, P. K. et al. Towards a structural basis for the relationship between blood
group and the severity of El Tor Cholera. Angew. Chem. Int. Ed. 51, 5143–5146
(2012).
8. Talhout, R. & Engberts, J. B. Thermodynamic analysis of binding of p-substituted
benzamidines to trypsin. Eur. J. Biochem. FEBS 268, 1554–1560 (2001).
9. Sun, J., Kitova, E. N. & Klassen, J. S. Method for stabilizing protein−ligand
complexes in nanoelectrospray ionization mass spectrometry. Anal. Chem. 79, 416–
425 (2007).

55
10. Clark, S. M. & Konermann, L. Determination of ligand−protein dissociation
constants by electrospray mass spectrometry-based diffusion measurements. Anal.
Chem. 76, 7077–7083 (2004).
11. Maresgui.m & Shaw, E. Studies on active center of trypsin - binding of amidines and
guanidines. J. Biol. Chem. 240, 1579–& (1965).
12. Krieger, M., Kay, L. M. & Stroud, R. M. Structure and specific binding of trypsin:
Comparison of inhibited derivatives and a model for substrate binding. J. Mol. Biol.
83, 209–230 (1974).
13. Duong-Thi, M.-D. et al. Weak affinity chromatography as a new approach for
fragment screening in drug discovery. Anal. Biochem. 414, 138–146 (2011).
14. Buch, I., Giorgino, T. & Fabritiis, G. D. Complete reconstruction of an enzyme-
inhibitor binding process by molecular dynamics simulations. Proc. Natl. Acad. Sci.
108, 10184–10189 (2011).
15. Pereira, M. T., Silva-Alves, J. M., Martins-Jose, A., Lopes, J. C. D. & Santoro, M.
M. Thermodynamic evaluation and modeling of proton and water exchange
associated with benzamidine and berenil binding to beta-trypsin. Braz. J. Med. Biol.
Res. 38, 1593–1601 (2005).
16. Ernst, R. R. & Anderson, W. A. Application of fourier transform spectroscopy to
magnetic resonance. Rev. Sci. Instrum. 37, 93–102 (1966).
17. Matsumoto, S. et al. Generation of 24 T at 4.2 K using a layer-wound GdBCO insert
coil with Nb3Sn and Nb-Ti external magnetic field coils. Supercond. Sci. Technol.
25, 025017 (2012).

56
18. Hore, P. & Broadhurst, R. Photo-Cidnp of Biopolymers. Prog. Nucl. Magn. Reson.
Spectrosc. 25, 345–402 (1993).
19. Walker, T. G. & Happer, W. Spin-exchange optical pumping of noble-gas nuclei.
Rev. Mod. Phys. 69, 629–642 (1997).
20. Natterer, J. & Bargon, J. Parahydrogen induced polarization. Prog. Nucl. Magn.
Reson. Spectrosc. 31, 293–315 (1997).
21. Duckett, S. B. & Sleigh, C. J. Applications of the parahydrogen phenomenon: A
chemical perspective. Prog. Nucl. Magn. Reson. Spectrosc. 34, 71–92 (1999).
22. Ardenkjaer-Larsen, J. H. et al. Increase in signal-to-noise ratio of > 10,000 times in
liquid-state NMR. Proc. Natl. Acad. Sci. U. S. A. 100, 10158–10163 (2003).
23. Prisner, T. F. in NMR Biomol. (Bertini, I., McGreevy, K. S. & Parigi, G.) 419–431
(Wiley-VCH Verlag GmbH & Co. KGaA, 2012). at
<http://onlinelibrary.wiley.com/doi/10.1002/9783527644506.ch25/summary>
24. Abragam, A. & Goldman, M. Principles of dynamic nuclear-polarization. Rep. Prog.
Phys. 41, 395–467 (1978).
25. Mieville, P., Jannin, S., Helm, L. & Bodenhausen, G. NMR of insensitive nuclei
enhanced by dynamic nuclear polarization. Chimia 65, 260–263 (2011).
26. Barnes, A. B. et al. High-field dynamic nuclear polarization for solid and solution
biological NMR. Appl. Magn. Reson. 34, 237–263 (2008).
27. Hilty, C. & Bowen, S. Applications of dynamic nuclear polarization to the study of
reactions and reagents in organic and biomolecular chemistry. Org. Biomol. Chem.
8, 3361–3365 (2010).

57
28. Bowen, S. & Hilty, C. Rapid sample injection for hyperpolarized NMR
spectroscopy. Phys. Chem. Chem. Phys. 12, 5766–5770 (2010).
29. Lee, Y. et al. Hyperpolarized binding pocket nuclear overhauser effect for
determination of competitive ligand binding. Angew. Chem.-Int. Ed. 51, 5179–5182
(2012).
30. Lee, Y., Heo, G. S., Zeng, H., Wooley, K. L. & Hilty, C. Detection of living anionic
species in polymerization reactions using hyperpolarized NMR. J. Am. Chem. Soc.
135, 4636–4639 (2013).
31. Ragavan, M., Chen, H.-Y., Sekar, G. & Hilty, C. Solution NMR of polypeptides
hyperpolarized by dynamic nuclear polarization. Anal. Chem. 83, 6054–6059 (2011).
32. Mo, H. P. & Pochapsky, T. C. Intermolecular interactions characterized by nuclear
Overhauser effects. Prog. Nucl. Magn. Reson. Spectrosc. 30, 1–38 (1997).
33. Netzel, D. & Miknis, F. Nuclear-spin relaxation spectroscopy. Appl. Spectrosc. 31,
365–386 (1977).
34. Clore, G. M. & Gronenborn, A. M. Theory of the time dependent transferred nuclear
Overhauser effect: Applications to structural analysis of ligand-protein complexes in
solution. J. Magn. Reson. 1969 53, 423–442 (1983).
35. Ni, F. Recent developments in transferred NOE methods. Prog. Nucl. Magn. Reson.
Spectrosc. 26, Part 6, 517–606 (1994).
36. Mo, H. & Pochapsky, T. C. Intermolecular interactions characterized by nuclear
Overhauser effects. Prog. Nucl. Magn. Reson. Spectrosc. 30, 1–38 (1997).

58
37. Zerbe, O. & Jurt, S. Applied NMR Spectroscopy for Chemists and Life Scientists.
(John Wiley & Sons, 2013).
38. Kowalewski, J. & Maler, L. Nuclear Spin Relaxation in Liquids: Theory,
Experiments, and Applications. (CRC Press, 2006).
39. Boulat, B. & Bodenhausen, G. Cross relaxation in magnetic resonance: An extension
of the Solomon equations for a consistent description of saturation. J. Chem. Phys.
97, 6040 (1992).
40. Fielding, L. NMR methods for the determination of protein–ligand dissociation
constants. Prog. Nucl. Magn. Reson. Spectrosc. 51, 219–242 (2007).
41. Fielding, L., Rutherford, S. & Fletcher, D. Determination of protein–ligand binding
affinity by NMR: observations from serum albumin model systems. Magn. Reson.
Chem. 43, 463–470 (2005).
42. Kemper, S. et al. Group epitope mapping considering relaxation of the ligand
(GEM-CRL): Including longitudinal relaxation rates in the analysis of saturation
transfer difference (STD) experiments. J. Magn. Reson. 203, 1–10 (2010).
43. Angulo, J., Enríquez-Navas, P. M. & Nieto, P. M. Ligand–receptor binding affinities
from Saturation Transfer Difference (STD) NMR Spectroscopy: The binding
isotherm of STD initial growth rates. Chem. – Eur. J. 16, 7803–7812 (2010).
44. Angulo, J. & Nieto, P. M. STD-NMR: application to transient interactions between
biomolecules-a quantitative approach. Eur. Biophys. J. Biophys. Lett. 40, 1357–1369
(2011).

59
45. Sánchez-Pedregal, V. M. et al. The INPHARMA Method: Protein-mediated
interligand NOEs for pharmacophore mapping. Angew. Chem. Int. Ed. 44, 4172–
4175 (2005).
46. Ludwig, C. et al. SALMON: Solvent accessibility, ligand binding, and mapping of
ligand orientation by NMR Spectroscopy. J. Med. Chem. 51, 1–3 (2008).
47. Mayer, M. & James, T. L. NMR-based characterization of phenothiazines as a RNA
binding scaffold†. J. Am. Chem. Soc. 126, 4453–4460 (2004).
48. Mayer, M. & Meyer, B. Group epitope mapping by saturation transfer difference
NMR to identify segments of a ligand in direct contact with a protein receptor. J.
Am. Chem. Soc. 123, 6108–6117 (2001).
49. Lepre, C. A., Moore, J. M. & Peng, J. W. Theory and applications of NMR-based
screening in pharmaceutical research. Chem. Rev. 104, 3641–3675 (2004).
50. Lepre, C. A., Moore, J. M. & Peng, J. W. Theory and applications of NMR-based
screening in pharmaceutical research. Chem. Rev. 104, 3641–3676 (2004).
51. Mayer, M. & Meyer, B. Characterization of ligand binding by saturation transfer
difference NMR spectroscopy. Angew. Chem.-Int. Ed. 38, 1784–1788 (1999).
52. Umemoto, K., Oikawa, S., Aida, M. & Sugawara, Y. Intermolecular nuclear
overhauser effect and atomic pair potential approaches to wheat-germ agglutinin -
sugar binding. J. Biomol. Struct. Dyn. 6, 593–608 (1988).
53. Maaheimo, H., Kosma, P., Brade, L., Brade, H. & Peters, T. Mapping the binding of
synthetic disaccharides representing epitopes of chlamydial lipopolysaccharide to
antibodies with NMR. Biochemistry (Mosc.) 39, 12778–12788 (2000).

60
54. Zeng, H., Lee, Y. & Hilty, C. Quantitative rate determination by dynamic nuclear
polarization enhanced NMR of a Diels−Alder reaction. Anal. Chem. 82, 8897–8902
(2010).
55. Weiz, A. R. et al. Harnessing the evolvability of tricyclic microviridins to dissect
protease–inhibitor interactions. Angew. Chem. Int. Ed. 53, 3735–3738 (2014).
56. Vulpetti, A., Hommel, U., Landrum, G., Lewis, R. & Dalvit, C. Design and NMR-
based screening of LEF, a library of chemical fragments with different local
environment of fluorine. J. Am. Chem. Soc. 131, 12949–12959 (2009).
57. Zeng, H. Quantitative determination of chemical processes by dynamic nuclear
polarization enhanced nuclear magnetic resonance spectroscopy. (2012).
58. Clore, G. M. & Gronenborn, A. M. Theory and applications of the transferred
nuclear overhauser effect to the study of the conformations of small ligands bound to
proteins. J. Magn. Reson. 1969 48, 402–417 (1982).
59. Vold, R. L., Waugh, J. S., Klein, M. P. & Phelps, D. E. Measurement of spin
relaxation in complex systems. J. Chem. Phys. 48, 3831–3832 (2003).
60. Kay, L., Torchia, D. & Bax, A. backbone dynamics of proteins as studied by N-15
inverse detected heteronuclear NMR-spectroscopy - application to Staphylococcal
nuclease. Biochemistry (Mosc.) 28, 8972–8979 (1989).
61. Sklenar, V., Torchia, D. & Bax, A. measurement of C-13 longitudinal relaxation
using H-1 detection. J. Magn. Reson. 73, 375–379 (1987).

61
62. Angulo, J. et al. Saturation Transfer Difference (STD) NMR spectroscopy
characterization of dual binding mode of a mannose disaccharide to DC-SIGN.
Chembiochem 9, 2225–2227 (2008).
63. Mayer, M. & James, T. L. NMR-based characterization of phenothiazines as a RNA
binding scaffold. J. Am. Chem. Soc. 126, 4453–4460 (2004).
64. Ragavan, M., Chen, H.-Y., Sekar, G. & Hilty, C. Solution NMR of polypeptides
hyperpolarized by dynamic nuclear polarization. Anal. Chem. 83, 6054–6059 (2011).


![A COMPARATIVE STUDY OF MAGNETIC RESONANCE IMAGING, … · characterization and examples of their application can be found in the literature [1, 2]. Magnetic Resonance Imaging (MRI)](https://img.pdfslide.us/doc/110x75/608032f9c0412f58070e007a/a-comparative-study-of-magnetic-resonance-imaging-characterization-and-examples.jpg)