Embed Size (px)
Citation preview
American Mineralogist, Volume 74, pages 203-215, 1989
Characterization of clay minerals by ttAl nuclear magnetic resonance spectroscopy
DoN.q.Lo E. WopssNnnMobil Research and Development Corporation, Dallas Research l-aboratory, 13717 Midway Road, Dallas, Texas 75244, U.S.A.
Ansrn-tcr
'?7Al isotropic chemical shifts and the nuclear electric quadrupole coupling parameter (afunction of both the quadrupole coupling constant and the asymmetry parameter) havebeen determined for a wide variety of 2: I clay minerals using magic-angle-spinning nuclearmagnetic resonance spectroscopy at Homagnetic fields of 6.35 and 11.74 T, proton de-coupling, and high-speed sample spinning (8.9 kHz at 6.35 T and 5.3 kHz at 11.74 T).The tarAl chemical shifts become progressively deshielded (more positive) with increasingtctAl for Si substitution and increasing total layer charge, in the same manner as found byprevious authors for'?eSi. The talAl nuclear electric quadrupole coupling parameter alsoincreases with increasing t4rAl substitution and total layer charge. Both quantities are re-lated to tetrahedral layer distortion. The lorAl chemical shift is more shielded for triocta-hedral (Mg) phases than dioctahedral (Al) phases, as noted previously for 2eSi. The t6tAl
MAS NMR peaks of gibbsite, beidellite, and other minerals show multiple Al electrostaticsite environments. This peak is broader for dioctahedral phases containing Mg. t4rAyt6lAlquantitation using the 11.74-T spectra is in excellent agreement with published structuralformulae. The high spinning speed contributes sigrrificantly to this agreement. The amountof I4rAl in montmorillonites is either small or undetectable, and the published structuralformulae for some of them apparently do not represent the actual composition of the clayused in this study. High-field, high-speed spinning 27Al vres NMR measurement is a directand sensitive technique for distinguishing montmorillonite from beidellite.
INrnonucrrou
Since 1979 there has been a growing use ofhigh-reso-lution magic-angle spinning (ruas) nuclear magnetic res-onance (Nrvrn) spectroscopy to study minerals (Kirkpat-rick er al., 1985b; Oldfield and Kirkpatrick, 1985). Theearly work concentrated on 2eSi, because 2eSi r'ras Nvrnspectra have narrow, well-resolved peaks and, thus, muchstructural information. Measurements on quadrupolarnuclei such as 27Al were initially avoided, because thenuclear electric quadrupole interaction produces verybroad Nun peaks for powder samples. However, in 1982it was shown that relatively high resolution spectra canbe obtained under conditions of magic-angle spinning,very high magnetic field strengths (110) and observationof solely the (t/2, -Yz) spin transition (Meadows et al.,l 982).
This paper explores the relationships of the 27Al Nvrnchemical shifts and of nuclear electric quadrupole cou-pling parameters (Hafner and Hartmann, 19641. Ghoseand Tsang, 1973;Y1lla and Bjorkstam. 1983; Shulepovet al., 1983; Kirkpatrick et al., 1985a) to the atomic sub-stitutions in the tetrahedral and octahedral sheets of 2: Iclay minerals. This work differs from most earlier 27Al
MAS NMR work on clays (Alma et al., 1984; Barron et a1.,1985; Diddams et al., 1984; Goodman and Stucki, 1984;Kinsey et al., 1985; Kirkpatrick et al., 1985b; Komareniet al., 1986; Lippmaa et al., 1986; Lipsicas et al., 1984;
0003-004x/8 9/0 l 02-0203 $02.00
Plee et al., 1985; Sanz and Serratosa, 1984a, 1984b;'Thompson, 1984) in several important aspects. (l) Manydifferent types of 2: I clay minerals were studied to allowcomprehensive comparison of the 'z7Al MAS NMR charac-teristics to clay structural and compositional parameters.(2) The sample spinning speeds were higher, greatly in-creasing the clarity of the spectra by reducing the numberand intensity ofinterfering spinning sidebands. The spin-ning speeds were chosen to remove the spinning side-bands of thetulAl peak from the spectral region containingthe peak for I4rAl. (3) Proton decoupling was used rou-tinely, significantly increasing the resolution. (4) Mostsamples were measured at two magnetic fields.
It is important to obtain data at several l1o field strengthsbecause the first moment (the center of gravity), Ml, ofthe (Vz, - Yz) vns Nvrn peak of a quadrupolar nucleus ina powder sample differs from the isotropic chemical shift(Behrens and Schnabel, 1982). This second-order quad-rupole shift and the width of the observed Nvrn peak de-crease with increasing fIo magnetic field (Behrens andSchnabel, 1982; Ganapathy et al., 1982). The isotropicchemical shift, Di, and the second-order quadrupole effectparameter (SOQE : (QCC) (l + n2/3)h, where QCC is thequadrupole coupling constant and 4 is the asymmetry pa-rameter) can be determined from the Ml values mea-sured at two different l1o strengths (Lippmaa et al., 1986).When multiple sites contribute to the Nun peaks, the 6'obtained in this fashion is the weighted average isotropic
203
204 WOESSNER: CHARACTERIZATION OF CLAY MINERALS BY,AI NMR
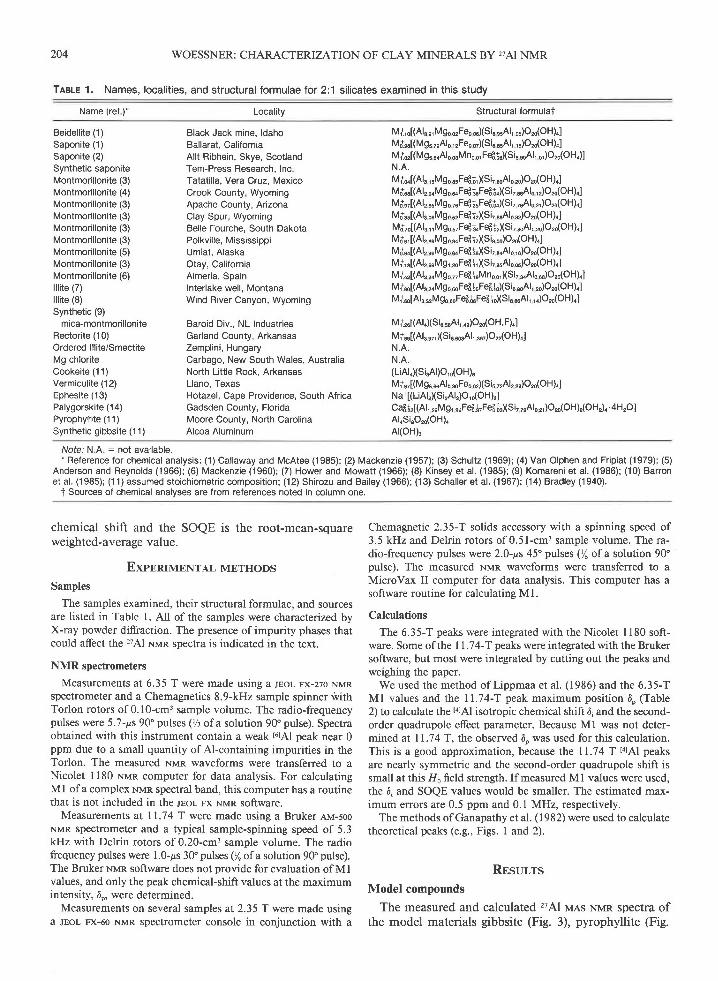
TreLe 1, Names, localities, and structural formulae for 2:1 silicates examined in this study
Name (ref )- Locality Structural formulat
Beidellite (1)Saponite (1)Saponite (2)Synthetic saponiteMontmorillonite (3)Montmorillonite (4)Montmorillonite (3)Montmorillonite (3)Montmorillonite (3)Montmorillonite (3)Montmorillonite (5)Montmorillonite (3)Montmorillonite (6)lllite (7)lllite (8)Synthetic (9)
mica-montmorilloniteRectorite (10)Ordered lllite/SmectiteMg chloriteCookeite (1 1)Vermiculite (12)Ephesite (13)Palygorskite (14)Pyrophyllite (1 1)Synthetic gibbsite (1 1)
Black Jack mine, ldahoBallarat, CaliforniaAllt Ribhein, Skye, ScotlandTem-Press Research, IncTatatilla, Vera Cruz, MexicoCrook County, WyomingApache County, ArizonaClay Spur, WyomingBelle Fourche, South DakotaPolkville, MississippiUmiat, AlaskaOtay, CaliforniaAlmeria, SpainInterlake well, MontanaWind River Canyon, Wyoming
Baroid Div., NL IndustriesGarland County, ArkansasZemplini, HungaryCarbago, New South Wales, AustraliaNorth Little Rock, ArkansasLlano, TexasHotazel, Cape Providence, South AfricaGadsden County, FloridaMoore County, North CarolinaAlcoa Aluminum
Mf,o[(Alo $ Mgo 02Feo o6XSi6 esAl, os)Oro(OH)4]MJ36[(M95 TrAlo lrFeo o,XSi6 sAl, ,s)Oro(OH)4]Mi@[(M95 s4Alo @Mno o, FeBi6)(Si6 erAl j ol)Oa(OH4)]N.A.
Mfo.[(Al.,.Mgo *F4.6XSi? eAlo ro)Oro(OH)4]M Jj6[(Alr 14M go ilFq:oFe6&XSi? soAlo,r)Om(OH)4]Mo+e7[(Al, e5M go 76F415FeA j4XSi? ?rAlo rl )Oro(OH)4]Mo*€s[(Al3 6M go 5rF41rXSi? sAlo s)Oro(OH),]MJ,o[(Alo il Mgo 5?Fq1"Fe6ir)(Si? eAlo ,o)Oro(OH)4]Mdrl[(Al, srMgo sF4;XSis oo)Oro(OH)4]Mo+r4[(Al, e6Mgo qFql6XSi? eAlo 16)Oro(OH)4]Mirr[(Al, 6rMg! roF411XSi, r5Alo 6)010(0H)4]Mi,.[(Al.
"nMgo rrF4leMno 01XSi7 sAlo 66)Oro(OH)4]
Mio6[(Al3 24Mgo mFqj6Fe6io)(Si6 soAl, ro)Oro(OH)4]Ml6o[Als eMgo 6oFdi6Fe6loxsi6 06A11 1n)Oro(OH)o]
Mi26(Al4xsi6 56Al' 4roro(oH, F)ol
MiEr(Al3 e,,XSi6 6@A11 3r7)Orr(OH)41N.A.
N.A,(LiAt4xsisADoro(oH)6Mie?[(Mgs sAlo ooFeo orXSi5 TrAl2 rs)Oe(OH)4]Na.[(LiAl,XSi,At)O,o(OH),]Caf;jr[(Al, rrMg,
"uFe8j,Fe6io)(Si,,rAlor,)Oro(OH)r(OHr)o'4HrO]Atlsiso'o(oH)4A(OH)3
Notei N A : not available.'Reference for chemical analysis: (1) Callaway and McAtee (1985); (2) Mackenzie (1957); (3) Schultz (1969); (4) Van Olphen and Fripiat (1979); (5)
Anderson and Reynolds (1966); (6) Mackenzie (1960); (7) Hower and Mowatt (1966); (8) Kinsey et al. (1985); (9) Komareni et al. (1986); (10) Barronet al. (1 985); (1 1) assumed stoichiometric composition; (12) Shirozu and Bailey (1 966); (13) Schaller et al. (1967); (14) Bradley (1 940).
f Sources of chemical analvses are from references noted in column one.
chemical shift and the SOQE is the root-mean-squareweighted-average value.
ExpnnrtrnurAl, METHoDS
Samples
The samples examined, their structural formulae, and sourcesare listed in Table l. All of the samples were characterized byX-ray powder diffraction. The presence of impurity phases thatcould affect the'?7Al NMR spectra is indicated in the text.
NMR spectrorneters
Measurements at 6.35 T were made using a lror- FX-270 NMRspectrometer and a Chemagnetics 8.9-kHz sample spinner \hithTorlon rotors of 0.10-cm3 sample volume. The radio-frequencypulses were 5.7-ps 90'pulses (7: ofa solution 90'pulse). Spectraobtained with this instrument contain a weak t6lAl peak near 0ppm due to a small quantity of Al-containing impurities in theTorlon. The measured ].Iur waveforms were transferred to aNicolet ll80 Nrr,rn computer for data analysis. For calculatingMl of a complex NMR spectral band, this computer has a routinethat is not included in the rsoI- Fx NMR software.
Measurements at 11.74 T were made using a Bruker,c,N{-sooNMR spectrometer and a typical sample-spinning speed of 5.3kHz with Delrin rotors of 0.20-cm3 sample volume. The radiofrequency pulses were 1.0-prs 30' pulses ()/n ofa solution 90'pulse).The Bruker Nrr.rn software does not provide for evaluation of Mlvalues, and only the peak chemical-shift values at the maximumintensity, 6o, were determined.
Measurements on several samples at 2.35'l were made usinga JEoL Fx-60 NMR spectrometer console in conjunction with a
Chemagnetic 2.35-T solids accessory with a spinning speed of3.5 kHz and Delrin rotors of 0.51-cm3 sample volume. The ra-dio-frequency pulses were 2.0-ps 45 pulses (% of a solution 90'pulse). The measured Nun. waveforms were transferred to aMicroVax II computer for data analysis. This computer has asoftware routine for calculatins Ml.
Calculations
The 6.35-T peaks were integrated with the Nicolet 1180 soft-ware. Some of the I 1.74-T peaks were integrated with the Brukersoftware, but most were integrated by cutting out the peaks andweighing the paper.
We used the method of Lippmaa et al. (1986) and the 6.35-TMl values and the 11.74-'l peak maximum position 6o (Table2) to calculate the I4rAl isotropic chemical shift 6, and the second-order quadrupole effect parameter. Because Ml was not deter-mined at ll.7 4 T, the observed 6o was used for this calculation.This is a good approximation, because the 11.74 T tatAl peaksare nearly symmetric and the second-order quadrupole shift issmall at this Ilo field strength. If measured Ml values were used,the d, and SOQE values would be smaller. The estimated max-imum errors are 0.5 ppm and 0.1 MHz, respectively.
The methods ofcanapathy et al. (1982) were used to calculatetheoretical peaks (e.g., Figs. I and 2).
Rnsur,rsModel compounds
The measured and calculated 'z7Al MAS NMR spectra ofthe model materials gibbsite (Fig. 3), pyrophyllite (Fig.
WOESSNER: CHARACTERIZATION OF CLAY MINERALS BY ,AI NMR
? = 1 . 0
70241 KHz
205
D
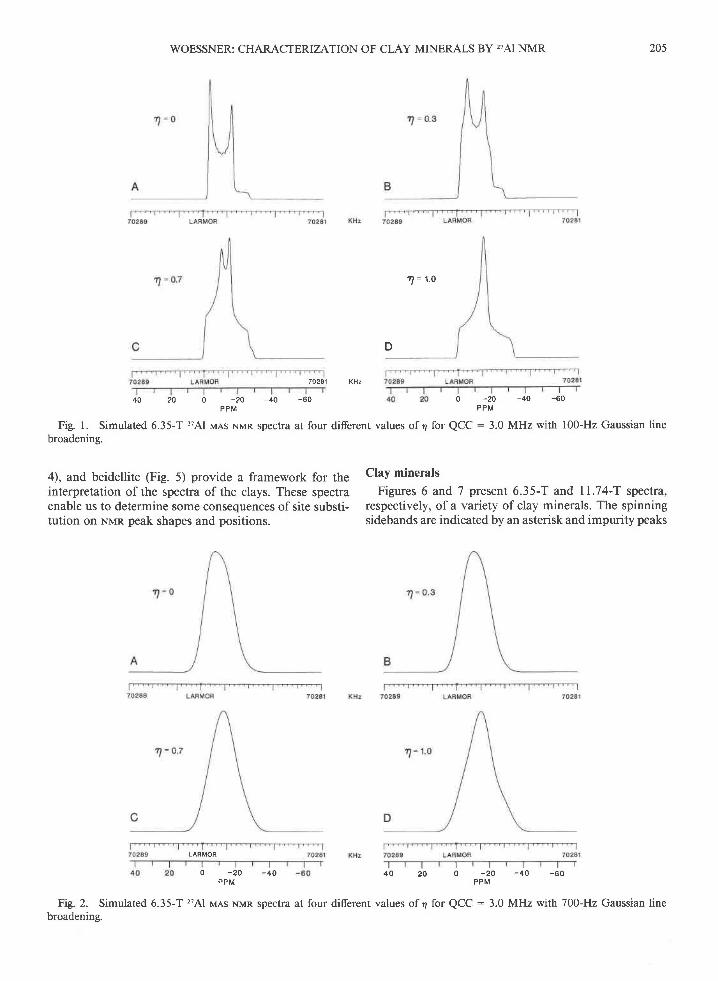
Fig. 1. Simulated 6.35-T 'Al MAs NMR spectra at four diferent values of 4 for QCC : 3.0 MHz with 100-Hz Gaussian linebroadening.
40 m 0 -20 -40 -60
P P M
4), and beidellite (Fie. 5) provide a framework for theinterpretation of the spectra of the clays. These spectraenable us to determine some consequences of site substi-tution on Nrran peak shapes and positions.
0 -20 -40 -60
P P M
Clay minerals
Figures 6 and 7 present 6.35-T ard 11.74-T spectra,respectively, of a variety of clay minerals. The spinningsidebands are indicated by an asterisk and impurity peaks
LAHMOR
0 -20 -40P P M
40 20 0 -20 -40 -60P P M
Fig. 2. Simulated 6.35-T 'Al MAs NMR spectra at four different values of 4 for QCC : 3.0 MHz with 700-Hz Gaussian linebroadening.
206
0 oPM -20 0 -40 0
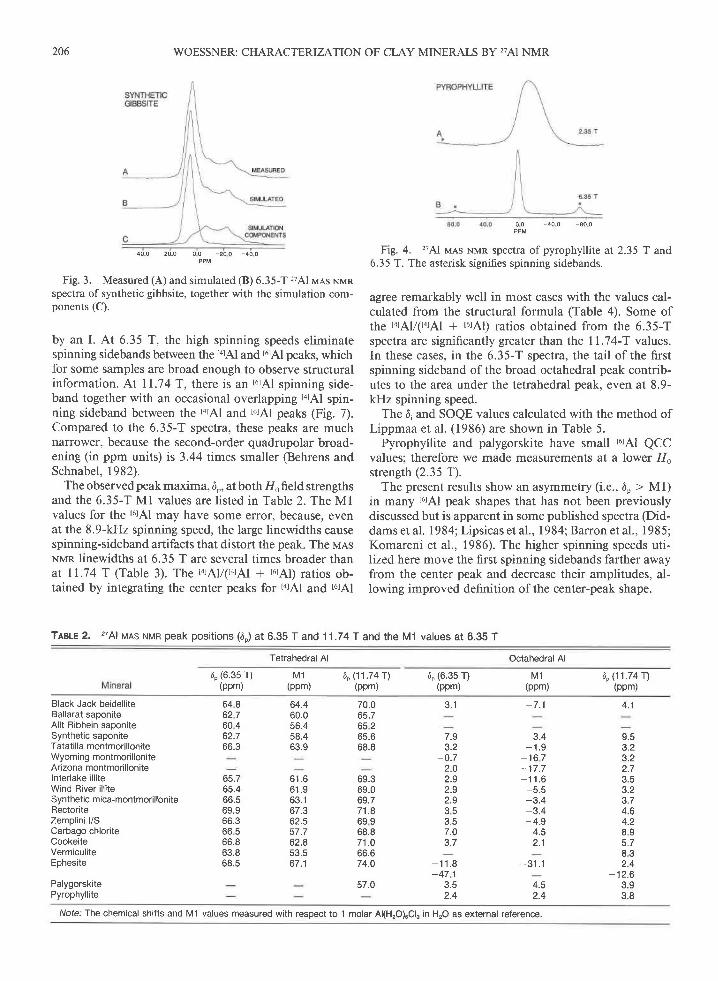
Fig. 3. Measured (A) and simulated (B) 6.35-T 27Al rraas Nrunspectra of synthetic gibbsite, together with the simulation com-ponents (C).
by an I. At 6.35 T, the high spinning speeds eliminatespinning sidebands between the torAl and turAl peaks, whichfor some samples are broad enough to observe structuralinformation. At 11.74 T, there is an t6rAl spinning side-band together with an occasional overlapping tarAl spin-ning sideband between the r4rAl and I6rAl peaks (Fig. 7).Compared to the 6.35-T spectra, these peaks are muchnanower, because the second-order quadrupolar broad-ening (in ppm units) is 3.44 times smaller (Behrens andSchnabel ,1982).
The observed peak maxima, 6o, at both llo field strengthsand the 6.35-T Ml values are listed in Table 2. The Mlvalues for the t6tAl may have some error, because, evenat the 8.g-kHz spinning speed, the large linewidths causespinning-sideband artifacts that distort the peak. The uesNvn linewidths at 6.35 T are several times broader thanat 11.74 T (Table 3). The t4rAy(4rAl + t6rAl) ratios ob-tained by integrating the center peaks for talAl and t6tAl
WOESSNER: CHARACTERIZATION OF CLAY MINERALS BY ZAI NMR
0 0 - 4 0 0 - 8 0 0
Fig. 4. 27Al rvras NMR spectra of pyrophyllite at 2.35 T and6.35 T. The asterisk signifies spinning sidebands.
agree remarkably well in most cases with the values cal-culated from the structural formula (Table 4). Some ofthe r4rAl/fl4rAl + 16rAl) ratios obtained from the 6.35-Tspectra are significantly greater than the 11.74-T values.In these cases, in the 6.35-T spectra, the tail of the firstspinning sideband ofthe broad octahedral peak contrib-utes to the area under the tetrahedral peak, even at 8.9-kHz spinning speed.
The 6, and SOQE values calculated with the method ofLippmaa et al. (1986) are shown in Table 5.
Pyrophyllite and palygorskite have small t6rAl QCCvalues; therefore we made measurements at a lower 110strength (2.35 T).
The present results show an asymmetry (i.e., do > Ml)in many I6lAl peak shapes that has not been previouslydiscussed but is apparent in some published spectra (Did-dams et al. 1984; Lipsicas et al., 1984; Barron et al., 1985;Komareni et al., 1986). The higher spinning speeds uti-lized here move the first spinning sidebands farther awayfrom the center peak and decrease their amplitudes, al-lowing improved definition of the center-peak shape.
Trale 2. 27Al MAS r.h,rn peak positions (6e) at 6.35 T and 11.74T and the M1 values at 6.35 T
Tetrahedral Al Octahedral Al
De (6.35 T)(ppm)
M 1(ppm)
6e (1 .74 r1(ppm)
6e (6.35 T)(ppm)
M1(ppm)
6e (1 1.74 T)(ppm)
Black Jack beidelliteBallarat saponiteAllt Ribhein saponiteSynthetic saponiteTatatilla montmorilloniteWyoming montmorilloniteArizona montmorilloniteInterlake illiteWind River illiteSynthetic mica-montmorilloniteRectoriteZemplini l/SCarbago chloriteCookeiteVermiculiteEphesite
PalygorskitePyrophyllite
6 4 86 2 76 0 462.7oo.J
b J . /
65.4oo.c69.966.3o o c
bb.d
63.868.5
64.460.0J O . 4
58.4oJ.v
o t . o6 1 . 963.1o / . Jo t .c57 .762.8cJ .co / . I
57.0
3 .1
t .u3.2
2.02.92.92.9J C
7.03.7
- 1 1 . 8-47 1
3.52.4
- 7 .1
3.4- 1 . 9
-16 7
1 1 . 6-5.5-3.4-3.4-4.9
4.52 .1
- 3 1 . 1
2.4
4.1
9.53.23 .22.7
3.23.74 . O
8 .95 .78.32.4
-12 .6J . V
3.8
70.065.765265.668.8
69.369.069.771.86 9 968.871 .0oo.o74.0
Note. The chemical shifts and M1 values measured with respect to 1 molar A(HrO)6Cls in HrO as external reference.
WOESSNER: CHARACTERIZATION OF CLAY MINERALS BY,?AI NMR
0 0 - 4 0 0 8 0 0
207
Fig.T and
BLACKJACKBEIDELLITE
8 0 0 4 0 0
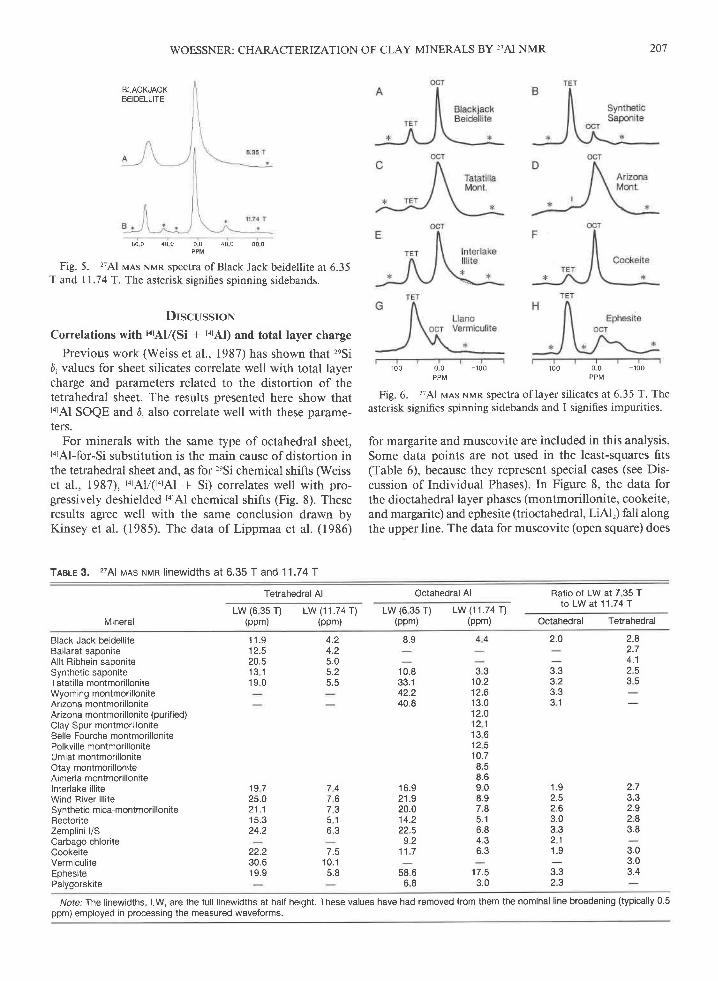
5. 27Al v-ls NMR spectra of Black Jack beidellite at 6.3511 .7 4
't. The asterisk signifies spinning sidebands.
DrscussroNCorrelations with tatAl/(Si + I4rAl) and total layer charge
Previous work (Weiss et al., 1987) has shown that,eSi6, values for sheet silicates correlate well with total layercharge and parameters related to the distortion of thetetrahedral sheet. The results presented here show thatt4rAl SOQE and D, also correlate well with these parame-ters.
For minerals with the same type of octahedral sheet,rarAl-for-Si substitution is the main cause of distortion inthe tetrahedral sheet and, as for 2eSi chemical shifts (Weisset al., 1987), I4rAV(r4rAl + Si) correlates well with pro-gressively deshielded tarAl chemical shifts (Fig. 8). Theseresults agree well with the same conclusion drawn byKinsey et al. (1985). The data of Lippmaa et al. (1986)
TaeLe 3. 27Al uns nvn l inewidths at 6.35 T and 11.741
100 0 0 -100
PPI\4100 0 0 -100
PPM
Fig. 6. 27Al uas NMR spectra of layer silicates at 6.35 T. Theasterisk signifies spinning sidebands and I signifies impurities.
for margarite and muscovite are included in this analysis.Some data points are not used in the least-squares fits(Table 6), because they represent special cases (see Dis-cussion of Individual Phases). In Figure 8, the data forthe dioctahedral layer phases (montmorillonite, cookeite,and margarite) and ephesite (trioctahedral, LiAl,) fall alongthe upper line. The data for muscovite (open square) does
Tetrahedral Al Octahedral Al Ratio of LW at 7 35 Tto LW at 11.74 T
MineralLW (6 35 r) LW (11.74 r)
(ppm) (ppm)LW (6 3s r) LW (11.74 r)
(ppm) (ppm) Octahedral Tetrahedral
Black Jack beidelliteBallarat saponiteAllt Ribhein saponiteSynthetic saponiteTatatilla montmorilloniteWyoming montmorilloniteArizona montmorilloniteArizona montmorillonite (purif ied)Clay Spur montmorilloniteBelle Fourche montmorillonitePolkville montmorilloniteUmiat montmorilloniteOtay montmorilloniteAlmeria montmorillonitelnterlake illiteWind River illiteSynthetic mica-monlmorilloniteRectoriteZemplini l/SCarbago chloriteCookeiteVermiculiteEphesitePalygorskite
2.82.7
2 53 5
2.73.32.92 83.8
3.03.03.4
1 . 92.52,63.03 32 11 . 9
3.32.3
4.24.25.05.2
1 9 725.u21.115 .324.2
22.2JU.O
19 .9
1 1 . 912.520.51 3 11 9 0
8.9
10 .833.142.240.8
16 .921.920.014.222.59.2
11 .7
58.6o.o
4 4
J O
10.212.613 .012.O1 2 11 3 61 2 510.78 .58 .69 08.91 . 6
5.16.84.3o . J
17.53.0
2.0
3.2
3 1
7 4T O
7 35 16.3
7.51 0 . 15.8
Note: The linewidths, LW, are the full linewidths at half height. These values have had removed lrom them the nominal line broadening (typically 0.5ppm) employed in processing the measured waveforms.
208 WOESSNER: CHARACTERIZATION OF CLAY MINERALS BY,?AI NMR
TABLE 5, t4lAl isotropic 27Al chemical shifts and SOQE values
6r-(ppm)
SOQE-(MHz)
Black Jack beidelliteBallarat saponiteAllt Ribhein saponiteSynthetic saponiteTatatilla montmorilloniteWyoming montmorilloniteArizona montmorillonitelnterlake illiteWind River illiteSynthetic mica-montmorilloniteRectoriteZemplini l/SCarbago chloriteCookeiteVermiculiteEphesitePalygorskite
72.268.06 8 86 8 67 0 8
2.542.563.202.902.37
3.002862 7 82.282.94
3.103.912.82
72.57 1 . 872.473.67 3 0
74.472.076.8
1 0 0 0 0 0 - 1 0 0 0PPM
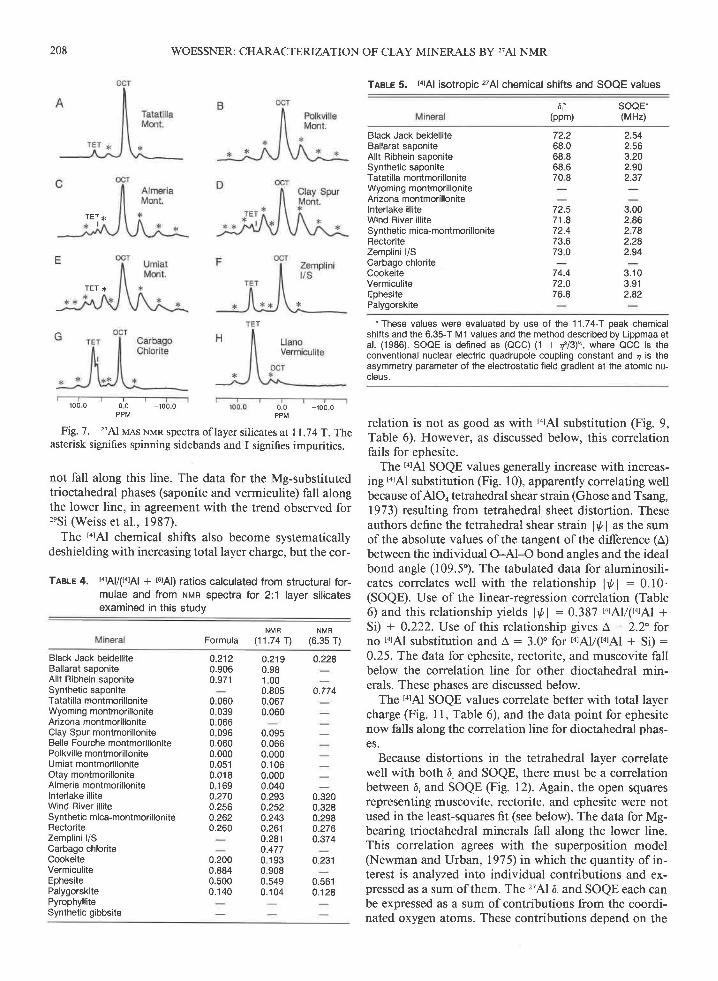
Fig. 7. 27Al ves Nrr,rn spectra of layer silicates at I 1.74 T. Theasterisk signifies spinning sidebands and I signifies impurities.
not fall along this line. The data for the Mg-substitutedtrioctahedral phases (saponite and vermiculite) fall alongthe lower line, in agreement with the trend observed for,eSi (weiss er al., 1987).
The t4rAl chemical shifts also become systematicallydeshielding with increasing total layer charge, but the cor-
Trale 4, t4rAl/(r4rAl + t6rAl) ratios calculated from structural for-mulae and from Nvn spectra for 2:1 layer silicatesexamined in this studv
N M R N M F
Formula (11.74 T) (6.35 T)
*These values were evaluated by use of the 11.74-T peak chemicalshifts and the 6.35-T M1 values and the method described by Lippmaa etaf. (1986). SOOE is defined as (OCC) (1 + n2l3)h, where OCC is theconventional nuclear electric quadrupole coupling constant and a is theasymmetry parameter of the electrostatic field gradient at the atomic nu-cteus.
relation is not as good as with tatAl substitution (Fig. 9,Table 6). However, as discussed below, this correlationfails for ephesite.
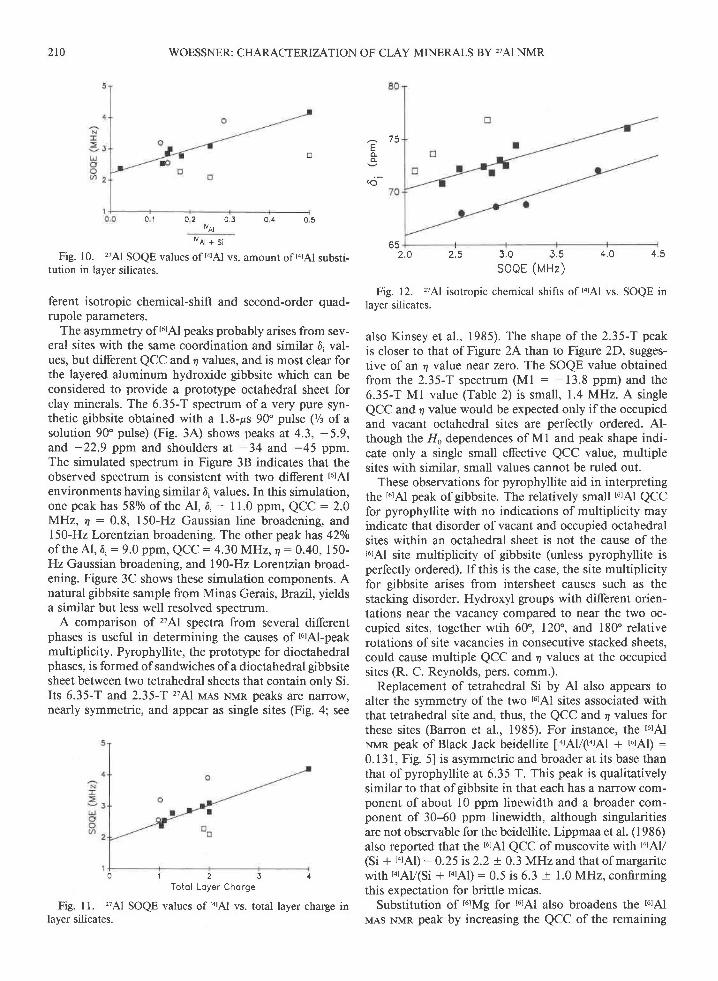
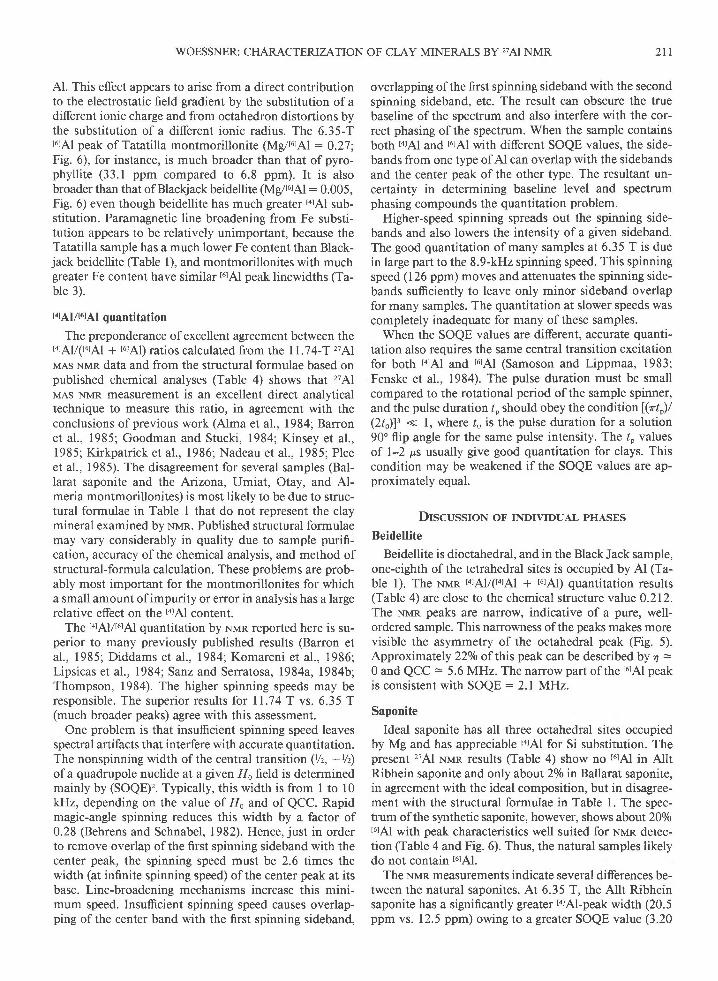
The ratAl SOQE values generally increase with increas-ing tor41 substitution (Fig. l0), apparently correlating wellbecause of AlOo tetrahedral shear strain (Ghose and Tsang,1973) resulting from tetrahedral sheet distortion. Theseauthors define the tetrahedral shear strain lry'l as the sumof the absolute values of the tangent of the difference (A)between the individual O-AI-O bond angles and the idealbond angle (109.5). The tabulated data for aluminosili-cates correlates well with the relationship l/l : 0. l0'(SOQE). Use of the linear-regression correlation (Table6) and this relationship yields lpl : 0.387 t4lAl/(4rAl +Si) + 0.222. Use of this relationship gives A : 2.2" forno tarAl substitution and A : 3.0" for t4rAy(t4lAl + Si) :0.25. The data for ephesite, rectorite, and muscovite fallbelow the correlation line for other dioctahedral min-erals. These phases are discussed below.
The talAl SOQE values correlate better with total layercharge (Fig. I l, Table 6), and the data point for ephesitenow falls along the correlation line for dioctahedral phas-es.
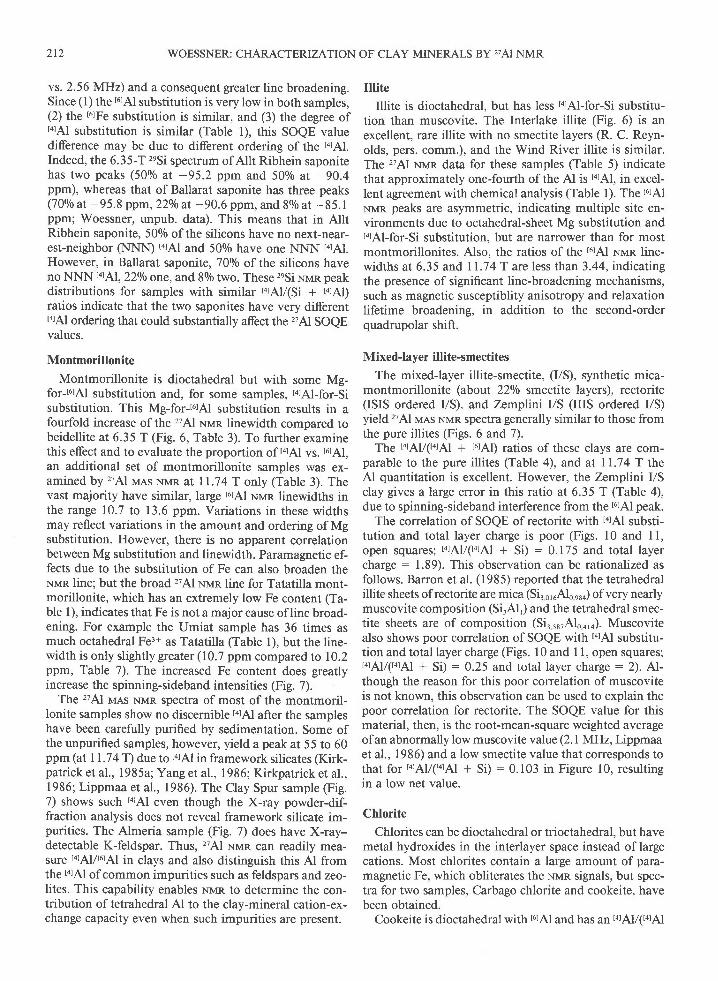
Because distortions in the tetrahedral layer correlatewell with both d, and SOQE, there must be a correlationbetween 6, and SOQE (Fig. l2). Again, the open squaresrepresenting muscovite, rectorite, and ephesite were notused in the least-squares fit (see below). The data for Mg-bearing trioctahedral minerals fall along the lower line.This correlation agrees with the superposition model(Newman and Urban, 1975) in which the quantity of in-terest is analyzed into individual contributions and ex-pressed as a sum of them. The'z7Al D, and SOQE each canbe expressed as a sum ofcontributions from the coordi-nated oxygen atoms. These contributions depend on the
0 0 - 1 0 0 0PPM
Black Jack beidelliteBallarat saponiteAllt Ribhein saponiteSynthetic saponiteTatatilla montmorilloniteWyoming montmorilloniteArizona montmorilloniteClay Spur montmorilloniteBelle Fourche montmorillonitePolkville montmorilloniteUmiat montmorilloniteOtay montmorilloniteAlmeria montmorilloniteInterlake illiteWind River illiteSynthetic mica-montmorilloniteRectoriteZemplini l/SCarbago chloriteCookeiteVermiculiteEphesitePalygorskitePyrophylliteSynthetic gibbsite
0.2120.9060.971
0 0600 0390 0660 0960.0600.0000.0510.0180 1690 2700.2560.2620.260
0.2000.8840.5000.1 40
0.2190.981.000.8050.0670.060
0.09s0.0660.0000.1 060.0000.0400 2930.2520.2430.2610.2810.4770 1930.9080.5490.1 04
0.228
o.774
0.3200.3280.2980.276o.374
0 231
0.5610.128
TET 4
TET *
WOESSNER: CHARACTERIZATION OF CLAY MINERALS BY,AI NMR 209
80
a ' e
40
^ -7q
-
70
0.2 0 .3
lvAt + si
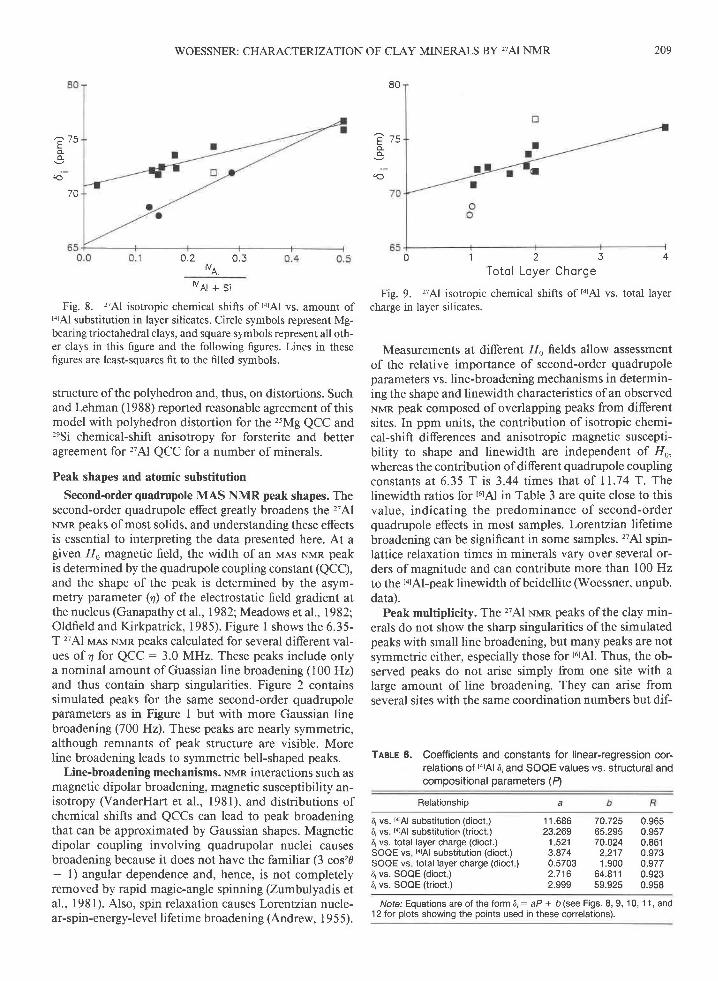
Fig. 8. 'ziAl isotropic chemical shifts of tarAl vs. amount oftarAl substitution in layer silicates. Circle symbols represent Mg-bearing trioctahedral clays, and square symbols represent all oth-er clays in this figure and the following figures. Lines in thesefigures are least-squares fit to the filled symbols.
structure ofthe polyhedron and, thus, on distortions. Suchand Lehman (1988) reported reasonable agreement of thismodel with polyhedron distortion for the ,sMg QCC and'eSi chemical-shift anisotropy for forsterite and betteragreement for'zTAl QCC for a number of minerals.
Peak shapes and atomic substitution
Second-order quadrupole MAS NMR peak shapes. Thesecond-order quadrupole effect greatly broadens the ,7Al
Nun peaks of most solids, and understanding these effectsis essential to interpreting the data presented here. At agiven tlo magnetic field, the width of an MAS Nvrn peakis determined by the quadrupole coupling constant (QCC),and the shape of the peak is determined by the asym-metry parameter (a) of the electrostatic field gradient atthe nucleus (Ganapathy etal.,1982; Meadows et al., 1982;Oldfield and Kirkpatrick, 1985). Figure I shows the 6.35-T 27Al vras NMR peaks calculated for several different val-ues of 4 for QCC : 3.0 MHz. These peaks include onlya nominal amount of Guassian line broadening (100 Hz)and thus contain sharp singularities. Figure 2 containssimulated peaks for the same second-order quadrupoleparameters as in Figure I but with more Gaussian linebroadening (700 Hz). These peaks are nearly symmetric,although remnants of peak structure are visible. Moreline broadening leads to symmetric bell-shaped peaks.
Line-broadening rnechanisms. NMR interactions such asmagnetic dipolar broadening, magnetic susceptibility an-isotropy (VanderHart et a1., l98l), and distributions ofchemical shifts and QCCs can lead to peak broadeningthat can be approximated by Gaussian shapes. Magneticdipolar coupling involving quadrupolar nuclei causesbroadening because it does not have the familiar (3 cos,d- l) angular dependence and, hence, is not completelyremoved by rapid magic-angle spinning (Zumbulyadis etal., 1981). Also, spin relaxation causes Lorentzian nucle-ar-spin-energy-level lifetime broadening (Andrew, 1 9 5 5).
0 1 2 3Toto l Loyer Chorge
Fig. 9. "Al isotropic chemical shifts of torAl
charge in layer silicates.
4
vs. total Iayer
Measurements at different 11o fields allow assessmentof the relative importance of second-order quadrupoleparameters vs. line-broadening mechanisms in determin-ing the shape and linewidth characteristics ofan observedNMR peak composed of overlapping peaks from differentsites. In ppm units, the contribution of isotropic chemi-cal-shift differences and anisotropic magnetic suscepti-bility to shape and linewidth are independent of I1o,whereas the contribution ofdifferent quadrupole couplingconstants at 6.35 T is 3.44 times that of 11.74 T. Thelinewidth ratios fort6lAl in Table 3 are quite close to thisvalue, indicating the predominance of second-orderquadrupole effects in most samples. Lorentzian lifetimebroadening can be significant in some samples. '?7Al spin-lattice relaxation times in minerals vary over several or-ders of magnitude and can contribute more than 100 Hzto the totAl-peak linewidth of beidellite (Woessner, unpub.data).
Peak multiplicity. The 27Al Nvrn peaks of the clay min-erals do not show the sharp singularities of the simulatedpeaks with small line broadening, but many peaks are notsymmetric either, especially those for 1614l. Thus, the ob-served peaks do not arise simply from one site with alarge amount of line broadening. They can arise fromseveral sites with the same coordination numbers but dif-
TABLE 6. Coefficients and constants for linear-regression cor-relations of IarAl 6i and SOQE values vs. structural andcompositional parameters (A
Relationship a
11.686 70.725 0.96523.269 65.295 0.957
1 521 70.024 0.8613.874 2 217 0.9730.5703 1.900 0.9772.716 64.811 0.9232.999 59.925 0.958
lvAI
6i vs. IqAl substitution (dioct )6i vs. talAl substitution (trioct.)D, vs. total layer charge (dioct.)SOQE vs t4rAl substitution (dioct.)SOQE vs total layer charge (dioct )d, vs. SOQE (dioct )6, vs. SOOE (trioct.)
Note.' Equations are of the form d, : aP + b (see Figs. 8, 9, 10, 1 1, and12 for plots showing the points used in these correlations).
210 WOESSNER: CHARACTERIZATION OF CLAY MINERALS BY,AI NMR
E
o 1 0 50 4U , J
"o'll 'Fig. 10. '??Al SOQE values of tarAl vs. amount of tatAl substi-
tution in layer silicates.
ferent isotropic chemical-shift and second-order quad-rupole parameters.
The asymmetry of t6tAl peaks probably arises from sev-eral sites with the same coordination and similar D, val-ues, but different QCC and 4 values, and is most clear forthe layered aluminum hydroxide gibbsite which can beconsidered to provide a prototype octahedral sheet forclay minerals. The 6.35-T spectrum of a very pure syn-thetic gibbsite obtained with a 1.8-ps 90" pulse (% of asolution 90' pulse) (Fig. 3A,) shows peaks at 4.3, -5.9,
and, -22.9 ppm and shoulders at -34 and -45 ppm.The simulated spectrum in Figure 38 indicates that theobserved spectrum is consistent with two different t6tAlenvironments having similar D, values. In this simulation,one peakhas 580/o of the Al , Dt : l l .0 ppm, QCC:2.0IsIHz, n : 0.8, 150-Hz Gaussian line broadening, and150-Hz Lorentzian broadening. The other peakhas 42o/oof the Al,6i : 9.0 ppm, QCC : 4.30MHz,q: 0.40, 150-Hz Gaussian broadening, and 190-Hz Lorentzian broad-ening. Figure 3C shows these simulation components. Anatural gibbsite sample from Minas Gerais, Brazil, yieldsa similar but less well resolved spectnrm.
A comparison of '?7Al spectra from several differentphases is useful in determining the causes of r6lAl-peakmultiplicity. Pyrophyllite, the prototlpe for dioctahedralphases, is formed of sandwiches of a dioctahedral gibbsitesheet between two tetrahedral sheets that contain only Si.Its 6.35-T and 2.35-T 27Al rvras NMR peaks are narrow,nearly symmetric, and appear as single sites (Fig. 4; see
0 1 2 3 4Totol Loyer Chorge
Fig. 11. 'A1 SOQE values of larAl vs. total layer charge inlayer silicates.
o 32 . O 2.5 3 .0 3 .5 4 .0 4 .5
SOQE (MHz)
Fig. 12. '?7Al isotropic chemical shifts of torAl vs. SOQE inlayer silicates.
also Kinsey et al., 1985). The shape of the 2.35-T peakis closer to that of Figure 2,{ than to Figure 2D, sugges-tive of an 4 value near zero. The SOQE value obtainedfrom the 2.35-T spectrum (Ml : -13.8 ppm) and the6.35-T Ml value (Table 2) is small, 1.4 MHz A singleQCC and 4 value would be expected only if the occupiedand vacant octahedral sites are perfectly ordered. Al-though the Flo dependences of Ml and peak shape indi-cate only a single small effective QCC value, multiplesites with similar, small values cannot be ruled out.
These observations for pyrophyllite aid in interpretingthe t6rAl peak of gibbsite. The relatively smallt6rAl QCCfor pyrophyllite with no indications of multiplicity mayindicate that disorder ofvacant and occupied octahedralsites within an octahedral sheet is not the cause of ther6rAl site multiplicity of gibbsite (unless pyrophyllite isperfectly ordered). If this is the case, the site multiplicityfor gibbsite arises from intersheet causes such as thestacking disorder. Hydroxyl groups with different orien-tations near the vacancy compared to near the two oc-cupied sites, together wtih 60", 120", and 180" relativerotations of site vacancies in consecutive stacked sheets,could cause multiple QCC and 4 values at the occupiedsites (R. C. Reynolds, pers. comm.).
Replacement of tetrahedral Si by Al also appears toalter the symmetry of the two I6rAl sites associated withthat tetrahedral site and, thus, the QCC and 4 values forthese sites (Barron et al., 1985). For instance, the t6tAlNrvrn peak of Black Jack beidellite [tarAy(arAl + t6rAl) :
0. 13 l, Fig. 5l is asymmetric and broader at its base thanthat of pyrophyllite at 6.35 T. This peak is qualitativelysimilar to that of gibbsite in that each has a narrow com-ponent of about l0 ppm linewidth and a broader com-ponent of 30-60 ppm linewidth, although singularitiesare not observable for the beidellite. Lippmaa et al. (1986)also reported that the I6rAl QCC of muscovite with tatAl/(Si + I.1Al) : 0.25 is 2.2 + 0.3 MHz and that of margaritewith tatAV(Si + tolAl) : 0.5 is 6.3 + 1.0 MHz, confirmingthis expectation for brittle micas.
Substitution of t6lMg for t6lAl also broadens fhs teldl
MAS NMR peak by increasing the QCC of the remaining
WOESSNER: CHARACTERIZATION OF CLAY MINERALS BY,AI NMR 2tr
Al. This effect appears to arise from a direct contributionto the electrostatic field gradient by the substitution ofadiferent ionic charge and from octahedron distortions bythe substitution of a different ionic radius. The 6.35-Tt5rAl peak of Tatatilla montmorillonite (Mg/t6rAl : 0.27;Fig. 6), for instance, is much broader than that of pyro-phyllite (33.1 ppm compared to 6.8 ppm). It is alsobroader than that of Blackjack beidellite (Myrur41 : 0.005,Fig. 6) even though beidellite has much greater t+rAl sub-stitution. Paramagnetic line broadening from Fe substi-tution appears to be relatively unimportant, because theTatatilla sample has a much lower Fe content than Black-jack beidellite (Table l), and montmorillonites with muchgreater Fe content have similar t'rAl peak linewidths (Ta-ble 3).
r4rAl/16rAl quantitation
The preponderance of excellent agreement between thet4rAl/(t4rAl + 161Al) ratios calculated from the ll.7 4-T ,7 AlMAS NMR data and from the structural formulae based onpublished chemical analyses (Table 4) shows that 'z7Al
MAS NMR measurement is an excellent direct analyticaltechnique to measure this ratio, in agreement with theconclusions of previous work (Alma et al., 1984; Barronet al., 1985; Goodman and Stucki, 1984; Kinsey et al.,1985; Kirkpatrick et al., 1986; Nadeau et al., 1985; Pleeet al., 1985). The disagreement for several samples (Bal-larat saponite and the Arizona, Umiat, Otay, and Al-meria montmorillonites) is most likely to be due to struc-tural formulae in Table I that do not represent the claymineral examined by Nrrrn. Published structural formulaemay vary considerably in quality due to sample purifi-cation, accuracy of the chemical analysis, and method ofstructural-formula calculation. These problems are prob-ably most important for the montmorillonites for whicha small amount of impurity or error in analysis has a largerelative effect on the ratAl content.
The 14rAl/16lAl quantitation by Nrran reported here is su-perior to many previously published results (Barron etal., 1985; Diddams et al., 1984; Komareni et al., 1986;Lipsicas et al., 1984; Sanz and Serratosa, 1984a, 1984b;Thompson, 1984). The higher spinning speeds may beresponsible. The superior results for 11.74 T vs. 6.35 T(much broader peaks) agree with this assessment.
One problem is that insufficient spinning speed leavesspectral artifacts that interfere with accurate quantitation.The nonspinning width of the central transition (Vz, -Vz)
of a quadrupole nuclide at a given 110 field is determinedmainly by (SOQE)'. Typically, this width is from I to l0kHz, depending on the value of I/o and of QCC. Rapidmagic-angle spinning reduces this width by a factor of0.28 (Behrens and Schnabel, 1982). Hence, just in orderto remove overlap of the first spinning sideband w'ith thecenter peak, the spinning speed must be 2.6 times thewidth (at infinite spinning speed) of the center peak at itsbase. Line-broadening mechanisms increase this mini-mum speed. Insufficient spinning speed causes overlap-ping of the center band with the first spinning sideband,
overlapping ofthe first spinning sideband with the secondspinning sideband, etc. The result can obscure the truebaseline ofthe spectrum and also interfere with the cor-rect phasing of the spectrum. When the sample containsboth tarAl and t6rAl with different SOQE values, the side-bands from one type of Al can overlap with the sidebandsand the center peak ofthe other type. The resultant un-certainty in determining baseline level and spectrumphasing compounds the quantitation problem.
Higher-speed spinning spreads out the spinning side-bands and also lowers the intensity of a given sideband.The good quantitation of many samples at 6.35 T is duein large part to the 8.9-kHz spinning speed. This spinningspeed (126 ppm) moves and attenuates the spinning side-bands sufficiently to leave only minor sideband overlapfor many samples. The quantitation at slower speeds wascompletely inadequate for many of these samples.
When the SOQE values are different, accurate quanti-tation also requires the same central transition excitationfor both I4lAl and r6tAl (Samoson and Lippmaa, 1983:,Fenske et al., 1984). The pulse duration must be smallcompared to the rotational period of the sample spinner,and the pulse duration lo should obey the condition [(zrl)/(2to)7' << l, where lo is the pulse duration for a solution90" flip angle for the same pulse intensity. The lo valuesof 1-2 ps usually give good quantitation for clays. Thiscondition may be weakened if the SOQE values are ap-proximately equal.
DrscussroN oF TNDTvTDUAL PHASES
Beidellite
Beidellite is dioctahedral, and in the Black Jack sample,one-eighth ofthe tetrahedral sites is occupied by Al (Ta-ble l). The NMR t4rAl/(t4lAl + t6lAl) quantitation results(Table 4) are close to the chemical structure value 0.212.The Nlnrn peaks are nanow, indicative of a pure, well-ordered sample. This narrowness ofthe peaks makes morevisible the asymmetry of the octahedral peak (Fig. 5).Approximately 22o/o of this peak can be described by 4 =0 and QCC = 5.6 MHz. The narrow part of the t6rAl peakis consistent with SOQE :2.1 MHz.
Saponite
Ideal saponite has all three octahedral sites occupiedby Mg and has appreciable I4rAl for Si substitution. Thepresent 2'Al Nun results (Table 4) show no t6lAl in AlltRibhein saponite and only about2o/o in Ballarat saponite,in agreement with the ideal composition, but in disagree-ment with the structural formulae in Table l. The spec-trum of the synthetic saponite, however, shows about 200lor6rAl with peak characteristics well suited for Nun detec-tion (Table 4 and Fig. 6). Thus, the natural samples likelydo not contain 16rAl.
The Nvrn measurements indicate several differences be-tween the natural saponites. At 6.35 T, the Allt Ribheinsaponite has a significantly greater IotAl-peak width (20.5ppm vs. 12.5 ppm) owing to a greater SOQE value (3.20
2r2 WOESSNER: CHARACTERIZATION OF CLAY MINERALS BY,AI NMR
vs. 2.56 MHz) and a consequent greater line broadening.Since (l) the t5tAl substitution is very low in both samples,(2) the t6rFe substitution is similar, and (3) the degree oftorAl substitution is similar (Table l), this SOQE valuedifference may be due to different ordering of the tatAl.Indeed, the 6.35-T 2eSi spectrum ofAllt Ribhein saponitehas two peaks (500/o at -95.2 ppm and 50o/o at -90.4ppm), whereas that of Ballarat saponite has three peaks(7 0o/o at - 9 5. 8 ppm, 22o/o at - 90.6 ppm, and 8o/o at - 8 5. Ippm; Woessner, unpub. data). This means that in AlltRibhein saponite, 500/o of the silicons have no next-near-est-neighbor (NNI.O t4rAl and 500/o have one NNN tatAl.However, in Ballarat saponite, 700/o of the silicons haveno NNN t4t{l,22o/o one, and 80/o two. These reSi NMR peakdistributions for samples with similar I4rAy(Si + IorAl)ratios indicate that the two saponites have very differentt4rAl ordering that could substantially affect the ,?Al SOQEvalues.
Montmorillonite
Montmorillonite is dioctahedral but with some Mg-for-t6rAl substitution and, for some samples, talAl-for-Sisubstitution. This Mg-for-r6tAl substitution results in afourfold increase of the ,7Al Nvrn linewidth compared tobeidellite at 6.35 T (Fig. 6, Table 3). To further examinethis effect and to evaluate the proportion of talAl vs. 1614l,an additional set of montmorillonite samples was ex-amined by "Al MAS NMR at 11.74 T only (Table 3). Thevast majority have similar, Iarge t6lAl Nrvrn linewidths inthe range 10.7 to 13.6 ppm. Variations in these widthsmay reflect variations in the amount and ordering of Mgsubstitution. However, there is no apparent correlationbetween Mg substitution and linewidth. Paramagnetic ef-fects due to the substitution of Fe can also broaden theNnrn line; but the broad ,?Al Nnrn line for Tatatilla mont-morillonite, which has an extremely low Fe content (Ta-ble l), indicates that Fe is not a major cause of line broad-ening. For example the Umiat sample has 36 times asmuch octahedral Fe3+ as Tatatilla (Table l), but the line-width is only slightly greater (10.7 ppm compared to 10.2ppm, Table 7). The increased Fe content does greatlyincrease the spinning-sideband intensities (Fig. 7).
The 'z7Al MAs NMR spectra of most of the montmoril-lonite samples show no discernible tarAl after the sampleshave been carefully purified by sedimentation. Some ofthe unpurified samples, however, yield a peak at 55 to 60ppm (at ll.7 4T) due to lalAl in framework silicates (Kirk-patrick et al., 1985a; Yang et al., 1986 Kirkpatrick et al.,1986; Lippmaa et al., 1986). The Clay Spur sample (Fig.7) shows such tarAl even though the X-ray powder-dif-fraction analysis does not reveal framework silicate im-purities. The Almeria sample (Fig. 7) does have X-ray-detectable K-feldspar. Thus, 27Al NMR can readily mea-suls t+lfil/rordl in clays and also distinguish this Al fromthe t4rAl of common impurities such as feldspars and zeo-lites. This capability enables NMR to determine the con-tribution of tetrahedral Al to the clay-mineral cation-ex-change capacity even when such impurities are present.
Illite
Illite is dioctahedral, but has less IarAl-for-Si substitu-tion than muscovite. The Interlake illite (Fig. 6) is anexcellent, rare illite with no smectite layers (R. C. Reyn-olds, pers. comm.), and the Wind River illite is similar.The 'z?Al Nrrrn data for these samples (Table 5) indicatethat approximately one-fourth of the Al is tarAl, in excel-lent agreement with chemical analysis (Table l). The t6rAl
Nun peaks are asymmetric, indicating multiple site en-vironments due to octahedral-sheet Mg substitution andr4lAl-for-Si substitution, but are narrower than for mostmontmorillonites. Also, the ratios of the rulAl xr"rn line-widths at 6.35 and | | .7 4 T are less than 3.44, indicatingthe presence of significant line-broadening mechanisms,such as magnetic susceptiblity anisotropy and relaxationlifetime broadening, in addition to the second-orderquadrupolar shift.
Mixed-layer illite-smectites
The mixed-layer illite-smectite, (I/S), synthetic mica-montmorillonite (about 22o/o smectite layers), rectorite(ISIS ordered I/S), and Zemplini I/S (IIIS ordered I/S)yield "Al MAS NMR spectra generally similar to those fromthe pure illites (Figs. 6 and 7).
The t4lAl/(4rAl + rrAl) ratios of these clays are com-parable to the pure illites (Table 4), and at 11.74 T theAl quantitation is excellent. However, the Zemplini I/Sclay gives a large error in this ratio at 6.35 T (Table 4),due to spinning-sideband interference from the rutAl peak.
The correlation of SOQE of rectorite with torAl substi-tution and total layer charge is poor (Figs. l0 and ll,open squares' I4rAl/(t4rAl + si) : 0. 175 and total layercharge : 1.89). This observation can be rationalized asfollows. Barron et al. (1985) reported that the tetrahedralillite sheets of rectorite are mica (Si, o,uAlo nr*) of very nearlymuscovite composition (Si3Al,) and the tetrahedral smec-tite sheets are of composition (SirrrrAloo,o). Muscovitealso shows poor correlation of SOQE with rotAl substitu-tion and total layer charge (Figs. I 0 and I l, open squares;r4rAy(t4rAl + Si) : 0.25 and total layer charge : 2). Al-though the reason for this poor correlation of muscoviteis not known, this observation can be used to explain thepoor correlation for rectorite. The SOQE value for thismaterial, then, is the root-mean-square weighted averageofan abnormally low muscovite value (2.lMHz, Lippmaaet al., 1986) and a low smectite value that corresponds tothat for r4rAl/(4rAl + Si):0. 103 in Figure 10, resultingin a low net value.
Chlorite
Chlontes can be dioctahedral or trioctahedral, but havemetal hydroxides in the interlayer space instead oflargecations. Most chlorites contain a large amount of para-magnetic Fe, which obliterates the Nvn signals, but spec-tra for two samples, Carbago chlorite and cookeite, havebeen obtained.
Cookeite is dioctahedral with t6rAl and has an l4lAl/(r4rAl
WOESSNER: CHARACTERIZATION OF CLAY MINERALS BY,AI NMR 2t3
+ Si) ratio of 0.25. The hydroxide interlayer is triocta-hedral with two aluminums and one Li. The 6, '??Al fort4rAl in cookeite is 74.4 ppm, 1.9 to 3.6 ppm more de-shielded than for the illites and montmorillonites. Thisincreased deshielding is predominantly due to the in-creased t4tAI substitution (filled square in Fig. 8; t4rAVI4lAl+ Si) : 0.25), but may be in part due to the Li in theinterlayer (Weiss et al., 1987).
The t6rAl Nrln peak for cookeite is symmetric, even at6.35 T (Fig. 6), indicating similar environments for thet6lAl in the octahedral and hydroxide layers.
The Carbago chlorite sample has l0 to 20o/o sodic pla-gioclase impunty that is responsible for the 60.7-ppmpeak in the ll.'74-T spectrum (Fig. 7). A structural for-mula for the Carbago chlorite is not available, but the(001) X-ray powder-diffraction intensities indicate thatthis material is a magnesium chlorite. The 71 ppm '?7Al
6, for this sample is 3-4 ppm more shielded than that ofcookeite, probably owing to the trioctahedral Mg in theinterlayer.
Vermiculite
Vermiculite is trioctahedral (like saponite) with somer6lAl-for-Mg substitution, a large amount of totAl-for-Sisubstitution, and Mg in the interlayer. The "Al NMR spec-tra of Llano vermiculite (Figs. 6 and 7) yield a l4rAl/(r4rAl+ t6rAl) ratio in agreement with chemical analysis (Table4). The large t4rAl rlun linewidth (30.6 ppm at 6.35 T,Table 3) is the result of a relatively large SOQE value(3.91 MHz, Table 6). This large SOQE value and the "AlD, value, which is 3.5 ppm less shielded than that of sapo-nite (Table 5), probably reflect the greater tarAl substitu-tion (Fig. 8, filled circle; t4rAv(r4rAl + Si) : 0.285).
Ephesite
Ephesite, like margarite, is a brittle mica with one-halfof the tetrahedral positons occupied by Al. However, un-like either muscovite or margarite, it is trioctahedral withtwo aluminums and one Li in the octahedral sites andNa instead of Ca in the interlayer.
The t6lAl MAS NMR peak of ephesite is broad and showsstructure (Fig. 6) that can be simulated with the param-eters d, : 10.4 ppm, QCC : 5.7 MHz, and4:0.3. Theseparameters are similar to those reported for margarite (6,: l1 + 4 ppm, QCC: 6.3 + 1.0 MHz, and ?: 0. I +0.1; Lippmaaet al., 1986). This similarity shows that thefilling of the octahedral vacancies by the Li has only aminor affect on the I6lAl NMR parameters.
The failure of the totAl chemical shift of ephesite to fallalong the correlation line for trioctahedral phases (Fig. 9)can be rationalized by noting that an octahedral site oc-cupied by Li is the same size as the vacancy (Bailey, 1980).Thus, it should not affect the tetrahedral sheet distortion,and, thus, the torAl chemical shift should fall along thecorrelation line for dioctahedral minerals as observed [Fig.8, upper filled square; t4rAl/r4rAl + Si) : 0.51. The tatAl D'for ephesite does not fall along the correlation ofdiocta-hedral phases with total layer charge (open square, Fig.
9). Ifthe layer charge is doubled (to counteract the chargedue to the Li substitution), however, this point falls onthe correlation. Therefore, the effect oftotal layer chargeon 6, is due to lattice distortion, and the Li charge sub-stitution (which does not distort the lattice) has little ef-fect on d,. The'zeSi MAS NMR spectrum supports these con-clusions. The 'zeSi D, for ephesite is -75.9 ppm, whereasthat for margarite is -75.5 ppm, indicating similar tet-rahedral distortions (Woessner, unpub. data).
The talAl SOQE value of ephesite correlates well withtotal layer charge (Fig. I l, lower filled square; total layercharge : 2) but poorb with IorAI substitution [open squareat l4rAy(r4rAl + SD : 0.5, Fig. 101. The data for margaritecorrelate well with both. Thus, the change in charge dis-tribution resulting from octahedral Li substitution coun-teracts part of the SOQE value resulting from tetrahedralsheet distortion.
The value of 550/o for t4rAl/(t4rAl + t6rAl) determined byNrrrn is close to the value for "ideal" ephesite.
Palygorskite
Palygorskite (formerly called attapulgite) is composedof 2:l ribbons that are linked to each other laterally bysingle basal oxygens. There are five cation positions acrossthe octahedral strip, but all are not necessarily occupied.There is little torAl. In the sample examined, 1.96 octa-hedral sites are filled by Mg and 1.29 by Al. The t6rAl ve.slwn peak is unusual, because it is symmetric and at near-ly the same ppm value at all three 110 field strengths.Thus, the SOQE value is small (0.9 MHz), and d', : 5.5ppm. The SOQE value is the smallest known for clayminerals, indicating that the A106 tetrahedra are very reg-ular. The peaks have relatively long tails, similar in shapeto Figure 2D, indicating an 4 value near l.
Conqcr.usroNs
Magic-angle-spinning "Al NMR at high 110 magnetic fieldstrengths provides a means of characterizing 2:l clayminerals on the basis of the local chemical and structuralenvironment ofthe Al atoms. The isotropic chemical shiftsand nuclear electric quadrupole coupling values increasewith the tetrahedral lattice distortion arising from in-creasing t4tAl substitution and total layer charge. This cor-relation agrees with the findings of Such and Lehman(1988) that QCC and anisotropy of the chemical shift aredetermined largely by the distortion of the first coordi-nation sphere of the central ion. The quadrupole couplingcan also be affected by a direct electrostatic interactionwith ionic charges (Villa and Bjorkstam, 1983).
The chemical-shift difference between I4rAl in clays andframework silicate impurities such as feldspars, glasses,and zeolites enables determination of clay t4rAl/t6rAl evenwhen such contaminants are present. Excellent quanti-tation of ratAl/t6rAl is possible under the above conditions.This ability can be important for the calculation of claystructural formulae, especially when used in conjunctionwith absolute Al quantitation (Kirkpatrick et al., 1986).Chemical analysis gives the total, overall elemental com-
214
position of the sample. The usual method of structural-formula calculation of a 2:l layer involves assigning allof the Si to the tetrahedral layer and then apportioningenough Al to bring the total tetrahedral cations to 8. Sincethe number of silicons in a montmorillonite is typically7.5-8, contaminants can readily cause elror in this meth-od. Even when no contaminant is present, a lolo error inSi analysis would result in a minimum 150/o relative errorin the talAl content. Nvrn has a distinct advantage for suchdeterminations. In particular, it is a direct and sensitivetechnique (Nadeau et al, 1985) compared to the otherwisecomplex procedures for distinguishing montmorillonitefrom beidellite (Malla and Douglas, 1987) and for deter-mining the tetrahedral-layer charge (Nadeau and Bain,l 986) .
The broad asymmetric I6lAl Nun peak of many 2:l clayminerals indicates multiple octahedral-site environmentsthat differ mainly in SOQE value. The site differences aresensitive to I4rAl substitution and especially to octahedral-sheet Mg substitution. Multiple-I/o-strength 27Al rrlAs rtunmeasurements with ultra-high speed spinning should beuseful in studies of t6lAl-site environments. The effects ofMg substitution are complicated, as shown by the lack ofcorrelation between t6lAl Nun peak linewidth and amountof Mg substitution. The peak linewidth may be a com-plicated function of the amount of Mg substitution andthe ordering ofthe site substitutions. Since the peaks fromthe various t6rAl-site environments may not be resolved,the use of Ml values may be informative.
AcxNowmocMENTS
I acknowledge W S. Callaway, J T. Edwards, J B. Higgins, R. C.Reynolds, and S. E. Sommer for samples and information on clay min-eralogy. J. T Edwards characterized the samples by X-ray powder dif-fraction. I am especially thankful for the stimulating discussions with L.B Alemany, J G. Bendoraitis, L. Green, and J. C. Trewella at the Riv-erside Conference Center conceming the ubiquity of albite The sugges-tions of R J Kirkpatrick, J. T. Edwards, and R. C. Reynolds resulted ina significant improvement of the original manuscript.
RarnnnNcos crrnoAlma, N.C.M., Hays, G.R., Samoson, A.V, and Lippmaa, E T. (1984)
Characterization of synthetic dioctahedral clays by solid-state silicon-29 and aluminum-27 nuclear magnetic resonance spectrometry. Ana-lytical Chemistry, 56, 729-733.
Anderson, D M., and Reynolds, R.C. (1966) Umiat bentonite: An unusualmontmorillonite from Umiat, Alaska. American Mineralogrst, 5 1, 1 443-1456.
Andrew, E,R. (1955) Nuclear magnetic resonance, 120 p. University Press,Cambridge
Bailey, S.W. (1980) Structures of layer silicates. In G.W. Brindley and G.Brown, Eds., Crystal.structures of clay minerals and their X-ray iden-tification, p. l-123 Mineralogical Society, London
Barron, P.F., Slade, P., and Frost, R L. (1985) Ordering ofaluminum intetrahedral sites in mixedlayer 2:l phyllosilicates by solid-state high-resolution NMR. Joumal of Physical Chemistry, 89, 3880-3885
Behrens, H.-J., and Schnabel, B ( I 982) The second-order infl uence of thenuclear quadrupole interaction on the central line in the NMR ofquad-rupolar nulcei using rapid sample spinning. Physica, I l4B, 185-190.
Bradley, W.F. (1940) The structural scheme of attapulgite. AmericanMineralogist, 25, 405410.
Callaway, W.S., III, and McAtee, J.L., Jr. (1985) Magneric susceptibilitiesof representative smectites. American Mineralogist, 70, 996-1003.
WOESSNER: CHARACTERIZATION OF CLAY MINERALS BY 2?AI NMR
Diddams, P A., Thomas, J.M., Jones, W., Ballentine, J A., and Purnell,J H. (1984) Synthesis, characterization, and catalytic activity of bei-dellite-montmorillonite layered silicates and their pillared analogues.Joumal of the Chemical Society, Chemical Communications, 1340-1342
Fenske, D., Freude, D., Frohlich, T., and Haase, J. (1984) NMR intensitymeasurements of half-integer quadrupole nuclei. Chemical Physics Let-ters. I I l. 17 l-17 5.
Ganapathy, S., Schramm, S., and Oldfield, E. (1982) Variable-angle sam-ple-spinning high-resolution NMR of solids. Joumal of Chemical Phys-ics, 77, 43604365.
Ghose, S., and Tsang, T. (1973) Structural dependence of quadrupolecoupling constant e2qQ/h for 21 Al and crystal field parameter D for Fe3+in aluminosilicates American Mineralogist, 58, 748-755.
Goodman, B.A, and Stucki, J.W. (1984) The use of nuclear magneticresonance (NMR) for the determination of tetrahedral aluminum inmontmorillonite- Clay Minerals, 19, 663-667
Hafner, S , and Hartmann, P. (l 964) Electrische feldgradienten und sauer-stoff-polarisierbarkeit in alkali-feldspaten (NaAlSi,O, und KalSi,Or).Helvetica Physica Acta, 37, 348-360.
Hower, J., and Mowatt, T.C. (1966) The mineralogy of illites and mixedlayer illite/montmorillonites. American Mineralogist, 5 l, 825-854.
Kinsey, R.A , Krrkpatrick, R J., Hower, J., Smith, K.A., and Oldfield, E.(1985) High resolution aluminum-27 and silicon-29 nuclear magneticresonance spectroscopic study oflayer silicates, including clay minerals.American Mineralogist, 7 0, 537 -5 48.
Kirkpatrick, R J., Kinsey, R A , Smith, K.A., Henderson, D.M , and Old-field, E. (1985a) High resolution solid-state sodium-23, aluminum-27,and silicon-29 nuclear magnetic resonance spectroscopic reconnars-sance of alkali and plagioclase feldspars. American Mineralogist, 70,106- l 23.
Kirkpatrick, R.J., Smith, K.A., Schramm, S., Turner, G., and Yang,W.-H. (1985b) Solid-state nuclear magnetic resonance spectroscopy ofminerals. Annual Reviews of Earth and Planetary Sciences, 13,2947.
Kirkpatrick, R J., Oestrike, R, Weiss, C.A., Jr., Smith, K.A., and Old-field, E. (1986) High-resolution '??Al and DSi NMR spectroscopy ofglasses and crystals along the join CaMgSirO6-CaAlrSiO6 AmericanMineralogist, 1 l, 705-7'l l.
Komareni, S., Fyfe, C.A, Kennedy, G.J., and Strobl, H (1986) Charac-terization of synthetic and naturally occurring clays by '??Al and "Simagic-angle spinning NMR spectroscopy. Journal of the American Ce-ramic Society, 69, C-45-C-47
Lippmaa, E, Samoson, A., and Magi, M. (1986) High-resolution 2?Al
NMR of aluminosilicates. Joumal of the American Chemical Society,108 , 1730 -1735 .
Lipsicas, M., Raythatha, R H , Pinnavaia, T.J., Johnson, I D., Giese Jr,R F., Costanzo, P M., and Robert, J.-L. (1984) Silicon and aluminumsite distributions in 2:1 layered silicate clays. Nature, 309, 604-607.
Mackenzie, R.C. (1957) Saponite from Allt Ribhein, Fiskavaig Bay, Skye.Mineralogical Magazine, 31, 67 2-680.
-(1960) The evaluation of clay mineral composition with particularreference to smectites. Silicates Industry, 25, 12-18, 7 l-7 5.
Malla, P B , and Douglas, L.A (1987) Problems in identification of monl-morillonite and beidellite. Clays and Clay Minerals, 35,232-236.
Meadows, M D., Smith, K.A , Kinsey, R.A , Rothgeb, T M., Skarjune,R P., and Oldfield, E. (1982) High-resolution solid-s*gte NMR of quad-rupolar nuclei Proceedings of the National Academy of Sciences, 79,1 3 5 1 - 1 3 5 5
Nadeau, P H., and Bain, D.C. (1986) Composition of some smectites anddiagenetic illitic clays and implications for their origin. Clays and ClayMinerals. 34,455464.
Nadeau, PH., Farmer, VC, McHardy, W.J, and Bain, D.C. (1985)Compositional variations of the Untemrpsroth beidellite. AmericanMineralogist, 70, 1004-1010.
Newman, D J., and Urban, W. (1975) Interpretation of S-state ion E.P.R.spectra Advances in Physics, 24,793-844.
Oldfield, E., and Kirkpatrick, R.J. (1985) High-resolution nuclear mag-netic resonance of inorganic solids. Science, 227, 1537 -1544.
Plee, D., Borg, F, Gatineau, L., and Fripiat, J.J (1985) High resolutionsolid-state '?7Al and 2eSi nuclear magnetic resonance study of pillaredclays. Joumal ofthe American Chemical Society, 107, 2362-2369.
Samoson, A. and Lippmaa, E (1983) Excitation phenomena and lineintensities in high-resolution NMR powder spectra of half-integerquadrupolar nuclei. Physical Review B, 28,6567-6570
Sanz, J., and Serratosa, J M (1984a) Distinction oftetrahedrally and oc-tahedrally coordinated Al in phyllosilicates by NMR spectroscopy. ClayMinerals, 19, I l3- l I 5
-(1984b) "Si and 'Al high-resolution MAS-NMR spectra of phyl-
losilicates Joumal of the Amerjcan Chemical Society, 106, 47904793Schaller, WT, Maxwell, KC, and Fleischer, M. (1967) Ephesite,
Na(LiAlr)(AlrSir)O,o(OH),, a trioclahedral member of the margaritegroup, and related brittle micas American Mineralogist, 52, 1689-1 696
Schultz, L G (l 969) Lithium and potassium absorption, dehydroxylationtemperature, and structural water content ofaluminous smectites. Claysand CIay Minerals, 17, ll5-149
Shirozu, H., and Bailey, S W. (1966) Crystal structure of a two-layer Mg-vermiculite American Mineralogist, 5 l, | 124-l | 43.
Shulepov, YuV., Litovchenko, A.S, Melnikov, A.A., Proshko, V. Ya.,and Kulik, V.V. (1983) The effects ofquadrupole splitting ofthe central'??Al NMR line in polycrystalline kaolinite Joumal of Magnetic Reso-n a n c e , 5 3 , 1 7 8 - 1 8 6
Such, K.P., and Lehman, G. (1988) Superposition analysis of'?eSi and':5Mg NMR data for forsterite MgrSiOo. Chemical Physics Letters, 143,463466
215
Thompson, J.G. (1984)'?eSi and "Al nuclear magnetic resonance spec-
troscopy of2:1 clay minerals. Clay Minerals, 19,229-236'VanderHart. D.L., Earl, W.L, and Garroway, A N. (1981) Resolution in
I3C NMR of organic solids using high-power proton decoupling and
magic-angle sample spinning. Journal ofMagnetic Resonance, 44, 36 l-
401 .Van Olphen, H, and Fripiat, J.J (l 979) Data handbook for clay minerals
and other non-metallic minerals. Pergamon Press, Oxford.Villa, Marco, and Bjorkstam, J L. (1983) Structure and'?TAl NMR spectra
in B-aluminas. Joumal of Magnetic Resonance, 51, 349-360.Weiss. CA.. Jr., Altaner, S P., and Kirkpatrick, R.J (1987) High-reso-
lution "Si NMR spectroscopy of 2: I layer silicates: Correlations among
chemical shift. structural distortions, and chemical variations Ameri-
can Mineralogist, 7 2, 935-9 42Yang, W.-H., Kirkpatrick, R.J., and Henderson, D.M. (1986) High-res-
olution '?eSi, "Al, and 'rNa NMR spectroscopic study of Al-Si disor-
dering in annealed albite and oligoclase American Mineralogist, 71,
7 t2-1 26.Zumbulyadis, N., Henrichs, P.M, and Young, R H. (1981) Quadrupole
effects in the magic-angle-spinning spectra of spin-72 nuclei. Joumal of
Chemical Physics, 75, 1603-l6l l.
Mrrr-rscnrr"r REcEtvED Ocrosen 9, 1987MlNuscnrpr AccEprED Ocrosen 7, 1988
WOESSNER: CHARACTERIZATION OF CLAY MINERALS BY,AI NMR