Embed Size (px)
Citation preview
1
NTT Communications
Cloudⁿ
Monitoring
(VPC Type OpenNW)
Operation Manual
Ver.1.0
Any secondary distribution of this material (distribution, reproduction,
provision, etc.) is prohibited.

2
Version no. Revision date Revision details
Ver.1.0 25/3/2014 Created 1st draft
3
1. Introduction P4 1) Service Overview
2) What You’ll Need
3. Using Cloudn Monitoring P7 1) Displaying the Metrics Graph
2) Configuring Alarms
3) Editing Alarms
4) Deleting Alarms
2. Preparing for Monitoring Service P6 1) Launching the Monitoring Console
Table of Contents
Cloudn Monitoring is a monitoring service provided by Cloudn to watch over the state of
Cloudn Compute, Cloudn Load Balancing Advanced (LBA) and other Cloudn services. With
Cloudn Monitoring, you can easily monitor metrics like system load and network traffic to
manage your service.
You can also configure alarms that will alert you based on whether a metric’s data point goes
over or under a certain threshold. Alarms can be configured to notify you via email as well as
be a trigger for your Cloudn AutoScaling autoscale group activities.
This manual will explain basic operations that can be done through the Cloudn Monitoring
console like how to display metric graphs and configure alarms. If you have any questions,
please contact us through the Support Portal which can be accessed from the main Cloudn
Portal.
The major features of this service are:
Cloudn Compute Monitoring
Monitors the virtual server’s CPU utilization, disk I/O, and amount of net transfer (in 5
minute intervals).
Cloudn Compute Data Disk Monitoring
Monitors the disk I/O of the data disk added to the virtual server (in 5 minute intervals).
Cloudn LBA Monitoring
Monitors the number of request to the load balancer as well as the status of the load
balanced virtual servers (in 1 minute intervals).
Cloudn AutoScaling Monitoring
Monitors the number of virtual servers belonging to a Cloudn AutoScaling autoscale group,
as well as the number of InService / Pending / Terminating servers (in 1 minute intervals).
Alarms
Can be configured to notify you by email when the specified resource’s metric goes over or
under the set threshold. Can also be used to trigger an autoscaling group to scale in or out.
Custom Metrics
Allows users to add their own “custom” metrics to their Monitoring service. If you want to
monitor metrics beyond the standard menu, this service is for you.
1-1) Service Overview
4
“Cloudn Service Guide” mail
Make sure you have your “Cloudn Service Guide” on hand, which was delivered to
you when you first signed up for Cloudn.
Internet connection service
You must be signed up for an internet connection service.
ex) OCN Dial Access Service, OCN ADSL Connection Service, Super OCN or any other 24-hour internet connection service
Note: You can use other Internet service providers.
If a proxy server is used in your environment, check that https (port 443) is open.
5
Device for internet connection
Check that PCs, modems, and other devices necessary for internet / intranet
connection are in place.
Make sure you have the following before using Cloudn Monitoring:
You cannot use Cloudn Monitoring for virtual servers created on Compute (VLAN
Type).
1-2) What You’ll Need
6
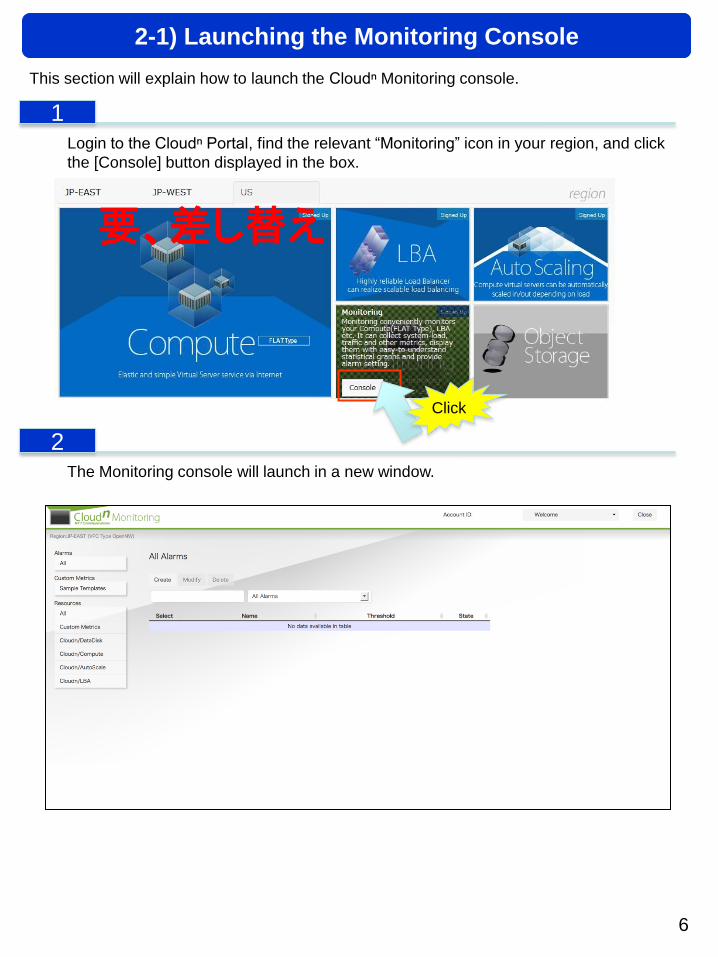
This section will explain how to launch the Cloudⁿ Monitoring console.
The Monitoring console will launch in a new window.
Login to the Cloudⁿ Portal, find the relevant “Monitoring” icon in your region, and click
the [Console] button displayed in the box.
1
2
Click
2-1) Launching the Monitoring Console
要、差し替え
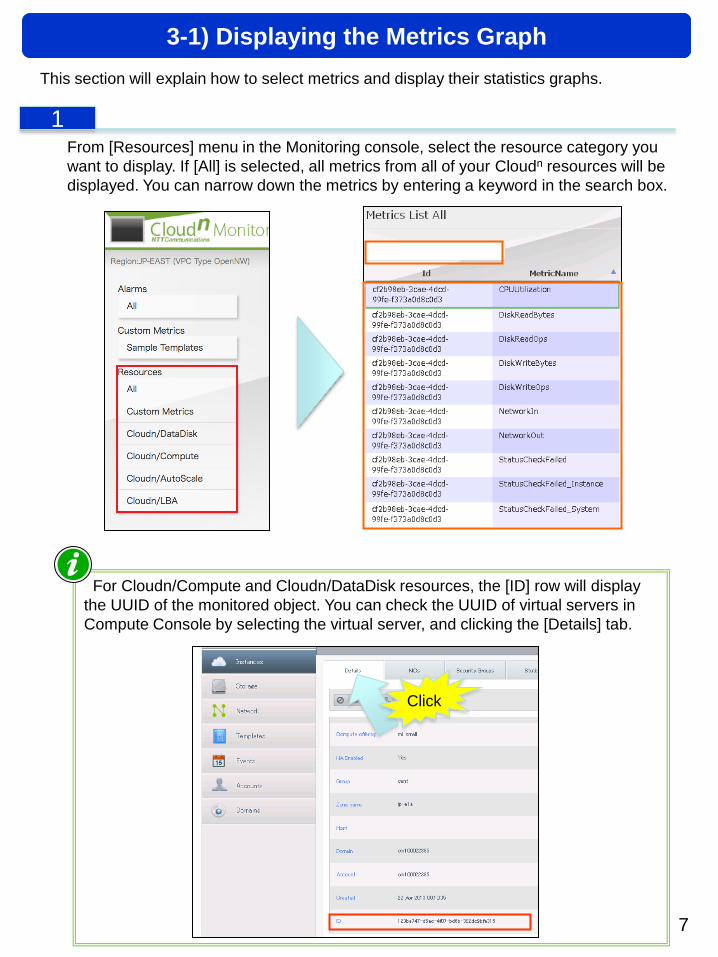
This section will explain how to select metrics and display their statistics graphs.
From [Resources] menu in the Monitoring console, select the resource category you
want to display. If [All] is selected, all metrics from all of your Cloudn resources will be
displayed. You can narrow down the metrics by entering a keyword in the search box.
1
7
Click
For Cloudn/Compute and Cloudn/DataDisk resources, the [ID] row will display
the UUID of the monitored object. You can check the UUID of virtual servers in
Compute Console by selecting the virtual server, and clicking the [Details] tab.
3-1) Displaying the Metrics Graph
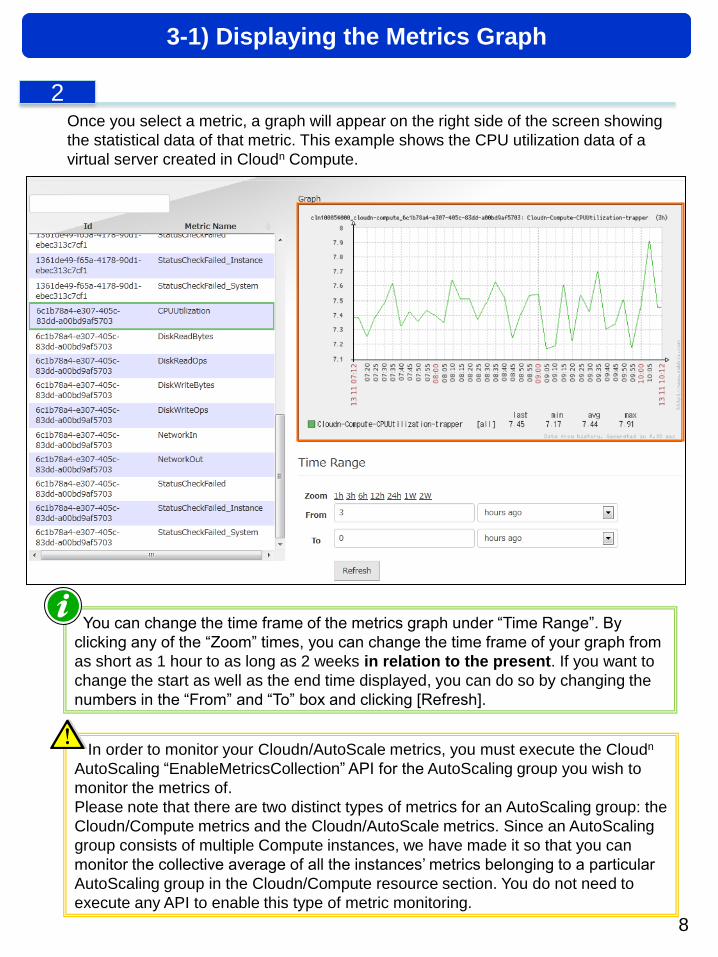
Once you select a metric, a graph will appear on the right side of the screen showing
the statistical data of that metric. This example shows the CPU utilization data of a
virtual server created in Cloudn Compute.
2
8
You can change the time frame of the metrics graph under “Time Range”. By
clicking any of the “Zoom” times, you can change the time frame of your graph from
as short as 1 hour to as long as 2 weeks in relation to the present. If you want to
change the start as well as the end time displayed, you can do so by changing the
numbers in the “From” and “To” box and clicking [Refresh].
3-1) Displaying the Metrics Graph
In order to monitor your Cloudn/AutoScale metrics, you must execute the Cloudn
AutoScaling “EnableMetricsCollection” API for the AutoScaling group you wish to
monitor the metrics of.
Please note that there are two distinct types of metrics for an AutoScaling group: the
Cloudn/Compute metrics and the Cloudn/AutoScale metrics. Since an AutoScaling
group consists of multiple Compute instances, we have made it so that you can
monitor the collective average of all the instances’ metrics belonging to a particular
AutoScaling group in the Cloudn/Compute resource section. You do not need to
execute any API to enable this type of metric monitoring.
9
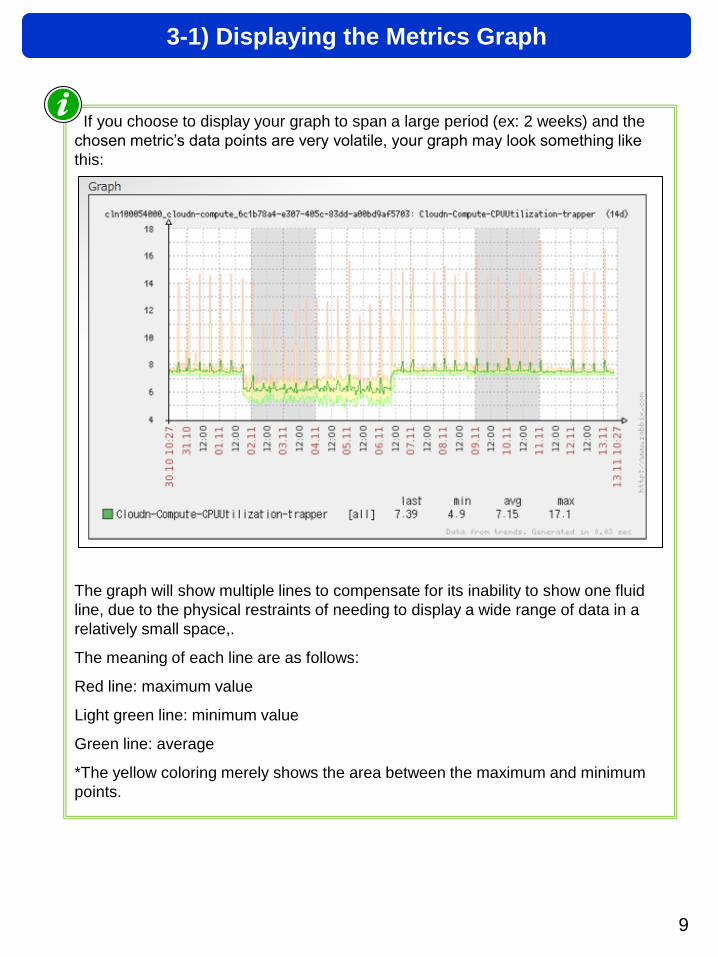
If you choose to display your graph to span a large period (ex: 2 weeks) and the
chosen metric’s data points are very volatile, your graph may look something like
this:
The graph will show multiple lines to compensate for its inability to show one fluid
line, due to the physical restraints of needing to display a wide range of data in a
relatively small space,.
The meaning of each line are as follows:
Red line: maximum value
Light green line: minimum value
Green line: average
*The yellow coloring merely shows the area between the maximum and minimum
points.
3-1) Displaying the Metrics Graph
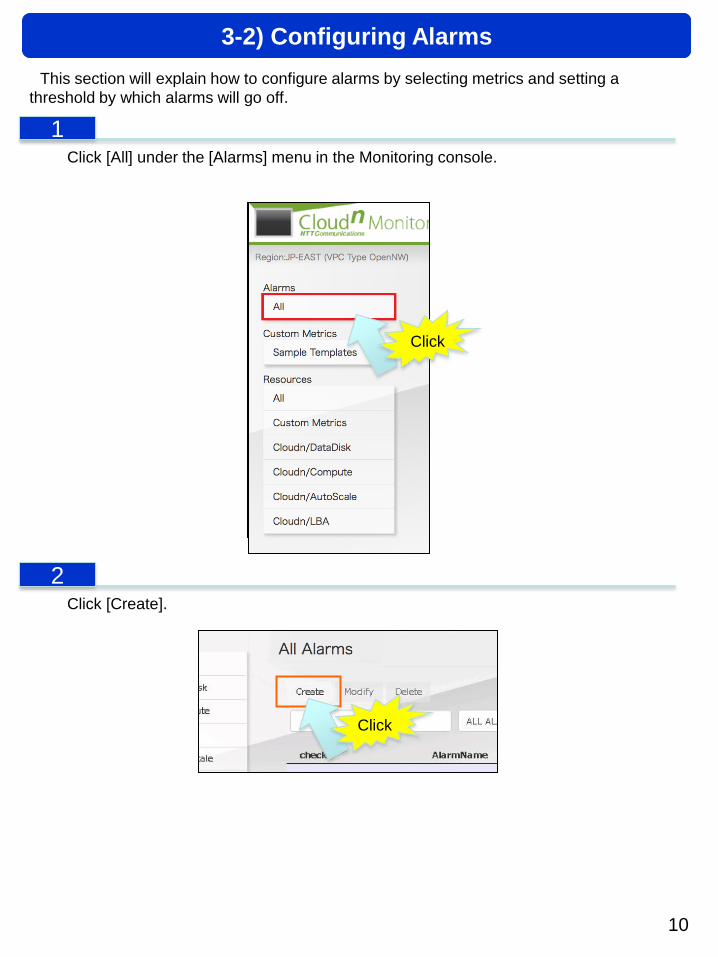
This section will explain how to configure alarms by selecting metrics and setting a
threshold by which alarms will go off.
Click [All] under the [Alarms] menu in the Monitoring console.
1
10
3-2) Configuring Alarms
Click [Create].
2
Click
Click
11
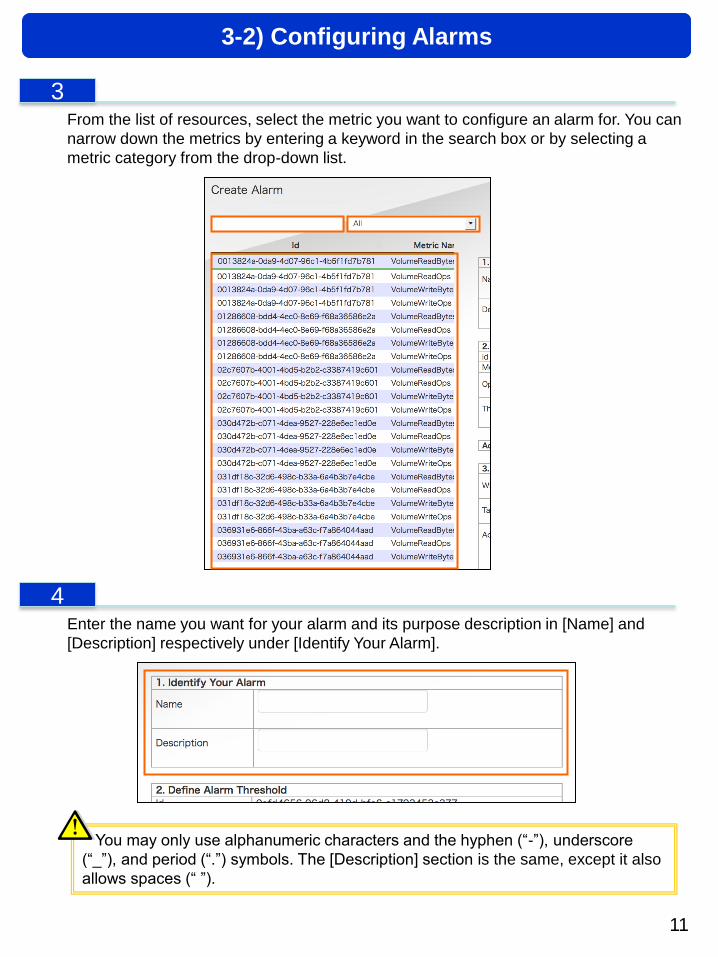
From the list of resources, select the metric you want to configure an alarm for. You can
narrow down the metrics by entering a keyword in the search box or by selecting a
metric category from the drop-down list.
3
3-2) Configuring Alarms
Enter the name you want for your alarm and its purpose description in [Name] and
[Description] respectively under [Identify Your Alarm].
4
You may only use alphanumeric characters and the hyphen (“-”), underscore
(“_”), and period (“.”) symbols. The [Description] section is the same, except it also
allows spaces (“ ”).
12
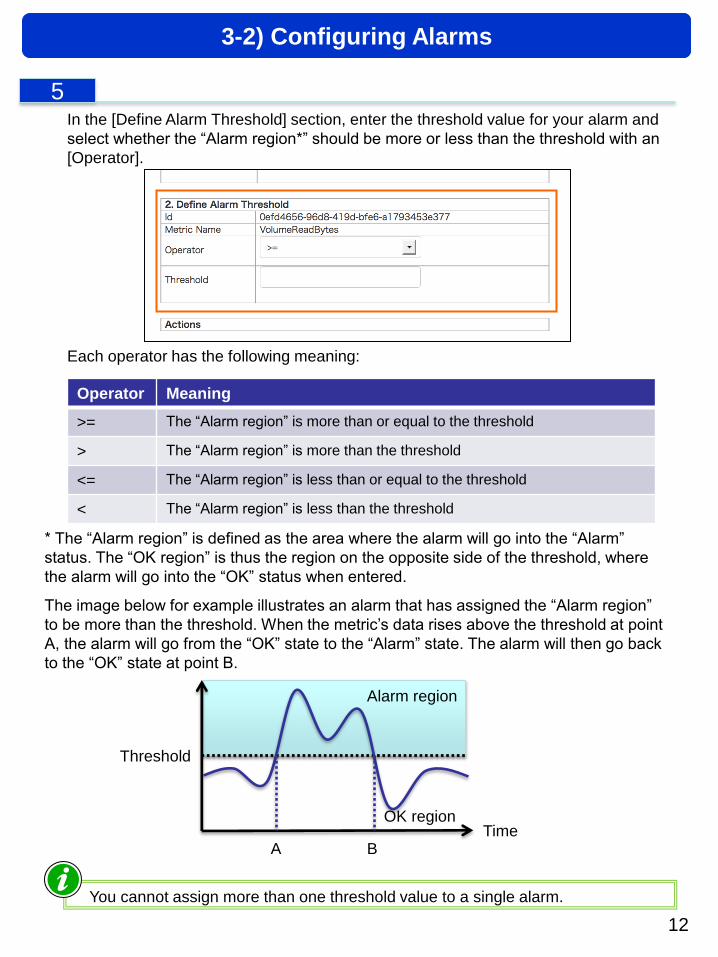
In the [Define Alarm Threshold] section, enter the threshold value for your alarm and
select whether the “Alarm region*” should be more or less than the threshold with an
[Operator].
5
Each operator has the following meaning:
Operator Meaning
>= The “Alarm region” is more than or equal to the threshold
> The “Alarm region” is more than the threshold
<= The “Alarm region” is less than or equal to the threshold
< The “Alarm region” is less than the threshold
You cannot assign more than one threshold value to a single alarm.
3-2) Configuring Alarms
Time
Threshold
A B
Alarm region
* The “Alarm region” is defined as the area where the alarm will go into the “Alarm”
status. The “OK region” is thus the region on the opposite side of the threshold, where
the alarm will go into the “OK” status when entered.
The image below for example illustrates an alarm that has assigned the “Alarm region”
to be more than the threshold. When the metric’s data rises above the threshold at point
A, the alarm will go from the “OK” state to the “Alarm” state. The alarm will then go back
to the “OK” state at point B.
OK region
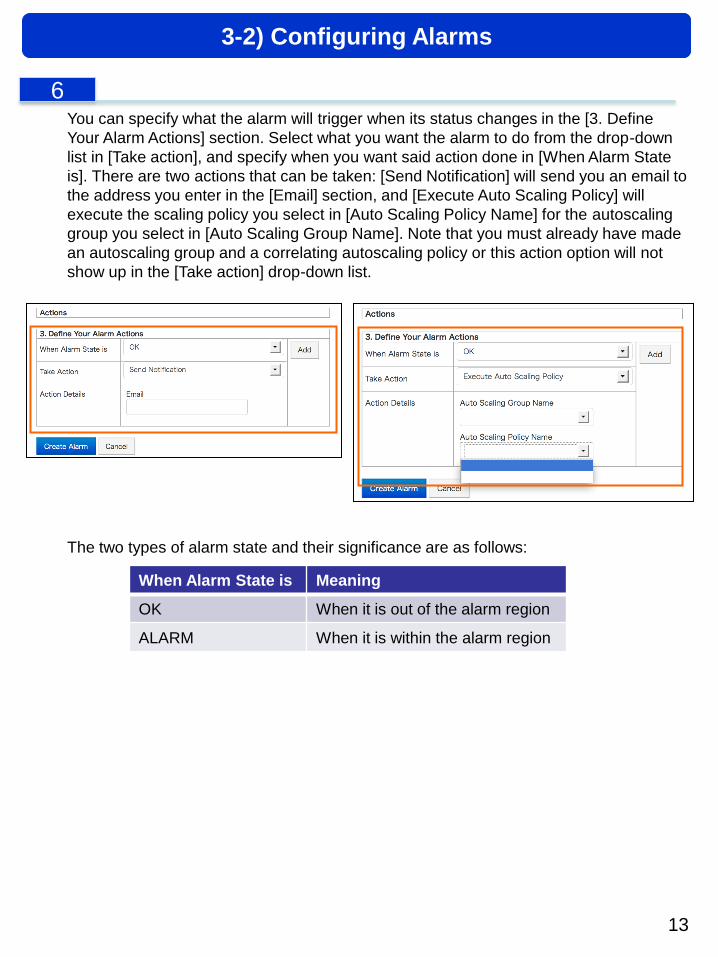
You can specify what the alarm will trigger when its status changes in the [3. Define
Your Alarm Actions] section. Select what you want the alarm to do from the drop-down
list in [Take action], and specify when you want said action done in [When Alarm State
is]. There are two actions that can be taken: [Send Notification] will send you an email to
the address you enter in the [Email] section, and [Execute Auto Scaling Policy] will
execute the scaling policy you select in [Auto Scaling Policy Name] for the autoscaling
group you select in [Auto Scaling Group Name]. Note that you must already have made
an autoscaling group and a correlating autoscaling policy or this action option will not
show up in the [Take action] drop-down list.
6
When Alarm State is Meaning
OK When it is out of the alarm region
ALARM When it is within the alarm region
The two types of alarm state and their significance are as follows:
3-2) Configuring Alarms
13
14
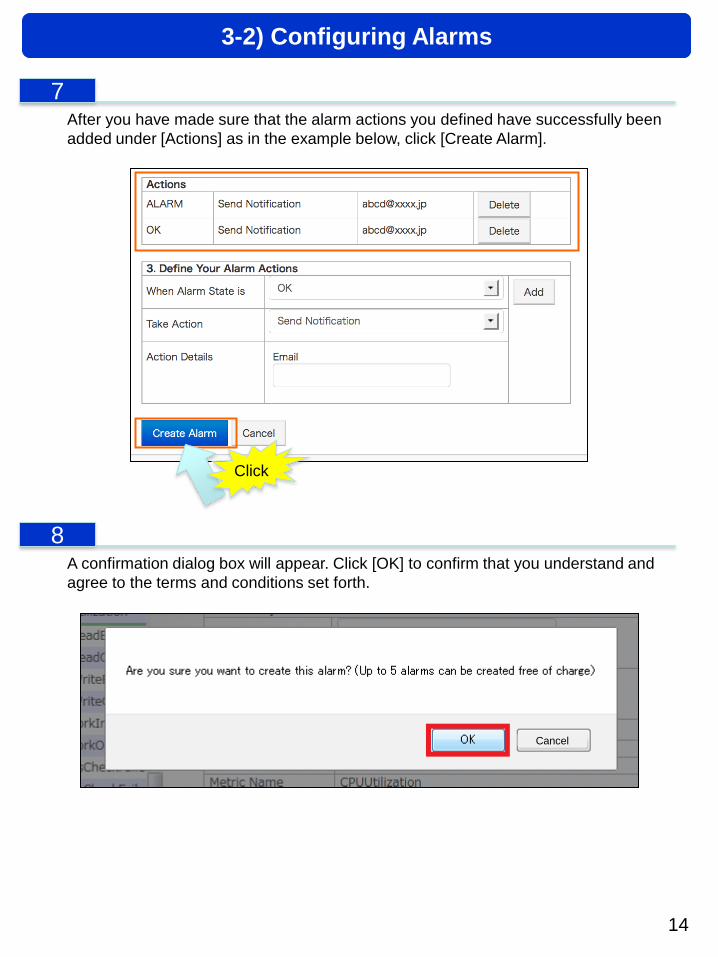
A confirmation dialog box will appear. Click [OK] to confirm that you understand and
agree to the terms and conditions set forth.
8
3-2) Configuring Alarms
After you have made sure that the alarm actions you defined have successfully been
added under [Actions] as in the example below, click [Create Alarm].
7
Click
Cancel
15
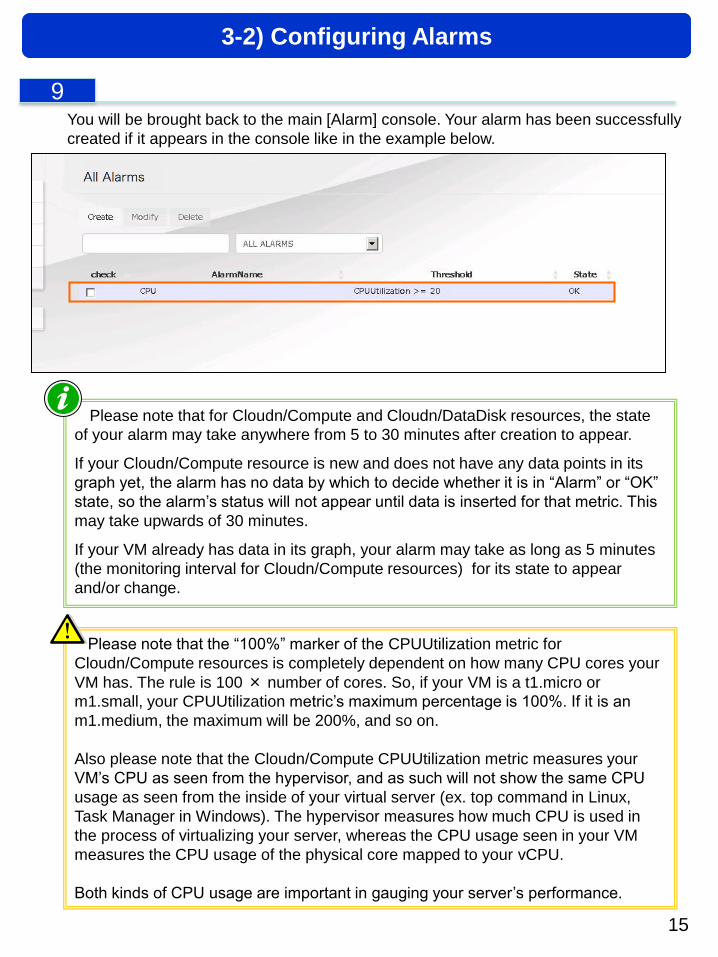
You will be brought back to the main [Alarm] console. Your alarm has been successfully
created if it appears in the console like in the example below.
9
3-2) Configuring Alarms
Please note that for Cloudn/Compute and Cloudn/DataDisk resources, the state
of your alarm may take anywhere from 5 to 30 minutes after creation to appear.
If your Cloudn/Compute resource is new and does not have any data points in its
graph yet, the alarm has no data by which to decide whether it is in “Alarm” or “OK”
state, so the alarm’s status will not appear until data is inserted for that metric. This
may take upwards of 30 minutes.
If your VM already has data in its graph, your alarm may take as long as 5 minutes
(the monitoring interval for Cloudn/Compute resources) for its state to appear
and/or change.
Please note that the “100%” marker of the CPUUtilization metric for
Cloudn/Compute resources is completely dependent on how many CPU cores your
VM has. The rule is 100 × number of cores. So, if your VM is a t1.micro or
m1.small, your CPUUtilization metric’s maximum percentage is 100%. If it is an
m1.medium, the maximum will be 200%, and so on.
Also please note that the Cloudn/Compute CPUUtilization metric measures your
VM’s CPU as seen from the hypervisor, and as such will not show the same CPU
usage as seen from the inside of your virtual server (ex. top command in Linux,
Task Manager in Windows). The hypervisor measures how much CPU is used in
the process of virtualizing your server, whereas the CPU usage seen in your VM
measures the CPU usage of the physical core mapped to your vCPU.
Both kinds of CPU usage are important in gauging your server’s performance.
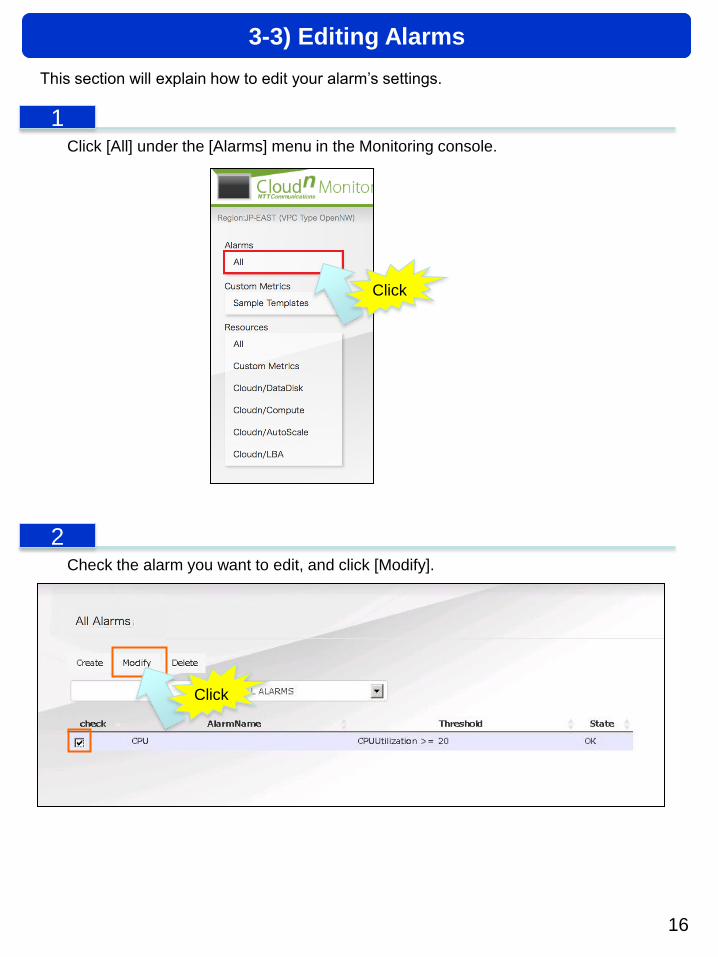
This section will explain how to edit your alarm’s settings.
Click [All] under the [Alarms] menu in the Monitoring console.
1
16
Check the alarm you want to edit, and click [Modify].
2
Click
3-3) Editing Alarms
Click
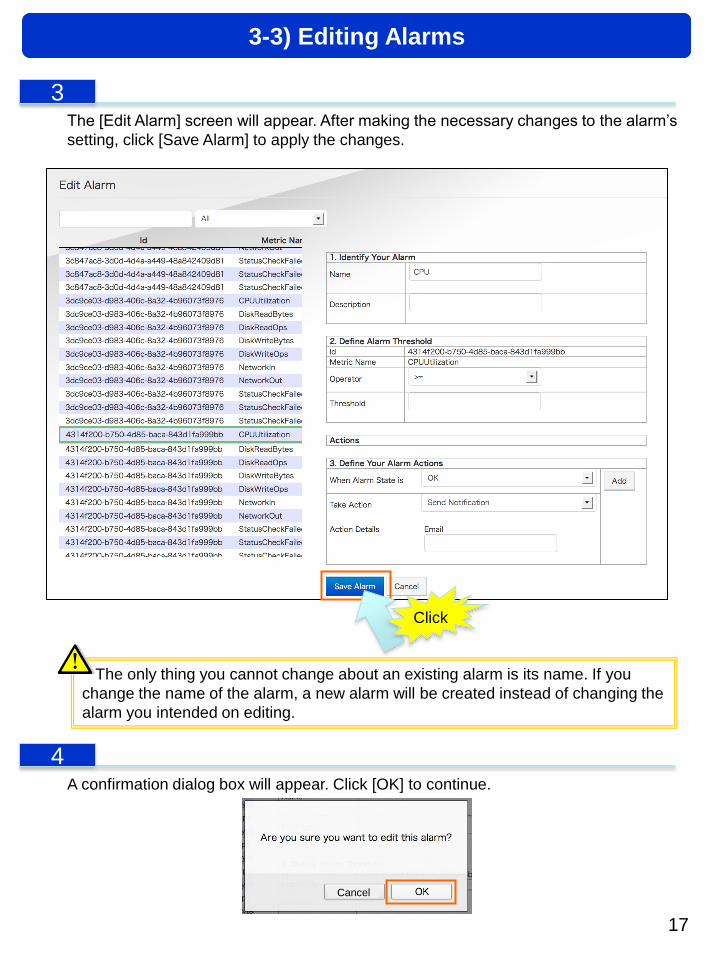
The [Edit Alarm] screen will appear. After making the necessary changes to the alarm’s
setting, click [Save Alarm] to apply the changes.
3
17
Click
3-3) Editing Alarms
The only thing you cannot change about an existing alarm is its name. If you
change the name of the alarm, a new alarm will be created instead of changing the
alarm you intended on editing.
A confirmation dialog box will appear. Click [OK] to continue.
4
Cancel
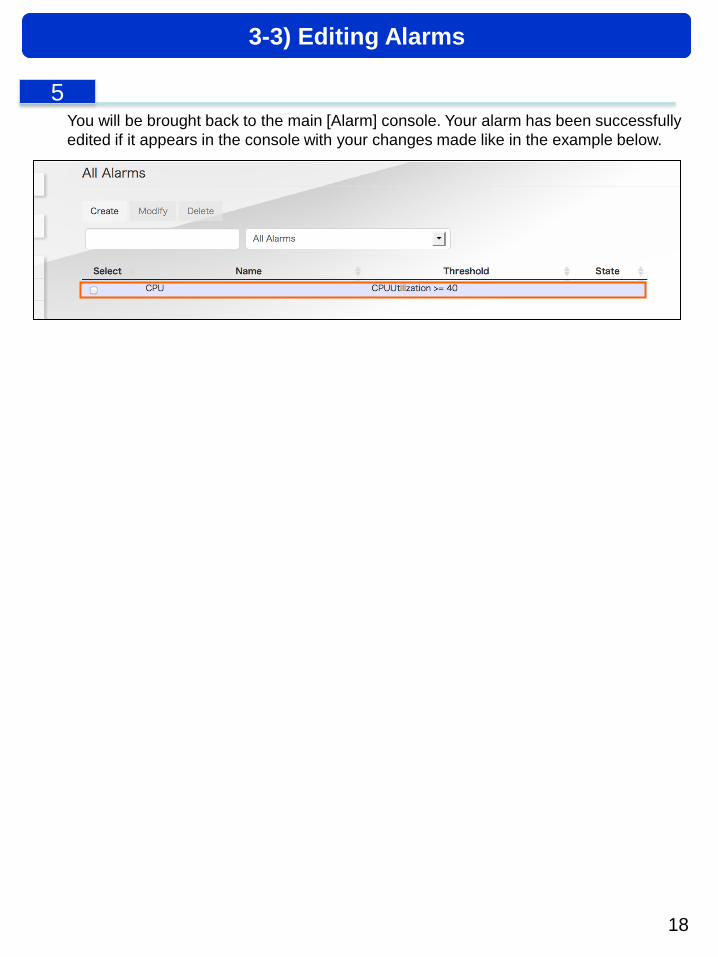
You will be brought back to the main [Alarm] console. Your alarm has been successfully
edited if it appears in the console with your changes made like in the example below.
5
18
3-3) Editing Alarms
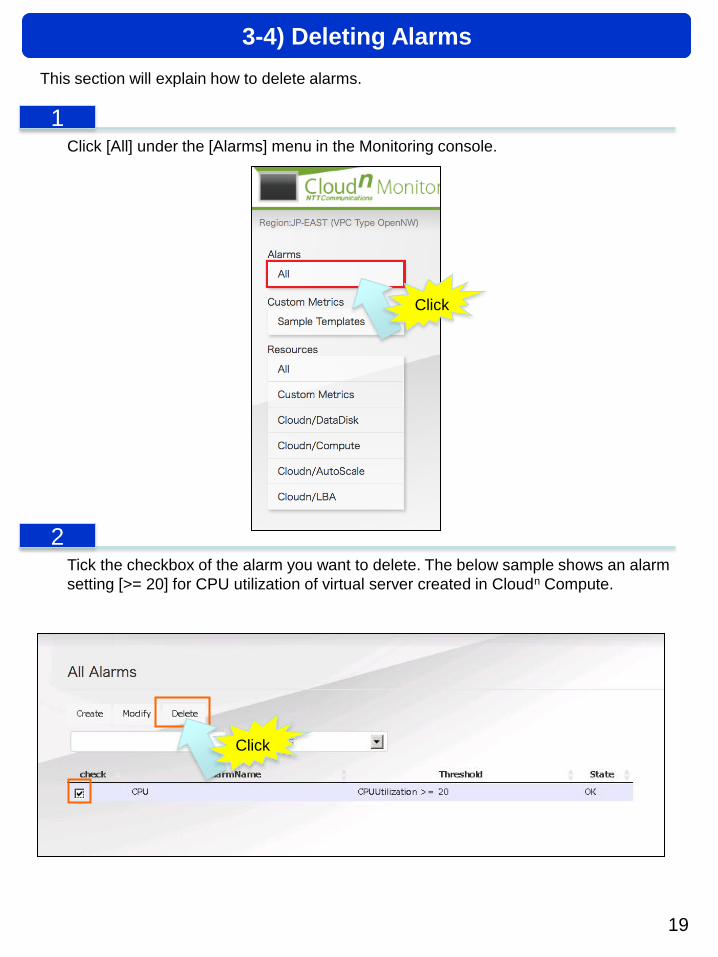
This section will explain how to delete alarms.
Click [All] under the [Alarms] menu in the Monitoring console.
1
19
Tick the checkbox of the alarm you want to delete. The below sample shows an alarm
setting [>= 20] for CPU utilization of virtual server created in Cloudn Compute.
2
Click
3-4) Deleting Alarms
Click
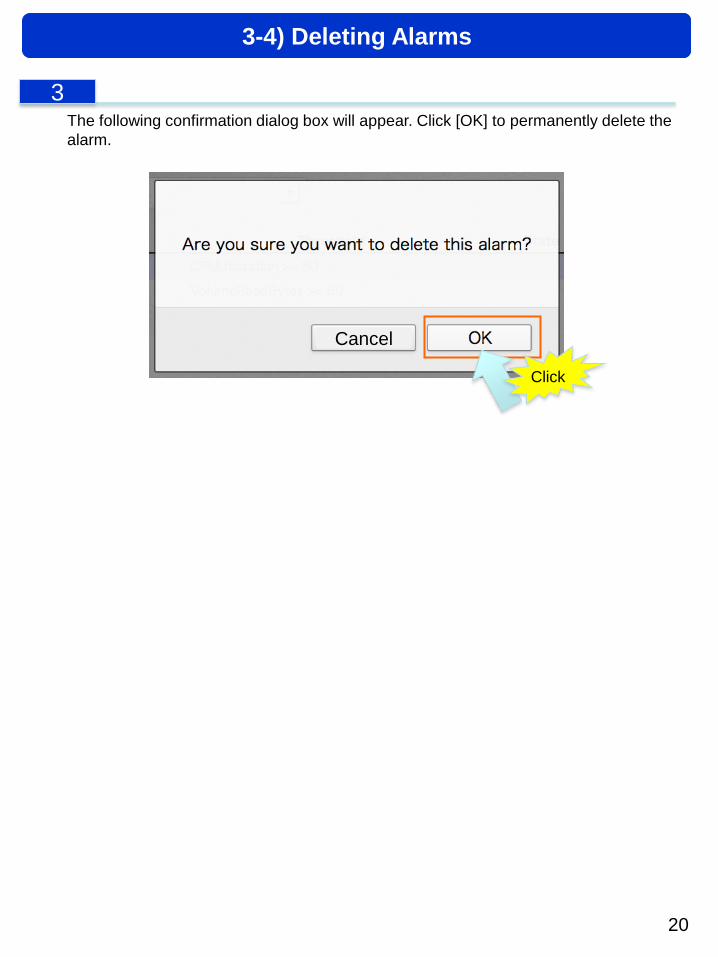
The following confirmation dialog box will appear. Click [OK] to permanently delete the
alarm.
3
20
Click
3-4) Deleting Alarms
Cancel