Embed Size (px)
Citation preview
•
" i:
k
~
<.
Ai!l~ eA?-/Y~ ~7t:J
3 1176 01326 7597
NASA Contractor Report 181670 NASA_CR-181670
19880017029
A MICROMECHANICS MODEL OF THE STIFFNESS AND STRENGTH OF LAMINATES WITH FIBER WAVINESS
Charles E. Harris and Jong-Won Lee Texas A&M University College Station, Texas
NAG1-711 July 1988
NI\S/\ National Aeron,lIltlcs and Space Admlfw-;Ir atlun
Langley Research Center Hampton, Virginia 23665-5225
111111111111111111111111111111111111111111111 . NF00889
:"';,
-~,
https://ntrs.nasa.gov/search.jsp?R=19880017029 2020-04-05T17:08:13+00:00Z
j j j j j j j j j j j j j j j j j j j j j j j j j j j
j j j j j j j j j j j j j
j j j j j j j
j j j
j j
j j j j
TABLE OF CONTENTS
TABLE OF CONTENTS i
LIST OF FIGURES
LIST OF TABLES
i i
iv
LIST OF SYMBOLS ..........................................
INTRODUCTION ............................................ 1
PROBLEM BACKGROUND 3
PREVIOUS EXPERlKENTAL STUDIES ••...................... 3 PREVIOUS MODELS . . . • . . . . . . . . . . . . . . . . . . • . . . . . • . . . . . . . . • 7
MATHEMATICAL MODEL 11
S INGLE CORRUGATED BEAK • • • • • • • • • • • • • • • • • • • • • • • • • • • • • • • 17 IN-PHASE WAVY lAYER ....... ....•.... ... .••... .. •. . ..•. 19 OUT-OF PHASE WAVY LAYER. • . . . . .. • .• •• • . . • • . . • • • . •. . ..•• 22 RESULTS OF THE PARAMETER STUDy....................... 25
EXPERIMENTAL PROGRAM . . . . . . . . . . . . . . . . . . . . . . . . . ........ . 34
MATERIAL PROPERTIES OF RAW KATERlAlS •.•..•.•..•••...• 34 SPECIMEN PREPARATION FOR TENSION TEST .•.••.•••.•...... 37 TENSION TEST . • • . • • . . • . . . . . . . . . • • • . . • . . . . • • . . . • . . . • . . . 42 SPECIMEN PREPARATION FOR MOIRE INTERFEROMETRy......... 45 MOIRE TEST . . . . . . . . . . . . . . . . . . . . . . . . . . . . . . . . . . . . . . . . . . . 48
RESULTS AND DISCUSSION
TENSION TEST MOIRE TEST
APPLICATION OF THE HODEL
63
63 68
75
THE MODEL PREDICTION AND OTHER EXPERIMENTS ..........• 75 COMPARISON WITH OTHER MODELS •.••.•.•....•••.......... 79
CONCLUSIONS ............................................. 85
REFERENCES .............................................. 87
APPENDIX ................................................ 91
v
i
#" ft/(f-20 JI/J
LIST OF FIGURES
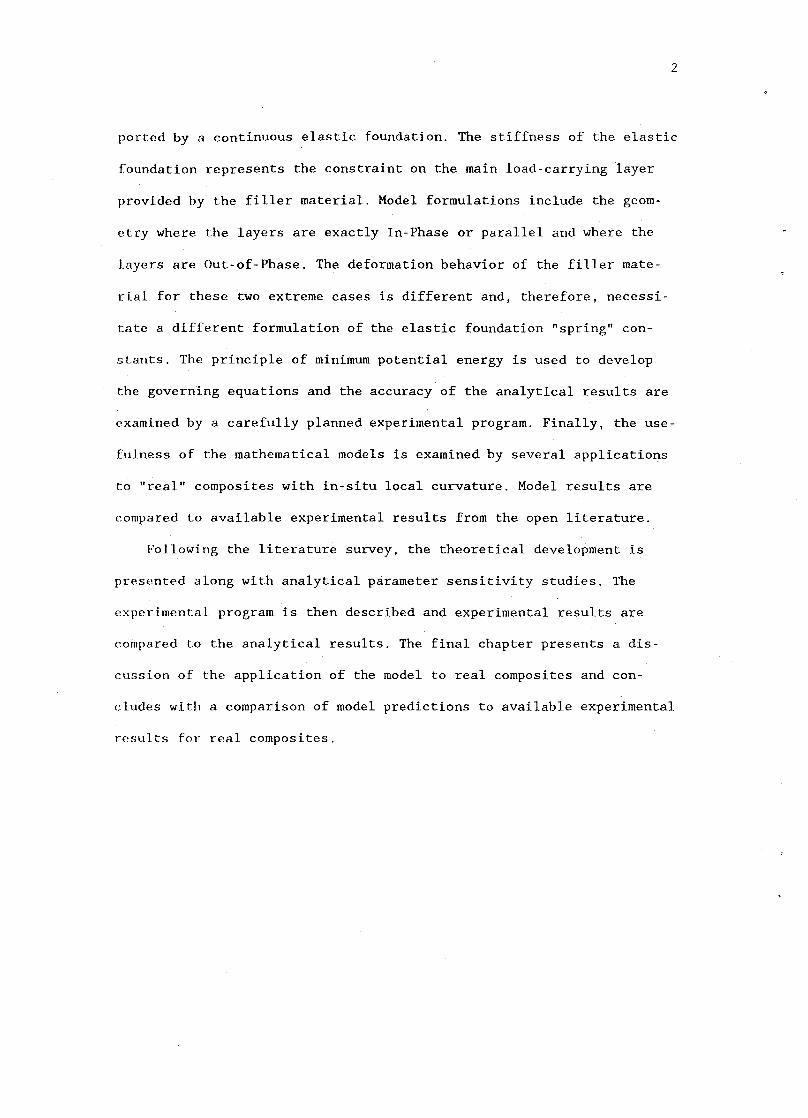
Fig. 1 Wavy Patterns in 00 Reinforcing Layers in a Filament Wound Composite Specimen
Fig. 2 Copper Matrix Metal Composites
Fig. 3 Wavy Layers
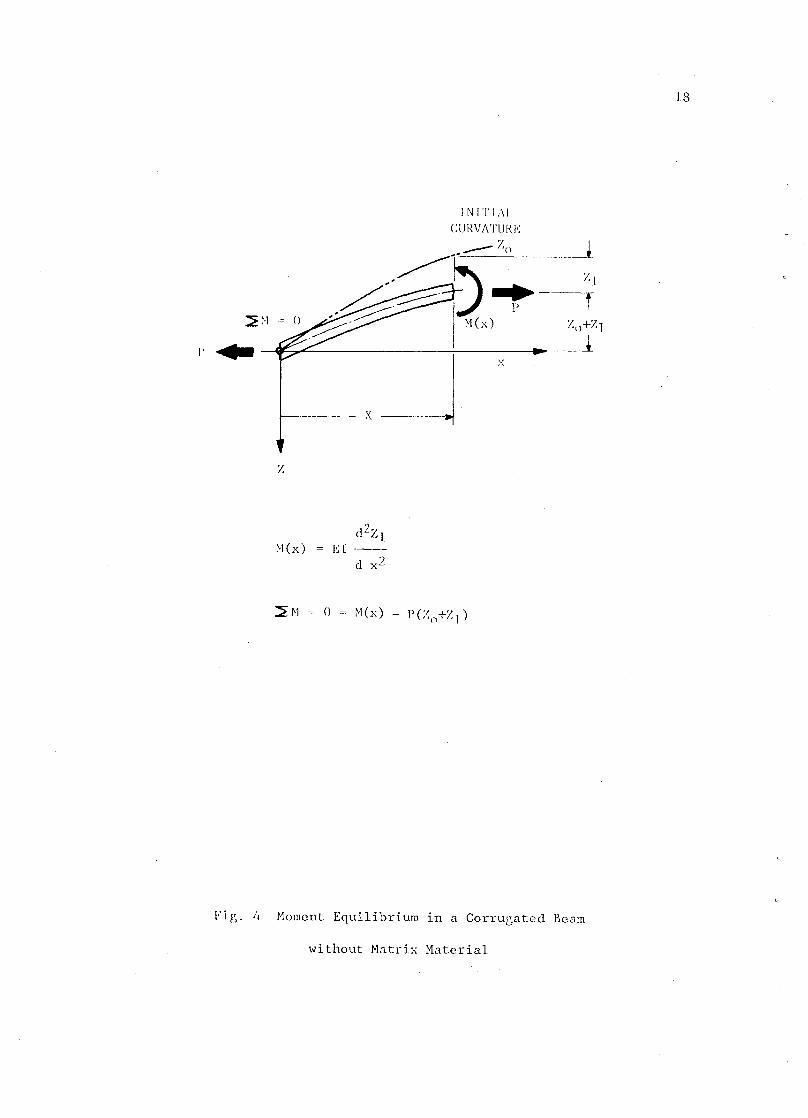
Fig. 4 Moment Equilibrium in a Corrugated Beam without Matrix Material
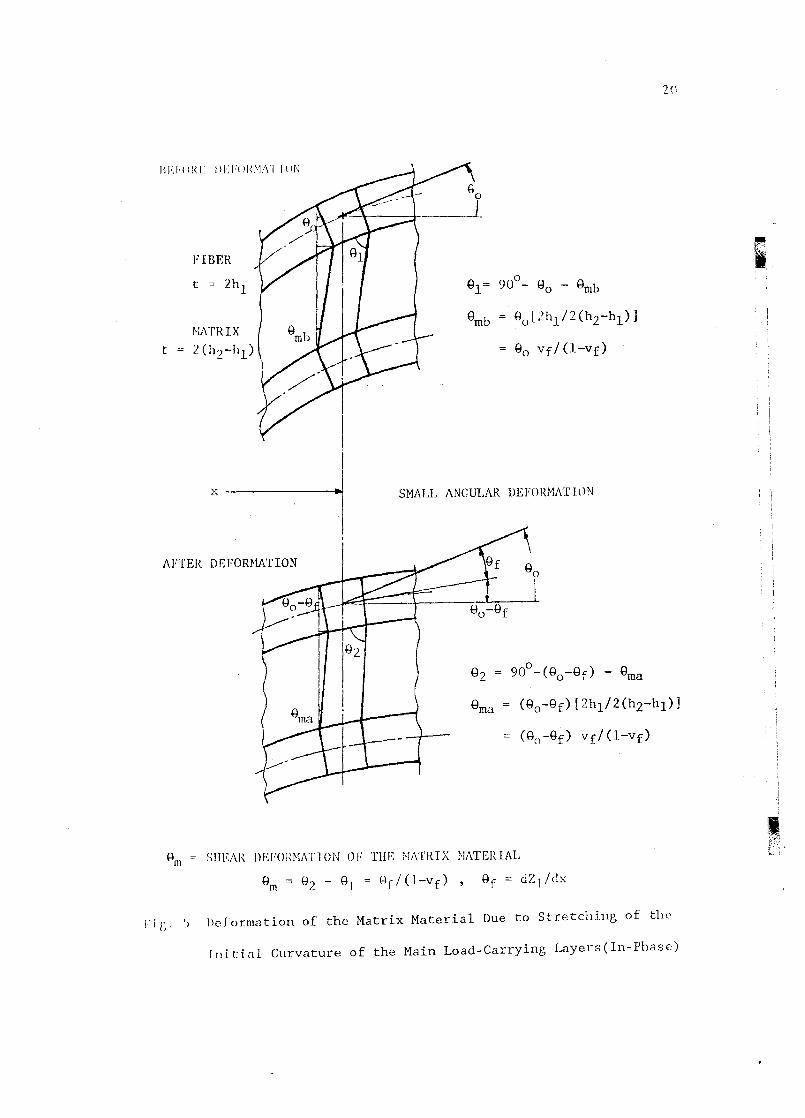
Fig. 5 Deformation of the Matrix Material Due to Stretching of the Initial Curvature of the Main Load-Carrying Layers(In-Phase)
Fig. 6 Deformation of the Matrix Material Due to Stretching of the Initial Curvature of the Main Load-Carrying Layers(Out-of-Phase)
Figs. 7-9 Predicted Strain
Figs. 10-12 Strain Variation along the Curvature
Fig. 13 Roller Press and Corrugating Procedure of aluminum layers
Fig. 14 Aluminum Layers of Different Thicknesses
Fig. 15 Comparison between a Specimen Curvature and a Mathematical Sine Function
Fig. 16 Epoxy Ingot and Specimens
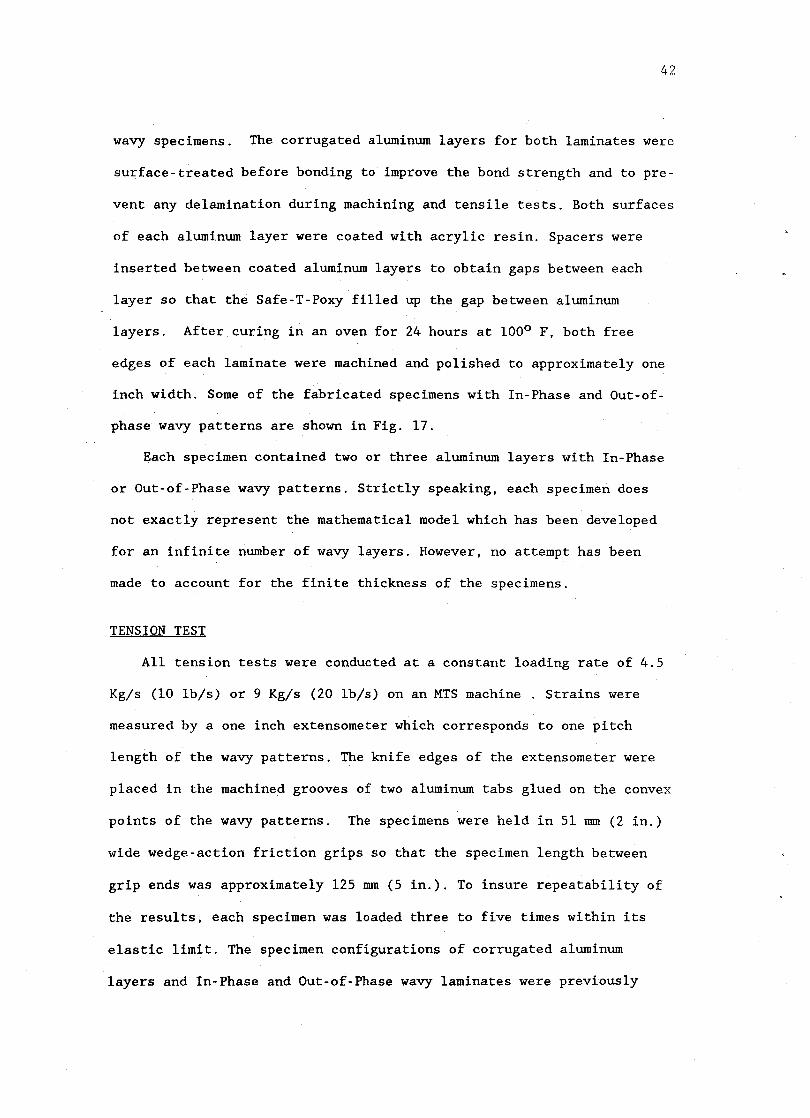
Fig. 17 Laminated Specimens
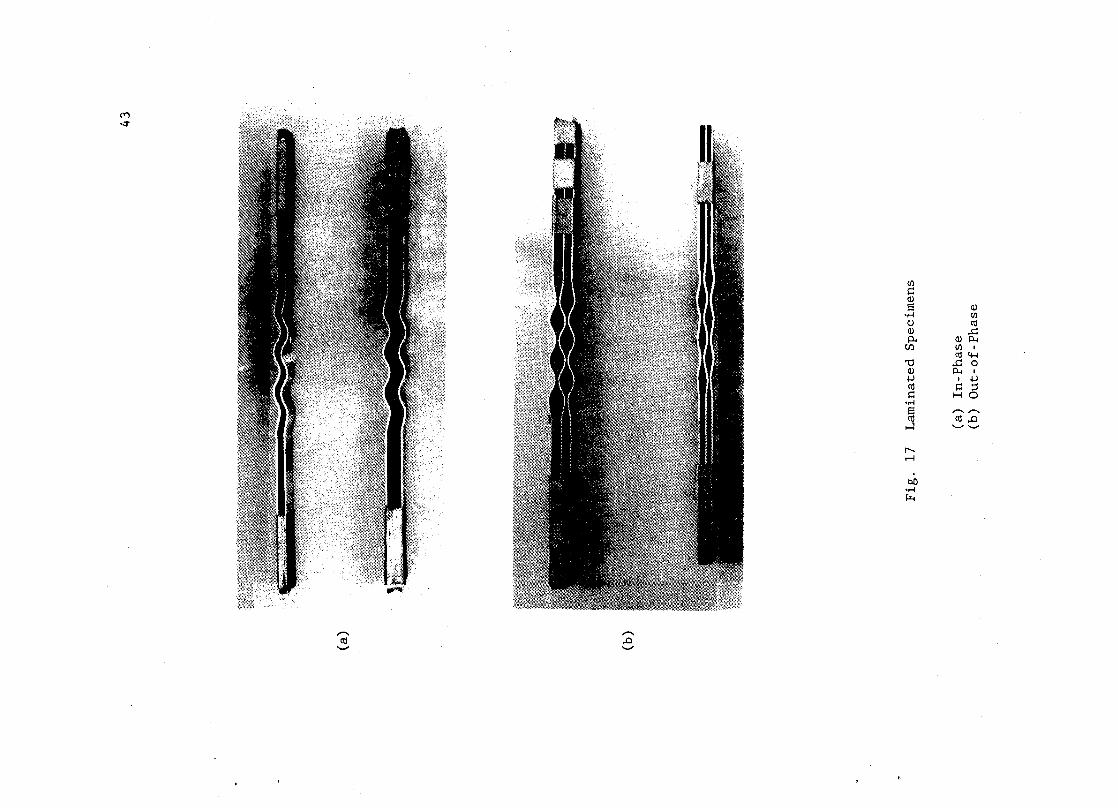
Fig. 18 Installment of the Extensometer on a Specimen
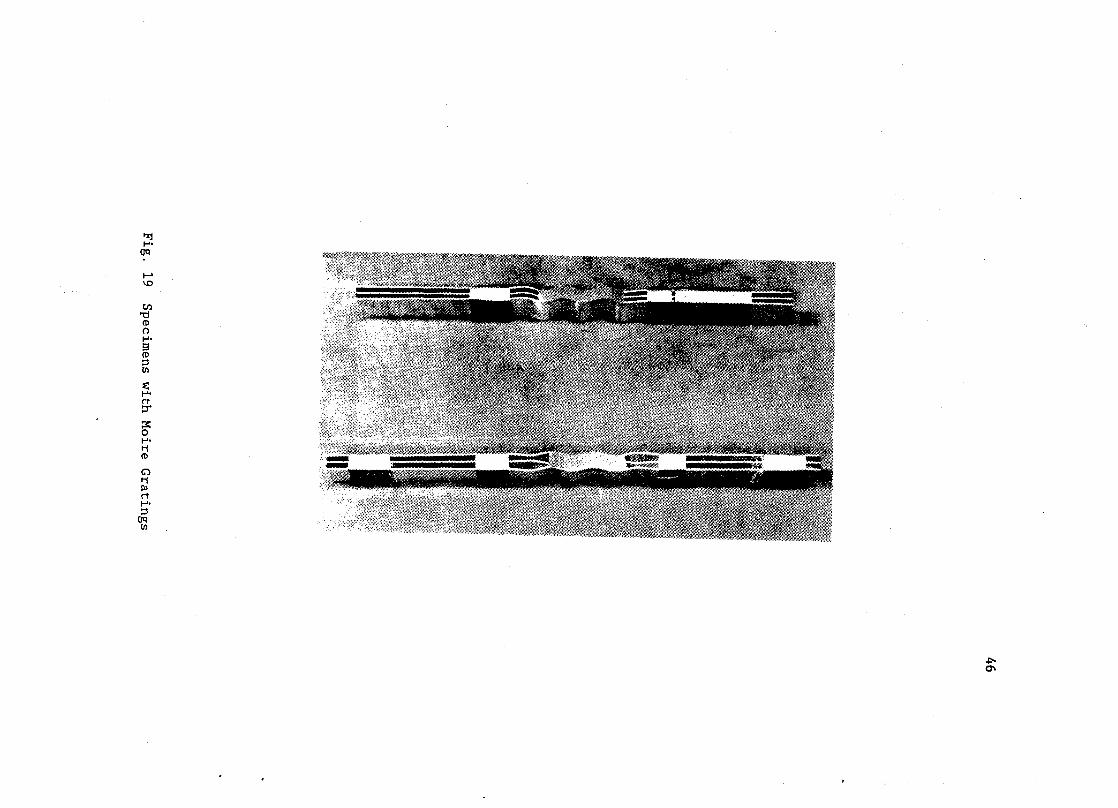
Fig. 19 Specimens with Moire Gratings
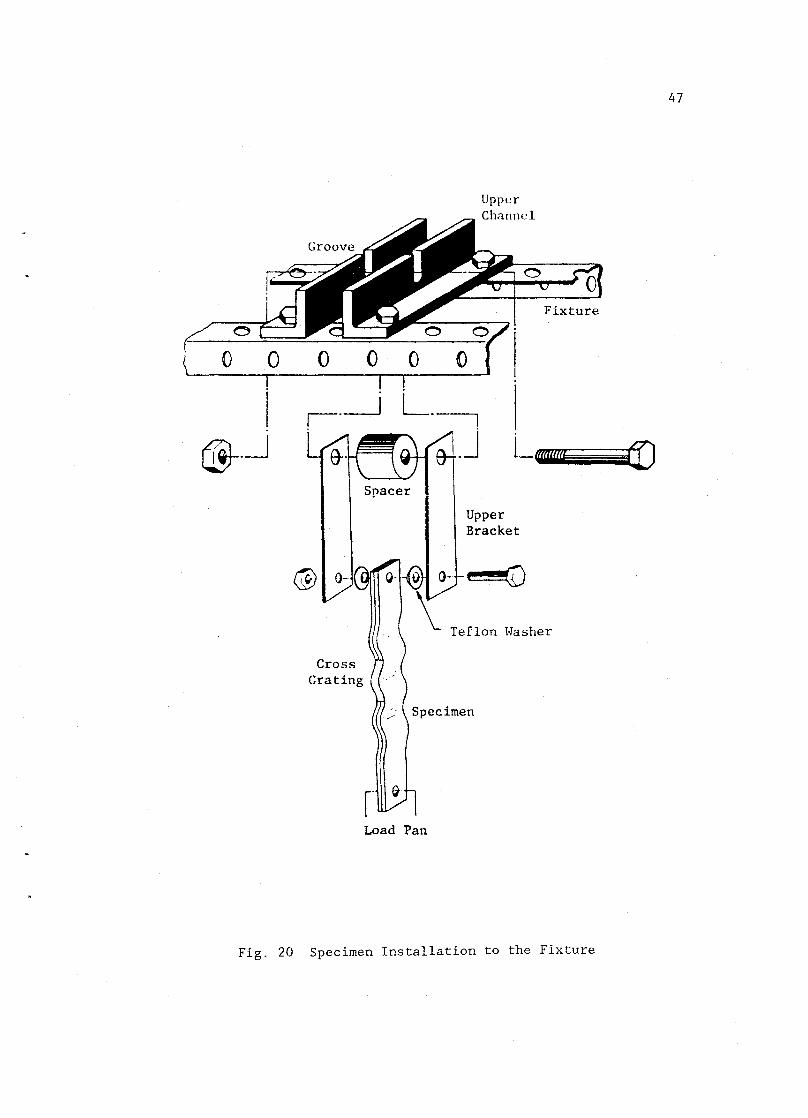
Fig. 20 Specimen Installation to the Fixture
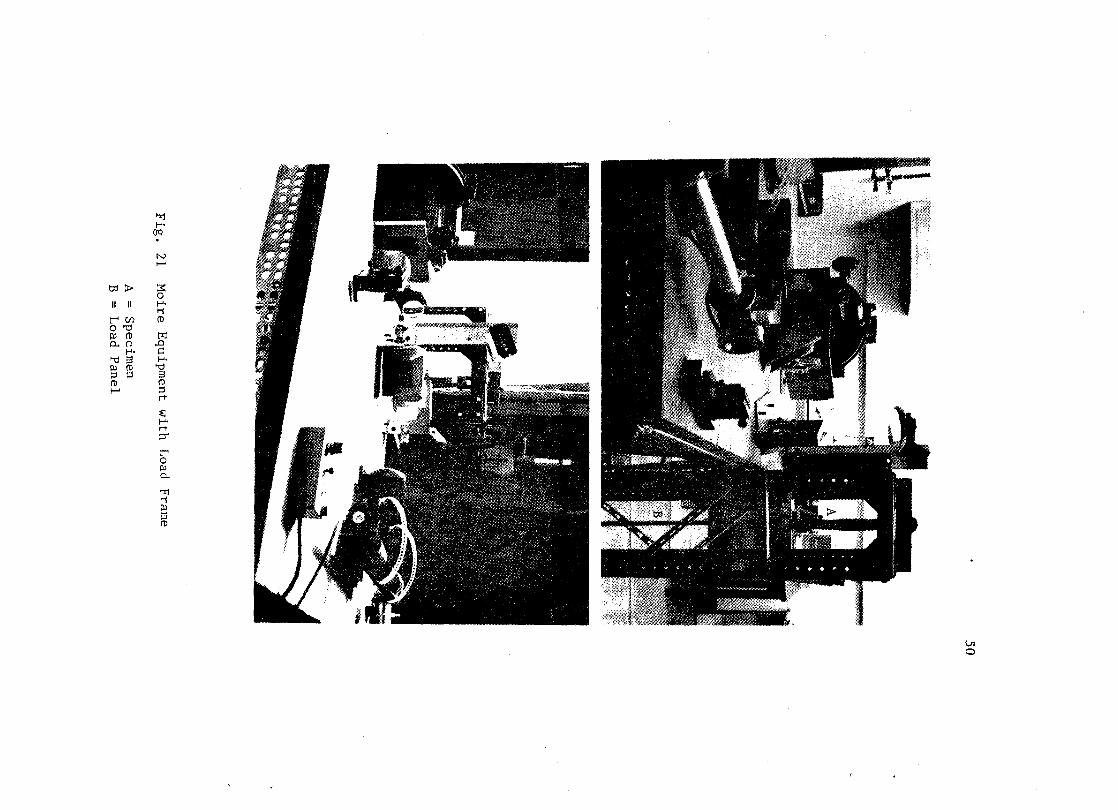
Fig. 21 Moire Equipment with Load Frame
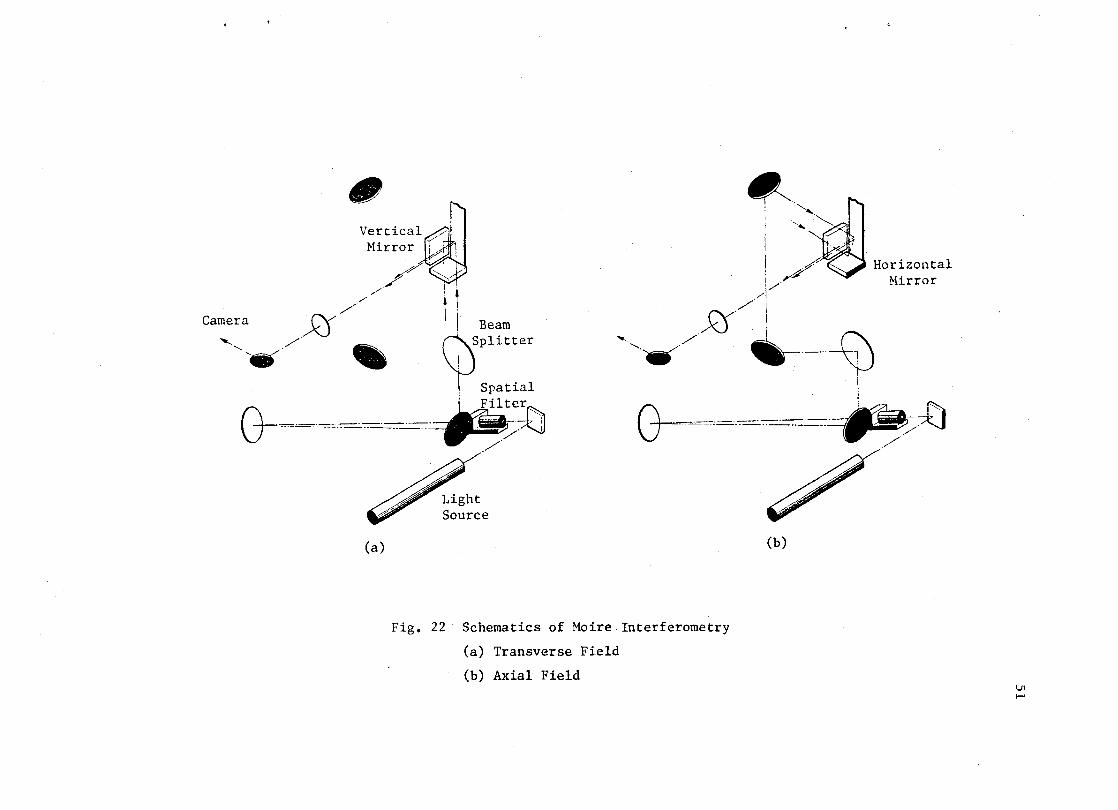
Fig. 22 Schematics of Moire Interferometry
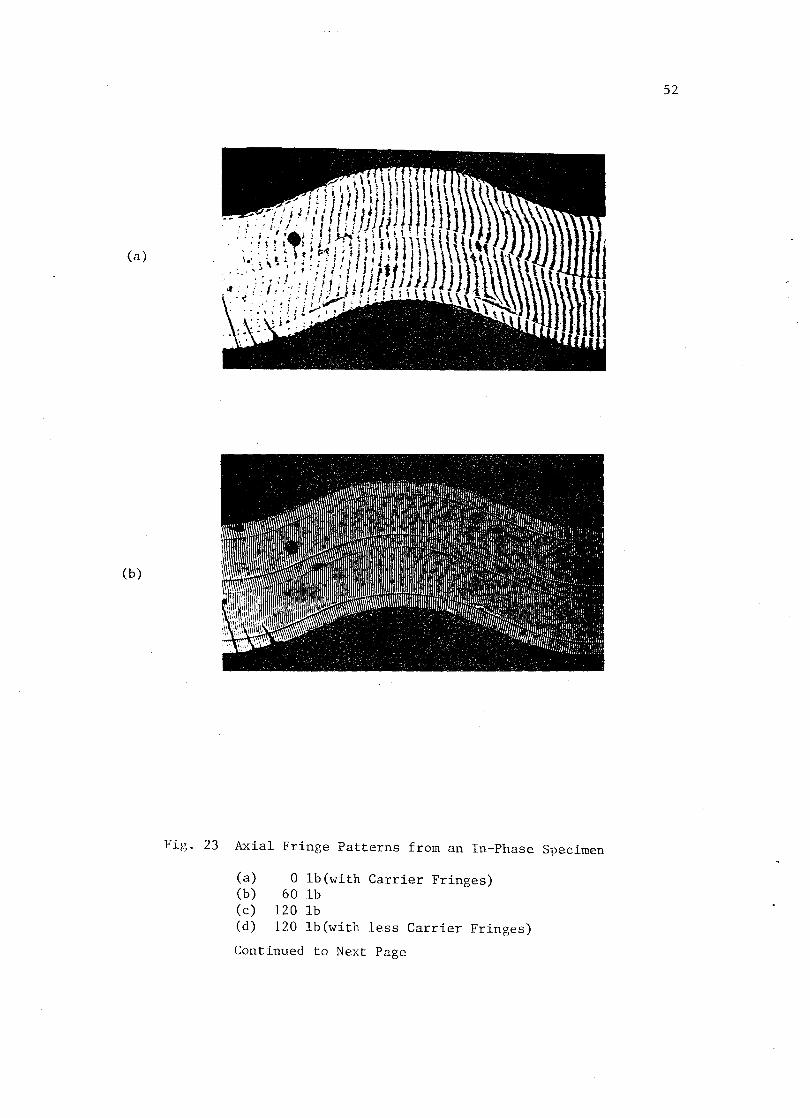
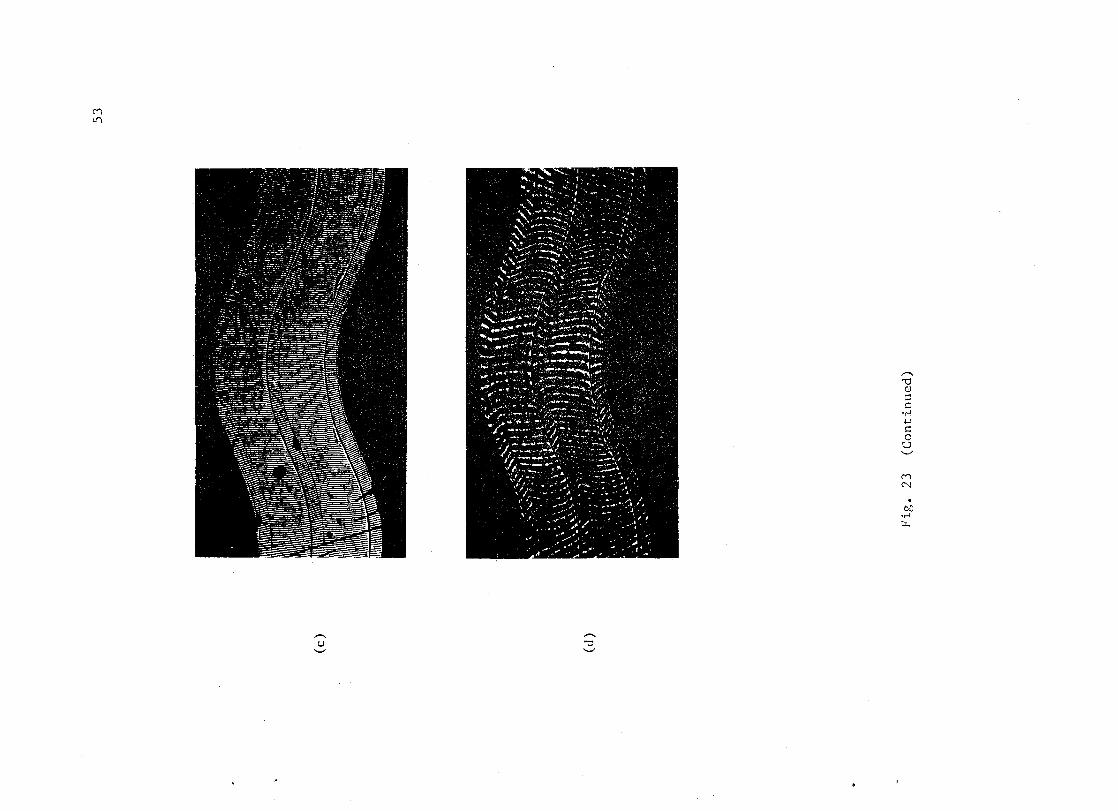
Fig. 23 Axial Fringe Patterns from an In-Phase Specimen
Fig. 24 Transverse Fringe Patterns from an In-Phase Specimen
ii
4
6
12 ~
18
20
23
27
31
38
39
40
41
43
44
46
47
50
51
52
54
Fig. 25 Axial Fringe Patterns from an Out-ofPhase Specimen
Fig. 26 Axial Fringe Patterns with More Carrier Fringes in an Out-of-Phase Specimen
Fig. 27 Transverse Fringe Patterns from an Outof-Phase Specimen
Fig. 28 Comparison between the Model Prediction and Data from Corrugated Aluminum Layers
Fig. 29 Comparison between the Model Prediction and Data from the In-Phase Specimens
Fig. 30 Comparison between the Model Prediction and Data from the Out-of-Phase Specimens
Fig. 31 Averaged Difference in Bending Strain between the Upper and Lower Surfaces of the In-Phase Specimen
Fig. 32 Averaged Difference in Bending Strain between the Upper and Lower Surfaces of the Out-of-Phase Specimen
Fig. 33 Moire Pattern with Less Carrier Fringes
Fig. 34 Moire Pattern with More Carrier Fringes
Fig. 35 Variation of the Total Strain in the In-Phase Specimen
Fig. 36 Comparison with Kagawa's Experiment
Fig. 37 Comparison with Jortner's Result
Fig. 38 Change of Fringe Pattern in the Out-of-
Phase Specimen
Fig. 39 Sample Fringe Pattern for Analyzing the Total Strain Variation
iii
57
59
61
64
65
66
69
70
72
73
74
78
82
93
94
LIST OF TABLES
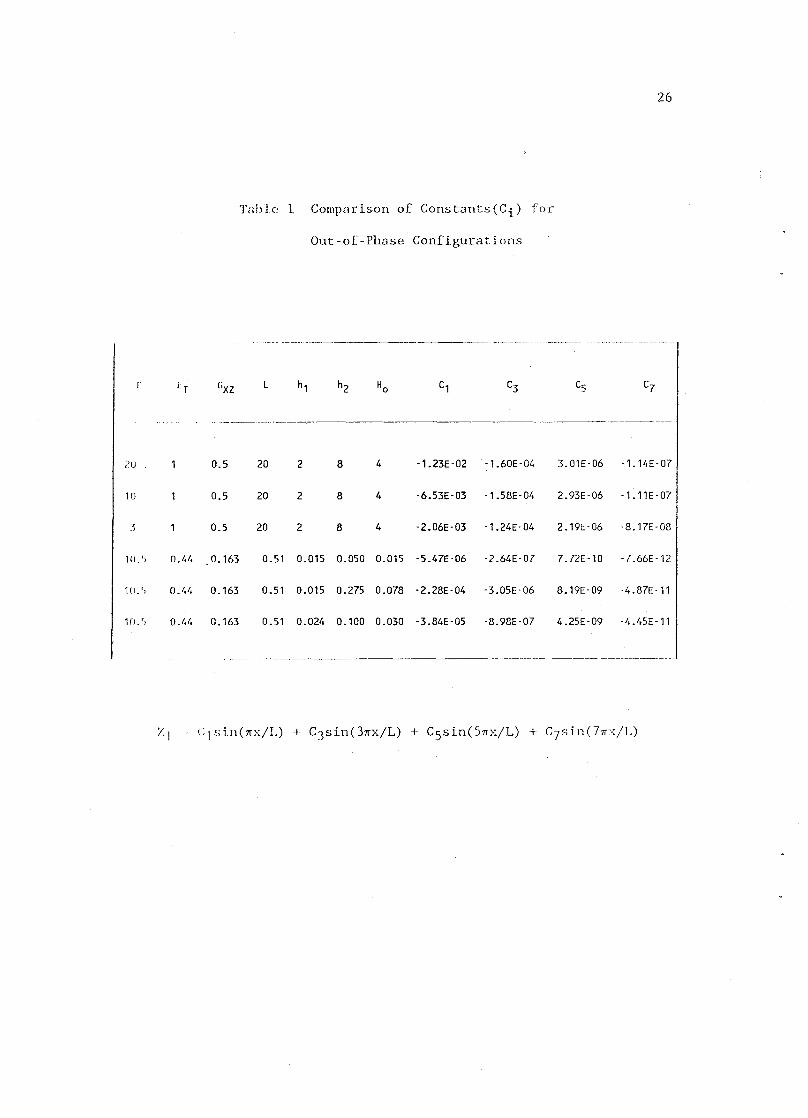
Table 1 Comparison of Constants(Ci) for Out-of-Phase Configurations
Table 2 Specimen Configurations ...............................................
Table 3 Measured Effective Young's Modulus ............................
Table 4 Applications to "REAL" Composites ............................
Table 5 Jortner's Ideal Material ................................................
iv
26
35
36
77
81
Ci
D
E. Ef
LIST OF SYMBOLS
unknown constants to be determined by the Rayleigh-Ritz method
flexural rigidity of a beam
- Young's modulus of the wavy layer or fiber
Em. ET. Et ,Er Young's modulus of the matrix material
F
f
Gf
Gm• GXZ
Ho
hI
h2
I
KL
Kl
Ku
KT
k
L
lu
11
M
P, PI
Pcr
S
- p
frequency of the moire grating
shear modulus of the fiber
shear modulus of the matrix material
max. rise of the initial wavy pattern
- half thickness of the wavy layer or fiber
half thickness of one representing segment
moment of inertia of the main load carrying layer or fiber
linear spring constant of the matrix material
linear spring constant of the lower matrix material
linear spring constant of the upper matrix material
torsional spring constant of the matrix material
- spring constant
half pitch of the wavy pattern
thickness of the matrix material above the wavy layer
thickness of the matrix material below the wavy layer
moment
far-field load on the wavy layer or fiber
critical load for buckling
total length of the neutral axis before deformation
v
tr
vf
Wo
w, w2
x
Z
Zo
Zl
a
A
ANx
ANy
AT/Ax
AUx
AUy
to
fcr
tdiff
tIND
tps
EXX
EYLD
80
8f
8m
thickness of the resin-rich region
fiber volume fraction
Zo
Zl
axis representing the fiber direction
through-the-thickness direction
initial amplitude of the wavy layer
change of the wavy pattern in the Z axis
correction factor
rigid body displacement due to straightening of the wavy layer
the increment of number of fringes in the axial(x) direction
the increment of number of fringes in the transverse(Z) direction
torque per infinitesimal length in the x axis direction
displacement in the axial(x) direction
displacement in the transverse(Z) direction
far-field strain in the x axis direction
critical far-field strain for tension failure or yield
the average difference in the bending strain component between the upper and lower surfaces of the wavy layer
measurable strain
pseudo strain
actual value of the axial strain in a wavy layer
yield strain of the wavy layer
initial angle of the fiber with respect to the x axis
dZl/dx
angular deformation of the matrix material
vi
vii
IT total potential energy
of far-field stress of the fiber
ocr critical far-field stress for buckling
vm Poisson's ratio of the matrix material

INTRODUCTION
The behavior of fiber-reinforced composite materials containing
wrinkled fibers or wavy patterns in the main load-carrying layers has
been the subject of considerable interest. Fibers or the main load
carrying layers may become wavy during manufacturing procedures such as
filament winding, braiding, and stitching used to achieve through-the
thickness reinforcing. Furthermore, local geometric imperfections may
develop as a result of twisted fiber bundles, air pockets, or the
excess resin in local resin-rich regions. A number of experimental
investigations[I-6] have shown that laminates with these wrinkled fib
ers, wavy layers or local geometric imperfections do not develop their
full strength or stiffness under tensile or compressive loading. While
geometric imperfections have been the subject of a number of rather
specific analytical investigations, there does not exist a relatively
simple micromechanics based model for the design or analysis of a gen
eral laminate with local curvature under either tension or compression
loading. The development of a simple mathematical model for predicting
the effective laminate strength and stiffness and the associated exper
imental confirmation of the theoretical assumptions and model results
is the objective of the research described herein.
A simpl~ mathematical model describing the deformation behavior of
the n.ain load-carrying layer of a laminated composite is developed
herein. The main load-carrying layers, or the principal load-carrying
layc~s. have initial curvature and are modelled as curved beams sup-
2
ported by a continuous elastic foundation. The stiffness of the elastic
foundation represents the constraint on the main load-carrying layer
provided by the filler material. Model formulations include the geom
etry where the layers are exactly In-Phase or parallel and where the
layers are Out-of-Phase. The deformation behavior of the filler mate
rial for these two extreme cases is different and, therefore, necessi
tate a different formulation of the elastic foundation "spring" con
stants. The principle of minimum potential energy is used to develop
the governing equations and the accuracy of the analytical results are
examined by a carefully planned experimental program. Finally, the use
fulness of the mathematical models is examined by several applications
to "real" composites with in-situ local curvature. Model results are
compared to available experimental results from the open literature.
Following the literature survey, the theoretical development is
presented along with analytical parameter sensitivity studies. The
experimental program is then described and experimental results are
compared to the analytical results. The final chapter presents a dis
cussion of the application of the model to real composites and con
cludes with a comparison of model predictions to available experimental
results for real composites.
'3
PROBLEM BACKGROUND
The problem background is discussed by way of the literature review
presented in this section. The presentation of the literature is
divided into two topics. The first topic addresses the engineering and
research studies that have explored the effects of local curvature on
the stiffness and strength of laminated composites and a metal matrix
composite[I-6]. This work provides the motivation for the subject
research. The second topic describes those studies that have developed
an analytical treatment of the local curvature problem[7-l4]. This
discussion will establish the state-of-the-art of the design methodol
ogy when local curvature is present in laminated composites.
PREVIOUS EXPERIMENTAL STUDIES
Poe, et al.[l] conducted a test program to determine the residual
tensile strength of a thick filament-wound solid rocket motor case
after low-velocity impacts. They reported that the undamaged strength
of specimens cut from a filament-wound case reinforced by unidirec
tional layers was 39% less than the expected strength on the basis of
fiber-lot-acceptance tests. It was observed that the main load-carrying
layers became wavy during manufacturing. A specimen edge cut from the
filament wound graphite epoxy cylinder contains many wavy patterns in
the main load-carrying layers, actually 0 degree layers, as shown in
Fig. 1.
An experimental study of stitched composite laminates conducted by
Dexter and Funk[2] showed a similar result. Their experimental result
shows that the tensile and compressive strength of stitched laminates
I-zj 1-'-~
r-'
III ~ III
I-zj ~ 1-'- '< r-' III ""d !3 III (1) rt ::l rt rt (1)
ti ~ ::l 0 en ~ ::l 1-'-p.. ::l (") 0 0 0 !3
"0 ::0 0 (1) en 1-'-1-'- ::l rt HJ (1) 0
ti (J) n
"0 1-'-(1) ::l n ~ 1-'-!3 r-' (1) III ::l '<
(1) r-' ti
en 1-'-::l
was approximately 20-25 % lower than the strength of unstitched lami
nates. Furthermore, the tensile strength of the stitched laminates
decreased as the number of stitches increased, while the compressive
strength increased.
5
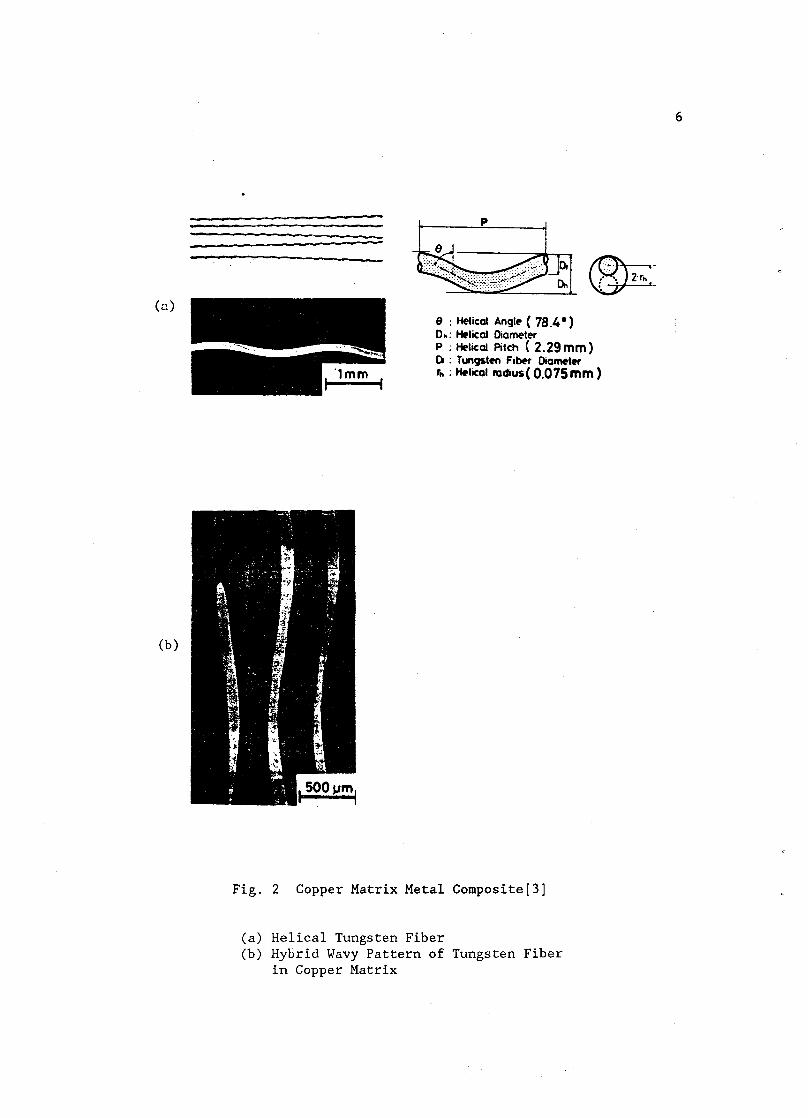
Kagawa, et al.[3] obtained a larger ultimate tensile strain at
small expense of the ultimate stress using helical fibers instead of
straight fibers in a tungsten-copper metal matrix composite. They
reported that the tensile fracture behavior of the helical fiber com
posite was not so catastrophic as that of the straight fiber composite,
and suggested that tougher composite materials could be available using
helical fibers instead of straight fibers in the metal matrix compos-
ite. In Fig. 2, the helical fibers surrounded by a copper matrix are
shown with one possible combination of the hybrid wavy pattern, i.e.,
one In-Phase and one Out-of-Phase wavy pattern.
Makarov and Nikolaev[4] investigated the effect of curvature of the
reinforcing fibers on the mechanical properties of composites through
an experimental study using a low modulus matrix and high modulus rein
forcing fibers. They concluded that the initial curvature of the rein
forcing fibers must be taken into consideration in calculating the
effective Young's modulus in the fiber direction.
Simonds, et al.[S] reported that the tensile strength of the
AS4-3S0l braided composite material of which the braid angle was
120 -150 was 30 to 50 % greater than the tensile strength of 150
angle-ply laminates made of ASl-3S01 graphite/epoxy. In addition the
Young's modulus measured in the 00 direction was almost the same as
that of the ISo angle-ply graphite/epoxy laminate.
Davis(6) presented results of an experimental investigation of the
(n)
(b)
p
8 : Helical Angle ( 78.4.) Dh: Helical Diameter
~~
P : Helical Pitch ( 2.29 mm ) t) : Tung5ten Fi~r OiOlMt.,. rio: tt.licol radius( O.075mm)
Fig. 2 Copper Matrix Metal Composite[3]
(a) Helical Tungsten Fiber (b) Hybrid Wavy Pattern of Tungsten Fiber
in Copper Matrix
6
compressive strength of unidirectional boron/epoxy composite materials
with initially curved fibers. He obtained experimental evidence that
showed that the shear modulus was related to the axial compressive
stress.
7
It is obvious from these experimental investigations that local ply
or local fiber curvature can result in significant differences in the
stiffness and strength of otherwise straight laminated composites.
Therefore, a proper design of a composite with local curvature in the
reinforcement would require a mathematical model that accurately pre
dicts the local and global deformation behavior of the composite.
PREVIOUS MODELS
The analysis of compressively loaded laminated composites with
local fiber or layer curvature has been the subject of a number of
investigations. In several cases, simple micromechanics based models of
compressive strength have been formulated. The work of Rosen[7] is con
sidered to be classical for predicting the compressive strength of a
composite material with straight fibers as the reinforcement.
Rosen developed two analytical models for predicting the compres
sive strength of a fiber reinforced composite[7] by assuming the fibers
as plates imbedded in a homogeneous matrix material. By applying the
energy method to two extreme cases of fiber buckling, i.e., the exten
sion mode and the shear mode, he derived compact analytical solutions
to the critical stress and strain of straight fibers surrounded by mat
rix material which was relatively less stiff than the fibers.
However, mathematical modeling for the tension problem is still in
8
its infancy[8-l3]. There is no counterpart to Rosen's compressive
strength model for the tensile loading case. The tie-bar/column
approach of Bert[8] may be the most likely candidate model for solving
the tension problem of wrinkled fibers or wavy layers. But his govern
:i ng differential equation is not directly applicable to a laminated
composite, because it was derived for a rigid fiber imbedded in an
infinite matrix material.
Bert[8] reviewed a number of mathematical models and proposed two
methods: the mean-fiber-angle approach; and the elastically supported
tie-bar/column approach, to explain the differences in tension and com
pression behavior of fiber-reinforced composites with locally curved
fibers. He concluded that a definitive experimental program is required
to determine which of the two methods is most efficient to predict the
mechanical behavior of composites containing wavy patterns. Also, he
emphasized the development of an experimental program to determine the
role of interfacial adhesion between the fibers and matrix on the
global behavior of composite materials with wavy patterns.
Jortner[9] constructed a theoretical model from which all elastic
constants and thermal coefficients of a composite containing In-Phase
wrinkled fihers can be estimated. After implementing his method by num
erically satisfying stress equilibrium and strain compatibility simul
taneously, he recommended comparing his model predictions to experimen
tal data or with other finite-element models.
Akbarov and Guz[lO,ll] developed two mathematical models based on
the linear elasticity theory and piecewise homogeneity to determine the
stress-strain state of laminated composites containing wavy layers
under a remote uniform tensile loading. From their model, the interfa-
9
cial stress components between the main load-carrying layers and filler
layers can be predicted numerically. They calculated two interfacial
stress components, which are normal and tangential to the interface
between the matrix material and a curved layer, by satisfying the equa
tions of equilibrium, Hooke's law, and the Cauchy relationships. In
ref.[lO], they assumed a very thick matrix layer and neglected the mut
ual influence between wavy layers. In ref.[ll], they extended the
approach proposed in ref. [10] including the mutual influence of adja
cent wavy layers. In both studies, they found that a small-scale curva
ture gave a significant effect on the stress-strain state in a compos
ite. However, as Akbarov and Guz mentioned in their papers, it is very
cumbersome to compare any experimental data to their models because of
the complexity of the mathematical formulations.
Ishikawa, et al.[12] also proposed two models, the mosaic and fiber
undulation models, for predicting the effective elastic moduli of fab
ric composites. Their experimental results showed that the ratio of ply
thickness to thread width, i.e. pitch of the wavy pattern, was a very
important parameter which had a significant effect on the elastic mod
uli of plain weave composites.
EI-Senussi and Webber[13] presented a theoretical analysis for the
crack propagation of a layered strip in compression, in the presence of
8 blister. They proposed a typical set of design curves which showed
the influence of blister length, applied strain and resin stiffness on
loads required for splitting the reinforcing layer from the blister.
Their approach for determining the deformed shape of the layered strip
on the blister was exactly the same as the tie-bar/column approach pro
posed by Bert[S], except for the inclusion of the equivalent spring
10
constant for the elastic constraint due to the blister.
Shuart[14] investigated the short-wavelength buckling(or the micro
buckling) and the interlaminar and inplane shear failures of multi
directional composite laminates under uniaxial compression. He assumed
the fibers-in the lamina as a plate, and the matrix in the lamina as an
elastic foundation. After his numerical analysis, he recommended addi
tional experimental verification of his detailed 3-D analysis. (Refer
ence 14 also contains a complete literature review of the compression
loading problem and a genesis of the fiber buckling and compressive
strength models.)
All of these theoretical studies have shown that relatively small
scale wavy patterns or wrinkles produce a noticeable effect on the
stress-strain behavior of the composite material system. However, dif
ficulties arise when we try to directly compare the experimental data
puhlished in the literature with those theories. This is because most
of the mathematical models mentioned above are too complicated to apply
directly. Among those mathematical models, the tie-bar/column approach
proposed by Bert[8] and Rosen's model[7] are relatively simple. How
ever, Rosen's model requires modification for solving the tension prob
lem, and Bert's model needs more verification of its governing differ
ential equation and elastic constraint due to the matrix layer. There
fore, the author has developed a new and simple deformation based
mathematical model which includes geometrical parameters as well as
material parameters for predicting stress-strain behavior of wavy lami
nates under tension loading.
11
MATHEMATICAL MODEL
The theoretical development of a mathematical model of the local
deformation and state of strain of a wavy layer or a wrinkled fiber in
a laminated composite proceeds from the micromechanics viewpoint. Con-
cepts of strength-of-materials are applied to a representative segment
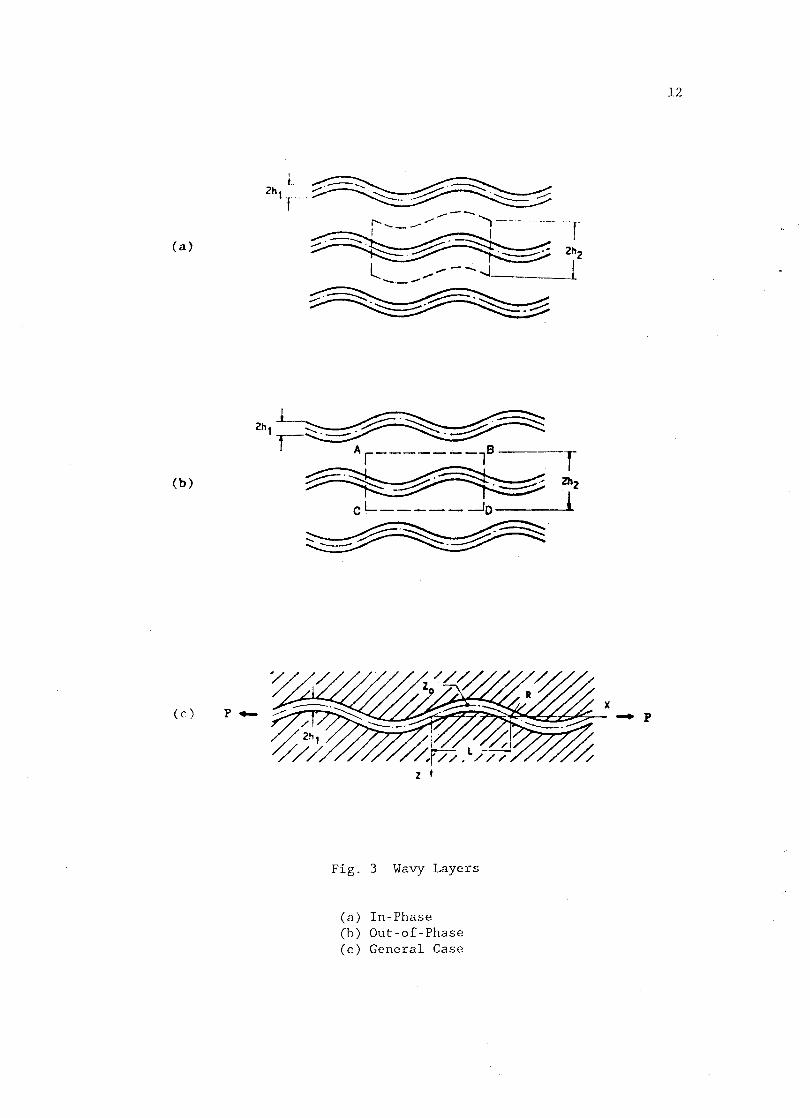
of a single wavy layer. The geometry of the model is shown in Fig. 3.
The In-Phase layer (Fig. 3a) and the Out-of-Phase layer (Fig. 3b) are
treated as the two extreme cases. A single wavy layer is analyzed as a
corrugated beam on an elastic foundation(Fig. 3c), where the stiffness
of the elastic foundation represents the kinematic constraint on the
wavy layer from the surrounding filler material.
The tension-compression behavior of the filler material is modeled
as an array of linear springs, and the shear deformation behavior is
modeled as an array of torsional springs. Since the curvature of the
wavy layer is small relative to the length of the segment(pitch) , the
Euler-Bernoulli beam theory is applied. The governing differential
equation for the initially curved beam on an elastic foundation is
developed from the principle of minimum potential energy. Using the
Cartesiall coordinate system shown in Fig. 3c, the total potential
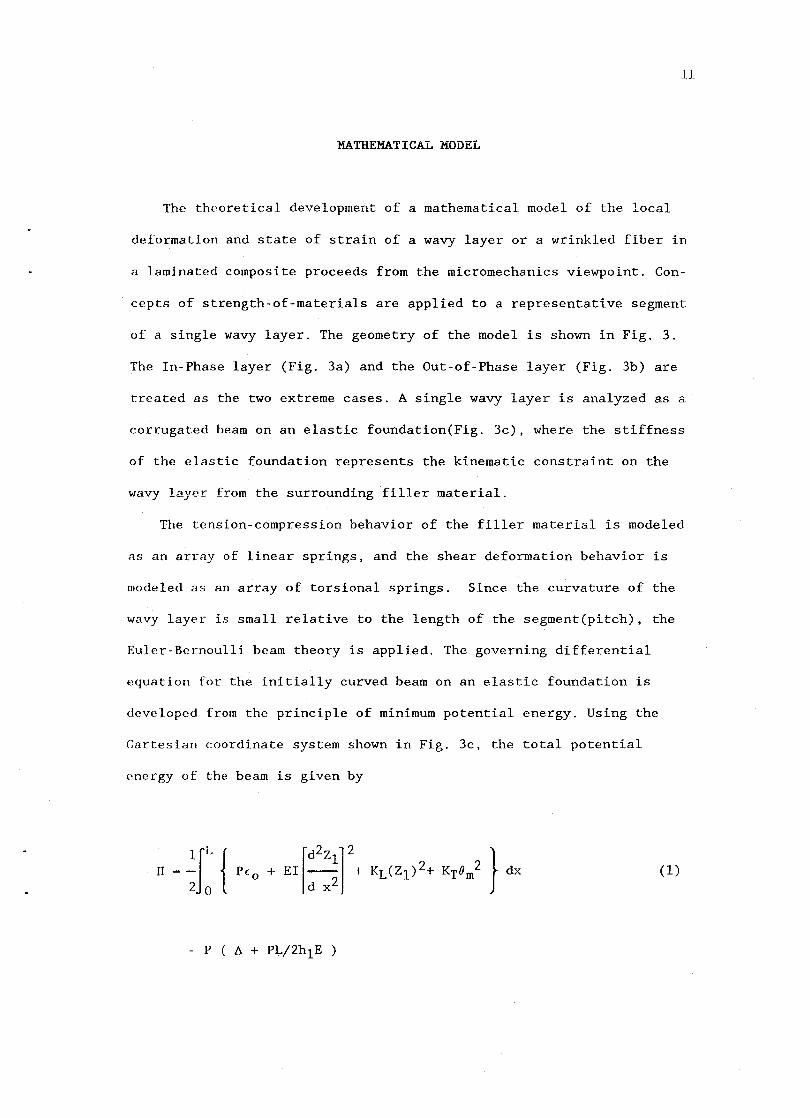
nnergy of the beam is given by
IlL { II--
2 0 Pf O [
d2Z ]2 + EI __ 1 + KL (Zl)2+
d x2 Kr 8m
2 }dx (1)
- P ( ~ + PL/2hlE )
:.---:
---~ ;------..--------; ---T (a) 2~
l .... .----.J j ---
(b) , ~2
(c) P ....
CL-----~O ~
~~x ... p
Z I
Fig. 3 Wavy Layers
(a) In-Phase (b) Out-of-Phase (c) General Case
12
13
where
EI = flexural rigidity of the wavy layer/unit width
KT - torsional spring constant of the matrix material/unit width
KL = linear spring constant of the matrix material/unit width
Zl transverse displacement of the mid-surface of the wavy layer
Zo - initial amplitude of the wavy layer
P - far field axial load on the wavy layer/unit width
€o = far-field axial strain
6 = pitch increase due to straightening of the wavy layer
Om - angular deformation of the matrix
a dZl/dx
a a constant calculated from the matrix deformation kinematics
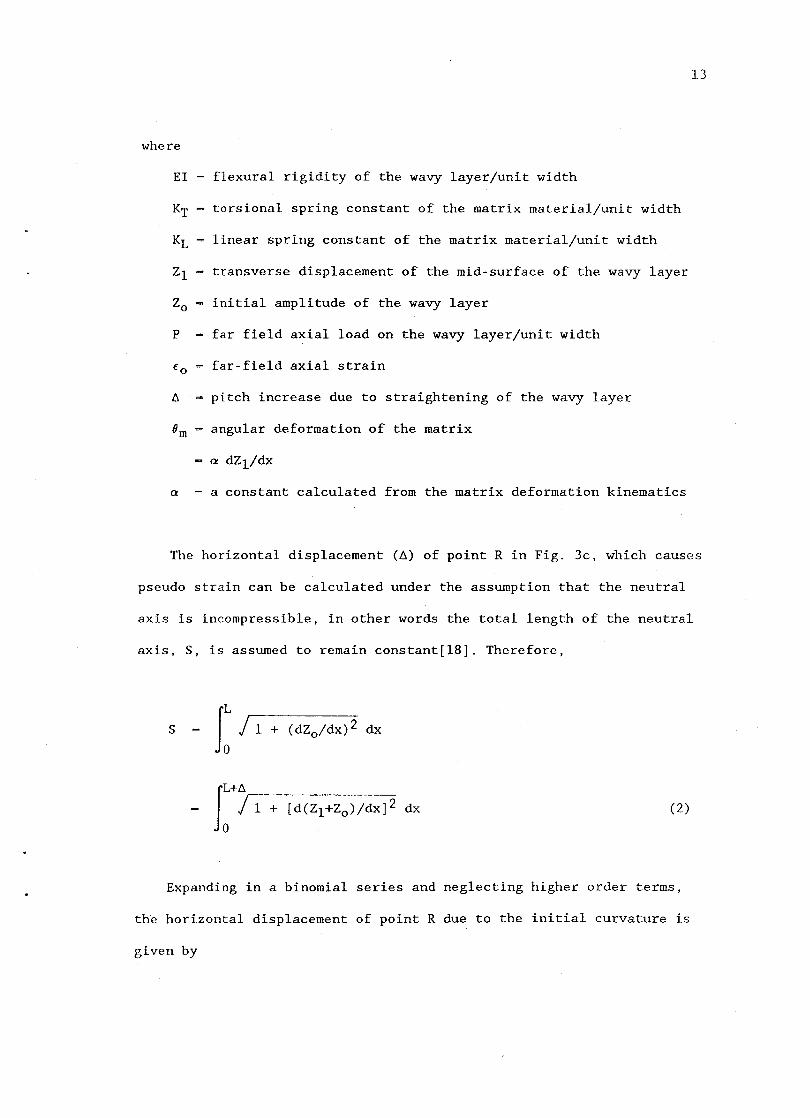
The horizontal displacement (6) of point R in Fig. 3c, which causes
pseudo strain can be calculated under the assumption that the neutral
axis is incompressible, in other words the total length of the neutral
axis, S, is assumed to remain constant[l8]. Therefore,
s - J: j 1 + (dZoIdx)2 dx
JL+6
o J 1 + [d(Zl+Zo)/dx]2 dx (2)
Expanding in a binomial series and neglecting higher order terms,
the horizontal displacement of point R due to the initial curvature is
given by
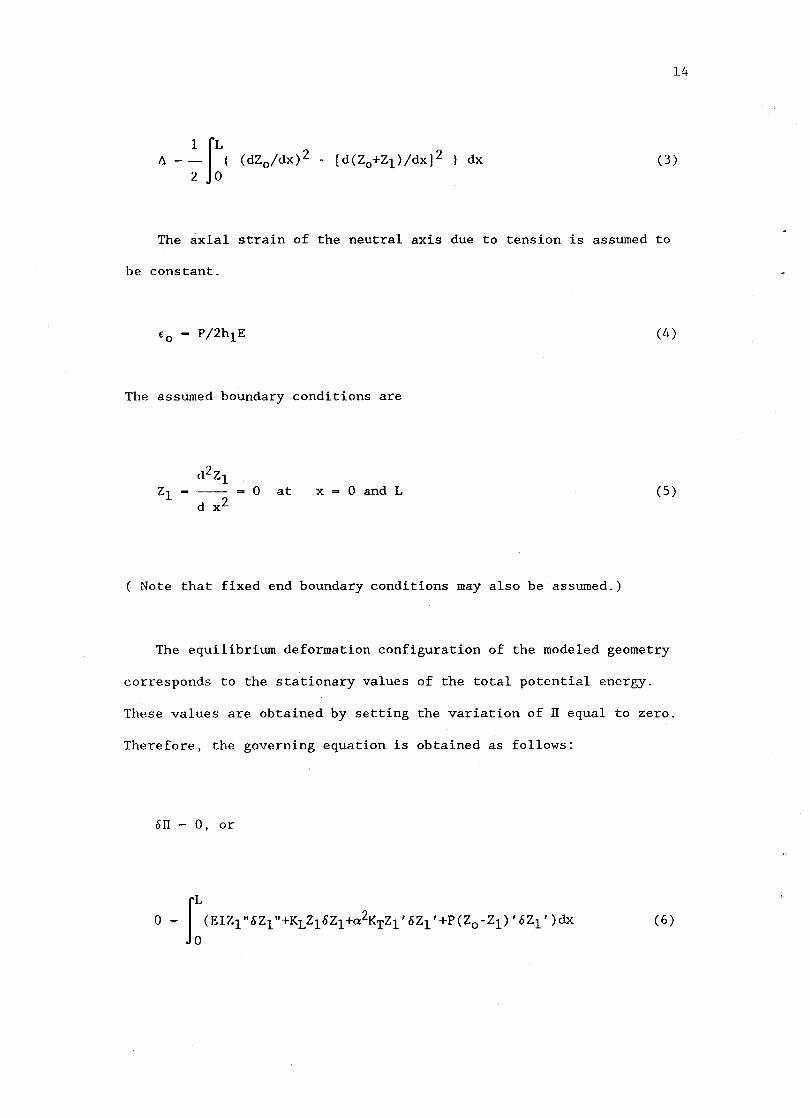
14
1 JL 6 =-- (dZo/dx)2 - [d(Zo+Zl)/dx]2 } dx 2 0
(3)
The axial strain of the neutral axis due to tension is assumed to
be constant.
fO - P/2hlE (4)
The assumed boundary conditions are
d 2Zl Zl = - 0 at
d x 2 x = 0 and L (5)
( Note that fixed end boundary conditions may also be assumed.)
The equilibrium deformation configuration of the modeled geometry
corresponds to the stationary values of the total potential energy.
These values are obtained by setting the variation of rr equal to zero.
Therefore, the governing equation is obtained as follows:
6rr - 0, or
o - !:<EIZl"6Z1"+KLZ16Z1+a2KTZl'6Z1'+P<ZO-Zl)'6Z1')dX (6)
15
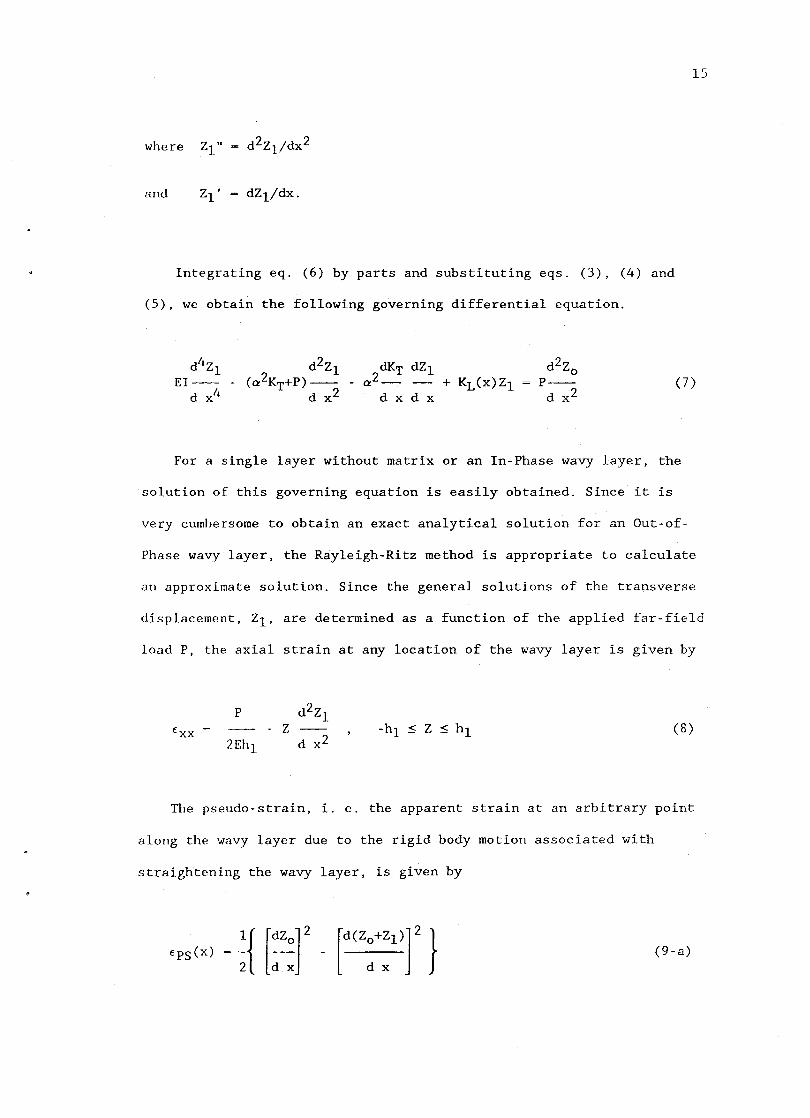
where Zl" ~ d2Z1/dx2
Rnd Zl' = dZ1/dx.
Integrating eq. (6) by parts and substituting eqs. (3), (4) and
(5), we obtain the following governing differential equation.
dKT dZl d4 Z1 EI --
d x4
d 2Z1 (a2KT+P) - 2
d x - a 2 _ - + KL (x)ZI
d x d x
d2Zo P-
d x 2 (7)
For a single layer without matrix or an In-Phase wavy layer, the
solution of this governing equation is easily obtained. Since it is
very cumhersome to obtain an exact analytical solution for an Out-of-
Phase wavy layer, the Rayleigh-Ritz method is appropriate to calculate
an approximate solution. Since the general solutions of the transverse
displacement, Zl, are determined as a function of the applied far-field
load P, the axial strain at any location of the wavy layer is given by
P d 2Z1 (xx - Z
2Eh1 d x 2 -h1 :$ Z :$ h1 (8)
The pseudo-strain, i. e. the apparent strain at an arbitrary point
along the wavy layer due to the rigid body motion associated with
straightening the wavy layer, is given by
l{ [dZo] 2 [d(ZO+Zl)]2
} (PS(x) = - - -2 d x d x
(9-a)
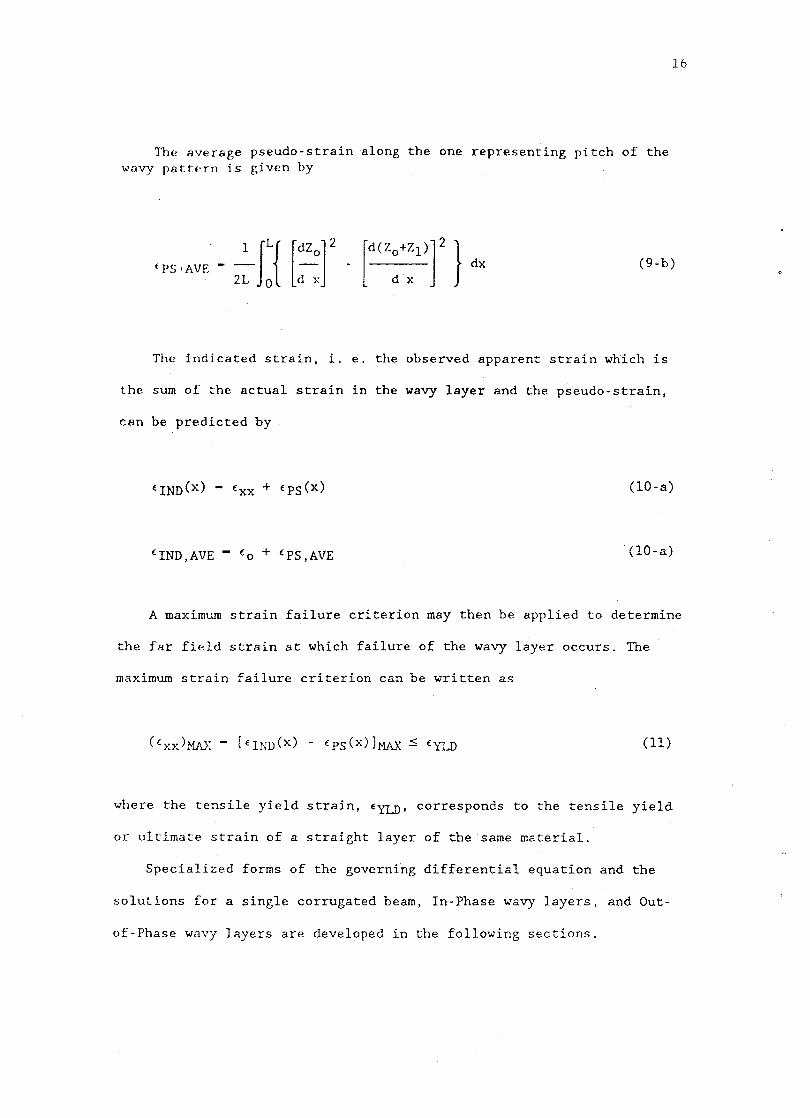
The average pseudo-strain along the one representing pitch of the wavy patt('rn is given by
16
~PS'AVE -_1 JL{ [dZo]2 _ [d(ZO+Zl)]
2 } dx (9-b)
2L 0 d x d x
The indicated strain, i. e. the observed apparent strain which is
the sum of the actual strain in the wavy layer and the pseudo-strain,
can be predicted by
(IND(x) - (xx + (PS(x) (IO-a)
(IND,AVE - (0 + tpS,AVE (IO-a)
A maximum strain failure criterion may then be applied to determine
the far field strain at which failure of the wavy layer occurs. The
maximum strain failure criterion can be written as
(EXX)MA): - [EIND(x) - EpS(X) ] MAX :S EYLD (ll)
where the tensile yield strain, tYLD' corresponds to the tensile yield
or ultimate strain of a straight layer of the same material.
Specialized forms of the governing differential equation and the
solutions for a single corrugated beam, In-Phase wavy layers, and Out-
of-Phase wavy layers are developed in the following sections.
JI
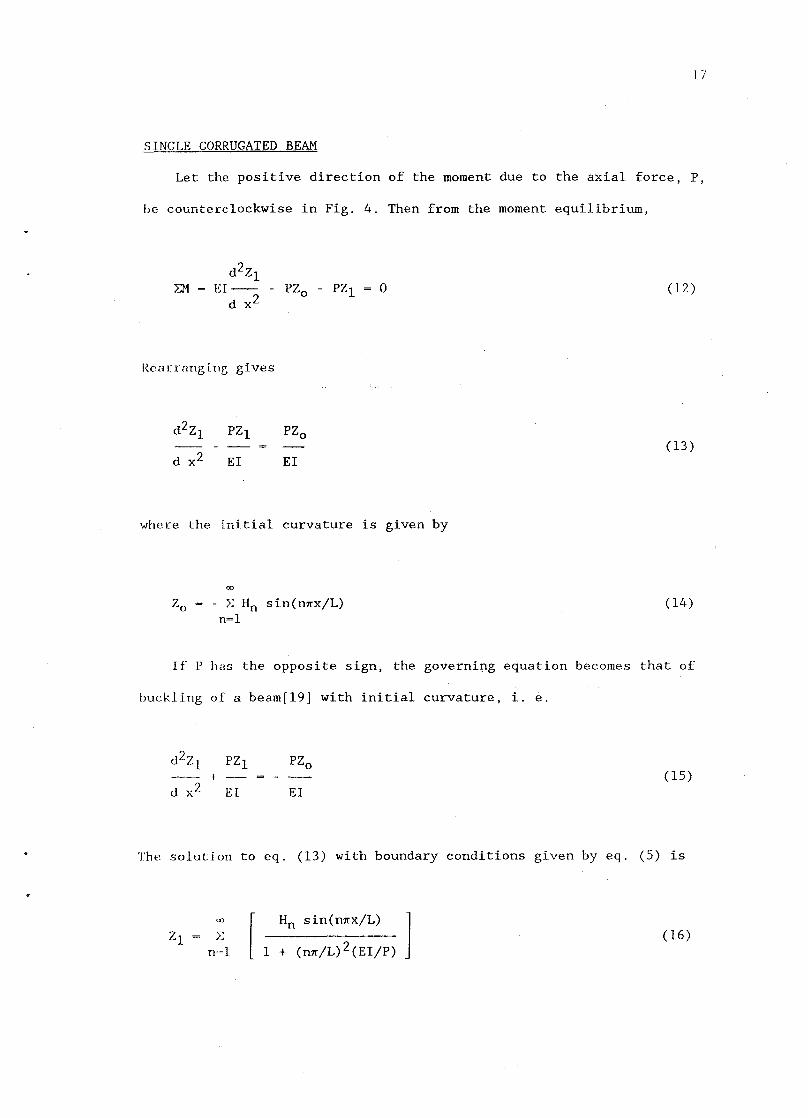
SINGLE CORRUGATED BEAM
Let the positive direction of the moment due to the axial force, P,
be counterclockwise in Fig. 4. Then from the moment equilibrium,
1.11 d2Zl
EI-- - PZo - PZl d x 2
RcnrrnnginE gives
d2Zl
d x 2
PZl
EI
PZo
EI
o
where the initial curvature is given by
Zo 00
- E "n sin(n~x/L) n=l
(12)
(13)
(14)
If P has the opposite sign, the governing equation becomes that of
buckling of a beam[19] with initial curvature, i. e.
d 2Z1 PZl PZo -- ! (15) d x? 1<:1 EI
The solution to eq. (13) with boundary conditions given by eq. (5) is
Zl <Xl
E n·~l [ 1
Hn sin(n.xjL) 1 (16)
~H ()
1 N 1 '11:\ I,
ClJl{VATURE
..... .-1 1::1
-- ----'1 l'
Z()+I::,
~, __ . ___ l I' ~ --4t;;:~,....-=~-x ~-... -~J---J---;;-x-
Z
d2Z1 ~1 (x) E [
d xL
2~1 () M(x) - 1'(;~()+1::1)
~i~. 4 Moment Equilibrium in a Corrugated Beam
without Matrix Material
18
19
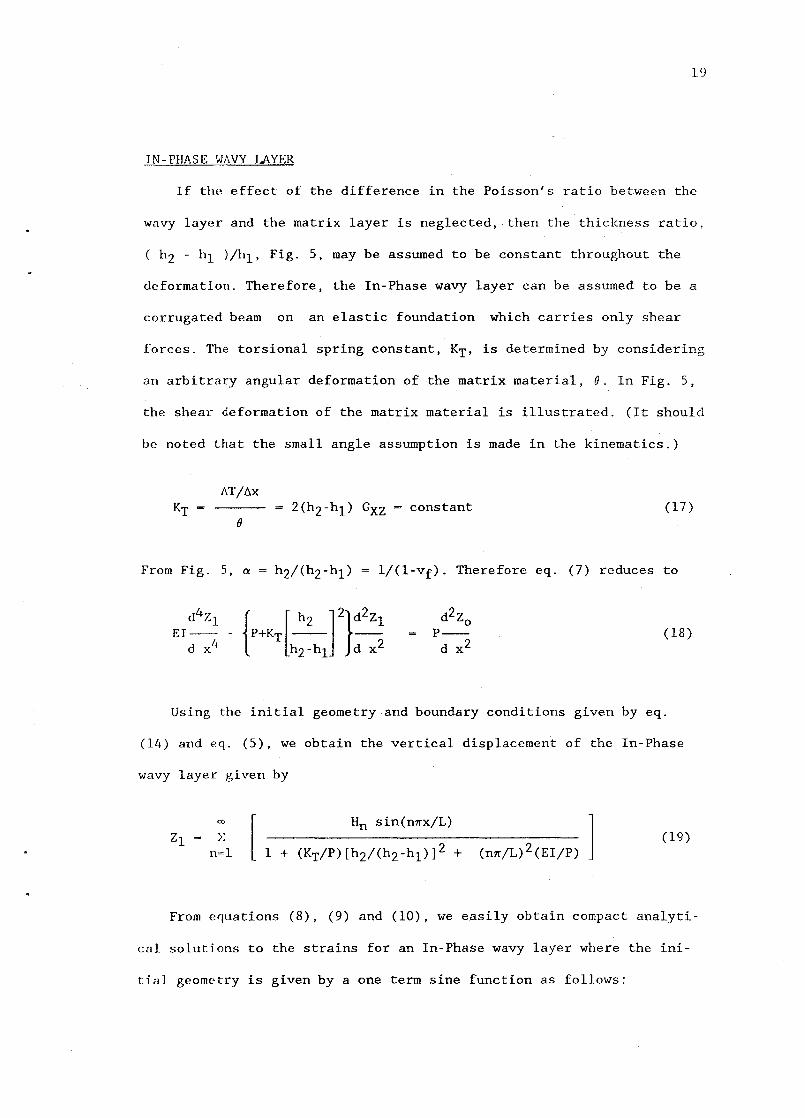
TN-PHASE WAVY LAYER
If tllP effect of the difference in the Poisson's ratio between the
WllVy layer and the matrix layer is neglected, then the thickness ratio,
( h2 - hI )/hl, Fig. 5, may be assumed to be constant throughout the
deformation. Therefore, the In-Phase wavy layer can be assumed to be a
corrugated beam on an elastic foundation which carries only shear
forces. The torsional spring constant, KT , is determined by considering
an arbitrary angular deformation of the matrix material, O. In Fig. 5,
the shear deformation of the matrix material is illustrated. (It should
be noted that the small angle assumption is made in the kinematics.)
I1T/l1x KT - 2(h2 -hl) GXZ constant (17)
e
From Fig. 5, a h2/(h2-hl) l/(l-vf)' Therefore eq. (7) reduces to
d4 Zl EI-
d x4 { [ h2 ]2}d
2Z l
- P+KT -- --h2- hl d x2
d2Z o P--
d x 2 (18)
Using the initial geometry and boundary conditions given by eq.
(14) and eq. (5), we obtain the vertical displacement of the In-Phase
wavy layer given by
Zl 00
L: n=l [ 1 +
Hn sin(mrx/L)
(KT/P) [h2/(h2-h l)]2 + ] (19)
From e~uations (8), (9) and (10), we easily obtain compact analyti-
cal solutions to the strains for an In-Phase wavy layer where the ini-
tial geometry is given by a one term sine function as follows:
2("
1\1':1'(11<1 1)I'Y()I\~1:\'J' ION
t
FIBER
t = 2h1
f-':ATRIX
2(hrhl)
x
o 91= 90 - 90 - 9mb
9mb 90
[2h1/2(h2-h1)]
90 vf/(l-vf)
SMALL ANGULAR DEFORMAT JON
AFTER DEFORHATION
gm
8 0 -e f
82 900-(90 -9f) - 9ma
8ma (90 -Gf) [ 2h1/2(h2-hl)]
(80 -Gf) vf/(l-vf)
SHEAK DEFOI,HATlON OF THE Nl\TIUX NATERIAL
gm = 82 - gl = Ar/(l-vr) , 9 f = dz1/dx
I,'j I> '.i Deformation of the Matrix Material Due to Stretching of the
Itlitial Curvature of the Main Load-Carrying Layers(In-Phase)
! ~\;c .' !IIJII.,,:
, I,
II !~'~:'.' I,:" , ..
2l
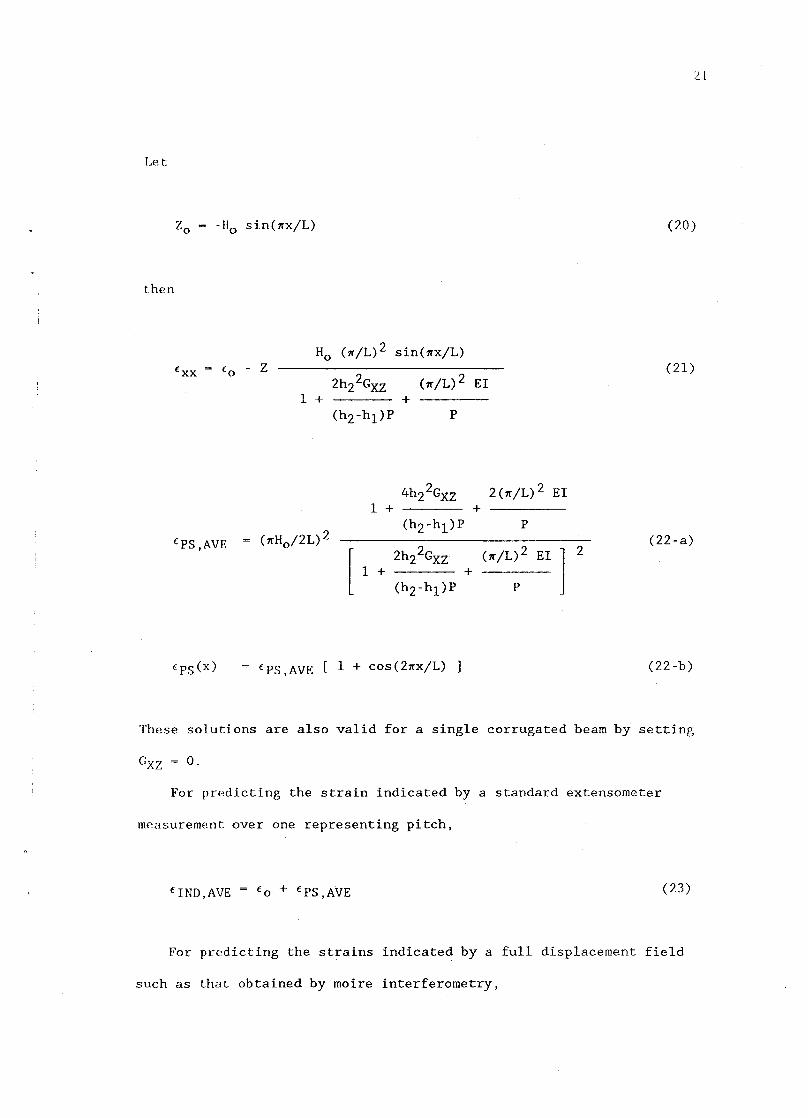
Let
20 -Ho sin(1rx/L) (20)
then
H (1r/L)2 sin(1rx/L) 0 f - <0 - 2 xx
2h22GX2 (1r/L) 2 EI (21)
1 + + (h2-h1)P P
4h2 2GX2 2(1r/L)2 EI 1 + +
fpS,AVE = ( 1rHo/2L)2 (h2-h1)P P
[ 2h 20
(22-a)
1 + 2 XZ + (K/L)2 E1 1 2
(hrh1)P P
fpS(X) fpS,AVE [ 1 + cos(21rx/L) ] (22-b)
These solutions are also valid for a single corrugated beam by setting
GX2 o.
For predicting the strain indicated by a standard extensometer
measurement over one representing pitch,
fIND,AVE fO + fpS,AVE (23)
For predicting the strains indicated by a full displacement field
such as that obtained by moire interferometry,
22
tIND(X) txx + tpS(x) (24)
along the upper and lower surfaces of each wavy layer, where
-hI :c:: Z :s hI
P 2hl E to / unit width
2 I - (2h l )3/l2 = -h13 / unit width.
3
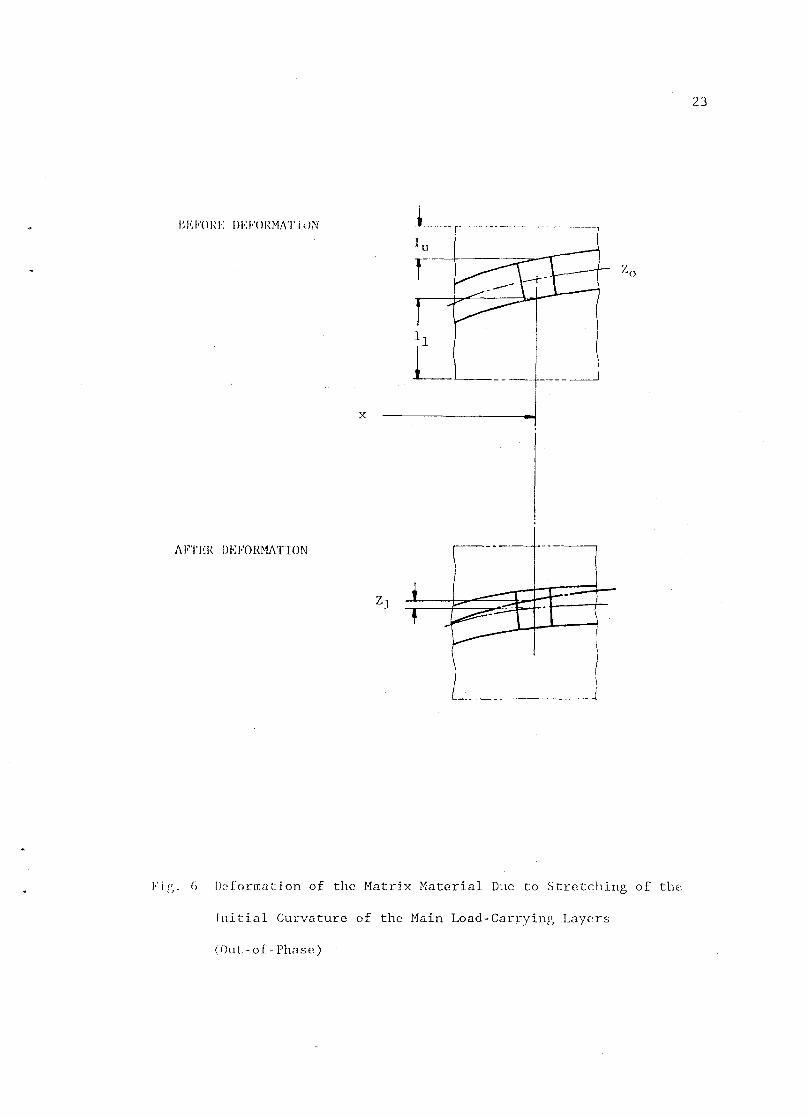
OUT-OF-PIIASE WAVY LAYER
(25)
Since the straight lines AB and CD of the Out-of-Phase segment,
Fig. 3b, remain straight after deformation, the Out-of Phase wavy layer
can be assumed to be a corrugated beam on an elastic foundation which
carries only tension-compression forces in the Z direction. The linear
spring constant of the elastic foundation, as illustrated in Fig. 6, is
given as a function of x. The upper and lower matrix layers of the
representing segment are assumed to be two arrays of linear springs of
different spring constants. Along the upper surface the length of the
linear springs is given by
lu - (h2 - hI ) + Ho sin(wx/L) (26)
BI':I"OI:I': 1l1':VORMAT WN
x
AFTER DE FORMI\T ION
Zl
•
Ll---J----~ -,
) I \ ______ ----l
Zo
Fi g_ () Ild.-ormation of the Matrix Material Due to Stretching of the;
Initial Curvature of the Main Load-Carrying Layers
( 0 u t: - 0 f - Piw s e )
23
24
Along the lower surface,
11 (h2 - hl ) - Ho sin(1rX/L) (27)
The equivalent spring constants of the upper and lower matrix material
are given by
Ku = ET/lu and (28)
Kl = ET/ll' (29)
respectively.
Therefore, the total contribution of the matrix layer in one represet
ing segment can be replaced by a linear spring of which the spring con
stant is given by
KL = Ku + Kl '
or
2(h2-h l) ET KL(x)
(h2-hl)2 - Ho2sin2(~x/L) (30)
where the initial geometry is given by
Zo ~ -110 sin(~x/L) . (31)
Then the governing differential equation, eq. (7), becomes
d 2Zl d2Z o
25
d4 Zl EI -
d x4 P-- + KL(x) Zl
d x 2 P--
d x2 (32)
Since Zl should be symmetric with respect to x = L/2, we may assume
Zl - L Ci sin(i~x/L), i odd
1,3,5, ... ,2n-1.
The principle of minimum potential energy may be expressed as
a IT/B Ci = 0 for all i ~ 1,3,5, ... ,2n-l.
(33)
(34)
Substituting eq. (33) into eq. (1) and then applying eq. (34) yields n
equations which are solved simultaneously for the unknown constants Ci .
Table 1 shows that the four-term approximate solution is sufficient for
the test cases considered herein.
HESULTS OF TilE PARAMETER STUDY
Using eqs. (16), (19), (23), and (8-10), the indicated and actual
strains for the three cases described above can be expressed in terms
of the far-field strain, f O ' which is the equivalent strain in a
straight layer under the same loading conditions; thus the ratio
between the reference strain and the far-field strain is always one.
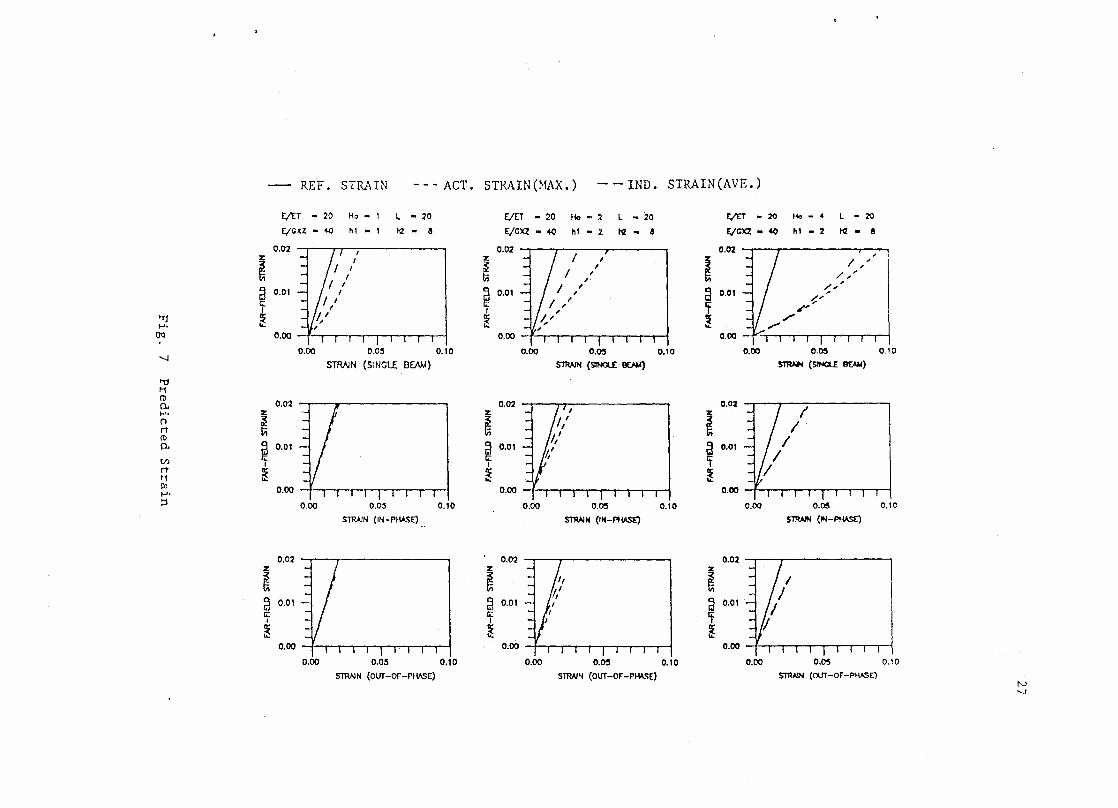
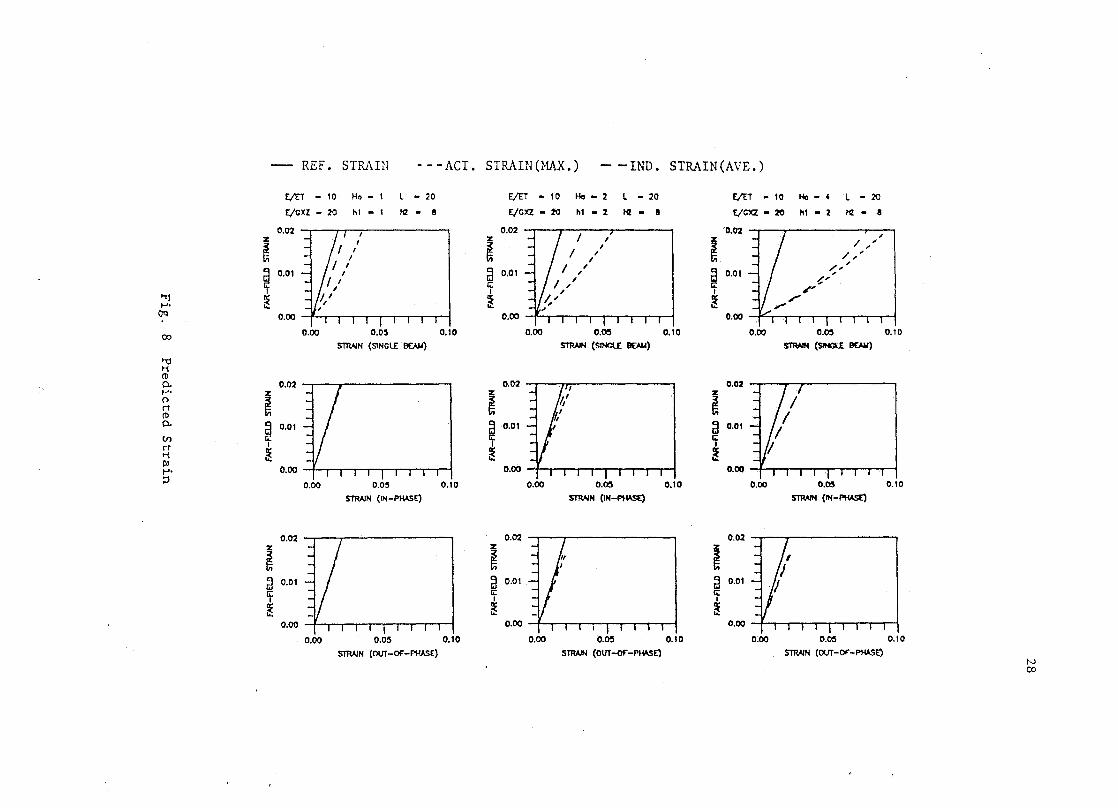
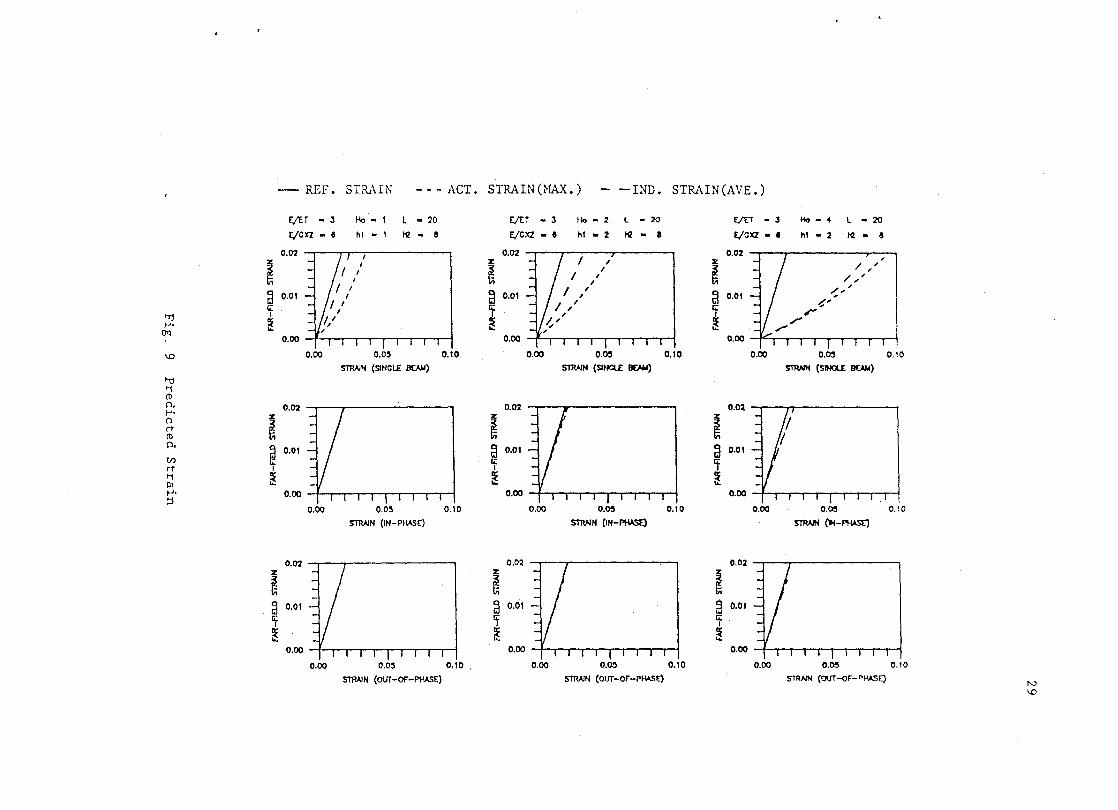
The maximum value of actual strain and the indicated(extensometer)
strain are predicted and illustrated in Figs. 7-9. Three different com-
binations of geometric parameters of a single corrugated beam, an In-
Phase layer, an Out-of-Phase layer are used as input data for three
different material configurations. Also, the predicted variations of
26
Table 1 Comp<lrison of Constants(Ci) for
Out-of-Phase Configurations
I E T Gxz L hl h2 HO Cl C3 C5 C7
?u 0.5 20 2 8 4 ·1.23E·02 ·1.60E -04 3.01E-06 -1.14E-07
10 0.5 20 2 8 4 -6.53E-03 ·1.58E·04 2.93E-06 ·1.11 E -07
'r 0.5 20 2 8 4 -2.06E-03 -1.24E-04 2. 19E -06 -8.17E-OB .J
HI_', O.4f. 0.163 0.51 0.015 0.050 0.015 -5.47E-06 -2.64E-07 7.72E-10 -7.66E-12
111. " O.4f, 0.163 0.51 0.015 0.275 0.078 ·2.28E-04 -3.05E-06 8.19E-09 -4.B7E-l1
10.', OJ,f, 0.163 0.51 0.024 0.100 0.030 -3.84E-05 -8.98E-07 4.25E-09 -4.4SE-11
1:1 <:1 sin(7Tx/L) + C3sin (37TX/L) + CSsin(S7Tx/L) + C7 sin (7n:/L)
- REF. STRAIN - - - ACT. STRAIN(HAX.) - -- IND. STRAIN(AVE.)
E/ET - 20 Ho - 1 - 20 E/ET - 20 He - ~ L - 20 E/n -~ Ho - 4 L - ~ f/GXZ - 40 hI - 1 I'CZ - II E/CXZ - 4C hI - :I. I'CZ - II E/CXZ - 40 hi - 2 I'CZ - !I
o.en 0.02 e.en
~ 2:
~ ,
~ I , ,
/, ,
d 0.01 d 0.01 d 0.01 ~,'"
?' t;; t;; t;;
"" I I I 'Tj ~ ~ ~ /' f-'. ,,-
()Q 0.00 0.00 0.00 I I I I I I I 0.00 0.0:1 0.10 0.00 O.~ 0.10 0.00 0.0:1 0.10
"--J STR.AJN (SINGLE BEMI) STlWH (SINCl£ IVM) STIWoI (SINCLE B£.A.W)
"0 Ii ro
0.02 0.02 0.02 0-f-'. 2: Z
I () ~ ~ rt C1> 0- d 0.01 d 0.01 d 0.01
en t;; t;; t;; I I I
rt ~ ~ ~ Ii
PI 0.00 0.00 0.00 f-'. ::I 0.00 0.0:1 0.10 0.00 0.0:1 0.10 0.00 0.0:1 0.10
STlWN (IN-PHASE) ST'AAIH {IH-PI-lASQ S1RNH (JIoI-PWSf:)
o.en 0.02 0.02 z 2: Z
~ ~ ~ d 0.01 ~ 0.01 d 0.01 [;: [;: Ii: I I I
~ ~ ~ 0.00 0.00 0.00
1 0.00 0.05 0.10 0.00 O.~ 0.10 0.00 0.05 0.10
STlWH (OUT-Or-PHASE) STRAJH (OUT -or -Pw.5E) ST1UJN (OUT-Or-PHASE) N '--l
-- REF. STRAIN - - - ACT. STRAIN (HAX.) -IND. STRAIN(AVE.)
£lEi - 10 Ho - 1 L - 20 £/ET - 10 Ho - 2 L - 20 £lEi - 10 He! - • L -20
E/CXZ -20 hI - 1 I'CZ - II E/CXZ - 20 h1 - 2 HZ - II E/CXZ - 20 hl- Z I'CZ - 8
0.02 0.02 0.02 Z z
! ~
~ ~ / ~ ~
/~ ~
~
a 0.01 a 0,01 d 0.01 --;,
-t' !4: !4: Ii: r' I I I "'1 ~ ~ ~ r fo'. ,.,
(Jq 0.00 0.00 0.00
co 0.00 0.05 0.10 0.00 o.~ 0.10 0.00 0.05 0.10
S1'lWN (S1NCl£ 1l£AU) STTWN (smcu: l1£).l.I) sm.MI (S1NCLE .l1£).l.I)
'"d '1 (1)
0- 0.02 0.02 0.02 fo"
! z
! n ~ rt
(b
0- ~ 0.01 d 0.01 d 0.01
til Ii: Ii: Ii: rt I I I '1 ~ ~ ~ 1\1
0.00 0.00 0.00 fo'. :,:j
0.00 0.05 0.10 0.00 0.05 0.10 0.00 0.05 0.10
S1'lWN (IN-PKlSE) S1'lWN (IN-~ rnwN (IN-PHASE)
0.02 0.02 0.02 z z z
~ ~ ~ d 0.01 d 0.01 d 0.01
Ii: Ii: Ii: I I I
~ ~ ~ 0.00 0.00 0.00
0.00 0.05 0.10 0.00 0.05 0.10 0.00 0.05 0.10
S1'lWN (OUT-Of"-PHASE) STRAIN (OUT -<1r -PfW;E) S1'lWN (OUT-Of"-PfW;E) N co
- REF. STRAIN ACT. STRAIN (HAX. ) -IND. STRAIN(AVE.)
f.ltT - J He - 1 - 20 E/tT - .) flo - 2 L -~ £/0 - J .... -. L -20
£jCXZ - e hI - I HZ - II £jC'tJ. - e hi - Z HZ - II £jC'tJ. - • hI - 2 HZ - II
0.02 0.02 . ,~ ~! / " ~ z
~ ~ / /~ ~ 0.01 ~ 0.01 d 0.01 ,~", (;: Ii: 10: ?
"Tj I I I .r-1-" ~ ~ ~ //
()Q 0.00 0.00 0.00
\0 0.00 O.O~ 0.10 0.00 o.~ 0.10 0.00 o.~ 0.10
SlRAIH (SlHCLE ~) S1'IWN (SlNCl£ I!QM) smM4 (SINCU ~)
'" t1 (l)
0. 0.02 0.02 0.02 1-"
I z z ()
~ ~ rt (l)
0. ~ 0.01 d 0.0\ d 0.01
t/) (;: 10: rt I I I t1 ~ ~ ~ 1\1 1-" ::l
0.00 0.00 0.00
0.00 O.O~ 0.10 0.00 o.~ 0.10 0.00 o.~ 0.10
SlRAIH (IH-PHASE) STlWH (IH-P!~ Sl!WH (lH-P'MASt)
0.02 0.02 0.02 z z z
~ ~ ~ ~ 0.01 ~ 0.01 9 0.01 w Ii: (;: [i: I I I
~ ~ ~ 0.00 0.00 0.00
0.00 O.O~ 0.10 0.00 o.~ 0.10 0.00 o.~ 0.10
STAAlH (OUT-Of-PHA$E) SlRAIH (OUT-or-p~E) S11WN (ovr-or-pwsE) N \0
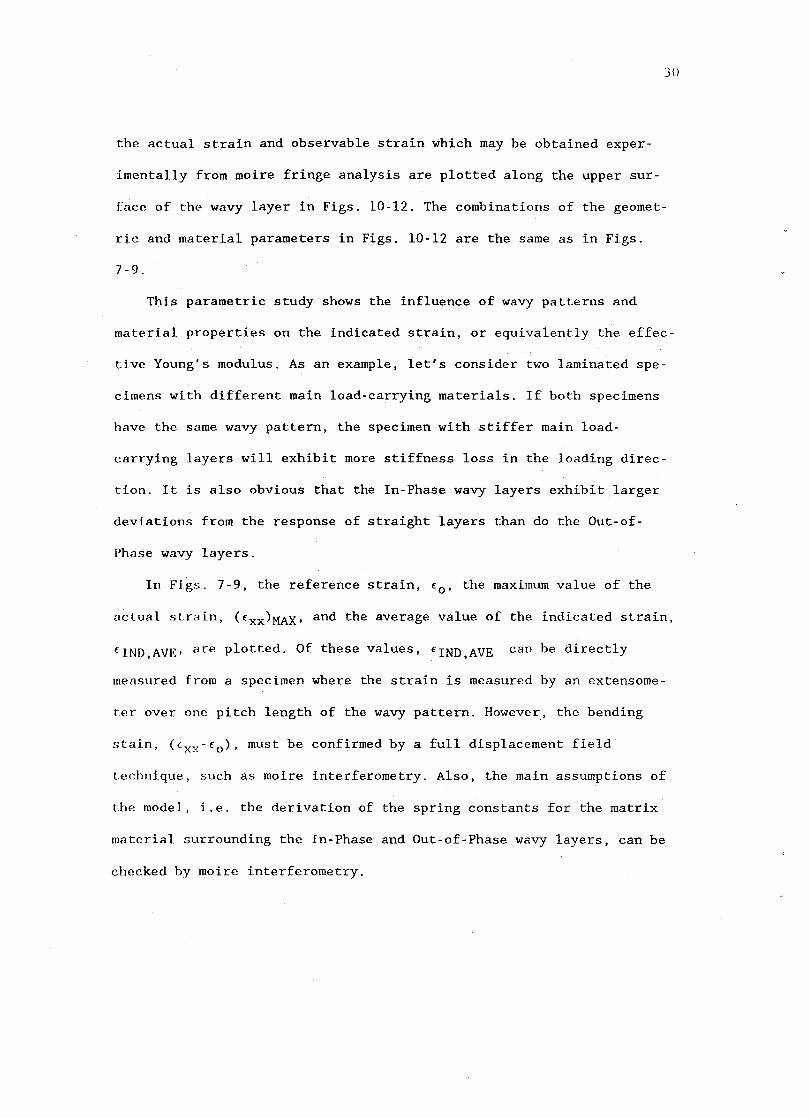
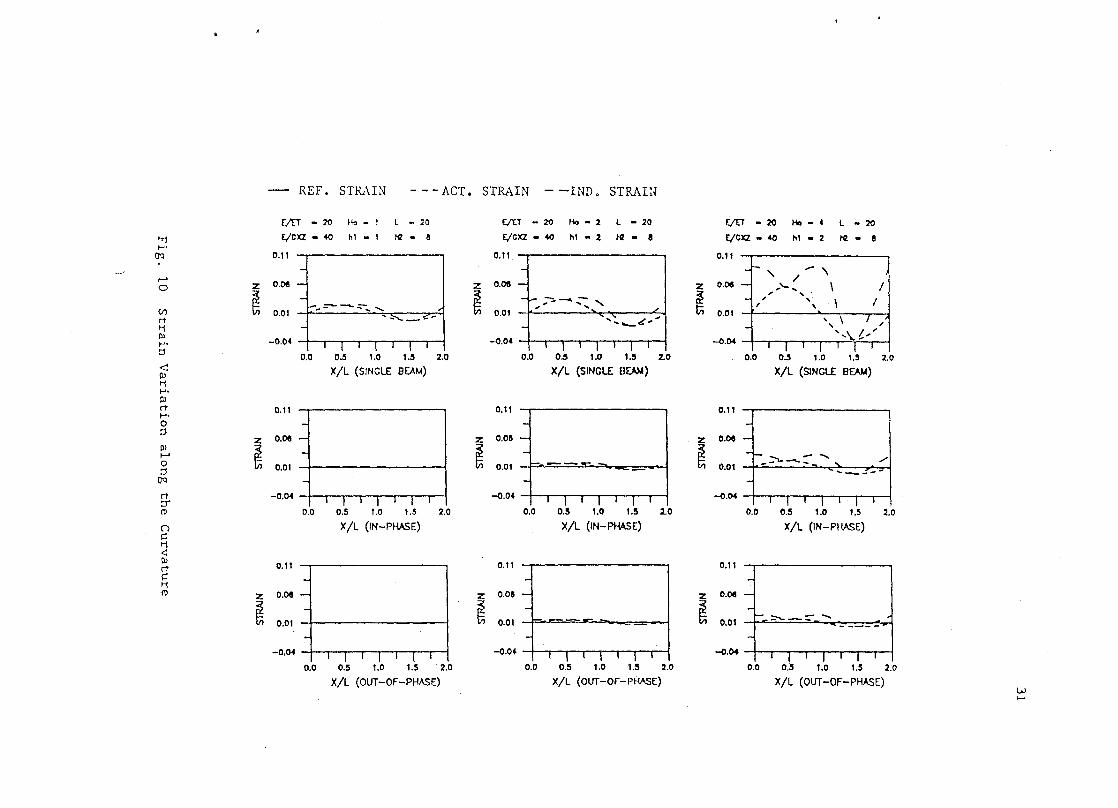
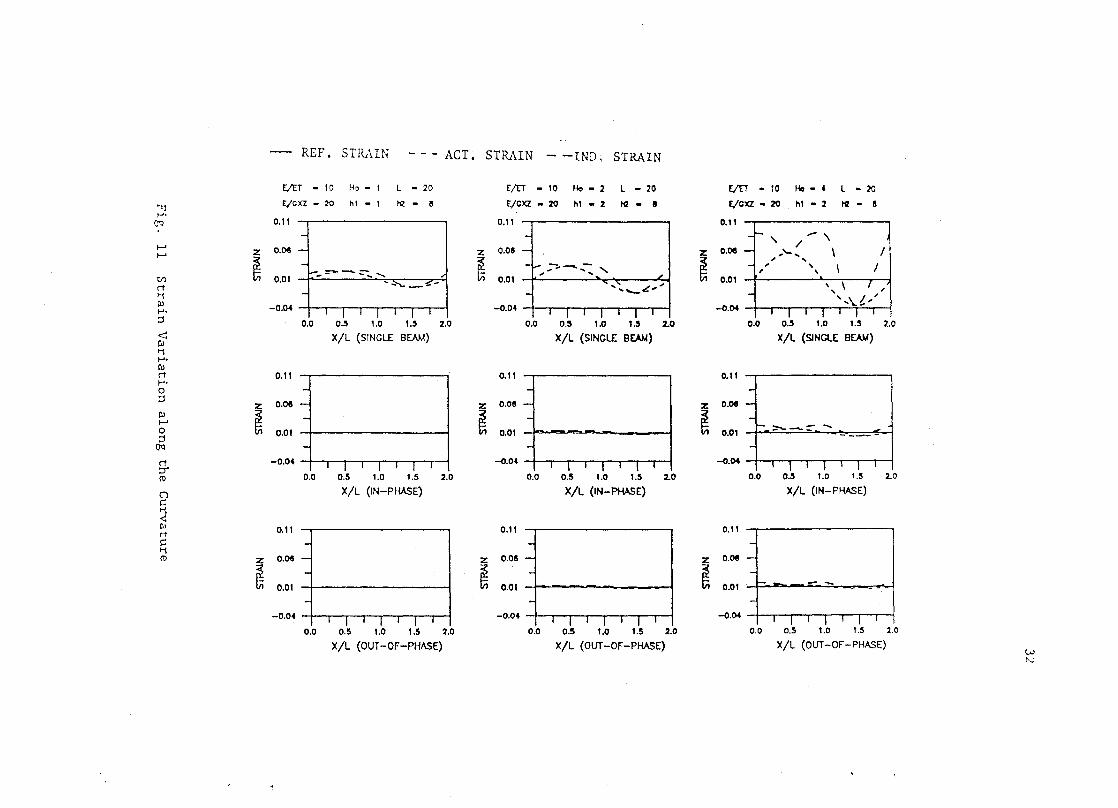
30
the actual strain and observable strain which may be obtained exper
imentally from moire fringe analysis are plotted along the upper sur
face of the wavy layer in Figs. 10-12. The combinations of the geomet
ric and material parameters in Figs. 10-12 are the same as in Figs.
7-9.
This parametric study shows the influence of wavy patterns and
material properties on the indicated strain, or equivalently the effec
tive Young's modulus. As an example, let's consider two laminated spe
cimens with different main load-carrying materials. If both specimens
have the same wavy pattern, the specimen with stiffer main load
carrying layers will exhibit more stiffness loss in the loading direc
tion. It is also obvious that the In-Phase wavy layers exhibit larger
deviations from the response of straight layers than do the Out-of
Phase wavy layers.
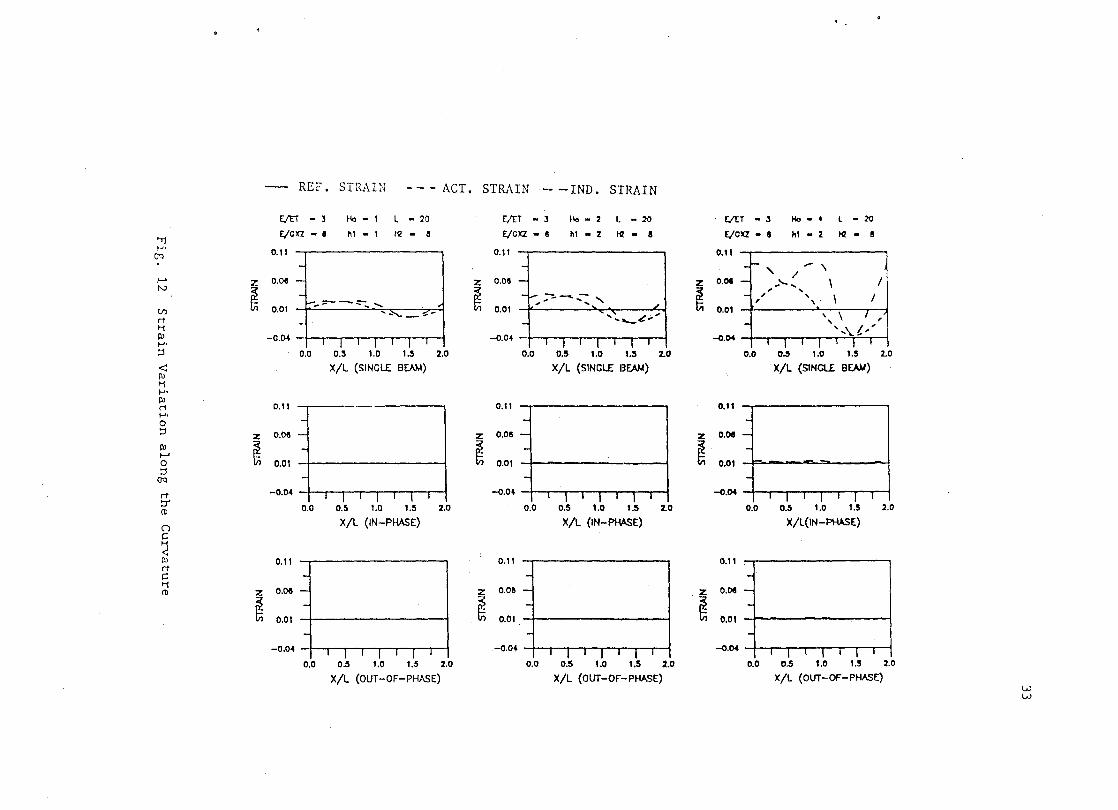
In Figs. 7-9, the reference strain, fO' the maximum value of the
f1ctual strain, (fxx)MAX' and the average value of the indicated strain,
fIND,AVE' are plotted. Of these values, fIND,AVE can be directly
measured from a specimen where the strain is measured by an extensome
ter over one pitch length of the wavy pattern. However, the bending
stain, ({xx-fo)' must be confirmed by a full displacement field
technique, such as moire interferometry. Also, the main assumptions of
the model, i.e. the derivation of the spring constants for the matrix
material surrounding the In-Phase and Out-of-Phase wavy layers, can be
checked by moire interferometry.
- REF. STRAIN - - - ACT. STRAIN - -IND. STRAW
VET -20 H<> - I L - 20 (/H -20 He> - 2 l. - 20 E/tT -20 He> - 4 L -20
"1 £ICX! - 40 hI - I K! -II £ICX! - 40 hl - 2 /'2 - II £leX! - 40 hl - 2 K! - II
~.
()':l O.ll O. " 0.11
- - " /.- \ ~ 0.08 - O.OS - 0.08 0 Z Z Z ... '-... \ I
~ - ~ -.-.... :::-~ ~ " ~ , , , , I ..--=-- ---...~ ....... f In
, , (/) 0.01 0.01 0.01 rt ''''--''''' ,~,-".( ... "" ~ - -Pl
-0.04 -0.04 -0.04 ~. I I I I I I I I I I I I I I ::l
0.0 O.s 1.0 1.s 2.0 0.0 0.5 1.0 1.5 2.0 0.0 O.s 1.0 1.5 2.0 < X!L (SINGLE BEAM) X!L (SINGLE ElE.AAl) X!L (SlNGl£ BE.AAI) Pl ~ ~.
Pl rt 0.11 ~. D." 0.11
0 - -::l
z 0.08 - Z o.oe - Z 0.08 PI
~ - ~ - ~ +- -, ~ 0 0.D1 0.01 --- 0.01 .. ---"'-......" . / ::l c: .... __ .!'_ ....
()':l - - .., rt -0.04 -0.04 -0.04 ::r I I I I I I I I I I I I I I I I ct> 0.0 0.5 1.0 1.5 2.0 0.0 O.S 1.0 1.5 2.0 0.0 0.5 1.0 1.5 2.0
()
C X!l (IN-PHASE) X/L (IN-PHASE) X!L (IN-PHASE)
~ PI
O.ll 0.11 0.11 rt C - -~ ct> Z 0.08 - Z O.OS - Z 0.08
~ - ~ - ~ 0.01 ~~-:::- ..... 0.01 0.01 --
-0.04 I I I I I I I
-0.04 I I I I I I I
-0.04 I I 0.0 0.5 1.0 1.5 2.0 0.0 O.S 1.0 1.5 2.0 0.0 0.5 1.0 1.5 2.0
X/l (OUT-OF-PHASE) X!L (OUT-OF-PHASE) X/l (OUT-OF-PHASE) w ~
-- REF. STRAIN - - - ACT. STRAIN - -IND, STRAIN
E/ET - 10 Ho - 1 L - 20 E/ET - 10 He - 2 L - 20 r;tT - 10 He - 4 L -20
'Tj r;c:a - 2Q hi - 1 HZ - e E/C'ICl. - 2Q hI - 2 ~ - I r;C'ICl. - 20 hi - Z ~ - II 1-"
en 0.11 0.11 0.11
- - -'- , - \ / ~ z O.~ - Z 0.011 - Z 0.08 - .. '- ... \ I ~
~ - ~ ~ , ,
- r-.... ;::. --'':: " , , I
--::--~ .... " , ,
til 0,01 "'~-"'-
0.01 0.01 rt .... '...~.c! ........ ',\ I, ~ - - ' ... \.[. .. ' til -0.04 -0.04 -0.04 1-" I I I I I I I I I I I I I I I I I I I I I ;j 0.0 0.5 1.0 1.5 2.0 0.0 0.' 1.0 1.' 2.0 0.0 0.' 1.0 1.:1 2.0
< X!L (SINGLE BEAM) X!L (SINGLE BEAM) X!L (SlNGli BEAM) til ~ 1-" \Il rt 0.11 0.11 0.11 1-" 0 - - -;j
o.~ - o.os - O.~ -Z Z Z \Il
~ - ~ - ~ -~ r- ::-..._=:" -0 0.01 0,01 0.01 ;j
()'q - - -rt -0.04 I I I I I I I -0.04 I I I I I I I
-0.04 I I I I I I ::r'
ro 0.0 0.5 1.0 1.5 2.0 0.0 0.5 1.0 1.5 2.0 0.0 0.5 1.0 1.5 2.0
() X!L (IN-PHASE) X/L (IN-PHASE) X!L (IN-PHASE) ~
~ til 0.11 0.11 0.11 rt C - - -~ ro z o.~ - z O.OS - Z 0.08 -
ffi - ~ - ~ -
0.01 om 0.01 -_ .. .£:""- -
- - --0.04 I I I I I I I
-0.04 I I I I I I I -0.04 I I I I I I I
0.0 0.5 1.0 1.5 2.0 0.0 0.5 1.0 1.5 2.0 0.0 0.5 1.0 1.5 2.0
X!L (OUT-Of-PHASE) X!L (OUT-Or-PHASE) X!L (OUT -Of -PHASE) w N
-- REF. STRAni ACT. STRAIN - -IND. STRAIN
E/tT - 3 Ho - 1 L - 20 EjET - J Ho - 2 l. -20 E/t:T - J Ho - 4 L -20
'"Tj £/GXZ - I hI - 1 t<Z - S £/G>a. - e h1 - 2 til! - II £/G>a. - , hI - 2 t<Z - 8
..... en 0.11 0.11 0.11
- - , / -- \ r' Z o.~ - Z 0.05 - Z 0.01 .. '-... \ I tv
~ ~ ~ .- ,
-- ~., ;::. -c. -=: " , ,
\ I --:::--- ~ ....... , , til 0.01 0.01 L 0.01 rt '~-"'- ' .... ___ .rt!;"" - -'i II> -0.D-4 -0.04 -o.D-4 ~. I I I I I I I I I I I I I I ;:J 0.0 0.5 1.0 loS 2.0 0.0 0.5 1.0 1.5 2.0 0.0 OOS 1.0 1.5 2.0
<: X/L (SINGl£ BEAM) X/L (SINGl£ BEAM) X/L (SINGLE BEAM) II> 'i ~.
II> 0.11 0.11 0.11 rt
~.
0 - -;:J
Z 0.01 - Z 0.05 - Z 0.01
II> ~ - ~ - ~ f--I 0 O.ot 0.01 0.01 ;:J
()Q - -rt -0.D-4
I I I I I I I -0.04
I I I I I I I -0.04 I I I ::r
ro 0.0 0.5 1.0 1.5 2.0 0.0 0.5 1.0 1.5 2.0 0.0 0.5 1.0 1.5 2.0
(') X/L (IN-PHASE) X/L (IN-PHASE) X/L(IN-PHASE)
c 'i < II> 0.11 0.11 0.11 rt C - -'i
0.01 - o.oe - 0.01 ro z z z
~ - ~ - ~ 0,01 0.01 0.01
- --0.04
I I I I I I I -0.04
I I I I I I I -0.04 I I
0.0 0.5 1.0 1.5 2.0 0.0 0.5 1.0 1.5 2.0 0.0 0.5 1.0 1.5 2.0
X/L (OUT -Of -PHASE) X/L (OUT-Of-PHASE) X/L (OUT-OF-PHASE) w w
34
EXPERIMENTAL PROGRAM
An experimental program was conducted to verify the accuracy of the
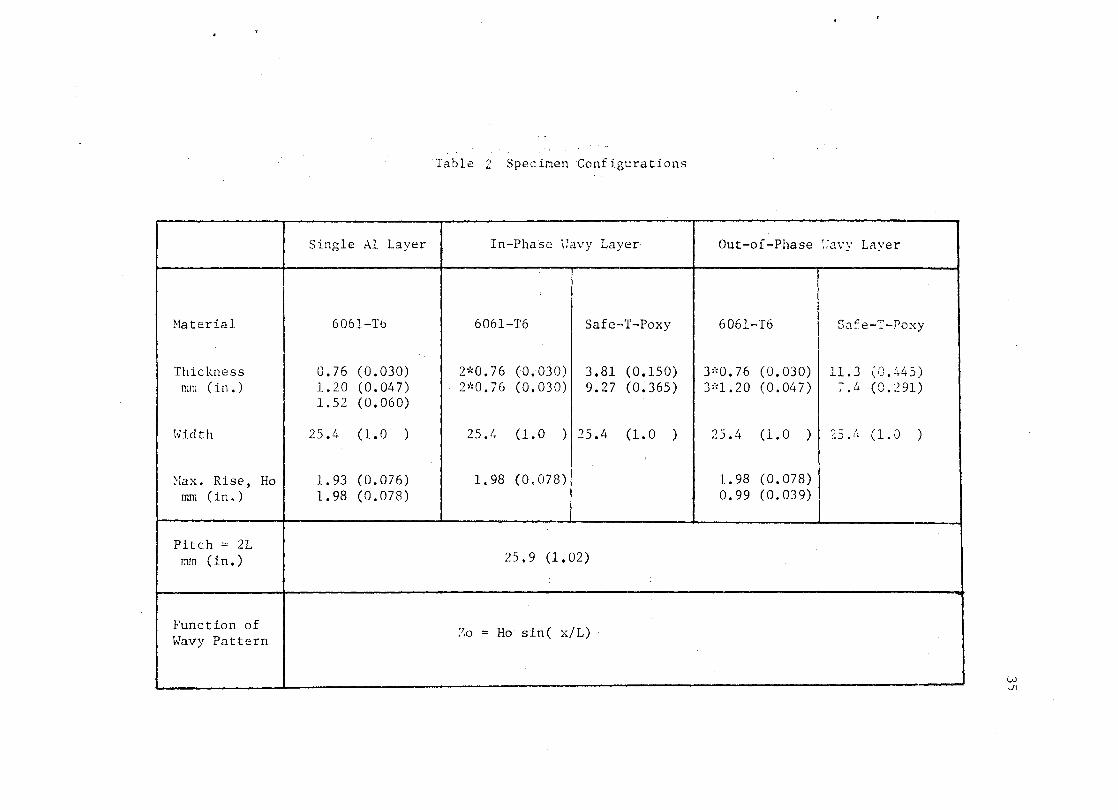
proposed mathematical model. Tensile specimens for each model type
were prepared from aluminum 606l-T6 sheets of 0.76 mm (0.03 in.), 1.20
mm (0.047 in.), and 1.52 mm (0.06 in.) thicknesses, and room tempera
ture curing epoxy. These materials were selected because of the neces
sity to fabricate precise wavy patterns in the main load-carrying
layers. The dimensions of each specimen and the mechanical properties
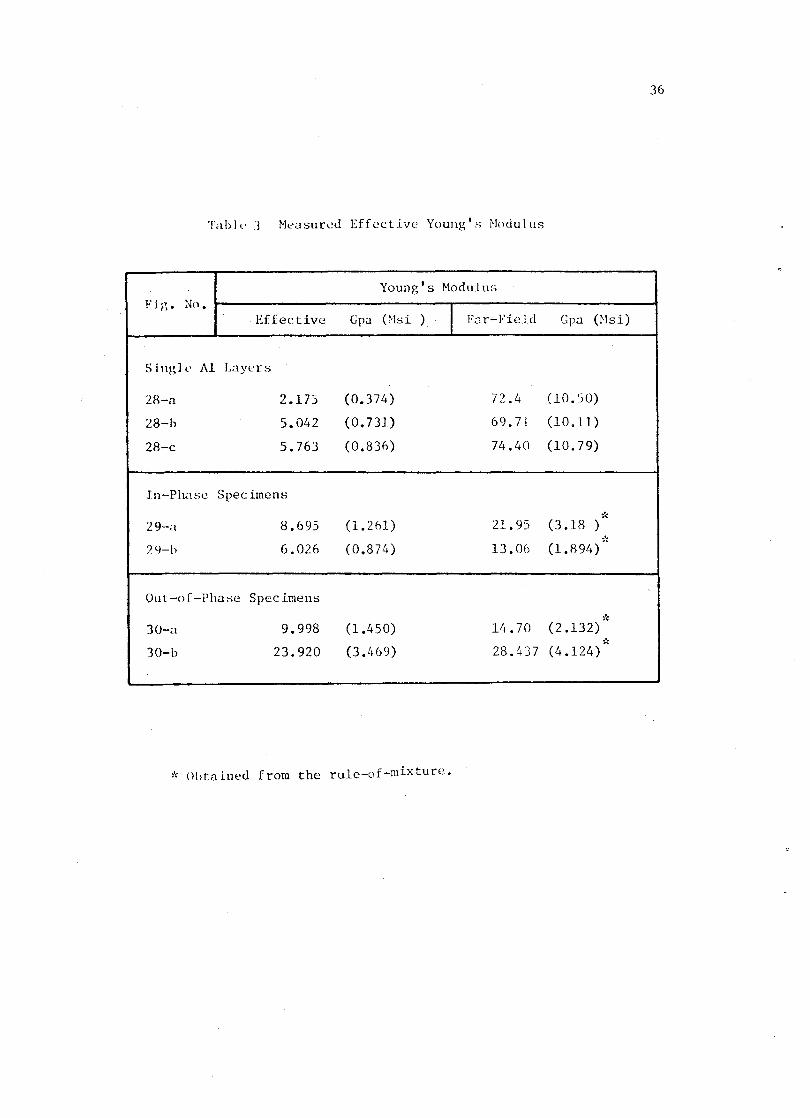
are given in Table. 2 and 3. The effective Young's moduli were measured
by a one inch extensometer and the bending strains along the wavy alu
minum layers were calculated from the analysis of the fringe pattern
obtained from moire interferometry. Further details of the specimen
preparation and experimental program are given in the following sec
tion.
MATERIAL PROPERTIES OF RAW MATERIALS
Using the average of three to five replicated tension tests con
ducted on an MTS testing machine and using a one inch extensometer, the
Young's modulus of straight aluminum specimens was found to be 72.4 CPa
(10.5 Msi). The Young's modulus and the Poisson's ratio of the epoxy
were 3.034 CPa (0.44 Msi) and 0.35, respectively. (The elastic con
stants of the epoxy were measured by an extensometer and a strain gage
rosette.) The shear modulus of the epoxy was estimated as 1.124 CPa
(0.163 Msi) from the isotropic relationship given by
C = E/2(1+v) (35)
Single Al Layer
:1a terial 6061-T6
Thickness 0.76 (0.030) mm (in.) 1. 20 ( 0 • 047)
1.52 (0.060)
l.Jidth 25.4 (1.0 )
:!ax. Rise, Ho 1.93 (0.076) mm (in.) 1.98 (0.078)
Pitch = 2L mm (in.)
Function of Wavy Pattern
Table 2 Spec ir.len Configurations
In-Phase ~~vy Layer
6061-T6 Safe-·T-Poxy
21~0. 76 (0.030) 3.81 (0.150) 2'~0. 76 (0.030) 9.27 (0.365)
25.4 (1.0 ) 25.4 (1. 0 )
1.98 (0,078)
I 25.9 (1.02)
Zo = Ho sine x/L)
-- - --- _. -_._--
Out-of-Phase l~vy Layer
6061-T6 Sa:Oe-T-T'oxy
3"~0.76 (0.030) 11.3 (0.-'+45) 3 ,'~ 1. 2 0 ( 0 • 04 7) 7.4 (0.291)
25.4 (1. 0 ) 2.5.!+ (1.0 )
1.98 (0.078) 0.99 (0.039)
!
,
(,,0 \J1
36
Tablv J 1'1easlln~d Effective Young's 1'1odulus
Young's Modulus Fig. No. I Far-Field Effective Cpa (~1si ) Cpa (Hsi)
Single Al Layers
28-a 2.175 (0.374) 72.4 (10.'50)
28-b 5.042 (0.731) 69.71 (10.11)
28-c 5.763 (0.836) 74.40 (10.79)
In-Phase Specimens
* 29-a 8.695 (1.261) 21. 95 (3.18 ) -;.';
7.lJ-h 6.026 (0.874) 13.06 (1.894)
OUl-of-Phase Specimens ";~
30-<1 9.998 (1.450) 14.70 (2.132)
* 10-b 23.920 (3./169) 28.437 (4.124)
,', Obtained from the rule-of-mixture.
37
SPECIMEN PREPARATION FOR TENSION TEST
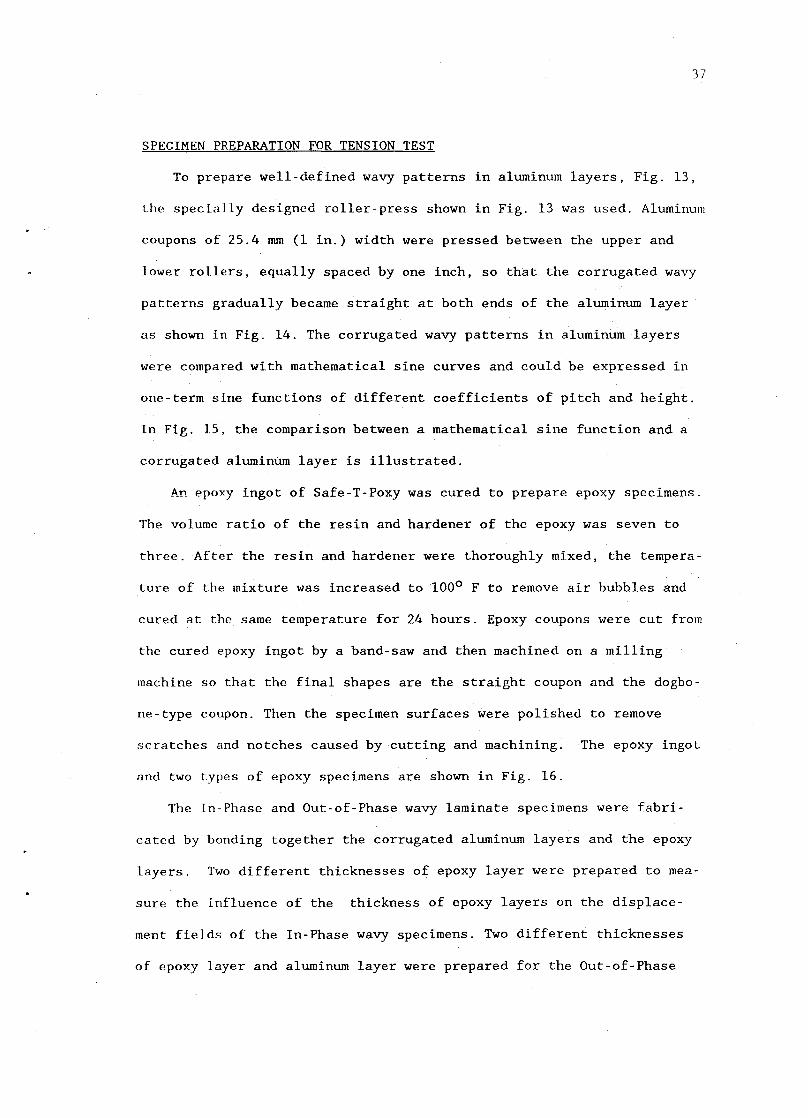
To prepare well-defined wavy patterns in aluminum layers, Fig. 13,
the specially designed roller-press shown in Fig. 13 was used. Aluminum
coupons of 25.4 rnm (1 in.) width were pressed between the upper and
lower rollers, equally spaced by one inch, so that the corrugated wavy
patterns gradually became straight at both ends of the aluminum layer
as shown in Fig. 14. The corrugated wavy patterns in aluminum layers
were compared with mathematical sine curves and could be expressed in
one-term sine functions of different coefficients of pitch and height.
In Fig. 15, the comparison between a mathematical sine function and a
corrugated aluminum layer is illustrated.
An epoxy ingot of Safe-T-Poxy was cured to prepare epoxy specimens.
The volume ratio of the resin and hardener of the epoxy was seven to
three. After the resin and hardener were thoroughly mixed, the tempera
ture of the mixture was increased to 1000 F to remove air bubbles and
cured at the same temperature for 24 hours. Epoxy coupons were cut from
the cured epoxy ingot by a band-saw and then machined on a milling
machine so that the final shapes are the straight coupon and the dogba
ne-type coupon. Then the specimen surfaces were polished to remove
scratches and notches caused by cutting and machining. The epoxy ingot
and two types of epoxy specimens are shown in Fig. 16.
The In-Phase and Out-of-Phase wavy laminate specimens were fabri
cated by bonding together the corrugated aluminum layers and the epoxy
layers. Two different thicknesses of epoxy layer were prepared to mea
sure the influence of the thickness of epoxy layers on the displace
ment fields of the In-Phase wavy specimens. Two different thicknesses
of epoxy layer and aluminum layer were prepared for the Out-of-Phase
(a)
(b)
38
• o • ,'t; • ,:,
.~.p,". . . ,
• , .. If r: • • • . ", • «I ~-:
! I . ?) pi () • • J • . ,
11 , l
Fig. 13 Roller Press and Corrugating Procedure of Aluminum Layers
(a) Before Pressing (b) After Pressing
(a)
(b)
Fig. 14 Aluminum Layers of Different Thicknesses
(a) Straight Layers (b) Corrugated Layers
-'" :J~
SPECIMEN CURVATURE
,- MATHEMATICAL SINE FUNCTION
Zo = 0.078 sin(llx/0.'51)
Fig. l~ Comparison between a Specimen Curvature and a Mathematical
Sine Function
40
(a)
(b)
(c)
Fig. 16 Epoxy Ingot and Specimens
(a) Epoxy Ingot (b) Straight Coupon (c) Dogbone Coupon
41
42
wavy specimens. The corrugated aluminum layers for both laminates were
surface-treated before bonding to improve the bond strength and to pre
vent any delamination during machining and tensile tests. Both surfaces
of each aluminum layer were coated with acrylic resin. Spacers were
inserted between coated aluminum layers to obtain gaps between each
layer so that the Safe-T-Poxy filled up the gap between aluminum
layers. After curing in an oven for 24 hours at 1000 F, both free
edges of each laminate were machined and polished to approximately one
inch width. Some of the fabricated specimens with In-Phase and Out-of
phase wavy patterns are shown in Fig. 17.
Each specimen contained two or three aluminum layers with In-Phase
or Out-of-Phase wavy patterns. Strictly speaking, each specimen does
not exactly represent the mathematical model which has been developed
for an infinite number of wavy layers. However, no attempt has been
made to account for the finite thickness of the specimens.
TENSION TEST
All tension tests were conducted at a constant loading rate of 4.5
Kg/s (10 Ibis) or 9 Kg/s (20 Ibis) on an MTS machine . Strains were
measured by a one inch extensometer which corresponds to one pitch
length of the wavy patterns. The knife edges of the extensometer were
placed in the machined grooves of two aluminum tabs glued on the convex
points of the wavy patterns. The specimens were held in 51 mm (2 in.)
wide wedge-action friction grips so that the specimen length between
grip ends was approximately 125 mm (5 in.). To insure repeatability of
the results, each specimen was loaded three to five times within its
elastic limit. The specimen configurations of corrugated aluminum
layers and In-Phase and Out-of-Phase wavy laminates were previously
UJ ~ <J)
s <J) 'M UJ U CIl <J) ..c P- <J) p.., til UJ I
CIl ~ "d ..c 0
<J) p.., I
-I.J I -I.J CIl ~ ;j ~ H 0
'M S '""' '""' CIl CIl.o ~ '-" '-"
r--.-l
be 'M ~
t-' 00
H ::l Ul rt III t-' t-' S (1)
::l rt
o I-t)
go (1)
t>l X rt (1)
::l Ul o ~ rt (1)
t1
o ::l
III
CI)
"d (1)
o 1-'-S (1)
::l
45
given in Table 2. Fig. 18 illustrates the extensometer installation for
a typical specimen.
Values of the effective Young's modulus of each aluminum layer and
wavy laminate configuration were obtained from the replicated tests by
using the least square curve fitting technique to the digital test
data. The Young's modulus of each specimen was nondimensionalized by
dividing by the reference Young's modulus, i.e. the equivalent Young's
modulus of the layer or laminate without corrugated wavy patterns.
Measured values of the effective Young's modulus of each specimen con
figuration were previously given in Table 3.
SPECIMEN PREPARATION FOR MOIRE INTERFEROMETRY
Moire interferometry is a real time method that gives the in-plane
displacements of the specimen surface below the moire grating. This
technique does not require a transparent specimen as the conventional
photoelasticity technique does. The Moire grating frequency for this
study is 2400 lines/mm(60,960 lines/inch). Since the technique provides
contour maps of in-plane displacement fields from a cross grating
transferred to the specimen surface, it may be used for non-homogeneous
materials. For more details of moire interferometry and the general
procedure of specimen preparations, please refer to Post[15].
One In-Phase specimen and one Out-of-Phase specimen were prepared
for moire interferometry. A moire grating supplied by Professor Daniel
Post at VPI & SU was coated with a thin aluminum layer using a metal
vaporizing technique and cut into appropriate sizes for the specimens.
Mirrorized moire gratings were transferred to the specimen surfaces as
shown in Fig. 19.
In order to use a hinge joint for applying tension loads to a spe-
I @-.~
!.~ L.
@
Cross Grating
Spacer
Load Pan
I
J
Upper Channel
L({{(([w en Upper Bracket
E2!!5([)
Fig. 20 Specimen Installation to the Fixture
47
48
cimen without causing global bending, a quarter inch diameter hole was
drilled at each end of the specimen. Then, one end was connected to
the load pan and the other end was connected to the upper brackets by
quarter inch bolts as shown in Fig. 20. Teflon washers were placed
between the outermost aluminum layers and the inner surfaces of the
upper brackets to minimize friction forces between the brackets and the
specimen. The upper brackets are connected to the grooves in the upper
channels by a 5/16 inch bolt. Then, tension load is applied to the spe
cimen by putting calibrated weights on the load pan. Fig. 21 shows the
moire setup with a specimen installed in the test configuration.
MOIRE TEST
If the displacement in a specimen is large enough to neglect any
possible misalignment during loading, then the strain components, EXX
and EpS can be directly obtained from the loaded fringe patterns.
However, the increment of the fringes due to tension loading was not so
significant and the out-of-plane displacement was not negligible when
compared to the in-plane displacement. Therefore, the mirrors in the
test setup schematic of Fig. 22 were adjusted to increase the number of
fringes at the zero loading condition to facilitate the measurement of
the distance between each fringe and to obtain better contrast between
the light and dark fringes in both the axial and transverse displace
ment fields. This initial carrier fringe pattern does not eliminate the
coupling between the in-plane and out-of-plane displacements, but the
bending strain component can be calculated from the axial fringe pat
terns with carrier fringes.
After the initial fringe patterns with the carrier fringes for the
axial and transverse displacement fields were photographed from the
49
In-Phase specimen at zero loading condition, a 27 Kg (60 lb) tensile
load was applied and both fringe patterns were photographed again. This
procedure was repeated at 36 Kg (80 lb), 54 Kg (120 Ib), and 72 Kg(160
lb) tensile loads. Then the horizontal and vertical mirrors were
adjusted to reduce the fringes in both displacement fields so that the
effect of the epoxy layers on the center aluminum layer could be quali
tatively observed as illustrated in Fig. 23-c and 23-d. The load was
removed and the same procedure was repeated with different initial car
rier fringes in both axial and transverse displacement fields. These
sets of photographs are shown in Figs. 23 and 24.
The Out-of-Phase specimen was photographed under zero, 36 Kg (80
Ib), and 67.5 Kg (150 lb) for the axial displacement field, and under
zero, 27 Kg (60 lb), 45 Kg (100 lb), and 67.6 Kg (150 lb) for the
transverse displacement field. The sets of photographs taken from the
Out-of-Phase specimen with different initial carrier patterns are shown
in Figs. 25- 27.
b:I~
II II
r-'Cf) O"'Cl III ro 0.(')
1-'-'"OS! III ro ;:l ;:l ro i-'
t-rj 1-'-
(IQ
N ......
~ 0 1-'-t-I ro tr:!
..0 C 1-'-
"'Cl S ro ::s r-t
~ 1-'-r-t ::r r-' 0 ~ 0.
t-rj 'i ~ S! ro
\.J'I o
., //~
./' I / , . ./ . I
~ t . Camera ("y' I ./(J Beam ,,_.~. _ ~Plitter
(\--.----=,=-=.:.~---~~;~ ~ ----- - /~ -~-
Light Source
~ . . '" ., ..... ~
/" 1./
/1/
Horizontal Nirror
Z·~I " ~ ....l D '.'4iiiJ. .,-.-- V
! j ~
G-~~===~~/7ZJ
(a) (b)
Fig. 22 Schematics of Moire Interferometry
(a) Transverse Field
(b) Axial Field \J1 t-'
52
(a)
(b)
Fig. 23 Axial Fringe Patterns from an In-Phase Specimen
(a) 0 lb(with Carrier Fringes) (b) 60 lb (c) 120 lb (d) 120 lh(with less Carrier Fringes)
Continued to Next Page
(a)
(b)
54
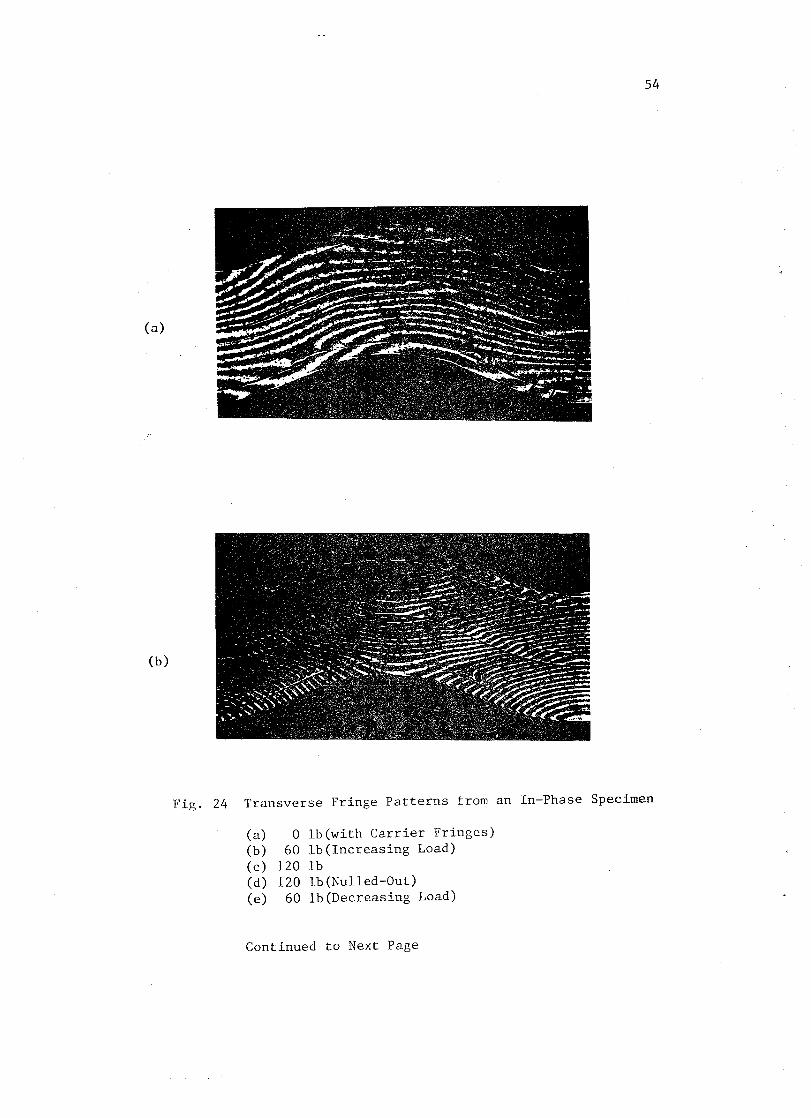
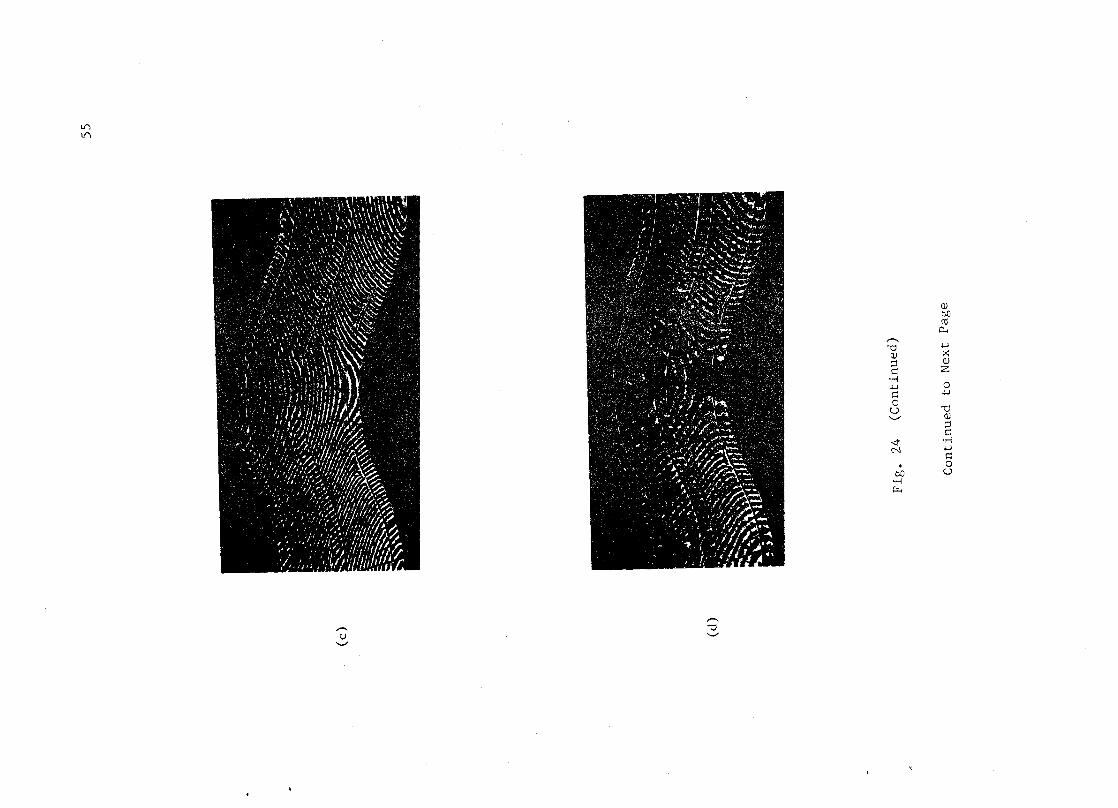
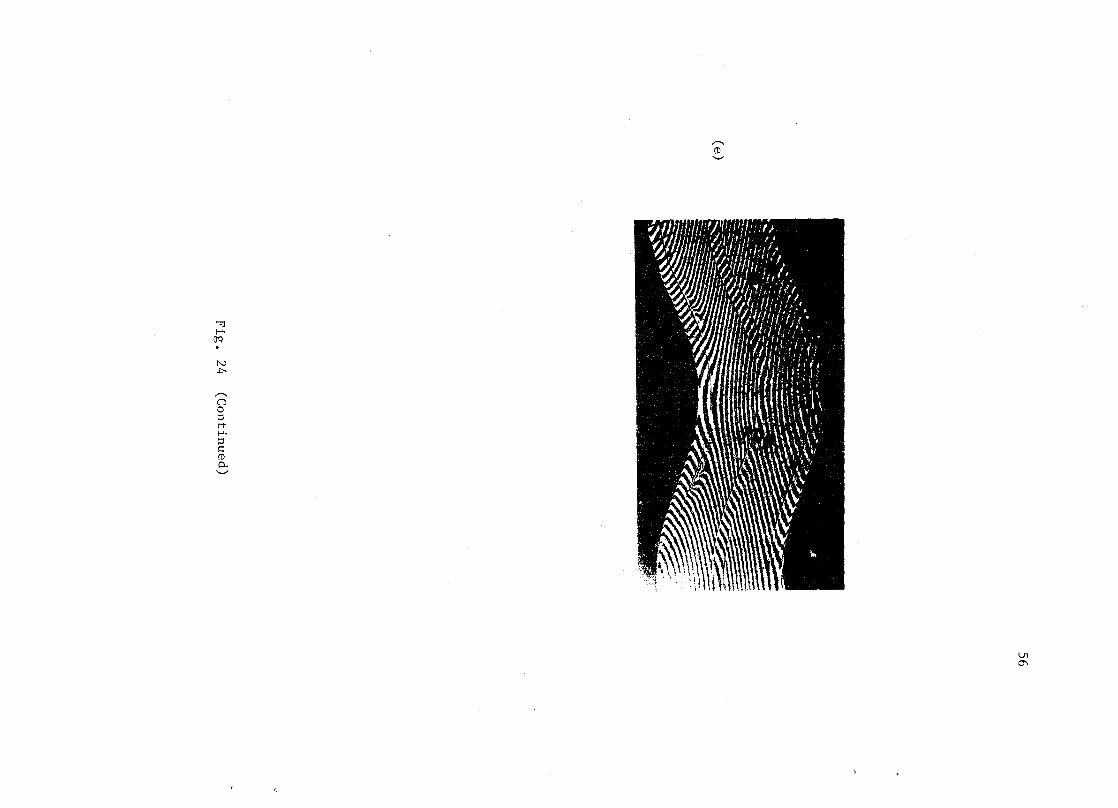
Fig. 24 Transverse Fringe Patterns from an In-Phase Specimen
(a) 0 Ib(with Carrier Fringes) (b) 60 Ib(Increasing Load) (c) 120 Ib (d) 120 Ib(Nulled-Out) (e) 60 Ib(Decreasing Load)
Continued to Next Page
(J)
co (lj
P... r--'"d
..., (J) x ;:l ('J
~ Z "..1 ..., 0 ~
..., 0
U '"d '-" (J)
;:l ~
-.:t "..1 N
..., ~ 0
bO U ".-1 ~
(a)
(b)
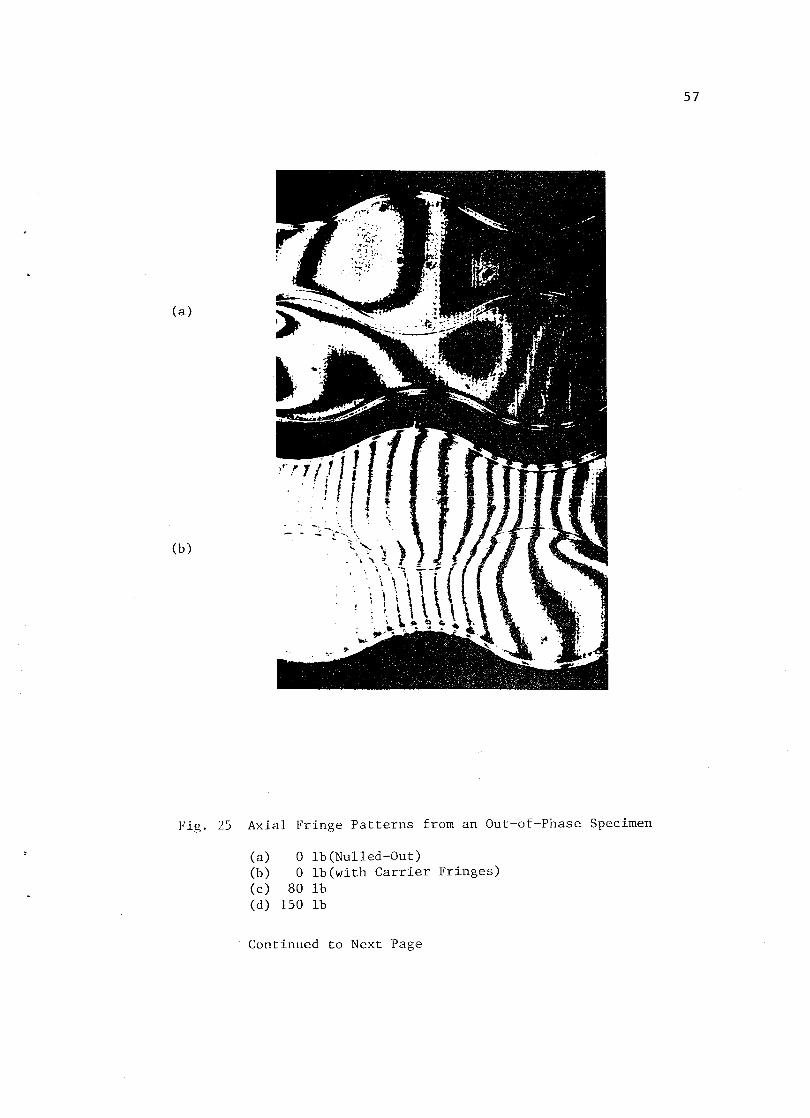
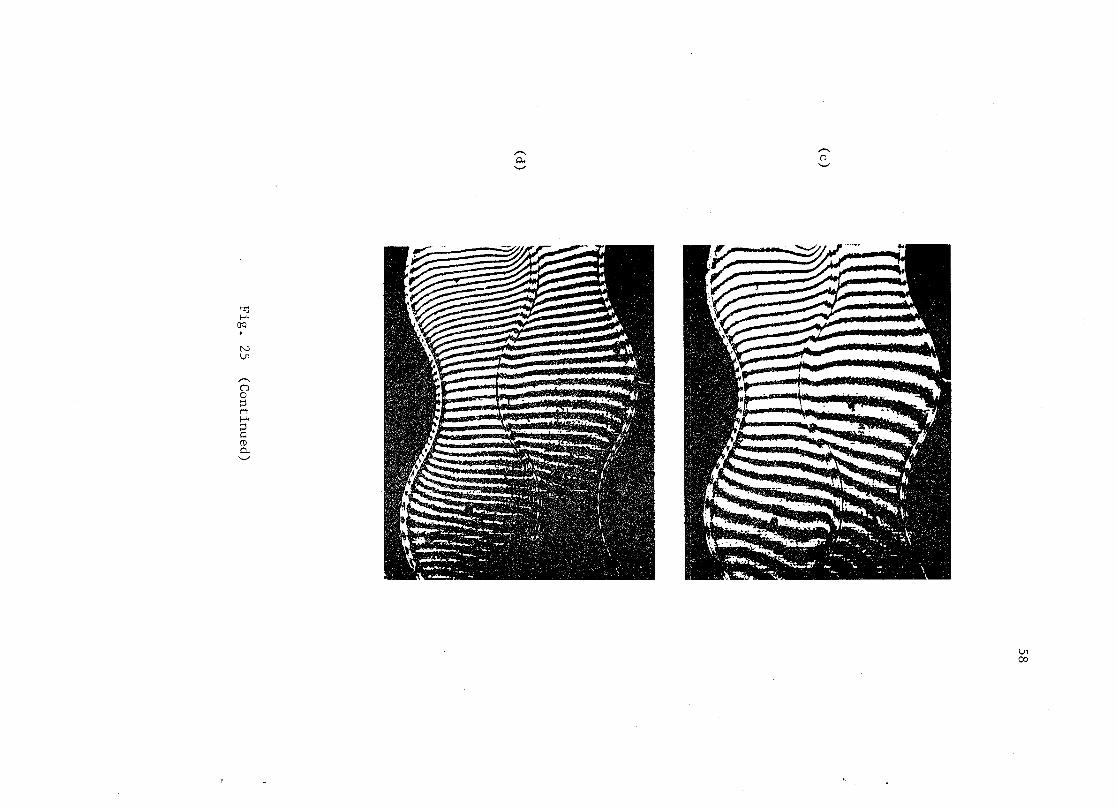
Fig. 25 Axial Fringe Patterns from an Out-of-Phase Specimen
(a) 0 lb(Nulled-Out) (b) 0 Ib(with Carrier Fringes) (c) 80 lb (d) 150 Ib
Continued to Next Page
57
\.Jl co
(a)
(b)
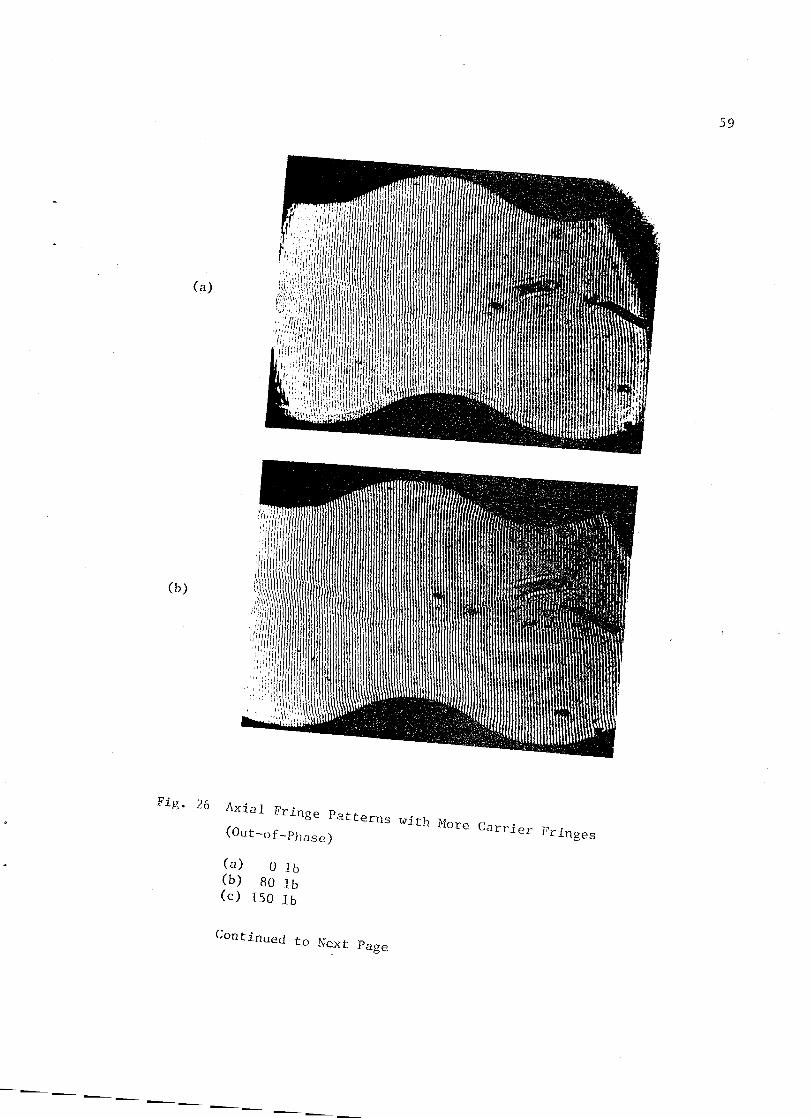
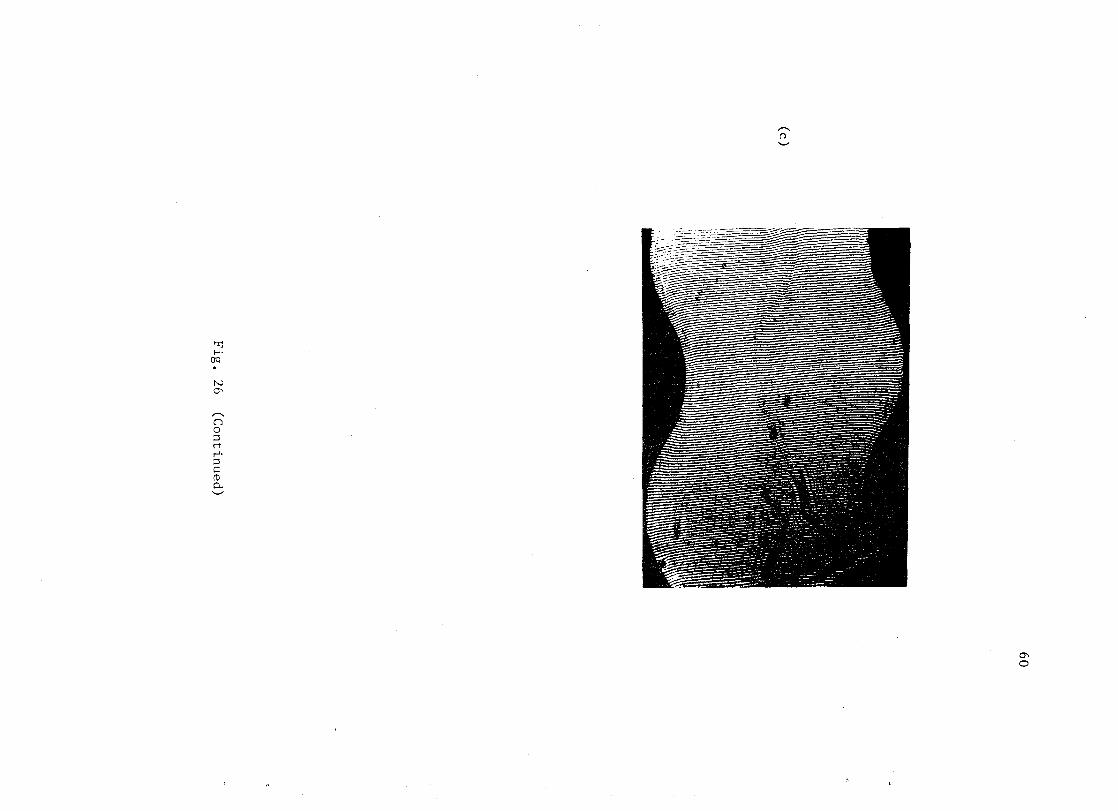
Fig. 26 AXial Fri~. Patterns with ~r. Carrier Fringe. (Out-of-Phase)
(a) 0 1 b (b) 80 Ib (c) 150 Ib
Continued to Next Page
59
----- ----- ---------- ----- --------------- --------------- ----- ----- ---------- ----- --------------- --------------- ---------- ------
61
(<1 )
(b)
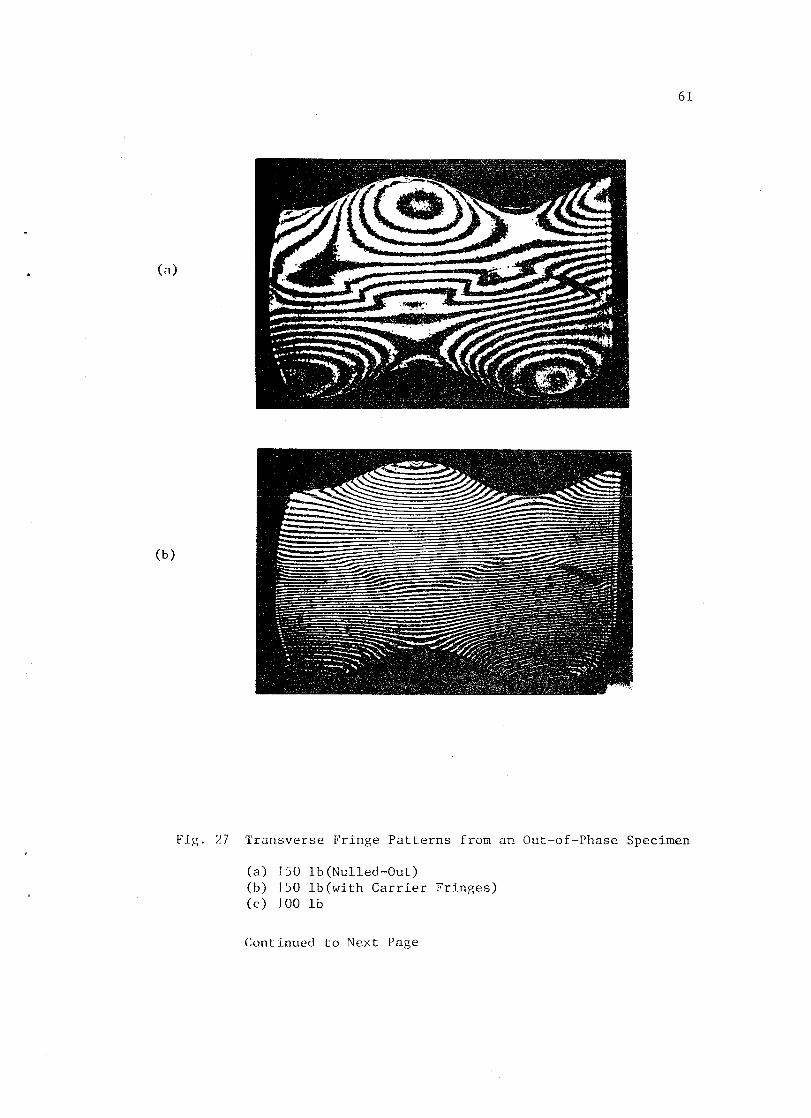
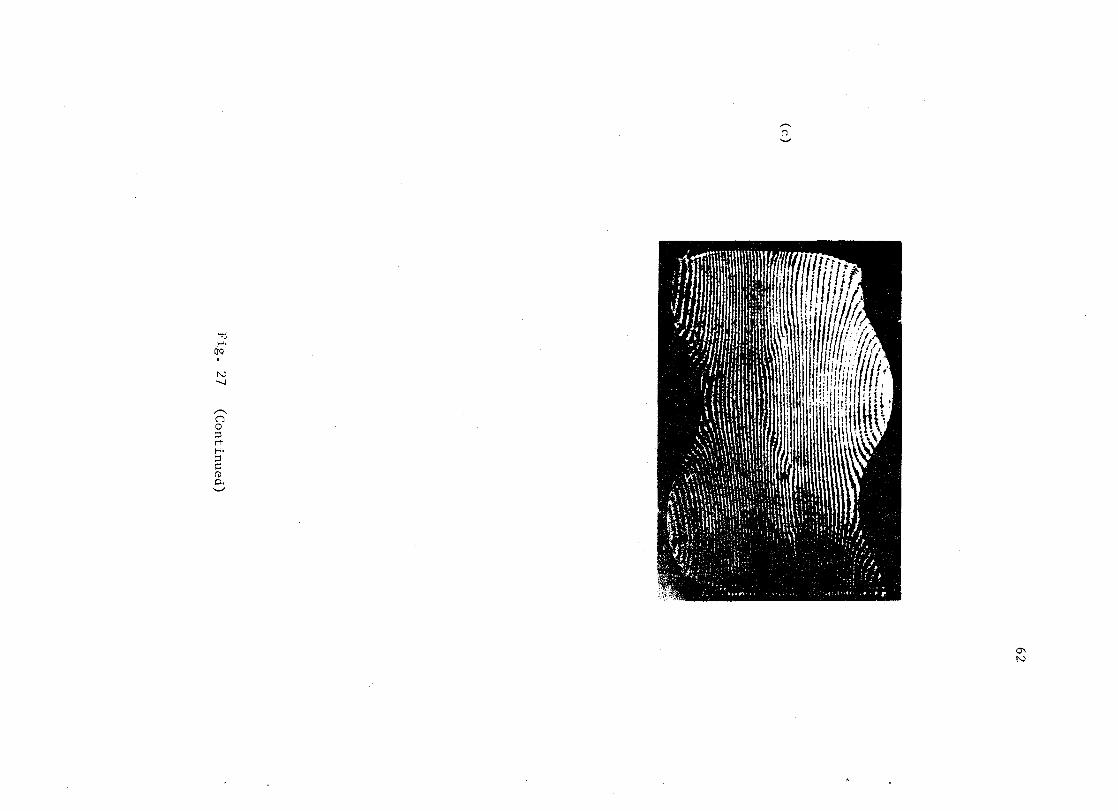
Fig. L7 Transverse Fringe Patterns from an Out-of-Phase Specimen
(a) 150 Ib(Nulled-Out) (b) 150 Ib(with Carrier Fringes) (c) 100 Ib
Continued to Next Page
'" N
63
RESULTS AND DISCUSSION
TENSION TEST
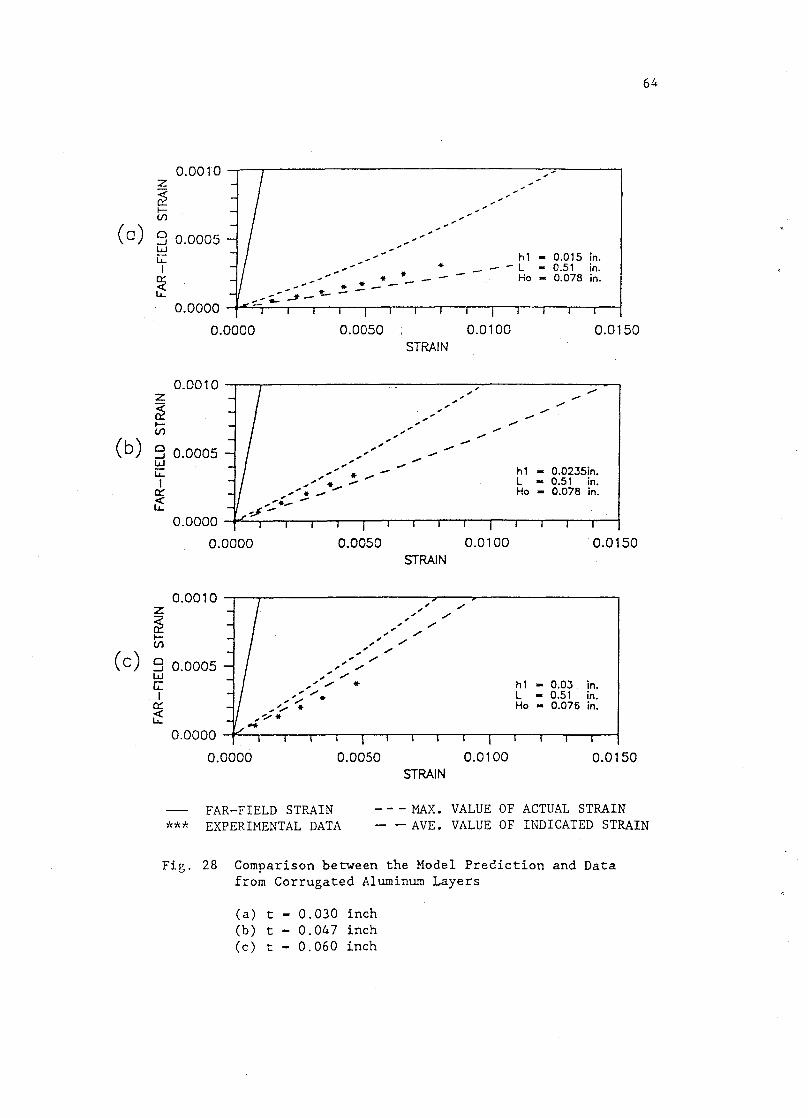
The replicate tension tests for all specimen configurations exhi
bited fundamentally identical elastic behavior which was remarkably
linear and reproducible. From the elastic constants obtained from
straight specimens of aluminum and epoxy, the effective non-dimensional
Young's modulus was predicted for each specimen configuration. In Fig.
28, the comparisons between the model predictions and the experimental
data from the corrugated aluminum specimens are shown for three differ
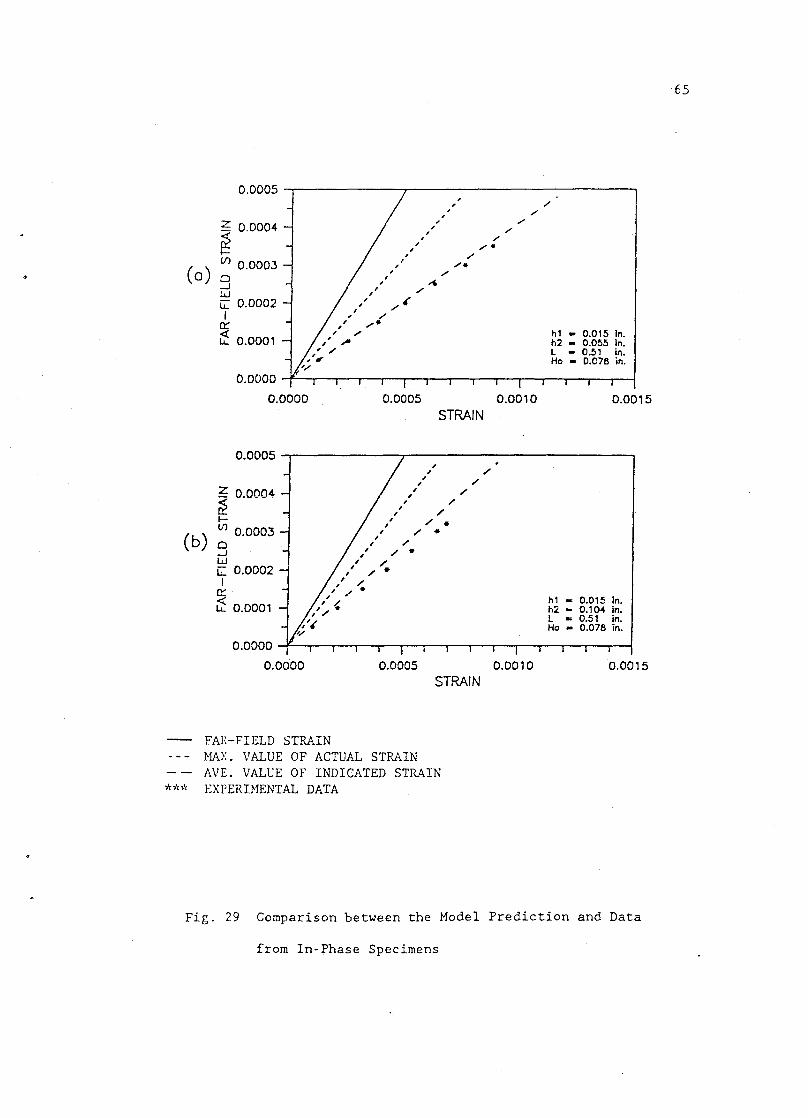
ent thicknesses of the aluminum layers. Experimental data from the two
In-Phase and two Out-of-Phase laminate configurations are compared with
the model predictions in Fig. 29 and Fig. 30, respectively. The compar
isons between the model predictions and experimental data are in good
agreement.
As expected from the model, the measured strains were always
greater than the actual strains at the neutral axis of the corrugated
layers which, in this study, were assumed to be the main load-carrying
layers. The pseudo strain computed from the model together with the
average of the actual strain over the wave pattern gave a reasonable
value to which the measured strain could be directly compared. This is
explained by the fact that the contribution of bending strain component
cancels out when the indicated strain is measured by an extensometer over
one representative pitch of the wavy patterns.
The measured indicated strains of the Out-of-Phase specimens were
always slightly greater than the model predictions. One possible expla
nation for this is that the Out-of-Phase specimen does not exactly
(0)
(b)
z ~ t-(I)
0.0010 , ,
9 0.0005 --, * __ h1 - 0.015 in.
__ ,- • * it _* ____ - - L - 0.51 i 0.0000 f~-- _ J __ - - Ho - 0.07. ;~.
I I I .
w [i: I
0:::
it •
0.0000 0.0050 0.0100 0.0150 STRAIN
--0.0010 -" -" --Z
" .. --- -~
" .. -.. --t-
" " -(I)
" -.. -" .. -9 0.0005 " --W
G: t
0:::
it
z g (I)
.. .. -' ,. .. -.. * -.. " .. it-, , .-.. -.,'* ........
0.0000 _?-
0.0000 0.0050 0.0100 STRAIN
0.0010 > , , ," " , "
,," " ," " , "
hl 0.0235in. L 0.51 in. Ho 0.078 in.
0.0150
64
(C) ~ 0.0005 ,,' " , .. "
" " , ..-G: I
0:::
it
,'''' .. " "
"" it , ............ ,'l'*
hl - 0.03 in. L - 0.51 in. Ho - 0.076 in. -0.0000 -f"'r--.,-.---.--,r-.-----.--.-...--.---,-.---.---,--,---t
0.0000 0.0050 0.0100 0.0150
FAR-FIELD STRAIN *** EXPERIMENTAL DATA
STRAIN
- - - MAX. VALUE OF ACTUAL STRAIN - - AVE. VALUE OF INDICATED STRAIN
Fig. 28 Comparison between the Model Prediction and Data from Corrugated Aluminum Layers
(a) t - 0.030 inch (b) t - 0.047 inch (c) t - 0.060 inch
0.0005 --.-------,---------------,
(0)
~ 0.0004
~ I-
(f) 0.0003 o --.J W G: 0.0002 I
rr Lt 0.0001
, , ,
, , , ,
, , , , ,
,," ,,-
, , , , , , ,
" 4
"
, ,
" ".
" " ,-".
,-,-
hl - 0.015 In. h2 - 0.055 In. l - 0.51 in. Ho - 0.078 in.
0.0000 ......f-'-r---,I--r---r----,-..__.,.-~-..____r____"T-_r___r____r-.,__~
0.0000 0.0005 0.0010 0.0015 STRAIN
0.0005 ...,.-------r---------------,
(b)
~ 0.0004-~ l-
V) 0.0003 o --.J W L:: 0.0002 I
c: ~ 0.0001
./ -
,-./
./ . ./ .
./ ./ .
./
./ ./
hl - 0.015 In. h2 - 0.104 In. l .. 0.51 in. Ho - 0.078 in.
0.0000 --f!=-f ---...-.--..,.----r-----r--r-.....--..,.---r---.-.....--..,.---,----.----1
0.0000 0.0005 STRAIN
FAR-FIELD STRAIN HAX. VALUE OF ACTUAL STRAIN AVE. VALUE OF INDICATED STRAIN
*7C>~ EXPERIHENTAL DATA
0.0010 0.0015
Fig. 29 Comparison between the Model Prediction and Data
from In-Phase Specimens
65
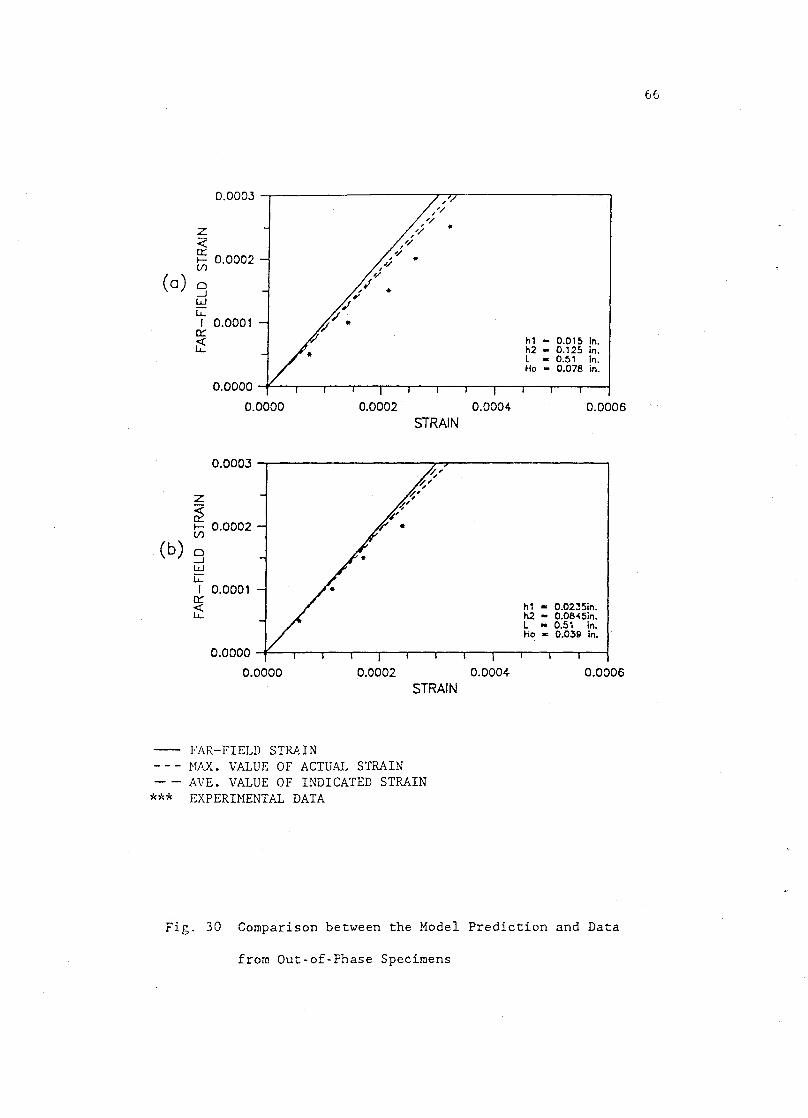
66
0.0003 ~,; '/ ,
Z '/ • <i:
, //
n::: '/ I- 0.0002 , • (f) , '/
(0) 0 '/
, '.I • -1 ; W ~ G:
~'/ . I 0.0001 n::: r;:: ~ hl - 0.015 In.
h2 - 0.125 in . L .. 0.5' In. Ho - 0.078 in.
0.0000 V I 0.0000 0.0002 0.0004 0.0006
STRAIN
0.0003 /'/' ~, ,
g 0.0002 J /' ~, , ~'
f' • (f)
(b) 0 -1 W G: I 0.0001
n::: / hl .. 0.02:35in. ~ h2 - 0.08~5in.
L - 0.51 in. Ho .. 0.039 In.
0.0000 V I I 0.0000 0.0002 0.0004 0.0006
STRAIN
-- FAR-FIELD STRP.IN - - - ~1AX. VALUE OF ACTUAL STRAIN - - AVE. VALUE OF INDICATED STRAIN *** EXPERIMENTAL DATA
Fig. 30 Comparison between the Model Prediction and Data
from Out-of-Phase Specimens
67
match the idealized geometries required by the model. The Out-of-Phase
specimens tested during this study consist of three aluminum layers
resulting in indicated In-Phase patterns between the two outer aluminum
layers. The indicated In-Phase bending due to the limited number of
aluminum layers may cause additional pseudo strain. However, the In-
Phase specimens always satisfy the idealized geometry for one represen-
tative segment as required by the model.
The effect of the thickness of the epoxy layer is best illustrated
in Fig. 29. As the thickness of the epoxy layer in the In-Phase lami-
nate increases, the difference between the maximum value of predicted
actual strain at X - L/2 (fACT) and the measurable strain (fIND AVE) ,
decreases. The experimental data obtained from two In-Phase wavy lami-
nate configurations showed the same trend as predicted. The model pre-
dictions and measured data from two different Out-of-Phase specimens
are also illustrated in Fig. 30. The shifting of the experimental data
from fACT to fIND AVE is primarily attributed to the influence of the ,
stretching of the wavy patterns in the main load-carrying layers. This
change of the wavy patterns is indicated as if it were real strain due
to the limitation of the strain gage length. If the strain gage or
extensometer gage length is much smaller than the pitch of the wavy
pattern in a laminate, then the actual strain may be directly measur-
able. However, in most composite laminates containing wavy patterns or
wrinkled fibers in the main load-carrying layers including the speci-
mens of this study, the strain gage length has the same order of magni-
tude as the pitch length of wavy patterns of the layers or wrinkled
fibers. Thus, the average value of the pseudo strain (fpS) over one
representative segment derived by the model should be taken into con-
68
sideration to predict the effective Young's moduli of composite materi
als with wavy layers or wrinkled fibers.
MOIRE TEST
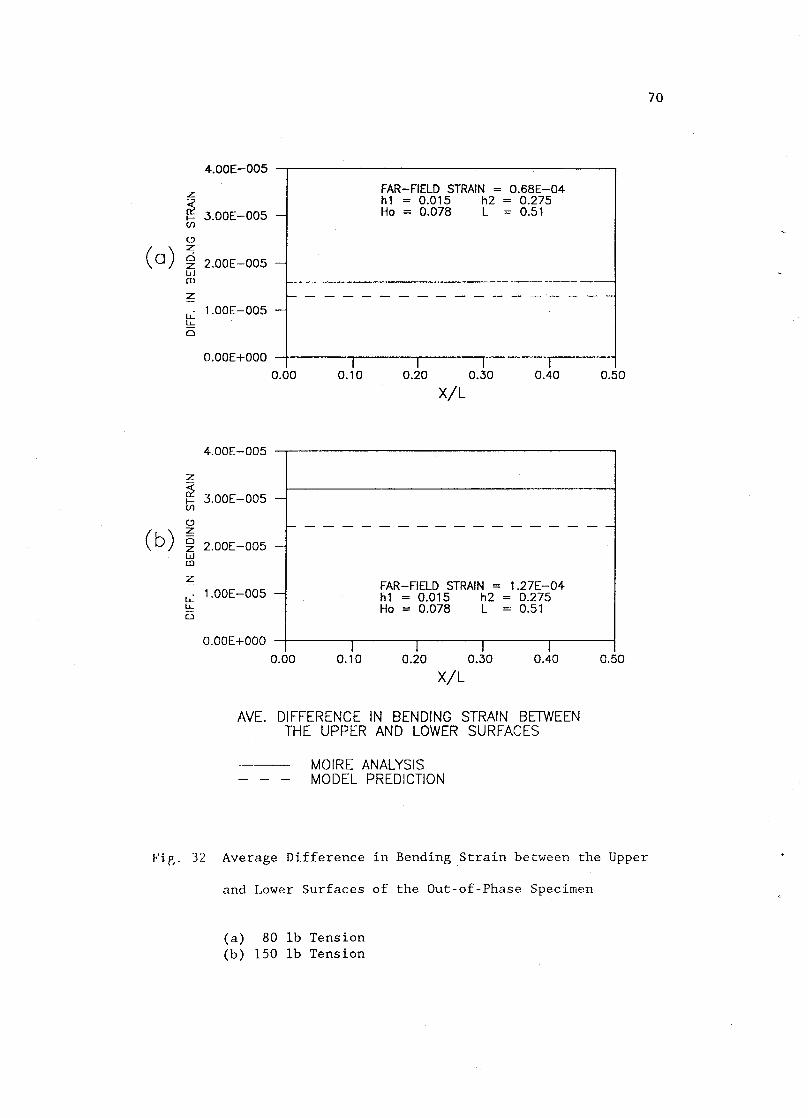
Moire fringe patterns taken from In-Phase and Out-of-Phase speci
mens were shown in Fig. 23-27. As previously discussed, the fringe pat
terns were enhanced by the addition of initial carrier fringe patterns,
instead of null field fringe patterns. Therefore, only the differences
in bending strain components between the upper and lower surfaces of
the aluminum layers were calculated and are compared with the model
predictions for both In-Phase and Out-of-Phase specimens in Fig. 31-32.
For more details of the fringe pattern analysis, please refer to the
Appendix.
The transverse fringe patterns from In-Phase and Out-of-Phase spe
cimens confirmed the main assumption of the model. Comparing Figs. 24-d
and 27-a, it is obvious that the fringe patterns for the two specimen
configurations are fundamentally different. The rotation of the fringes
illustrated in Fig. 24-d is characteristic of shear deformation. Fur
thermore, the number of fringes through the thickness is relatively
constant. The bull's eye pattern illustrated in Fig. 27-a is character
istic of tension-compression behavior. Also, the number of fringes
through the thickness varies along the axial direction of the Out-of
Phase specimen. This provides qualitative confirmation that the matrix
layers of the In-Phase specimen is shear dominated while the matrix
layers of the Out-of-Phase specimen is governed by tension-compression
behavior.
The pseudo strain components could not be compared with the model
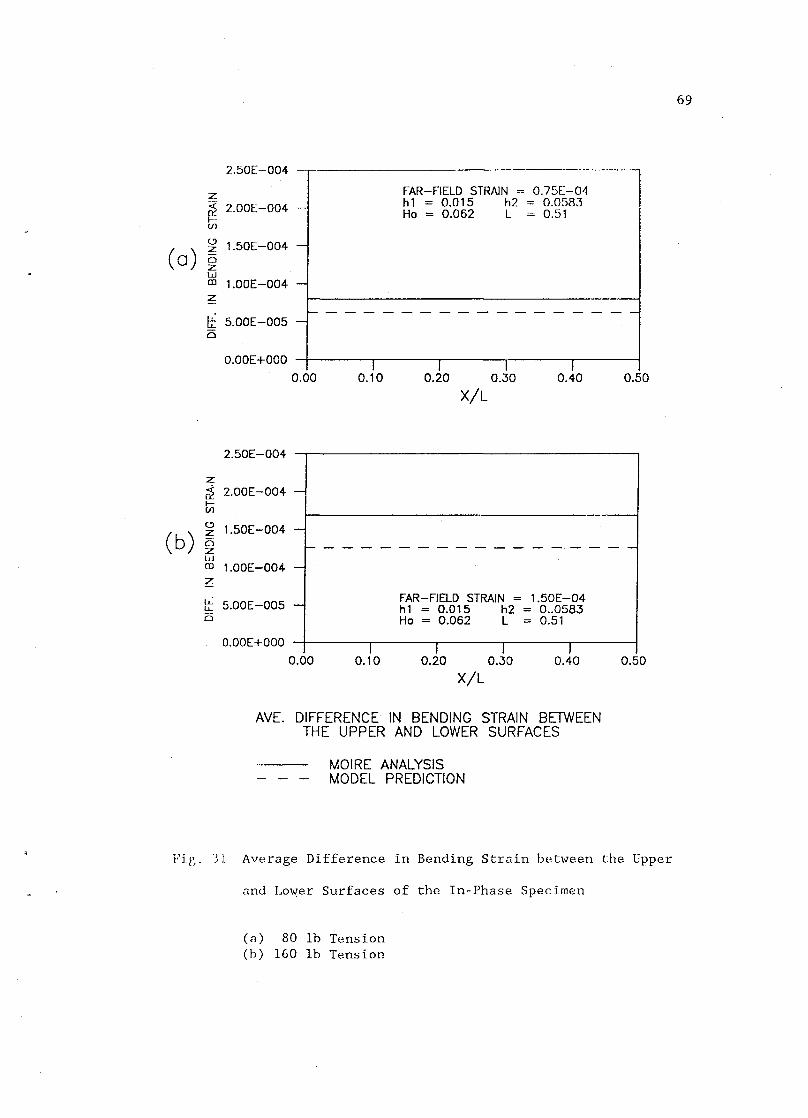
(0)
2.50E-004
z ~ 2.00E-004 -fUl
~ 1.50E-004 o z w CD 1.00E-004 -~
FAR-FIELD STRAIN = 0.75[-04 h1 = 0.015 h2 0.0583 He = 0.062 L = 0.51
. ~-----------------l:!: 5.00E-005 -o
z
~ f0-Ul
Cl
O.OOE+OOO I I I I I 0.00 0.10 0.20 0.30 0.40
2.50E-004 ]
2.00E-004 _
X/L 0.50
(b) ~ 1.50E-004 -
~-----------------w CD 1.00E-004 -~
ti 5.00E-005 -o
FAR-FIELD STRAIN = 1.50E-04 h1 = 0.015 h2 0 .. 0583 He = 0.062 L = 0.51
O.OOE+OOO J
0.00 I
0.10 I I
0.20 0.30
X/L
I 0.40
AVE. DIFFERENCE IN BENDING STRAIN BETWEEN THE UPPER AND LOWER SURFACES
MOIRE ANALYSIS - - - MODEL PREDICTION
0.50
Fig. :31 Average Difference in Bending Strain between the Upper
and Lower Surfaces of the In-Phase Specimen
(a) 80 Ib Tension (h) 160 Ib Tension
69
z ~ l-V!
(:)
(0) z 0 Z til ill
~
u..: lL..
0
z ~ ~ (:)
(b) z 0 z W ill
~
u..: lL..
0
4.00E-005
FAR-FIELD STRAIN = 0.68E-04 h1 = 0.015 h2 0.275
3.00E-005 - Ho = 0.078 L = 0.51
2.00E-005 -
~-----------------1.00E-005 -
O.OOE+OOO I I I I I 0.00 o. , 0 0.20 0.30 DAD 0.50
X/L
4.00E-005
3.00E-005 -
r-----------------2.00E-005 -
FAR-FIELD STRAIN = , .27E-04 h1 = 0.015 h2 0.275 1.00E-005 -Ho = 0.078 L = 0.51
O.OOE+OOO I I I I I 0.00 O. , 0 0.20 0.30 DAD
X/L
AVE. DIFFERENCE IN BENDING STRAIN BETWEEN THE UPPER AND LOWER SURFACES
MOIRE ANALYSIS MODEL PREDICTION
0.50
Fig. 32 Average Difference in Bending Strain between the Upper
and Lower Surfaces of the Out-of-Phase Specimen
(a) 80 1b Tension (b) 150 1b Tension
70
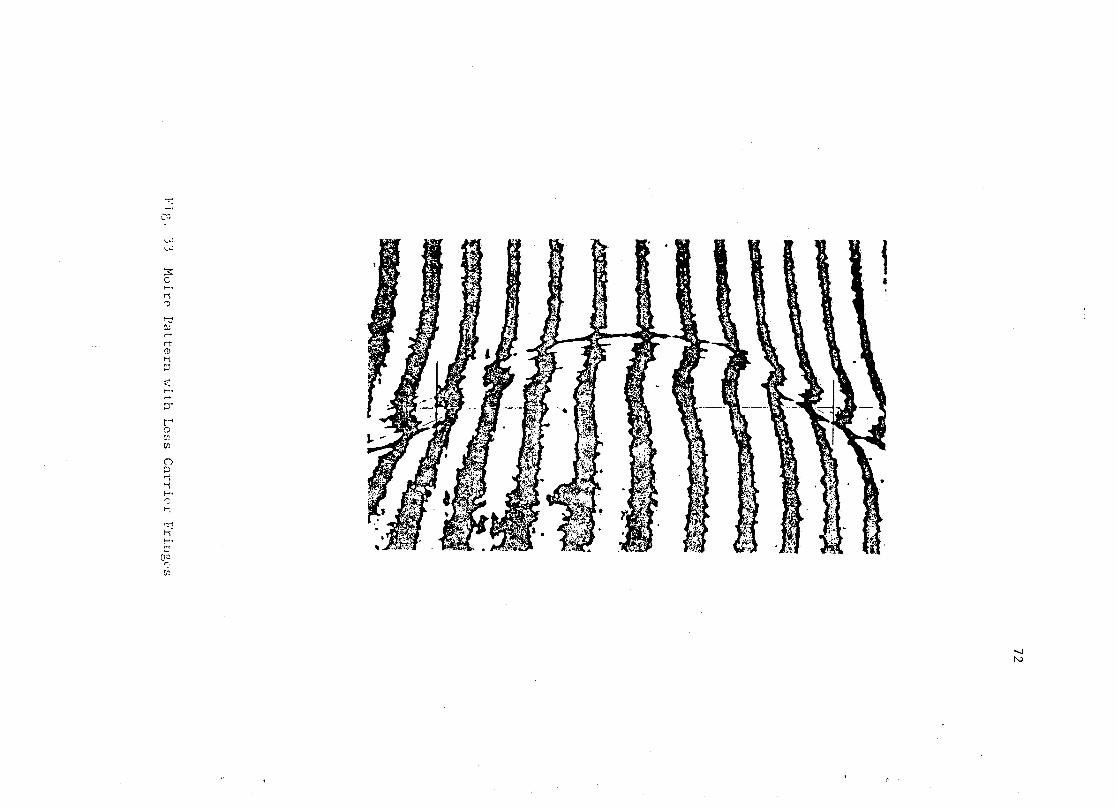
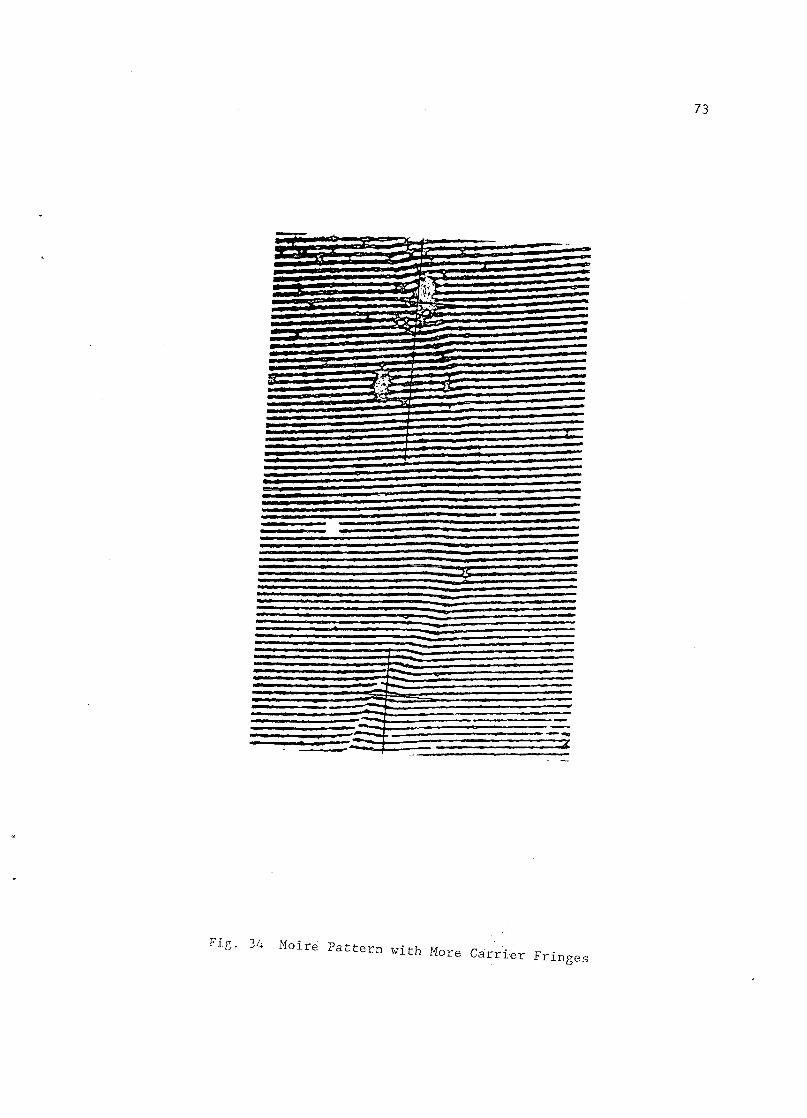
71
predictions because the rigid body rotations of the hinge mechanism
used for the specimen installation were coupled to the axial and trans
verse deformation of the specimens. This coupling effect changed the
number of fringes in the axial displacement field as well as the trans
verse displacement field. However, these rigid body rotations due to
the hinge mechanism may be eliminated by calculating the difference in
the number of fringes between the upper and lower surfaces of the cen
ter aluminum layers as illustrated in Figs. 33 and 34. The difference
in the number of fringes between the upper and lower surfaces are the
same in both figures. Both figures are taken from one specimen under
the same loading condition, 67.5kg(150Ib) in tension, but with differ
ent initial carrier fringe patterns.
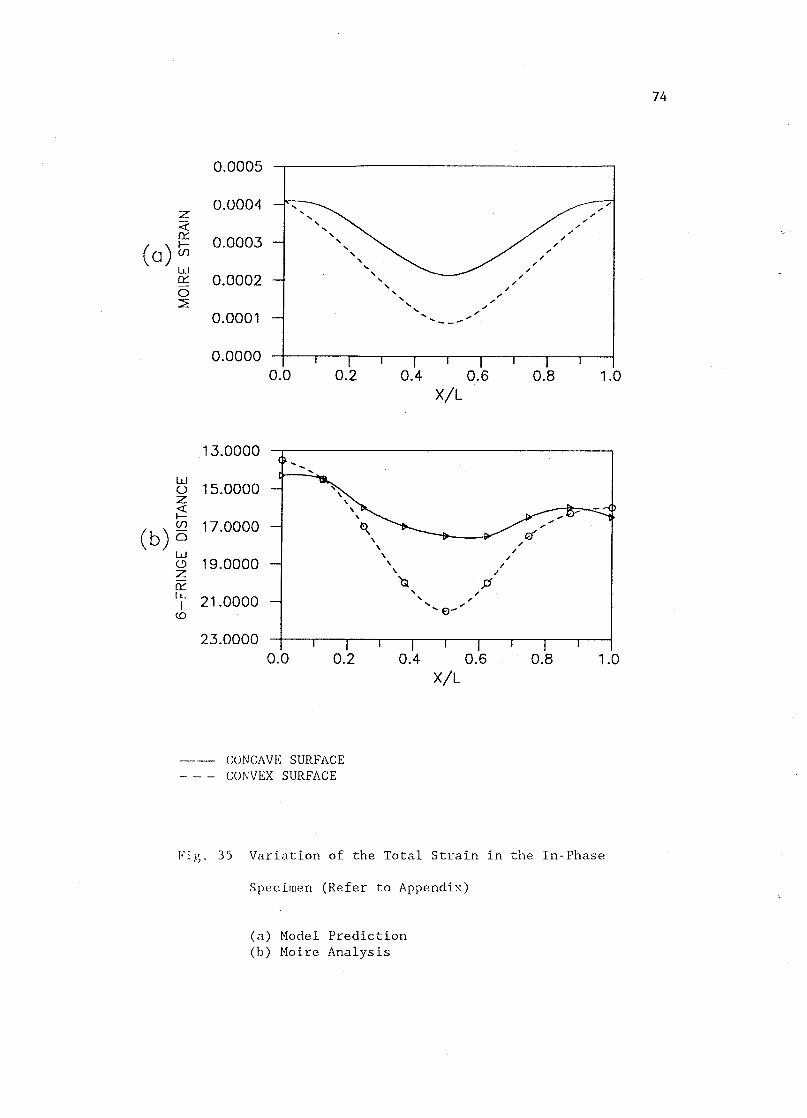
The variation of the pseudo strain along the curvature in the In
Phase specimen can be qualitatively checked from Fig. 35. Exact numer
ical data for the pseudo strain and far-field strain could not be
retrieved from the moire fringe analysis because of the rigid body
rotation problem. The general trend of the pseudo strain obtained from
the In-Phase specimen shows a good agreement with that from the model
prediction as illustrated in Fig. 35 confirming that the pseudo strain
component is a cosine function of the x. This variation of the pseudo
strain component along the x axis does not give a practical effect on
the effective Young's modulus of a wavy specimen. This is because the
strain measuring device accesses only the average value of the sum of
the pseudo strain and constant axial strain along the neutral axis of
the wavy layer when the gage length is equal to or longer than one
representative pitch of the wavy pattern.
73
"~'" :.~
-.;.~.
.. ;;;rs---
o
---- --
Fig. 34 Moire Pattern with More Carrier Fringes
0.0005
0.0004 z « 0::: 0.0003
(0) ~ w 0::: 0.0002 0 2
0.0001
... " ... ;-
... " ... " ... " ... " ... " ... " ... ;-
... " ... " ... .-... " ... ;-
... " ... '" ... ...
..... _--
0.0000 I
0.0 0.2 0.4 0.6 0.8 X/L
13.0000
w 15.0000 0
z ~ (f) 17.0000 (b) 0 \
" \ / ! 19.0000 ~ \
" , /
\ " Q p ...
" I 21.0000 ... " ... " CD '6'
23.0000 I I
0.0 0.2 0.4 0.6 0.8 X/L
CONCAVE SURFACE CONVEX SURFACE
;
'" "
1.0
1.0
Vj~. 35 Variation of the Total Strain in the In-Phase
Specimen (Refer to Appendix)
(a) Model Prediction (b) Moire Analysis
74
75
APPLICATIONS OF THE MODEL
THE MODEL PREDICTIONS AND OTHER EXPERIMENTS
By applying a maximum strain failure criterion to the wavy layer,
analytical results from the mathematical models may be used to predict
the strength of composites with in-situ local curvature in the rein-
forcement. For an In-Phase laminate, eq. (11) and eq. (21) can be
rewritten as:
f .2 (Hohl/L2) 1 fYLD ~ fO 1 + h22 GXZ/E ~2 (36-1)
fO + + - (hl/L) 2
\. hl(h2-h l) 3 J
Neglecting the first term and the last term of the denominator in
eq. (36-1) and rearranging gives the critical far-field strain:
{ 1 } fcr ::S fYLD
1 + ~2(Hohl/L2)[hl(h2-hl)/h22](E/Gxz) (36-2)
In this section, experimental results reported by other experimen-
talists[1-3] are compared with the model predictions. Those experimen-
tal studies were selected by the author for the following reasons.
1. The experimental result reported by Poe[l] contains an exact
numerical value of strength reduction as the result of wavy patterns in
a specimen configuration. Also, one of Poe's specimens was available to
measure the geometrical parameters.
2. The stitched composites studied by Dexter[2] contained repeated
wavy pattern with accurate pitches. Other geometrical parameters were
measurable from his paper.
76
3. The geometrical parameters of the helical tungsten fibers for a
metal matrix composite and the stress-strain curve of the helical fib
ers were compared with those of straight tungsten fibers in the exper
imental study conducted by Kagawa[3].
In order to compare the model predictions with other experimental
data, the material properties of the main load-carrying layers and the
geometrical parameters are required as input data for the model. The
three experimental studies mentioned above include this information.
The material properties and geometrical parameters related to these
experimental studies and comparison with the present model predictions
are given Table 4 and Fig. 36. The ultimate strength for Poe [I] and
Dexter[2] were calculated from the ultimate tensile strain under the
assumption that the specimen will fail if the outermost fiber at the
concave side of the wavy layer reaches its ultimate strain measured
from an equivalent straight fiber or layer. The comparison of the model
prediction with Poe's experiment [1] is not as good as with Dexter[2] as
shown in Table 4. Also, the In-Phase model gives better results than
the Out-of-phase model for comparing with both experimental results.
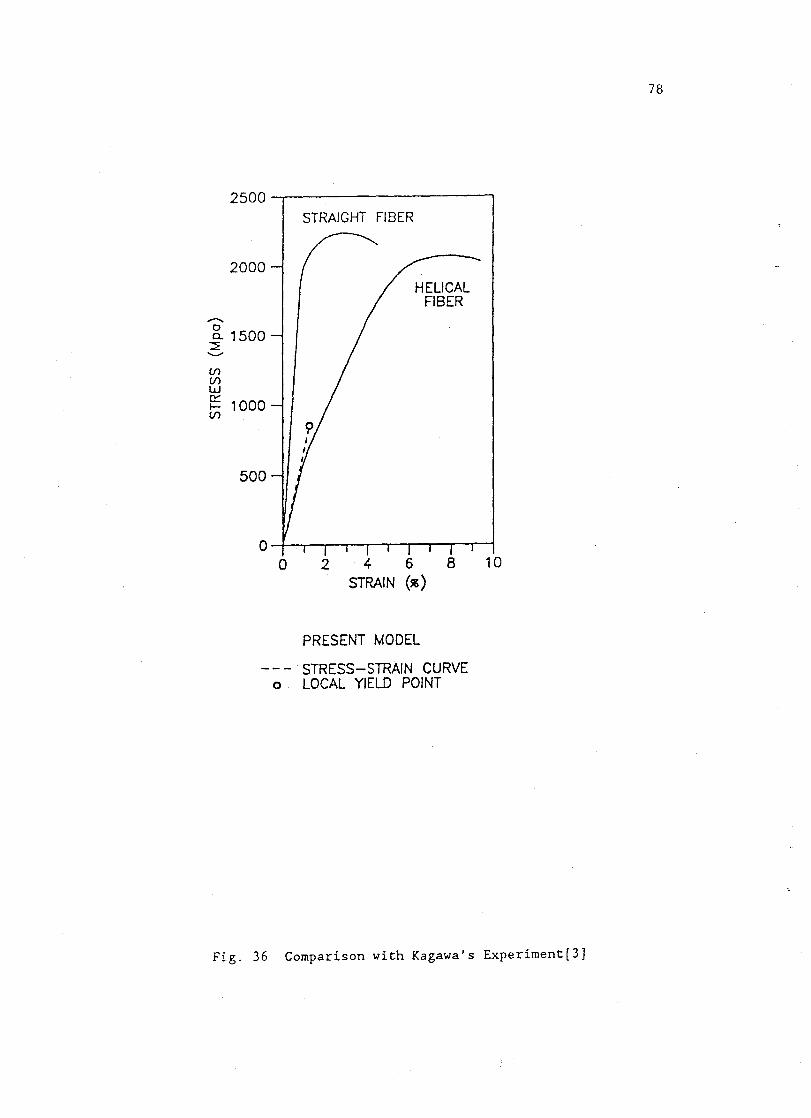
In Fig. 36, the present model may be used to predict the effective
young modulus and the local yield point of Kagawa's helical fibers[3].
Kagawa's stress-strain curve shows a very interesting change in the
effective Young's modulus which is almost linear before and after the
local yield point. One possible explanation is the fact that, under
certain geometries, the local plastic zone will gradually propagate
from the concave surface to the convex surface and also from the maxi-
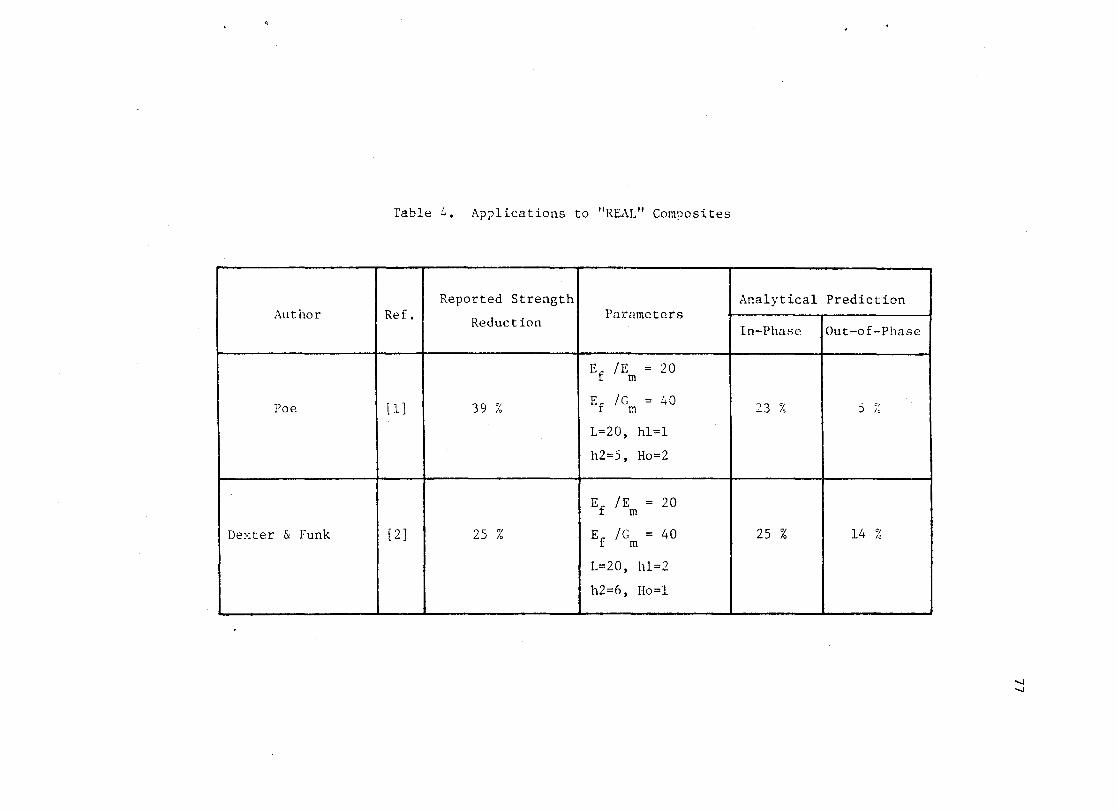
Table 4. Applications to "REAL" Composites
Reported Strength Analytical Prediction Author Ref. Reduction
Parameters In-Phase Out-of-Phase
i
Ef fErn = 20
Poe [1 ] 39 % E fG = 40 f f!1 23 /; 5 ;;
L=20, hl=l
h2=5, Ho=2
Ef fErn = 20
Dexter & Funk [2 ] 25 % Ef fCm = 40 25 % 14 ;~
L=20, h1=2
h2=6, Ho=l
-..J -..J
2500~--------------------'
2000
..........
:f 1500 '--"
(f) (f) w g: 1000 (f)
500
STRAIGHT FIBER
HELICAL FIBER
o~~~~~~-.-.-.-.~
o 246 8 STRAIN (51!))
PRESENT MODEL
STRESS-STRAIN CURVE o LOCAL YIELD POINT
10
Fig. 36 Comparison with Kagawa's Experiment[3]
78
79
mum rising point to the inflection point of the wavy pattern. Then the
effective Young's modulus will decrease after the local yield point is
reached and exhibit almost linear elastic behavior until the elastic
deformation and plastic deformation equilibriate each other. Once this
equilibrium point is reached, the plastic zone will stop propagating to
the adjacent material which is within the elastic range. Thereafter,
increasing the tension load will result in failure of the plastically
deformed region much like a straight specimen failure after its yield
point is exceeded.
COMPARISON WITH OTHER MODELS
Some of the mathematical models given in the literature [8 and 13]
are actually special cases of the present model. Also these studies [8
and 13] do not include the shear term given in eq. (7). The governing
differential equation of the blister model[l3] is a special case of the
Out-of-Phase governing differential equation given by eq. (32). Also,
the equivalent spring constant in ref.[13] is a special case of the
linear spring constant given by eq. (30).
d4w2 d2w2 D-- + Pl-- + kW2 = 0
d x4 d x 2 (37)
where
k - Er/tr
The tie-bar/column model[8] assumed an infinite matrix material and
its governing equation is that of the Out-of-Phase case, but the elas-
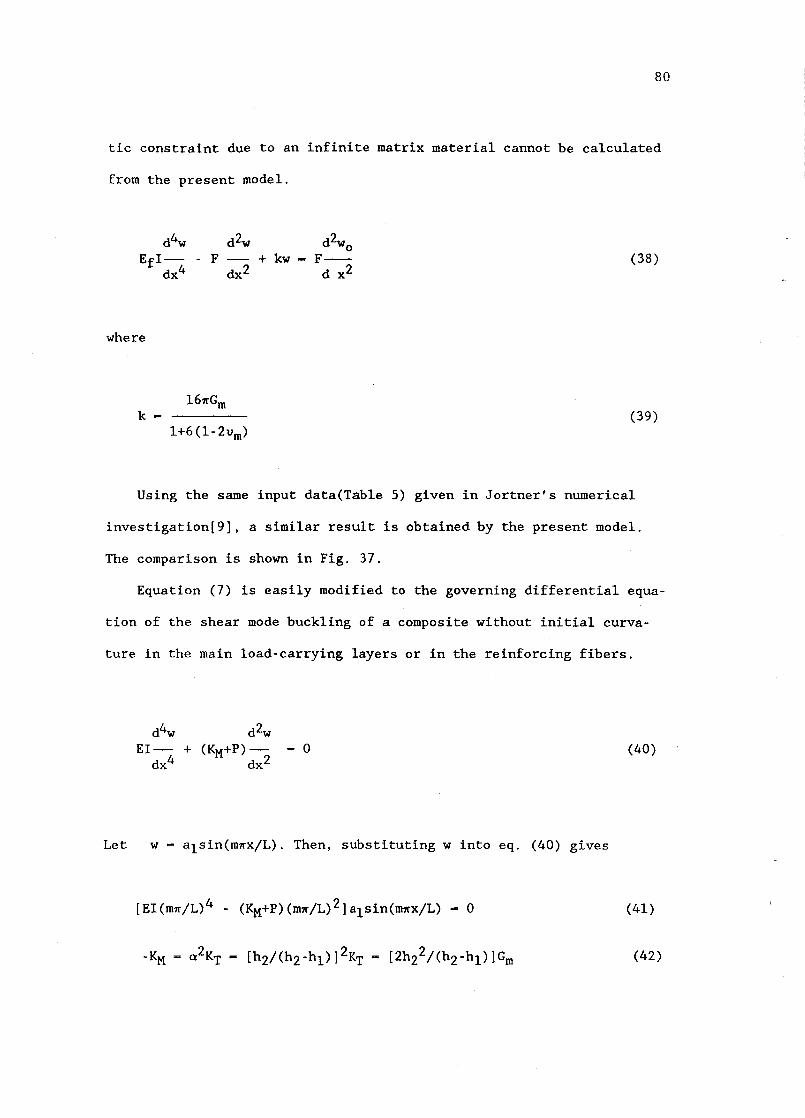
80
tic constraint due to an infinite matrix material cannot be calculated
from the present model.
d4w d 2w EfI- - F
dx4 dx2
where
l6'11"Gm k -
1+6(1-2vm)
d2w o + kw - F--
d x2 (38)
(39)
Using the same input data(Table 5) given in Jortner's numerical
investigation[9], a similar result is obtained by the present model.
The comparison is shown in Fig. 37.
Equation (7) is easily modified to the governing differential equa-
tion of the shear mode buckling of a composite without initial curva-
ture in the main load-carrying layers or in the reinforcing fibers.
d4w d2w EI-- + (KM+P)- - 0
dx4 dx2 (40)
Let w - alsin(m'll"x/L). Then, substituting w into eq. (40) gives
[EI(m'll"/L)4 (KM+p)(m'll"/L)2]alsin(m'll"x/L) - 0 (41)
-KM ~ a 2KT - [h2/(h2-hl)]2KT = [2h22/(h2-hl)]Gm (42)
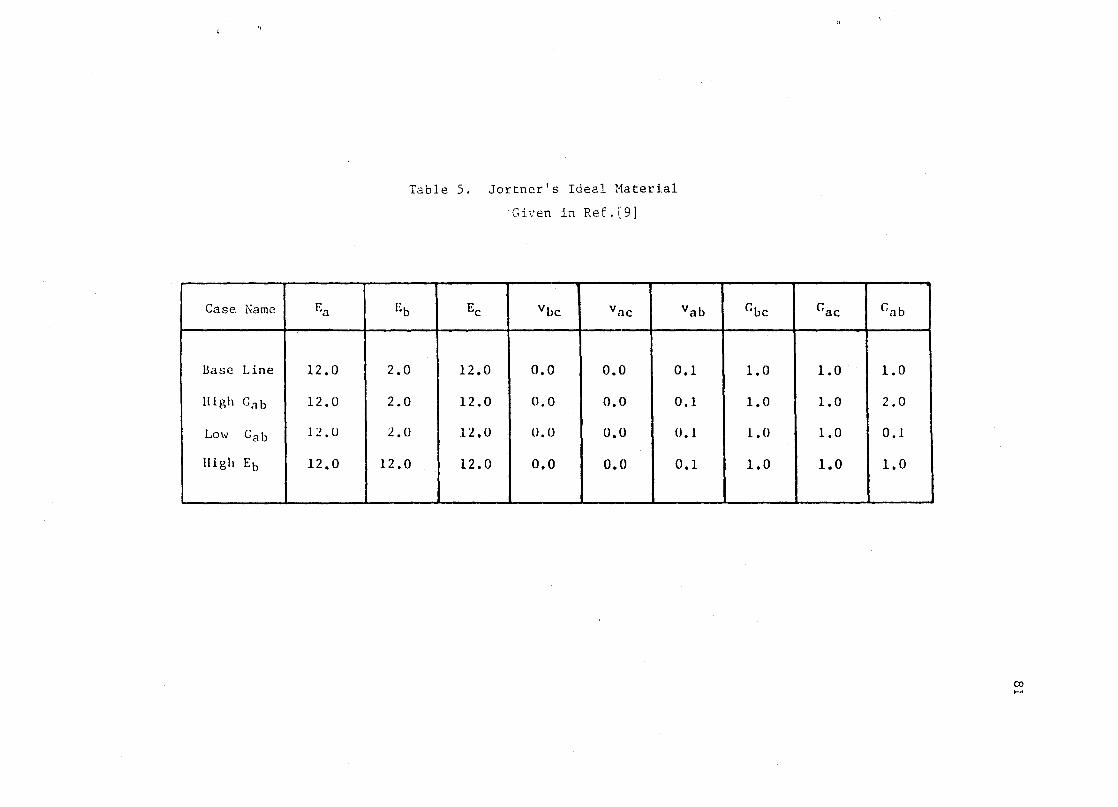
Table 5. Jortner's Ideal Material
Given in Ref.[9]
Case Name E a Eb E e vue vae vau Gue Gae Gab
Base Line 12.0 2.0 12.0 0.0 0.0 0.1 1.0 1.0 1.0
lIigh Gab 12.0 2.0 12.0 0.0 0.0 0.1 1.0 1.0 2.0
Low Gab 12 .U 2.0 12.0 0.0 0.0 0.1 1.0 1.0 0.1
High Eb 12.0 12.0 12.0 0.0 0.0 0.1 1.0 1.0 1.0
- -- ---
co .....
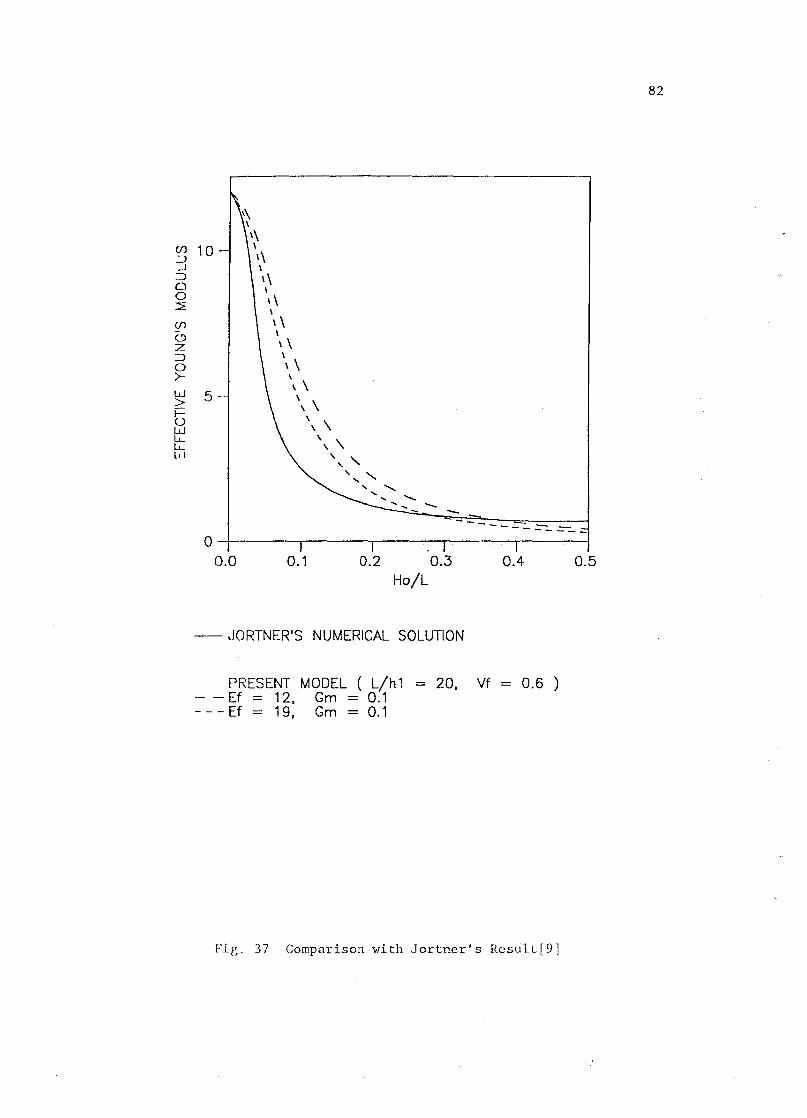
(/) 10 ::::l ...-l ::::l o o L
(/)
C) Z ::::l o >-W 5 > I-o W 1.L 1.L W
,\\ \
\\ \
\\ \ 1\ I \ \ \\ \\ \ \ \ \ \ \ \\ \\
" " , "-" " ..... ........ ......... -
- -------~------0~-------'-------'-------'-------'-------4
0.0 0.1 0.2 0.3 0.4 0.5 Ho/l
- JORTNER'S NUMERICAL SOLUTION
PRESENT MODEL ( l/h 1 = 20, Vf = 0.6 ) - - Ef = 12. Gm = 0.1 - - - Ef = 19. Gm = 0.1
fiE. 37 Comparison with Jortner's Result[9]
82
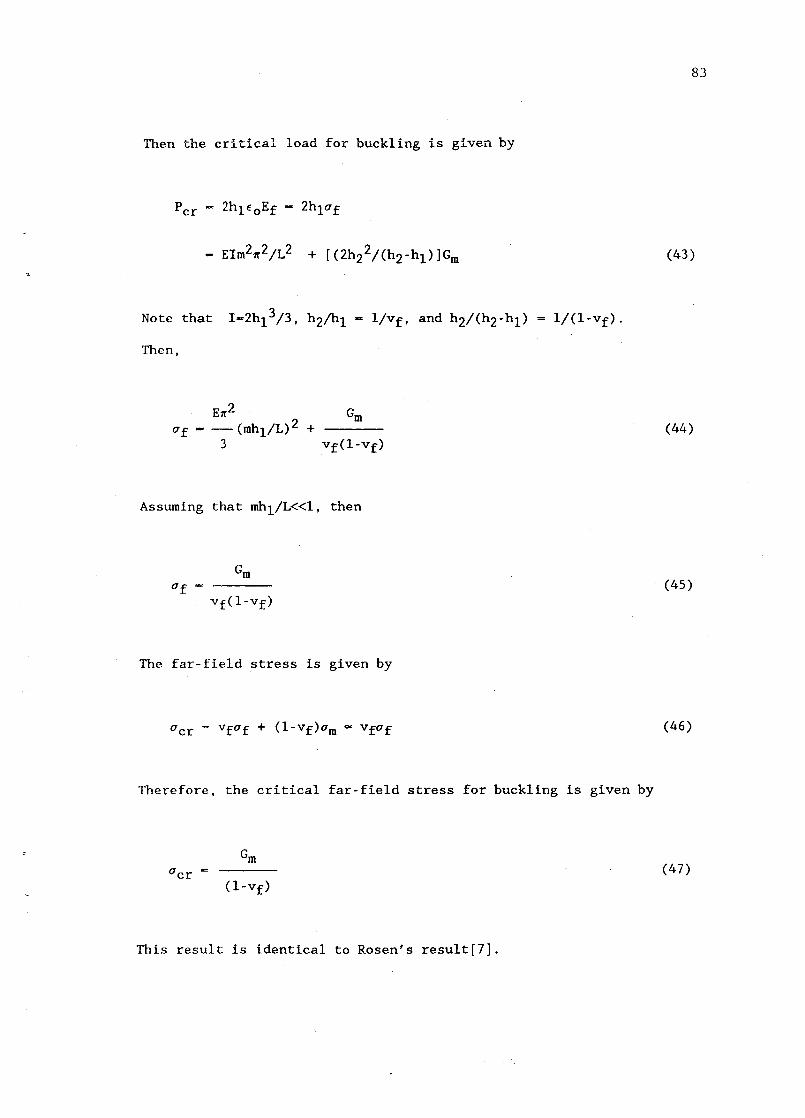
83
Then the critical load for buckling is given by
Pcr - 2hl€oEf = 2hlof
- Elm2~2/L2 + [(2h22/(h2-hl)]Gm (43)
Note that 1-2hl3/3, h2/hl - l/vf, and h2/(h2-hl) l/(l-Vf)·
Then,
E~2 G of _ - (mhl/L) 2 + m (44)
3 vf(l-vf)
Assuming that mhl/L«l, then
Gm Of - (45)
vf{l-Vf)
The far-field stress is given by
Ocr - vfof + (l-vf)om ~ vfof (46)
Therefore, the critical far-field stress for buckling is given by
Gm Ocr (47)
(l-Vf)
This result is identical to Rosen's result[7].
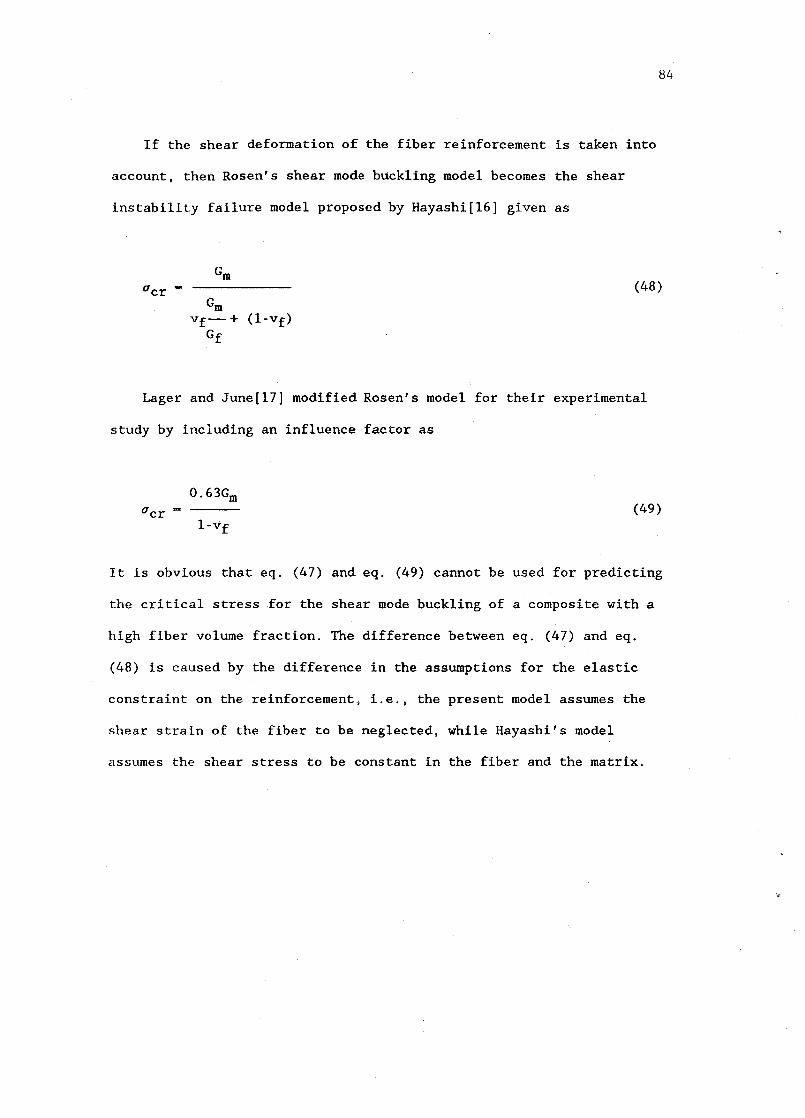
84
If the shear deformation of the fiber reinforcement is taken into
account, then Rosen's shear mode buckling model becomes the shear
instability failure model proposed by Hayashi[16] given as
Gm Ocr - (48)
Gm vf- + (l-vf)
Gf
Lager and June[17] modified Rosen's model for their experimental
study by including an influence factor as
O.63Gm Ocr - (49)
I-Vf
It is obvious that eq. (47) and eq. (49) cannot be used for predicting
the critical stress for the shear mode buckling of a composite with a
high fiber volume fraction. The difference between eq. (47) and eq.
(48) is caused by the difference in the assumptions for the elastic
constraint on the reinforcement, i.e., the present model assumes the
shear strain of the fiber to be neglected, while Hayashi's model
assumes the shear stress to be constant in the fiber and the matrix.
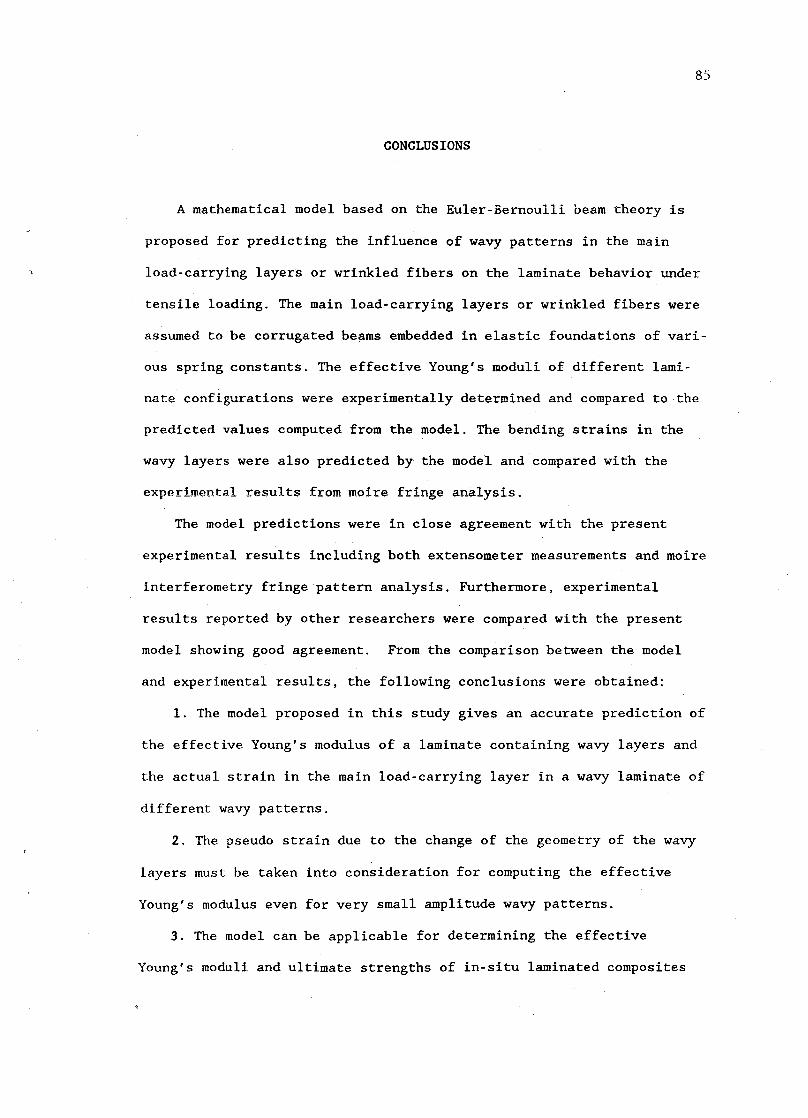
85
CONCLUSIONS
A mathematical model based on the Euler-Bernoulli beam theory is
proposed for predicting the influence of wavy patterns in the main
load-carrying layers or wrinkled fibers on the laminate behavior under
tensile loading. The main load-carrying layers or wrinkled fibers were
assumed to be corrugated beams embedded in elastic foundations of vari
ous spring constants. The effective Young's moduli of different lami
nate configurations were experimentally determined and compared to the
predicted values computed from the model. The bending strains in the
wavy layers were also predicted by the model and compared with the
experimental results from moire fringe analysis.
The model predictions were in close agreement with the present
experimental results including both extensometer measurements and moire
interferometry fringe pattern analysis. Furthermore, experimental
results reported by other researchers were compared with the present
model showing good agreement. From the comparison between the model
and experimental results, the following conclusions were obtained:
1. The model proposed in this study gives an accurate prediction of
the effective Young's modulus of a laminate containing wavy layers and
the actual strain in the main load-carrying layer in a wavy laminate of
different wavy patterns.
2. The pseudo strain due to the change of the geometry of the wavy
layers must be taken into consideration for computing the effective
Young's modulus even for very small amplitude wavy patterns.
3. The model can be applicable for determining the effective
Young's moduli and ultimate strengths of in-situ laminated composites
86
containing wavy patterns under tension loading in the direction of the
wavy patterns.
The present model has three disadvantages. First, it does not give
the interfacial stresses between the main load-carrying layers and the
matrix layers because the stress and deformation of the matrix layers
are assumed to be constant through the thickness. Therefore, failure
modes such as delamination cannot be addressed. By combining the pre
sent model and the approach of Akbarov & Guz [10,111, the interfacial
stress components in a wavy laminate can be calculated. Second, the
model is not directly applicable to anisotropic materials containing
wavy layers. To extend the present model to anisotropic materials, the
model must be generalized in a way similar to the mathematical model
proposed by Shuart[14]. Finally, the stress-strain state in the matrix
material cannot be accurately predicted by the model. This is because
the deformation behavior of the matrix material was idealized as simple
uniform shear or tension-compression, which was only qualitatively con
firmed by the moire analysis.
In conclusion, the model generated herein gives a reasonable first
approximation of the effective Young's modulus of composites containing
local curvature in the reinforcement. Furthermore, while the strength
issue has not been fully investigated, the model appears to give a rea
sonable approximation of the failure of the reinforcing layer.
87
REFERENCES
1. Poe, C. C., Jr., Illg, W., and Garber, D. P., "Tension Strength of
a Thick Graphite/Epoxy Laminate after Impact by a 1/2-in.-radius
Impactor," NASA TM -87771 National Aeronautics and Space Administra
tion, Washington, D.C., July 1986.
2. Dexter, H. B. and Funk, J. G., "Impact Resistance and Interlamina
Fracture Toughness of Through-the-Thickness reinforced Graphite/
Epoxy," AIM Paper 86-l020-CP, May 1986.
3. Kagawa, Y., Nakata, E., and Yoshida, S., "Fracture Behavior and
Toughness of Helical Fiber Reinforced Composite Metals," Proceed
ings of the 4th International Conference on Composite materials,
ICCN-IV, October 1982.
4. Makarov, B. P. and Nikolaev, V. P., "Effect of Curvature of the
Reinforcement on the Mechanical and Thermophysical Properties of a
Composite," Polymer Mechanics(Translated from Russian), No.6,
November-December,1971.
5. Simonds, R. A., Stinchcomb, W., and Jones, R. M., "Mechanical
Behavior of Braided Composite Materials," Composite Materials;
Testing and Design(8th Conference). ASTM STP 972, J. D. Whitcomb,
Ed., American Society for Testing and Materials, Philadelphia,
April 29-May I, 1986.
6. Davis, J. G., Jr., "Compressive Strength of Fiber-Reinforced Com
posite Materials," Composite Reliability. ASTM STP 580, American
Society for Testing and Materials, Philadelphia, pp.364-377, 1975.
7. Rosen, B. W., "Mechanics of Composite Strengthening," Fiber Compos
ite Materials, American Society for Metals, pp.37-75, 1965.
88
8. Bert, C. W., "Micromechanics of the Different Elastic Behavior of
Filamentary Composites in Tension and Compression," Mechanics of
Bimodulus Materials, ASME, New York, AMD-Vol. 33, pp.17-28, Decem
ber, 1979.
9. Jortner, J., "A Model for Predicting Thermal and Elastic Constants
of Wrinkled Regions in Composite Materials," Effects of Defects in
Composite Materials, ASTM STP 836, American Society for Testing and
Materials, Philadelphia, pp,217-236, 1984.
10. Akbarov, S. D, and Guz, A. N., "Stressed State in a Composite Mate
rials with Curved Layers Having a Low Filler Concentration, "
Mechanics of Composite Materials (Translated from Russian), Consul
tant Bureau, New York, pp,688-693, May 1985, (Russian Original,
Vol. 20, No.6, 1984).
11. Akbarov, S. D. and Guz, A. N., "Model of a Piecewise Homogeneous
body in the Mechanics of Laminar Composites with Fine-Scale curva
tures," Soviet Applied Mechanics (Translated from Russian), Consul
tant Bureau, New York, pp.3l3-3l9, October 1985, (Russian Original,
Vol. 21, No.4, 1985.)
12. Ishikawa, T., Matsushima, M., Hayashi, Y., and Chow, T., "Exper
imental Confirmation of the Theory of Elastic Moduli of Fabric Com
posites," Journal of Composite Materials, Vol. 19, pp.443-458,
September 1985.
13. El-Senussi, A. K. and Webber, J. P. H, "Blister Delamination Analy
sis Using Beam-Column Theory with an Energy Release Rate Crite
rion," Composite Structures, Vol. 5, pp.125-l42, 1986.
14. Shuart, M. J., "Short-Wavelength Buckling and Shear Failure for
Compression-Loaded Composite Materials," NASA TM 87640, National
Aeronautics and Space Administration, Washington, D.C., November,
1985.
15. Post, D., "Moire Interferometry," SESA Handbook on Experimental
Mechanics, Albert S. Kobayashi, Ed., 1987.
16. Hayashi, T., " On the Shear Instability of Structures Caused by
Compressive Load," AIAA Paper No. 65-770, 1965.
89
17. Lager, J. B. and June, R. R., "Compressive Strength of Boron-Epoxy
Composites," Journal of Composite Materials, vol. 3, No.1,
pp.48-56, 1969.
18. Shames, I. H. and Dym C. L., Energy and Finite Element Methods in
Structural Mechanics, McGraw-Hill, pp.424, 1985.
19. Timoshenko, S. P. and Gere, J. M., Theory of Elastic Stability,
McGraw-Hill, Second Edition, pp.32, 1983.
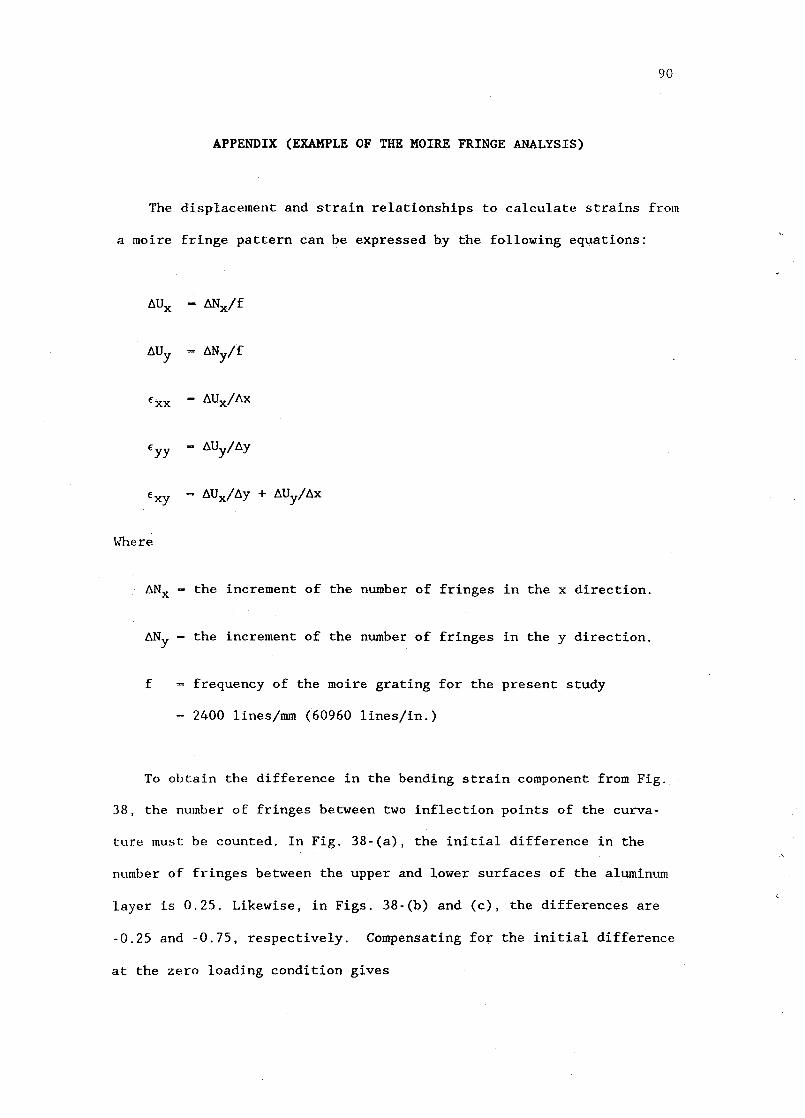
90
APPENDIX (EXAMPLE OF THE MOIRE FRINGE ANALYSIS)
The displacement and strain relationships to calculate strains from
a moire fringe pattern can be expressed by the following equations:
AUx - 8Nx/f
AUy - ANy/f
€xx = 8UX/Ax
€yy - AUy/Ay
€xy - 8UX/Ay + AUy/Ax
Where
ANx - the increment of the number of fringes in the x direction.
ANy = the increment of the number of fringes in the y direction.
f frequency of the moire grating for the present study
2400 lines/mrn (60960 lines/in.)
To obtain the difference in the bending strain component from Fig.
38, the number of fringes between two inflection points of the curva
ture must be counted. In Fig. 38-(a), the initial difference in the
number of fringes between the upper and lower surfaces of the aluminum
layer is 0.25. Likewise, in Figs. 38-(b) and (c), the differences are
-0.25 and -0.75, respectively. Compensating for the initial difference
at the zero loading condition gives
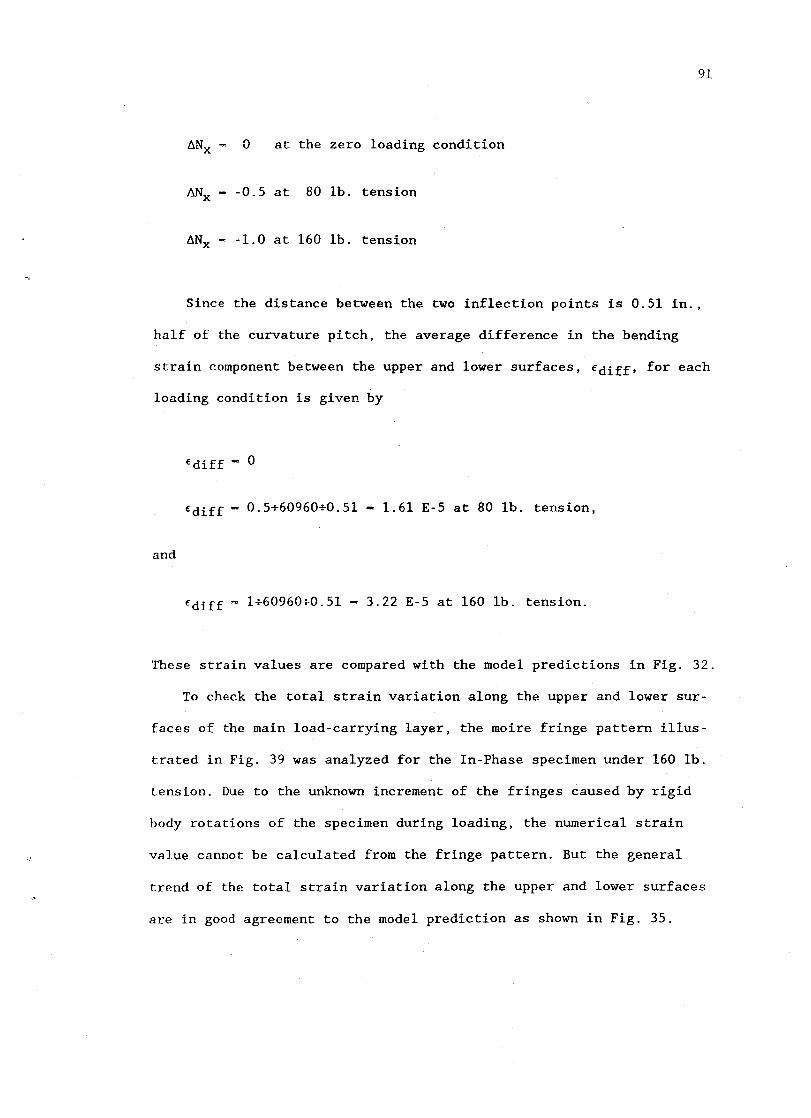
91
llNx = 0 at the zero loading condition
llNx = -O.S at 80 lb. tension
llNx - -1.0 at 160 lb. tension
Since the distance between the two inflection points is O.Sl in.,
half of the curvature pitch, the average difference in the bending
strain component between the upper and lower surfaces, fdiff, for each
loading condition is given by
fdiff - 0
fdiff - 0.S+60960+0.Sl - 1.61 E-S at 80 lb. tension,
and
Ediff - 1+60960+0.Sl - 3.22 E-S at 160 lb. tension.
These strain values are compared with the model predictions in Fig. 32.
To check the total strain variation along the upper and lower sur
faces of the main load-carrying layer, the moire fringe pattern illus
trated in Fig. 39 was analyzed for the In-Phase specimen under 160 lb.
tension. Due to the unknown increment of the fringes caused by rigid
body rotations of the specimen during loading, the numerical strain
value cannot be calculated from the fringe pattern. But the general
trend of the total strain variation along the upper and lower surfaces
are in good agreement to the model prediction as shown in Fig. 3S.
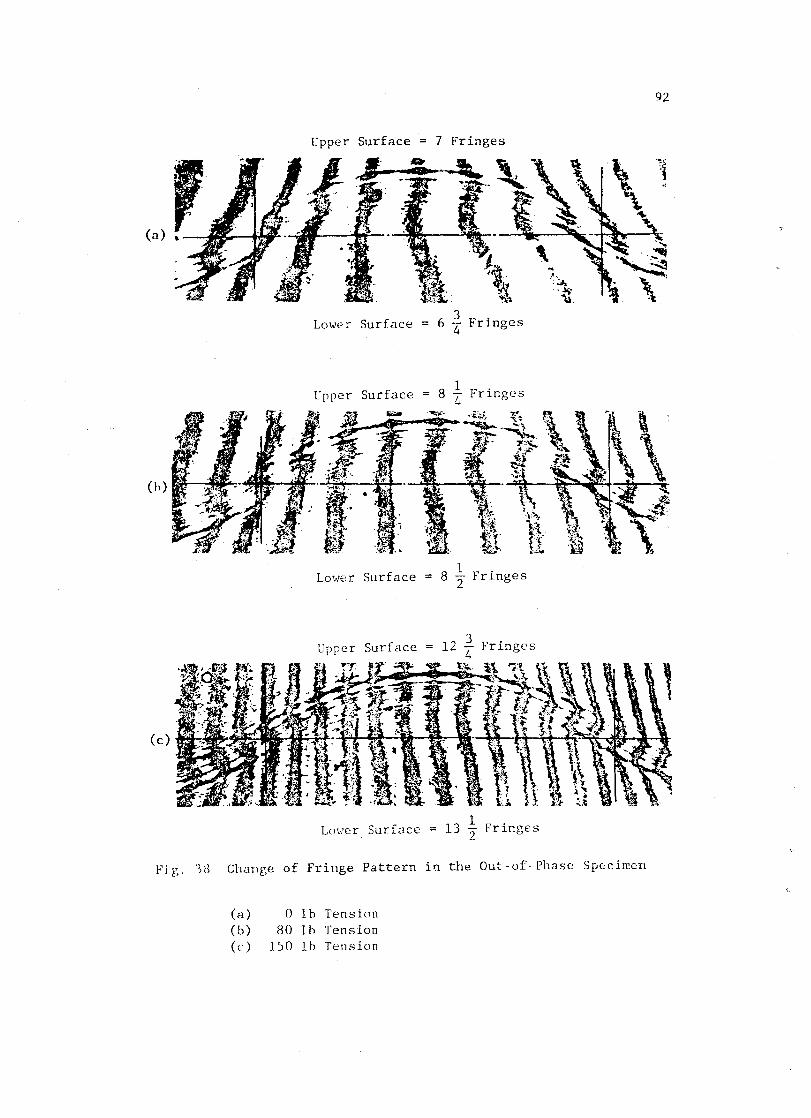
92
Upper Surface 7 Fringes
:~ 0'
(n)
.. . ft ... , .. ", ,~o
"\i,
Lower Surface 6 % Fringes
Surface 8 1 I' . - ·rlnges 4
(b) '\\ ~,~-~
~_.:tl: '6' '~:
~A ,'-'n ' r.! ,
Lo,o!er Surface 8 1 T_' 0 "2 rrlnges
Upper Fringes
(c)
Lower Surface 13 t Fringes
Fig. '"g Change of Fringe Pattern in the Out-of-Pl13se Specimen
(a) 0 Ih Tension (b) 80 Ib Tension (e) 150 Ib Tension
,-
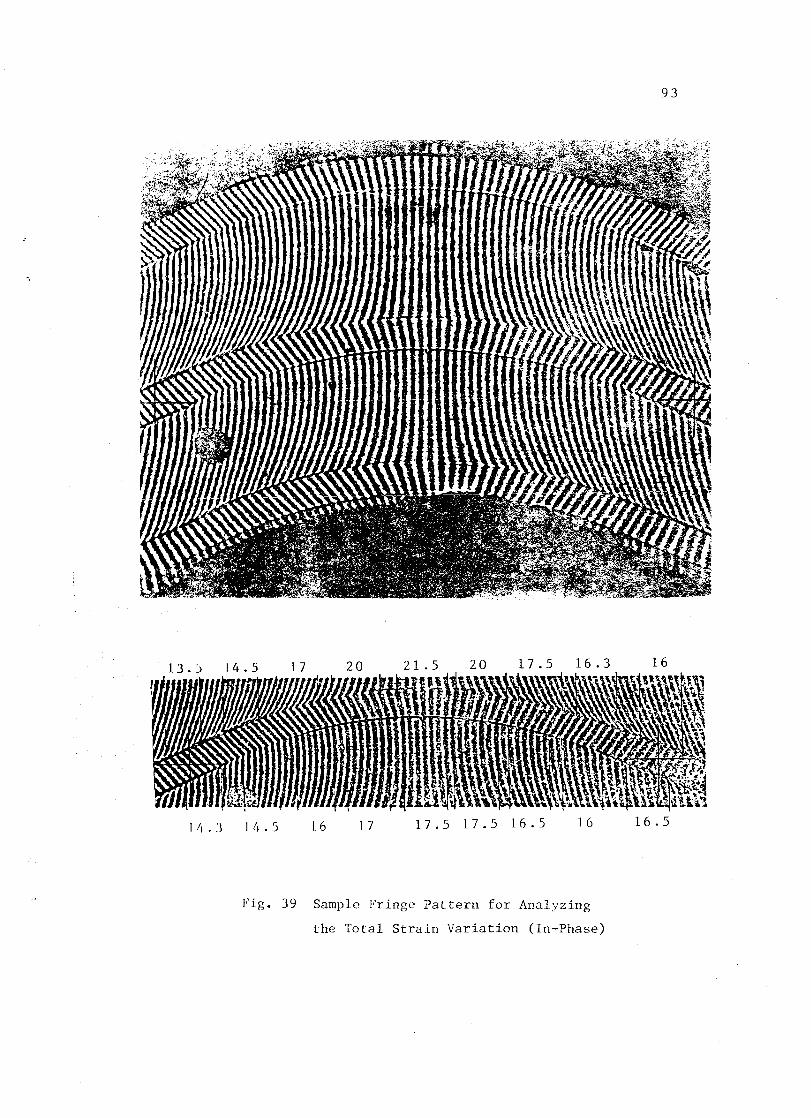
-,
17 20 21 .5 20
]L,.J 14.5 1 6 1 7 17.5 17.5 16.5
Fig. 39 Sample Fringe Pattern for Analyzing
the Total Strain Variation (In-Phase)
93
I\U\SI\ Report Documentation Page r .1.11. ">.ll !\j" ~ "I' It. -, .11 ~; ,t"·j, ,. "',1""',,',;' II.w'
.... ----------------. 2. Government Accession No. 3. Recipient's Catalog No. 1. H~,pmt No.
NASA CR-181670 .. ___ 1...
4. rltl" and Subtitle
A MICROMECHANICS MODEL OF THE STIFFNESS AND STRENGTH OF LAMINATES WITH FIBER WAVINESS
."-----~--
7. Author(s)
Charles E. Harris and Jong-Won Lee
5. Report Date
July 1988 ·-6.·-performing Organization Code ----
8. Performing Organization Report No.
~------,----::-:---------.-----j 10. Work Unit No.
- .- ----_ ...• _.- .. _ ... __ ... -'-- .. _--_._.--_._----_. ~ 506-43-11-04 9. Pnrform,nn Organization Name and Address
Texas A&M University Aerospace Engineering Department College Station, TX 77841
11. Contract or Grant No.
NAGl-711 _________________ --1,13. Type of Report and Period Covered
.- .. - -.-~ -~.-.-~--.--.-
12. Sponsoring Agency Namf' and Address
National Aeronautics and Space Administration Langley Research Center
Contractor Report 14. Sponsoring p,.gency Code
Hampton, VA 23665-5225 --'~'-'- _ .... _-_._ .. __ .. _-_. __ .. _--15. Supplementary Notes
Langley Technical Monitor: C. C. Poe, Jr .
. _-- - -- ._-------" . 16. Abstract A mathematical model based on the Euler-Bernoulli beam theory is proposed for predicting the effective Young's moduli of piecewise isotropic composite laminates with local ply curvatures in the main load-carrying layers. Strains in corrugated layers, In-Phase layers, and Out-of-Phase layers are predicted for various geometries and material configurations by assuming matrix layers as elastic foundations of differen spring constants. The effective Young's moduli measured from corrugated aluminum specimens and alunlinu~/ epoxy specimens with In-Phase and Out-of-Phase wavy patterns coincide very well with the model predictions. Moire fringe analysis of an In-Phase specimen and an Out-ofPhase specimen are also presented confirming the main assumption of the model related to the elastic constraint due to the matrix layers. The present model is also compared with the experimental results and other models, including the micro-bucklinc models, published in the literature. The results of the present study show that even a very small-scale local ply curvature produces a noticeable effect on the mechanical constitutive behavior of a laminated composite.
i-i~-Key·W~-ds(S~ggesied by' A~thor(s))-' /18. Distribution Statement
Laminated composites In-phase Main load-carrying layer Out-of-Phase U 1 'f' d - U l' 't d \~avy pattern Pseudo strain nc aSSl le n lml e Local ply curvature Tension Subject Category - 24 Corrugated beam Compression 19. SIlCUllty Classif. (of th,~ rep~'rt)-'-" -T2O:-S;C-urity- Classif. (of this page) 121 No. of pages 122. Price
Unclassified Unclassified 101 A06 NASA FORM 1626 OCT 86

End of Document