Embed Size (px)
Citation preview

Non-destructive determination of Young's modulus and its relationship with compressive strength, porosity and density
R. J. Allison
S U M MA R Y : The Grindosonic apparatus, new equipment capable of indirectly determining rock compressive strength, is discussed. This utilizes the principle that elasticity theory can be applied to rock masses (Attewell & Farmer 1976; Selby 1982) and directly measures the fundamental vibration frequency of a rock sample of regular dimensions following shock excitation. Dynamic Young's modulus and a variety of other parameters can be established.
Samples of Upper Cretaceous Chalk and Upper Jurassic Portland Limestone are used to demonstrate the apparatus and its application. Test specimens were prepared and analysis conducted on material extracted at a number of locations throughout the Isle of Purbeck in Dorset, UK. Samples suitable for deformation in triaxial compression were also prepared and correlations drawn between compressive strength, dynamic Young's modulus, porosity and density.
The Grindosonic apparatus
The Grindosonic apparatus (Fig. 1) is new equipment capable of determining rock strength. This utilizes the principle that elasticity theory can be applied to rock masses and directly measures the fundamental vibration frequency of a rock sample of known dimensions following shock excitation. The measured elastic material properties can then be calibrated to determine rock hardness and strength. The device, an example of ultrasonic pulse velocity testing equipment (Neville 1981), analyses the transient vibration of a test specimen. The sample is struck to set up a mechanical vibration pattern rather than being subjected to continuous flexure. This pattern is converted to an electronic signal via
FIG. 1. Grindosonic apparatus.
either a piezo-electric detector held in contact with the test piece surface or a microphone placed directly beneath the sample. The signal is amplified by the apparatus before being fed to the instrument input. If it exceeds the predeter- mined minimum level required for analysis, the time of eight wave passes is measured. A short interval between striking the sample and meas- urement prevents the analysis of spurious initial wave patterns which have complex harmonics and which occur when the test piece is initially struck. The lapsed time appears as a result in the equipment display panel and is known as the r-value.
The vibrating sample experiences damping relative to its elastic properties. The decay of a vibration pattern set up in a hard, rigid test piece will take much longer than the same flexure in a soft material of similar dimensions. The result given by Grindosonic therefore constitutes a direct measure of sample rigidity or hardness. However, the natural frequency of vibration is determined by specimen shape and several other physical constants. Consequently, by utilizing details of the dimensions and weight of a specimen together with its r-value determined by the Grindosonic, Young's modulus of elasticity, shear modulus, Poisson's ratio, bulk density, seismic velocity and a variety of other parameters can be calculated. Additionally, these properties can be measured as a function of variables such as temperature, degree of saturation, chemical alteration and weathering.
From: JONES, M. E. &PRESTON, R. M. F. (eds), 1987, Deformation of Sediments and Sedimentary Rocks, Geological Society Special Publication No. 29, pp. 63-69.
63
64 R. J. Allison
Sample preparation, constraints and testing
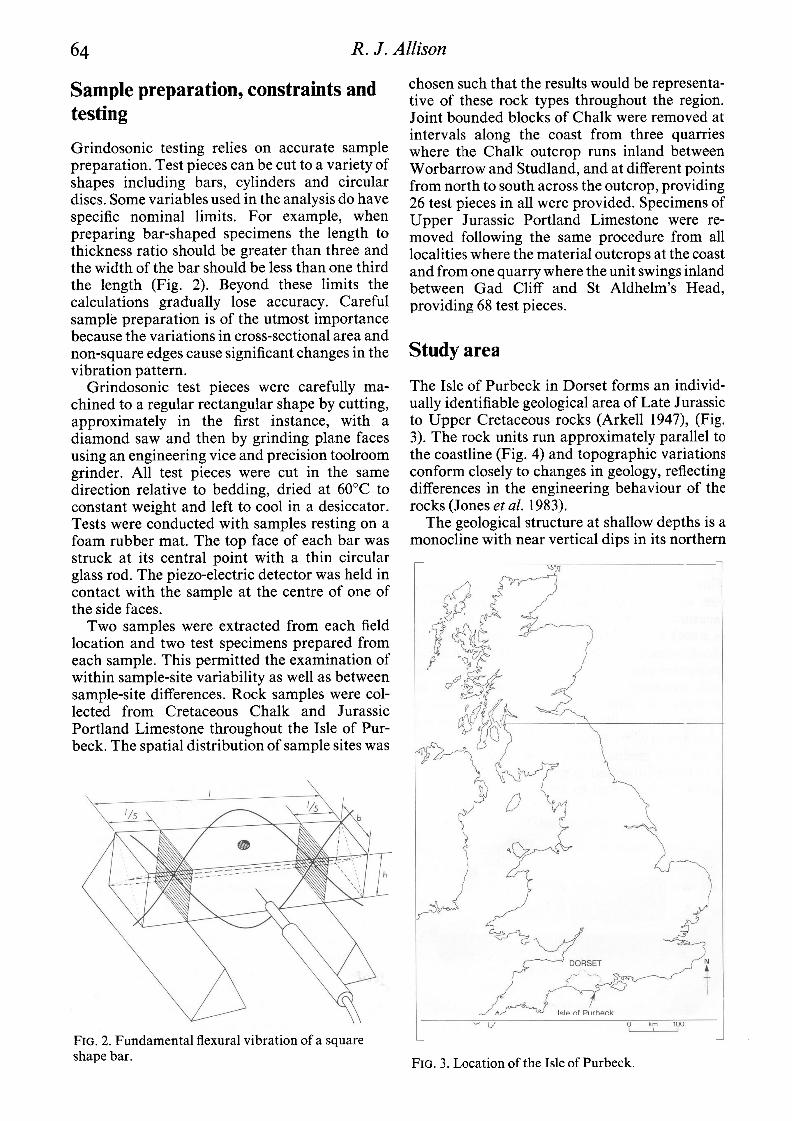
Grindosonic testing relies on accurate sample preparation. Test pieces can be cut to a variety of shapes including bars, cylinders and circular discs. Some variables used in the analysis do have specific nominal limits. For example, when preparing bar-shaped specimens the length to thickness ratio should be greater than three and the width of the bar should be less than one third the length (Fig. 2). Beyond these limits the calculations gradually lose accuracy. Careful sample preparation is of the utmost importance because the variations in cross-sectional area and non-square edges cause significant changes in the vibration pattern.
Grindosonic test pieces were carefully ma- chined to a regular rectangular shape by cutting, approximately in the first instance, with a diamond saw and then by grinding plane faces using an engineering vice and precision toolroom grinder. All test pieces were cut in the same direction relative to bedding, dried at 60°C to constant weight and left to cool in a desiccator. Tests were conducted with samples resting on a foam rubber mat. The top face of each bar was struck at its central point with a thin circular glass rod. The piezo-electric detector was held in contact with the sample at the centre of one of the side faces.
Two samples were extracted from each field location and two test specimens prepared from each sample. This permitted the examination of within sample-site variability as well as between sample-site differences. Rock samples were col- lected from Cretaceous Chalk and Jurassic Portland Limestone throughout the Isle of Pur- beck. The spatial distribution of sample sites was
FIG. 2. Fundamental flexural vibration of a square shape bar.
chosen such that the results would be representa- tive of these rock types throughout the region. Joint bounded blocks of Chalk were removed at intervals along the coast from three quarries where the Chalk outcrop runs inland between Worbarrow and Studland, and at different points from north to south across the outcrop, providing 26 test pieces in all were provided. Specimens of Upper Jurassic Portland Limestone were re- moved following the same procedure from all localities where the material outcrops at the coast and from one quarry where the unit swings inland between Gad Cliff and St Aldhelm's Head, providing 68 test pieces.
Study area
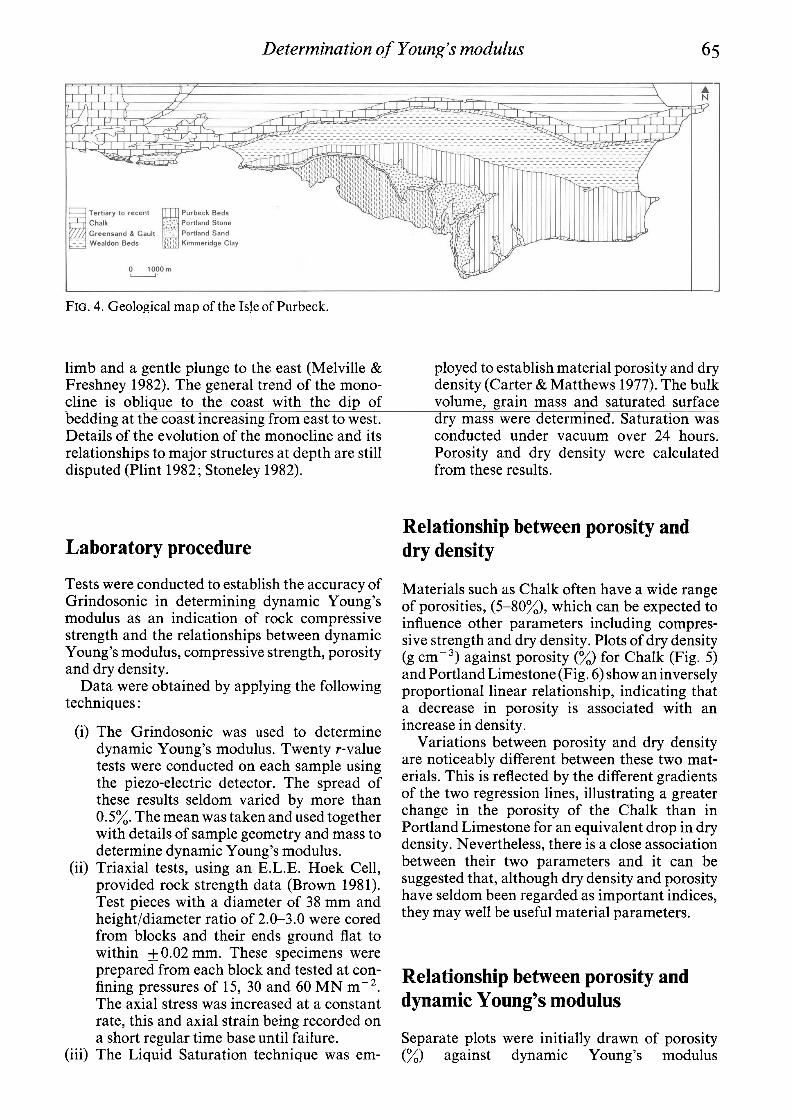
The Isle of Purbeck in Dorset forms an individ- ually identifiable geological area of Late Jurassic to Upper Cretaceous rocks (Arkell 1947), (Fig. 3). The rock units run approximately parallel to the coastline (Fig. 4) and topographic variations conform closely to changes in geology, reflecting differences in the engineering behaviour of the rocks (Jones et al. 1983).
The geological structure at shallow depths is a monocline with near vertical dips in its northern
FIG. 3. Location of the Isle of Purbeck.
Determination of Young's modulus 65
FIG. 4. Geological map of the Isle of Purbeck.
limb and a gentle plunge to the east (Melville & Freshney 1982). The general trend of the mono- cline is oblique to the coast with the dip of bedding at the coast increasing from east to west. Details of the evolution of the monocline and its relationships to major structures at depth are still disputed (Plint 1982; Stoneley 1982).
Laboratory procedure
Tests were conducted to establish the accuracy of Grindosonic in determining dynamic Young's modulus as an indication of rock compressive strength and the relationships between dynamic Young's modulus, compressive strength, porosity and dry density.
Data were obtained by applying the following techniques:
(i) The Grindosonic was used to determine dynamic Young's modulus. Twenty r-value tests were conducted on each sample using the piezo-electric detector. The spread of these results seldom varied by more than 0.5%. The mean was taken and used together with details of sample geometry and mass to determine dynamic Young's modulus.
(ii) Triaxial tests, using an E.L.E. Hoek Cell, provided rock strength data (Brown 1981). Test pieces with a diameter of 38 mm and heightldiameter ratio of 2.0-3.0 were cored from blocks and their ends ground flat to within k0.02 mm. These specimens were prepared from each block and tested at con- fining pressures of 15, 30 and 60 MN m-2. The axial stress was increased at a constant rate, this and axial strain being recorded on a short regular time base until failure.
(iii) The Liquid Saturation technique was em-
ployed to establish material porosity and dry density (Carter & Matthews 1977). The bulk volume, grain mass and saturated surface dry mass were determined. Saturation was conducted under vacuum over 24 hours. Porosity and dry density were calculated from these results.
Relationship between porosity and dry density
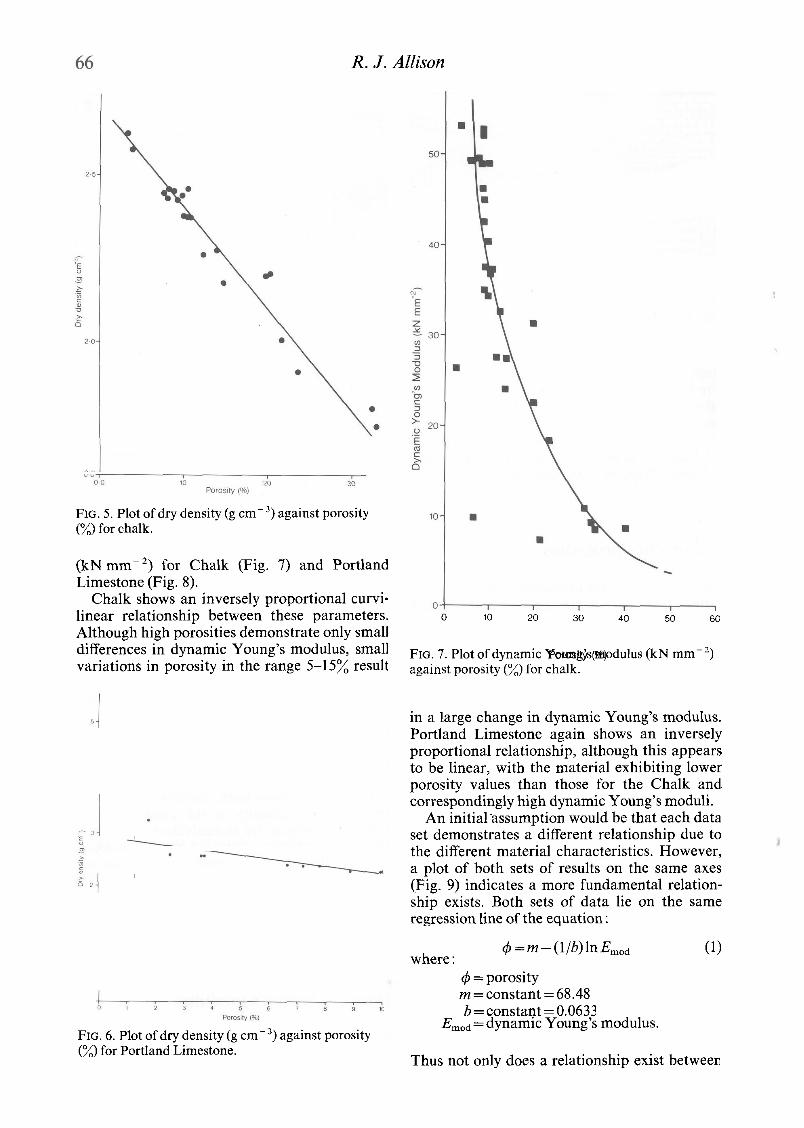
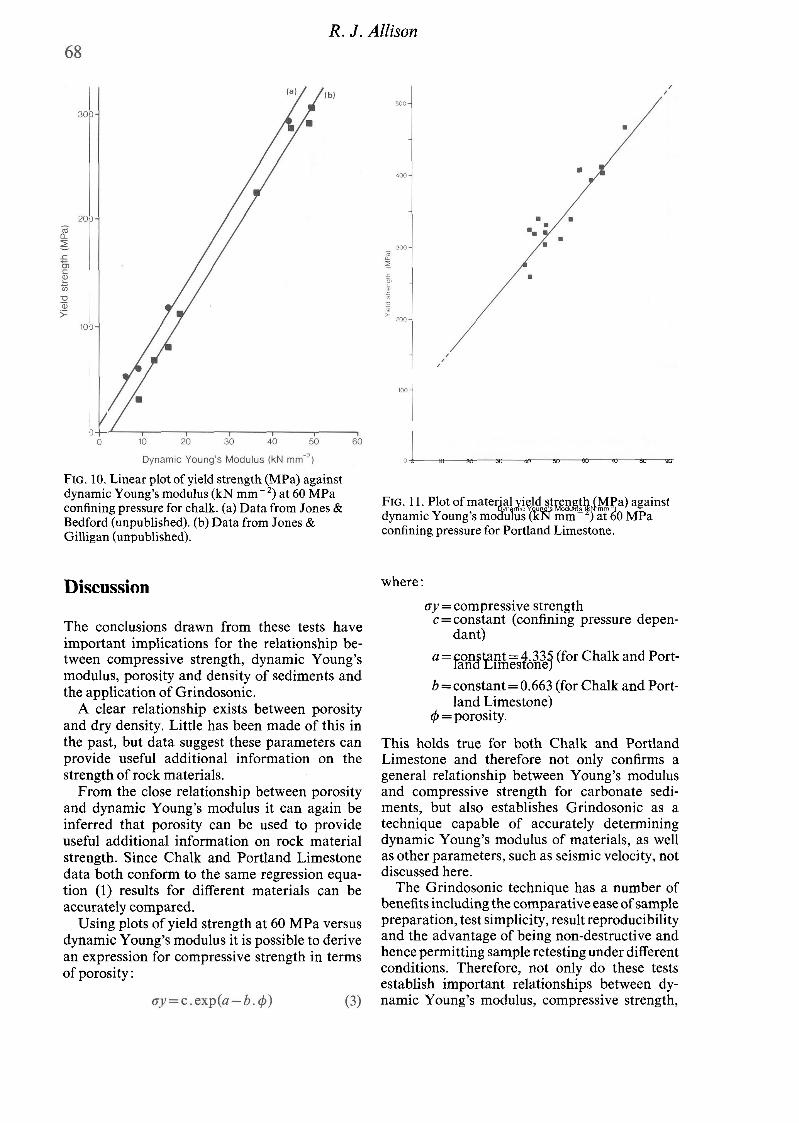
Materials such as Chalk often have a wide range of porosities, (5-80%), which can be expected to influence other parameters including compres- sive strength and dry density. Plots of dry density (g cm-3) against porosity ( X ) for Chalk (Fig. 5) and PortlandLimestone (Fig. 6) show an inversely proportional linear relationship, indicating that a decrease in porosity is associated with an increase in density.
Variations between porosity and dry density are noticeably different between these two mat- erials. This is reflected by the different gradients of the two regression lines, illustrating a greater change in the porosity of the Chalk than in Portland Limestone for an equivalent drop in dry density. Nevertheless, there is a close association between their two parameters and it can be suggested that, although dry density and porosity have seldom been regarded as important indices, they may well be useful material parameters.
Relationship between porosity and dynamic Young's modulus
Separate plots were initially drawn of porosity (%) against dynamic Young's modulus
R. J . Allison
FIG. 5. Plot of dry density (g cm-3) against porosity (%)for chalk.
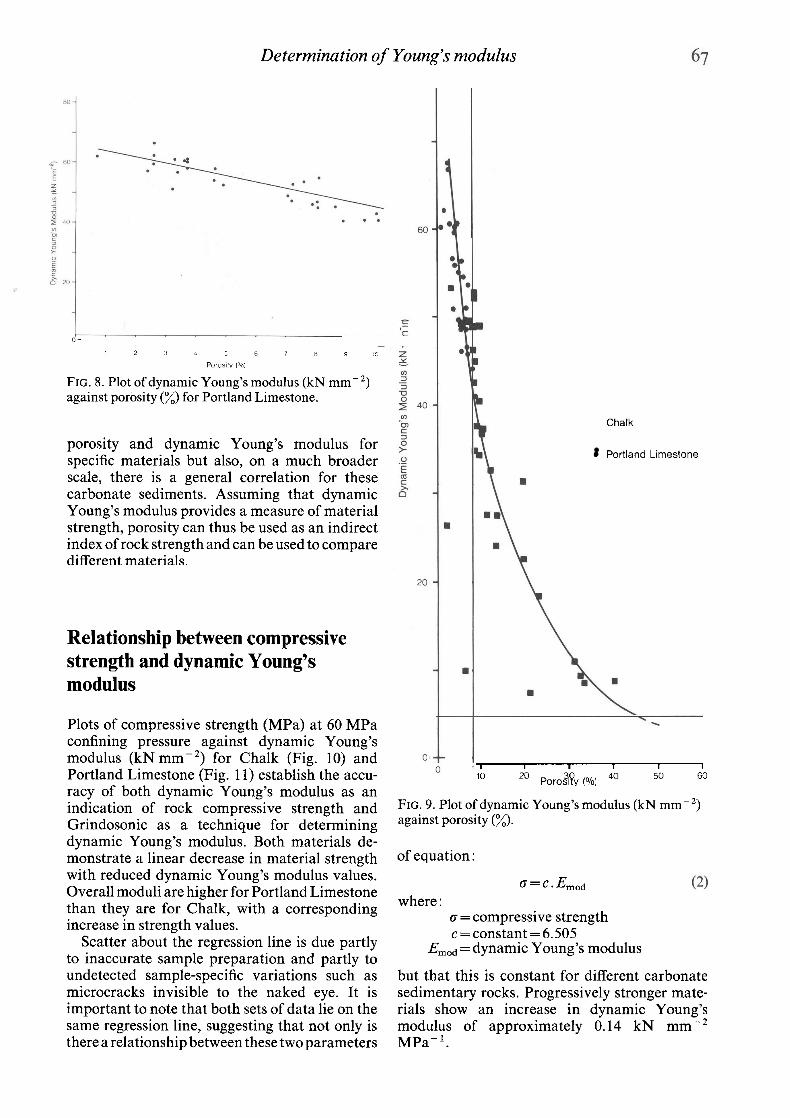
(kNmm-2) for Chalk (Fig. 7) and Portland Limestone (Fig. 8).
Chalk shows an inversely proportional curvi- linear relationship between these parameters. Although high porosities demonstrate only small differences in dynamic Young's modulus, small variations in porosity in the range 5-15% result
FIG. 6. Plot of dry density (g cm-3) against porosity ( X ) for Portland Limestone.
0 10 20 30 40 50 60
Porosity (%)
FIG. 7. Plot of dynamic Young's modulus (kN mm-') against porosity ( X ) for chalk.
in a large change in dynamic Young's modulus. Portland Limestone again shows an inversely proportional relationship, although this appears to be linear, with the material exhibiting lower porosity values than those for the Chalk and correspondingly high dynamic Young's moduli.
An initialassumption would be that each data set demonstrates a different relationship due to the different material characteristics. However, a plot of both sets of results on the same axes (Fig. 9) indicates a more fundamental relation- ship exists. Both sets of data lie on the same regression line of the equation :
4=m-(l/b)lnEmod (1) where :
4 =porosity m = constant = 68.48 b = constant = 0.0633
Em,, = dynamic Young's modulus.
Thus not only does a relationship exist between
Determination of Young's modulus
0 / 1 2 3 4 1 5 7 8 9 W
Porosity ,*a,
FIG. 8. Plot of dynamic Young's modulus (kN mm-') against porosity (A) for Portland Limestone.
porosity and dynamic Young's modulus for specific materials but also, on a much broader scale, there is a general correlation for these carbonate sediments. Assuming that dynamic Young's modulus provides a measure of material strength, porosity can thus be used as an indirect index of rock strength and can be used to compare different materials.
Relationship between compressive strength and dynamic Young's modulus
Plots of compressive strength (MPa) at 60 MPa confining pressure against dynamic Young's modulus (kN mm-') for Chalk (Fig. 10) and Portland Limestone (Fig. l l ) establish the accu- racy of both dynamic Young's modulus as an indication of rock compressive strength and Grindosonic as a technique for determining dynamic Young's modulus. Both materials de- monstrate a linear decrease in material strength with reduced dynamic Young's modulus values. Overall moduli are higher for Portland Limestone than they are for Chalk, with a corresponding increase in strength values.
Scatter about the regression line is due partly to inaccurate sample preparation and partly to undetected sample-specific variations such as microcracks invisible to the naked eye. It is important to note that both sets of data lie on the same regression line, suggesting that not only is there arelationship between these two parameters
Chalk
Portland Limestone
I I I I 1 I 10 20 30 40 50 60
Porosity (%)
FIG. 9. Plot of dynamic Young's modulus (kN mm-') against porosity (X ) .
of equation :
o=c.&,,~
where : a = compressive strength c = constant = 6.505
E,,, = dynamic Young's modulus
but that this is constant for different carbonate sedimentary rocks. Progressively stronger mate- rials show an increase in dynamic Young's modulus of approximately 0.14 kN mm-' MPa-l.
R. J . Allison
FIG. 10. Linear plot of yield strength (MPa) against dynamic Young's modulus (kN mm-') at 60 MPa confining pressure for chalk. (a) Data from Jones & Bedford (unpublished). (b) Data from Jones & Gilligan (unpublished).
Discussion
The conclusions drawn from these tests have important implications for the relationship be- tween compressive strength, dynamic Young's modulus, porosity and density of sediments and the application of Grindosonic.
A clear relationship exists between porosity and dry density. Little has been made of this in the past, but data suggest these parameters can provide useful additional information on the strength of rock materials.
From the close relationship between porosity and dynamic Young's modulus it can again be inferred that porosity can be used to provide useful additional information on rock material strength. Since Chalk and Portland Limestone data both conform to the same regression equa- tion (1) results for different materials can be accurately compared.
Using plots of yield strength at 60 MPa versus dynamic Young's modulus it is possible to derive an expression for compressive strength in terms of porosity:
0 10 20 30 40 50 60 70 80 90
Dynamic Young's Modulus IkN mm~'l
FIG. 11. Plot of material yield strength (MPa) against dynamic Young's modulus (kN mm-') at 60 MPa confining pressure for Portland Limestone.
where: oy = compressive strength
c = constant (confining pressure depen- dant)
a = constant = 4.335 (for Chalk and Port- land Limestone)
b = constant = 0.663 (for Chalk and Port- land Limestone)
$ =porosity.
This holds true for both Chalk and Portland Limestone and therefore not only confirms a general relationship between Young's modulus and compressive strength for carbonate sedi- ment~ , but also establishes Grindosonic as a technique capable of accurately determining dynamic Young's modulus of materials, as well as other parameters, such as seismic velocity, not discussed here.
The Grindosonic technique has a number of benefits including the comparative ease of sample preparation, test simplicity, result reproducibility and the advantage of being non-destructive and hence permitting sample retesting under different conditions. Therefore, not only do these tests establish important relationships between dy- namic Young's modulus, compressive strength,
Determination of Young's modulus 69
porosity and density, but they also suggest that the Grindosonic apparatus has wide application in the field of rock characterization, testing and monitoring. Data presented here have been restricted to two rock units. Work on other materials is in progress.
ACKNOWLEDGEMENTS: The author expresses his thanks to Dr M. E. Jones and Professor D.
Brunsden for encouragement with the field work and valuable discussions during the course of this work. The research was commenced while in receipt of a NERC research studentship and is being continued with funding from the Addison Wheeler Fellowship. The figures were prepared with dexterity by Roma Beaumont and Gordon Reynell in the Geography Department at King's College, London.
References
ARKELL, W. J. 1947. The Geology ofthe Country around Weymouth, Swanage, Corfe and Lulworth, p. 386. H M S O , London.
ATTEWELL, P. B. & FARMER, I. W. 1976. Principles of Engineering Geology, p. 1045. Chapman & Hall, London.
BROWN, E. T. 1981. Rock Characterisation, Testing and Monitoring, p. 21 1. Pergamon Press, Oxford.
CARTER, M. E. & MATTHEWS, A. P. 1977. The measurement of porosity of irregular vulgar rock samples using a modified liquid saturation tech- nique. Geotechnique, 27,435-7.
JONES, M. E., ALLISON, R. J. & GILLIGAN, J. 1983. On the relationships between geology and coastal
landforms in central southern England. Proc. Dorset nat. His?. archaeol. Soc. 105, 107-18.
MELVILLE, R. V. & FRESHNEY, E. C. 1982. British Regional Geology, the Hampshire Basin and Adjoin- ing Areas, p. 146. HMSO, London.
NEVILLE, A. M. 1981. Properties of Concrete, p. 779. Pitman, London.
PLINT, A. G. 1982. Eogene sedimentation and tectonics in the Hampshire Basin. J. geol. Soc. London, 139, 249-54.
SELBY, M. J. 1982. Hillslope Form and Process, p. 264. Oxford University Press, New York.
STONELEY, A. 1982. The structural development of the Wessex Basin. J. geol. Soc. London. 139,543-54.
R. J. ALLISON, Department of Geography, King's College London, Strand, London WC2R 2LS. Present address: Department of Geography, University of Durham, South Road, Durham DH1 3LE.