Embed Size (px)
Citation preview
NTRD Program Disclaimers
1. Disclaimer of Endorsement:
The posting herein of progress reports and final reports provided to TCEQ by its NTRD GrantAgreement recipients does not necessarily constitute or imply an endorsement, recommendation, orfavoring by TCEQ or the State of Texas. The views and opinions expressed in said reports do notnecessarily state or reflect those of TCEQ or the State of Texas, and shall not be used for advertisingor product endorsement purposes.
2. Disclaimer of Liability:
The posting herein of progress reports and final reports provided to TCEQ by its NTRD GrantAgreement recipients does not constitute by TCEQ or the State of Texas the making of anywarranty, express or implied, including the warranties of merchantability and fitness for a particularpurpose, and such entities do not assume any legal liability or responsibility for the accuracy,completeness, or usefulness of any information,apparatus, product, or process disclosed, or representthat its use would not infringe privately owned rights.

TESTING OF CDT BIODIESEL PLUS™ USING THE TCEQ PROCEDURE FOR CERTIFICATION OF EMISSION REDUCTIONS FOR LOW EMISSION
DIESEL FUELS
FINAL REPORT
SwRI Project No. 03-05586
Prepared for:
Clean Diesel Technologies, Inc. 300 Atlantic St.
Suite 702 Stamford, CT 06901-3522
Prepared by:
E. Robert Fanick Group Leader
May 2006
TESTING OF CDT BIODIESEL PLUS™ USING THE
TCEQ PROCEDURE FOR CERTIFICATION OF EMISSION REDUCTIONS FOR LOW EMISSION
DIESEL FUELS
FINAL REPORT
Prepared for
Clean Diesel Technologies, Inc. 300 Atlantic St.
Suite 702 Stamford, CT 06901-3522
May 2006
Prepared by: Approved: ________________________________ ________________________________ E. Robert Fanick, Jeff J. White, Group Leader Director of Development Reviewed by: ________________________________ Lawrence R. Smith, Manager Chemistry and Unregulated Emissions
DEPARTMENT OF ENGINE AND EMISSIONS RESEARCH ENGINE, EMISSIONS, AND VEHICLE RESEARCH DIVISION
This report shall not be reproduced, except in full, without the written approval of Southwest Research Institute®.
Results and discussion given in this report relate only to the test items described in this report.

Report SwRI Project 03-05586 ii
TABLE OF CONTENTS Page LIST OF FIGURES ..................................................................................................................... iii LIST OF TABLES ....................................................................................................................... iv 1.0 INTRODUCTION ...............................................................................................................1 2.0 EXPERIMENTAL SETUP ................................................................................................2 3.0 DESCRIPTION OF FUELS TESTED ..............................................................................4 4.0 TEST PLAN AND TEST PROCEDURES .......................................................................6 5.0 RESULTS.............................................................................................................................9 6.0 SUMMARY........................................................................................................................13 Appendices No. of Pages A Power Validation and Torque Map Data for a 1991 Detroit Diesel Series 60 Running with Reference Fuel and with CDT Biodiesel PLUS™ from Clean Diesel Technologies, Inc .........................................................................................29 B Transient Regulated Emissions Data for a 1991 Detroit Diesel Series 60 Running with Reference Fuel and with CDT Biodiesel PLUS™ from Clean Diesel Technologies, Inc. Fuel ................................................................................18
Report SwRI Project 03-05586 iii
LIST OF FIGURES Figure Page 1 Sampling System Used for Transient Emission Measurements...................................3 2 Graphic Representation of Torque and Speed Commands for the Transient Cycle for Heavy-Duty Engines ........................................................................................8 3 Engine Performance Using Fuels R and C...................................................................10
Report SwRI Project 03-05586 iv
LIST OF TABLES Table Page 1 Engine Specifications and Features..................................................................................2 2 Fuel Analysis Results for Fuel R and Blend Stock for Fuel C.......................................4 3 Fuel Analysis Results for B100 Additive..........................................................................5 4 Fuel Analysis of EM-5901-F for Platinum and Cerium .................................................5 5 Procedure for Accumulating Regulated Emissions Data Using Alternative 4 of the TCEQ Protocol ............................................................................................................7 6 Actual Pattern of Runs Using Alternative 4 ...................................................................7 7 Summary of Transient Torque Maps Obtained with the 1991 Detroit Diesel Series 60 Heavy-Duty Diesel Test Engine ........................................................................9 8 Summary of Regulated Emissions .................................................................................11 9 Comparison of Emissions Using TCEQ Statistical Criteria .......................................12
Report SwRI Project 03-05586 1 of 13
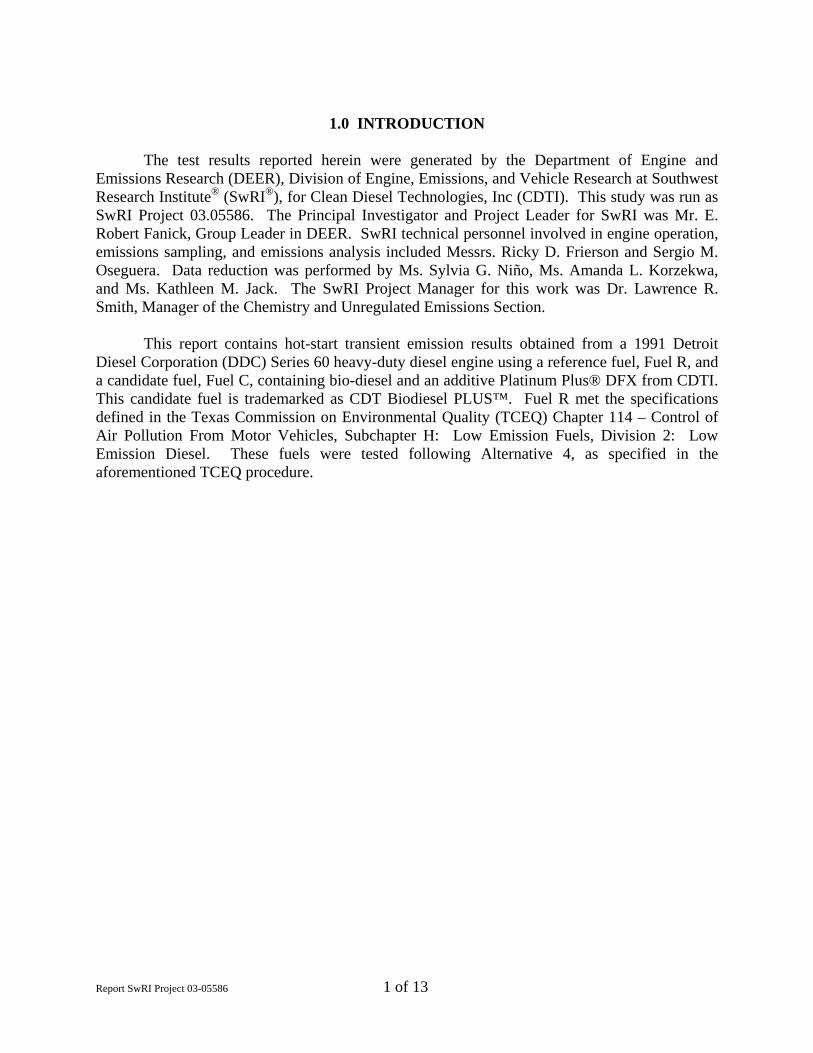
1.0 INTRODUCTION The test results reported herein were generated by the Department of Engine and Emissions Research (DEER), Division of Engine, Emissions, and Vehicle Research at Southwest Research Institute® (SwRI®), for Clean Diesel Technologies, Inc (CDTI). This study was run as SwRI Project 03.05586. The Principal Investigator and Project Leader for SwRI was Mr. E. Robert Fanick, Group Leader in DEER. SwRI technical personnel involved in engine operation, emissions sampling, and emissions analysis included Messrs. Ricky D. Frierson and Sergio M. Oseguera. Data reduction was performed by Ms. Sylvia G. Niño, Ms. Amanda L. Korzekwa, and Ms. Kathleen M. Jack. The SwRI Project Manager for this work was Dr. Lawrence R. Smith, Manager of the Chemistry and Unregulated Emissions Section. This report contains hot-start transient emission results obtained from a 1991 Detroit Diesel Corporation (DDC) Series 60 heavy-duty diesel engine using a reference fuel, Fuel R, and a candidate fuel, Fuel C, containing bio-diesel and an additive Platinum Plus® DFX from CDTI. This candidate fuel is trademarked as CDT Biodiesel PLUS™. Fuel R met the specifications defined in the Texas Commission on Environmental Quality (TCEQ) Chapter 114 – Control of Air Pollution From Motor Vehicles, Subchapter H: Low Emission Fuels, Division 2: Low Emission Diesel. These fuels were tested following Alternative 4, as specified in the aforementioned TCEQ procedure.
Report SwRI Project 03-05586 2 of 13
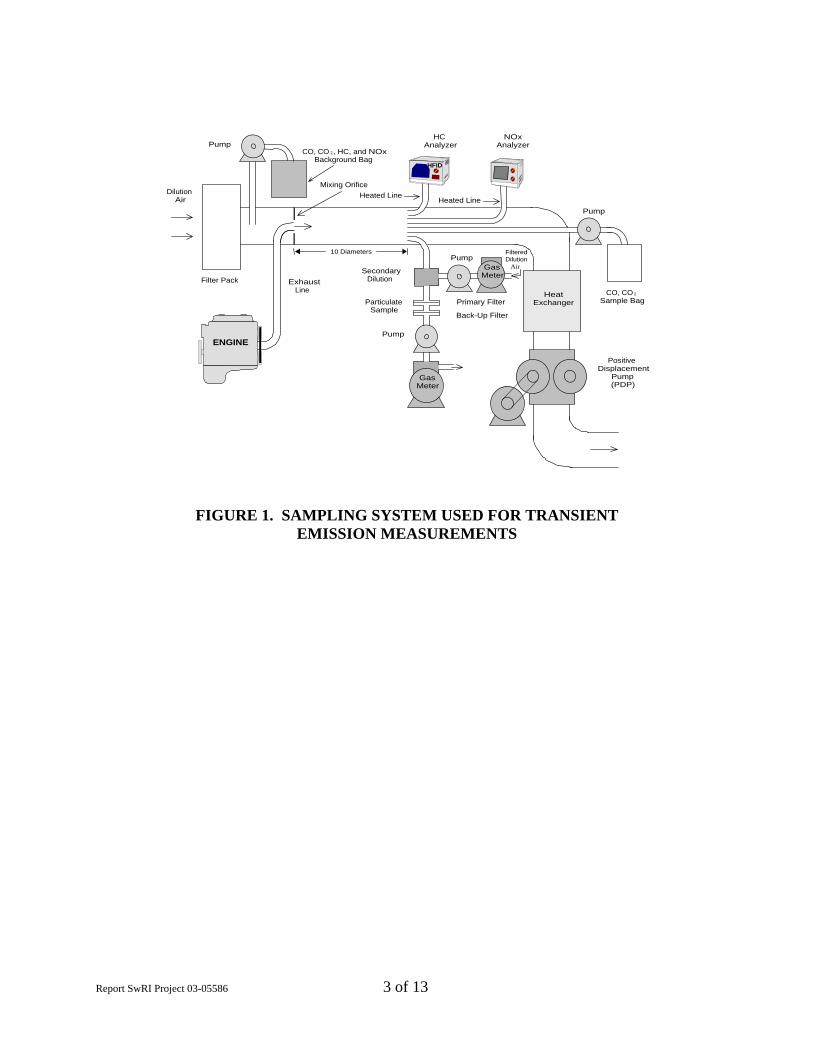
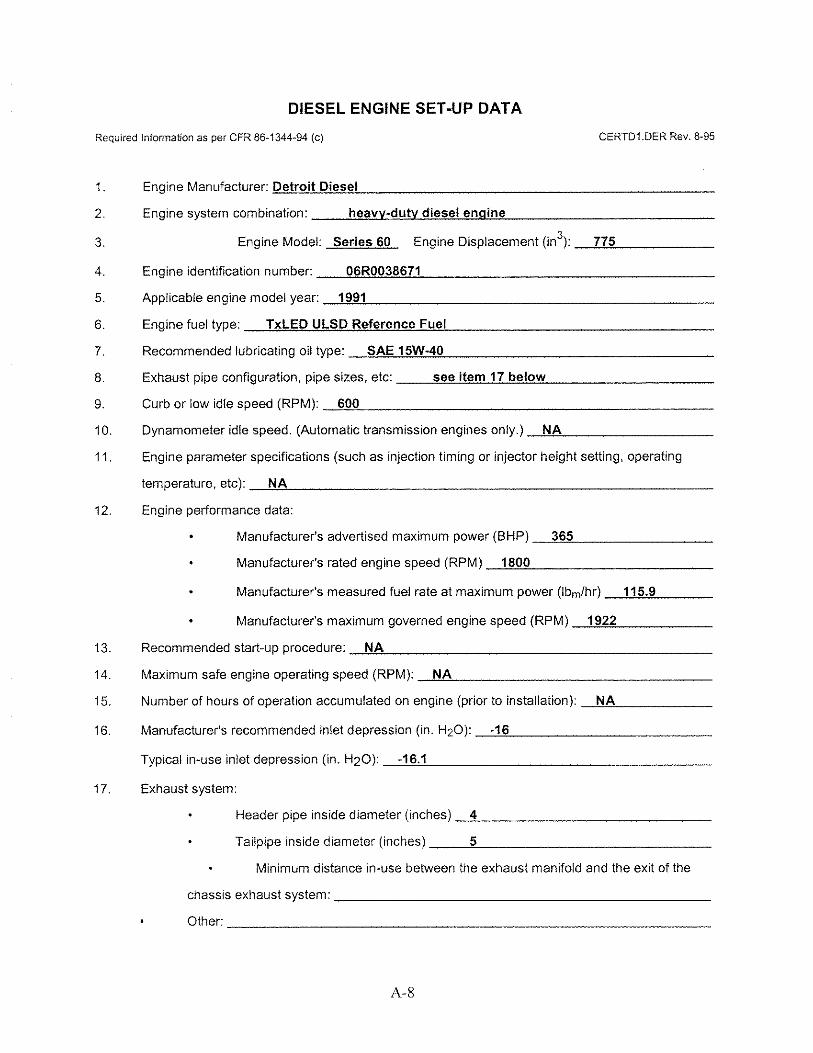
2.0 EXPERIMENTAL SETUP For testing, a 1991 DDC Series 60 (Serial No. 06R0038671) heavy-duty diesel engine was mounted in a transient-capable test cell. This engine had an inline, six-cylinder configuration rated for 365 hp at 1800 rpm. It was turbocharged and used a laboratory water-to-air heat exchanger for a charge air intercooler. Table 1 lists the engine specifications and features. The exhaust was routed to a full flow constant volume sampler (CVS) that utilizes a positive displacement pump (PDP), as illustrated in Figure 1. Total flow in the tunnel was maintained at a nominal flow rate of about 2000 SCFM. Sample zone probes for total particulate (PM), heated oxides of nitrogen (NOx), heated hydrocarbons (HC), carbon monoxide (CO), and carbon dioxide (CO2) measurements were connected to the main tunnel. Probes for background gas measurement were connected downstream of the dilution air filter pack, but upstream of the mixing section. The dilution system was equipped with pressure and temperature sensors at various locations in order to obtain all necessary information required by the U.S. Code of Federal Regulation (CFR 40, Part 86, Subpart N).
TABLE 1. ENGINE SPECIFICATIONS AND FEATURES
Engine Parameter Comment
Engine Serial Number 06R0038671 Make Detroit Diesel Model Series 60, 6067GU60
Engine Displacement and Configuration 12.7 L, I-6 Emission Family MDD12.7FZAK
Rated Power 365 bhp at 1800 rpm Electronic Control Module DDEC-II
Aspiration Turbocharged
Report SwRI Project 03-05586 3 of 13
FIGURE 1. SAMPLING SYSTEM USED FOR TRANSIENT EMISSION MEASUREMENTS
HCAnalyzer
NOxAnalyzer
PositiveDisplacement
Pump(PDP)
CO, CO 2, HC, and NOxBackground Bag
Filter Pack
ENGINE
Mixing Orifice
ExhaustLine
Pump
HeatExchangerPrimary Filter
HFID
Heated LineHeated Line
CO, CO 2
Sample Bag
Back-Up Filter
GasMeter
Pump
DilutionAir
10 Diameters
GasMeter
Pump
Pump
ParticulateSample
SecondaryDilution
FilteredDilution Air
Report SwRI Project 03-05586 4 of 13
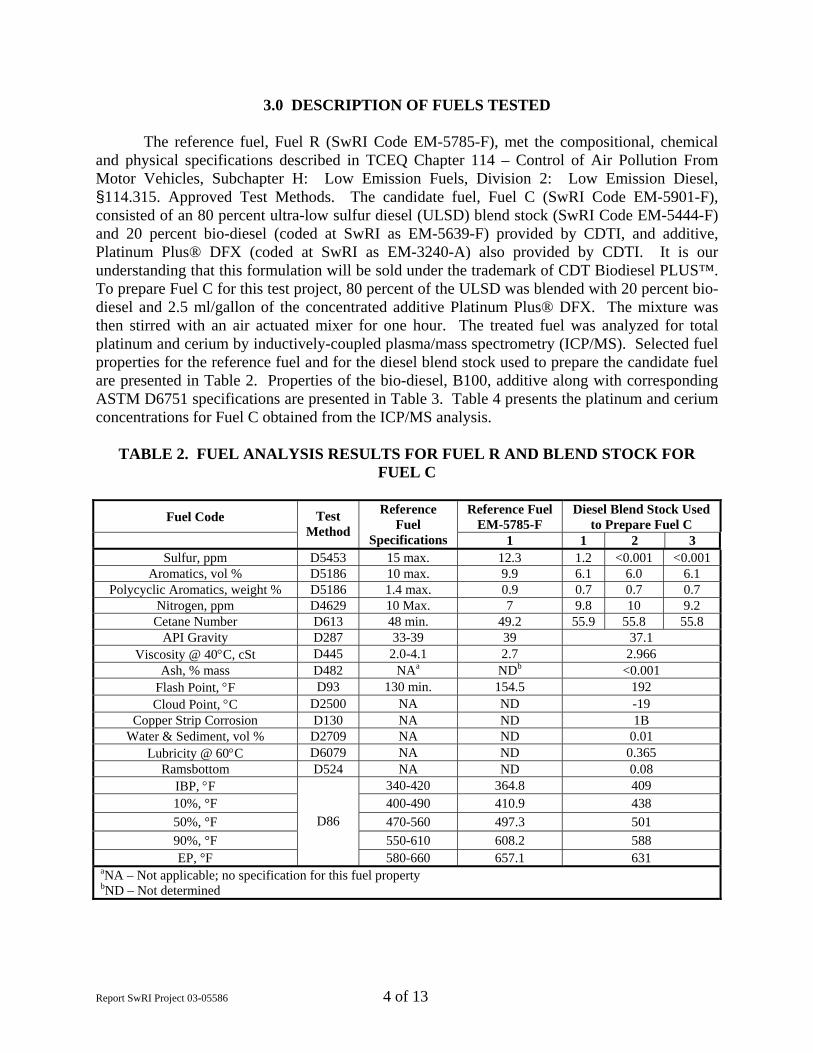
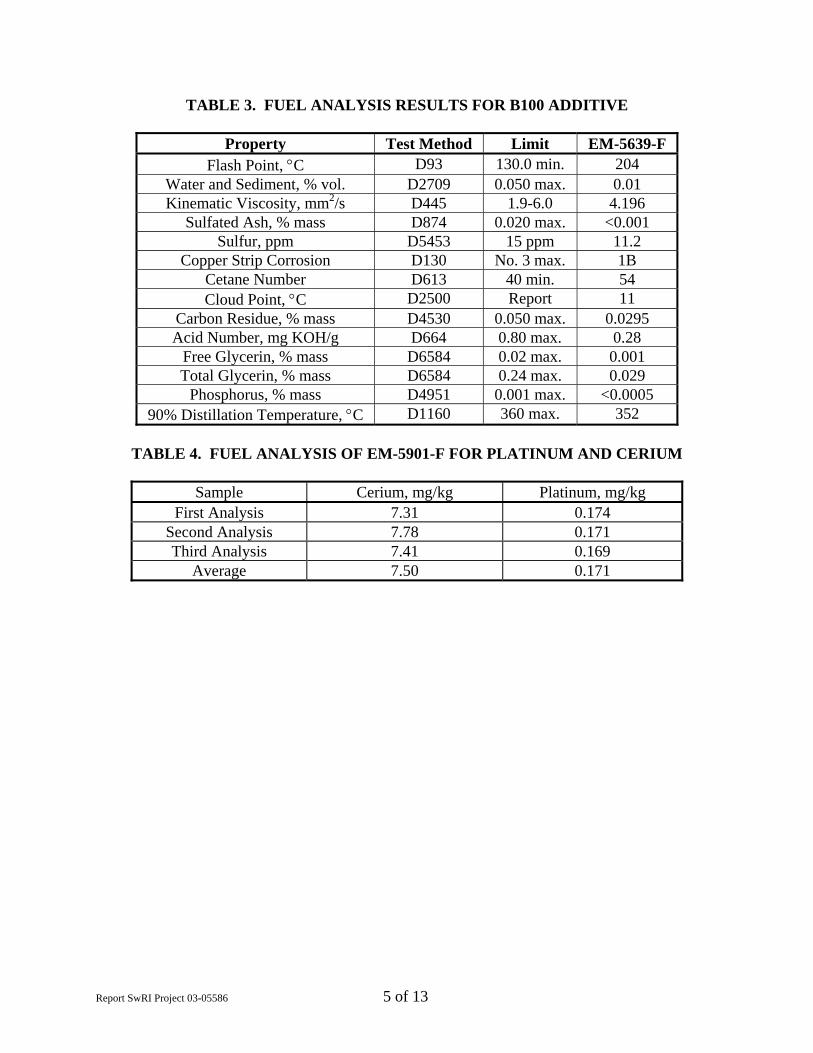
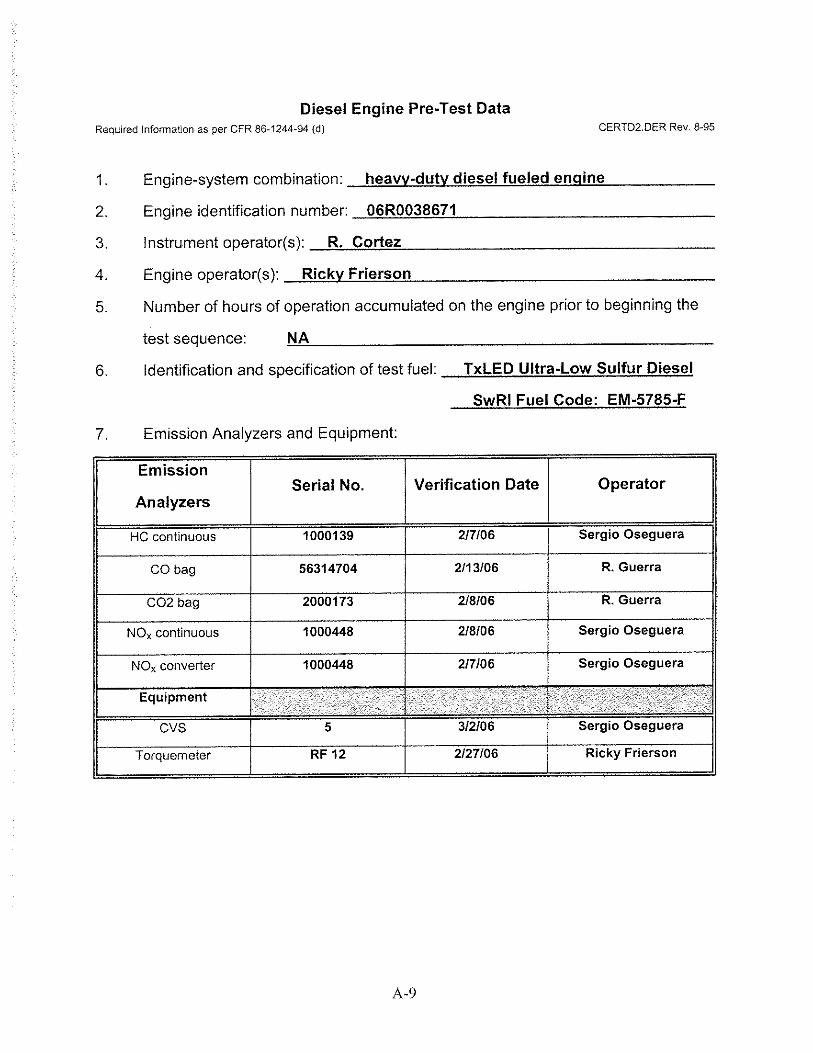
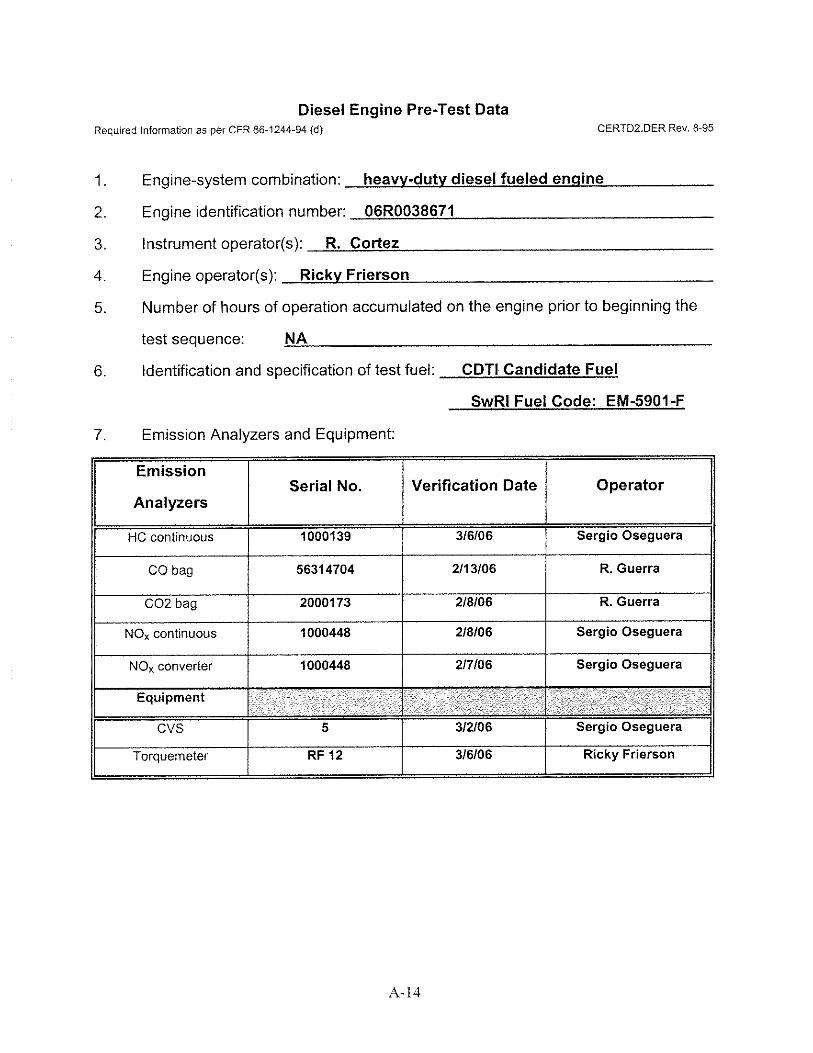
3.0 DESCRIPTION OF FUELS TESTED The reference fuel, Fuel R (SwRI Code EM-5785-F), met the compositional, chemical and physical specifications described in TCEQ Chapter 114 – Control of Air Pollution From Motor Vehicles, Subchapter H: Low Emission Fuels, Division 2: Low Emission Diesel, §114.315. Approved Test Methods. The candidate fuel, Fuel C (SwRI Code EM-5901-F), consisted of an 80 percent ultra-low sulfur diesel (ULSD) blend stock (SwRI Code EM-5444-F) and 20 percent bio-diesel (coded at SwRI as EM-5639-F) provided by CDTI, and additive, Platinum Plus® DFX (coded at SwRI as EM-3240-A) also provided by CDTI. It is our understanding that this formulation will be sold under the trademark of CDT Biodiesel PLUS™. To prepare Fuel C for this test project, 80 percent of the ULSD was blended with 20 percent bio-diesel and 2.5 ml/gallon of the concentrated additive Platinum Plus® DFX. The mixture was then stirred with an air actuated mixer for one hour. The treated fuel was analyzed for total platinum and cerium by inductively-coupled plasma/mass spectrometry (ICP/MS). Selected fuel properties for the reference fuel and for the diesel blend stock used to prepare the candidate fuel are presented in Table 2. Properties of the bio-diesel, B100, additive along with corresponding ASTM D6751 specifications are presented in Table 3. Table 4 presents the platinum and cerium concentrations for Fuel C obtained from the ICP/MS analysis.
TABLE 2. FUEL ANALYSIS RESULTS FOR FUEL R AND BLEND STOCK FOR FUEL C
Fuel Code Reference Fuel
EM-5785-F Diesel Blend Stock Used
to Prepare Fuel C
Test Method
Reference Fuel
Specifications 1 1 2 3 Sulfur, ppm D5453 15 max. 12.3 1.2 <0.001 <0.001
Aromatics, vol % D5186 10 max. 9.9 6.1 6.0 6.1 Polycyclic Aromatics, weight % D5186 1.4 max. 0.9 0.7 0.7 0.7
Nitrogen, ppm D4629 10 Max. 7 9.8 10 9.2 Cetane Number D613 48 min. 49.2 55.9 55.8 55.8
API Gravity D287 33-39 39 37.1 Viscosity @ 40°C, cSt D445 2.0-4.1 2.7 2.966
Ash, % mass D482 NAa NDb <0.001 Flash Point, °F D93 130 min. 154.5 192 Cloud Point, °C D2500 NA ND -19
Copper Strip Corrosion D130 NA ND 1B Water & Sediment, vol % D2709 NA ND 0.01
Lubricity @ 60°C D6079 NA ND 0.365 Ramsbottom D524 NA ND 0.08
IBP, °F 340-420 364.8 409 10%, °F 400-490 410.9 438 50%, °F 470-560 497.3 501 90%, °F 550-610 608.2 588 EP, °F
D86
580-660 657.1 631 aNA – Not applicable; no specification for this fuel property bND – Not determined
Report SwRI Project 03-05586 5 of 13
TABLE 3. FUEL ANALYSIS RESULTS FOR B100 ADDITIVE
Property Test Method Limit EM-5639-F Flash Point, °C D93 130.0 min. 204
Water and Sediment, % vol. D2709 0.050 max. 0.01 Kinematic Viscosity, mm2/s D445 1.9-6.0 4.196
Sulfated Ash, % mass D874 0.020 max. <0.001 Sulfur, ppm D5453 15 ppm 11.2
Copper Strip Corrosion D130 No. 3 max. 1B Cetane Number D613 40 min. 54 Cloud Point, °C D2500 Report 11
Carbon Residue, % mass D4530 0.050 max. 0.0295 Acid Number, mg KOH/g D664 0.80 max. 0.28
Free Glycerin, % mass D6584 0.02 max. 0.001 Total Glycerin, % mass D6584 0.24 max. 0.029
Phosphorus, % mass D4951 0.001 max. <0.0005 90% Distillation Temperature, °C D1160 360 max. 352
TABLE 4. FUEL ANALYSIS OF EM-5901-F FOR PLATINUM AND CERIUM
Sample Cerium, mg/kg Platinum, mg/kg
First Analysis 7.31 0.174 Second Analysis 7.78 0.171 Third Analysis 7.41 0.169
Average 7.50 0.171
Report SwRI Project 03-05586 6 of 13
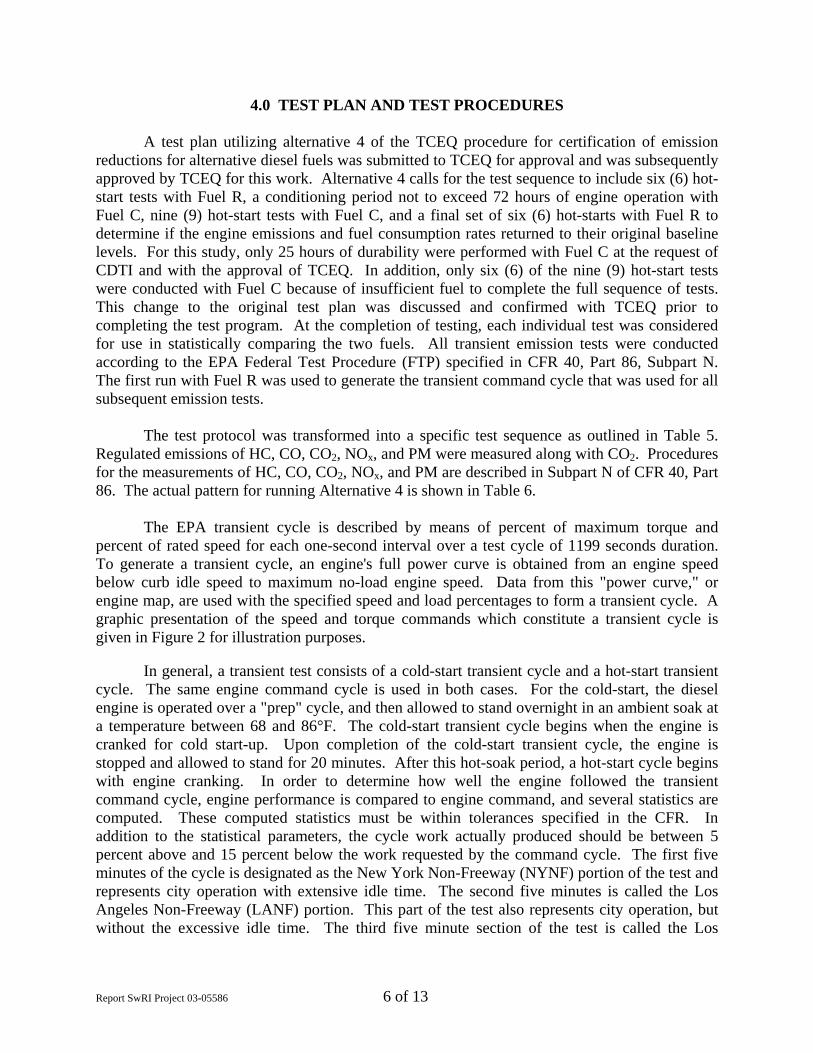
4.0 TEST PLAN AND TEST PROCEDURES A test plan utilizing alternative 4 of the TCEQ procedure for certification of emission reductions for alternative diesel fuels was submitted to TCEQ for approval and was subsequently approved by TCEQ for this work. Alternative 4 calls for the test sequence to include six (6) hot-start tests with Fuel R, a conditioning period not to exceed 72 hours of engine operation with Fuel C, nine (9) hot-start tests with Fuel C, and a final set of six (6) hot-starts with Fuel R to determine if the engine emissions and fuel consumption rates returned to their original baseline levels. For this study, only 25 hours of durability were performed with Fuel C at the request of CDTI and with the approval of TCEQ. In addition, only six (6) of the nine (9) hot-start tests were conducted with Fuel C because of insufficient fuel to complete the full sequence of tests. This change to the original test plan was discussed and confirmed with TCEQ prior to completing the test program. At the completion of testing, each individual test was considered for use in statistically comparing the two fuels. All transient emission tests were conducted according to the EPA Federal Test Procedure (FTP) specified in CFR 40, Part 86, Subpart N. The first run with Fuel R was used to generate the transient command cycle that was used for all subsequent emission tests. The test protocol was transformed into a specific test sequence as outlined in Table 5. Regulated emissions of HC, CO, CO2, NOx, and PM were measured along with CO2. Procedures for the measurements of HC, CO, CO2, NOx, and PM are described in Subpart N of CFR 40, Part 86. The actual pattern for running Alternative 4 is shown in Table 6.
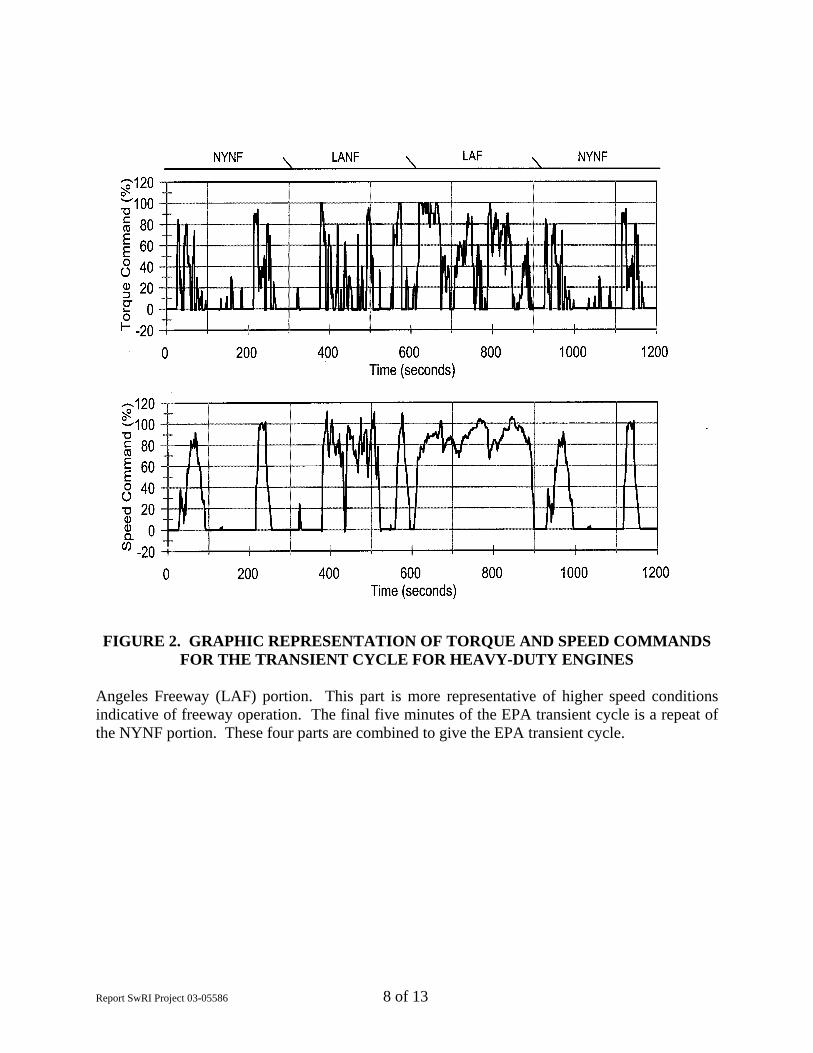
The EPA transient cycle is described by means of percent of maximum torque and percent of rated speed for each one-second interval over a test cycle of 1199 seconds duration. To generate a transient cycle, an engine's full power curve is obtained from an engine speed below curb idle speed to maximum no-load engine speed. Data from this "power curve," or engine map, are used with the specified speed and load percentages to form a transient cycle. A graphic presentation of the speed and torque commands which constitute a transient cycle is given in Figure 2 for illustration purposes. In general, a transient test consists of a cold-start transient cycle and a hot-start transient cycle. The same engine command cycle is used in both cases. For the cold-start, the diesel engine is operated over a "prep" cycle, and then allowed to stand overnight in an ambient soak at a temperature between 68 and 86°F. The cold-start transient cycle begins when the engine is cranked for cold start-up. Upon completion of the cold-start transient cycle, the engine is stopped and allowed to stand for 20 minutes. After this hot-soak period, a hot-start cycle begins with engine cranking. In order to determine how well the engine followed the transient command cycle, engine performance is compared to engine command, and several statistics are computed. These computed statistics must be within tolerances specified in the CFR. In addition to the statistical parameters, the cycle work actually produced should be between 5 percent above and 15 percent below the work requested by the command cycle. The first five minutes of the cycle is designated as the New York Non-Freeway (NYNF) portion of the test and represents city operation with extensive idle time. The second five minutes is called the Los Angeles Non-Freeway (LANF) portion. This part of the test also represents city operation, but without the excessive idle time. The third five minute section of the test is called the Los
Report SwRI Project 03-05586 7 of 13
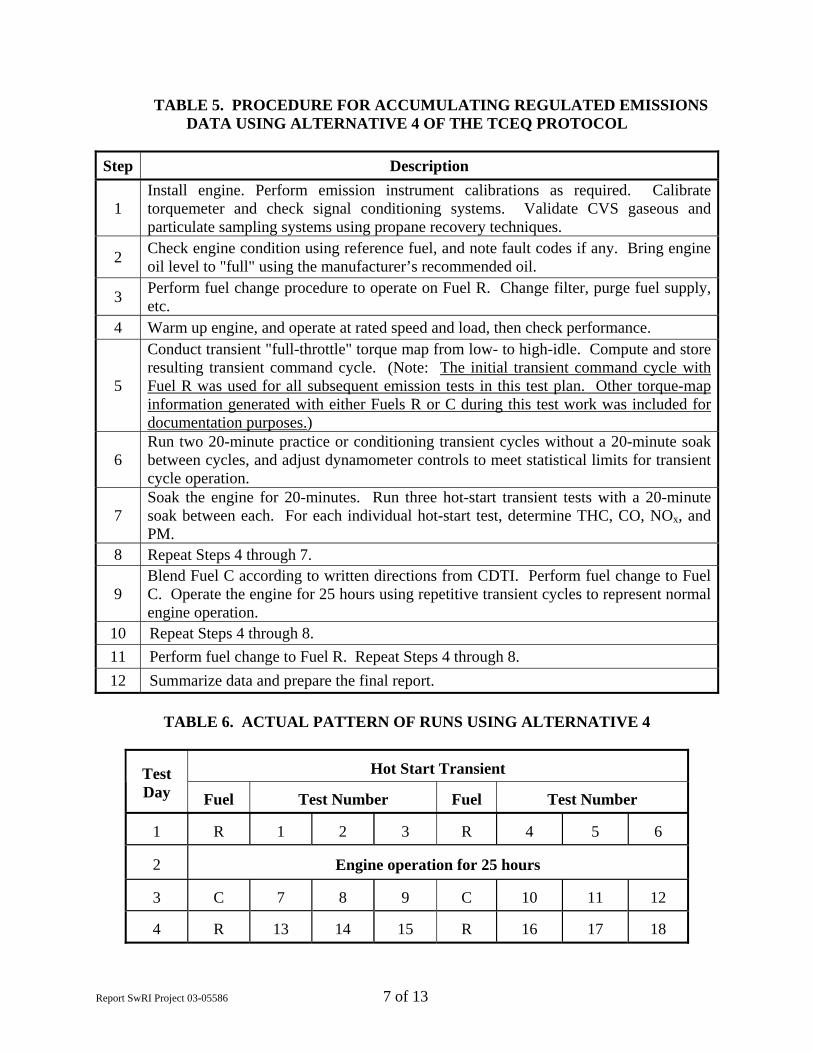
TABLE 5. PROCEDURE FOR ACCUMULATING REGULATED EMISSIONS DATA USING ALTERNATIVE 4 OF THE TCEQ PROTOCOL
Step Description
1 Install engine. Perform emission instrument calibrations as required. Calibrate torquemeter and check signal conditioning systems. Validate CVS gaseous and particulate sampling systems using propane recovery techniques.
2 Check engine condition using reference fuel, and note fault codes if any. Bring engine oil level to "full" using the manufacturer’s recommended oil.
3 Perform fuel change procedure to operate on Fuel R. Change filter, purge fuel supply, etc.
4 Warm up engine, and operate at rated speed and load, then check performance.
5
Conduct transient "full-throttle" torque map from low- to high-idle. Compute and store resulting transient command cycle. (Note: The initial transient command cycle with Fuel R was used for all subsequent emission tests in this test plan. Other torque-map information generated with either Fuels R or C during this test work was included for documentation purposes.)
6 Run two 20-minute practice or conditioning transient cycles without a 20-minute soak between cycles, and adjust dynamometer controls to meet statistical limits for transient cycle operation.
7 Soak the engine for 20-minutes. Run three hot-start transient tests with a 20-minute soak between each. For each individual hot-start test, determine THC, CO, NOx, and PM.
8 Repeat Steps 4 through 7.
9 Blend Fuel C according to written directions from CDTI. Perform fuel change to Fuel C. Operate the engine for 25 hours using repetitive transient cycles to represent normal engine operation.
10 Repeat Steps 4 through 8. 11 Perform fuel change to Fuel R. Repeat Steps 4 through 8. 12 Summarize data and prepare the final report.
TABLE 6. ACTUAL PATTERN OF RUNS USING ALTERNATIVE 4
Hot Start Transient
Test Day
Fuel
Test Number
Fuel
Test Number 1
R
1
2
3
R
4
5
6
2
Engine operation for 25 hours
3
C
7
8
9
C
10
11
12
4
R
13
14
15
R
16
17
18
Report SwRI Project 03-05586 8 of 13
FIGURE 2. GRAPHIC REPRESENTATION OF TORQUE AND SPEED COMMANDS
FOR THE TRANSIENT CYCLE FOR HEAVY-DUTY ENGINES Angeles Freeway (LAF) portion. This part is more representative of higher speed conditions indicative of freeway operation. The final five minutes of the EPA transient cycle is a repeat of the NYNF portion. These four parts are combined to give the EPA transient cycle.
Report SwRI Project 03-05586 9 of 13
5.0 RESULTS
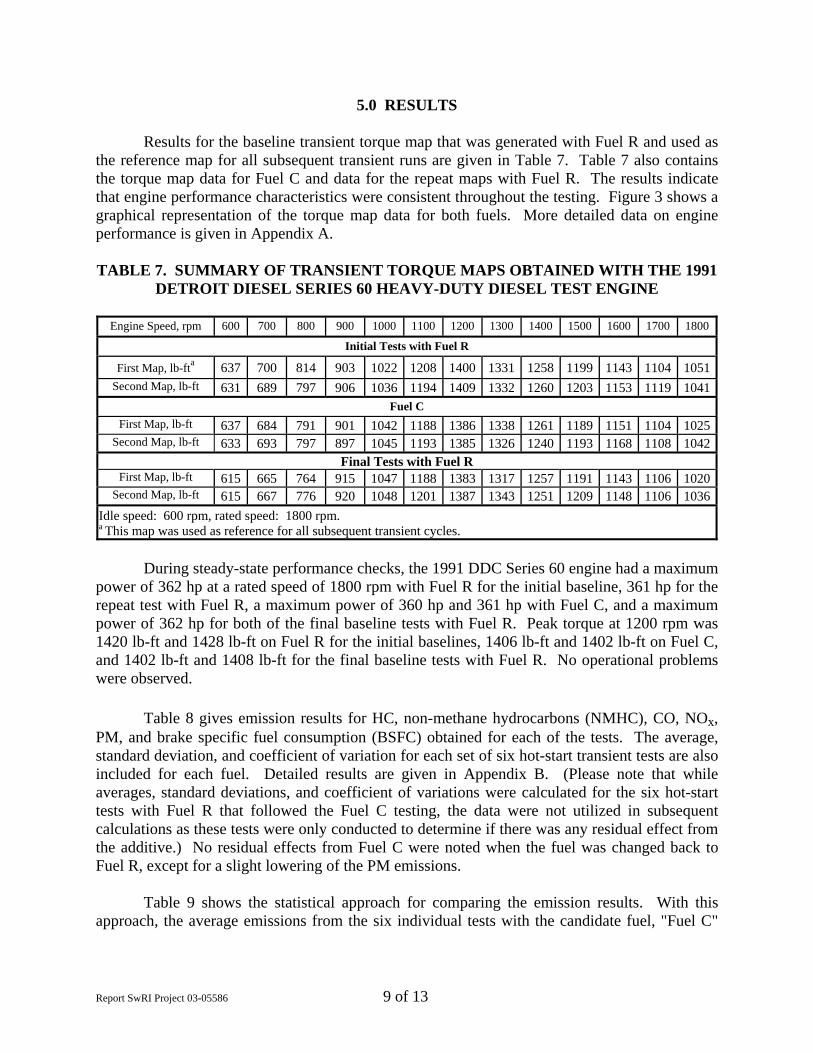
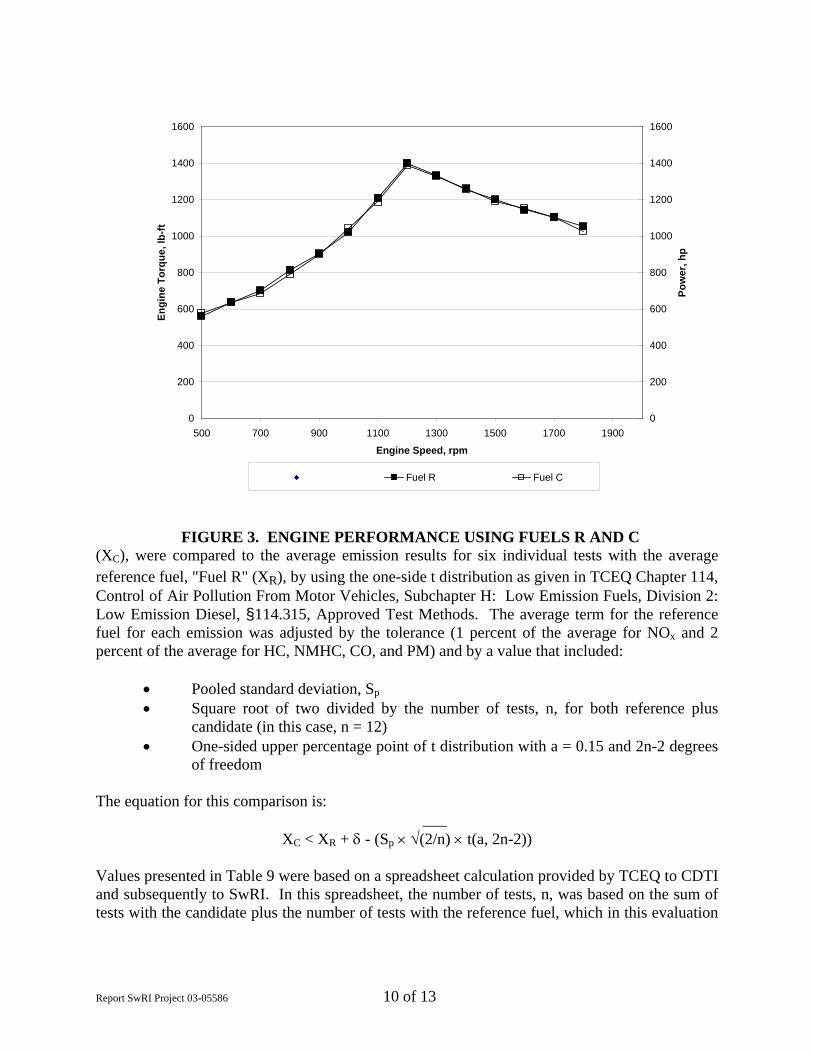
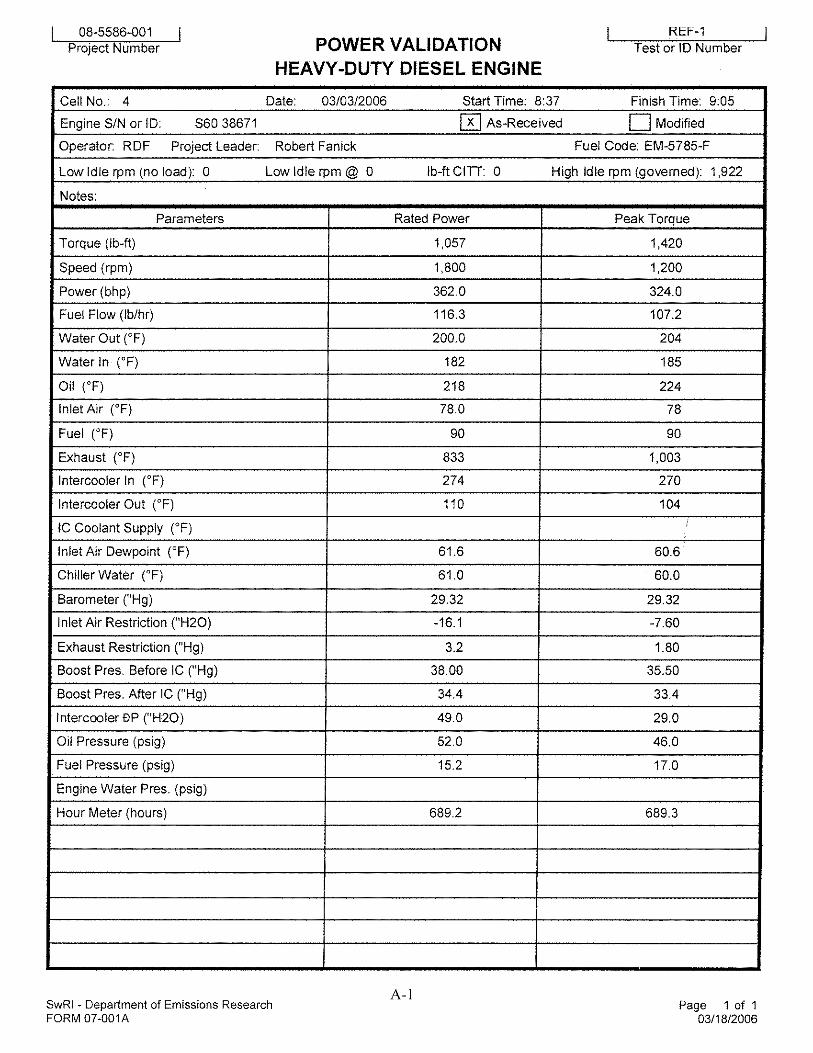
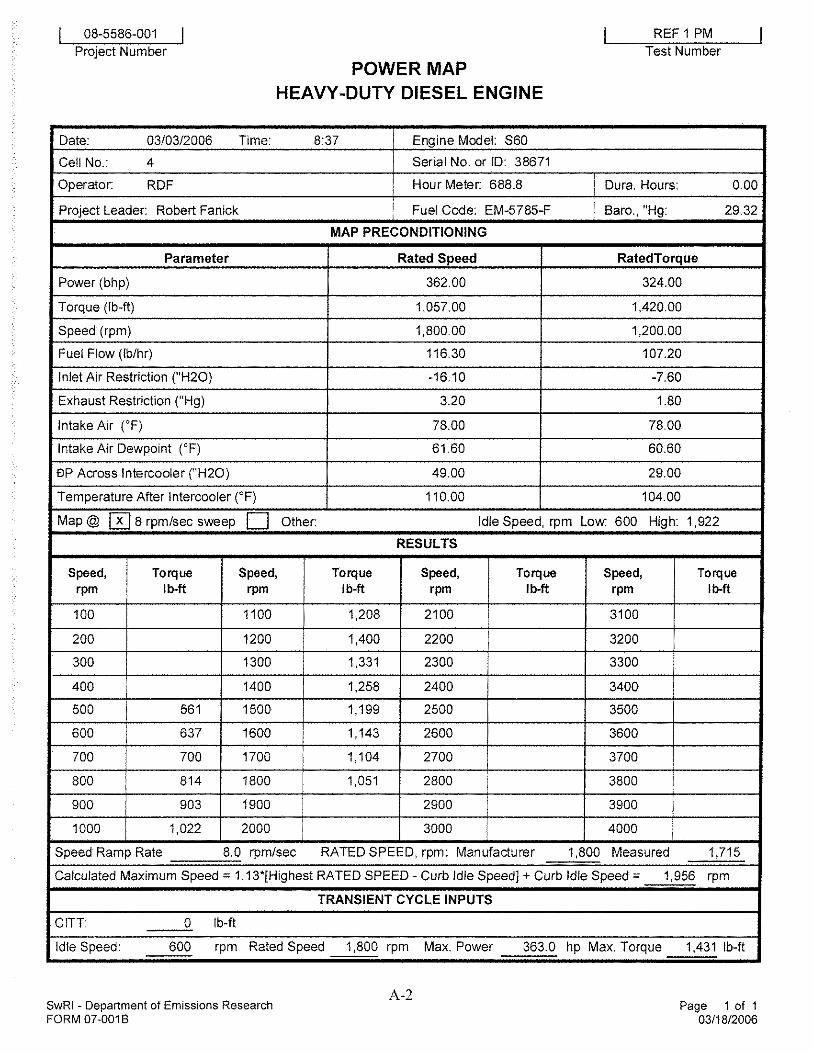
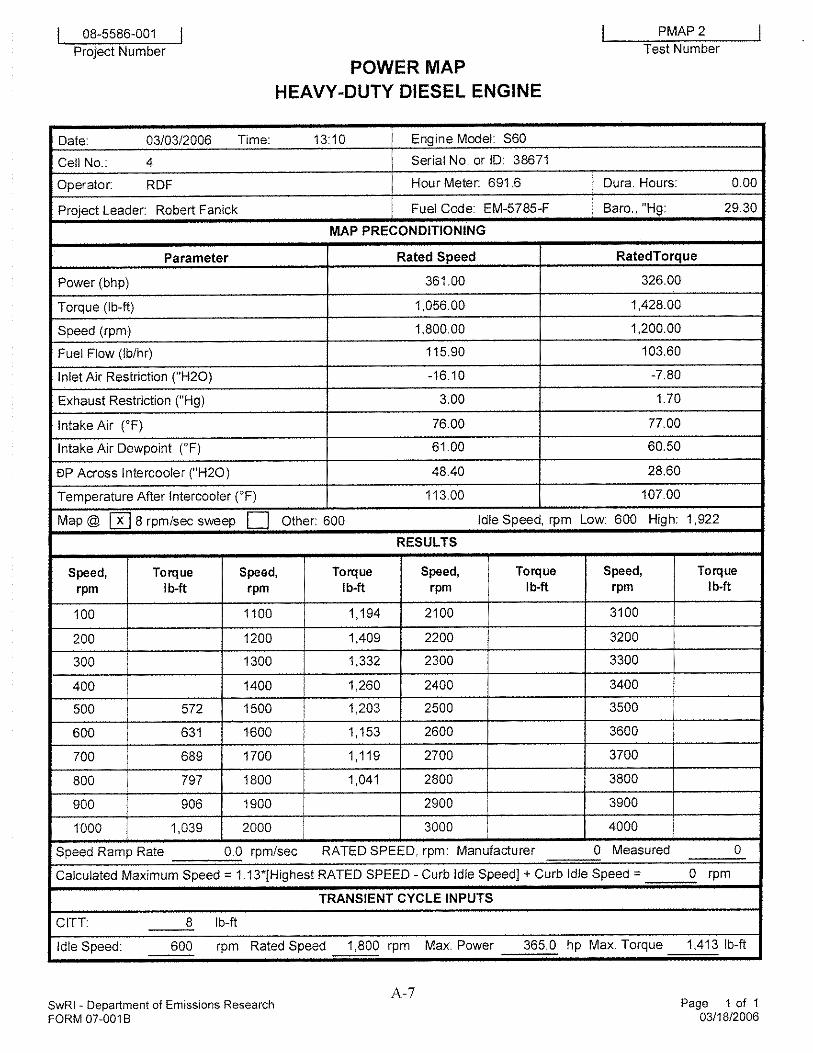
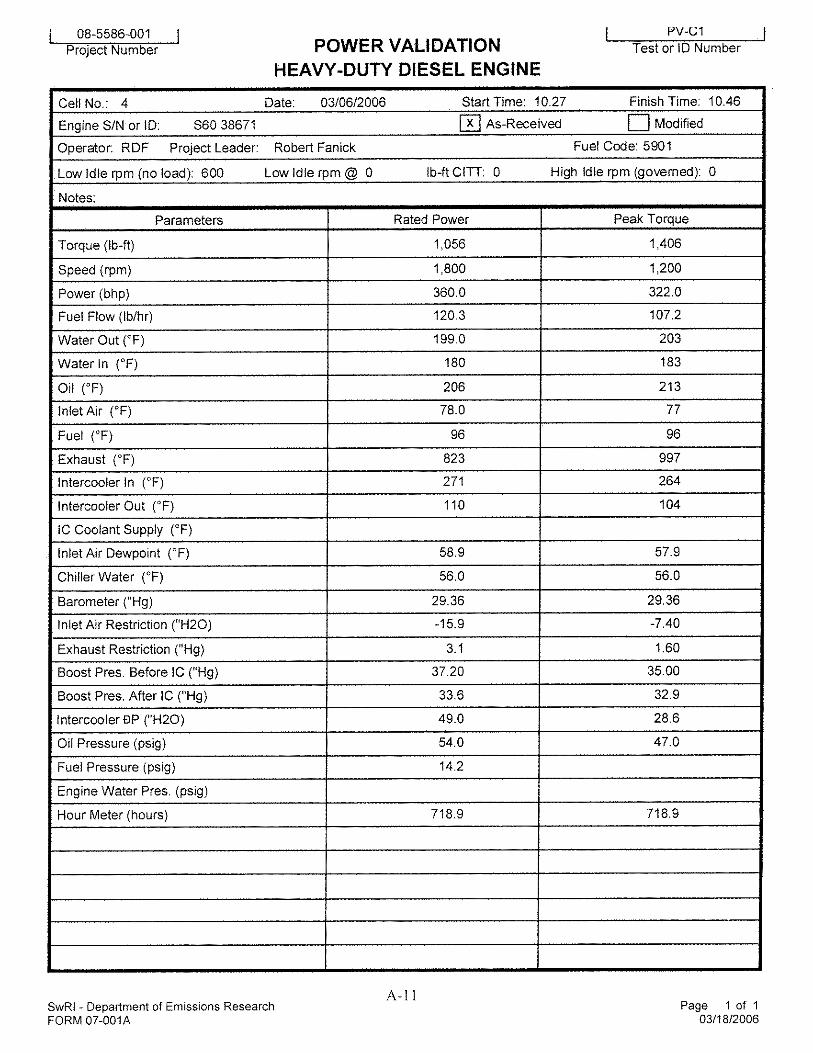
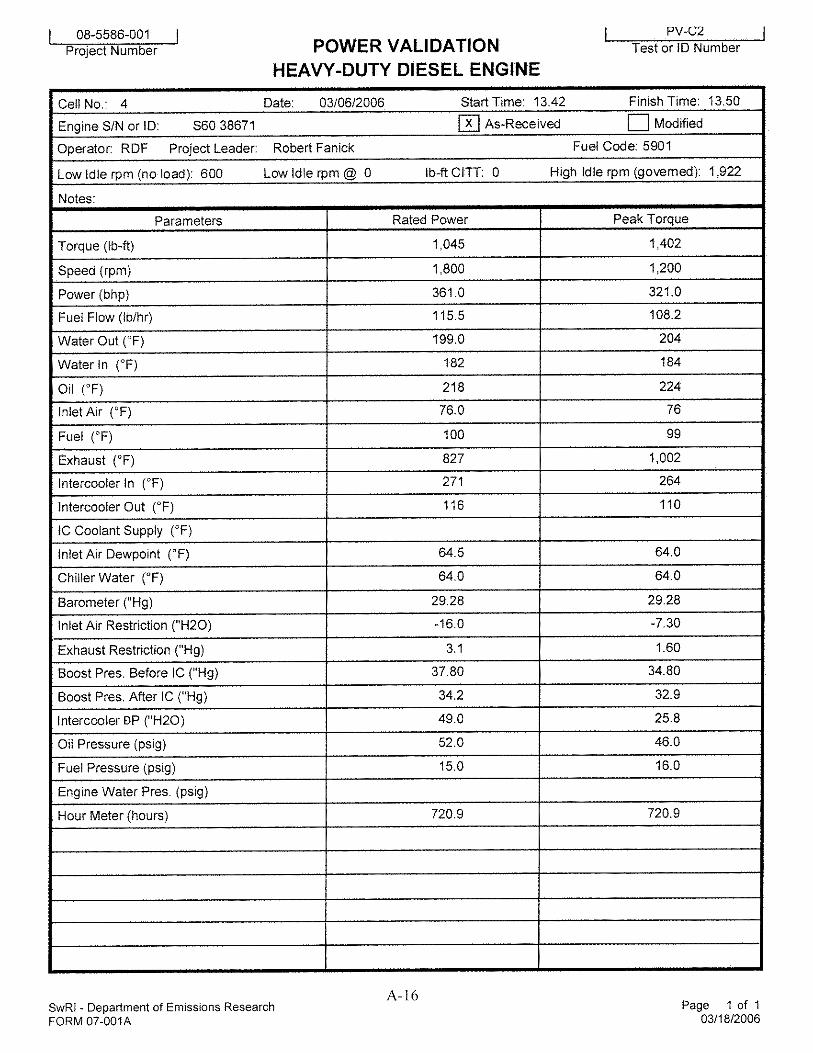
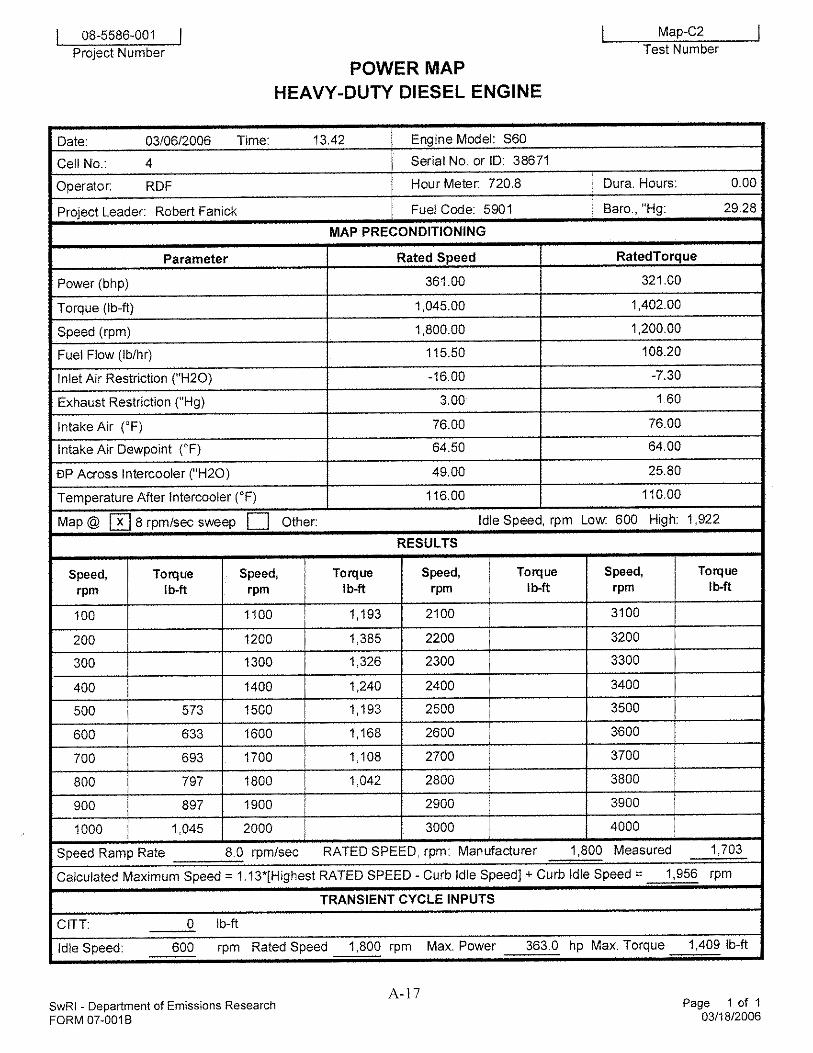
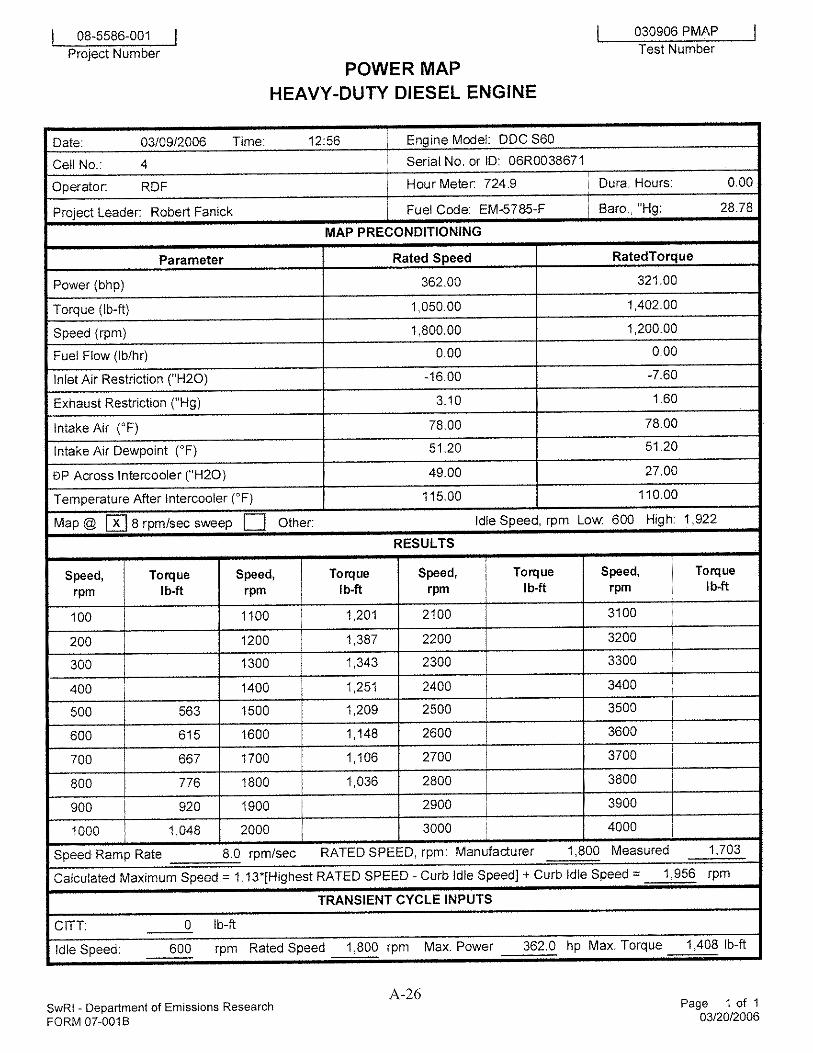
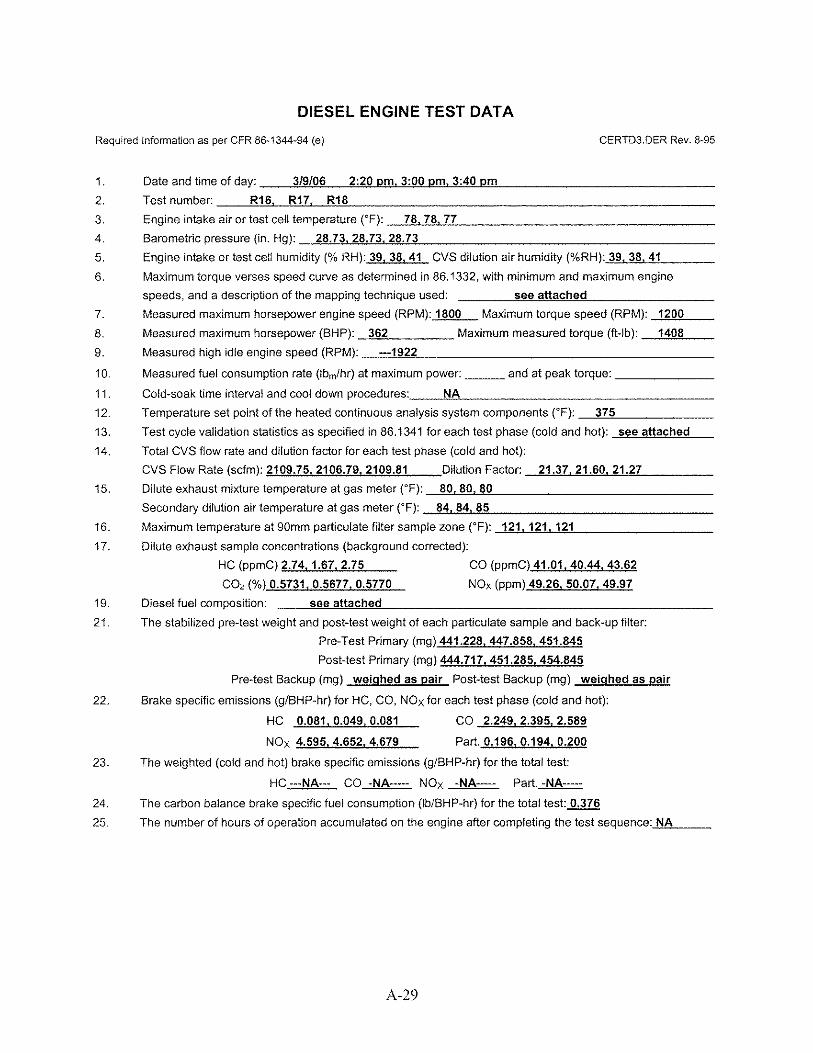
Results for the baseline transient torque map that was generated with Fuel R and used as the reference map for all subsequent transient runs are given in Table 7. Table 7 also contains the torque map data for Fuel C and data for the repeat maps with Fuel R. The results indicate that engine performance characteristics were consistent throughout the testing. Figure 3 shows a graphical representation of the torque map data for both fuels. More detailed data on engine performance is given in Appendix A. TABLE 7. SUMMARY OF TRANSIENT TORQUE MAPS OBTAINED WITH THE 1991
DETROIT DIESEL SERIES 60 HEAVY-DUTY DIESEL TEST ENGINE
Engine Speed, rpm 600 700 800 900 1000 1100 1200 1300 1400 1500 1600 1700 1800
Initial Tests with Fuel R
First Map, lb-fta 637 700 814 903 1022 1208 1400 1331 1258 1199 1143 1104 1051Second Map, lb-ft 631 689 797 906 1036 1194 1409 1332 1260 1203 1153 1119 1041
Fuel C First Map, lb-ft 637 684 791 901 1042 1188 1386 1338 1261 1189 1151 1104 1025
Second Map, lb-ft 633 693 797 897 1045 1193 1385 1326 1240 1193 1168 1108 1042Final Tests with Fuel R
First Map, lb-ft 615 665 764 915 1047 1188 1383 1317 1257 1191 1143 1106 1020Second Map, lb-ft 615 667 776 920 1048 1201 1387 1343 1251 1209 1148 1106 1036
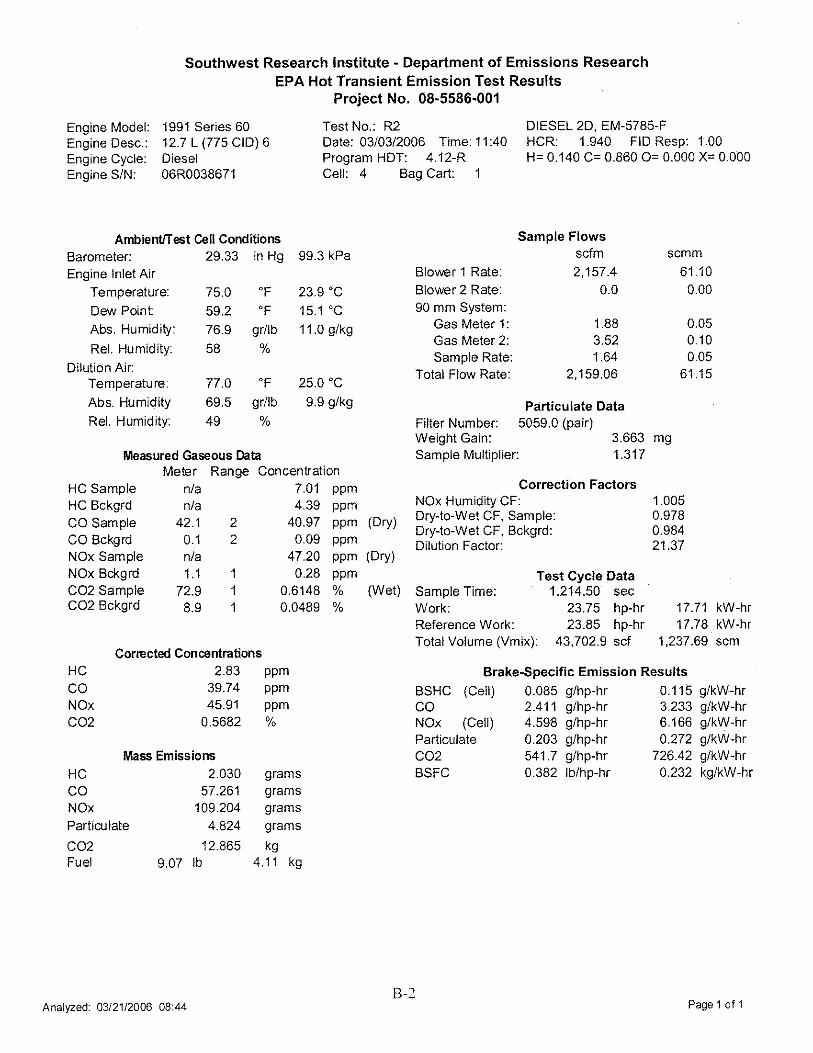
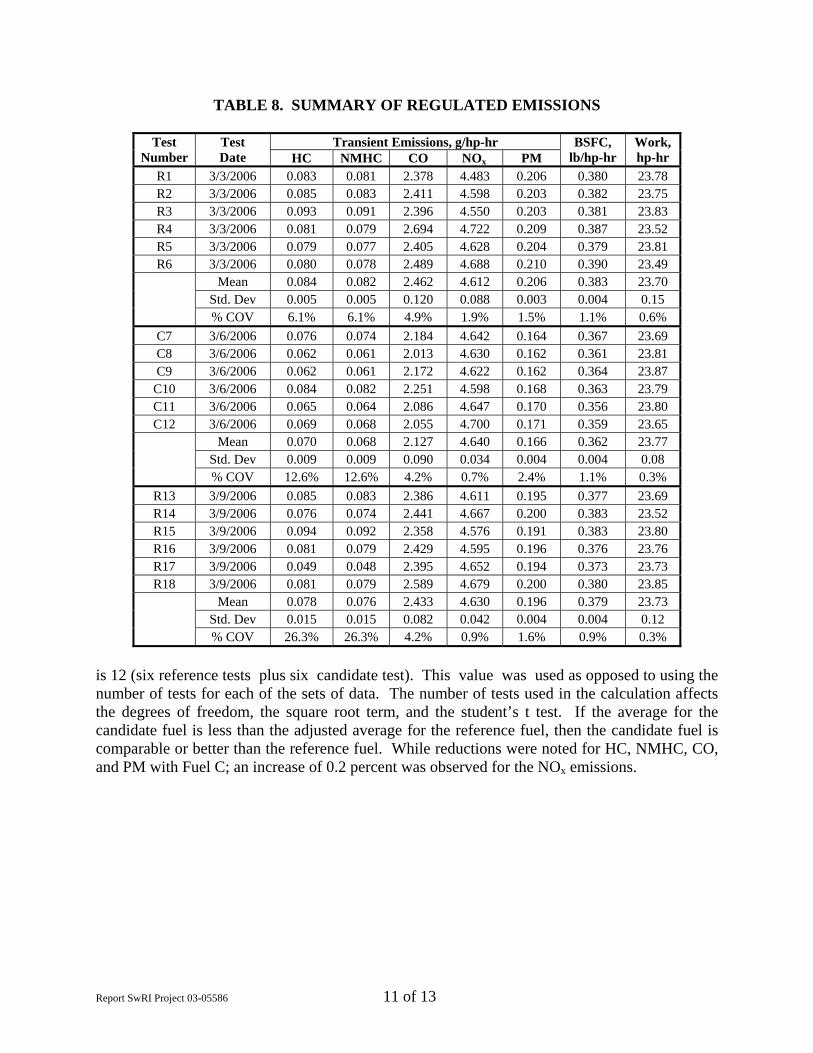
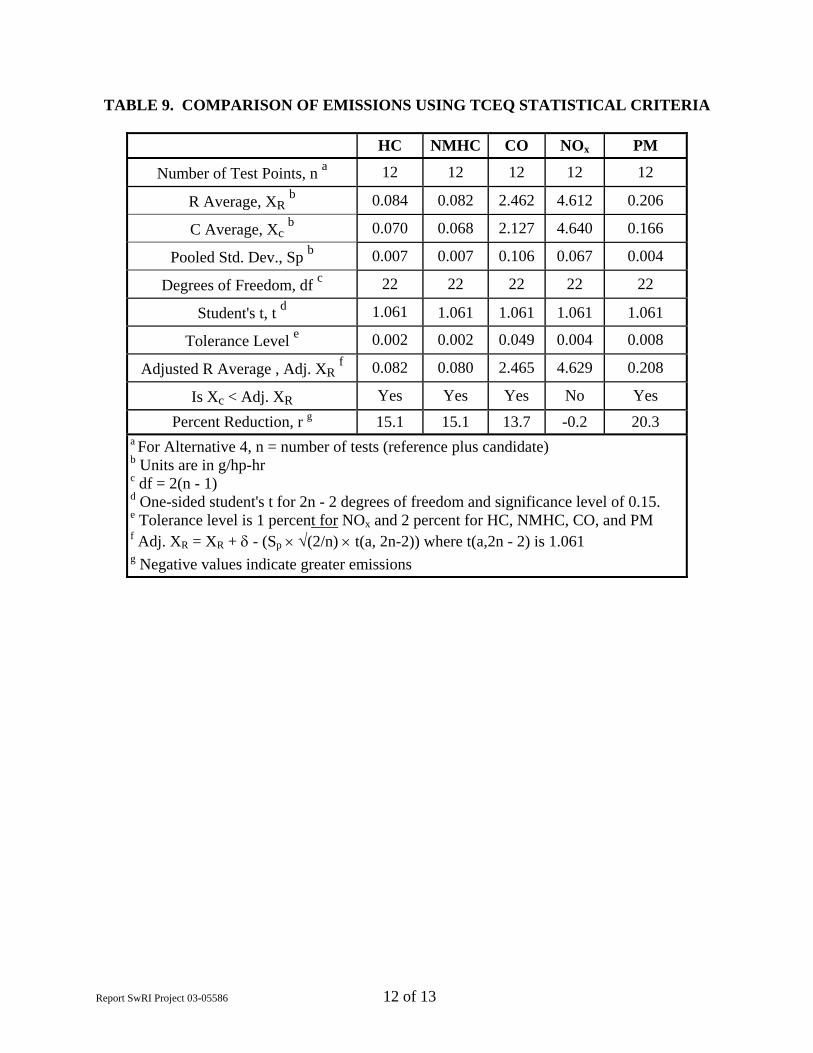
Idle speed: 600 rpm, rated speed: 1800 rpm. a This map was used as reference for all subsequent transient cycles. During steady-state performance checks, the 1991 DDC Series 60 engine had a maximum power of 362 hp at a rated speed of 1800 rpm with Fuel R for the initial baseline, 361 hp for the repeat test with Fuel R, a maximum power of 360 hp and 361 hp with Fuel C, and a maximum power of 362 hp for both of the final baseline tests with Fuel R. Peak torque at 1200 rpm was 1420 lb-ft and 1428 lb-ft on Fuel R for the initial baselines, 1406 lb-ft and 1402 lb-ft on Fuel C, and 1402 lb-ft and 1408 lb-ft for the final baseline tests with Fuel R. No operational problems were observed. Table 8 gives emission results for HC, non-methane hydrocarbons (NMHC), CO, NOx, PM, and brake specific fuel consumption (BSFC) obtained for each of the tests. The average, standard deviation, and coefficient of variation for each set of six hot-start transient tests are also included for each fuel. Detailed results are given in Appendix B. (Please note that while averages, standard deviations, and coefficient of variations were calculated for the six hot-start tests with Fuel R that followed the Fuel C testing, the data were not utilized in subsequent calculations as these tests were only conducted to determine if there was any residual effect from the additive.) No residual effects from Fuel C were noted when the fuel was changed back to Fuel R, except for a slight lowering of the PM emissions. Table 9 shows the statistical approach for comparing the emission results. With this approach, the average emissions from the six individual tests with the candidate fuel, "Fuel C"
Report SwRI Project 03-05586 10 of 13
(XC), were compared to the average emission results for six individual tests with the average reference fuel, "Fuel R" (XR), by using the one-side t distribution as given in TCEQ Chapter 114, Control of Air Pollution From Motor Vehicles, Subchapter H: Low Emission Fuels, Division 2: Low Emission Diesel, §114.315, Approved Test Methods. The average term for the reference fuel for each emission was adjusted by the tolerance (1 percent of the average for NOx and 2 percent of the average for HC, NMHC, CO, and PM) and by a value that included:
• Pooled standard deviation, Sp • Square root of two divided by the number of tests, n, for both reference plus
candidate (in this case, n = 12) • One-sided upper percentage point of t distribution with a = 0.15 and 2n-2 degrees
of freedom The equation for this comparison is: ___
XC < XR + δ - (Sp × √(2/n) × t(a, 2n-2)) Values presented in Table 9 were based on a spreadsheet calculation provided by TCEQ to CDTI and subsequently to SwRI. In this spreadsheet, the number of tests, n, was based on the sum of tests with the candidate plus the number of tests with the reference fuel, which in this evaluation
FIGURE 3. ENGINE PERFORMANCE USING FUELS R AND C
0
200
400
600
800
1000
1200
1400
1600
500 700 900 1100 1300 1500 1700 1900
Engine Speed, rpm
Engi
ne T
orqu
e, lb
-ft
0
200
400
600
800
1000
1200
1400
1600
Pow
er, h
p
Fuel R Fuel C
Report SwRI Project 03-05586 11 of 13
TABLE 8. SUMMARY OF REGULATED EMISSIONS
Transient Emissions, g/hp-hr Test Number
Test Date HC NMHC CO NOx PM
BSFC, lb/hp-hr
Work, hp-hr
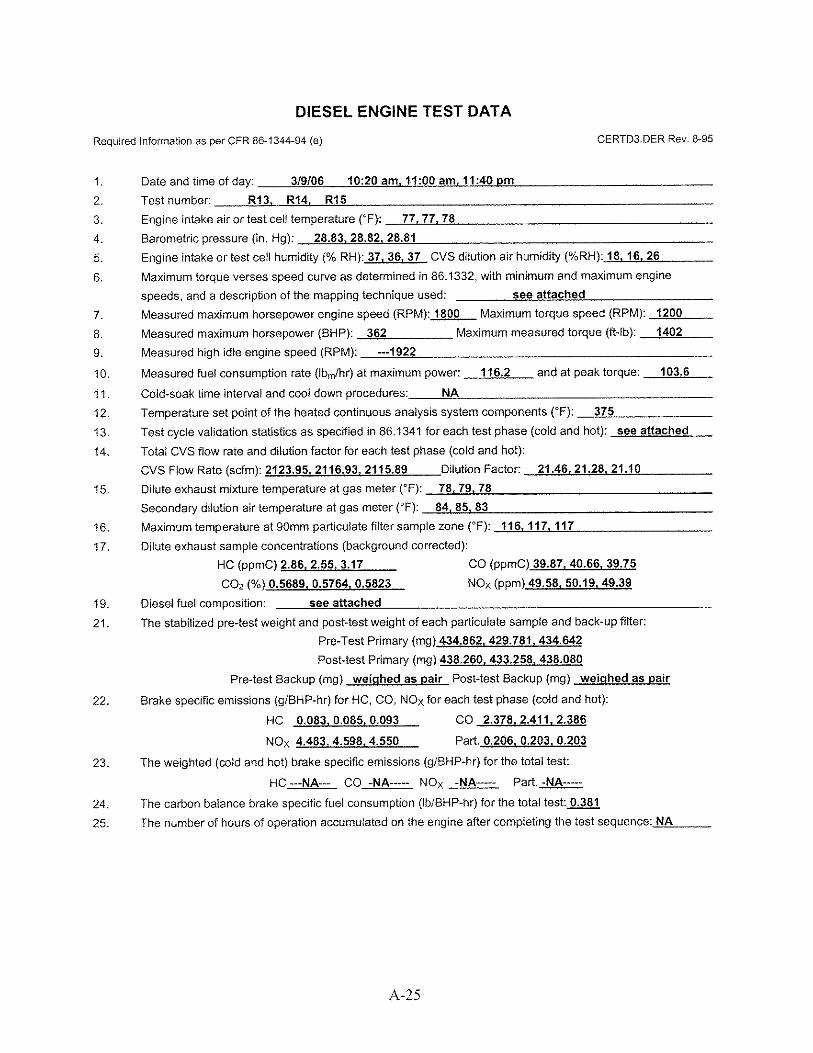
R1 3/3/2006 0.083 0.081 2.378 4.483 0.206 0.380 23.78 R2 3/3/2006 0.085 0.083 2.411 4.598 0.203 0.382 23.75 R3 3/3/2006 0.093 0.091 2.396 4.550 0.203 0.381 23.83 R4 3/3/2006 0.081 0.079 2.694 4.722 0.209 0.387 23.52 R5 3/3/2006 0.079 0.077 2.405 4.628 0.204 0.379 23.81 R6 3/3/2006 0.080 0.078 2.489 4.688 0.210 0.390 23.49
Mean 0.084 0.082 2.462 4.612 0.206 0.383 23.70 Std. Dev 0.005 0.005 0.120 0.088 0.003 0.004 0.15
% COV 6.1% 6.1% 4.9% 1.9% 1.5% 1.1% 0.6%
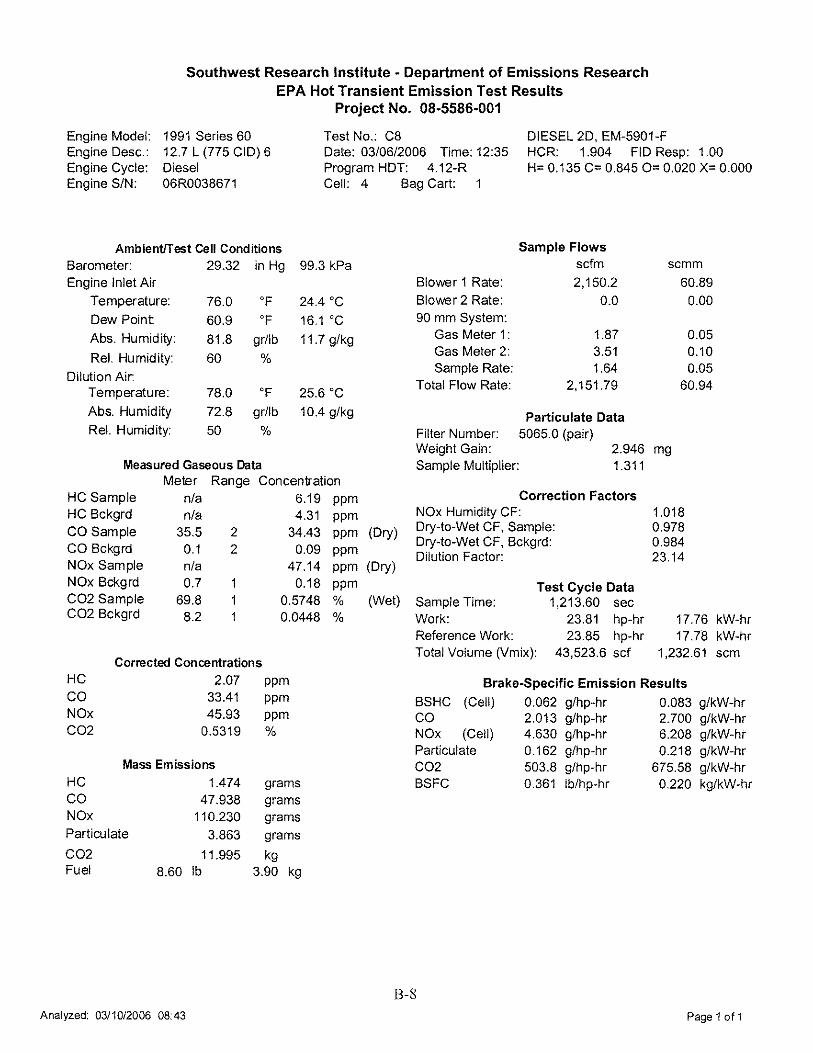
C7 3/6/2006 0.076 0.074 2.184 4.642 0.164 0.367 23.69 C8 3/6/2006 0.062 0.061 2.013 4.630 0.162 0.361 23.81 C9 3/6/2006 0.062 0.061 2.172 4.622 0.162 0.364 23.87
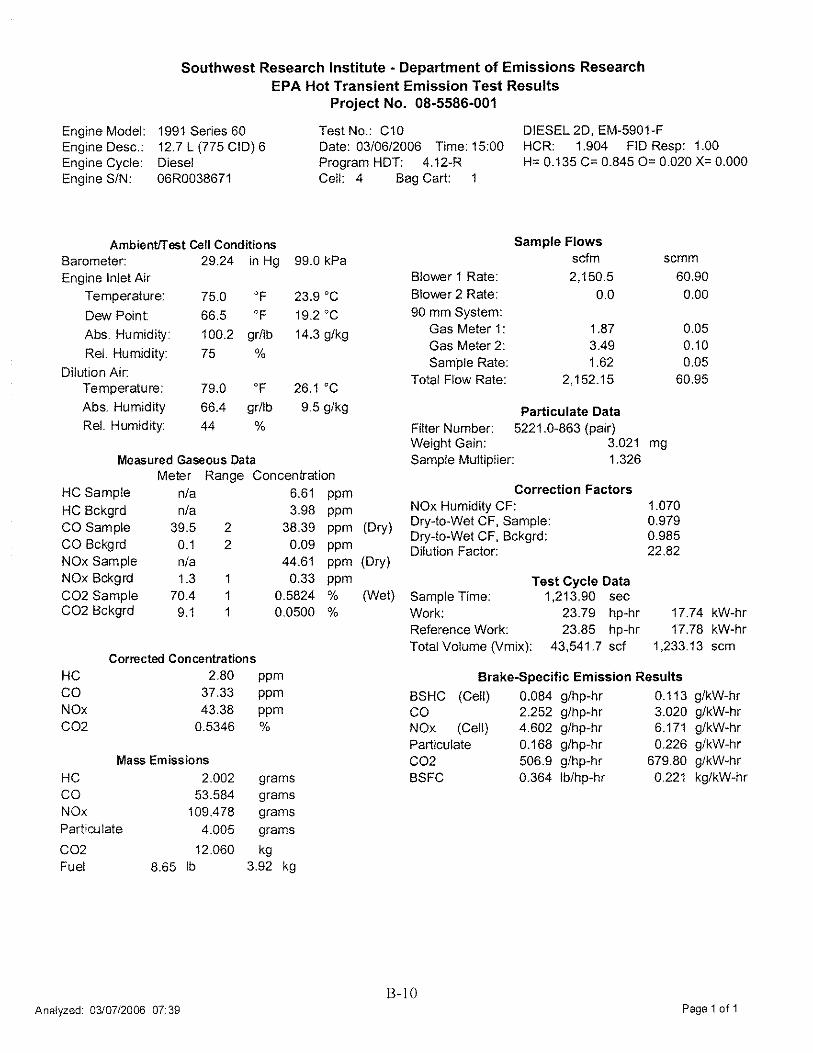
C10 3/6/2006 0.084 0.082 2.251 4.598 0.168 0.363 23.79 C11 3/6/2006 0.065 0.064 2.086 4.647 0.170 0.356 23.80 C12 3/6/2006 0.069 0.068 2.055 4.700 0.171 0.359 23.65
Mean 0.070 0.068 2.127 4.640 0.166 0.362 23.77 Std. Dev 0.009 0.009 0.090 0.034 0.004 0.004 0.08
% COV 12.6% 12.6% 4.2% 0.7% 2.4% 1.1% 0.3%
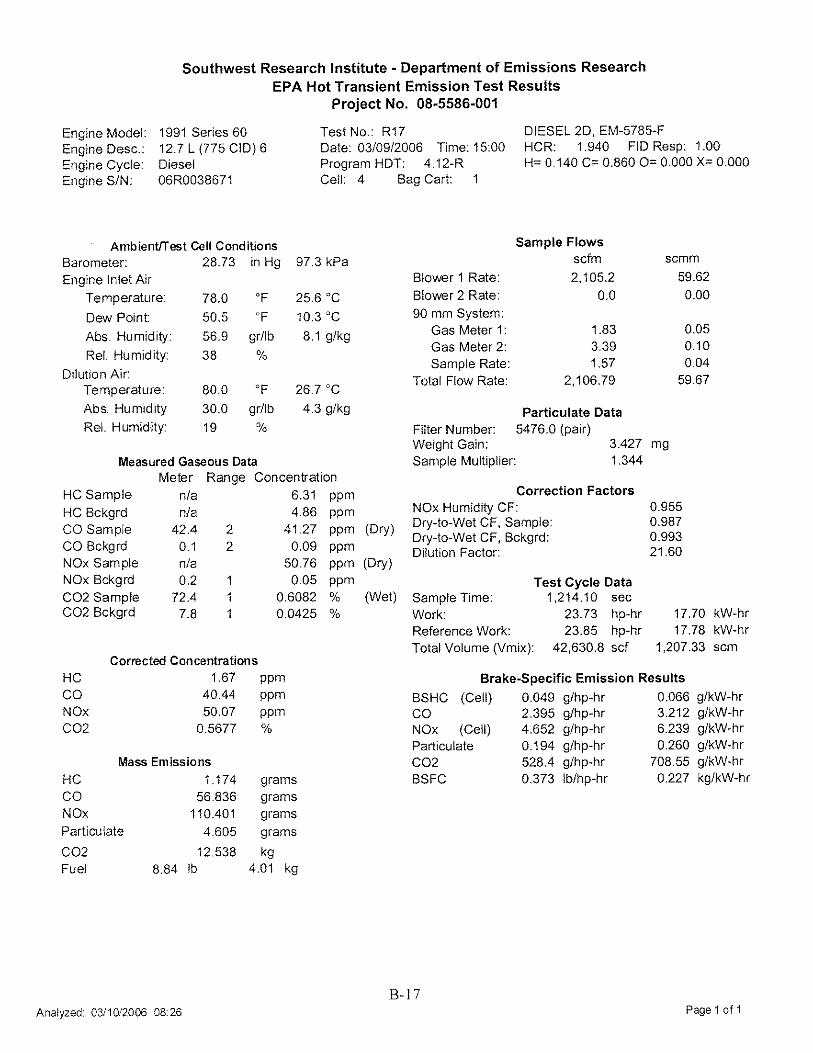
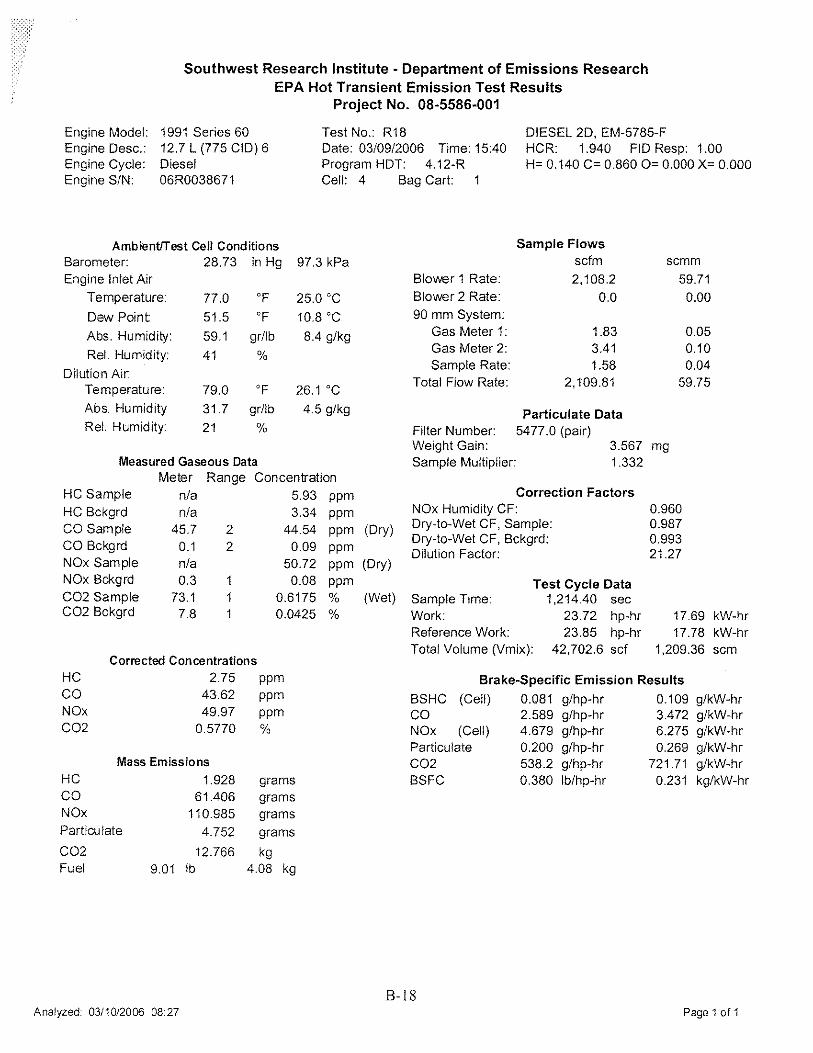
R13 3/9/2006 0.085 0.083 2.386 4.611 0.195 0.377 23.69 R14 3/9/2006 0.076 0.074 2.441 4.667 0.200 0.383 23.52 R15 3/9/2006 0.094 0.092 2.358 4.576 0.191 0.383 23.80 R16 3/9/2006 0.081 0.079 2.429 4.595 0.196 0.376 23.76 R17 3/9/2006 0.049 0.048 2.395 4.652 0.194 0.373 23.73 R18 3/9/2006 0.081 0.079 2.589 4.679 0.200 0.380 23.85
Mean 0.078 0.076 2.433 4.630 0.196 0.379 23.73 Std. Dev 0.015 0.015 0.082 0.042 0.004 0.004 0.12
% COV 26.3% 26.3% 4.2% 0.9% 1.6% 0.9% 0.3%
is 12 (six reference tests plus six candidate test). This value was used as opposed to using the number of tests for each of the sets of data. The number of tests used in the calculation affects the degrees of freedom, the square root term, and the student’s t test. If the average for the candidate fuel is less than the adjusted average for the reference fuel, then the candidate fuel is comparable or better than the reference fuel. While reductions were noted for HC, NMHC, CO, and PM with Fuel C; an increase of 0.2 percent was observed for the NOx emissions.
Report SwRI Project 03-05586 12 of 13
TABLE 9. COMPARISON OF EMISSIONS USING TCEQ STATISTICAL CRITERIA
HC NMHC CO NOx PM
Number of Test Points, n a 12 12 12 12 12
R Average, XR b 0.084 0.082 2.462 4.612 0.206
C Average, Xc b 0.070 0.068 2.127 4.640 0.166
Pooled Std. Dev., Sp b 0.007 0.007 0.106 0.067 0.004
Degrees of Freedom, df c 22 22 22 22 22
Student's t, t d 1.061 1.061 1.061 1.061 1.061
Tolerance Level e 0.002 0.002 0.049 0.004 0.008
Adjusted R Average , Adj. XR f 0.082 0.080 2.465 4.629 0.208
Is Xc < Adj. XR Yes Yes Yes No Yes
Percent Reduction, r g 15.1 15.1 13.7 -0.2 20.3 a For Alternative 4, n = number of tests (reference plus candidate) b Units are in g/hp-hr c df = 2(n - 1) d One-sided student's t for 2n - 2 degrees of freedom and significance level of 0.15. e Tolerance level is 1 percent for NOx and 2 percent for HC, NMHC, CO, and PM f Adj. XR = XR + δ - (Sp × √(2/n) × t(a, 2n-2)) where t(a,2n - 2) is 1.061 g Negative values indicate greater emissions
Report SwRI Project 03-05586 13 of 13
6.0 SUMMARY This test program was conducted for CDTI by the DEER at SwRI. The reference fuel (Fuel R) and the candidate fuel (Fuel C) were compared using hot-start transient tests run on a 1991, DDC Series 60 heavy-duty diesel engine following Alternative 4 (with the exception that only six (6) hot-start tests were run with Fuel C) as specified in the (TCEQ) Chapter 114 – Control of Air Pollution From Motor Vehicles, Subchapter H: Low Emission Fuels, Division 2: Low Emission Diesel. The average emission results for PM and NOx using the candidate alternative diesel fuel were compared to the adjusted average emission results using the reference diesel fuel. The candidate fuel was found to decrease PM emissions by 20.3 percent and to increase NOx emissions by 0.2 percent when compared to the reference fuel. Average HC and CO emissions were lower with the candidate fuel than with the reference fuel (15 and 14 percent lower, respectively).

APPENDIX A
Power Validation and Torque Map Data for a 1991 Detroit Diesel Series 60 Running with Reference Fuel and with CDT Biodiesel PLUS™ from
Clean Diesel Technologies, Inc


APPENDIX B
Transient Regulated Emissions Data for a 1991 Detroit Diesel Series 60 Running with Reference Fuel and with CDT Biodiesel PLUS™ from
Clean Diesel Technologies, Inc. Fuel