Embed Size (px)
Citation preview
How to Read the Budget Papers
2021-22
How to Read the Budget Papers
FOREWORD
The Budget is the Government’s principle financial, economic and policy statement and is released once a year. It focuses on the next four years ahead, with a particular analysis on the year ahead (the Budget year).
The Budget itself is made up of five individual Budget Papers, one of which is the Appropriation Bills presented to NSW Parliament.
The Budget Papers are an important resource for citizens. They provide insight into how the NSW Government is allocating taxpayer dollars, what new services are being delivered and what key performance indicators are being tracked.
How to Read the Budget Papers has been prepared to help readers get the most from the Budget, from where to locate key information to an overview of key concepts and terminology.
This document is structured to serve a dual purpose:
1. A plain English guide for readers, to aid them in interpreting key economic, financial and performance information in the Budget Papers
2. A technical accompaniment for the ‘Actual and Estimated Financial Statements for the general government sector’ – including how they are prepared in accordance with principles and rules established by the Australian Accounting Standards Board and the Australian Bureau of Statistics.
This document concludes with a glossary of key terms used across the Budget Papers.
The full range of Budget Papers and associated products can be found on the NSW Budget website, www.budget.nsw.gov.au.
How to Read the Budget Papers
TABLE OF CONTENTS
Foreword
Basis and scope of the budget papers ...................................................................................... i
What is ‘The Government’ and what is the scope of the Budget Papers .................. i
Where to locate information in budget papers ........................................................................ iii
Budget Paper No. 1: Budget Statement .................................................................. iii
Budget Paper No. 2: Outcomes Statement ............................................................... iii
Budget Paper No. 3: Infrastructure Statement .......................................................... iv
Budget Paper No. 4: Agency Financial Statements .................................................. iv
Budget Paper No. 5: Appropriation Bill ...................................................................... iv
Important concepts .......................................................................................................................... v
Explaining key terms and phrases .............................................................................................. viii
Concepts used to measure production and spending ............................................... viii
Concepts used to measure the State’s overall financial position and performance .. ix
Concepts used in Outcome Budgeting ...................................................................... x
Reading and understanding financial statements ................................................................. xii
Financial statements presented in the Budget Papers .............................................. xiii
Statement of significant accounting policies and forecast assumptions ....................... xx
Scope of the Actual Financial Statements and Estimated Financial Statements for the General Government Sector ................................................................................. xx
Basis of preparation ................................................................................................... xx
Accounting policies .................................................................................................... xxii
Changes in accounting policies ................................................................................. xxii
Presentation of the GGS Estimated Financial Statements ........................................ xxiii
Definitions .................................................................................................................. xxiv
Material economic assumptions ................................................................................ xxv
Summary of other key assumptions .......................................................................... xxv
Glossary .............................................................................................................................................. xxxii
How to Read the Budget Papers i
BASIS AND SCOPE OF THE BUDGET PAPERS
The Budget Papers deliver several objectives. They:
inform the public of the State’s economic and fiscal position
set out the NSW Government’s fiscal strategy
provide Parliament with financial and service delivery information to inform consideration of the Appropriation Bills
provide a clear and detailed report on the State’s infrastructure expenditure strategy, covering both new works and works-in-progress
provide advice and insight on how resources are expected to deliver outcomes
fulfil additional legal requirements (the Government Sector Finance Act 2018 and the Fiscal Responsibility Act 2012).
What is ‘The Government’ and what is the scope of the Budget Papers
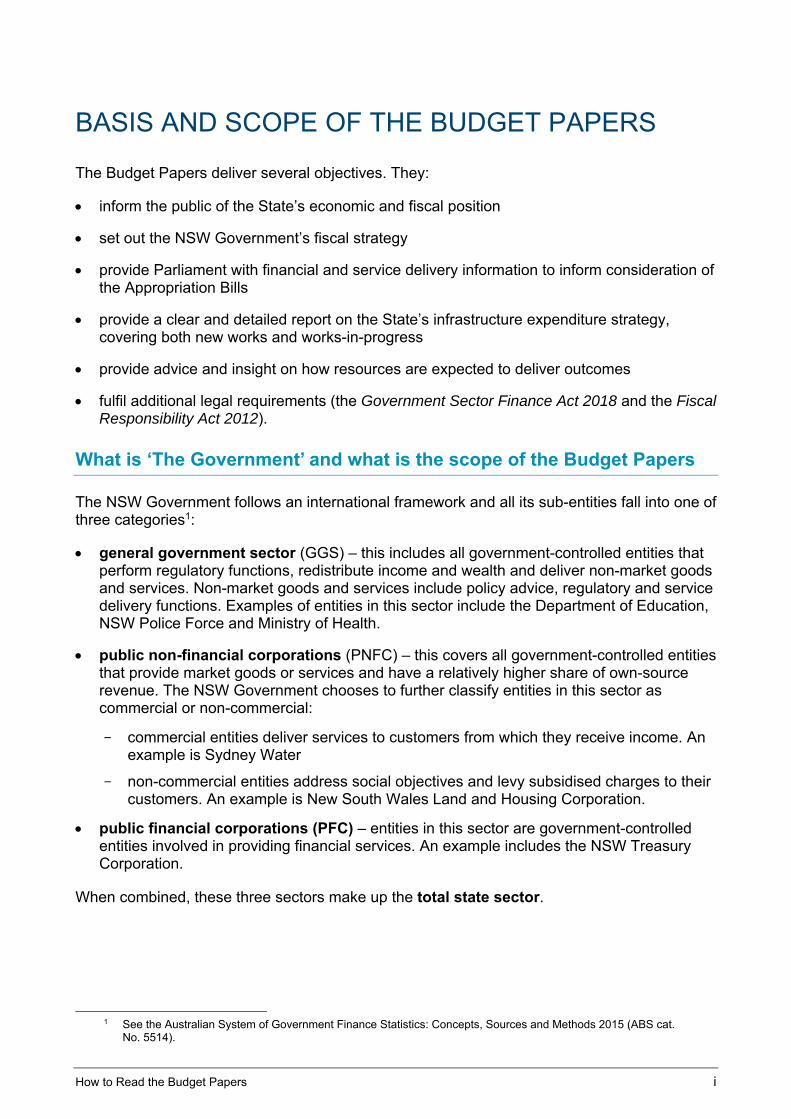
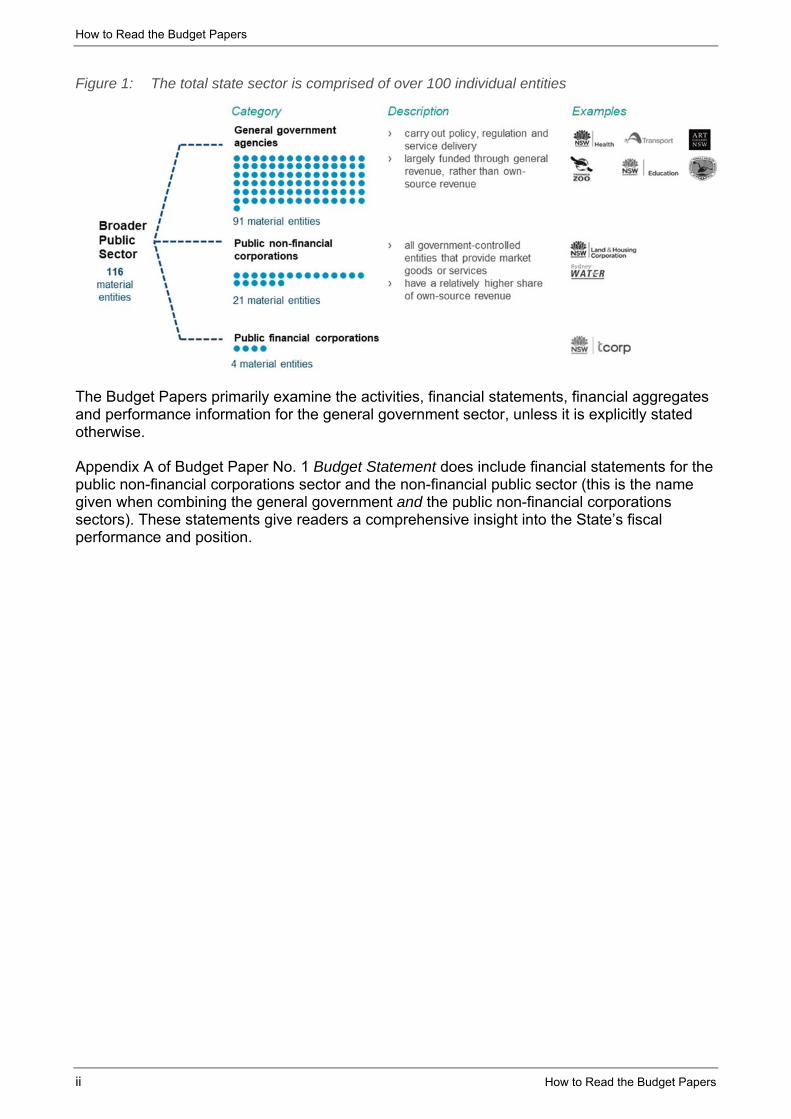
The NSW Government follows an international framework and all its sub-entities fall into one of three categories1:
general government sector (GGS) – this includes all government-controlled entities that perform regulatory functions, redistribute income and wealth and deliver non-market goods and services. Non-market goods and services include policy advice, regulatory and service delivery functions. Examples of entities in this sector include the Department of Education, NSW Police Force and Ministry of Health.
public non-financial corporations (PNFC) – this covers all government-controlled entities that provide market goods or services and have a relatively higher share of own-source revenue. The NSW Government chooses to further classify entities in this sector as commercial or non-commercial:
– commercial entities deliver services to customers from which they receive income. An example is Sydney Water
– non-commercial entities address social objectives and levy subsidised charges to their customers. An example is New South Wales Land and Housing Corporation.
public financial corporations (PFC) – entities in this sector are government-controlled entities involved in providing financial services. An example includes the NSW Treasury Corporation.
When combined, these three sectors make up the total state sector.
1 See the Australian System of Government Finance Statistics: Concepts, Sources and Methods 2015 (ABS cat. No. 5514).
How to Read the Budget Papers
ii How to Read the Budget Papers
Figure 1: The total state sector is comprised of over 100 individual entities
The Budget Papers primarily examine the activities, financial statements, financial aggregates and performance information for the general government sector, unless it is explicitly stated otherwise.
Appendix A of Budget Paper No. 1 Budget Statement does include financial statements for the public non-financial corporations sector and the non-financial public sector (this is the name given when combining the general government and the public non-financial corporations sectors). These statements give readers a comprehensive insight into the State’s fiscal performance and position.
How to Read the Budget Papers
How to Read the Budget Papers iii
WHERE TO LOCATE INFORMATION IN BUDGET PAPERS
This section helps readers understand where in the Budget they can find what they are looking for. The Budget Papers for 2021-22 are:
Budget Paper No. 1: Budget Statement
Budget Paper No. 2: Outcomes Statement
Budget Paper No. 3: Infrastructure Statement
Budget Paper No. 4: Agency Financial Statements
Budget Paper No. 5: Appropriation Bill.
In addition to the papers listed above, the NSW Government prepares supporting products and these include the Budget Overview, Regional NSW and Budget Speech.
All Budget Papers and associated products can be found on the NSW Budget website, www.budget.nsw.gov.au. The website also includes key interactive dashboards.
Budget Paper No. 1: Budget Statement
Budget Paper No. 1 presents ‘whole of Government’ information. It contains the NSW Government’s economic and fiscal position and outlook. It also details the NSW Government’s fiscal strategy and presents a consolidation of the main expense, revenue and balance sheet measures.
This Budget Paper is often read in conjunction with Budget Paper No. 2 Outcomes Statement, which details information at the Cluster-by-Cluster and Outcome-by-Outcome level. Readers interested in capital expenditure often read Budget Paper No. 1 Budget Statement alongside Budget Paper No. 3 Infrastructure Statement.
Budget Paper No. 2: Outcomes Statement
Budget Paper No. 2 puts a lens on performance and the impact of policies. It structures information into 37 State Outcomes. Readers who are interested in understanding what a particular Cluster is delivering will often refer to this Budget Paper. The document provides:
a short introduction to each Cluster
an explanation of the State Outcomes being delivered by that Cluster
key performance information for each State Outcome
policy and project highlights for each State Outcome.
Readers often use the analysis in Budget Paper No. 2 when reading Budget Paper No. 4 Agency Financial Statements and Budget Paper No. 5 Appropriation Bill.
How to Read the Budget Papers
iv How to Read the Budget Papers
Budget Paper No. 3: Infrastructure Statement
Budget Paper No. 3 Infrastructure Statement provides detailed information on the NSW Government’s infrastructure investment program and projects to be delivered by the Government. The document also provides detail on the Restart NSW program, the Snowy Hydro Legacy Fund and the Digital Restart Fund.
Budget Paper No. 4: Agency Financial Statements
Budget Paper No. 4 Agency Financial Statements presents an operating statement and balance sheet for each Department and their respective agencies for the upcoming Budget year ahead.
Budget Paper No. 5: Appropriation Bill
Budget Paper No.5 Appropriation Bill sets out the amount to be appropriated to each Cluster Minister, along with the purpose for which it is to be spent.
The Appropriation Bill actually includes two bills. The first bill sets out the appropriation for the services of Government of the nine Clusters and eight Special Offices. The second bill, which is presented cognate (meaning two or more bills are considered in detail at the same time) details the appropriation for parliamentary services.
How to Read the Budget Papers
How to Read the Budget Papers v
IMPORTANT CONCEPTS
The Budget is based on economic forecasts and assumptions
It is important to keep in mind the Budget is a forward-looking document, so it relies on economic forecasts and assumptions. The forecasts and assumptions used in budget preparation are based on sound judgement and they reflect information available at the time.
Some economic parameters are heavily influenced by Commonwealth policy settings and these are largely underpinned by Commonwealth Government assumptions. An example is the impact of the Commonwealth’s migration and border policies, which impact New South Wales population growth.
Readers that are interested in the underlying forecasts and assumptions for this Budget can read further at:
Box 2.1 in Budget Paper No. 1 Budget Statement, which outlines the health assumptions in the Budget
Page xxv of this document, which outlines the material economic assumptions used in the 2021-22 Budget, such as population and gross state product.
Government financial statements have similarities but also differences to household and private sector financial statements
The presentation of government financial statistics in Australia largely follows international best practice established by the International Monetary Fund. The Australian Bureau of Statistics sets out the practices to be followed by governments around Australia.2
At their core, government financial statements inform readers about economic value. The Operating Statement measures changes in economic value over the year and the Balance Sheet shows the economic value (assets and liabilities) at the end of a year. More detail on each statement is available later in this guide, including what a ‘surplus’ or ‘deficit’ is actually measuring.
Although government financial statistics are economic in nature, wherever possible they harmonise with accounting principles.
Accrual basis of accounting
The financial statements presented in the Budget Papers are prepared using an accrual basis of accounting and accord with official Australian Accounting Standards. Accrual accounting is different from cash accounting, which is the basis used by many households.
Importantly, the Statement of Finances in Appendix A1 of Budget Paper No. 1 Budget Statement is prepared in accordance with the Uniform Presentation Framework and the principles and rules contained in the Australian Bureau of Statistics, Australian System of Government Finance Statistics: Concepts, Sources and Methods 2015 (Cat. No. 5514) (ABS-GFS Manual). This aids transparency and integrity in public reporting and facilitates comparison across jurisdictions.
2 5514.0 Australian System of Government Finance Statistics: Concepts, Sources and Methods (2015)
How to Read the Budget Papers
vi How to Read the Budget Papers
Outcome Budgeting and performance information
Outcome Budgeting is a performance management approach. It starts the conversation by asking what outcomes are ultimately being pursued by Government (e.g. the best start in life for young children). All spending in this Budget falls within one of 37 State Outcomes.
For each State Outcome, the Government considers:
the relative level of investment
how success should be tracked (e.g. proportion of young children enrolled in early education)
a performance target (e.g. x% of young children).
A key benefit of this management approach is it examines whether policies have evidence of achieving targets, alongside their cost. It is a more innovative and comprehensive approach than simply looking at whether existing programs or agencies need incremental adjustments to their budgets. It also encourages innovation across agencies, where services can work together to achieve an overarching goal.
See Budget Paper No. 2 Outcomes Statement for analysis on the 37 State Outcomes and for significant new policy initiatives in each Cluster.
In New South Wales, there are nine policy Clusters
The general government sector is made up of around 90 material-sized agencies3. All agencies are grouped by policy area and fall into one of nine Clusters. This Cluster governance framework encourages similar and complementary Government services to be coordinated effectively and efficiently. The nine Clusters within the framework are:
Customer Service
Education
Health
Planning, Industry and Environment
Premier and Cabinet
Regional NSW
Stronger Communities
Transport
Treasury.
Further information about Clusters, and their associated agencies, financial statements, capital investment plans and performance information can be found in Budget Paper No. 2 Outcomes Statement, Budget Paper No. 3 Infrastructure Statement and Budget Paper No. 4 Agency Financial Statements. The Consolidated Fund needs of each Cluster are outlined in Budget Paper No. 5 Appropriation Bill.
3 There are also a number of smaller service agencies and trusts
How to Read the Budget Papers
How to Read the Budget Papers vii
How to interpret aggregated data
Like large private sector conglomerates, entities within the NSW Government transact with each other throughout the year. For example, many agencies use Property NSW for property transactions and the NSW Audit Office for auditing services.
The aggregated financial data presented in Budget Paper No. 1 Budget Statement is presented on a ‘sector eliminated basis’. This means whole-of-government expenditure and revenue removes (or eliminates) intra-government transactions. This approach ensures there is no double counting and it provides an accurate picture of the size of the Government as a single entity. The benefit is citizens can see the total expenditure of the government as a unit, alongside the total revenue of the government.
In Budget Paper No. 2 Outcomes Statement and Budget Paper No. 4 Agency Financial Statements, recurrent expenses and capital expenditure are aggregated but they are eliminated at the Cluster level only. That means transactions between entities within that Cluster have been eliminated and not double counted as part of the Cluster’s aggregates. However, caution should be exercised in attempting to add up all the Cluster budgets to try and calculate whole-of-government spend. It will give an incorrect figure that does not net out trading across Clusters. As a general rule, readers should use Budget Paper No. 1 Budget Statement to understand whole-of-government aggregates.
Reflecting the latest changes in Accounting Standards
Accounting standard AASB 1059 Service Concession Arrangements (AASB 1059) applies from 1 July 2020. NSW Government has also repealed Accounting Policy TPP 06-08 Accounting for Privately Financed Projects. The impact of these changes have been reflected in the revised budget estimates for 2020-21, the 2021-22 Budget year and forward estimates years (2022-23 to 2024-25).
When data is referred to as actual (in this Budget that is usually the period ending 30 June 2020) that reflects the audited financial data that was tabled in Parliament on 17 November 2020. It has not been restated to reflect any changes that may arise due to the adoption, or repeal, of accounting standards and policies in subsequent reporting periods. This is consistent with section 4.2(3A) of the Government Sector Finance Act 2018 (GSF Act)4.
For further information on the impact of changes to accounting standards on the Estimated Financial Statements for the general government sector, see the Statement of Significant Accounting Policy and Forecast Assumptions section later on in this document.
4 Section 4.2 (3A) of the Government Sector Finance Act,2018
How to Read the Budget Papers
viii How to Read the Budget Papers
EXPLAINING KEY TERMS AND PHRASES
An understanding of the concepts in this section will help readers better interpret the Budget’s analysis of the economy and fiscal outlook. This section does not require previous knowledge of finance or economics.
This section explains frequently used concepts or those sometimes less understood. There is a Glossary at the end of this guide which provides an exhaustive list of terms used through the Budget Papers.
Concepts used to measure production and spending
Gross Domestic Product
Gross Domestic Product (GDP) is one measure of how an economy is performing. It measures the value-added production of goods and services produced by a country and is published quarterly. GDP can be measured in two ways: nominal and real.
Nominal GDP measures GDP in current (original) market prices, which includes the impact of inflation / deflation.
Real GDP measures GDP in constant prices and therefore excludes the impact of inflation / deflation. Movements in real GDP is the preferred indicator of how fast economic activity is growing.
The ABS releases updates to national GDP both quarterly and annually.
Gross State Product
The equivalent measure of GDP at a state or territory level is known as Gross State Product (GSP). It measures the value-add of goods and services produced within a state. GSP is released annually by the ABS. For example, the 2019-20 State Accounts (previously Cat:5220.0 Australian National Accounts: State Accounts) showed New South Wales GSP decreased 0.7 per cent in 2019-20.
State Final Demand
State Final Demand is different to GSP in that it measures the total value of goods and services that are sold in a state or territory to buyers who either consume them or retain them in the form of capital assets.
Consumer Price Index
The Consumer Price Index (CPI) is designed to provide a general measure of inflation of the household sector. It measures the change in the price for a basket of goods and services over a period of time. The CPI is compiled separately for each capital city and is presented as the weighted average of eight capital cities. In addition to a national CPI, a Sydney CPI is also published.
How to Read the Budget Papers
How to Read the Budget Papers ix
Concepts used to measure the State’s overall financial position and performance
Net worth
Is a measure of the strength of the Government’s financial position at a point in time, usually at the end of a financial year (30 June). It represents the value of all assets, minus the value of all outstanding liabilities.
Revenue
Revenue is defined as all increases in net worth resulting from transactions. Revenue consists mainly of taxation revenue, sales of goods and services, property income, other current revenue, and capital revenue.
Expenses
Expenses are defined as decreases in net worth resulting from transactions. Common types of expenses include employee expenses, interest, grants and subsidies.
In accrual accounting, total expenses include a line item for ‘depreciation’. This means the total expenses in this Budget ($98.1 billion for 2021-22) includes the amount associated with consuming assets to deliver services ($7 billion depreciation in 2021-22). 5
Budget result (also called the Net Operating Balance)
Represents the difference between expenses and revenue from operating transactions in the general government sector. It is important to keep in mind:
it is a ‘flow’ measure because it covers a period of time (12 months)
it measures activity from ‘transactions’. It excludes changes to assets / liabilities that occur through other means (e.g. revaluations, purchases and sales).
Page ix of this guide shows a marked-up operating statement, highlighting what is included in the Budget result.
Capital expenditure
This is money spent on acquiring or enhancing property, plant and equipment (including land and buildings, plant and equipment, and infrastructure systems) and intangibles (including computer software and easements). In New South Wales, capital expenditure also includes leases and assets acquired using service concession arrangements, as required under Australian accounting standards. As page ix illustrates, the Budget result does not include capital expenditure – it includes depreciation.
5 Depreciation records the value of accounting processes by which the cost of assets are written off over time, and
relates to non-financial, tangible produced assets. Under the ABS concepts adopted by the NSW Government, depreciation is defined as “the decline in the current value of the stock of produced assets owned by public sector units over their useful life, due to physical deterioration, normal obsolescence, or accidental damage.”
How to Read the Budget Papers
x How to Read the Budget Papers
Net lending/borrowing
Shows the financing requirement of the Government over a one-year period. It is measured as the net operating balance less the net acquisition of non-financial assets.
Net debt
Net debt comprises the stock of selected gross financial liabilities less selected financial assets. The stock of net debt is one (but not the only) common measure used to assess the overall strength of a jurisdiction's fiscal position. High levels of net debt can impose a call on future revenue flows to service that debt and if unchecked can limit government flexibility to adjust expenditure.
Gross debt
Gross debt represents the total value of money borrowed by the Government. It is the sum of deposits held, borrowings at amortised costs and borrowings and derivatives at fair value.
Gross debt is less commonly used than net debt when assessing the Governments fiscal position. That’s because gross debt does not factor in the Government’s financial assets which are liquid (e.g. cash and liquid investments), which could be used to reduce borrowings.
Concepts used in Outcome Budgeting
State Outcomes
There are 37 State Outcomes. Each identifies an impact the Government wishes to achieve in New South Wales. Three examples are:
Excellence in Customer Service
Skilled and employable workforce
People receive high-quality, safe care in our hospitals.
All spending in the NSW Budget is allocated to a State Outcome.
Every State Outcome has one or more measures of success – these are referred to as ‘Outcome Indicators’.
Budget Paper No. 2 Outcomes Statement presents financial information, policies and performance data for all 37 State Outcomes.
Programs
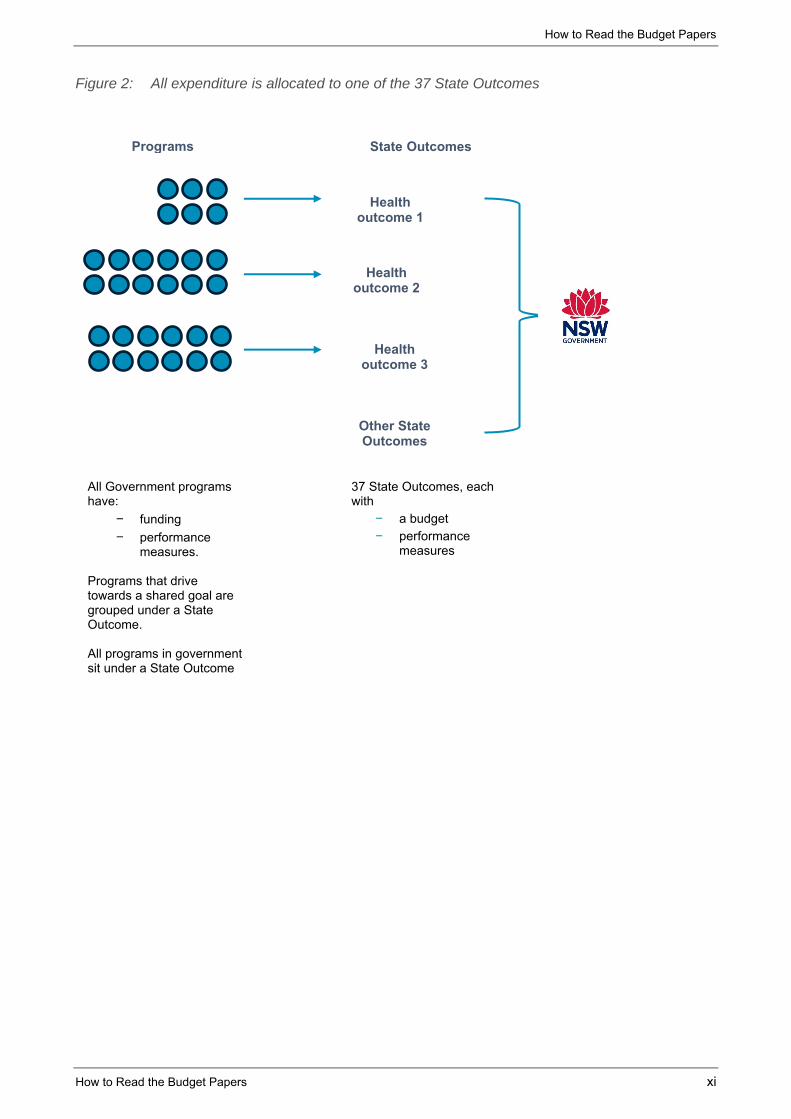
A Program is an activity (or group of activities) designed to achieve a specific policy objective. Programs drive the achievement of State Outcomes and every program in the NSW Government sits under a State Outcome.
Like State Outcomes, each program has at least one measure of success – called Program Performance Measures.
How to Read the Budget Papers
How to Read the Budget Papers xi
Figure 2: All expenditure is allocated to one of the 37 State Outcomes
Health outcome 1
All Government programs have:
– funding
– performance measures.
Programs that drive towards a shared goal are grouped under a State Outcome. All programs in government sit under a State Outcome
Health outcome 2
37 State Outcomes, each with
– a budget – performance
measures
Programs State Outcomes
Health outcome 3
Other State Outcomes
How to Read the Budget Papers
xii How to Read the Budget Papers
READING AND UNDERSTANDING FINANCIAL STATEMENTS
Budget Paper No. 1 Budget Statement includes the consolidated6 financial statements for the general government sector and non-financial public sector. There are three primary statements:
1. Operating Statement
2. Balance Sheet
3. Cash Flow Statement.
These statements cover a number of years:
The year ending 30 June 2020. This is referred to as an ‘actual’ position because the year is complete and the results have been audited.
The year about to end on 30 June 2021. This is called a ‘revised estimated’ position because it has been revised on the Budget that was originally handed down last November, and it is ‘estimated’ because the year is still underway.
The year ending 30 June 2022. This is called the Budget year.
The years ending 30 June 2023, 2024 and 2025. These are called the forward years.
These statements contain common financial aggregates that are reported consistently across governments in Australia and internationally, in line with best practice. These aggregates are detailed further below. The NSW aggregates are prepared in line with:
the Uniform Presentation Framework (UPF) endorsed by the Council on Federal Financial Relations
Australian Accounting Standard AASB 1049 Whole of Government and General Government Sector Financial Reporting, which adopts a harmonised Government Finance Statistics (GFS)/Generally Accepted Accounting Principles (GAAP) reporting basis.
Further background on the UPF can be found in Appendix A1 Statement of Finances in Budget Paper No.1 Budget Statement.
Budget Paper No. 4 Agency Financial Statements provides financial statements for each principal Cluster Department and their agencies. These are prepared consistent with Australian Accounting Standards.
Differences between harmonised GFS and GAAP information, as shown in the Budget Papers, and pure GFS information, as reported by the Australian Bureau of Statistics, are known as convergence differences. Such differences are not departures from Accounting Standards but merely variations in measurement or treatments between GAAP and GFS frameworks.
6 Consolidated means the combined activities of all those entities in the sector.
How to Read the Budget Papers
How to Read the Budget Papers xiii
Financial statements presented in the Budget Papers
While the Budget does contain some historical data, the bulk of analysis is forward looking. The sections below help readers understand how to read the different statements in the Budget, keeping in mind that the numbers presented for 2021-22 and beyond remain estimates because they are prospective.
At their heart, the financial statements are about economic value. Some statements show the change in value over a financial year (flows), some statements measure the economic value at a point in time (stocks).
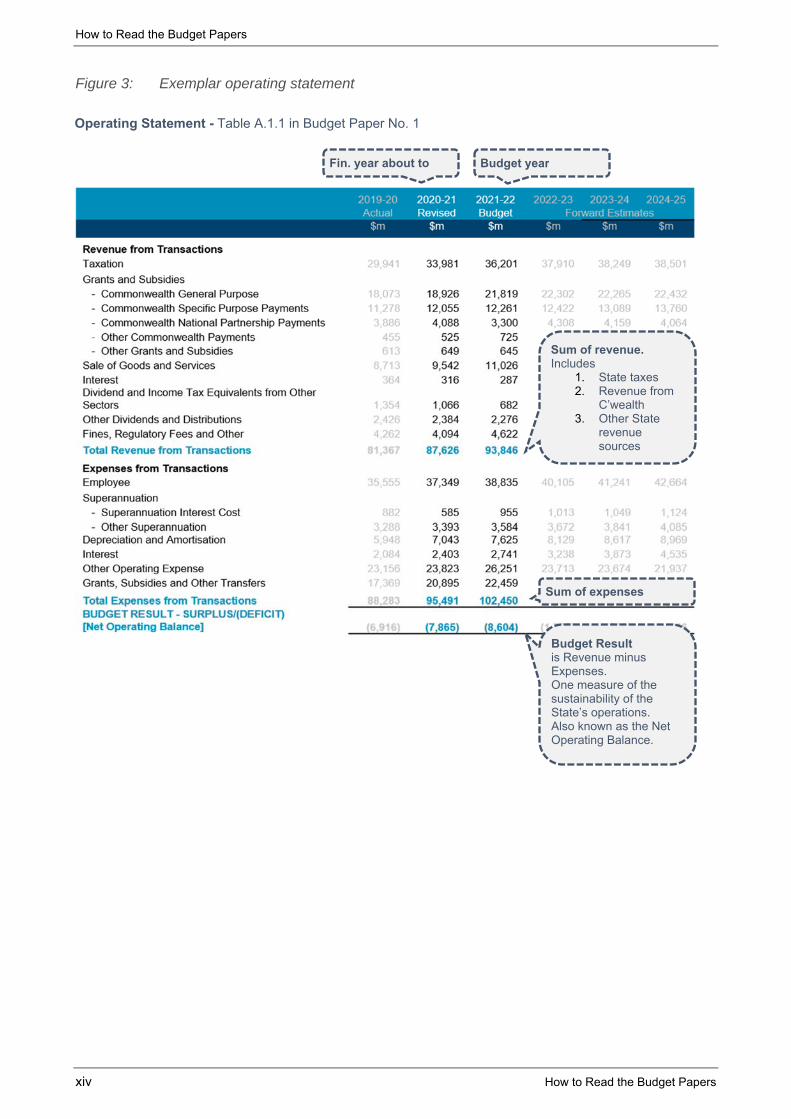
Operating Statement
The Operating Statement shows the revenue and expenditure of the relevant sector. It also shows the net cost of government activities (Budget Result or Net Operating Balance) within a financial year. It reflects the impact of government measures and actions during that time.
The Operating Statement reports against several major fiscal measures, including:
net operating balance (Budget result)
operating result
comprehensive result – total change in net worth
net lending/(borrowing) (fiscal balance)
capital expenditure.
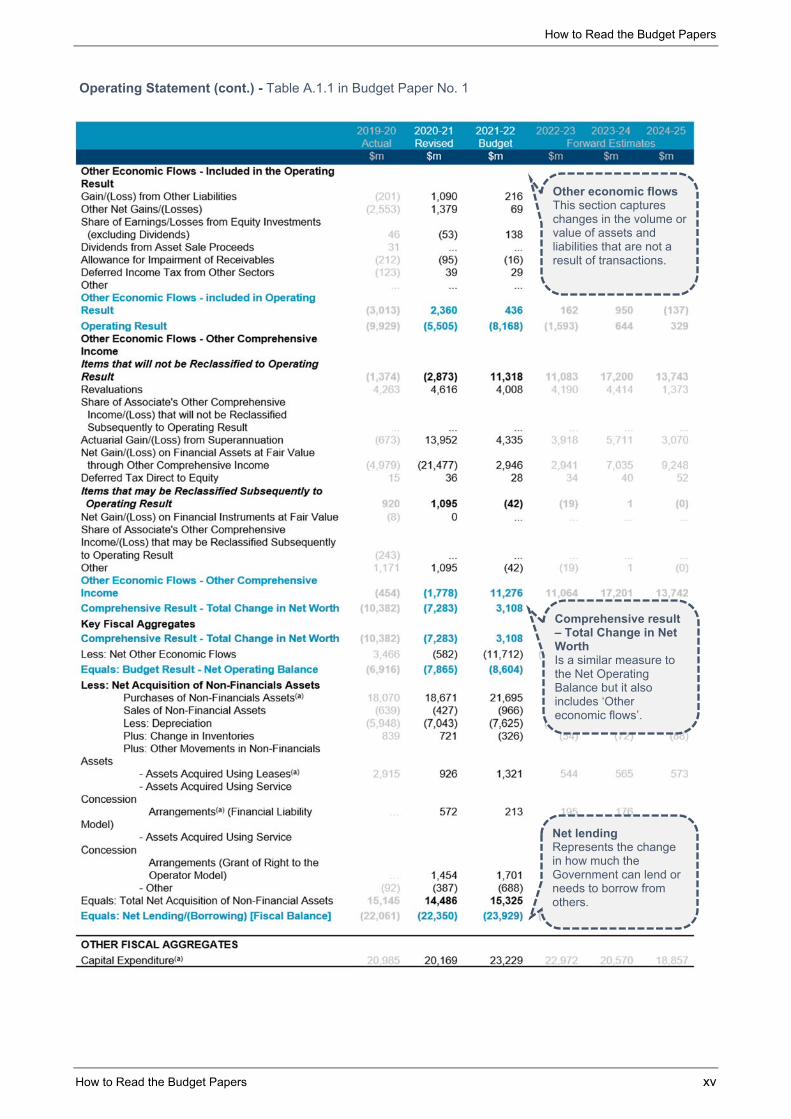
The following pages provide an example of an Operating Statement. It is important to recognise the Operating Statement, which runs over two pages:
captures changes in economic value (economic flows) over a 12 month period.
breaks down economic flows into two main categories
– transactions – an economic flow that is an interaction between institutional units by mutual agreement or through the operation of the law.
– other economic flows – which are changes in the volume or value of assets or liabilities that do not result from transactions. For example, there may be changes due to natural events, such as an earthquake or a flood, or there may be other re-valuations.
Figure 3 below provides an example of an Operating Statement, detailing the above concepts for clarity.
How to Read the Budget Papers
xiv How to Read the Budget Papers
Figure 3: Exemplar operating statement
Sum of revenue. Includes
1. State taxes 2. Revenue from
C’wealth 3. Other State
revenue sources
Sum of expenses
Budget Result is Revenue minus Expenses. One measure of the sustainability of the State’s operations. Also known as the Net Operating Balance.
Fin. year about to
Operating Statement - Table A.1.1 in Budget Paper No. 1
Budget year
How to Read the Budget Papers
How to Read the Budget Papers xv
Operating Statement (cont.) - Table A.1.1 in Budget Paper No. 1
Other economic flowsThis section captures changes in the volume or value of assets and liabilities that are not a result of transactions.
Comprehensive result – Total Change in Net Worth Is a similar measure to the Net Operating Balance but it also includes ‘Other economic flows’.
Net lending Represents the change in how much the Government can lend or needs to borrow from others.
How to Read the Budget Papers
xvi How to Read the Budget Papers
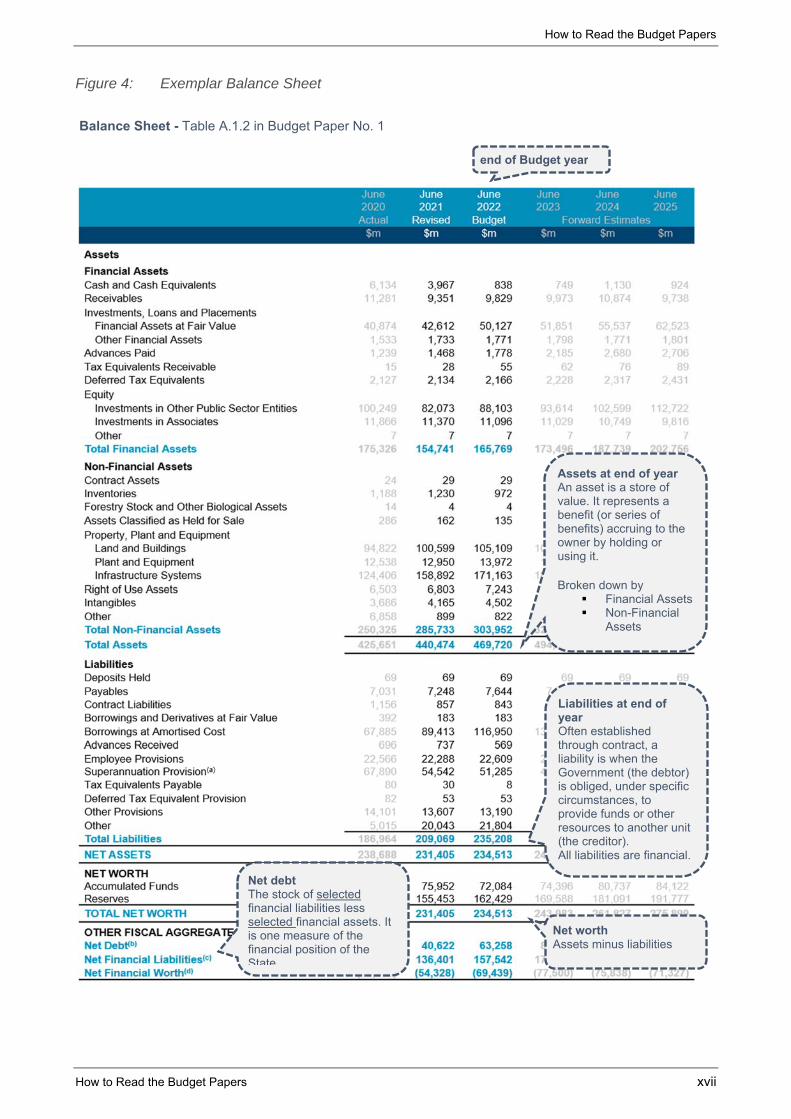
Balance Sheet
The Balance Sheet records the value of financial and non-financial assets and liabilities of the Government at the end of the financial year. It is a stock measure – highlighting the fiscal position of the NSW Government at a point in time.
The balance sheet details the following fiscal aggregates:
total assets and liabilities
net financial worth
net worth
net financial liabilities
net debt.
Figure 4 below provides an example of a Balance Sheet, detailing the concepts listed above.
How to Read the Budget Papers
How to Read the Budget Papers xvii
Figure 4: Exemplar Balance Sheet
Balance Sheet - Table A.1.2 in Budget Paper No. 1
Assets at end of yearAn asset is a store of value. It represents a benefit (or series of benefits) accruing to the owner by holding or using it. Broken down by
Financial Assets Non-Financial
Assets
Liabilities at end of year Often established through contract, a liability is when the Government (the debtor) is obliged, under specific circumstances, to provide funds or other resources to another unit (the creditor). All liabilities are financial.
end of Budget year
Net worth Assets minus liabilities
Net debt The stock of selected financial liabilities less selected financial assets. It is one measure of the financial position of the State
How to Read the Budget Papers
xviii How to Read the Budget Papers
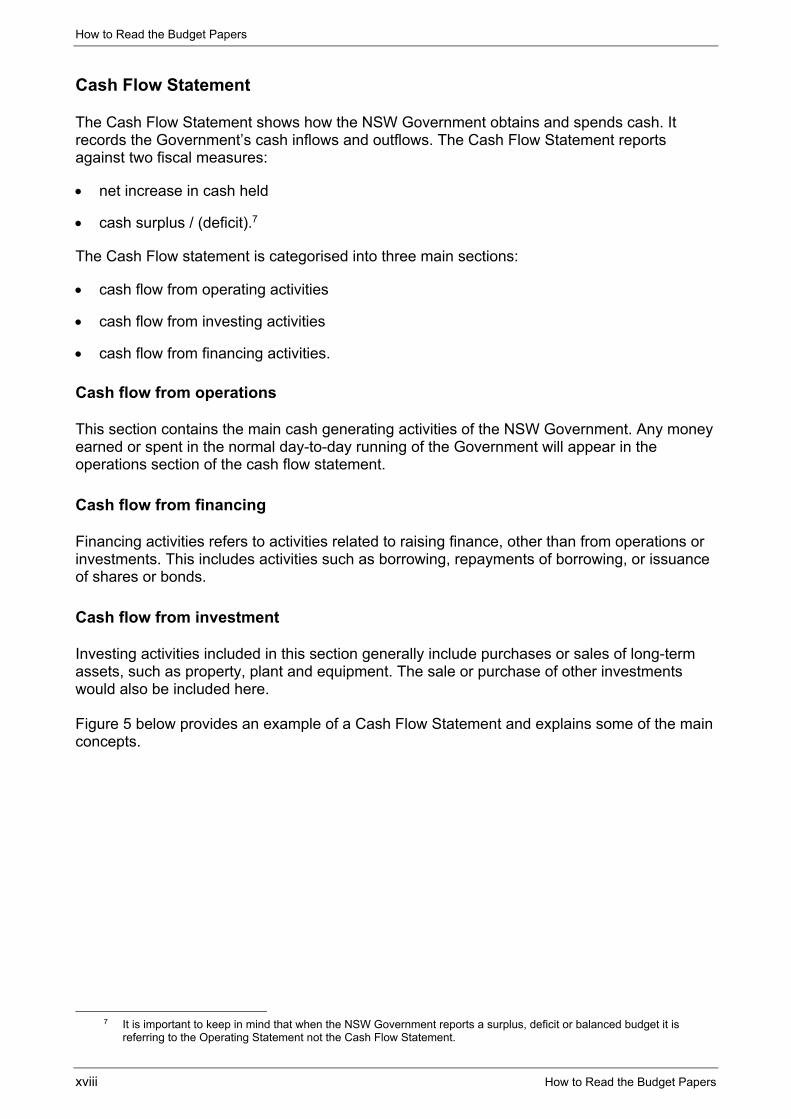
Cash Flow Statement
The Cash Flow Statement shows how the NSW Government obtains and spends cash. It records the Government’s cash inflows and outflows. The Cash Flow Statement reports against two fiscal measures:
net increase in cash held
cash surplus / (deficit).7
The Cash Flow statement is categorised into three main sections:
cash flow from operating activities
cash flow from investing activities
cash flow from financing activities.
Cash flow from operations
This section contains the main cash generating activities of the NSW Government. Any money earned or spent in the normal day-to-day running of the Government will appear in the operations section of the cash flow statement.
Cash flow from financing
Financing activities refers to activities related to raising finance, other than from operations or investments. This includes activities such as borrowing, repayments of borrowing, or issuance of shares or bonds.
Cash flow from investment
Investing activities included in this section generally include purchases or sales of long-term assets, such as property, plant and equipment. The sale or purchase of other investments would also be included here.
Figure 5 below provides an example of a Cash Flow Statement and explains some of the main concepts.
7 It is important to keep in mind that when the NSW Government reports a surplus, deficit or balanced budget it is
referring to the Operating Statement not the Cash Flow Statement.
How to Read the Budget Papers
How to Read the Budget Papers xix
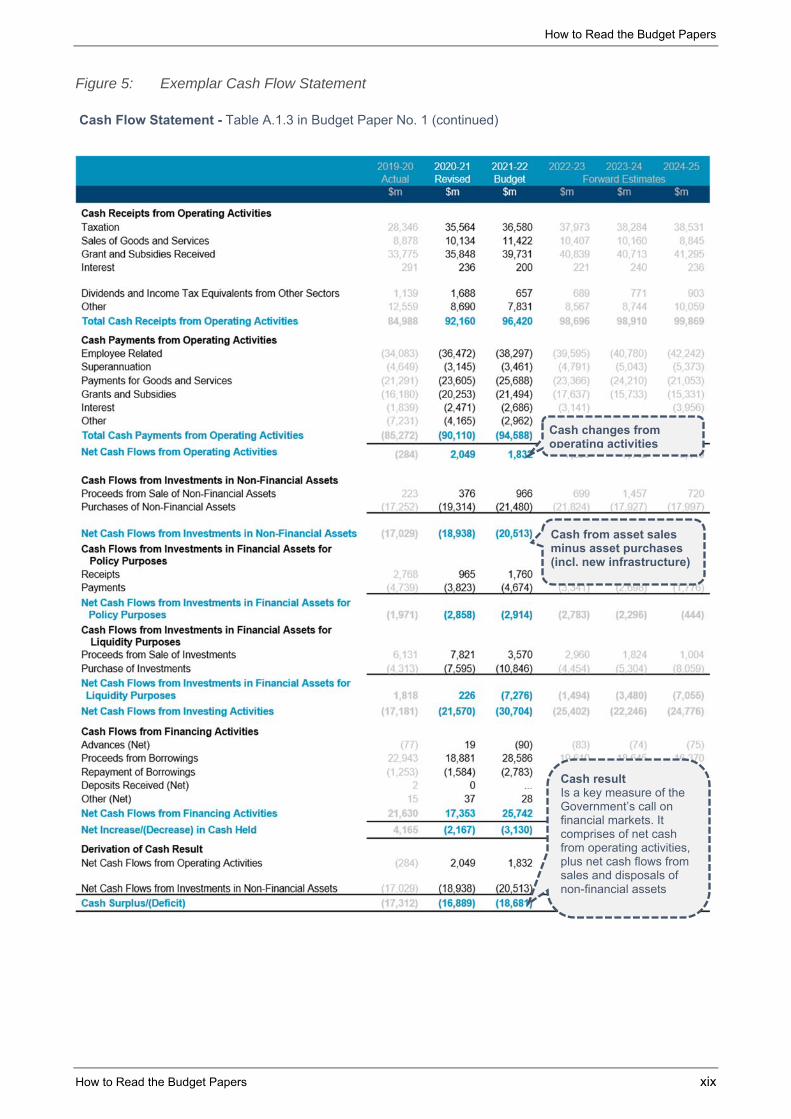
Figure 5: Exemplar Cash Flow Statement
Cash Flow Statement - Table A.1.3 in Budget Paper No. 1 (continued)
Cash changes from operating activities
Cash from asset sales minus asset purchases (incl. new infrastructure)
Cash result Is a key measure of the Government’s call on financial markets. It comprises of net cash from operating activities, plus net cash flows from sales and disposals of non-financial assets
How to Read the Budget Papers xx
STATEMENT OF SIGNIFICANT ACCOUNTING POLICIES AND FORECAST ASSUMPTIONS
Scope of the Actual Financial Statements and Estimated Financial Statements for the General Government Sector
This Statement of Significant Accounting Policies and Forecast Assumptions applies to the actual and estimated financial statements of the general government sector (GGS) for the 2021-22 Budget publications.
The GGS comprises government agencies controlled by the State that:
undertake regulatory functions
redistribute income and wealth
provide or distribute goods and services on a non-market basis to individuals and the community and/or provide other services to general government agencies.
The scope of the GGS is determined in accordance with the principles and rules contained in the Australian Bureau of Statistics, Australian System of Government Finance Statistics: Concepts, Sources and Methods 2015 (cat. No. 5514) (ABS-GFS Manual).
The Financial Statements of the GGS include:
the GGS operating statement
the GGS balance sheet
the GGS cash flow statement.
The Financial Statements for the GGS include:
the Actual Financial Statements for the GGS for the financial years ending 30 June 2020
the revised budget estimates for the GGS for the current year ending 30 June 2021
the Estimated Financial Statements for the GGS for the budget year ending 30 June 2022 and three forward years ending 30 June 2023, 2024 and 2025.
Basis of preparation
The GGS Actual and Estimated Financial Statements are prepared using the accrual basis of accounting. This basis recognises the effect of transactions and events when they are forecast to occur.
How to Read the Budget Papers
How to Read the Budget Papers xxi
The GGS Actual Financial Statements
The actual results for 2019-20 reflect the audited financial statements for the GGS as presented in the Total State Sector Accounts 2019-20.
The following new accounting standards were adopted for the first time in the Total State Sector Accounts 2019-20:
AASB 15 Revenue from Contracts with Customers
AASB 16 Leases
AASB 1058 Income of Not-for-Profit Entities.
Please refer to the Total State Sector Accounts 2019-20 for more information on the impact from the adoption of these standards.
The GGS Estimated Financial Statements
The GGS Estimated Financial Statements are prepared in accordance with this Statement of Significant Accounting Policies and Forecast Assumptions and include:
revised estimates for the current budget year ending 30 June 2021
estimates for the budget year ending 30 June 2022
estimates for the three forward years ending 30 June 2023, 2024 and 2025.
The GGS 2020-21 revised estimates are based on the following information provided by agencies:
actual results for the 10-month period ending 30 April 2021
updated year end projections.
The GGS Estimated Financial Statements for the budget and forward years are prepared to reflect existing operations and the impact of new policy decisions taken by the NSW Government, where their financial effect can be reliably estimated.
They take into account other economic and financial data available to Treasury up to 15 June 2021, including Commonwealth Government funding decisions announced in the 2021-22 Commonwealth Government Budget.
In keeping with these principles, where the impact of a policy decision or planned event cannot be reliably estimated, the impact is not reflected within the GGS Estimated Financial Statements (e.g. due to uncertainties regarding the timing and amount of future cash flows).
Additionally, they do not include the impact of major asset transactions until they are finalised. The estimated financial impact of these future planned discontinuing operations or restructuring transactions are not recognised due to their commercial-in-confidence nature.
How to Read the Budget Papers
xxii How to Read the Budget Papers
In the GGS Estimated Financial Statements, any estimates or assumptions made in measuring revenue, expenses, other economic flows, assets or liabilities are based on:
the latest information available at the time
professional judgements derived from experience
other factors considered to be reasonable under the circumstances.
Actual results may differ from such estimates. Key assumptions are detailed below in the sections: Material economic assumptions and Summary of other key assumptions.
Accounting policies
Australian Accounting Standards (AAS) do not include requirements for, or provide guidance on, the preparation or presentation of prospective financial information, such as that included in the GGS Estimated Financial Statements. However, recognition and measurement principles within AAS have been applied in the presentation of the GGS Estimated Financial Statements to the maximum extent possible.
The GGS Estimated Financial Statements, except for the revised estimates, adopt the accounting policies expected to be used in preparing the Total State Sector Accounts for 2021-22. The revised estimates have been prepared in accordance with the accounting policies expected to be used in preparing the Total State Sector Accounts for 2020-21.
The GGS Estimated Financial Statements have been prepared consistently with the GGS Actual Financial Statements, except for the matters described below under Changes in accounting policies.
The significant accounting policies (including the principles of consolidation), significant accounting judgements and estimates, and the recognition and measurement policies for revenue, expenses, other economic flows, assets and liabilities are outlined within Note 1 Statement of Significant Accounting Policies in the Total State Sector Accounts 2019-20.
The GGS Actual Financial Statements reflect the audited financial statements for the GGS as presented in the Total State Sector Accounts 2019-20.
The Government Sector Finance Act 2018 (GSF Act) does not require that the presentation of prior years’ Actual Financial Statements to be restated to include the impacts of the adoption of new accounting standards.
Changes in accounting policies
Changes in Australian Accounting Standards (AAS) are taken into account when preparing the GGS Estimated Financial Statements.
For periods commencing 1 July 2020, changes include:
application of the new accounting standard AASB 1059 Service Concession Arrangements: Grantors (AASB 1059) for the 2020-21 estimates and beyond
repeal of the accounting policy TPP 06-8 Privately Financed Projects (TPP 06-8), effective for the 2020-21 estimates and beyond.
How to Read the Budget Papers
How to Read the Budget Papers xxiii
There are no other significant changes to AAS or accounting policies in 2021-22 that materially impact the GGS Estimated Financial Statements.
AASB 1059 Service Concession Arrangements: Grantors
The accounting standard AASB 1059 applies to service concession arrangements. These are arrangements where an operator uses a service concession asset to provide a public service on behalf of the State.
Where an arrangement is within the scope of the standard, AASB 1059 requires service concession assets to be recognised from the start of the arrangement or over the construction period, with a corresponding liability to reflect any payments due to the operator, and/or where the State has granted to the operator a right to charge users of the asset.
Previously, under TPP 06-8 Privately Financed Projects (TPP 06-8), most service concession arrangements in New South Wales were generally treated as leases or as assets gradually recognised over the concession period. Following adoption of AASB 1059, TPP 06-8 was withdrawn. Arrangements previously accounted for under TPP 06-08 will be accounted for under AASB 1059 or other applicable accounting standards.
AASB 1059 has a different scope than TPP 06-8, possibly resulting in more arrangements being recognised in the State’s balance sheet, such as those arrangements previously classified as emerging rights to receive.
For the purposes of the GGS Estimated Financial Statements, AASB 1059 has been applied in preparing the estimates for the revised budget year ending 30 June 2021 as well as the budget year ending 30 June 2022 and three forward years ending 30 June 2023, 2024 and 2025. The GGS 2019-20 Actual Financial Statements do not reflect the impact of the adoption of AASB 1059.
Withdrawal of TPP 06-8 Privately Financed Projects
TPP 06-8 has been withdrawn alongside the introduction of AASB 1059. Some arrangements previously accounted for under TPP 06-08 will not fall within the scope of AASB 1059. The GGS 2019-20 Actual Financial Statements do not reflect the impact of withdrawing TPP 06-08.
New Accounting Standards issued but not effective
There are no standards that are issued and not yet effective, or that have been adopted early, that are expected to have a material impact on the GGS Estimated Financial Statements.
Presentation of the GGS Estimated Financial Statements
The Statement of Finances follows the presentation requirements for GGS reporting contained in AASB 1049 Whole of Government and General Government Sector Financial Reporting (AASB 1049).
This accounting standard harmonises Generally Accepted Accounting Principles (GAAP) with Government Financial Statistics (GFS) principles in accordance with the GFS framework adopted by the Australian Bureau of Statistics (ABS).
The net operating balance (that is, the Budget Result) presented in accordance with AASB 1049 is the net result of harmonised GFS-GAAP transactions for the GGS.
How to Read the Budget Papers
xxiv How to Read the Budget Papers
AASB 1049 requirements include:
The statement of comprehensive income (referred to as the operating statement) classifies amounts into transactions or other economic flows, in order to be consistent with GFS principles, applied from a GAAP perspective.
In the operating statement:
- the net operating balance is the net result of revenue and expenses from transactions. Transactions are the result of mutually agreed interactions between parties. This excludes other economic flows, that represent changes in the volume or value of assets or liabilities that do not arise from transactions with other entities (and which are often outside the control of government)
- the operating result includes the net operating balance and certain other economic flows. It is the same under both the harmonised GFS-GAAP and pure GAAP presentations.
The GGS financial statements adopt the recognition, measurement and disclosure requirements of GAAP, consistent with the following principles in AASB 1049:
where options exist in GAAP, the GGS financial statements adopt the option that is aligned with GFS, to minimise differences between GAAP and GFS and/or
where only one approach is allowed in GAAP and there is conflict between GAAP and GFS, GAAP prevails.
Due to the prospective nature of the GGS Estimated Financial Statements, detailed notes to the GGS Estimated Financial Statements are not required to be included. This is consistent with Section 4.2 of the Government Sector Finance Act 2018.
Each year ends on 30 June, all monetary amounts are presented in Australian dollars and rounded to the nearest million dollars ($m).
Use of a zero (“0”) represents amounts rounded to zero. Use of three dots (“…”) represents nil amounts.
Tables may not add in all instances due to rounding to the nearest million dollars.
Presentation changes
There have been no significant presentation changes since the release of the 2020-21 Budget Papers. The presentation of information in the financial estimates remains consistent with GAAP and GFS presentation requirements.
Definitions
Key technical terms, including fiscal aggregates, are defined in the Glossary to this document and Note 38 of the Total State Sector Accounts 2019-20.
How to Read the Budget Papers
How to Read the Budget Papers xxv
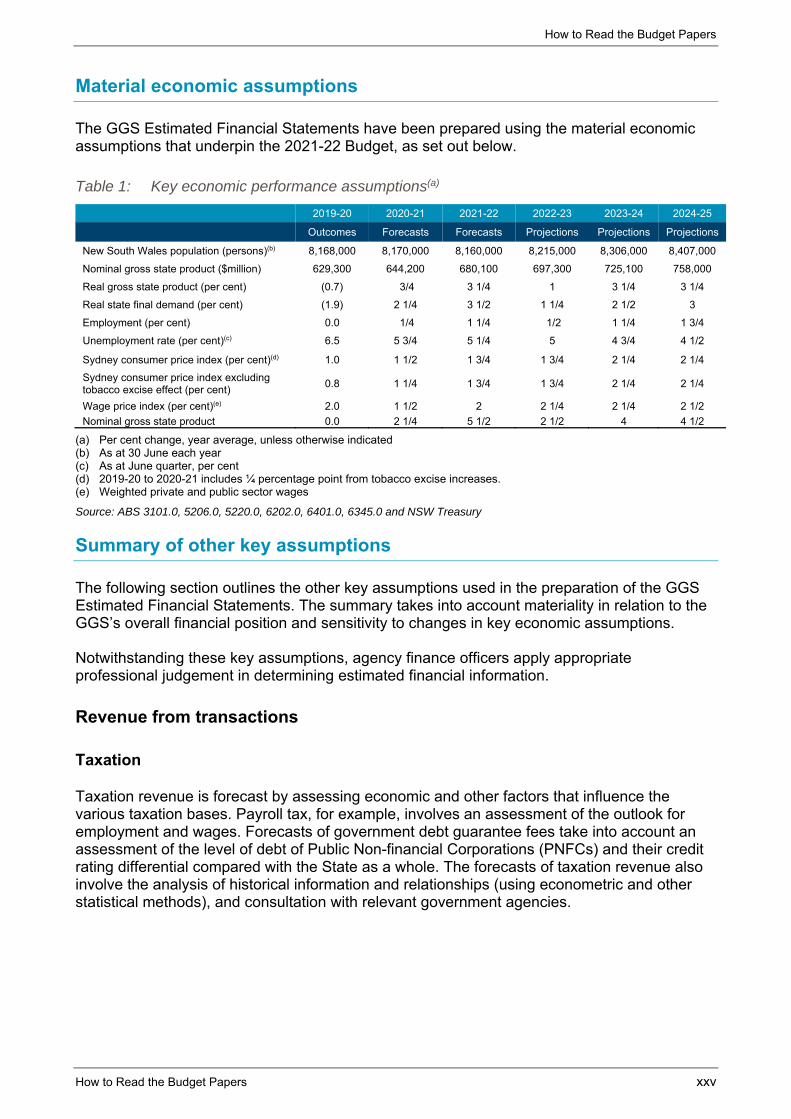
Material economic assumptions
The GGS Estimated Financial Statements have been prepared using the material economic assumptions that underpin the 2021-22 Budget, as set out below.
Table 1: Key economic performance assumptions(a)
2019-20 2020-21 2021-22 2022-23 2023-24 2024-25
Outcomes Forecasts Forecasts Projections Projections Projections
New South Wales population (persons)(b) 8,168,000 8,170,000 8,160,000 8,215,000 8,306,000 8,407,000
Nominal gross state product ($million) 629,300 644,200 680,100 697,300 725,100 758,000
Real gross state product (per cent) (0.7) 3/4 3 1/4 1 3 1/4 3 1/4
Real state final demand (per cent) (1.9) 2 1/4 3 1/2 1 1/4 2 1/2 3
Employment (per cent) 0.0 1/4 1 1/4 1/2 1 1/4 1 3/4
Unemployment rate (per cent)(c) 6.5 5 3/4 5 1/4 5 4 3/4 4 1/2
Sydney consumer price index (per cent)(d) 1.0 1 1/2 1 3/4 1 3/4 2 1/4 2 1/4
Sydney consumer price index excluding tobacco excise effect (per cent)
0.8 1 1/4 1 3/4 1 3/4 2 1/4 2 1/4
Wage price index (per cent)(e) 2.0 1 1/2 2 2 1/4 2 1/4 2 1/2
Nominal gross state product 0.0 2 1/4 5 1/2 2 1/2 4 4 1/2
(a) Per cent change, year average, unless otherwise indicated (b) As at 30 June each year (c) As at June quarter, per cent (d) 2019-20 to 2020-21 includes ¼ percentage point from tobacco excise increases. (e) Weighted private and public sector wages
Source: ABS 3101.0, 5206.0, 5220.0, 6202.0, 6401.0, 6345.0 and NSW Treasury
Summary of other key assumptions
The following section outlines the other key assumptions used in the preparation of the GGS Estimated Financial Statements. The summary takes into account materiality in relation to the GGS’s overall financial position and sensitivity to changes in key economic assumptions.
Notwithstanding these key assumptions, agency finance officers apply appropriate professional judgement in determining estimated financial information.
Revenue from transactions
Taxation
Taxation revenue is forecast by assessing economic and other factors that influence the various taxation bases. Payroll tax, for example, involves an assessment of the outlook for employment and wages. Forecasts of government debt guarantee fees take into account an assessment of the level of debt of Public Non-financial Corporations (PNFCs) and their credit rating differential compared with the State as a whole. The forecasts of taxation revenue also involve the analysis of historical information and relationships (using econometric and other statistical methods), and consultation with relevant government agencies.
How to Read the Budget Papers
xxvi How to Read the Budget Papers
Grants and subsidies revenue
Forecast grants from the Commonwealth Government are based on the latest available information from the Commonwealth Government and projections of timing of payments at the time of preparation of the Budget. This takes into account the conditions, payment timetable, escalation factors relevant to each type of grant and, where relevant, estimated progress against grant obligations.
Goods and Services Tax (GST) grants are forecast based on estimates of the national GST pool by New South Wales Treasury. For 2021-22, the GST forecast is based on the assessed relativity for New South Wales in 2021-22 and the Commonwealth Government’s population projections. The assessed relativity is based on the three-year average of actual data (2017-18, 2018 -19 and 2019-20) as published by the Commonwealth Grants Commission.
Beyond 2021-22, the State’s share of GST is based on New South Wales Treasury’s forecast relativities, national GST pool estimates and the Commonwealth’s state populations projections. The forecast per capita annual relativities are based on the projected fiscal capacity of New South Wales compared with other states and territories.
Sale of goods and services
Revenue from the sale of goods and services is forecast by taking into account all known factors, including:
estimates of changes in demand for services provided
expected unit price variations based on proposed fee increases imposed by general government agencies and/or indexation.
Dividend and income tax equivalents from other sectors
Dividend and income tax equivalent revenue from other sectors are estimated by the PNFC and Public Financial Corporations (PFC) sectors. They are based on expected profitability and the agreed dividend policy at the time of the Budget.
Other dividends and distributions
Other dividends include estimates of dividends to be received from investments in entities other than the PNFC and PFC sectors, with the revenue recognised when the right to receive payment is expected to be established. Estimates are based on advice from external parties.
Distributions are mainly from managed fund investments administered by TCorp, with the revenue recognised when the right to receive payment is expected to be established based on advice from TCorp. It excludes estimated fair value movements in the unit price of the investments, which are recognised as ‘other economic flows – included in the operating result’.
How to Read the Budget Papers
How to Read the Budget Papers xxvii
Fines, regulatory fees and other revenues
Fines, regulatory fees and other revenues include estimates of fines issued by the courts, estimated traffic infringement fines, estimated revenue from enforcement orders and regulatory fees and contributions. It also includes estimated royalty revenue based on assessments of coal volumes and prices and the Australian dollar exchange rate. Other revenue forecasts are adjusted for indexation where appropriate.
Expenses from transactions
To improve the accuracy of budget estimates, consistent with longstanding practice and reflecting historic trends, the GGS Estimated Financial Statements includes adjustments:
to account for parameter and technical adjustments expected to be required to maintain service provision on a no policy change basis, reflecting the historic conservative bias in aggregate spending estimates
to account for expenses expected to be carried forward into future years reflecting changes in timing of delivery of government activity, consistent with the policy set out in Treasury Circular NSW TC 15-08 Agency Carry Forwards
to reflect government decisions not yet included in agency estimates, for example due to timing or because they are commercial in confidence or subject to further requirements.
Employee expenses
Employee expenses are forecast based on expected staffing profiles, salaries, conditions and on-costs. These can vary depending on:
approved wage agreements and other wage determinations in place;
the State’s public sector wages policy;
new initiatives; and
other policy changes.
How to Read the Budget Papers
xxviii How to Read the Budget Papers
Superannuation expense (and liabilities)
Superannuation expense comprises:
for defined contribution plans, the forecast accrued contributions for the period
for defined benefit plans, the forecast service cost and the net interest expense. This excludes the re-measurements (i.e. actuarial gains and losses and return on plan assets in excess of the long-term Commonwealth Government Securities (CGS) rate), which are classified as ‘other economic flows – other comprehensive income’.
Superannuation expenses for defined contribution plans are based on assumptions regarding future salaries and contribution rates.
Superannuation expenses for defined benefit plans are estimated based on actuarial advice, applying the long-term CGS yield as at 30 June in the prior year to the opening value of net liabilities (gross superannuation liabilities less assets), less benefit payments at the mid-point of the contribution year, plus any accruing liability for the year.
Forecasts of defined benefit superannuation liabilities are based on actuarial estimates of cash flows for the various defined benefit superannuation schemes, discounted using a nominal long-term CGS yield as at 30 June. Gross liability estimates are based on a number of demographic and financial assumptions.
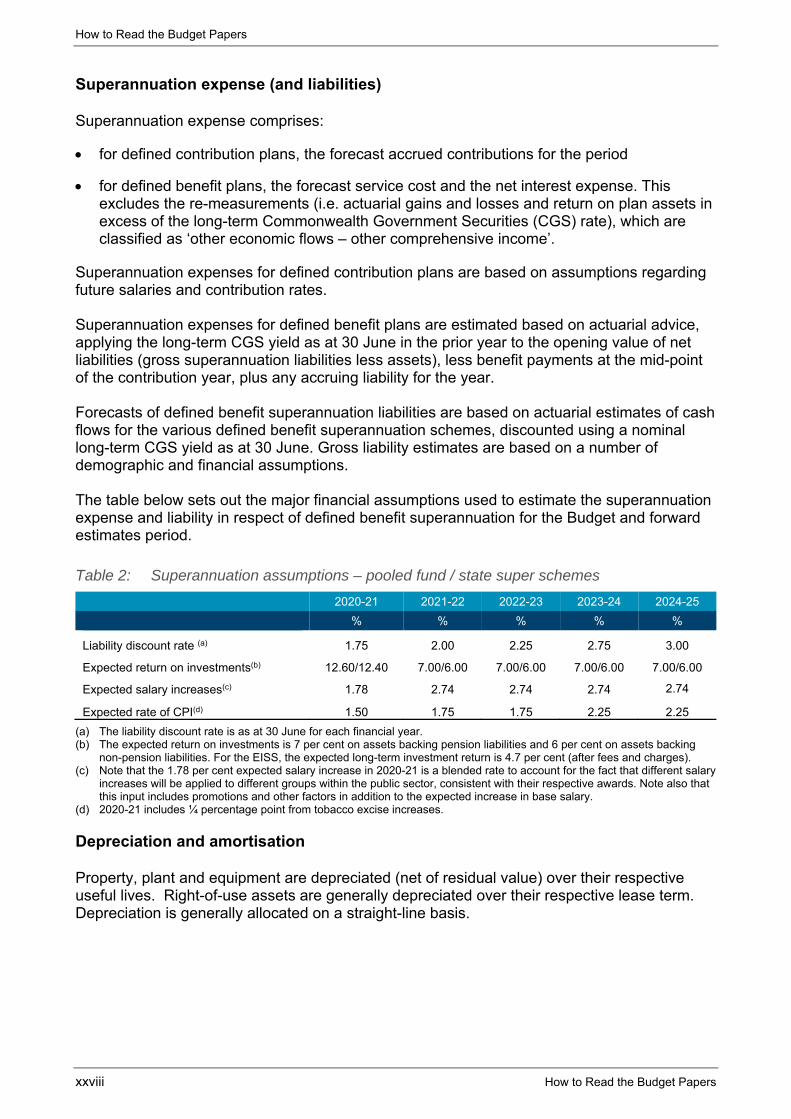
The table below sets out the major financial assumptions used to estimate the superannuation expense and liability in respect of defined benefit superannuation for the Budget and forward estimates period.
Table 2: Superannuation assumptions – pooled fund / state super schemes
2020-21 2021-22 2022-23 2023-24 2024-25
% % % % %
Liability discount rate (a) 1.75 2.00 2.25 2.75 3.00
Expected return on investments(b) 12.60/12.40 7.00/6.00 7.00/6.00 7.00/6.00 7.00/6.00
Expected salary increases(c) 1.78 2.74 2.74 2.74 2.74
Expected rate of CPI(d) 1.50 1.75 1.75 2.25 2.25
(a) The liability discount rate is as at 30 June for each financial year. (b) The expected return on investments is 7 per cent on assets backing pension liabilities and 6 per cent on assets backing
non-pension liabilities. For the EISS, the expected long-term investment return is 4.7 per cent (after fees and charges). (c) Note that the 1.78 per cent expected salary increase in 2020-21 is a blended rate to account for the fact that different salary
increases will be applied to different groups within the public sector, consistent with their respective awards. Note also that this input includes promotions and other factors in addition to the expected increase in base salary.
(d) 2020-21 includes ¼ percentage point from tobacco excise increases.
Depreciation and amortisation
Property, plant and equipment are depreciated (net of residual value) over their respective useful lives. Right-of-use assets are generally depreciated over their respective lease term. Depreciation is generally allocated on a straight-line basis.
How to Read the Budget Papers
How to Read the Budget Papers xxix
Depreciation is forecast on:
the basis of known asset valuations
the expected economic life of assets
assumed new asset investment
asset sale programs.
The depreciation expense is based on the assumption that there will be no change in depreciation rates over the forecast period but includes the estimated impact of the current and future revaluation of assets over the forecast period. The depreciation expense may also be impacted by future changes in useful lives, residual value or valuation methodology.
Certain heritage assets, including original artworks and collections and heritage buildings, may not have limited useful lives because appropriate custodial and preservation policies are adopted. Such assets are not subject to depreciation. Land is not a depreciable asset.
Intangible assets with finite lives are amortised using the straight-line method. Intangible assets with indefinite lives are not amortised but tested for impairment annually.
Interest expense
The forecasts for the interest expense are based on:
payments required on outstanding borrowings (e.g. debt facilities with NSW TCorp and lease liabilities), other long-term financial liabilities and provisions
expected payments on any new borrowings (including any refinancing of existing borrowings) required to finance general government activities based on forward contracts for TCorp bonds
the unwinding of discounts on non-employee provisions.
Other operating expenses
Other operating expenses mainly represent the day-to-day running costs incurred in the normal operations of agencies and include the cost of supplies and services. They are forecast by applying appropriate economic parameters and known activity changes. This includes planned changes in the method of service delivery and the application of government policies.
Other operating expenses also reflect the impact of government efficiency strategies, such as efficiency dividends.
Grants, subsidies and other transfers expenses
Grants, subsidies and other transfers expenses generally comprise cash contributions to local government authorities, non-government organisations and the PNFC and PFC sectors.
The forecast grant payments are determined by taking into account current and past policy decisions, the forecast payment schedules and escalation factors relevant to each type of grant.
How to Read the Budget Papers
xxx How to Read the Budget Papers
Other economic flows
Other economic flows are changes in the volume or value of an asset or liability that do not result from transactions (and which are often outside the control of government).
Revaluations
The estimates are based on an examination and extrapolation of historical trends in the valuation of property, plant and equipment. The budget and forward estimates years include the estimated impact of revaluations of property, plant and equipment.
Superannuation actuarial gains / losses
The forecast actuarial gains or losses on defined benefit superannuation liabilities are based on the revised estimates of the margin of forecast fund earnings in excess of the expected discount rate.
Net gain / (loss) on equity investments in other sectors
The net gain / (loss) on equity investments in other sectors is based on estimates of the PNFC and PFC sectors’ forward comprehensive results adjusted for transactions with owners. The underlying management estimates of future comprehensive results are based on current Statements of Corporate Intent. Future distributions to equity holders are based on Treasury’s Commercial Policy Framework.
Net acquisition of non-financial assets
This is purchases (or acquisitions) less sales (or disposals) of non-financial assets less depreciation, plus changes in inventory and other movements in non-financial assets. Purchases and sales of non-financial assets generally include accrued expenses and payables for capital items. Other movements in non-financial assets include non-cash capital grant revenue/expense such as assets contributed by developers.
Assets
Property, plant and equipment
The estimates of property, plant and equipment over the forecast period are at fair value and take into account planned acquisitions, disposals, and the impact of depreciation, impairment and revaluations. New investments in assets are valued at the forecast purchase price and, where appropriate, recognised progressively over the estimated construction period.
Right-of-use assets are based on the State’s best estimate of the timing of renewals of lease arrangements and the impact of depreciation.
The adoption of AASB 1059 from 1 July 2020 resulted in the recognition of service concession assets, which includes newly recognised assets and reclassification of existing assets previously classified as emerging assets or leased assets in previous years’ financial reports.
The forward estimates include the estimated impact of revaluations of property, plant and equipment. These estimates are based on an examination of expected cost trends.
How to Read the Budget Papers
How to Read the Budget Papers xxxi
To improve the accuracy of budget estimates, consistent with longstanding practice and reflecting historic trends, the Budget includes adjustments:
to account for capital expenses expected to be carried forward into future years reflecting changes in timing of delivery of government activity, consistent with the policy set out in Treasury Circular NSW TC 15-08
to reflect government decisions on capital expenditure that are not yet included in agency estimates, for example due to timing, because they are commercial in confidence or subject to further requirements.
Liabilities
Borrowings
Estimates for borrowings are based on current debt levels (including lease liabilities), amortisation of any premiums or discounts, and the cash flows expected to be required to fund future government activities.
Employee provisions
Employee provisions are forecast based on estimated future cash outflows to settle employees’ entitlements, such as unused long service leave, annual leave.
Superannuation provisions
Refer to section: Superannuation expense (and liabilities) above for information on assumptions that also impact the measurement of the superannuation provisions.
Other provisions
Other provisions include the State’s obligations for several insurance schemes. To estimate future claim liabilities, actuarial assumptions have been applied for future claims to be incurred, claim payments, inflation and liability discount rates. Actual liabilities may differ from estimates.
How to Read the Budget Papers
xxxii How to Read the Budget Papers
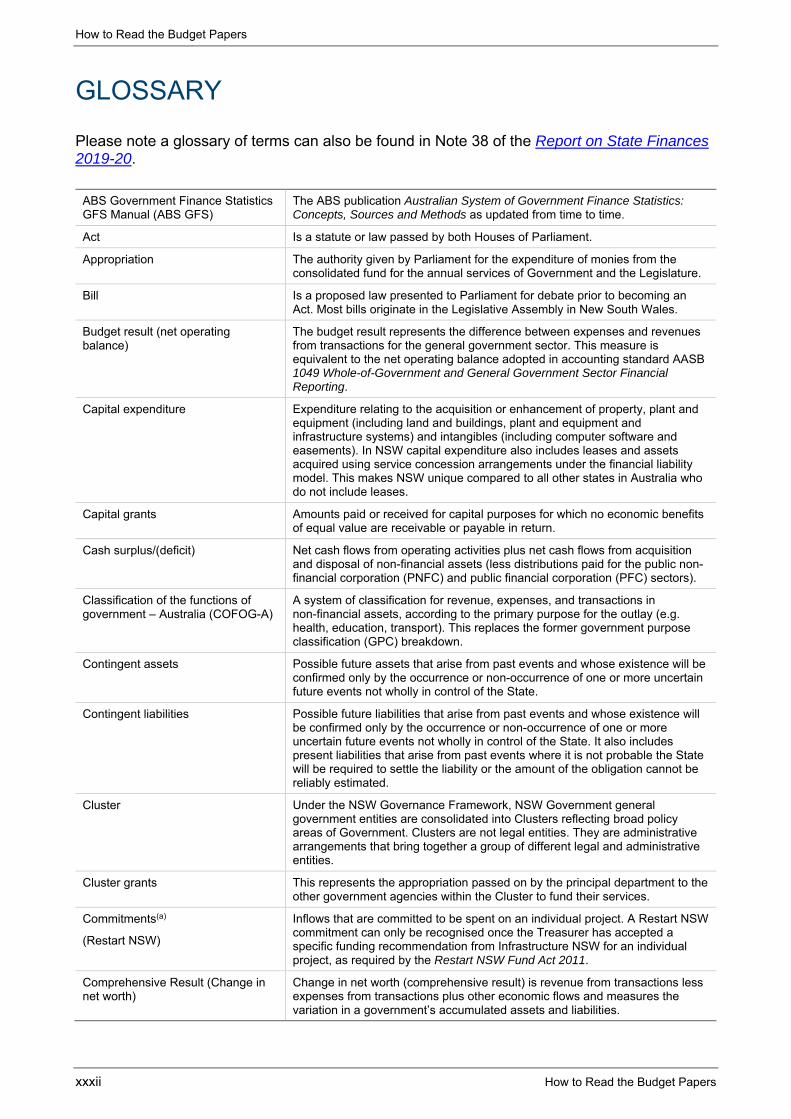
GLOSSARY
Please note a glossary of terms can also be found in Note 38 of the Report on State Finances 2019-20.
ABS Government Finance Statistics GFS Manual (ABS GFS)
The ABS publication Australian System of Government Finance Statistics: Concepts, Sources and Methods as updated from time to time.
Act Is a statute or law passed by both Houses of Parliament.
Appropriation The authority given by Parliament for the expenditure of monies from the consolidated fund for the annual services of Government and the Legislature.
Bill Is a proposed law presented to Parliament for debate prior to becoming an Act. Most bills originate in the Legislative Assembly in New South Wales.
Budget result (net operating balance)
The budget result represents the difference between expenses and revenues from transactions for the general government sector. This measure is equivalent to the net operating balance adopted in accounting standard AASB 1049 Whole-of-Government and General Government Sector Financial Reporting.
Capital expenditure Expenditure relating to the acquisition or enhancement of property, plant and equipment (including land and buildings, plant and equipment and infrastructure systems) and intangibles (including computer software and easements). In NSW capital expenditure also includes leases and assets acquired using service concession arrangements under the financial liability model. This makes NSW unique compared to all other states in Australia who do not include leases.
Capital grants Amounts paid or received for capital purposes for which no economic benefits of equal value are receivable or payable in return.
Cash surplus/(deficit) Net cash flows from operating activities plus net cash flows from acquisition and disposal of non-financial assets (less distributions paid for the public non-financial corporation (PNFC) and public financial corporation (PFC) sectors).
Classification of the functions of government – Australia (COFOG-A)
A system of classification for revenue, expenses, and transactions in non-financial assets, according to the primary purpose for the outlay (e.g. health, education, transport). This replaces the former government purpose classification (GPC) breakdown.
Contingent assets Possible future assets that arise from past events and whose existence will be confirmed only by the occurrence or non-occurrence of one or more uncertain future events not wholly in control of the State.
Contingent liabilities Possible future liabilities that arise from past events and whose existence will be confirmed only by the occurrence or non-occurrence of one or more uncertain future events not wholly in control of the State. It also includes present liabilities that arise from past events where it is not probable the State will be required to settle the liability or the amount of the obligation cannot be reliably estimated.
Cluster Under the NSW Governance Framework, NSW Government general government entities are consolidated into Clusters reflecting broad policy areas of Government. Clusters are not legal entities. They are administrative arrangements that bring together a group of different legal and administrative entities.
Cluster grants This represents the appropriation passed on by the principal department to the other government agencies within the Cluster to fund their services.
Commitments(a)
(Restart NSW)
Inflows that are committed to be spent on an individual project. A Restart NSW commitment can only be recognised once the Treasurer has accepted a specific funding recommendation from Infrastructure NSW for an individual project, as required by the Restart NSW Fund Act 2011.
Comprehensive Result (Change in net worth)
Change in net worth (comprehensive result) is revenue from transactions less expenses from transactions plus other economic flows and measures the variation in a government’s accumulated assets and liabilities.
How to Read the Budget Papers
How to Read the Budget Papers xxxiii
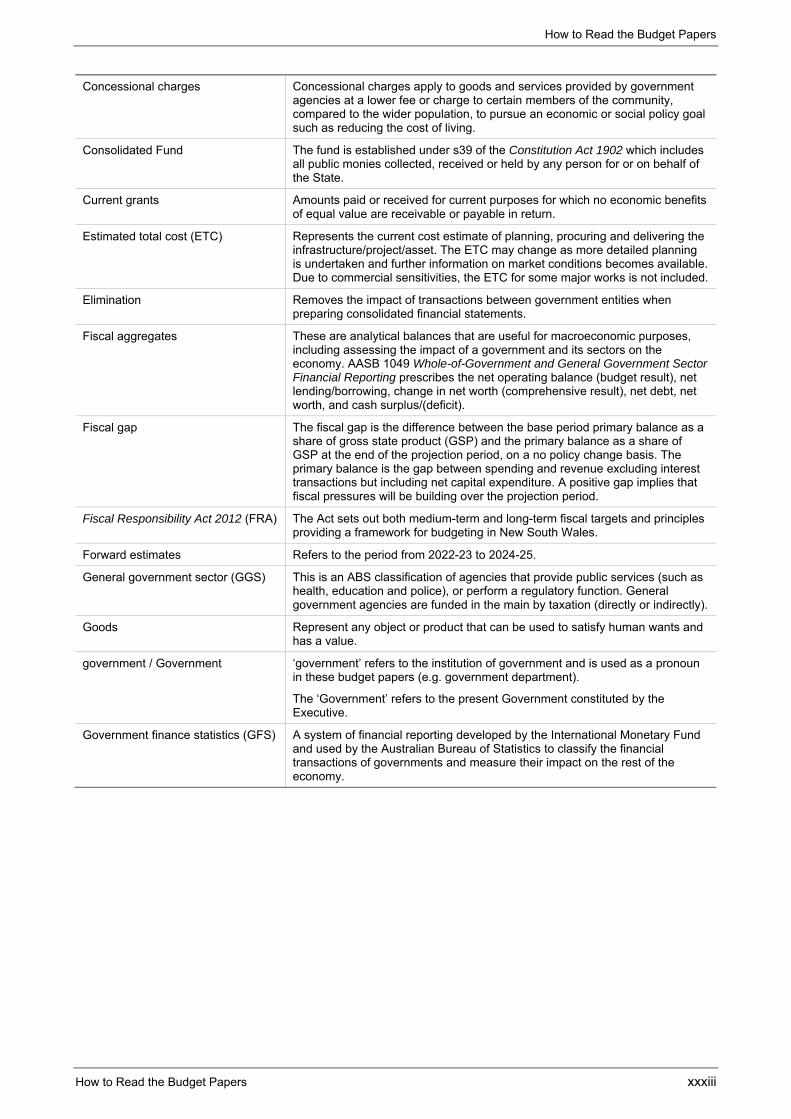
Concessional charges Concessional charges apply to goods and services provided by government agencies at a lower fee or charge to certain members of the community, compared to the wider population, to pursue an economic or social policy goal such as reducing the cost of living.
Consolidated Fund The fund is established under s39 of the Constitution Act 1902 which includes all public monies collected, received or held by any person for or on behalf of the State.
Current grants Amounts paid or received for current purposes for which no economic benefits of equal value are receivable or payable in return.
Estimated total cost (ETC) Represents the current cost estimate of planning, procuring and delivering the infrastructure/project/asset. The ETC may change as more detailed planning is undertaken and further information on market conditions becomes available. Due to commercial sensitivities, the ETC for some major works is not included.
Elimination Removes the impact of transactions between government entities when preparing consolidated financial statements.
Fiscal aggregates These are analytical balances that are useful for macroeconomic purposes, including assessing the impact of a government and its sectors on the economy. AASB 1049 Whole-of-Government and General Government Sector Financial Reporting prescribes the net operating balance (budget result), net lending/borrowing, change in net worth (comprehensive result), net debt, net worth, and cash surplus/(deficit).
Fiscal gap The fiscal gap is the difference between the base period primary balance as a share of gross state product (GSP) and the primary balance as a share of GSP at the end of the projection period, on a no policy change basis. The primary balance is the gap between spending and revenue excluding interest transactions but including net capital expenditure. A positive gap implies that fiscal pressures will be building over the projection period.
Fiscal Responsibility Act 2012 (FRA) The Act sets out both medium-term and long-term fiscal targets and principles providing a framework for budgeting in New South Wales.
Forward estimates Refers to the period from 2022-23 to 2024-25.
General government sector (GGS) This is an ABS classification of agencies that provide public services (such as health, education and police), or perform a regulatory function. General government agencies are funded in the main by taxation (directly or indirectly).
Goods Represent any object or product that can be used to satisfy human wants and has a value.
government / Government ‘government’ refers to the institution of government and is used as a pronoun in these budget papers (e.g. government department).
The ‘Government’ refers to the present Government constituted by the Executive.
Government finance statistics (GFS) A system of financial reporting developed by the International Monetary Fund and used by the Australian Bureau of Statistics to classify the financial transactions of governments and measure their impact on the rest of the economy.
How to Read the Budget Papers
xxxiv How to Read the Budget Papers
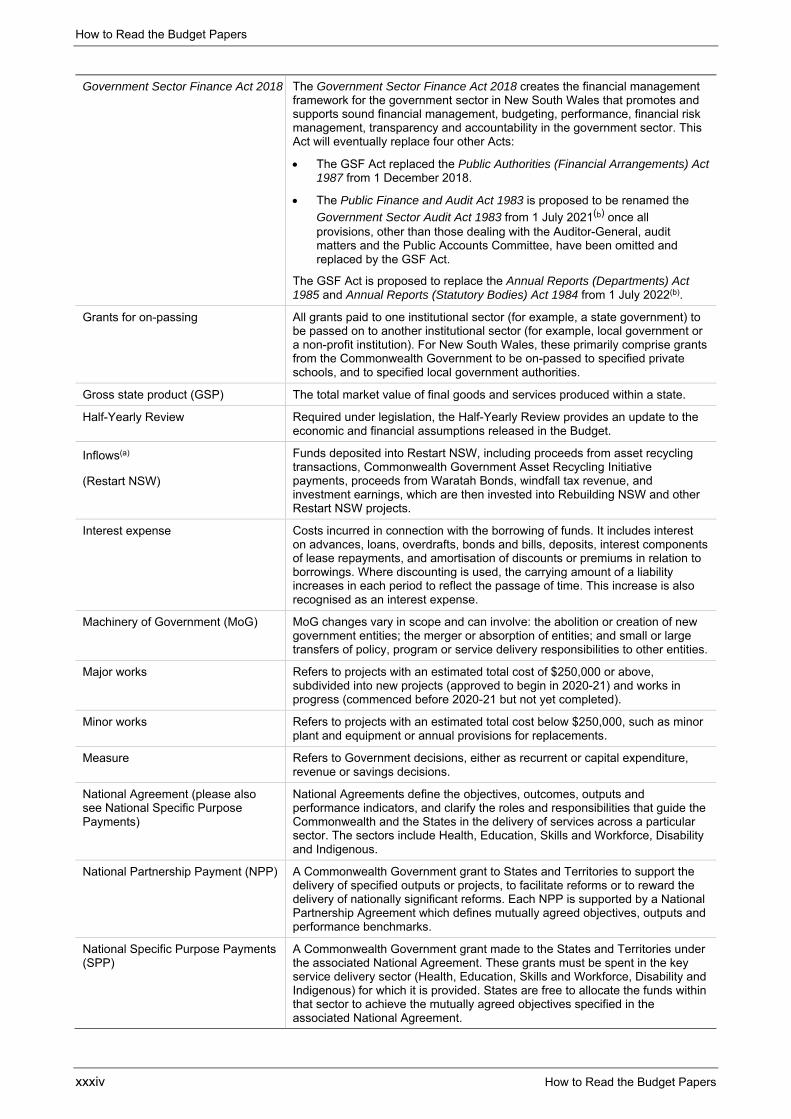
Government Sector Finance Act 2018 The Government Sector Finance Act 2018 creates the financial management framework for the government sector in New South Wales that promotes and supports sound financial management, budgeting, performance, financial risk management, transparency and accountability in the government sector. This Act will eventually replace four other Acts:
The GSF Act replaced the Public Authorities (Financial Arrangements) Act 1987 from 1 December 2018.
The Public Finance and Audit Act 1983 is proposed to be renamed the
Government Sector Audit Act 1983 from 1 July 2021(b) once all provisions, other than those dealing with the Auditor-General, audit matters and the Public Accounts Committee, have been omitted and replaced by the GSF Act.
The GSF Act is proposed to replace the Annual Reports (Departments) Act 1985 and Annual Reports (Statutory Bodies) Act 1984 from 1 July 2022(b).
Grants for on-passing All grants paid to one institutional sector (for example, a state government) to be passed on to another institutional sector (for example, local government or a non-profit institution). For New South Wales, these primarily comprise grants from the Commonwealth Government to be on-passed to specified private schools, and to specified local government authorities.
Gross state product (GSP) The total market value of final goods and services produced within a state.
Half-Yearly Review Required under legislation, the Half-Yearly Review provides an update to the economic and financial assumptions released in the Budget.
Inflows(a)
(Restart NSW)
Funds deposited into Restart NSW, including proceeds from asset recycling transactions, Commonwealth Government Asset Recycling Initiative payments, proceeds from Waratah Bonds, windfall tax revenue, and investment earnings, which are then invested into Rebuilding NSW and other Restart NSW projects.
Interest expense Costs incurred in connection with the borrowing of funds. It includes interest on advances, loans, overdrafts, bonds and bills, deposits, interest components of lease repayments, and amortisation of discounts or premiums in relation to borrowings. Where discounting is used, the carrying amount of a liability increases in each period to reflect the passage of time. This increase is also recognised as an interest expense.
Machinery of Government (MoG) MoG changes vary in scope and can involve: the abolition or creation of new government entities; the merger or absorption of entities; and small or large transfers of policy, program or service delivery responsibilities to other entities.
Major works Refers to projects with an estimated total cost of $250,000 or above, subdivided into new projects (approved to begin in 2020-21) and works in progress (commenced before 2020-21 but not yet completed).
Minor works Refers to projects with an estimated total cost below $250,000, such as minor plant and equipment or annual provisions for replacements.
Measure Refers to Government decisions, either as recurrent or capital expenditure, revenue or savings decisions.
National Agreement (please also see National Specific Purpose Payments)
National Agreements define the objectives, outcomes, outputs and performance indicators, and clarify the roles and responsibilities that guide the Commonwealth and the States in the delivery of services across a particular sector. The sectors include Health, Education, Skills and Workforce, Disability and Indigenous.
National Partnership Payment (NPP) A Commonwealth Government grant to States and Territories to support the delivery of specified outputs or projects, to facilitate reforms or to reward the delivery of nationally significant reforms. Each NPP is supported by a National Partnership Agreement which defines mutually agreed objectives, outputs and performance benchmarks.
National Specific Purpose Payments (SPP)
A Commonwealth Government grant made to the States and Territories under the associated National Agreement. These grants must be spent in the key service delivery sector (Health, Education, Skills and Workforce, Disability and Indigenous) for which it is provided. States are free to allocate the funds within that sector to achieve the mutually agreed objectives specified in the associated National Agreement.
How to Read the Budget Papers
How to Read the Budget Papers xxxv
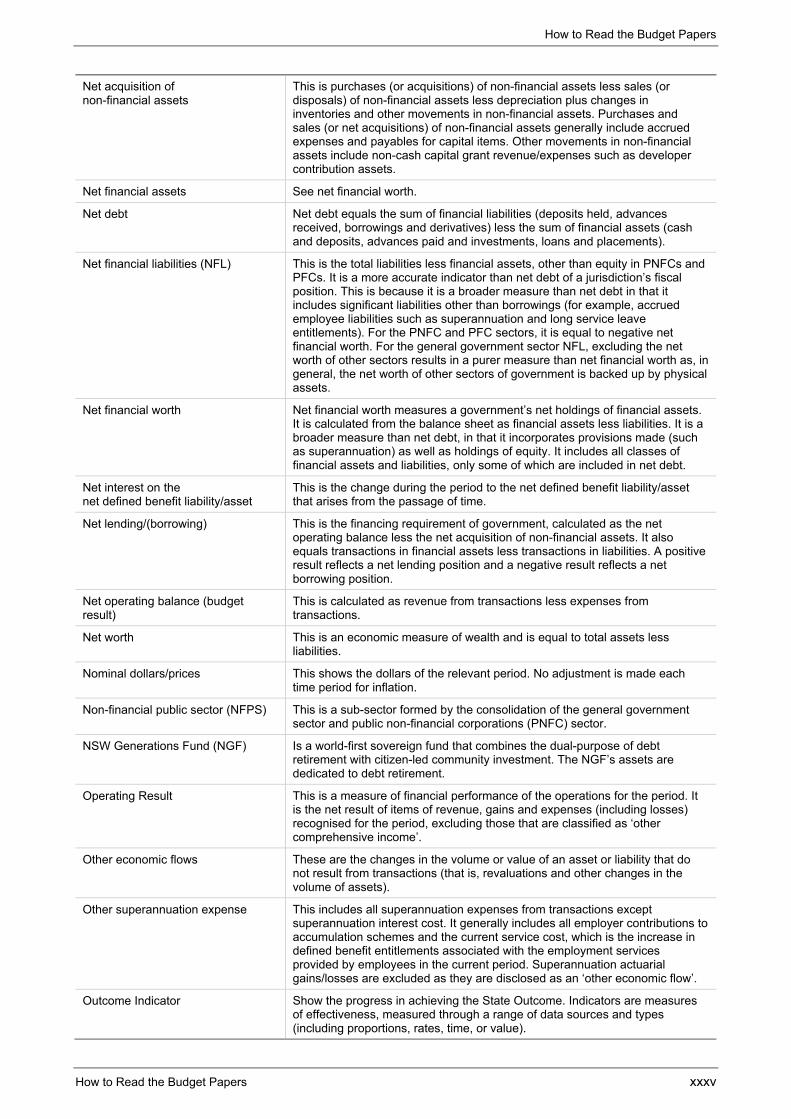
Net acquisition of non-financial assets
This is purchases (or acquisitions) of non-financial assets less sales (or disposals) of non-financial assets less depreciation plus changes in inventories and other movements in non-financial assets. Purchases and sales (or net acquisitions) of non-financial assets generally include accrued expenses and payables for capital items. Other movements in non-financial assets include non-cash capital grant revenue/expenses such as developer contribution assets.
Net financial assets See net financial worth.
Net debt Net debt equals the sum of financial liabilities (deposits held, advances received, borrowings and derivatives) less the sum of financial assets (cash and deposits, advances paid and investments, loans and placements).
Net financial liabilities (NFL) This is the total liabilities less financial assets, other than equity in PNFCs and PFCs. It is a more accurate indicator than net debt of a jurisdiction’s fiscal position. This is because it is a broader measure than net debt in that it includes significant liabilities other than borrowings (for example, accrued employee liabilities such as superannuation and long service leave entitlements). For the PNFC and PFC sectors, it is equal to negative net financial worth. For the general government sector NFL, excluding the net worth of other sectors results in a purer measure than net financial worth as, in general, the net worth of other sectors of government is backed up by physical assets.
Net financial worth Net financial worth measures a government’s net holdings of financial assets. It is calculated from the balance sheet as financial assets less liabilities. It is a broader measure than net debt, in that it incorporates provisions made (such as superannuation) as well as holdings of equity. It includes all classes of financial assets and liabilities, only some of which are included in net debt.
Net interest on the net defined benefit liability/asset
This is the change during the period to the net defined benefit liability/asset that arises from the passage of time.
Net lending/(borrowing) This is the financing requirement of government, calculated as the net operating balance less the net acquisition of non-financial assets. It also equals transactions in financial assets less transactions in liabilities. A positive result reflects a net lending position and a negative result reflects a net borrowing position.
Net operating balance (budget result)
This is calculated as revenue from transactions less expenses from transactions.
Net worth This is an economic measure of wealth and is equal to total assets less liabilities.
Nominal dollars/prices This shows the dollars of the relevant period. No adjustment is made each time period for inflation.
Non-financial public sector (NFPS) This is a sub-sector formed by the consolidation of the general government sector and public non-financial corporations (PNFC) sector.
NSW Generations Fund (NGF) Is a world-first sovereign fund that combines the dual-purpose of debt retirement with citizen-led community investment. The NGF’s assets are dedicated to debt retirement.
Operating Result This is a measure of financial performance of the operations for the period. It is the net result of items of revenue, gains and expenses (including losses) recognised for the period, excluding those that are classified as ‘other comprehensive income’.
Other economic flows These are the changes in the volume or value of an asset or liability that do not result from transactions (that is, revaluations and other changes in the volume of assets).
Other superannuation expense This includes all superannuation expenses from transactions except superannuation interest cost. It generally includes all employer contributions to accumulation schemes and the current service cost, which is the increase in defined benefit entitlements associated with the employment services provided by employees in the current period. Superannuation actuarial gains/losses are excluded as they are disclosed as an ‘other economic flow’.
Outcome Indicator Show the progress in achieving the State Outcome. Indicators are measures of effectiveness, measured through a range of data sources and types (including proportions, rates, time, or value).
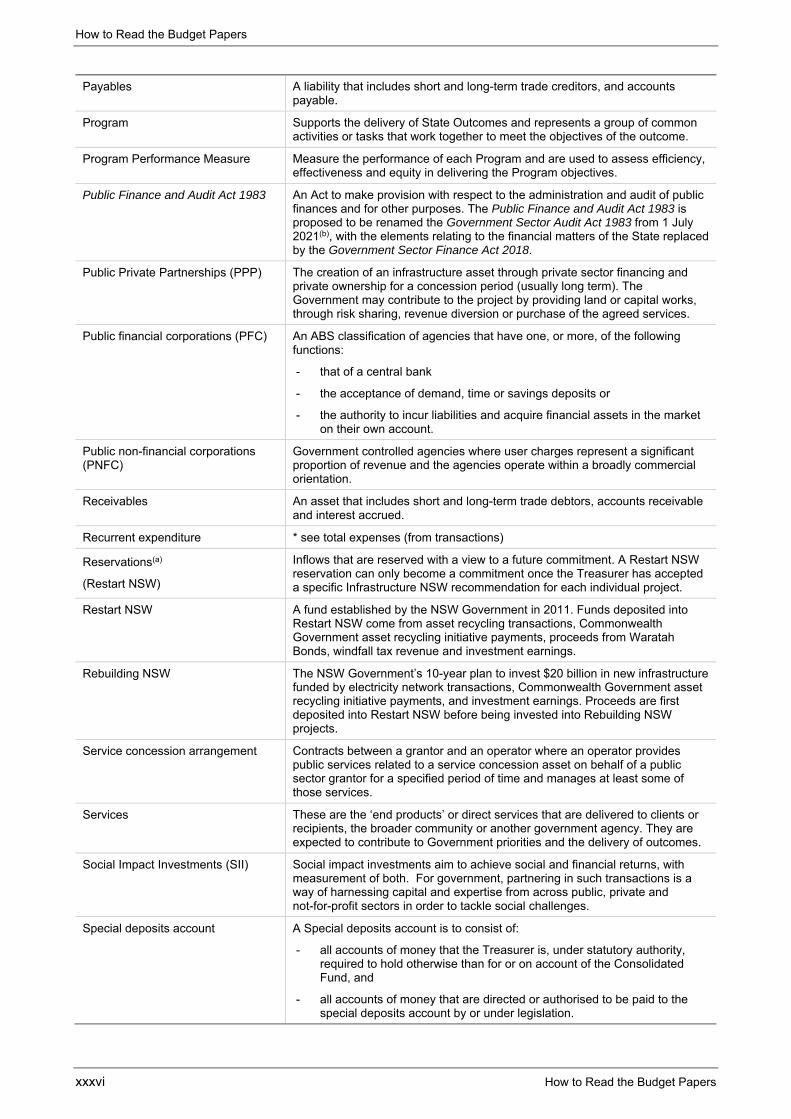
How to Read the Budget Papers
xxxvi How to Read the Budget Papers
Payables A liability that includes short and long-term trade creditors, and accounts payable.
Program Supports the delivery of State Outcomes and represents a group of common activities or tasks that work together to meet the objectives of the outcome.
Program Performance Measure Measure the performance of each Program and are used to assess efficiency, effectiveness and equity in delivering the Program objectives.
Public Finance and Audit Act 1983 An Act to make provision with respect to the administration and audit of public finances and for other purposes. The Public Finance and Audit Act 1983 is proposed to be renamed the Government Sector Audit Act 1983 from 1 July 2021(b), with the elements relating to the financial matters of the State replaced by the Government Sector Finance Act 2018.
Public Private Partnerships (PPP) The creation of an infrastructure asset through private sector financing and private ownership for a concession period (usually long term). The Government may contribute to the project by providing land or capital works, through risk sharing, revenue diversion or purchase of the agreed services.
Public financial corporations (PFC) An ABS classification of agencies that have one, or more, of the following functions:
- that of a central bank
- the acceptance of demand, time or savings deposits or
- the authority to incur liabilities and acquire financial assets in the market on their own account.
Public non-financial corporations (PNFC)
Government controlled agencies where user charges represent a significant proportion of revenue and the agencies operate within a broadly commercial orientation.
Receivables An asset that includes short and long-term trade debtors, accounts receivable and interest accrued.
Recurrent expenditure * see total expenses (from transactions)
Reservations(a)
(Restart NSW)
Inflows that are reserved with a view to a future commitment. A Restart NSW reservation can only become a commitment once the Treasurer has accepted a specific Infrastructure NSW recommendation for each individual project.
Restart NSW A fund established by the NSW Government in 2011. Funds deposited into Restart NSW come from asset recycling transactions, Commonwealth Government asset recycling initiative payments, proceeds from Waratah Bonds, windfall tax revenue and investment earnings.
Rebuilding NSW The NSW Government’s 10-year plan to invest $20 billion in new infrastructure funded by electricity network transactions, Commonwealth Government asset recycling initiative payments, and investment earnings. Proceeds are first deposited into Restart NSW before being invested into Rebuilding NSW projects.
Service concession arrangement Contracts between a grantor and an operator where an operator provides public services related to a service concession asset on behalf of a public sector grantor for a specified period of time and manages at least some of those services.
Services These are the ‘end products’ or direct services that are delivered to clients or recipients, the broader community or another government agency. They are expected to contribute to Government priorities and the delivery of outcomes.
Social Impact Investments (SII) Social impact investments aim to achieve social and financial returns, with measurement of both. For government, partnering in such transactions is a way of harnessing capital and expertise from across public, private and not-for-profit sectors in order to tackle social challenges.
Special deposits account A Special deposits account is to consist of:
- all accounts of money that the Treasurer is, under statutory authority, required to hold otherwise than for or on account of the Consolidated Fund, and
- all accounts of money that are directed or authorised to be paid to the special deposits account by or under legislation.
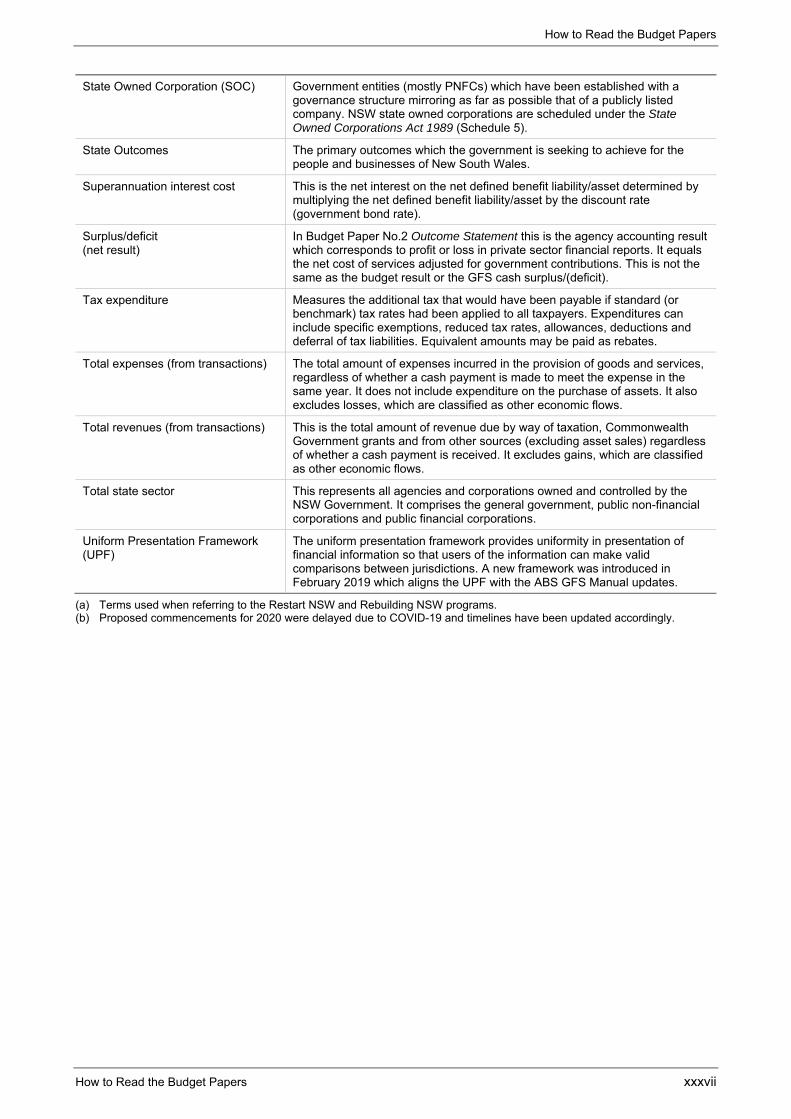
How to Read the Budget Papers
How to Read the Budget Papers xxxvii
State Owned Corporation (SOC) Government entities (mostly PNFCs) which have been established with a governance structure mirroring as far as possible that of a publicly listed company. NSW state owned corporations are scheduled under the State Owned Corporations Act 1989 (Schedule 5).
State Outcomes The primary outcomes which the government is seeking to achieve for the people and businesses of New South Wales.
Superannuation interest cost This is the net interest on the net defined benefit liability/asset determined by multiplying the net defined benefit liability/asset by the discount rate (government bond rate).
Surplus/deficit (net result)
In Budget Paper No.2 Outcome Statement this is the agency accounting result which corresponds to profit or loss in private sector financial reports. It equals the net cost of services adjusted for government contributions. This is not the same as the budget result or the GFS cash surplus/(deficit).
Tax expenditure Measures the additional tax that would have been payable if standard (or benchmark) tax rates had been applied to all taxpayers. Expenditures can include specific exemptions, reduced tax rates, allowances, deductions and deferral of tax liabilities. Equivalent amounts may be paid as rebates.
Total expenses (from transactions)
The total amount of expenses incurred in the provision of goods and services, regardless of whether a cash payment is made to meet the expense in the same year. It does not include expenditure on the purchase of assets. It also excludes losses, which are classified as other economic flows.
Total revenues (from transactions) This is the total amount of revenue due by way of taxation, Commonwealth Government grants and from other sources (excluding asset sales) regardless of whether a cash payment is received. It excludes gains, which are classified as other economic flows.
Total state sector This represents all agencies and corporations owned and controlled by the NSW Government. It comprises the general government, public non-financial corporations and public financial corporations.
Uniform Presentation Framework (UPF)
The uniform presentation framework provides uniformity in presentation of financial information so that users of the information can make valid comparisons between jurisdictions. A new framework was introduced in February 2019 which aligns the UPF with the ABS GFS Manual updates.
(a) Terms used when referring to the Restart NSW and Rebuilding NSW programs. (b) Proposed commencements for 2020 were delayed due to COVID-19 and timelines have been updated accordingly.


![BUDGET INDABA PRESENTATION 2020-21 [Read-Only]stlm.gov.za/publications/budgetIndaba/BUDGET INDABA...BUDGET INDABA DRAFT BUDGET 2020/2021 Purpose of the Budget Section 152 of Constitution:](https://img.pdfslide.us/doc/110x75/5f682c8064ad8261140a5074/budget-indaba-presentation-2020-21-read-onlystlmgovzapublicationsbudgetindababudget.jpg)


![Budget 2015 EI slides - final.pptx [Read-Only]...Title Microsoft PowerPoint - Budget 2015 EI slides - final.pptx [Read-Only] Author tearly Created Date 10/29/2014 1:21:13 PM](https://img.pdfslide.us/doc/110x75/6023075de89ad541b513e870/budget-2015-ei-slides-finalpptx-read-only-title-microsoft-powerpoint-.jpg)


![Budget Presentation 4-2-12 [Read-Only]2012/04/02 · 2012‐13 District Budget Proposal Final Budget Presentation April 2, 2012 Budget Update ˜Budget passed – Additional $180,688](https://img.pdfslide.us/doc/110x75/60029453d7a89163df46803e/budget-presentation-4-2-12-read-only-20120402-2012a13-district-budget-proposal.jpg)


![2018 Budget Presentation Police final.pptx [Read-Only]](https://img.pdfslide.us/doc/110x75/61ef934212bd8c60007052ea/2018-budget-presentation-police-finalpptx-read-only.jpg)
