Embed Size (px)
Citation preview

NSF NATIONAL SCIENCE FOUNDATION (DEPT ALL) Pay Period from 201221 to 201321
Table B1 - Total Workforce - Distribution by Disability
Employment Tenure Total
Total by Disability Status Detail for Targeted Disabilities
(04,05)
No
Disability
-1
Not
Identified
(06-98)
Disability
Targeted
Disability
(16,19)
Deafness
(21,23,25)
Blindness
(28,30,32-38)
Missing
Limbs/ Extremities
(64-69)
Partial
Paralysis
(71-79)
Total
Paralysis
-82
Convulsive
Disorder/ Epilepsy
-90
Mental
Retardation/ Severe
Intellectual Disability
-91
Mental
Illness/ Psychiatric Disabilty
-92
Distortion
Limb-Spine/
Dwarfism
TOTAL WORKFORCE - Permanent and Temporary
Prior FY # 1474 1309 43 122 15 4 2 0 3 1 0 0 5 0 % 100% 88.81% 2.92% 8.28% 1.02% 0.27% 0.14% 0.00% 0.20% 0.07% 0.00% 0.00% 0.34% 0.00%
Current FY # 1478 1316 36 126 15 3 2 0 3 1 0 0 6 0 % 100% 89.04% 2.44% 8.53% 1.01% 0.20% 0.14% 0.00% 0.20% 0.07% 0.00% 0.00% 0.41% 0.00%
Federal High # 2.23%
Difference # 4 7 -7 4 0 -1 0 0 0 0 0 0 1 0 Ratio
Change % 0.00% 0.23% -0.48% 0.25% 0.00% -0.07% 0.00% 0.00% 0.00% 0.00% 0.00% 0.00% 0.07% 0.00%
Net Change % 0.27% 0.53% -16.28% 3.28% 0.00% -25.00% 0.00% 0% 0.00% 0.00% 0% 0% 20.00% 0%
PERMANENT WORKFORCE
Prior FY # 1235 1098 32 105 14 3 2 0 3 1 0 0 5 0 % 100% 88.91% 2.59% 8.50% 1.13% 0.24% 0.16% 0.00% 0.24% 0.08% 0.00% 0.00% 0.40% 0.00%
Current FY # 1261 1120 31 110 15 3 2 0 3 1 0 0 6 0 % 100% 88.82% 2.46% 8.72% 1.19% 0.24% 0.16% 0.00% 0.24% 0.08% 0.00% 0.00% 0.48% 0.00%
Difference # 26 22 -1 5 1 0 0 0 0 0 0 0 1 0 Ratio
Change % 0.00% -0.09% -0.13% 0.22% 0.06% -0.01% 0.00% 0.00% -0.01% 0.00% 0.00% 0.00% 0.07% 0.00%
Net Change % 2.11% 2.00% -3.13% 4.76% 7.14% 0.00% 0.00% 0% 0.00% 0.00% 0% 0% 20.00% 0%
TEMPORARY WORKFORCE
Prior FY # 239 211 11 17 1 1 0 0 0 0 0 0 0 0 % 100% 88.28% 4.60% 7.11% 0.42% 0.42% 0.00% 0.00% 0.00% 0.00% 0.00% 0.00% 0.00% 0.00%
Current FY # 217 196 5 16 0 0 0 0 0 0 0 0 0 0 % 100% 90.32% 2.30% 7.37% 0.00% 0.00% 0.00% 0.00% 0.00% 0.00% 0.00% 0.00% 0.00% 0.00%
Difference # -22 -15 -6 -1 -1 -1 0 0 0 0 0 0 0 0 Ratio
Change % 0.00% 2.04% -2.30% 0.26% -0.42% -0.42% 0.00% 0.00% 0.00% 0.00% 0.00% 0.00% 0.00% 0.00%
Net Change % -9.21% -7.11% -54.55% -5.88% -100.00% -100.00% 0% 0% 0% 0% 0% 0% 0% 0%

NATIONAL SCIENCE FOUNDATION Pay Period 201321
Table B2 - Permanent Workforce By Component - Distribution by Disability
Component Total Total by Disability Status Detail for Targeted Disabilities
(04,05)
No
Disability
-1
Not
Identified
(06-98)
Disability
Targeted
Disability
(16,19)
Deafness
(21,23,25)
Blindness
(28,30,32-38)
Missing
Limbs/ Extremities
(64-69)
Partial
Paralysis
(71-79)
Total
Paralysis
-82
Convulsive
Disorder/ Epilepsy
-90
Mental
Retardation/ Severe
Intellectual Disability
-91
Mental
Illness/ Psychiatric Disabilty
-92
Distortion
Limb-Spine/
Dwarfism
Federal High
% 2.23%
BFA (ORG)
# 154 138 5 11 1 0 0 0 0 0 0 0 1 0
% 100% 89.61% 3.25% 7.14% 0.65% 0.00% 0.00% 0.00% 0.00% 0.00% 0.00% 0.00% 0.65% 0.00%
BIO (ORG)
# 94 80 2 12 1 0 0 0 0 0 0 0 1 0
% 100% 85.11% 2.13% 12.77% 1.06% 0.00% 0.00% 0.00% 0.00% 0.00% 0.00% 0.00% 1.06% 0.00%
CISE (ORG)
# 69 60 3 6 2 0 1 0 0 0 0 0 1 0
% 100% 86.96% 4.35% 8.70% 2.90% 0.00% 1.45% 0.00% 0.00% 0.00% 0.00% 0.00% 1.45% 0.00%
EHR (ORG)
# 103 94 2 7 2 1 1 0 0 0 0 0 0 0
% 100% 91.26% 1.94% 6.80% 1.94% 0.97% 0.97% 0.00% 0.00% 0.00% 0.00% 0.00% 0.00% 0.00%
ENG (ORG)
# 101 88 2 11 1 0 0 0 0 0 0 0 1 0
% 100% 87.13% 1.98% 10.89% 0.99% 0.00% 0.00% 0.00% 0.00% 0.00% 0.00% 0.00% 0.99% 0.00%
GEO (ORG)
# 92 86 0 6 0 0 0 0 0 0 0 0 0 0
% 100% 93.48% 0.00% 6.52% 0.00% 0.00% 0.00% 0.00% 0.00% 0.00% 0.00% 0.00% 0.00% 0.00%
IRM (ORG)
# 185 168 1 16 1 0 0 0 1 0 0 0 0 0
% 100% 90.81% 0.54% 8.65% 0.54% 0.00% 0.00% 0.00% 0.54% 0.00% 0.00% 0.00% 0.00% 0.00%
MPS (ORG)
# 112 93 6 13 2 1 0 0 0 0 0 0 1 0
% 100% 83.04% 5.36% 11.61% 1.79% 0.89% 0.00% 0.00% 0.00% 0.00% 0.00% 0.00% 0.89% 0.00%
NSB (ORG)
# 18 18 0 0 0 0 0 0 0 0 0 0 0 0
% 100% 100.00% 0.00% 0.00% 0.00% 0.00% 0.00% 0.00% 0.00% 0.00% 0.00% 0.00% 0.00% 0.00%
O/D (ORG)
# 115 104 2 9 2 0 0 0 1 1 0 0 0 0
% 100% 90.43% 1.74% 7.83% 1.74% 0.00% 0.00% 0.00% 0.87% 0.87% 0.00% 0.00% 0.00% 0.00%
OIG (ORG)
# 71 62 3 6 1 1 0 0 0 0 0 0 0 0
% 100% 87.32% 4.23% 8.45% 1.41% 1.41% 0.00% 0.00% 0.00% 0.00% 0.00% 0.00% 0.00% 0.00%
SBE (ORG)
# 91 83 2 6 0 0 0 0 0 0 0 0 0 0
% 100% 91.21% 2.20% 6.59% 0.00% 0.00% 0.00% 0.00% 0.00% 0.00% 0.00% 0.00% 0.00% 0.00%
Total # 1205 1074 28 103 13 3 2 0 2 1 0 0 5 0
% 100% 89.13% 2.32% 8.55% 1.08% 0.25% 0.17% 0.00% 0.17% 0.08% 0.00% 0.00% 0.41% 0.00%

NATIONAL SCIENCE FOUNDATION Pay Period 201321
Table B2 - Temporary Workforce By Component - Distribution by Disability
Component Total
Total by Disability Status Detail for Targeted Disabilities
(04,05) No
Disability
-1 Not
Identified
(06-98) Disability
Targeted Disability
(16,19) Deafness
(21,23,25) Blindness
(28,30,32-38) Missing
Limbs/ Extremities
(64-69) Partial
Paralysis
(71-79) Total
Paralysis
-82 Convulsive
Disorder/ Epilepsy
-90 Mental
Retardation/ Severe Intellectual Disability
-91 Mental
Illness/ Psychiatric Disabilty
-92 Distortion
Limb-Spine/ Dwarfism
Federal High % 2.23%
BFA (ORG)
# 1 1 0 0 0 0 0 0 0 0 0 0 0 0 % 100% 100.00% 0.00% 0.00% 0.00% 0.00% 0.00% 0.00% 0.00% 0.00% 0.00% 0.00% 0.00% 0.00%
BIO (ORG)
# 23 20 0 3 0 0 0 0 0 0 0 0 0 0 % 100% 86.96% 0.00% 13.04% 0.00% 0.00% 0.00% 0.00% 0.00% 0.00% 0.00% 0.00% 0.00% 0.00%
CISE (ORG)
# 18 13 2 3 0 0 0 0 0 0 0 0 0 0 % 100% 72.22% 11.11% 16.67% 0.00% 0.00% 0.00% 0.00% 0.00% 0.00% 0.00% 0.00% 0.00% 0.00%
EHR (ORG)
# 26 24 2 0 0 0 0 0 0 0 0 0 0 0 % 100% 92.31% 7.69% 0.00% 0.00% 0.00% 0.00% 0.00% 0.00% 0.00% 0.00% 0.00% 0.00% 0.00%
ENG (ORG)
# 26 26 0 0 0 0 0 0 0 0 0 0 0 0 % 100% 100.00% 0.00% 0.00% 0.00% 0.00% 0.00% 0.00% 0.00% 0.00% 0.00% 0.00% 0.00% 0.00%
GEO (ORG)
# 19 17 0 2 0 0 0 0 0 0 0 0 0 0 % 100% 89.47% 0.00% 10.53% 0.00% 0.00% 0.00% 0.00% 0.00% 0.00% 0.00% 0.00% 0.00% 0.00%
IRM (ORG)
# 3 2 0 1 0 0 0 0 0 0 0 0 0 0 % 100% 66.67% 0.00% 33.33% 0.00% 0.00% 0.00% 0.00% 0.00% 0.00% 0.00% 0.00% 0.00% 0.00%
MPS (ORG)
# 30 28 0 2 0 0 0 0 0 0 0 0 0 0 % 100% 93.33% 0.00% 6.67% 0.00% 0.00% 0.00% 0.00% 0.00% 0.00% 0.00% 0.00% 0.00% 0.00%
NSB (ORG)
# 25 23 1 1 0 0 0 0 0 0 0 0 0 0 % 100% 92.00% 4.00% 4.00% 0.00% 0.00% 0.00% 0.00% 0.00% 0.00% 0.00% 0.00% 0.00% 0.00%
O/D (ORG)
# 15 15 0 0 0 0 0 0 0 0 0 0 0 0 % 100% 100.00% 0.00% 0.00% 0.00% 0.00% 0.00% 0.00% 0.00% 0.00% 0.00% 0.00% 0.00% 0.00%
OIG (ORG)
# 4 3 0 1 0 0 0 0 0 0 0 0 0 0 % 100% 75.00% 0.00% 25.00% 0.00% 0.00% 0.00% 0.00% 0.00% 0.00% 0.00% 0.00% 0.00% 0.00%
SBE (ORG)
# 20 18 0 2 0 0 0 0 0 0 0 0 0 0 % 100% 90.00% 0.00% 10.00% 0.00% 0.00% 0.00% 0.00% 0.00% 0.00% 0.00% 0.00% 0.00% 0.00%
Total # 210 190 5 15 0 0 0 0 0 0 0 0 0 0 % 100% 90.48% 2.38% 7.14% 0.00% 0.00% 0.00% 0.00% 0.00% 0.00% 0.00% 0.00% 0.00% 0.00%

NSF NATIONAL SCIENCE FOUNDATION (DEPT ALL) Pay Period 201321
Table B3-1 - Occupational Categories - Distribution by Disability - Permanent Workforce Occupational Category Total Total by Disability Status Detail for Targeted Disabilities
(04,05)
No Disability
-1
Not Identified
(06-98)
Disability
Targeted
Disability
(16,19)
Deafness
(21,23,25)
Blindness
(28,30,32-38)
Missing Limbs/
Extremities
(64-69)
Partial Paralysis
(71-79)
Total Paralysis
-82
Convulsive Disorder/ Epilepsy
-90
Mental Retardation/
Severe Intellectual
Disability
-91
Mental Illness/
Psychiatric Disabilty
-92
Distortion Limb-Spine/
Dwarfism
1. Officials and Managers
Executive/Senior Level (Grades 15 and
Above)
# 114 104 3 7 0 0 0 0 0 0 0 0 0 0
% 100% 91.23% 2.63% 6.14% 0% 0.00% 0.00% 0.00% 0.00% 0.00% 0.00% 0.00% 0.00% 0.00%
Mid-Level (Grades 13-14)
# 34 32 0 2 0 0 0 0 0 0 0 0 0 0 % 100% 94.12% 0% 5.88% 0% 0.00% 0.00% 0.00% 0.00% 0.00% 0.00% 0.00% 0.00% 0.00%
First-Level (Grades 12 and Below)
# 15 15 0 0 0 0 0 0 0 0 0 0 0 0 % 100% 100% 0% 0% 0% 0.00% 0.00% 0.00% 0.00% 0.00% 0.00% 0.00% 0.00% 0.00%
Other # 435 392 5 38 5 0 1 0 1 0 0 0 3 0 % 100% 90.11% 1.15% 8.74% 1.15% 0.00% 0.23% 0.00% 0.23% 0.00% 0.00% 0.00% 0.69% 0.00%
Officials And Managers - TOTAL
# 598 543 8 47 5 0 1 0 1 0 0 0 3 0 % 100% 90.80% 1.34% 7.86% 0.84% 0.00% 0.17% 0.00% 0.17% 0.00% 0.00% 0.00% 0.50% 0.00%
2. Professionals # 523 466 18 39 6 1 1 0 2 0 0 0 2 0 % 100% 89.10% 3.44% 7.46% 1.15% 0.19% 0.19% 0.00% 0.38% 0.00% 0.00% 0.00% 0.38% 0.00%
3. Technicians # 2 1 0 1 0 0 0 0 0 0 0 0 0 0 % 100% 50% 0% 50% 0% 0.00% 0.00% 0.00% 0.00% 0.00% 0.00% 0.00% 0.00% 0.00%
4. Sales Workers # 0 0 0 0 0 0 0 0 0 0 0 0 0 0 % 0% 0% 0% 0% 0% 0% 0% 0% 0% 0% 0% 0% 0% 0%
5. Administrative Support Workers
# 126 100 5 21 4 2 0 0 0 1 0 0 1 0 % 100% 79.37% 3.97% 16.67% 3.17% 1.59% 0.00% 0.00% 0.00% 0.79% 0.00% 0.00% 0.79% 0.00%
6. Craft Workers # 0 0 0 0 0 0 0 0 0 0 0 0 0 0 % 0% 0% 0% 0% 0% 0% 0% 0% 0% 0% 0% 0% 0% 0%
7. Operatives # 0 0 0 0 0 0 0 0 0 0 0 0 0 0 % 0% 0% 0% 0% 0% 0% 0% 0% 0% 0% 0% 0% 0% 0%
8. Laborers and Helpers
# 0 0 0 0 0 0 0 0 0 0 0 0 0 0 % 0% 0% 0% 0% 0% 0% 0% 0% 0% 0% 0% 0% 0% 0%
9. Service Workers # 8 7 0 1 0 0 0 0 0 0 0 0 0 0 % 100% 87.50% 0% 12.50% 0% 0.00% 0.00% 0.00% 0.00% 0.00% 0.00% 0.00% 0.00% 0.00%

NSF NATIONAL SCIENCE FOUNDATION (DEPT ALL) Pay Period 201321
Table B3-2 - Occupational Categories - Distribution by Disability - Permanent Workforce
Occupational Category Total Total by Disability Status Detail for Targeted Disabilities
(04,05)
No Disability
-1
Not Identified
(06-98)
Disability
Targeted
Disability
(16,19)
Deafness
(21,23,25)
Blindness
(28,30,32-38)
Missing Limbs/
Extremities
(64-69)
Partial Paralysis
(71-79)
Total Paralysis
-82
Convulsive Disorder/ Epilepsy
-90
Mental Retardation/
Severe Intellectual
Disability
-91
Mental Illness/
Psychiatric Disabilty
-92
Distortion Limb-Spine/
Dwarfism
1. Officials and Managers
Executive/Senior Level (Grades 15 and
Above)
# 114 104 3 7 0 0 0 0 0 0 0 0 0 0
% 100% 9.31% 9.68% 6.42% 0% 0.00% 0.00% 0% 0.00% 0.00% 0% 0% 0.00% 0%
Mid-Level (Grades 13-14)
# 34 32 0 2 0 0 0 0 0 0 0 0 0 0 % 100% 2.86% 0% 1.83% 0% 0.00% 0.00% 0% 0.00% 0.00% 0% 0% 0.00% 0%
First-Level (Grades 12 and Below)
# 15 15 0 0 0 0 0 0 0 0 0 0 0 0 % 100% 1.34% 0% 0% 0% 0.00% 0.00% 0% 0.00% 0.00% 0% 0% 0.00% 0%
Other # 435 392 5 38 5 0 1 0 1 0 0 0 3 0 % 100% 35.09% 16.13% 34.86% 33.33% 0.00% 50.00% 0% 33.33% 0.00% 0% 0% 50.00% 0%
Officials And Managers - TOTAL
# 598 543 8 47 5 0 1 0 1 0 0 0 3 0 % 47.57% 48.61% 25.81% 43.12% 33.33% 0.00% 50.00% 0% 33.33% 0.00% 0% 0% 50.00% 0%
2. Professionals # 523 466 18 39 6 1 1 0 2 0 0 0 2 0 % 41.61% 41.72% 58.06% 35.78% 40% 33.33% 50.00% 0% 66.67% 0.00% 0% 0% 33.33% 0%
3. Technicians # 2 1 0 1 0 0 0 0 0 0 0 0 0 0 % 0.16% 0.09% 0% 0.92% 0% 0.00% 0.00% 0% 0.00% 0.00% 0% 0% 0.00% 0%
4. Sales Workers # 0 0 0 0 0 0 0 0 0 0 0 0 0 0 % 0% 0% 0% 0% 0% 0.00% 0.00% 0% 0.00% 0.00% 0% 0% 0.00% 0%
5. Administrative Support Workers
# 126 100 5 21 4 2 0 0 0 1 0 0 1 0 % 10.02% 8.95% 16.13% 19.27% 26.67% 66.67% 0.00% 0% 0.00% 100.00% 0% 0% 16.67% 0%
6. Craft Workers # 0 0 0 0 0 0 0 0 0 0 0 0 0 0 % 0% 0% 0% 0% 0% 0.00% 0.00% 0% 0.00% 0.00% 0% 0% 0.00% 0%
7. Operatives # 0 0 0 0 0 0 0 0 0 0 0 0 0 0 % 0% 0% 0% 0% 0% 0.00% 0.00% 0% 0.00% 0.00% 0% 0% 0.00% 0%
8. Laborers and Helpers
# 0 0 0 0 0 0 0 0 0 0 0 0 0 0 % 0% 0% 0% 0% 0% 0.00% 0.00% 0% 0.00% 0.00% 0% 0% 0.00% 0%
9. Service Workers # 8 7 0 1 0 0 0 0 0 0 0 0 0 0 % 0.64% 0.63% 0% 0.92% 0% 0.00% 0.00% 0% 0.00% 0.00% 0% 0% 0.00% 0%
Permanent Workforce # 1257 1117 31 109 15 3 2 0 3 1 0 0 6 0 % 100% 100% 100% 100% 100% 100% 100% 100% 100% 100% 100% 100% 100% 100%

NSF NATIONAL SCIENCE FOUNDATION (DEPT ALL) - Pay Period 201321
Table B4-1: Participation Rates for General Schedule Grades - Distribution by Disability - Permanent Workforce
Occupational Category Total
Total by Disability Status Detail for Targeted Disabilities
(04,05) No
Disability
-1 Not
Identified
(06-98) Disability
Targeted Disability
(16,19) Deafness
(21,23,25) Blindness
(28,30,32-38) Missing
Limbs/ Extremities
(64-69) Partial
Paralysis
(71-79) Total
Paralysis
-82 Convulsive
Disorder/ Epilepsy
-90 Mental
Retardation/ Severe Intellectual Disability
-91 Mental
Illness/ Psychiatric Disabilty
-92 Distortion
Limb-Spine/ Dwarfism
GS-01 # 0 0 0 0 0 0 0 0 0 0 0 0 0 0 % 0% 0% 0% 0% 0% 0% 0% 0% 0% 0% 0% 0% 0% 0%
GS-02 # 0 0 0 0 0 0 0 0 0 0 0 0 0 0 % 0% 0% 0% 0% 0% 0% 0% 0% 0% 0% 0% 0% 0% 0%
GS-03 # 1 1 0 0 0 0 0 0 0 0 0 0 0 0 % 100% 100.00% 0.00% 0.00% 0.00% 0.00% 0.00% 0.00% 0.00% 0.00% 0.00% 0.00% 0.00% 0.00%
GS-04 # 3 3 0 0 0 0 0 0 0 0 0 0 0 0 % 100% 100.00% 0.00% 0.00% 0.00% 0.00% 0.00% 0.00% 0.00% 0.00% 0.00% 0.00% 0.00% 0.00%
GS-05 # 19 17 0 2 0 0 0 0 0 0 0 0 0 0 % 100% 89.47% 0.00% 10.53% 0.00% 0.00% 0.00% 0.00% 0.00% 0.00% 0.00% 0.00% 0.00% 0.00%
GS-06 # 15 8 2 5 0 0 0 0 0 0 0 0 0 0 % 100% 53.33% 13.33% 33.33% 0.00% 0.00% 0.00% 0.00% 0.00% 0.00% 0.00% 0.00% 0.00% 0.00%
GS-07 # 71 59 2 10 2 1 0 0 0 0 0 0 1 0 % 100% 83.10% 2.82% 14.08% 2.82% 1.41% 0.00% 0.00% 0.00% 0.00% 0.00% 0.00% 1.41% 0.00%
GS-08 # 21 17 0 4 1 1 0 0 0 0 0 0 0 0 % 100% 80.95% 0.00% 19.05% 4.76% 4.76% 0.00% 0.00% 0.00% 0.00% 0.00% 0.00% 0.00% 0.00%
GS-09 # 79 67 2 10 1 0 0 0 0 1 0 0 0 0 % 100% 84.81% 2.53% 12.66% 1.27% 0.00% 0.00% 0.00% 0.00% 1.27% 0.00% 0.00% 0.00% 0.00%
GS-10 # 10 8 1 1 0 0 0 0 0 0 0 0 0 0 % 100% 80.00% 10.00% 10.00% 0.00% 0.00% 0.00% 0.00% 0.00% 0.00% 0.00% 0.00% 0.00% 0.00%
GS-11 # 87 82 1 4 1 0 1 0 0 0 0 0 0 0 % 100% 94.25% 1.15% 4.60% 1.15% 0.00% 1.15% 0.00% 0.00% 0.00% 0.00% 0.00% 0.00% 0.00%
GS-12 # 111 100 1 10 2 0 0 0 1 0 0 0 1 0 % 100% 90.09% 0.90% 9.01% 1.80% 0.00% 0.00% 0.00% 0.90% 0.00% 0.00% 0.00% 0.90% 0.00%
GS-13 # 144 128 3 13 3 1 0 0 0 0 0 0 2 0 % 100% 88.89% 2.08% 9.03% 2.08% 0.69% 0.00% 0.00% 0.00% 0.00% 0.00% 0.00% 1.39% 0.00%
GS-14 # 162 153 2 7 0 0 0 0 0 0 0 0 0 0 % 100% 94.44% 1.23% 4.32% 0.00% 0.00% 0.00% 0.00% 0.00% 0.00% 0.00% 0.00% 0.00% 0.00%
GS-15 # 89 83 1 5 0 0 0 0 0 0 0 0 0 0 % 100% 93.26% 1.12% 5.62% 0.00% 0.00% 0.00% 0.00% 0.00% 0.00% 0.00% 0.00% 0.00% 0.00%
All other (unspecified)
# 374 326 13 35 5 0 1 0 2 0 0 0 2 0 % 100.00% 87.17% 3.48% 9.36% 1.34% 0.00% 0.27% 0.00% 0.53% 0.00% 0.00% 0.00% 0.53% 0.00%
Senior Executive Service
# 75 68 3 4 0 0 0 0 0 0 0 0 0 0 % 100.00% 90.67% 4.00% 5.33% 0.00% 0.00% 0.00% 0.00% 0.00% 0.00% 0.00% 0.00% 0.00% 0.00%

NSF NATIONAL SCIENCE FOUNDATION (DEPT ALL) Pay Period 201321 Table B4-2: Participation Rates for General Schedule Grades - Distribution by Disability - Permanent Workforce
Occupational Category Total
Total by Disability Status Detail for Targeted Disabilities
(04,05) No
Disability
-1 Not
Identified
(06-98) Disability
Targeted Disability
(16,19) Deafness
(21,23,25) Blindness
(28,30,32-38) Missing
Limbs/ Extremities
(64-69) Partial
Paralysis
(71-79) Total
Paralysis
-82 Convulsive
Disorder/ Epilepsy
-90 Mental
Retardation/ Severe Intellectual Disability
-91 Mental
Illness/ Psychiatric Disabilty
-92 Distortion
Limb-Spine/ Dwarfism
GS-01 # 0 0 0 0 0 0 0 0 0 0 0 0 0 0 % 0.00% 0.00% 0.00% 0.00% 0.00% 0.00% 0.00% 0% 0.00% 0.00% 0% 0% 0.00% 0%
GS-02 # 0 0 0 0 0 0 0 0 0 0 0 0 0 0 % 0.00% 0.00% 0.00% 0.00% 0.00% 0.00% 0.00% 0% 0.00% 0.00% 0% 0% 0.00% 0%
GS-03 # 1 1 0 0 0 0 0 0 0 0 0 0 0 0 % 0.08% 0.09% 0.00% 0.00% 0.00% 0.00% 0.00% 0% 0.00% 0.00% 0% 0% 0.00% 0%
GS-04 # 3 3 0 0 0 0 0 0 0 0 0 0 0 0 % 0.24% 0.27% 0.00% 0.00% 0.00% 0.00% 0.00% 0% 0.00% 0.00% 0% 0% 0.00% 0%
GS-05 # 19 17 0 2 0 0 0 0 0 0 0 0 0 0 % 1.51% 1.52% 0.00% 1.82% 0.00% 0.00% 0.00% 0% 0.00% 0.00% 0% 0% 0.00% 0%
GS-06 # 15 8 2 5 0 0 0 0 0 0 0 0 0 0 % 1.19% 0.71% 6.45% 4.55% 0.00% 0.00% 0.00% 0% 0.00% 0.00% 0% 0% 0.00% 0%
GS-07 # 71 59 2 10 2 1 0 0 0 0 0 0 1 0 % 5.63% 5.27% 6.45% 9.09% 13.33% 33.33% 0.00% 0% 0.00% 0.00% 0% 0% 16.67% 0%
GS-08 # 21 17 0 4 1 1 0 0 0 0 0 0 0 0 % 1.67% 1.52% 0.00% 3.64% 6.67% 33.33% 0.00% 0% 0.00% 0.00% 0% 0% 0.00% 0%
GS-09 # 79 67 2 10 1 0 0 0 0 1 0 0 0 0 % 6.26% 5.98% 6.45% 9.09% 6.67% 0.00% 0.00% 0% 0.00% 100.00% 0% 0% 0.00% 0%
GS-10 # 10 8 1 1 0 0 0 0 0 0 0 0 0 0 % 0.79% 0.71% 3.23% 0.91% 0.00% 0.00% 0.00% 0% 0.00% 0.00% 0% 0% 0.00% 0%
GS-11 # 87 82 1 4 1 0 1 0 0 0 0 0 0 0 % 6.90% 7.32% 3.23% 3.64% 6.67% 0.00% 50.00% 0% 0.00% 0.00% 0% 0% 0.00% 0%
GS-12 # 111 100 1 10 2 0 0 0 1 0 0 0 1 0 % 8.80% 8.93% 3.23% 9.09% 13.33% 0.00% 0.00% 0% 33.33% 0.00% 0% 0% 16.67% 0%
GS-13 # 144 128 3 13 3 1 0 0 0 0 0 0 2 0 % 11.42% 11.43% 9.68% 11.82% 20.00% 33.33% 0.00% 0% 0.00% 0.00% 0% 0% 33.33% 0%
GS-14 # 162 153 2 7 0 0 0 0 0 0 0 0 0 0 % 12.85% 13.66% 6.45% 6.36% 0.00% 0.00% 0.00% 0% 0.00% 0.00% 0% 0% 0.00% 0%
GS-15 # 89 83 1 5 0 0 0 0 0 0 0 0 0 0 % 7.06% 7.41% 3.23% 4.55% 0.00% 0.00% 0.00% 0% 0.00% 0.00% 0% 0% 0.00% 0%
All other (unspecified)
# 374 326 13 35 5 0 1 0 2 0 0 0 2 0 % 29.66% 29.11% 41.94% 31.82% 33.33% 0.00% 50.00% 0% 66.67% 0.00% 0% 0% 33.33% 0%
Senior Executive Service
# 75 68 3 4 0 0 0 0 0 0 0 0 0 0 % 5.95% 6.07% 9.68% 3.64% 0.00% 0.00% 0.00% 0% 0.00% 0.00% 0% 0% 0.00% 0%
TOTAL # 1261 1120 31 110 15 3 2 0 3 1 0 0 6 0 % 100% 100% 100% 100% 100% 100% 100% 100% 100% 100% 100% 100% 100% 100%
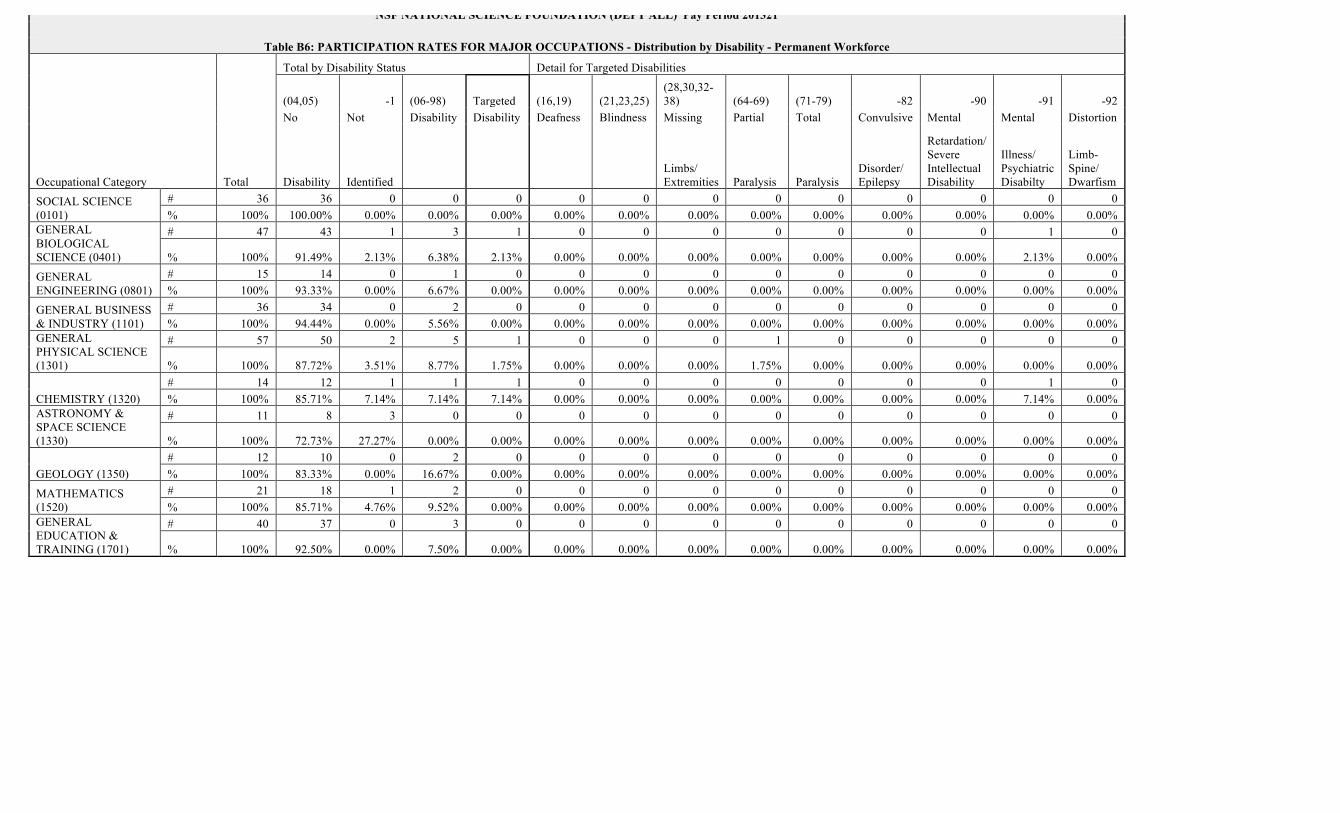
NSF NATIONAL SCIENCE FOUNDATION (DEPT ALL) Pay Period 201321
Table B6: PARTICIPATION RATES FOR MAJOR OCCUPATIONS - Distribution by Disability - Permanent Workforce
Occupational Category Total
Total by Disability Status Detail for Targeted Disabilities
(04,05) No
Disability
-1 Not
Identified
(06-98) Disability
Targeted Disability
(16,19) Deafness
(21,23,25) Blindness
(28,30,32-38) Missing
Limbs/ Extremities
(64-69) Partial
Paralysis
(71-79) Total
Paralysis
-82 Convulsive
Disorder/ Epilepsy
-90 Mental
Retardation/ Severe Intellectual Disability
-91 Mental
Illness/ Psychiatric Disabilty
-92 Distortion
Limb-Spine/ Dwarfism
SOCIAL SCIENCE (0101)
# 36 36 0 0 0 0 0 0 0 0 0 0 0 0 % 100% 100.00% 0.00% 0.00% 0.00% 0.00% 0.00% 0.00% 0.00% 0.00% 0.00% 0.00% 0.00% 0.00%
GENERAL BIOLOGICAL SCIENCE (0401)
# 47 43 1 3 1 0 0 0 0 0 0 0 1 0
% 100% 91.49% 2.13% 6.38% 2.13% 0.00% 0.00% 0.00% 0.00% 0.00% 0.00% 0.00% 2.13% 0.00%
GENERAL ENGINEERING (0801)
# 15 14 0 1 0 0 0 0 0 0 0 0 0 0 % 100% 93.33% 0.00% 6.67% 0.00% 0.00% 0.00% 0.00% 0.00% 0.00% 0.00% 0.00% 0.00% 0.00%
GENERAL BUSINESS & INDUSTRY (1101)
# 36 34 0 2 0 0 0 0 0 0 0 0 0 0 % 100% 94.44% 0.00% 5.56% 0.00% 0.00% 0.00% 0.00% 0.00% 0.00% 0.00% 0.00% 0.00% 0.00%
GENERAL PHYSICAL SCIENCE (1301)
# 57 50 2 5 1 0 0 0 1 0 0 0 0 0
% 100% 87.72% 3.51% 8.77% 1.75% 0.00% 0.00% 0.00% 1.75% 0.00% 0.00% 0.00% 0.00% 0.00%
CHEMISTRY (1320) # 14 12 1 1 1 0 0 0 0 0 0 0 1 0 % 100% 85.71% 7.14% 7.14% 7.14% 0.00% 0.00% 0.00% 0.00% 0.00% 0.00% 0.00% 7.14% 0.00%
ASTRONOMY & SPACE SCIENCE (1330)
# 11 8 3 0 0 0 0 0 0 0 0 0 0 0
% 100% 72.73% 27.27% 0.00% 0.00% 0.00% 0.00% 0.00% 0.00% 0.00% 0.00% 0.00% 0.00% 0.00%
GEOLOGY (1350) # 12 10 0 2 0 0 0 0 0 0 0 0 0 0 % 100% 83.33% 0.00% 16.67% 0.00% 0.00% 0.00% 0.00% 0.00% 0.00% 0.00% 0.00% 0.00% 0.00%
MATHEMATICS (1520)
# 21 18 1 2 0 0 0 0 0 0 0 0 0 0 % 100% 85.71% 4.76% 9.52% 0.00% 0.00% 0.00% 0.00% 0.00% 0.00% 0.00% 0.00% 0.00% 0.00%
GENERAL EDUCATION & TRAINING (1701)
# 40 37 0 3 0 0 0 0 0 0 0 0 0 0
% 100% 92.50% 0.00% 7.50% 0.00% 0.00% 0.00% 0.00% 0.00% 0.00% 0.00% 0.00% 0.00% 0.00%

NSF NATIONAL SCIENCE FOUNDATION (DEPT ALL) Pay Period 201321
Table B6: PARTICIPATION RATES FOR MAJOR OCCUPATIONS - Distribution by Disability - Temporary Workforce
Occupational Category Total
Total by Disability Status Detail for Targeted Disabilities
(04,05) No
Disability
-1 Not
Identified
(06-98) Disability
Targeted Disability
(16,19) Deafness
(21,23,25) Blindness
(28,30,32-38) Missing
Limbs/ Extremities
(64-69) Partial
Paralysis
(71-79) Total
Paralysis
-82 Convulsive
Disorder/ Epilepsy
-90 Mental
Retardation/ Severe Intellectual Disability
-91 Mental
Illness/ Psychiatric Disabilty
-92 Distortion
Limb-Spine/ Dwarfism
SOCIAL SCIENCE (0101)
# 26 25 0 1 0 0 0 0 0 0 0 0 0 0 % 100% 96.15% 0.00% 3.85% 0.00% 0.00% 0.00% 0.00% 0.00% 0.00% 0.00% 0.00% 0.00% 0.00%
GENERAL BIOLOGICAL SCIENCE (0401)
# 23 20 0 3 0 0 0 0 0 0 0 0 0 0
% 100% 86.96% 0.00% 13.04% 0.00% 0.00% 0.00% 0.00% 0.00% 0.00% 0.00% 0.00% 0.00% 0.00%
GENERAL ENGINEERING (0801)
# 20 20 0 0 0 0 0 0 0 0 0 0 0 0 % 100% 100.00% 0.00% 0.00% 0.00% 0.00% 0.00% 0.00% 0.00% 0.00% 0.00% 0.00% 0.00% 0.00%
GENERAL BUSINESS & INDUSTRY (1101)
# 0 0 0 0 0 0 0 0 0 0 0 0 0 0 % 0% 0% 0% 0% 0% 0% 0% 0% 0% 0% 0% 0% 0% 0%
GENERAL PHYSICAL SCIENCE (1301)
# 29 27 0 2 0 0 0 0 0 0 0 0 0 0 % 100% 93.10% 0.00% 6.90% 0.00% 0.00% 0.00% 0.00% 0.00% 0.00% 0.00% 0.00% 0.00% 0.00%
CHEMISTRY (1320) # 10 8 0 2 0 0 0 0 0 0 0 0 0 0 % 100% 80.00% 0.00% 20.00% 0.00% 0.00% 0.00% 0.00% 0.00% 0.00% 0.00% 0.00% 0.00% 0.00%
ASTRONOMY & SPACE SCIENCE (1330)
# 1 1 0 0 0 0 0 0 0 0 0 0 0 0
% 100% 100.00% 0.00% 0.00% 0.00% 0.00% 0.00% 0.00% 0.00% 0.00% 0.00% 0.00% 0.00% 0.00%
GEOLOGY (1350) # 6 6 0 0 0 0 0 0 0 0 0 0 0 0 % 100% 100.00% 0.00% 0.00% 0.00% 0.00% 0.00% 0.00% 0.00% 0.00% 0.00% 0.00% 0.00% 0.00%
MATHEMATICS (1520)
# 12 11 1 0 0 0 0 0 0 0 0 0 0 0 % 100% 91.67% 8.33% 0.00% 0.00% 0.00% 0.00% 0.00% 0.00% 0.00% 0.00% 0.00% 0.00% 0.00%
GENERAL EDUCATION & TRAINING (1701)
# 26 24 2 0 0 0 0 0 0 0 0 0 0 0
% 100% 92.31% 7.69% 0.00% 0.00% 0.00% 0.00% 0.00% 0.00% 0.00% 0.00% 0.00% 0.00% 0.00%

Table B7: APPLICANTS AND HIRES by Disability Permanent WorkForce
Total Total by Disability Status Detail for Targeted Disabilities [05] No
Disability [01] Not
Identified [06-94]
Disability Targeted Disability
[16,17] Deafness
[23,25] Blindness
[28,32-38] Missing Limbs
[64-68] Partial
Paralysis
[71-78] Total
Paralysis
[82] Convulsive
Disorder
[90] Mental Retardation
[91] Mental Illness
[92] Dist. of
Limb/Spine
Schedule A Applications # 0 0 0 0 0 0 0 0 0 0 0 0 0 0
% 0.00% 0.00% 0.00% 0.00% 0.00% 0.00% 0.00% 0.00% 0.00% 0.00% 0.00% 0.00% 0.00% 0.00%
Hires # 0 0 0 0 0 0 0 0 0 0 0 0 0 0
% 0.00% 0.00% 0.00% 0.00% 0.00% 0.00% 0.00% 0.00% 0.00% 0.00% 0.00% 0.00% 0.00% 0.00%
Voluntarily Identified (Outside of Schedule A) Applications # 16727 14674 1274 779 0 0 0 0 0 0 0 0 0 0
% 100.00% 87.73% 7.62% 87.73% 0.00% 0.00% 0.00% 0.00% 0.00% 0.00% 0.00% 0.00% 0.00% 0.00%
Hires # 63 56 5 2 0 0 0 0 0 0 0 0 0 0
% 100.00% 88.89% 7.94% 3.17% 0.00% 0.00% 0.00% 0.00% 0.00% 0.00% 0.00% 0.00% 0.00% 0.00%
* This report only returns data for people who chose to report their EEO data while in the application system. Applicants have the option to decline to report.

Table B7: APPLICANTS AND HIRES by Disability Temporary Workforce Total Total by Disability Status Detail for Targeted Disabilities
[05] No Disability
[01] Not Identified
[06-94] Disability
Targeted Disability
[16,17] Deafness
[23,25] Blindness
[28,32-38] Missing Limbs
[64-68] Partial
Paralysis
[71-78] Total
Paralysis
[82] Convulsive
Disorder
[90] Mental Retardation
[91] Mental Illness
[92] Dist. of
Limb/Spine
Schedule A Applications # 0 0 0 0 0 0 0 0 0 0 0 0 0 0
% 0.00% 0.00% 0.00% 0.00% 0.00% 0.00% 0.00% 0.00% 0.00% 0.00% 0.00% 0.00% 0.00% 0.00%
Hires # 0 0 0 0 0 0 0 0 0 0 0 0 0 0
% 0.00% 0.00% 0.00% 0.00% 0.00% 0.00% 0.00% 0.00% 0.00% 0.00% 0.00% 0.00% 0.00% 0.00%
Voluntarily Identified (Outside of Schedule A) Applications # 10429 9663 532 234 0 0 0 0 0 0 0 0 0 0
% 100.00% 92.66% 5.10% 92.66% 0.00% 0.00% 0.00% 0.00% 0.00% 0.00% 0.00% 0.00% 0.00% 0.00%
Hires # 32 28 2 2 0 0 0 0 0 0 0 0 0 0
% 100.00% 87.50% 6.25% 6.25% 0.00% 0.00% 0.00% 0.00% 0.00% 0.00% 0.00% 0.00% 0.00% 0.00%
* This report only returns data for people who chose to report their EEO data while in the application system. Applicants have the option to decline to report.

NSF NATIONAL SCIENCE FOUNDATION (DEPT ALL) For Period ( 2012-10-08 TO 2013-10-
Table B8: NEW HIRES BY TYPE OF APPOINTMENT - Distribution by Disability
06 )
Type of Appointment Total
Total by Disability Status Detail for Targeted Disabilities
(04,05) No
Disability
-1 Not
Identified
(06-98) Disability
Targeted Disability
(16,19) Deafness
(21,23,25) Blindness
(28,30,32-38) Missing
Limbs/ Extremities
(64-69) Partial
Paralysis
(71-79) Total
Paralysis
-82 Convulsive
Disorder/ Epilepsy
-90 Mental
Retardation/ Severe Intellectual Disability
-91 Mental
Illness/ Psychiatric Disabilty
-92 Distortion
Limb-Spine/ Dwarfism
Permanent # 78 69 1 8 2 0 0 0 0 1 1 0 0 0 % 100% 88.46% 1.28% 10.26% 2.56% 0.00% 0.00% 0.00% 0.00% 1.28% 1.28% 0.00% 0.00% 0.00%
Temporary # 179 167 2 10 0 0 0 0 0 0 0 0 0 0 % 100% 93.30% 1.12% 5.59% 0.00% 0.00% 0.00% 0.00% 0.00% 0.00% 0.00% 0.00% 0.00% 0.00%
Total # 257 236 3 18 2 0 0 0 0 1 1 0 0 0 % 100% 91.83% 1.17% 7.00% 0.78% 0.00% 0.00% 0.00% 0.00% 0.39% 0.39% 0.00% 0.00% 0.00%

Table B9: SELECTIONS FOR INTERNAL COMPETITIVE PROMOTIONS for Major Occupations by Disability Total Total by Disability Status Detail for Targeted Disabilities
[05] No Disability
[01] Not Identified
[06-94] Disability
Targeted Disability
[16,17] Deafness
[23,25] Blindness
[28,32-38] Missing Limbs
[64-68] Partial
Paralysis
[71-78] Total
Paralysis
[82] Convulsive
Disorder
[90] Mental Retardation
[91] Mental Illness
[92] Dist. of
Limb/Spine
Series: 0101 SCIENCE RESOURCE ANALYST Total Applications Received
# 8 6 2 0 0 0 0 0 0 0 0 0 0 0
% 100.00% 75.00% 25.00% 0.00% 0.00% 0.00% 0.00% 0.00% 0.00% 0.00% 0.00% 0.00% 0.00% 0.00%
Qualified # 1 1 0 0 0 0 0 0 0 0 0 0 0 0
% 100.00% 100.00% 0.00% 0.00% 0.00% 0.00% 0.00% 0.00% 0.00% 0.00% 0.00% 0.00% 0.00% 0.00%
Selected # 0 0 0 0 0 0 0 0 0 0 0 0 0 0
% 0.00% 0.00% 0.00% 0.00% 0.00% 0.00% 0.00% 0.00% 0.00% 0.00% 0.00% 0.00% 0.00% 0.00%
Relevant Applicant Pool %
%
Series: 0401 GENERAL BIOLOGICAL SCIENCE Total Applications Received
# 12 10 2 0 0 0 0 0 0 0 0 0 0 0
% 100.00% 83.33% 16.67% 0.00% 0.00% 0.00% 0.00% 0.00% 0.00% 0.00% 0.00% 0.00% 0.00% 0.00%
Qualified # 2 2 0 0 0 0 0 0 0 0 0 0 0 0
% 100.00% 100.00% 0.00% 0.00% 0.00% 0.00% 0.00% 0.00% 0.00% 0.00% 0.00% 0.00% 0.00% 0.00%
Selected # 0 0 0 0 0 0 0 0 0 0 0 0 0 0
% 0.00% 0.00% 0.00% 0.00% 0.00% 0.00% 0.00% 0.00% 0.00% 0.00% 0.00% 0.00% 0.00% 0.00%
Relevant Applicant Pool %
%
Series: 1301 GENERAL PHYSICAL SCIENCE Total Applications Received
# 12 10 1 1 0 0 0 0 0 0 0 0 0 0
% 100.00% 83.33% 8.33% 8.33% 0.00% 0.00% 0.00% 0.00% 0.00% 0.00% 0.00% 0.00% 0.00% 0.00%
Qualified # 1 1 0 0 0 0 0 0 0 0 0 0 0 0
% 100.00% 100.00% 0.00% 0.00% 0.00% 0.00% 0.00% 0.00% 0.00% 0.00% 0.00% 0.00% 0.00% 0.00%
Selected # 1 1 0 0 0 0 0 0 0 0 0 0 0 0
% 100.00% 100.00% 0.00% 0.00% 0.00% 0.00% 0.00% 0.00% 0.00% 0.00% 0.00% 0.00% 0.00% 0.00%
Relevant Applicant Pool %
%
Series: 1350 GEOLOGIST Total Applications Received
# 1 1 0 0 0 0 0 0 0 0 0 0 0 0
% 100.00% 100.00% 0.00% 0.00% 0.00% 0.00% 0.00% 0.00% 0.00% 0.00% 0.00% 0.00% 0.00% 0.00%
Qualified # 1 1 0 0 0 0 0 0 0 0 0 0 0 0
% 100.00% 100.00% 0.00% 0.00% 0.00% 0.00% 0.00% 0.00% 0.00% 0.00% 0.00% 0.00% 0.00% 0.00%
Selected # 0 0 0 0 0 0 0 0 0 0 0 0 0 0

Table B9: SELECTIONS FOR INTERNAL COMPETITIVE PROMOTIONS for Major Occupations by Disability Total Total by Disability Status Detail for Targeted Disabilities
[05] No Disability
[01] Not Identified
[06-94] Disability
Targeted Disability
[16,17] Deafness
[23,25] Blindness
[28,32-38] Missing Limbs
[64-68] Partial
Paralysis
[71-78] Total
Paralysis
[82] Convulsive
Disorder
[90] Mental Retardation
[91] Mental Illness
[92] Dist. of
Limb/Spine
% 0.00% 0.00% 0.00% 0.00% 0.00% 0.00% 0.00% 0.00% 0.00% 0.00% 0.00% 0.00% 0.00% 0.00%
Relevant Applicant Pool %
%
Series: 1701 GENERAL EDUCATION AND TRAINING Total Applications Received
# 14 13 1 0 0 0 0 0 0 0 0 0 0 0
% 100.00% 92.86% 7.14% 0.00% 0.00% 0.00% 0.00% 0.00% 0.00% 0.00% 0.00% 0.00% 0.00% 0.00%
Qualified # 1 1 0 0 0 0 0 0 0 0 0 0 0 0
% 100.00% 100.00% 0.00% 0.00% 0.00% 0.00% 0.00% 0.00% 0.00% 0.00% 0.00% 0.00% 0.00% 0.00%
Selected # 0 0 0 0 0 0 0 0 0 0 0 0 0 0
% 0.00% 0.00% 0.00% 0.00% 0.00% 0.00% 0.00% 0.00% 0.00% 0.00% 0.00% 0.00% 0.00% 0.00%
Relevant Applicant Pool %
%
* This report only returns data for people who chose to report their EEO data while in the application system. Applicants have the option to decline to report.

NSF NATIONAL SCIENCE FOUNDATION (DEPT ALL) Pay Period 201321
Table B10 - Non-Competitive Promotions - Time in Grade - By Disability - Permanent Workforce
Employment Tenure Total
Total by Disability Status Detail for Targeted Disabilities
(04,05) No
Disability
-1 Not
Identified
(06-98) Disability
Targeted Disability
(16,19) Deafness
(21,23,25) Blindness
(28,30,32-38) Missing
Limbs/ Extremities
(64-69) Partial
Paralysis
(71-79) Total
Paralysis
-82 Convulsive
Disorder/ Epilepsy
-90 Mental
Retardation/ Severe Intellectual Disability
-91 Mental
Illness/ Psychiatric Disabilty
-92 Distortion
Limb-Spine/ Dwarfism
Total Employees Eligible for Career Ladder Promotions
# 100 85 4 11 1 0 0 0 0 1 0 0 0 0
% 100% 85.00% 4.00% 11.00% 1.00% 0.00% 0.00% 0.00% 0.00% 1.00% 0.00% 0.00% 0.00% 0.00% Time in Grade Excess of Minimum
1-12 Months
# 10 7 2 1 0 0 0 0 0 0 0 0 0 0 % 100% 70.00% 20.00% 10.00% 0.00% 0.00% 0.00% 0.00% 0.00% 0.00% 0.00% 0.00% 0.00% 0.00%
13-24 Months
# 2 2 0 0 0 0 0 0 0 0 0 0 0 0 % 100% 100.00% 0.00% 0.00% 0.00% 0.00% 0.00% 0.00% 0.00% 0.00% 0.00% 0.00% 0.00% 0.00%
25 + Months
# 3 3 0 0 0 0 0 0 0 0 0 0 0 0 % 100% 100.00% 0.00% 0.00% 0.00% 0.00% 0.00% 0.00% 0.00% 0.00% 0.00% 0.00% 0.00% 0.00%
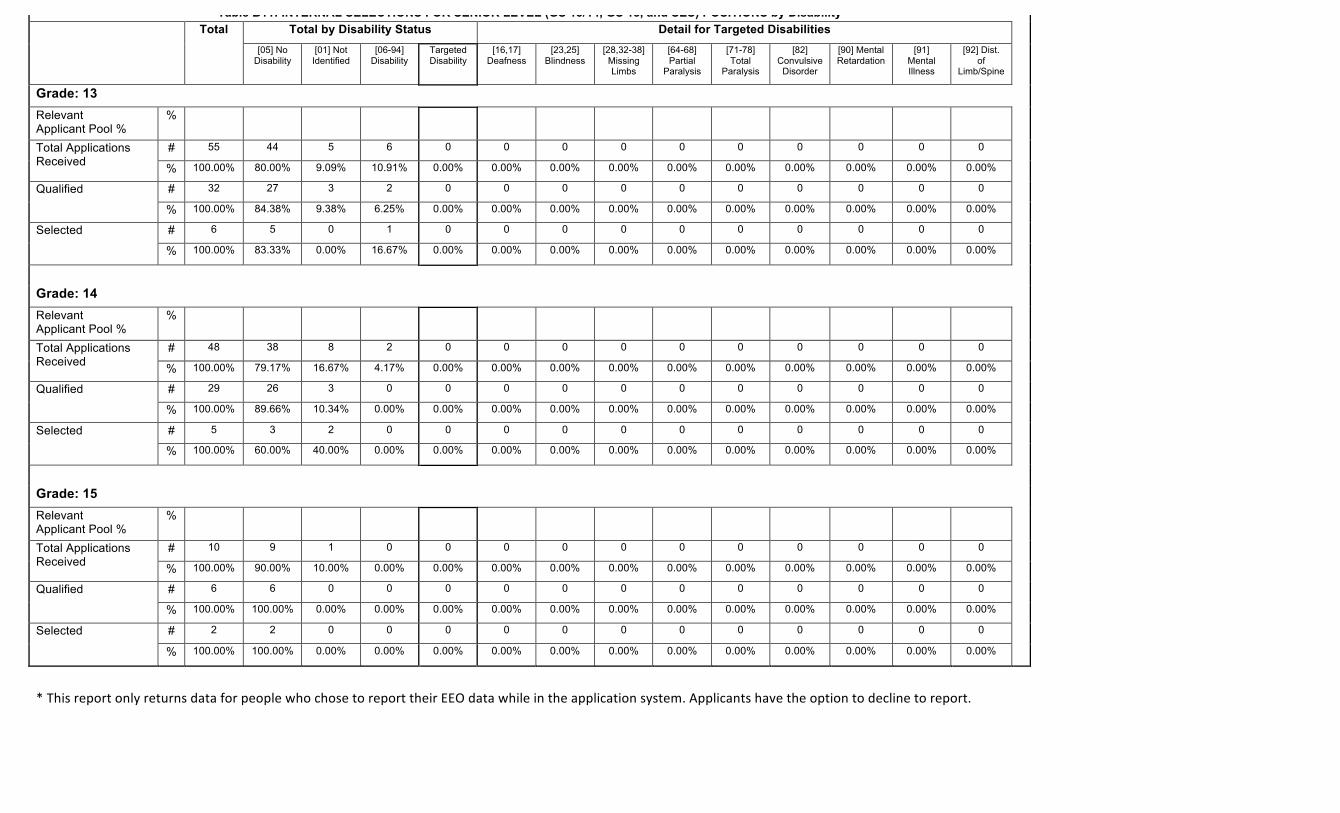
Table B11: INTERNAL SELECTIONS FOR SENIOR LEVEL (GS 13/14, GS 15, and SES) POSITIONS by Disability Total Total by Disability Status Detail for Targeted Disabilities
[05] No Disability
[01] Not Identified
[06-94] Disability
Targeted Disability
[16,17] Deafness
[23,25] Blindness
[28,32-38] Missing Limbs
[64-68] Partial
Paralysis
[71-78] Total
Paralysis
[82] Convulsive
Disorder
[90] Mental Retardation
[91] Mental Illness
[92] Dist. of
Limb/Spine
Grade: 13 Relevant Applicant Pool %
%
Total Applications Received
# 55 44 5 6 0 0 0 0 0 0 0 0 0 0
% 100.00% 80.00% 9.09% 10.91% 0.00% 0.00% 0.00% 0.00% 0.00% 0.00% 0.00% 0.00% 0.00% 0.00%
Qualified # 32 27 3 2 0 0 0 0 0 0 0 0 0 0
% 100.00% 84.38% 9.38% 6.25% 0.00% 0.00% 0.00% 0.00% 0.00% 0.00% 0.00% 0.00% 0.00% 0.00%
Selected # 6 5 0 1 0 0 0 0 0 0 0 0 0 0
% 100.00% 83.33% 0.00% 16.67% 0.00% 0.00% 0.00% 0.00% 0.00% 0.00% 0.00% 0.00% 0.00% 0.00%
Grade: 14 Relevant Applicant Pool %
%
Total Applications Received
# 48 38 8 2 0 0 0 0 0 0 0 0 0 0
% 100.00% 79.17% 16.67% 4.17% 0.00% 0.00% 0.00% 0.00% 0.00% 0.00% 0.00% 0.00% 0.00% 0.00%
Qualified # 29 26 3 0 0 0 0 0 0 0 0 0 0 0
% 100.00% 89.66% 10.34% 0.00% 0.00% 0.00% 0.00% 0.00% 0.00% 0.00% 0.00% 0.00% 0.00% 0.00%
Selected # 5 3 2 0 0 0 0 0 0 0 0 0 0 0
% 100.00% 60.00% 40.00% 0.00% 0.00% 0.00% 0.00% 0.00% 0.00% 0.00% 0.00% 0.00% 0.00% 0.00%
Grade: 15 Relevant Applicant Pool %
%
Total Applications Received
# 10 9 1 0 0 0 0 0 0 0 0 0 0 0
% 100.00% 90.00% 10.00% 0.00% 0.00% 0.00% 0.00% 0.00% 0.00% 0.00% 0.00% 0.00% 0.00% 0.00%
Qualified # 6 6 0 0 0 0 0 0 0 0 0 0 0 0
% 100.00% 100.00% 0.00% 0.00% 0.00% 0.00% 0.00% 0.00% 0.00% 0.00% 0.00% 0.00% 0.00% 0.00%
Selected # 2 2 0 0 0 0 0 0 0 0 0 0 0 0
% 100.00% 100.00% 0.00% 0.00% 0.00% 0.00% 0.00% 0.00% 0.00% 0.00% 0.00% 0.00% 0.00% 0.00%
* This report only returns data for people who chose to report their EEO data while in the application system. Applicants have the option to decline to report.

Table B12: This data is not available for the National Science Foundation, FY12

NSF NATIONAL SCIENCE FOUNDATION (DEPT ALL) For Period ( 2012-10-08 TO 2013-10-06 )
Table B13 - Employee Recognition and Awards - Distribution by Disability - Permanent Workforce
Employment Tenure Total
Total by Disability Status Detail for Targeted Disabilities
(04,05) No
Disability
-1 Not
Identified
(06-98) Disability
Targeted Disability
(16,19) Deafness
(21,23,25) Blindness
(28,30,32-38) Missing
Limbs/ Extremities
(64-69) Partial
Paralysis
(71-79) Total
Paralysis
-82 Convulsive
Disorder/ Epilepsy
-90 Mental
Retardation/ Severe Intellectual Disability
-91 Mental
Illness/ Psychiatric Disabilty
-92 Distortion
Limb-Spine/ Dwarfism
Time-Off Awards - 1-9 hours Total Time-Off Awards Given
# 113 105 1 7 2 0 0 0 1 0 0 0 1 0
% 100% 92.92% 0.88% 6.19% 1.77% 0.00% 0.00% 0.00% 0.88% 0.00% 0.00% 0.00% 0.88% 0.00%
Total Hours 698 652 8 38 12 0 0 0 4 0 0 0 8 0
Average Hours 6 6 8 5 6 0 0 0 4 0 0 0 8 0
Time-Off Awards - 9+ hours Total Time-Off Awards Given
# 29 26 2 1 0 0 0 0 0 0 0 0 0 0
% 100% 89.66% 6.90% 3.45% 0.00% 0.00% 0.00% 0.00% 0.00% 0.00% 0.00% 0.00% 0.00% 0.00%
Total Hours 536 488 32 16 0 0 0 0 0 0 0 0 0 0
Average Hours 18 19 16 16 0 0 0 0 0 0 0 0 0 0
Cash Awards - $100 - $500 Total Cash Awards Given
# 0 0 0 0 0 0 0 0 0 0 0 0 0 0
% 0% 0% 0% 0% 0% 0% 0% 0% 0% 0% 0% 0% 0% 0%
Total Amount $0 $0 $0 $0 $0 $0 $0 $0 $0 $0 $0 $0 $0 $0
Average Amount 0 0 0 0 0 0 0 0 0 0 0 0 0 0
Cash Awards - $501+ Total Cash Awards Given
# 0 0 0 0 0 0 0 0 0 0 0 0 0 0
% 0% 0% 0% 0% 0% 0% 0% 0% 0% 0% 0% 0% 0% 0%
Total Amount $0 $0 $0 $0 $0 $0 $0 $0 $0 $0 $0 $0 $0 $0
Average Amount 0 0 0 0 0 0 0 0 0 0 0 0 0 0
Senior Executive Service Performance Awards Total Cash Awards Given
# 66 60 1 5 0 0 0 0 0 0 0 0 0 0
% 100% 90.91% 1.52% 7.58% 0.00% 0.00% 0.00% 0.00% 0.00% 0.00% 0.00% 0.00% 0.00% 0.00%
Total Amount $687,247 $627,836 $8,070 $51,341 $0 $0 $0 $0 $0 $0 $0 $0 $0 $0
Average Amount $10,413 $10,464 $8,070 $10,268 0 0 0 0 0 0 0 0 0 0
Quality Step Increases(QSI) Total Cash Awards Given
# 120 109 3 8 1 0 0 0 0 0 0 0 1 0
% 100% 90.83% 2.50% 6.67% 0.83% 0.00% 0.00% 0.00% 0.00% 0.00% 0.00% 0.00% 0.83% 0.00%
Total Amount $314,000 $291,908 $6,583 $15,509 $2,495 $0 $0 $0 $0 $0 $0 $0 $2,495 $0
Average Amount $2,617 $2,678 $2,194 $1,939 $2,495 0 0 0 0 0 0 0 $2,495 0

NSF NATIONAL SCIENCE FOUNDATION (DEPT ALL) For Period ( 2012-10-08 TO 2013-10-06 )
Table B13 - Employee Recognition and Awards - Distribution by Disability - Temporary Workforce
Employment Tenure Total
Total by Disability Status Detail for Targeted Disabilities
(04,05) No
Disability
-1 Not
Identified
(06-98) Disability
Targeted Disability
(16,19) Deafness
(21,23,25) Blindness
(28,30,32-38) Missing
Limbs/ Extremities
(64-69) Partial
Paralysis
(71-79) Total
Paralysis
-82 Convulsive
Disorder/ Epilepsy
-90 Mental
Retardation/ Severe Intellectual Disability
-91 Mental
Illness/ Psychiatric Disabilty
-92 Distortion
Limb-Spine/ Dwarfism
Time-Off Awards - 1-9 hours Total Time-Off Awards Given
# 3 3 0 0 0 0 0 0 0 0 0 0 0 0
% 100% 100.00% 0.00% 0.00% 0.00% 0.00% 0.00% 0.00% 0.00% 0.00% 0.00% 0.00% 0.00% 0.00%
Total Hours 24 24 0 0 0 0 0 0 0 0 0 0 0 0
Average Hours 8 8 0 0 0 0 0 0 0 0 0 0 0 0
Time-Off Awards - 9+ hours Total Time-Off Awards Given
# 0 0 0 0 0 0 0 0 0 0 0 0 0 0
% 0% 0% 0% 0% 0% 0% 0% 0% 0% 0% 0% 0% 0% 0%
Total Hours 0 0 0 0 0 0 0 0 0 0 0 0 0 0
Average Hours 0 0 0 0 0 0 0 0 0 0 0 0 0 0
Cash Awards - $100 - $500 Total Cash Awards Given
# 0 0 0 0 0 0 0 0 0 0 0 0 0 0
% 0% 0% 0% 0% 0% 0% 0% 0% 0% 0% 0% 0% 0% 0%
Total Amount $0 $0 $0 $0 $0 $0 $0 $0 $0 $0 $0 $0 $0 $0
Average Amount 0 0 0 0 0 0 0 0 0 0 0 0 0 0
Cash Awards - $501+ Total Cash Awards Given
# 0 0 0 0 0 0 0 0 0 0 0 0 0 0
% 0% 0% 0% 0% 0% 0% 0% 0% 0% 0% 0% 0% 0% 0%
Total Amount $0 $0 $0 $0 $0 $0 $0 $0 $0 $0 $0 $0 $0 $0
Average Amount 0 0 0 0 0 0 0 0 0 0 0 0 0 0 Senior Executive Service Performance Awards Total Cash Awards Given
# 0 0 0 0 0 0 0 0 0 0 0 0 0 0
% 0% 0% 0% 0% 0% 0% 0% 0% 0% 0% 0% 0% 0% 0%
Total Amount $0 $0 $0 $0 $0 $0 $0 $0 $0 $0 $0 $0 $0 $0
Average Amount 0 0 0 0 0 0 0 0 0 0 0 0 0 0
Quality Step Increases(QSI) Total Cash Awards Given
# 0 0 0 0 0 0 0 0 0 0 0 0 0 0
% 0% 0% 0% 0% 0% 0% 0% 0% 0% 0% 0% 0% 0% 0%
Total Amount $0 $0 $0 $0 $0 $0 $0 $0 $0 $0 $0 $0 $0 $0
Average Amount 0 0 0 0 0 0 0 0 0 0 0 0 0 0
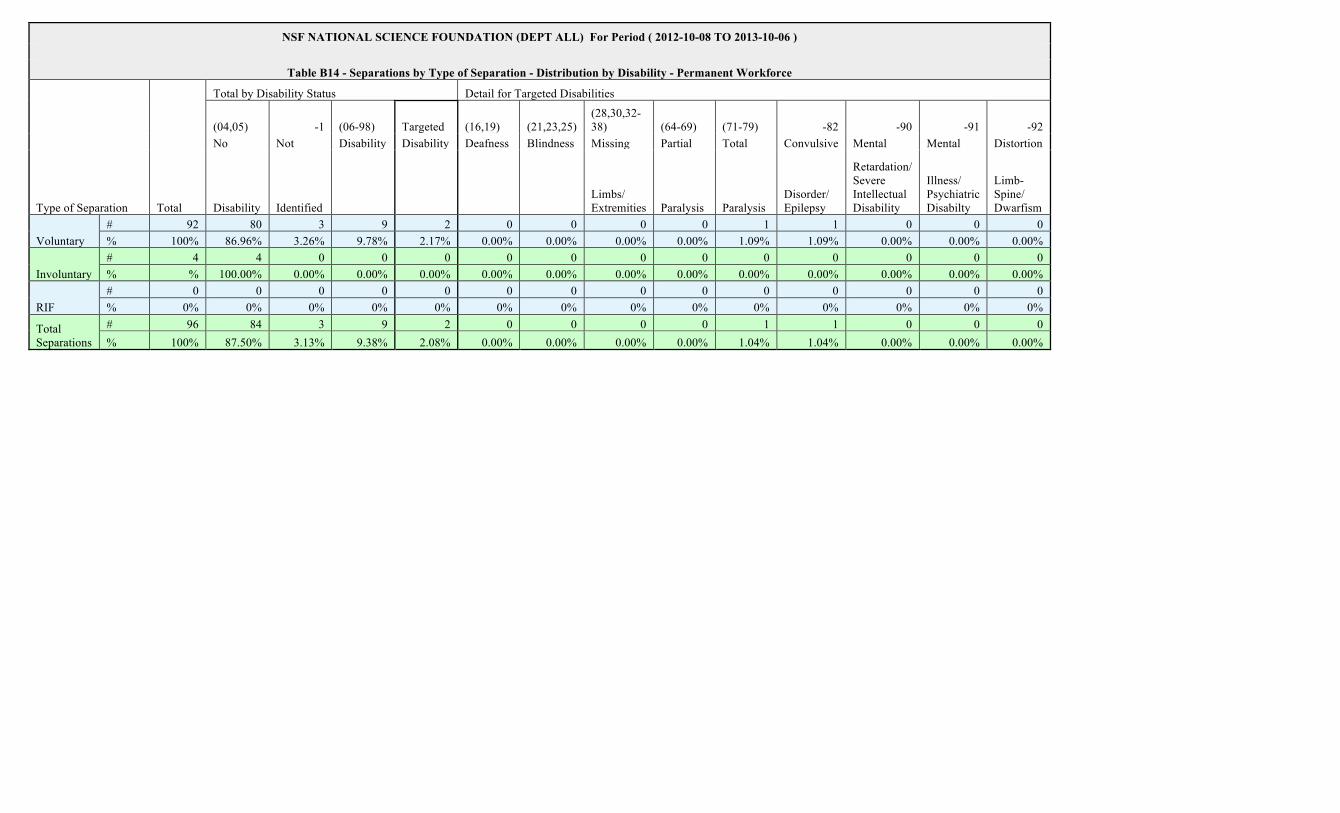
NSF NATIONAL SCIENCE FOUNDATION (DEPT ALL) For Period ( 2012-10-08 TO 2013-10-06 )
Table B14 - Separations by Type of Separation - Distribution by Disability - Permanent Workforce
Type of Separation Total
Total by Disability Status Detail for Targeted Disabilities
(04,05) No
Disability
-1 Not
Identified
(06-98) Disability
Targeted Disability
(16,19) Deafness
(21,23,25) Blindness
(28,30,32-38) Missing
Limbs/ Extremities
(64-69) Partial
Paralysis
(71-79) Total
Paralysis
-82 Convulsive
Disorder/ Epilepsy
-90 Mental
Retardation/ Severe Intellectual Disability
-91 Mental
Illness/ Psychiatric Disabilty
-92 Distortion
Limb-Spine/ Dwarfism
Voluntary # 92 80 3 9 2 0 0 0 0 1 1 0 0 0 % 100% 86.96% 3.26% 9.78% 2.17% 0.00% 0.00% 0.00% 0.00% 1.09% 1.09% 0.00% 0.00% 0.00%
Involuntary # 4 4 0 0 0 0 0 0 0 0 0 0 0 0 % % 100.00% 0.00% 0.00% 0.00% 0.00% 0.00% 0.00% 0.00% 0.00% 0.00% 0.00% 0.00% 0.00%
RIF # 0 0 0 0 0 0 0 0 0 0 0 0 0 0 % 0% 0% 0% 0% 0% 0% 0% 0% 0% 0% 0% 0% 0% 0%
Total Separations
# 96 84 3 9 2 0 0 0 0 1 1 0 0 0 % 100% 87.50% 3.13% 9.38% 2.08% 0.00% 0.00% 0.00% 0.00% 1.04% 1.04% 0.00% 0.00% 0.00%