Embed Size (px)
Citation preview
NSF International
789 N. Dixboro Rd. Ann Arbor, MI 48015, USA 1-800.NSF.MARK | +1-734.769.8010 | www.nsf.org
SN: n/a PSF: n/a Page 1 of 15 This report shall not be reproduced, except in its entirety, without the written approval of NSF. This report does not represent NSF Certification or authorization to use the NSF Mark. Authorization to use the NSF Mark is limited to products appearing in the Company’s Official NSF Listing (www.nsf.org). The results relate only to those items tested, in the condition received at the laboratory.
TEST REPORT
Send To: Mr. Bob G. Vincent Environmental Administrator, FL Dept of Health Div. of Disease Control and Health Protection
Facility: Bur. of Environmental Health, Water Programs Tallahassee, FL
Result: COMPLETE Report Date: 17-FEB-1015 Customer Name: Mr. Bob G. Vincent
Tested To: Procedure contained within this report
Tested Location: NSF International, 789 N. Dixboro Rd., Ann Arbor, MI 48105
Test Date(s): February 3-4, 2015
Description: Recovery analysis of free and total chlorine measurement methods in high MgSO4 solution
Test Type: Test Only
Job Number: n/a
Project Number: n/a
Project Manager: n/a
Executive Summary: An analysis was performed on three methods for the measurement of free and total chlorine in
pool water with a high MgSO4 concentration. The Hach DPD AccuVac method gave the best average percent recovery, but presented significant repeatability issues. The LaMotte InstaTest Free & Total Chlorine test strip appeared to be the most reliable of the three tested methods, but gave low recovery rates. The Hach AquaChek test strip was greatly affected by the high concentration of MgSO4.
Further investigation should be considered with respect to measurement accuracy in the
presence of high combined chlorine levels (i.e. low free, high total), the effect of dilution levels on DPD analysis, and the type of DPD sample vial used (non-AccuVac style).
Thank you for having your product tested by NSF International. Please contact your Project Manager if you have any questions or concerns pertaining to this report.
Report Authorization: Kevin Schaefer – Senior Engineer, Engineering Laboratory
SN: n/a PSF: n/a Page 2 of 15 This report shall not be reproduced, except in its entirety, without the written approval of NSF. This report does not represent NSF Certification or authorization to use the NSF Mark. Authorization to use the NSF Mark is limited to products appearing in the Company’s Official NSF Listing (www.nsf.org). The results relate only to those items tested, in the condition received at the laboratory.
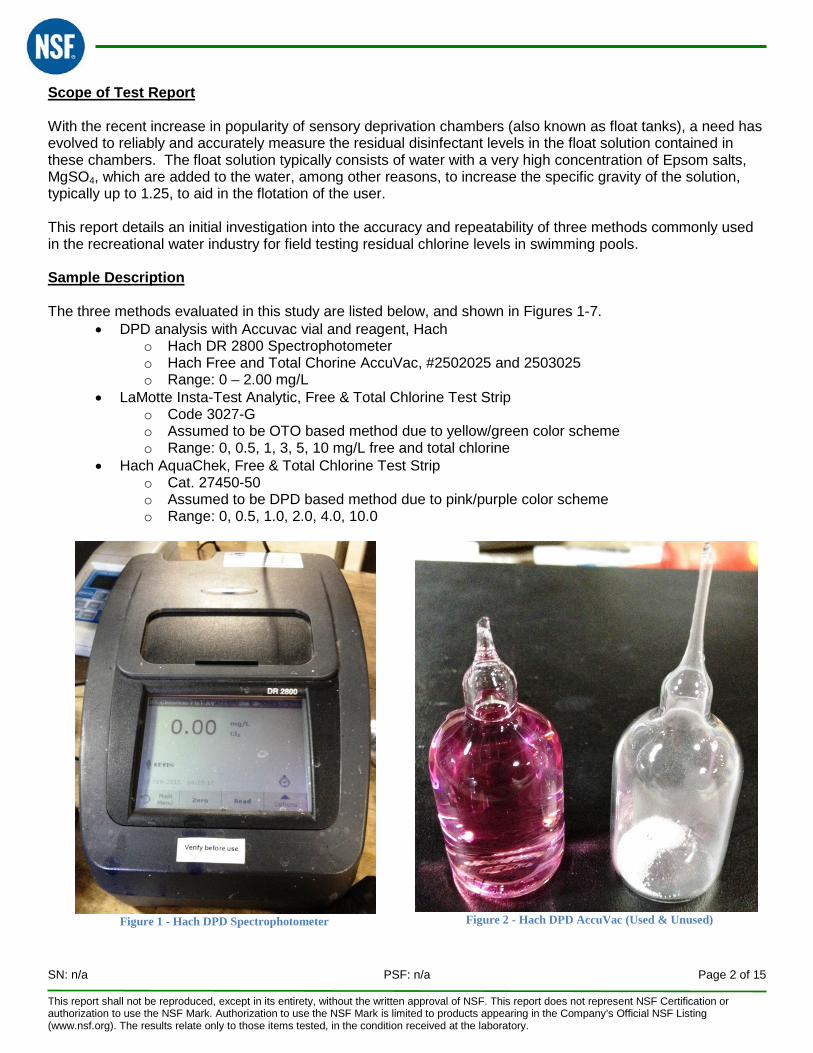
Scope of Test Report With the recent increase in popularity of sensory deprivation chambers (also known as float tanks), a need has evolved to reliably and accurately measure the residual disinfectant levels in the float solution contained in these chambers. The float solution typically consists of water with a very high concentration of Epsom salts, MgSO4, which are added to the water, among other reasons, to increase the specific gravity of the solution, typically up to 1.25, to aid in the flotation of the user. This report details an initial investigation into the accuracy and repeatability of three methods commonly used in the recreational water industry for field testing residual chlorine levels in swimming pools. Sample Description The three methods evaluated in this study are listed below, and shown in Figures 1-7.
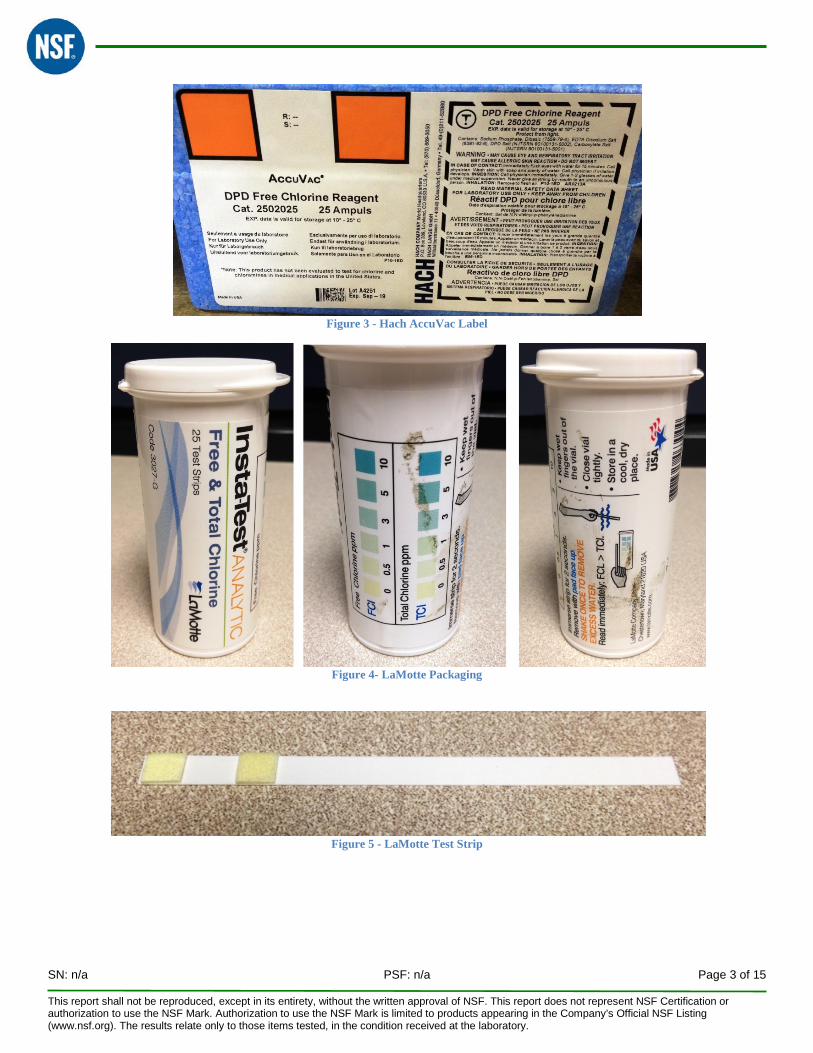
• DPD analysis with Accuvac vial and reagent, Hach o Hach DR 2800 Spectrophotometer o Hach Free and Total Chorine AccuVac, #2502025 and 2503025 o Range: 0 – 2.00 mg/L
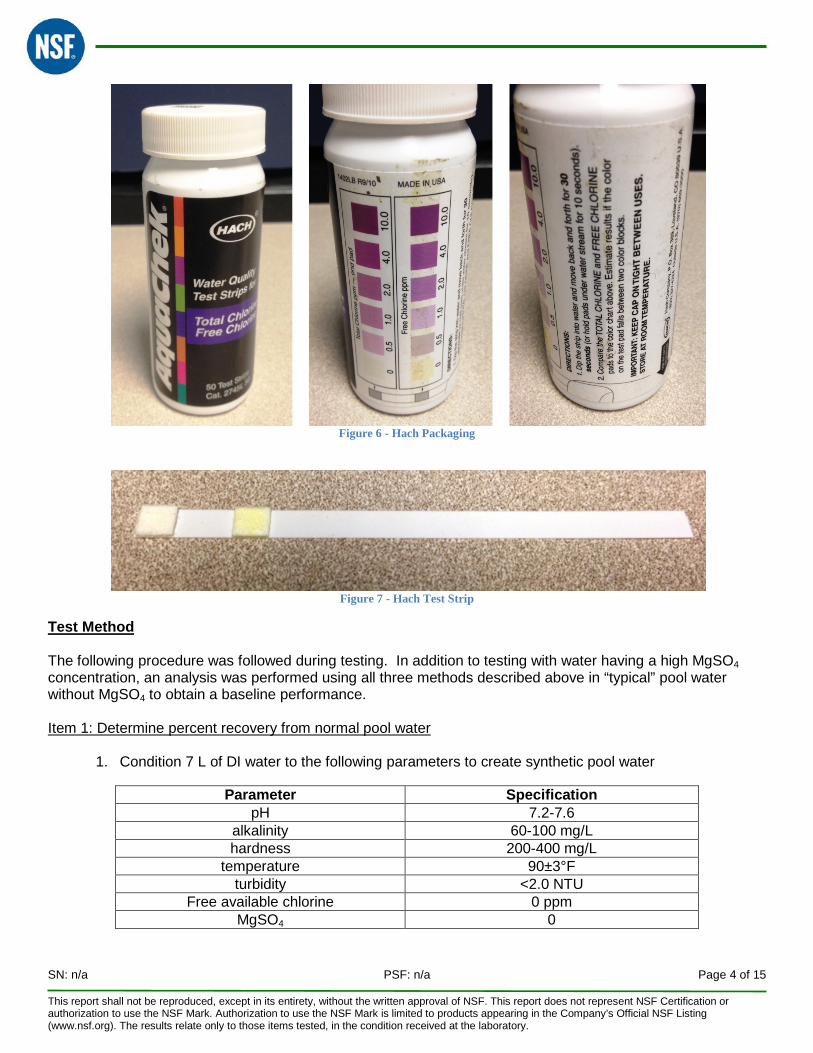
• LaMotte Insta-Test Analytic, Free & Total Chlorine Test Strip o Code 3027-G o Assumed to be OTO based method due to yellow/green color scheme o Range: 0, 0.5, 1, 3, 5, 10 mg/L free and total chlorine
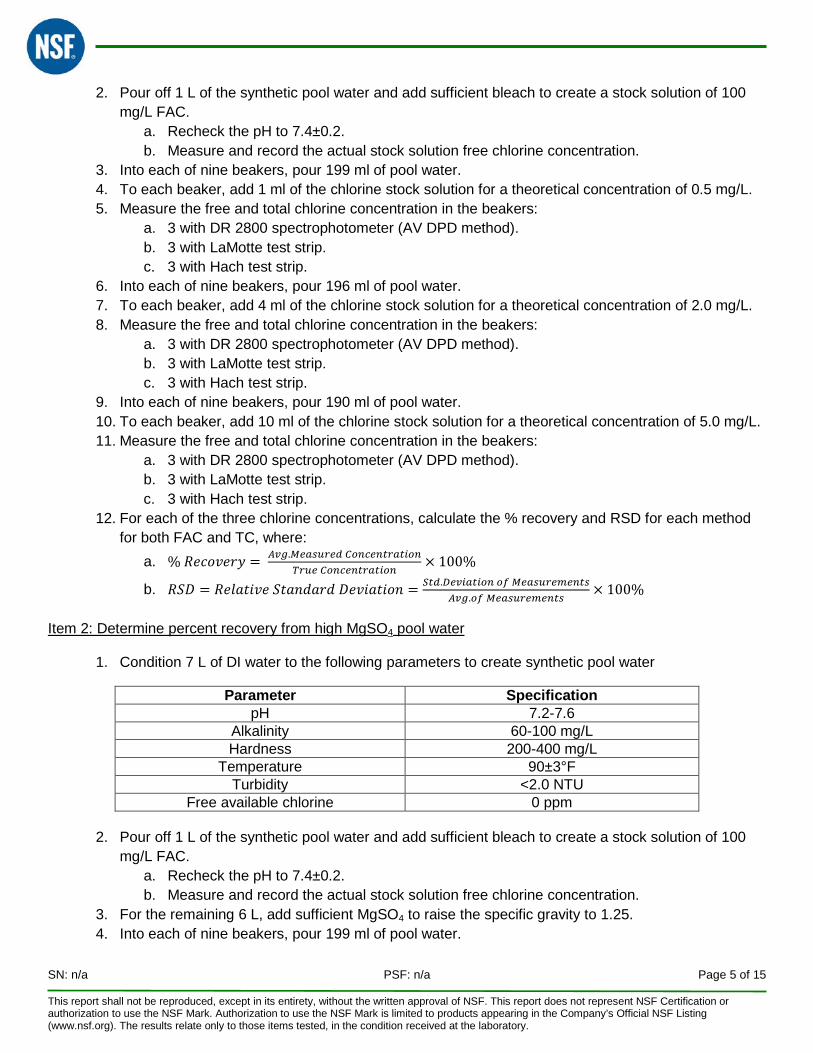
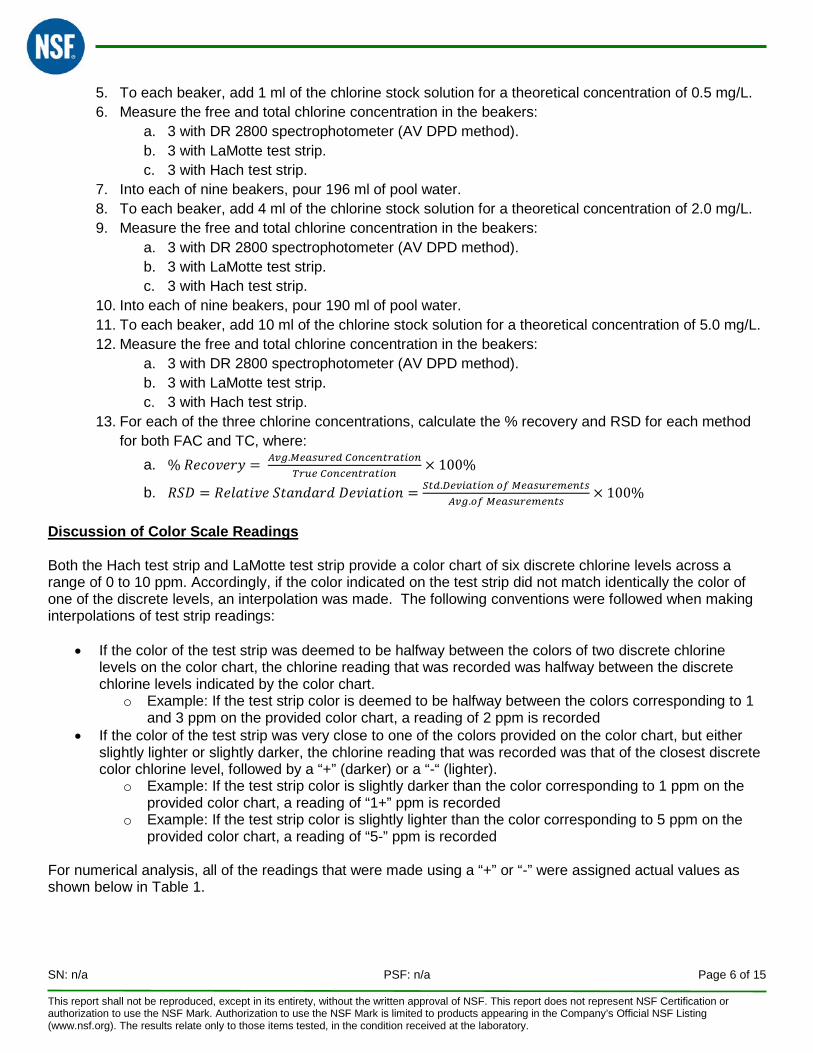
• Hach AquaChek, Free & Total Chlorine Test Strip o Cat. 27450-50 o Assumed to be DPD based method due to pink/purple color scheme o Range: 0, 0.5, 1.0, 2.0, 4.0, 10.0
Figure 1 - Hach DPD Spectrophotometer
Figure 2 - Hach DPD AccuVac (Used & Unused)
SN: n/a PSF: n/a Page 3 of 15 This report shall not be reproduced, except in its entirety, without the written approval of NSF. This report does not represent NSF Certification or authorization to use the NSF Mark. Authorization to use the NSF Mark is limited to products appearing in the Company’s Official NSF Listing (www.nsf.org). The results relate only to those items tested, in the condition received at the laboratory.
Figure 3 - Hach AccuVac Label
Figure 4- LaMotte Packaging
Figure 5 - LaMotte Test Strip
SN: n/a PSF: n/a Page 4 of 15 This report shall not be reproduced, except in its entirety, without the written approval of NSF. This report does not represent NSF Certification or authorization to use the NSF Mark. Authorization to use the NSF Mark is limited to products appearing in the Company’s Official NSF Listing (www.nsf.org). The results relate only to those items tested, in the condition received at the laboratory.
Figure 6 - Hach Packaging
Figure 7 - Hach Test Strip
Test Method The following procedure was followed during testing. In addition to testing with water having a high MgSO4 concentration, an analysis was performed using all three methods described above in “typical” pool water without MgSO4 to obtain a baseline performance. Item 1: Determine percent recovery from normal pool water
1. Condition 7 L of DI water to the following parameters to create synthetic pool water
Parameter Specification pH 7.2-7.6
alkalinity 60-100 mg/L hardness 200-400 mg/L
temperature 90±3°F turbidity <2.0 NTU
Free available chlorine 0 ppm MgSO4 0
SN: n/a PSF: n/a Page 5 of 15 This report shall not be reproduced, except in its entirety, without the written approval of NSF. This report does not represent NSF Certification or authorization to use the NSF Mark. Authorization to use the NSF Mark is limited to products appearing in the Company’s Official NSF Listing (www.nsf.org). The results relate only to those items tested, in the condition received at the laboratory.
2. Pour off 1 L of the synthetic pool water and add sufficient bleach to create a stock solution of 100 mg/L FAC.
a. Recheck the pH to 7.4±0.2. b. Measure and record the actual stock solution free chlorine concentration.
3. Into each of nine beakers, pour 199 ml of pool water. 4. To each beaker, add 1 ml of the chlorine stock solution for a theoretical concentration of 0.5 mg/L. 5. Measure the free and total chlorine concentration in the beakers:
a. 3 with DR 2800 spectrophotometer (AV DPD method). b. 3 with LaMotte test strip. c. 3 with Hach test strip.
6. Into each of nine beakers, pour 196 ml of pool water. 7. To each beaker, add 4 ml of the chlorine stock solution for a theoretical concentration of 2.0 mg/L. 8. Measure the free and total chlorine concentration in the beakers:
a. 3 with DR 2800 spectrophotometer (AV DPD method). b. 3 with LaMotte test strip. c. 3 with Hach test strip.
9. Into each of nine beakers, pour 190 ml of pool water. 10. To each beaker, add 10 ml of the chlorine stock solution for a theoretical concentration of 5.0 mg/L. 11. Measure the free and total chlorine concentration in the beakers:
a. 3 with DR 2800 spectrophotometer (AV DPD method). b. 3 with LaMotte test strip. c. 3 with Hach test strip.
12. For each of the three chlorine concentrations, calculate the % recovery and RSD for each method for both FAC and TC, where:
a. % 𝑅𝑒𝑐𝑜𝑣𝑒𝑟𝑦 = 𝐴𝑣𝑔.𝑀𝑒𝑎𝑠𝑢𝑟𝑒𝑑 𝐶𝑜𝑛𝑐𝑒𝑛𝑡𝑟𝑎𝑡𝑖𝑜𝑛𝑇𝑟𝑢𝑒 𝐶𝑜𝑛𝑐𝑒𝑛𝑡𝑟𝑎𝑡𝑖𝑜𝑛
× 100%
b. 𝑅𝑆𝐷 = 𝑅𝑒𝑙𝑎𝑡𝑖𝑣𝑒 𝑆𝑡𝑎𝑛𝑑𝑎𝑟𝑑 𝐷𝑒𝑣𝑖𝑎𝑡𝑖𝑜𝑛 = 𝑆𝑡𝑑.𝐷𝑒𝑣𝑖𝑎𝑡𝑖𝑜𝑛 𝑜𝑓 𝑀𝑒𝑎𝑠𝑢𝑟𝑒𝑚𝑒𝑛𝑡𝑠𝐴𝑣𝑔.𝑜𝑓 𝑀𝑒𝑎𝑠𝑢𝑟𝑒𝑚𝑒𝑛𝑡𝑠
× 100%
Item 2: Determine percent recovery from high MgSO4 pool water
1. Condition 7 L of DI water to the following parameters to create synthetic pool water
Parameter Specification pH 7.2-7.6
Alkalinity 60-100 mg/L Hardness 200-400 mg/L
Temperature 90±3°F Turbidity <2.0 NTU
Free available chlorine 0 ppm
2. Pour off 1 L of the synthetic pool water and add sufficient bleach to create a stock solution of 100 mg/L FAC.
a. Recheck the pH to 7.4±0.2. b. Measure and record the actual stock solution free chlorine concentration.
3. For the remaining 6 L, add sufficient MgSO4 to raise the specific gravity to 1.25. 4. Into each of nine beakers, pour 199 ml of pool water.
SN: n/a PSF: n/a Page 6 of 15 This report shall not be reproduced, except in its entirety, without the written approval of NSF. This report does not represent NSF Certification or authorization to use the NSF Mark. Authorization to use the NSF Mark is limited to products appearing in the Company’s Official NSF Listing (www.nsf.org). The results relate only to those items tested, in the condition received at the laboratory.
5. To each beaker, add 1 ml of the chlorine stock solution for a theoretical concentration of 0.5 mg/L. 6. Measure the free and total chlorine concentration in the beakers:
a. 3 with DR 2800 spectrophotometer (AV DPD method). b. 3 with LaMotte test strip. c. 3 with Hach test strip.
7. Into each of nine beakers, pour 196 ml of pool water. 8. To each beaker, add 4 ml of the chlorine stock solution for a theoretical concentration of 2.0 mg/L. 9. Measure the free and total chlorine concentration in the beakers:
a. 3 with DR 2800 spectrophotometer (AV DPD method). b. 3 with LaMotte test strip. c. 3 with Hach test strip.
10. Into each of nine beakers, pour 190 ml of pool water. 11. To each beaker, add 10 ml of the chlorine stock solution for a theoretical concentration of 5.0 mg/L. 12. Measure the free and total chlorine concentration in the beakers:
a. 3 with DR 2800 spectrophotometer (AV DPD method). b. 3 with LaMotte test strip. c. 3 with Hach test strip.
13. For each of the three chlorine concentrations, calculate the % recovery and RSD for each method for both FAC and TC, where:
a. % 𝑅𝑒𝑐𝑜𝑣𝑒𝑟𝑦 = 𝐴𝑣𝑔.𝑀𝑒𝑎𝑠𝑢𝑟𝑒𝑑 𝐶𝑜𝑛𝑐𝑒𝑛𝑡𝑟𝑎𝑡𝑖𝑜𝑛𝑇𝑟𝑢𝑒 𝐶𝑜𝑛𝑐𝑒𝑛𝑡𝑟𝑎𝑡𝑖𝑜𝑛
× 100%
b. 𝑅𝑆𝐷 = 𝑅𝑒𝑙𝑎𝑡𝑖𝑣𝑒 𝑆𝑡𝑎𝑛𝑑𝑎𝑟𝑑 𝐷𝑒𝑣𝑖𝑎𝑡𝑖𝑜𝑛 = 𝑆𝑡𝑑.𝐷𝑒𝑣𝑖𝑎𝑡𝑖𝑜𝑛 𝑜𝑓 𝑀𝑒𝑎𝑠𝑢𝑟𝑒𝑚𝑒𝑛𝑡𝑠𝐴𝑣𝑔.𝑜𝑓 𝑀𝑒𝑎𝑠𝑢𝑟𝑒𝑚𝑒𝑛𝑡𝑠
× 100%
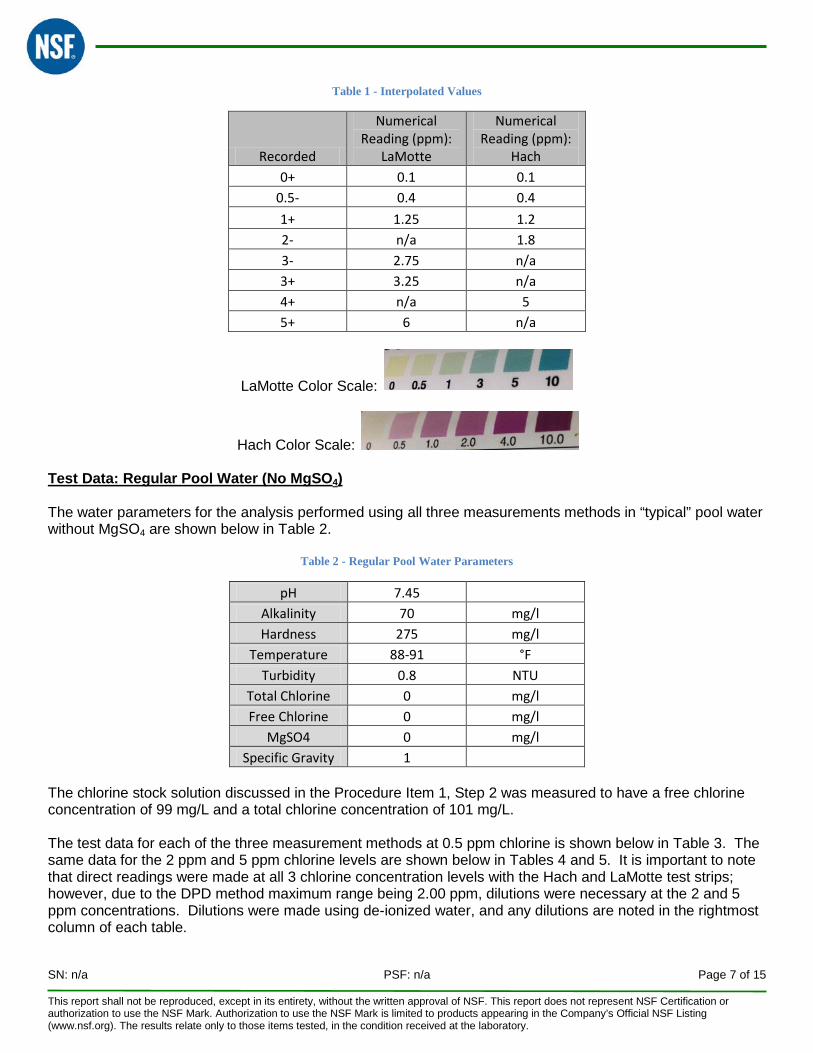
Discussion of Color Scale Readings Both the Hach test strip and LaMotte test strip provide a color chart of six discrete chlorine levels across a range of 0 to 10 ppm. Accordingly, if the color indicated on the test strip did not match identically the color of one of the discrete levels, an interpolation was made. The following conventions were followed when making interpolations of test strip readings:
• If the color of the test strip was deemed to be halfway between the colors of two discrete chlorine
levels on the color chart, the chlorine reading that was recorded was halfway between the discrete chlorine levels indicated by the color chart.
o Example: If the test strip color is deemed to be halfway between the colors corresponding to 1 and 3 ppm on the provided color chart, a reading of 2 ppm is recorded
• If the color of the test strip was very close to one of the colors provided on the color chart, but either slightly lighter or slightly darker, the chlorine reading that was recorded was that of the closest discrete color chlorine level, followed by a “+” (darker) or a “-“ (lighter).
o Example: If the test strip color is slightly darker than the color corresponding to 1 ppm on the provided color chart, a reading of “1+” ppm is recorded
o Example: If the test strip color is slightly lighter than the color corresponding to 5 ppm on the provided color chart, a reading of “5-” ppm is recorded
For numerical analysis, all of the readings that were made using a “+” or “-” were assigned actual values as shown below in Table 1.
SN: n/a PSF: n/a Page 7 of 15 This report shall not be reproduced, except in its entirety, without the written approval of NSF. This report does not represent NSF Certification or authorization to use the NSF Mark. Authorization to use the NSF Mark is limited to products appearing in the Company’s Official NSF Listing (www.nsf.org). The results relate only to those items tested, in the condition received at the laboratory.
Table 1 - Interpolated Values
Recorded
Numerical Reading (ppm):
LaMotte
Numerical Reading (ppm):
Hach 0+ 0.1 0.1
0.5- 0.4 0.4 1+ 1.25 1.2 2- n/a 1.8 3- 2.75 n/a 3+ 3.25 n/a 4+ n/a 5 5+ 6 n/a
LaMotte Color Scale:
Hach Color Scale: Test Data: Regular Pool Water (No MgSO4) The water parameters for the analysis performed using all three measurements methods in “typical” pool water without MgSO4 are shown below in Table 2.
Table 2 - Regular Pool Water Parameters
pH 7.45 Alkalinity 70 mg/l
Hardness 275 mg/l Temperature 88-91 °F
Turbidity 0.8 NTU Total Chlorine 0 mg/l Free Chlorine 0 mg/l
MgSO4 0 mg/l Specific Gravity 1
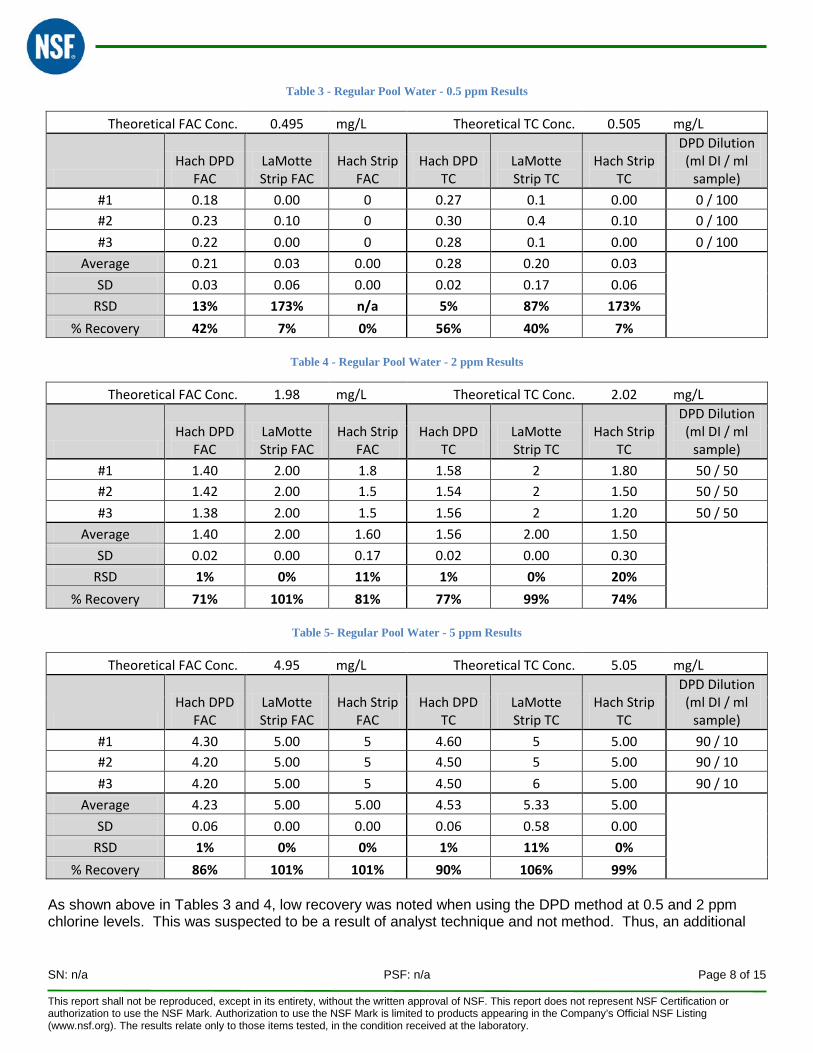
The chlorine stock solution discussed in the Procedure Item 1, Step 2 was measured to have a free chlorine concentration of 99 mg/L and a total chlorine concentration of 101 mg/L. The test data for each of the three measurement methods at 0.5 ppm chlorine is shown below in Table 3. The same data for the 2 ppm and 5 ppm chlorine levels are shown below in Tables 4 and 5. It is important to note that direct readings were made at all 3 chlorine concentration levels with the Hach and LaMotte test strips; however, due to the DPD method maximum range being 2.00 ppm, dilutions were necessary at the 2 and 5 ppm concentrations. Dilutions were made using de-ionized water, and any dilutions are noted in the rightmost column of each table.
SN: n/a PSF: n/a Page 8 of 15 This report shall not be reproduced, except in its entirety, without the written approval of NSF. This report does not represent NSF Certification or authorization to use the NSF Mark. Authorization to use the NSF Mark is limited to products appearing in the Company’s Official NSF Listing (www.nsf.org). The results relate only to those items tested, in the condition received at the laboratory.
Table 3 - Regular Pool Water - 0.5 ppm Results
Theoretical FAC Conc. 0.495 mg/L Theoretical TC Conc. 0.505 mg/L
Hach DPD
FAC LaMotte Strip FAC
Hach Strip FAC
Hach DPD TC
LaMotte Strip TC
Hach Strip TC
DPD Dilution (ml DI / ml
sample) #1 0.18 0.00 0 0.27 0.1 0.00 0 / 100 #2 0.23 0.10 0 0.30 0.4 0.10 0 / 100 #3 0.22 0.00 0 0.28 0.1 0.00 0 / 100
Average 0.21 0.03 0.00 0.28 0.20 0.03
SD 0.03 0.06 0.00 0.02 0.17 0.06 RSD 13% 173% n/a 5% 87% 173%
% Recovery 42% 7% 0% 56% 40% 7%
Table 4 - Regular Pool Water - 2 ppm Results
Theoretical FAC Conc. 1.98 mg/L Theoretical TC Conc. 2.02 mg/L
Hach DPD
FAC LaMotte Strip FAC
Hach Strip FAC
Hach DPD TC
LaMotte Strip TC
Hach Strip TC
DPD Dilution (ml DI / ml
sample) #1 1.40 2.00 1.8 1.58 2 1.80 50 / 50 #2 1.42 2.00 1.5 1.54 2 1.50 50 / 50 #3 1.38 2.00 1.5 1.56 2 1.20 50 / 50
Average 1.40 2.00 1.60 1.56 2.00 1.50
SD 0.02 0.00 0.17 0.02 0.00 0.30 RSD 1% 0% 11% 1% 0% 20%
% Recovery 71% 101% 81% 77% 99% 74%
Table 5- Regular Pool Water - 5 ppm Results
Theoretical FAC Conc. 4.95 mg/L Theoretical TC Conc. 5.05 mg/L
Hach DPD
FAC LaMotte Strip FAC
Hach Strip FAC
Hach DPD TC
LaMotte Strip TC
Hach Strip TC
DPD Dilution (ml DI / ml
sample) #1 4.30 5.00 5 4.60 5 5.00 90 / 10 #2 4.20 5.00 5 4.50 5 5.00 90 / 10 #3 4.20 5.00 5 4.50 6 5.00 90 / 10
Average 4.23 5.00 5.00 4.53 5.33 5.00
SD 0.06 0.00 0.00 0.06 0.58 0.00 RSD 1% 0% 0% 1% 11% 0%
% Recovery 86% 101% 101% 90% 106% 99% As shown above in Tables 3 and 4, low recovery was noted when using the DPD method at 0.5 and 2 ppm chlorine levels. This was suspected to be a result of analyst technique and not method. Thus, an additional
SN: n/a PSF: n/a Page 9 of 15 This report shall not be reproduced, except in its entirety, without the written approval of NSF. This report does not represent NSF Certification or authorization to use the NSF Mark. Authorization to use the NSF Mark is limited to products appearing in the Company’s Official NSF Listing (www.nsf.org). The results relate only to those items tested, in the condition received at the laboratory.
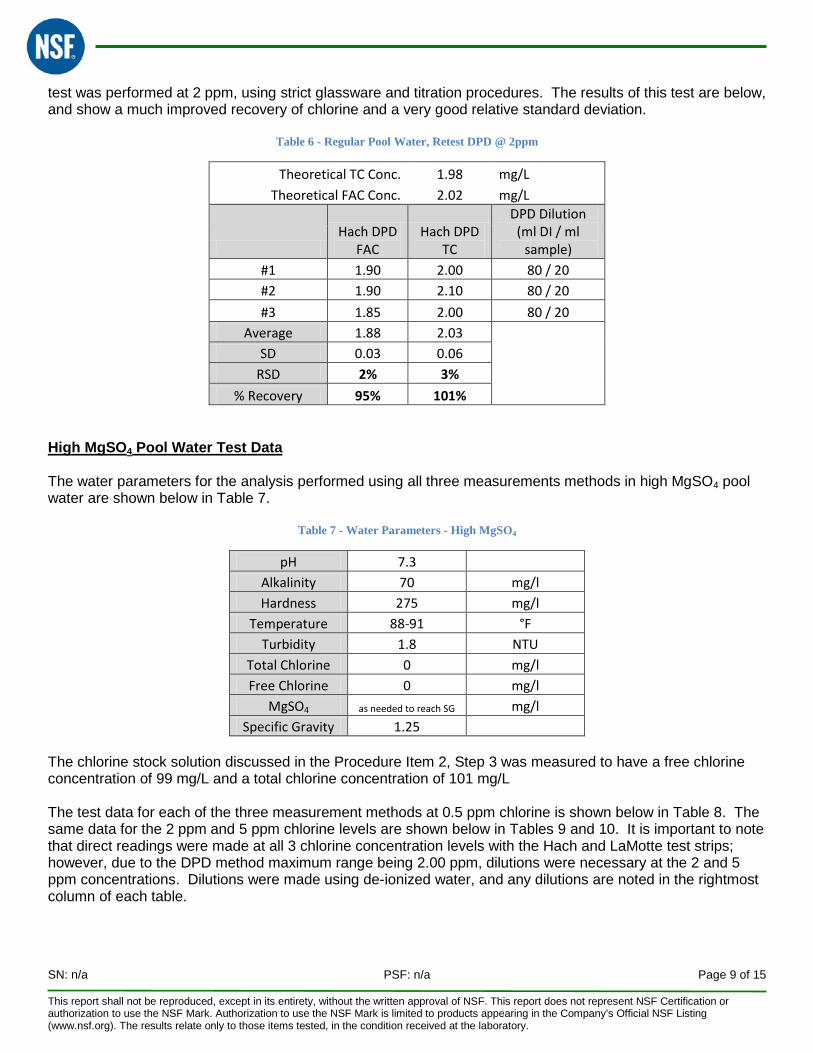
test was performed at 2 ppm, using strict glassware and titration procedures. The results of this test are below, and show a much improved recovery of chlorine and a very good relative standard deviation.
Table 6 - Regular Pool Water, Retest DPD @ 2ppm
Theoretical TC Conc. 1.98 mg/L Theoretical FAC Conc. 2.02 mg/L
Hach DPD
FAC Hach DPD
TC
DPD Dilution (ml DI / ml
sample) #1 1.90 2.00 80 / 20 #2 1.90 2.10 80 / 20 #3 1.85 2.00 80 / 20
Average 1.88 2.03
SD 0.03 0.06 RSD 2% 3%
% Recovery 95% 101% High MgSO4 Pool Water Test Data The water parameters for the analysis performed using all three measurements methods in high MgSO4 pool water are shown below in Table 7.
Table 7 - Water Parameters - High MgSO4
pH 7.3 Alkalinity 70 mg/l
Hardness 275 mg/l Temperature 88-91 °F
Turbidity 1.8 NTU Total Chlorine 0 mg/l Free Chlorine 0 mg/l
MgSO4 as needed to reach SG mg/l Specific Gravity 1.25
The chlorine stock solution discussed in the Procedure Item 2, Step 3 was measured to have a free chlorine concentration of 99 mg/L and a total chlorine concentration of 101 mg/L The test data for each of the three measurement methods at 0.5 ppm chlorine is shown below in Table 8. The same data for the 2 ppm and 5 ppm chlorine levels are shown below in Tables 9 and 10. It is important to note that direct readings were made at all 3 chlorine concentration levels with the Hach and LaMotte test strips; however, due to the DPD method maximum range being 2.00 ppm, dilutions were necessary at the 2 and 5 ppm concentrations. Dilutions were made using de-ionized water, and any dilutions are noted in the rightmost column of each table.
SN: n/a PSF: n/a Page 10 of 15 This report shall not be reproduced, except in its entirety, without the written approval of NSF. This report does not represent NSF Certification or authorization to use the NSF Mark. Authorization to use the NSF Mark is limited to products appearing in the Company’s Official NSF Listing (www.nsf.org). The results relate only to those items tested, in the condition received at the laboratory.
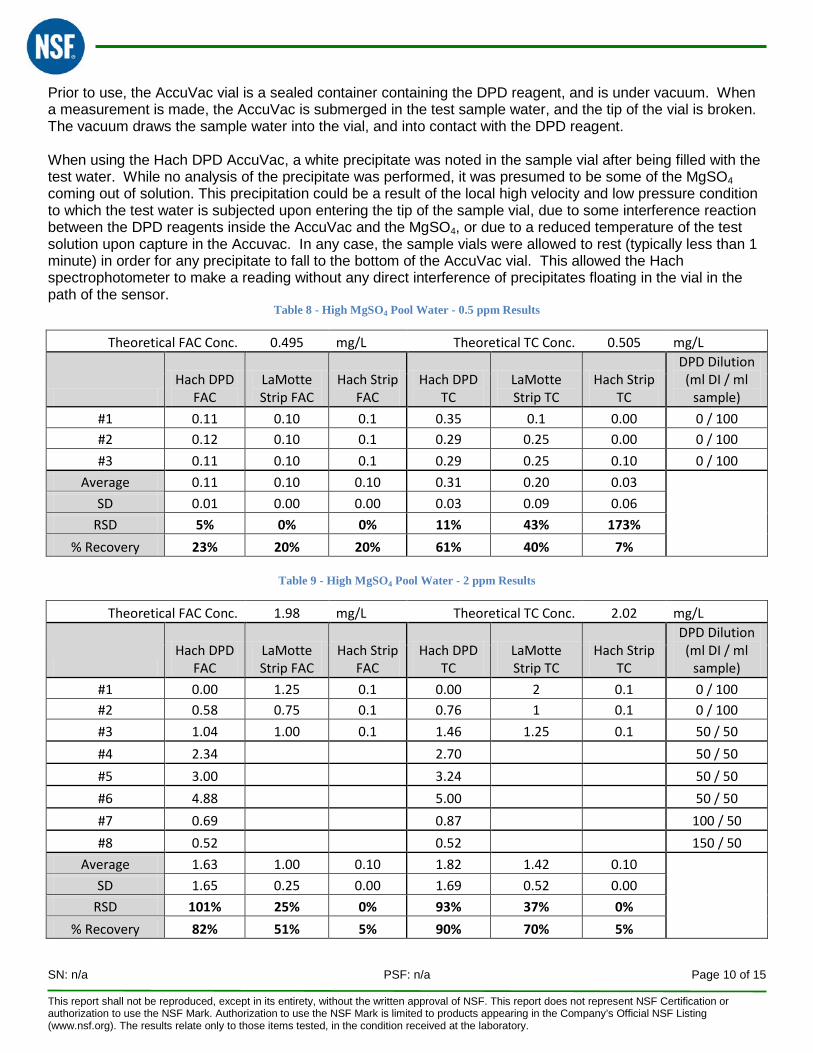
Prior to use, the AccuVac vial is a sealed container containing the DPD reagent, and is under vacuum. When a measurement is made, the AccuVac is submerged in the test sample water, and the tip of the vial is broken. The vacuum draws the sample water into the vial, and into contact with the DPD reagent. When using the Hach DPD AccuVac, a white precipitate was noted in the sample vial after being filled with the test water. While no analysis of the precipitate was performed, it was presumed to be some of the MgSO4 coming out of solution. This precipitation could be a result of the local high velocity and low pressure condition to which the test water is subjected upon entering the tip of the sample vial, due to some interference reaction between the DPD reagents inside the AccuVac and the MgSO4, or due to a reduced temperature of the test solution upon capture in the Accuvac. In any case, the sample vials were allowed to rest (typically less than 1 minute) in order for any precipitate to fall to the bottom of the AccuVac vial. This allowed the Hach spectrophotometer to make a reading without any direct interference of precipitates floating in the vial in the path of the sensor.
Table 8 - High MgSO4 Pool Water - 0.5 ppm Results
Theoretical FAC Conc. 0.495 mg/L Theoretical TC Conc. 0.505 mg/L
Hach DPD
FAC LaMotte Strip FAC
Hach Strip FAC
Hach DPD TC
LaMotte Strip TC
Hach Strip TC
DPD Dilution (ml DI / ml
sample) #1 0.11 0.10 0.1 0.35 0.1 0.00 0 / 100 #2 0.12 0.10 0.1 0.29 0.25 0.00 0 / 100 #3 0.11 0.10 0.1 0.29 0.25 0.10 0 / 100
Average 0.11 0.10 0.10 0.31 0.20 0.03
SD 0.01 0.00 0.00 0.03 0.09 0.06 RSD 5% 0% 0% 11% 43% 173%
% Recovery 23% 20% 20% 61% 40% 7%
Table 9 - High MgSO4 Pool Water - 2 ppm Results
Theoretical FAC Conc. 1.98 mg/L Theoretical TC Conc. 2.02 mg/L
Hach DPD
FAC LaMotte Strip FAC
Hach Strip FAC
Hach DPD TC
LaMotte Strip TC
Hach Strip TC
DPD Dilution (ml DI / ml
sample) #1 0.00 1.25 0.1 0.00 2 0.1 0 / 100 #2 0.58 0.75 0.1 0.76 1 0.1 0 / 100 #3 1.04 1.00 0.1 1.46 1.25 0.1 50 / 50 #4 2.34 2.70 50 / 50 #5 3.00 3.24 50 / 50 #6 4.88 5.00 50 / 50 #7 0.69 0.87 100 / 50 #8 0.52 0.52 150 / 50
Average 1.63 1.00 0.10 1.82 1.42 0.10
SD 1.65 0.25 0.00 1.69 0.52 0.00 RSD 101% 25% 0% 93% 37% 0%
% Recovery 82% 51% 5% 90% 70% 5%
SN: n/a PSF: n/a Page 11 of 15 This report shall not be reproduced, except in its entirety, without the written approval of NSF. This report does not represent NSF Certification or authorization to use the NSF Mark. Authorization to use the NSF Mark is limited to products appearing in the Company’s Official NSF Listing (www.nsf.org). The results relate only to those items tested, in the condition received at the laboratory.
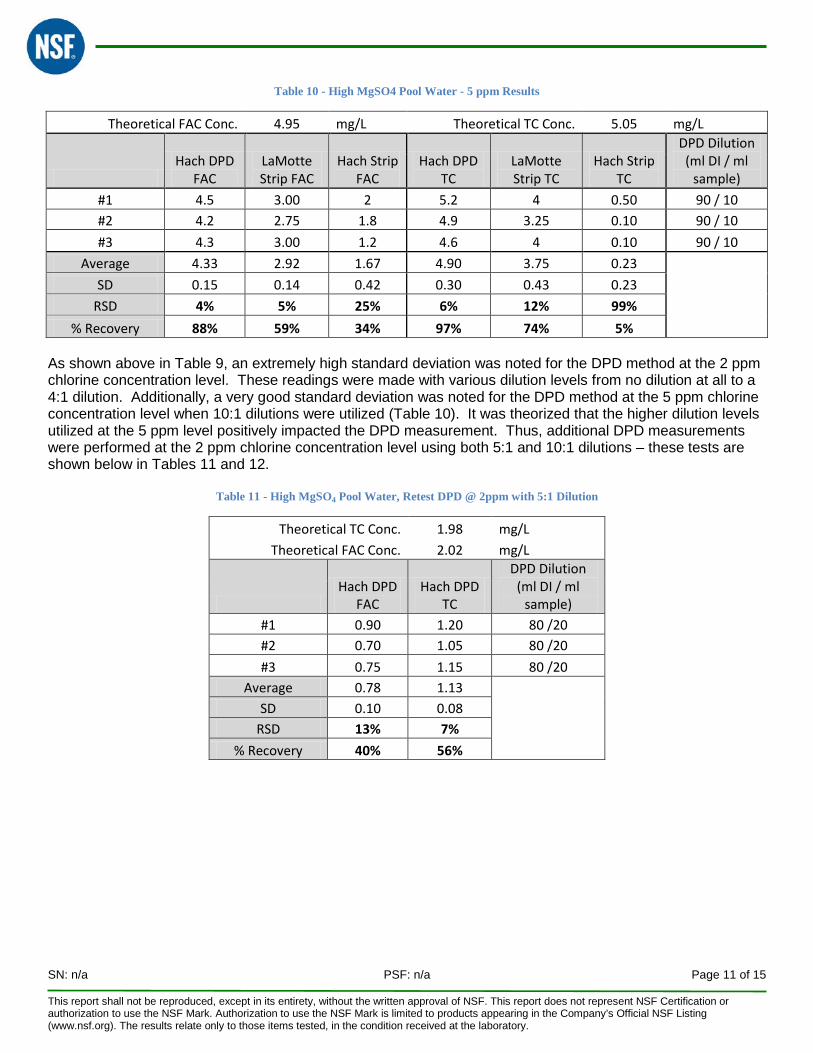
Table 10 - High MgSO4 Pool Water - 5 ppm Results
Theoretical FAC Conc. 4.95 mg/L Theoretical TC Conc. 5.05 mg/L
Hach DPD
FAC LaMotte Strip FAC
Hach Strip FAC
Hach DPD TC
LaMotte Strip TC
Hach Strip TC
DPD Dilution (ml DI / ml
sample) #1 4.5 3.00 2 5.2 4 0.50 90 / 10 #2 4.2 2.75 1.8 4.9 3.25 0.10 90 / 10 #3 4.3 3.00 1.2 4.6 4 0.10 90 / 10
Average 4.33 2.92 1.67 4.90 3.75 0.23
SD 0.15 0.14 0.42 0.30 0.43 0.23 RSD 4% 5% 25% 6% 12% 99%
% Recovery 88% 59% 34% 97% 74% 5% As shown above in Table 9, an extremely high standard deviation was noted for the DPD method at the 2 ppm chlorine concentration level. These readings were made with various dilution levels from no dilution at all to a 4:1 dilution. Additionally, a very good standard deviation was noted for the DPD method at the 5 ppm chlorine concentration level when 10:1 dilutions were utilized (Table 10). It was theorized that the higher dilution levels utilized at the 5 ppm level positively impacted the DPD measurement. Thus, additional DPD measurements were performed at the 2 ppm chlorine concentration level using both 5:1 and 10:1 dilutions – these tests are shown below in Tables 11 and 12.
Table 11 - High MgSO4 Pool Water, Retest DPD @ 2ppm with 5:1 Dilution
Theoretical TC Conc. 1.98 mg/L Theoretical FAC Conc. 2.02 mg/L
Hach DPD
FAC Hach DPD
TC
DPD Dilution (ml DI / ml
sample) #1 0.90 1.20 80 /20 #2 0.70 1.05 80 /20 #3 0.75 1.15 80 /20
Average 0.78 1.13
SD 0.10 0.08 RSD 13% 7%
% Recovery 40% 56%
SN: n/a PSF: n/a Page 12 of 15 This report shall not be reproduced, except in its entirety, without the written approval of NSF. This report does not represent NSF Certification or authorization to use the NSF Mark. Authorization to use the NSF Mark is limited to products appearing in the Company’s Official NSF Listing (www.nsf.org). The results relate only to those items tested, in the condition received at the laboratory.
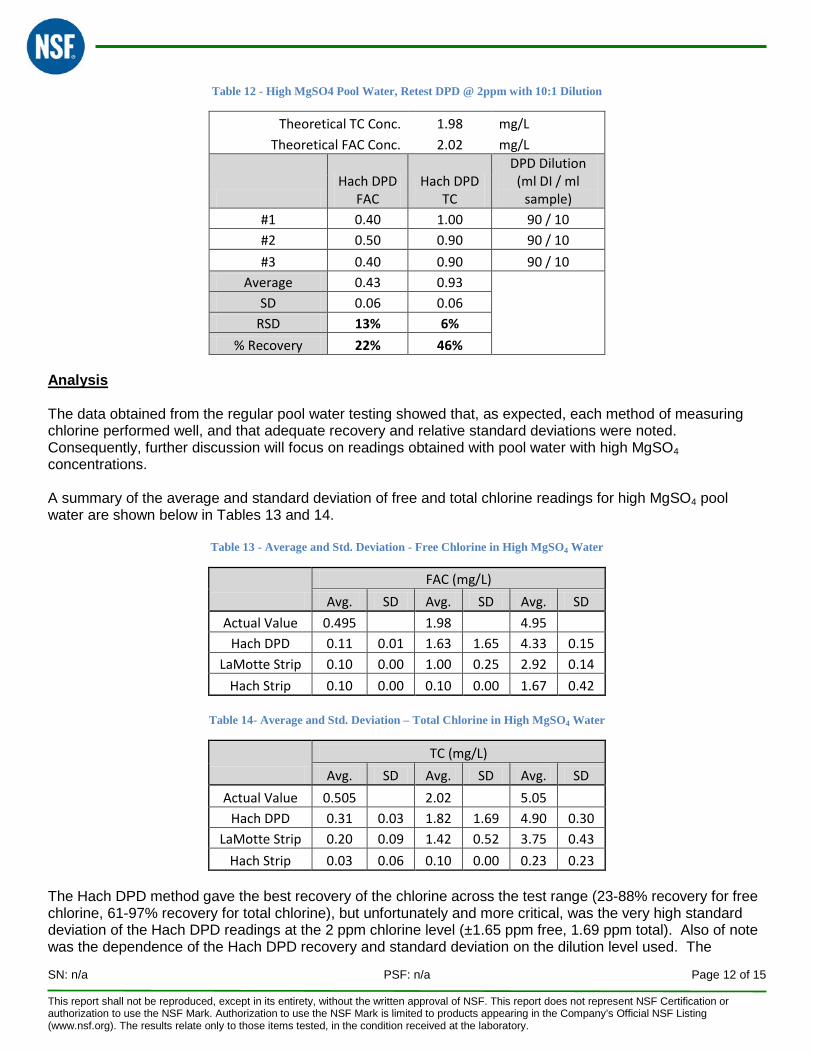
Table 12 - High MgSO4 Pool Water, Retest DPD @ 2ppm with 10:1 Dilution
Theoretical TC Conc. 1.98 mg/L Theoretical FAC Conc. 2.02 mg/L
Hach DPD
FAC Hach DPD
TC
DPD Dilution (ml DI / ml
sample) #1 0.40 1.00 90 / 10 #2 0.50 0.90 90 / 10 #3 0.40 0.90 90 / 10
Average 0.43 0.93
SD 0.06 0.06 RSD 13% 6%
% Recovery 22% 46% Analysis The data obtained from the regular pool water testing showed that, as expected, each method of measuring chlorine performed well, and that adequate recovery and relative standard deviations were noted. Consequently, further discussion will focus on readings obtained with pool water with high MgSO4 concentrations. A summary of the average and standard deviation of free and total chlorine readings for high MgSO4 pool water are shown below in Tables 13 and 14.
Table 13 - Average and Std. Deviation - Free Chlorine in High MgSO4 Water
FAC (mg/L)
Avg. SD Avg. SD Avg. SD Actual Value 0.495 1.98 4.95
Hach DPD 0.11 0.01 1.63 1.65 4.33 0.15 LaMotte Strip 0.10 0.00 1.00 0.25 2.92 0.14
Hach Strip 0.10 0.00 0.10 0.00 1.67 0.42
Table 14- Average and Std. Deviation – Total Chlorine in High MgSO4 Water
TC (mg/L)
Avg. SD Avg. SD Avg. SD Actual Value 0.505 2.02 5.05
Hach DPD 0.31 0.03 1.82 1.69 4.90 0.30 LaMotte Strip 0.20 0.09 1.42 0.52 3.75 0.43
Hach Strip 0.03 0.06 0.10 0.00 0.23 0.23 The Hach DPD method gave the best recovery of the chlorine across the test range (23-88% recovery for free chlorine, 61-97% recovery for total chlorine), but unfortunately and more critical, was the very high standard deviation of the Hach DPD readings at the 2 ppm chlorine level (±1.65 ppm free, 1.69 ppm total). Also of note was the dependence of the Hach DPD recovery and standard deviation on the dilution level used. The
SN: n/a PSF: n/a Page 13 of 15 This report shall not be reproduced, except in its entirety, without the written approval of NSF. This report does not represent NSF Certification or authorization to use the NSF Mark. Authorization to use the NSF Mark is limited to products appearing in the Company’s Official NSF Listing (www.nsf.org). The results relate only to those items tested, in the condition received at the laboratory.
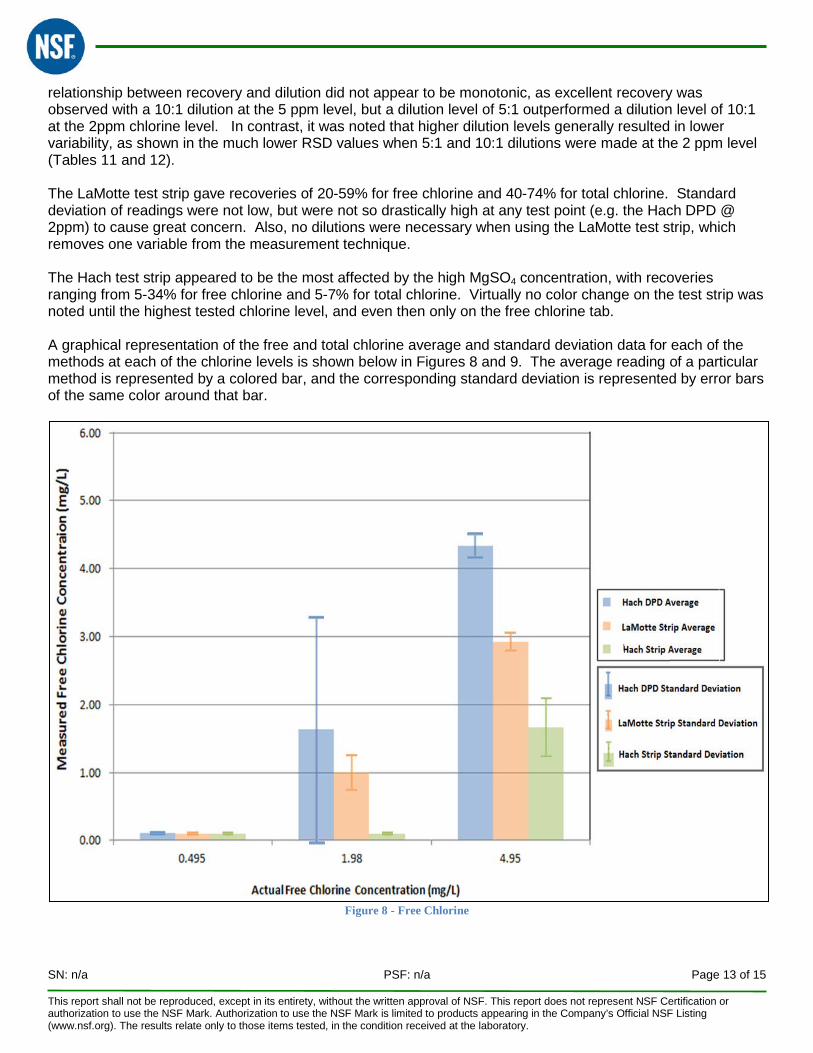
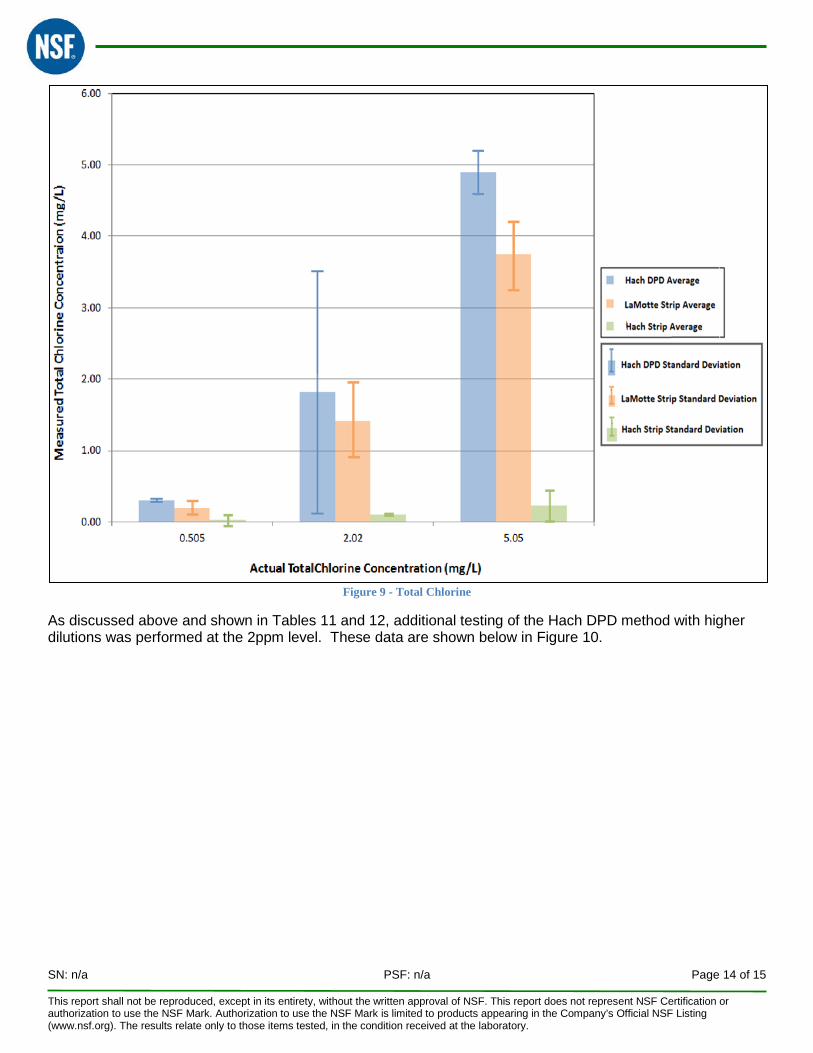
relationship between recovery and dilution did not appear to be monotonic, as excellent recovery was observed with a 10:1 dilution at the 5 ppm level, but a dilution level of 5:1 outperformed a dilution level of 10:1 at the 2ppm chlorine level. In contrast, it was noted that higher dilution levels generally resulted in lower variability, as shown in the much lower RSD values when 5:1 and 10:1 dilutions were made at the 2 ppm level (Tables 11 and 12). The LaMotte test strip gave recoveries of 20-59% for free chlorine and 40-74% for total chlorine. Standard deviation of readings were not low, but were not so drastically high at any test point (e.g. the Hach DPD @ 2ppm) to cause great concern. Also, no dilutions were necessary when using the LaMotte test strip, which removes one variable from the measurement technique. The Hach test strip appeared to be the most affected by the high MgSO4 concentration, with recoveries ranging from 5-34% for free chlorine and 5-7% for total chlorine. Virtually no color change on the test strip was noted until the highest tested chlorine level, and even then only on the free chlorine tab. A graphical representation of the free and total chlorine average and standard deviation data for each of the methods at each of the chlorine levels is shown below in Figures 8 and 9. The average reading of a particular method is represented by a colored bar, and the corresponding standard deviation is represented by error bars of the same color around that bar.
Figure 8 - Free Chlorine
SN: n/a PSF: n/a Page 14 of 15 This report shall not be reproduced, except in its entirety, without the written approval of NSF. This report does not represent NSF Certification or authorization to use the NSF Mark. Authorization to use the NSF Mark is limited to products appearing in the Company’s Official NSF Listing (www.nsf.org). The results relate only to those items tested, in the condition received at the laboratory.
Figure 9 - Total Chlorine
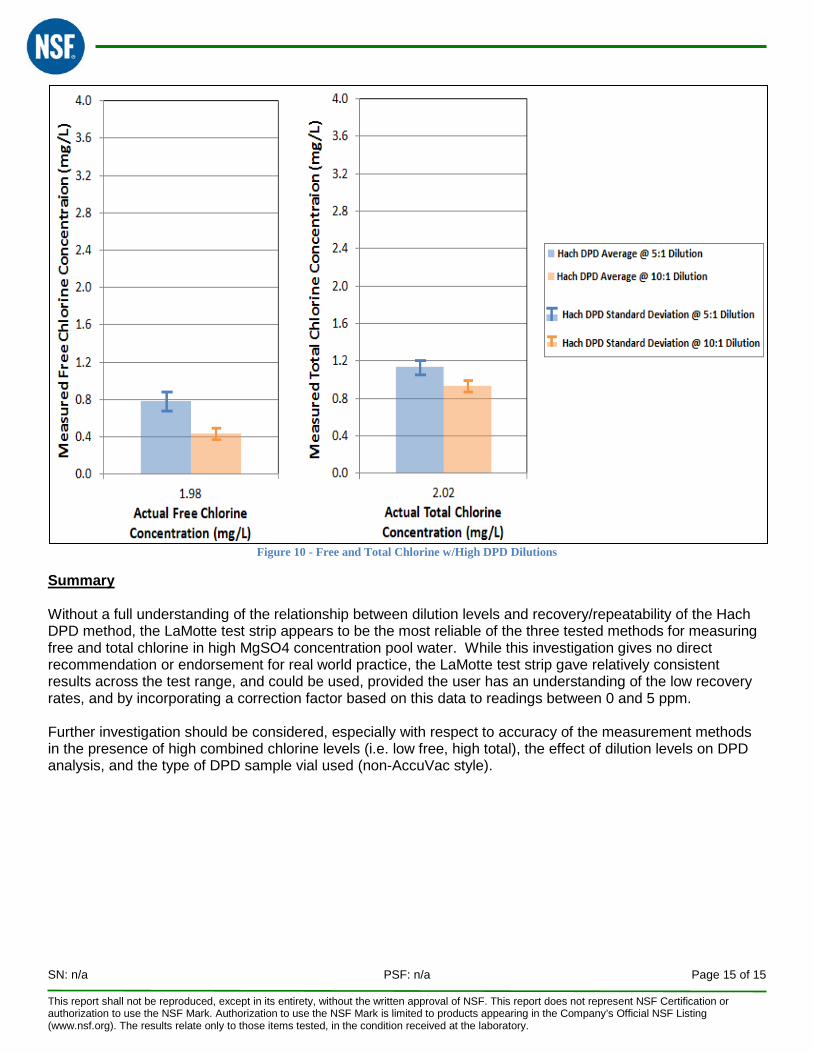
As discussed above and shown in Tables 11 and 12, additional testing of the Hach DPD method with higher dilutions was performed at the 2ppm level. These data are shown below in Figure 10.
SN: n/a PSF: n/a Page 15 of 15 This report shall not be reproduced, except in its entirety, without the written approval of NSF. This report does not represent NSF Certification or authorization to use the NSF Mark. Authorization to use the NSF Mark is limited to products appearing in the Company’s Official NSF Listing (www.nsf.org). The results relate only to those items tested, in the condition received at the laboratory.
Figure 10 - Free and Total Chlorine w/High DPD Dilutions
Summary Without a full understanding of the relationship between dilution levels and recovery/repeatability of the Hach DPD method, the LaMotte test strip appears to be the most reliable of the three tested methods for measuring free and total chlorine in high MgSO4 concentration pool water. While this investigation gives no direct recommendation or endorsement for real world practice, the LaMotte test strip gave relatively consistent results across the test range, and could be used, provided the user has an understanding of the low recovery rates, and by incorporating a correction factor based on this data to readings between 0 and 5 ppm. Further investigation should be considered, especially with respect to accuracy of the measurement methods in the presence of high combined chlorine levels (i.e. low free, high total), the effect of dilution levels on DPD analysis, and the type of DPD sample vial used (non-AccuVac style).