Embed Size (px)
Citation preview

I -_ . . ' .
- '. i I '.
I
I .
I
I
I '
i I
. . I . ! . . I ' 1 i
. .
I ! . . i
-.
k .
PROVINCE OF N O V A SCOTIA
DEPARTMENT OF MINES Groundwater Section
Report 70-3
HYDROGEOLOGY OF THE MUSQUODOBOIT
RIVER VALLEY, NOVA SCOTIA
by
Chang L. Lin
H O N . ALLAN E. SULLIVAN MINISTER
Halifax, Novo Scotia 1 970
J.P. NOWLAN, Ph.D. DEPUTY M I N ISTER
PREFACE
The Nova S c o t i a Department of Mines initiated i n 1964 an extensive program to evaluate the groundwater resources of the Province of Nova Scotia. This report on the hydrogeology of the Musquodoboit River valley forms part of this broader provincial program.
The field work for this study was commenced in the summer of 1967 by George F. Pinder withpreliminary results on the h y d r o g e o l o g y of the lower M u s q u o d o b o i t River valley published i n Groundwater Section report 68-2. Chang L. Lin continued this study during the summers of 1968, 1969 and 1970, part of which formed a doctoral dissertation at the University of Illinois. T h i s comprehensive project on the whole Musquodoboit River valley until 1970 was a joint undertaking between the Canada Department o f Regional Economic Ex- pansion (ARDA project No. 22042) and the Province of Nova S c o t i a. Use of Dol housie University's IBM/360-50 model computer was secured through the co- operation of the Department of Geology.
I t i s hoped that the information in this report w i l l be useful for agricul- tural , municipal and individual water needs and that the report w i l l serve as a guide for the future exploration,development, use and management of the im- portant groundwater resources of the Musquodoboit River Val ley.
John F. Jones Chief, Groundwater Section Nova Scotia Department of Mines
Halifax, January 15, 1971
CONTENTS
Page
Abstract ......................................................... 1
Introduction ...................................................... 2
Purpose and scope of the investigation ........................... 2 General description of the area ................................. 2
Location. access. und extent of the area ..................... 2 Physiography and drainage ................................. 2 Agriculture and soils ...................................... 4 Population and industry .................................... 6 Climate ................................................. 7
Previous investigations ......................................... 9 Field work and maps ........................................... 9 Acknowledgments ............................................. 10
Land survey system ............................................ 7
Geology ......................................................... 11
Introduction .................................................. 11 Rock units ................................................... 12
Megurna Group ........................................... 12 Granite ................................................. 12
Surficia I deposits ............................................. 14 Cretaceous quartz sands and clays ........................... 14 Glacial till .............................................. 15 Glaciofluvial deposits ..................................... 18 Glaciolacustrine deposits .................................. 18 Recent beach and salt marsh ................................ 21 Stream alluvium .......................................... 21 Peat and muck. ........................................... 21
Structure .................................................... 21 Geomorphology ............................................... 22
Windsor Group ........................................... 14
Hydrostratigraphic units ............................................ 25
Introduction .................................................. 25 Bedrock hydrostratigraphic units ................................. 26
Slate. quartzite and granite ................................ 26
Surf i c ia I h ydrostra ti gra ph i c units ................................ 27 27
Windsor Group ........................................... 27
Cretaceous quartz sands and clays ...........................
v i
Page
Glaciofluvial deposits ..................................... 27 Elmsvale sand and gravel aquifer ........................ 27 Musquodoboit Harbour sand and gravel aquifer ............ 29 Other g laciof I uvia I aquifers ............................ 30
Glacial ti l l .............................................. 30 Other surficial deposits .................................... 30
Chemical quality of groundwater .................................... 31
Introduction .................................................. 31 Relationship of groundwater quality to use ........................ 33
Hardness ................................................. 33
Sulfate .................................................. 33 Nitrate .................................................. 34 Total dissolved solids ...................................... 34
Chemical quality of groundwater i n the hydrostratigraphic units ...... 34 Slate. quartzite and granite ................................ 34 Windsor Group ........................................... 36 Cretaceous sand and gravel deposits ......................... 36 Glaciofluvial deposits ..................................... 36 Other surficial deposits .................................... 37
Iron and manganese ....................................... 33
Local properties of the groundwater i n the surficial aquifers ............. 38
Introduction .................................................. 38 Variation of temperature with depth ............................. 38 pH values ..................................................... 41 Si I ico concentration ........................................... 41 Total hardness ................................................ 43 Tentative correlation among silica. pH and hardness ................ 43
Groundwater uti l ization and development ............................ 47
Introduction .................................................. 47 Domestic and livestock water supplies ............................ 47 Irrigation water supplies ....................................... 48
48 Municipal and industrial water supplies .......................... Musquodoboit Harbour ..................................... 48 Middle Musquodoboit ...................................... 49 Upper Musquodoboi t ....................................... 50 Others .................................................. 50
Summary and conclusions ........................................... 51
vi i
Page
References ....................................................... 53
Appendix A. Chemical analyses of groundwaters in the Musquodoboit River valley ..... .................. , ................ 57
I v i i i
Map 1.
Figure 1.
Figure 2.
Figure 3.
Figure 4.
Figure 5.
Figure 6.
I
Figure 7.
Figure 8.
I Figure 9 .
I ,
Figure 0.
Figure 1.
Figure 12.
Figure 13.
Figure 14.
Figure 15.
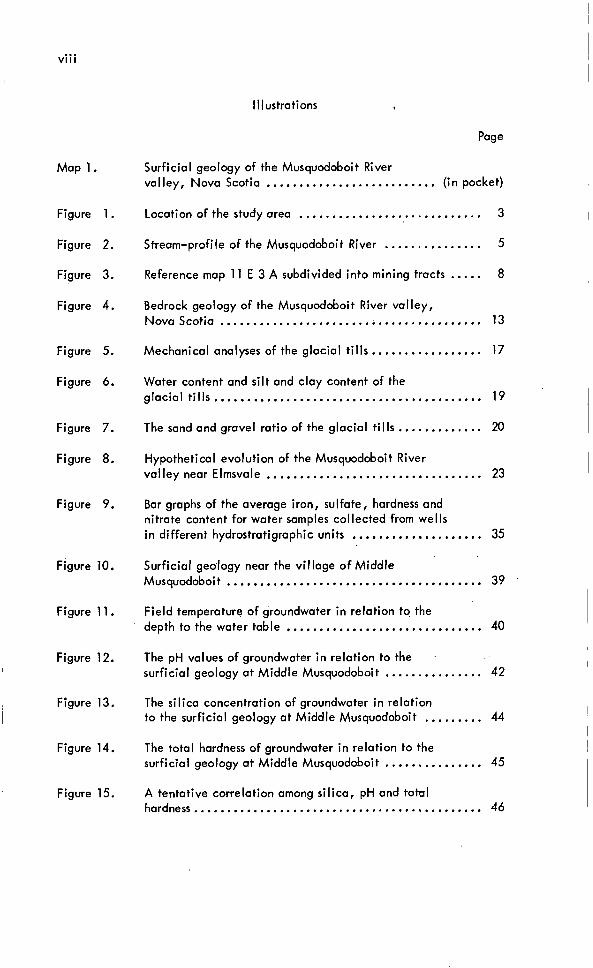
Illustrations
Page
Surficial geology of the Musquodoboit River valley, Nova Scotia .......................... (in pocket)
3
5
8
Location of the study area ............................ Stream-profile of the Musquodoboit River ............... Reference map 11 E 3 A subdivided into mining tracts ..... Bedrock geology of the Musquodoboit River valley, Nova Scotia ........................................ 13
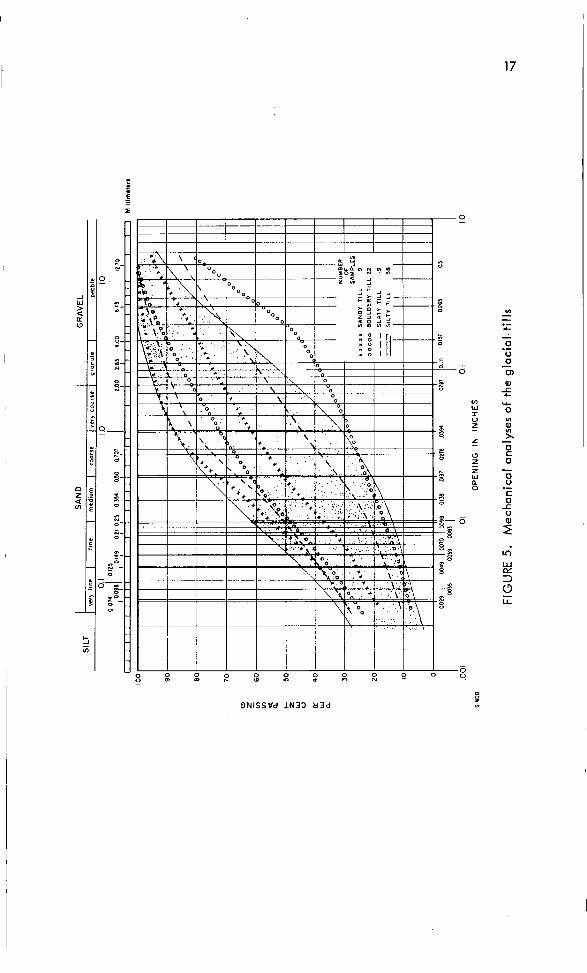
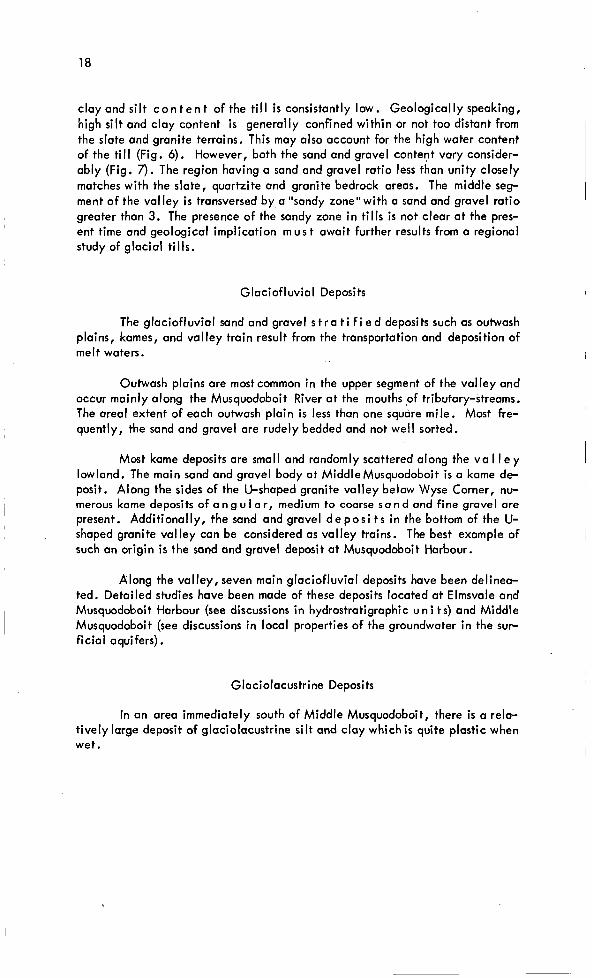
Mechanical analyses of the glacial t i l l s ................. 17
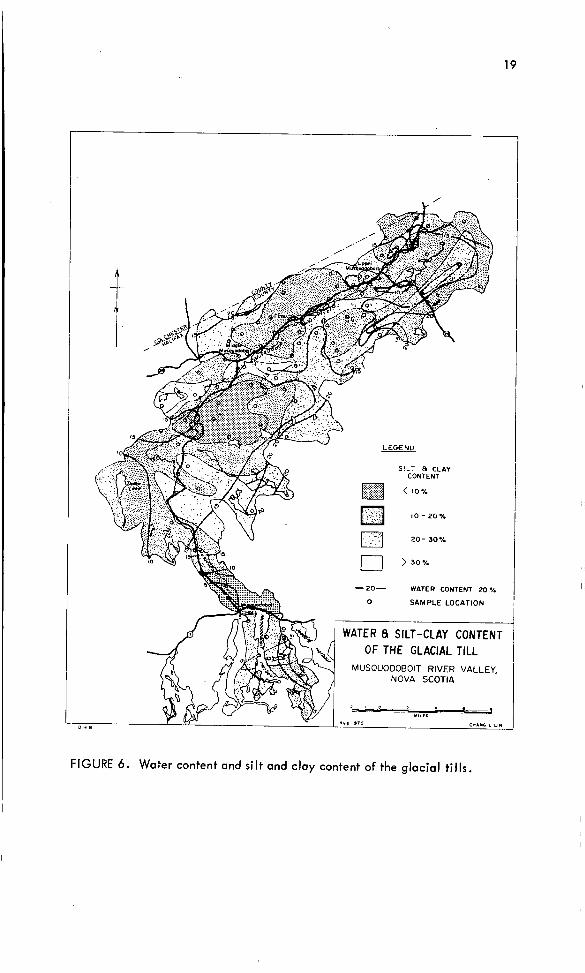
Water content and s i l t and clay content of the glacial t i l l s ......................................... 19
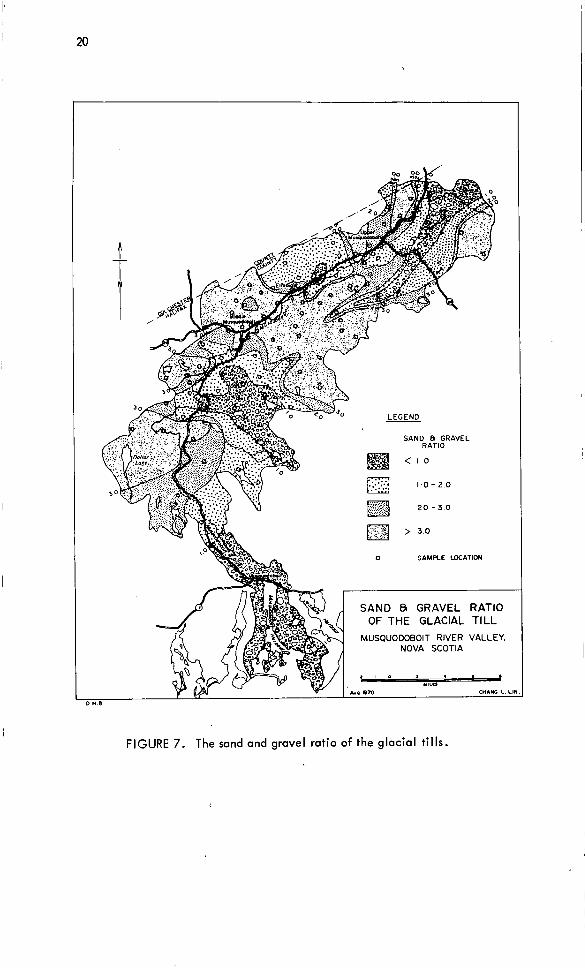
The sand and gravel ratio of the glacial t i l l s . . ........... 20
Hypothetical evolution of the Musquodoboit River valley near Elmsvale ................................. 23
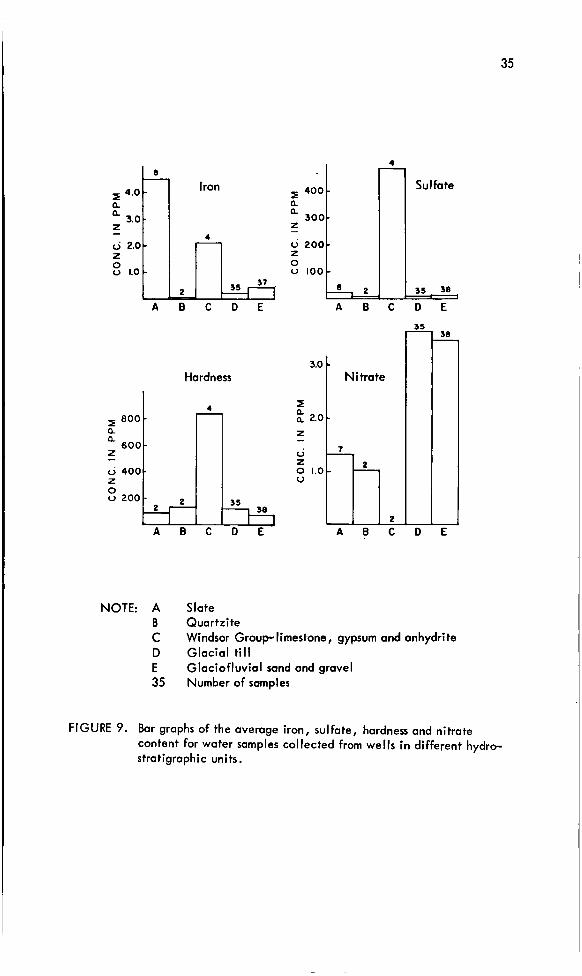
Bar graphs of the average iron, sulfate , hardness and nitrate content for water samples collected from wells i n different hydrostratigraphic units .................... 35
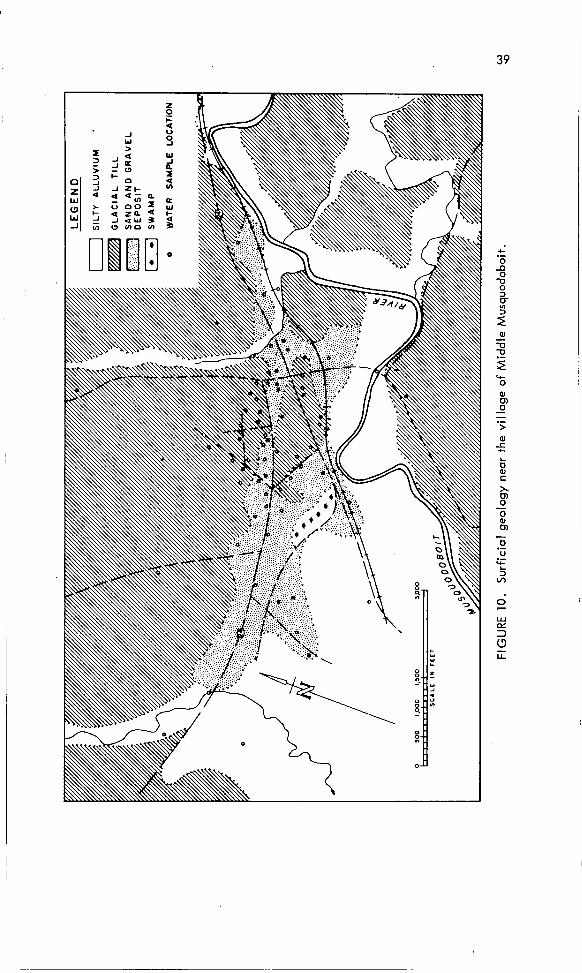
Surficial geology near the village o f Middle Musquodoboit ....................................... 39
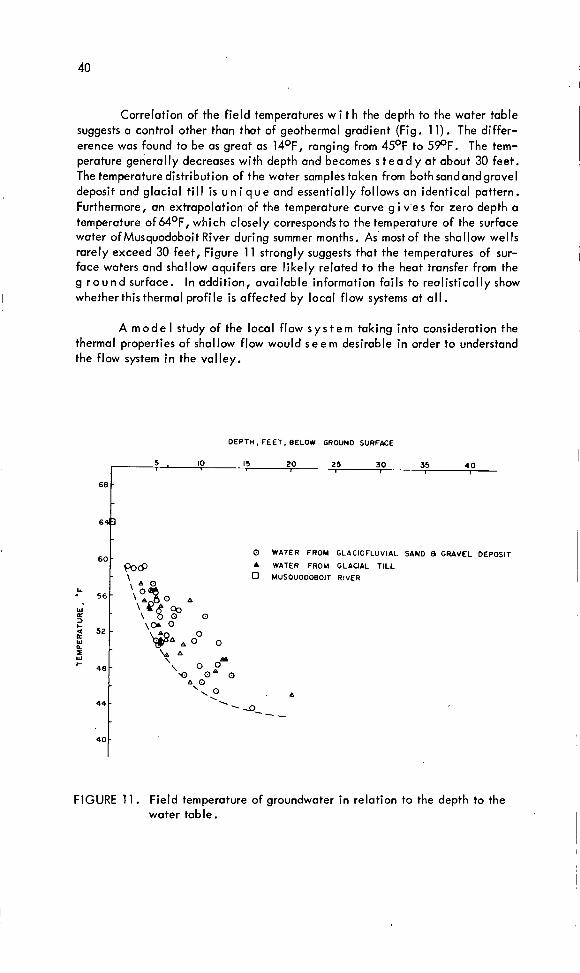
Field temperature of groundwater i n relation to the depth to the water table .............................. 40
The pH values of groundwater i n relation to the surficial geology at Middle Musquodoboit ............... 42
The silica concentration of groundwater i n relation to the surficial geology at Middle Musquodoboit ......... 44
The total hardness of groundwater i n relation to the surficial geology at Middle Musquodoboit ............... 45
A tentative correlation among silica, pH and total hardness.. .......................................... 46
Table 1.
Table 2.
Table 3.
Tab le 4 .
I X
Tables
Page
Soils and their suitability for agriculture in the Musquodoboit River valley ............................ 6
Generalized climate of the Musquodoboit River valley ............................................. 8
Stratigraphy of the Musquodoboit River valley ........... 1 1
Canadian drinking water standards ..................... 32
I -_ . . ' .
- '. i I '.
I
I .
I
I
I '
i I
. . I . ! . . I ' 1 i
. .
I ! . . i
-.
k .
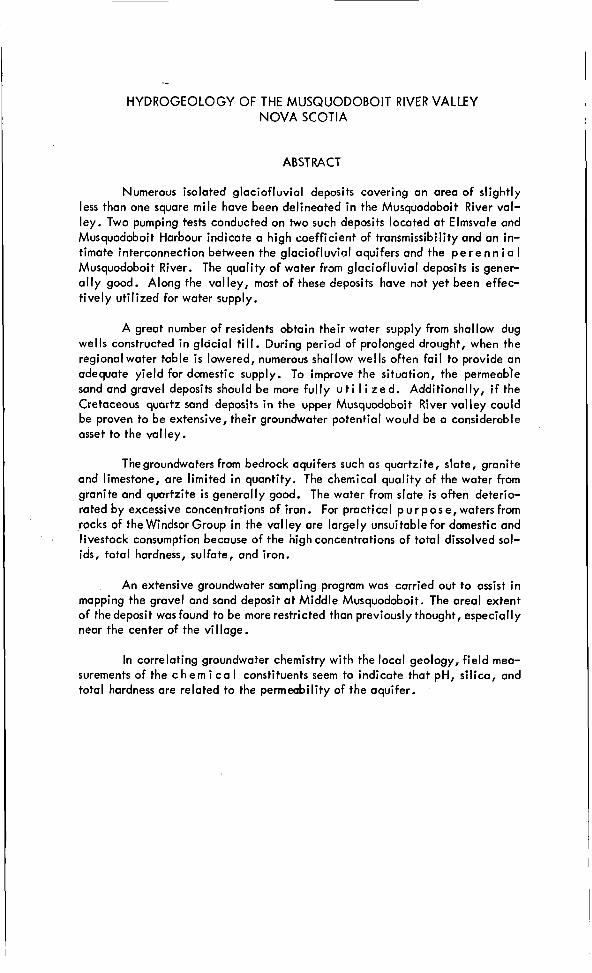
HYDROGEOLOGY OF THE MUSQUODOBOIT RIVER VALLEY NOVA SCOTIA
ABSTRACT
Numerous isolated glaciofluvial deposits covering an area of slightly less than one square mile have been delineated i n the Musquodoboit River Val- ley. Two pumping tests conducted on two such deposits located at Elmsvale and Musquodoboit Harbour indicate a high coefficient of transmissibility and an in- timate interconnection between the glaciofluvial aquifers and the p e r e n n i a I Musquodoboit River. The quality of water from glaciofluvial deposits i s gener- a l ly good. Along the valley, most of these deposits have not yet been effec- t ively utilized for water supply.
A great number of residents obtain their water supply from shallow dug wells constructed i n glacial till. During period of prolonged drought, when the regional water table i s lowered, numerous shallow wells often fail to provide an adequate yield for domestic supply. To improve the situation, the permeable sand and gravel deposits should be more ful ly u t i I i zed. Additionally, i f the Cretaceous quartz sand deposits i n the upper Musquodoboit River valley could be proven to be extensive, their groundwater potential would be a considerable asset to the valley.
The groundwaters from bedrock aquifers such as quartzite, slate, granite and limestone, are limited i n quantity. The chemical quality of the water from granite and quartzite i s generally good. The water from slate i s often deterio- rated by excessive concentrations of iron. For practiccl p u r pose, waters from rocks of the Windsor Group in the valley are largely unsuitable for domestic and livestock consumption because of the high concentrations of total dissolved sol- ids, total hardness, sulfate, and iron.
An extensive groundwater sampling program was carried out to assist i n mapping the gravel and sand deposit a t Middle Musquodoboit. The areal extent of the deposit was found to be more restricted than previously thought, especially near the center of the village.
In correlating groundwater chemistry with the local geology, f ield mea- surements of the c hem i c a l constituents seem to indicate that pH, silica, and total hardness are related to the permeability of the aquifer.
2
INTRODUCTION
Purpose and Scope of the Investigation
The purpose o f this study was to describe the hydrogeology and to eval- uate the quality and quantity of the groundwater resources of the Musquodoboit River valley. Test dri l l ing was used to assist i n mapping the surficial deposits of the area and to outline promising aquifers. Two pumping tests were carried out on aquifers located at Elmsvale and Musquodoboit Harbour to determine their potential for future use. Selected groundwater samples were collected to pro- vide basic information on the groundwater chemistry of the bedrock and surficial aquifers. Field studies of the chemistry of groundwater i n relation to the surfi- cia1 deposits were carriedout at MiddleMusquodoboit to provide a better under- standing of the surficial geology.
General Description of the Area ,
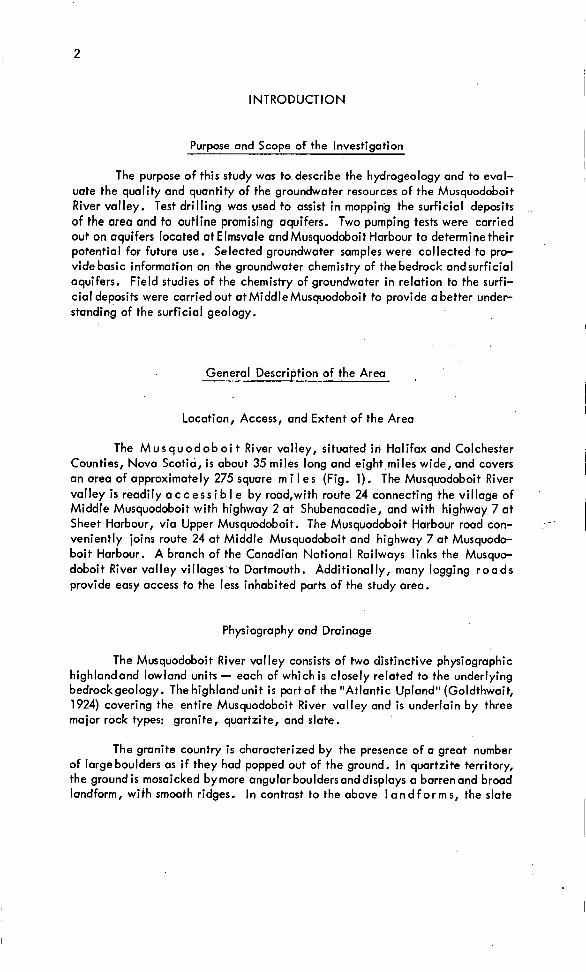
Location, Access, and Extent of the Area
The M u s q u o d o b o i t River valley, situated i n Halifax and Colchester Counties, Nova Scotia, i s about 35 miles long and eight miles wide, and covers an area of approximately 275 square m i I e s (Fig. 1). The Musquodoboit River valley i s readily a c c e s s i b I e by road,with route 24 connecting the village of Middle Musquodoboit with highway 2 at Shubenacadie, and with highway 7 at Sheet Harbour, via Upper Musquodoboit. The Musquodoboit Harbour road con- veniently joins route 24 at Middle Musquodoboit and highway 7 at Musquodo- boit Harbour. A branch of the Canadian National Railways links the Musquo- doboit River valley villages7o Dartmouth. Additionally, many logging r o a d s provide easy access to the less inhabited parts of the study area.
Physiography and Drainage
The Musquodoboit River vu1 ley consists of two distinctive physiographic highlandand lowland units - each of which i s closely related to the underlying bedrockgeology. The highland unit i s part of the "Atlantic Upland" (Goldthwait, 1924) covering the entire Musquodoboit River valley and i s underlain by three major rock types: granite, quartzite, and slate.
The granite country i s characterized by the presence of a great number of largeboulders as i f they had popped out of the ground. In quartzite territory, the ground i s mosaicked by more angular bouldersand displays a barren and broad landform, with smooth ridges. In contrast to the above I and fo rms , the slate
3
4
region i s locally bestowed with a mantle of glacial drift displaying a peculiar landform of drumlins.
The lowland unit i s underlain by Windsor rocks. The land surface i s generally poorlydrained with the Musquodoboit River meandering over the broad valley floor. Where the relief i s slight, runoff i s sluggish and the land boggy.
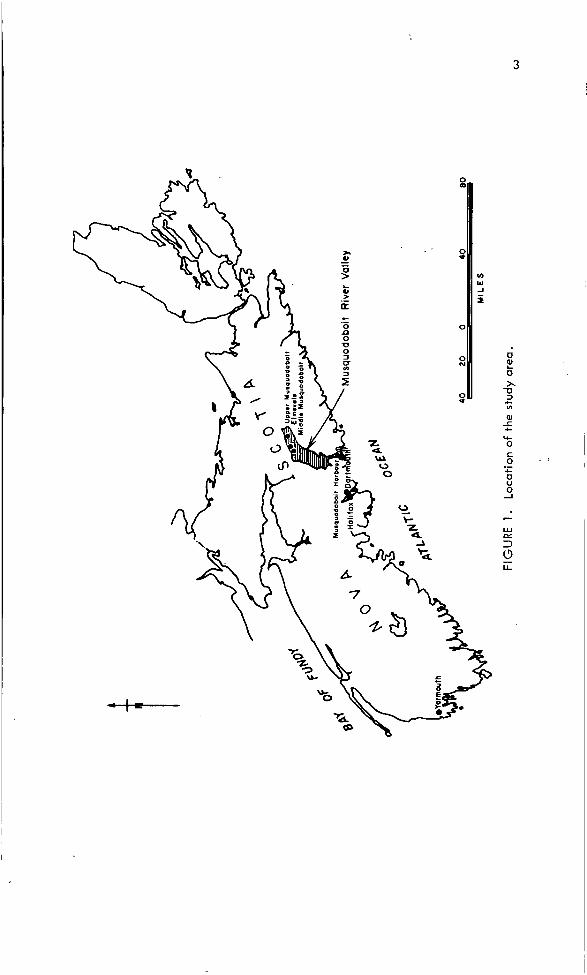
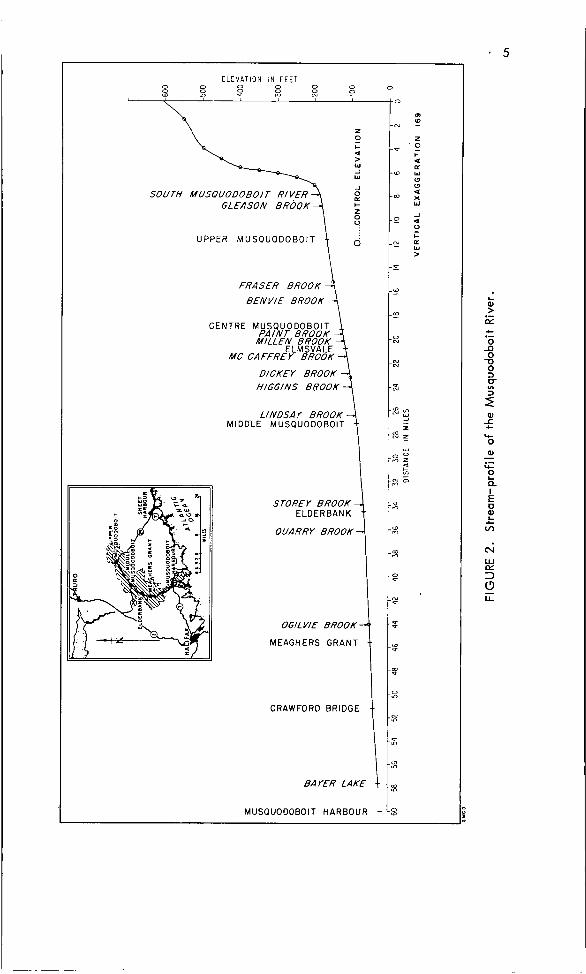
The entire course of theMusquodoboit River i s about 60 miles long. Ex- cept for the uppermost portion of the valley, the stream profile i s gently con- cave and has a gradient of 3.7 feet per mile (Fig. 2). Pleistocene glaciation has to some extentmodified the profile as i s evident from the well preserved U- shaped valley easily seen i n the uppermost and lower segments of the valley.
Recordsobtained from the Water Survey of Canada stream gauging station located near Crawford Bridge indicate the following (MMRA, 1964, p. 1): (1) the present river can handle approximately0.4 inch runoff from the whole water- shed or 2,780 cubic feet per second or c.f.s., and(2) the frequency of flooding for discharges between 2,000c.f.s. and3,OOOc.f.s. i s two to four times yearly.
The Conoda Department of Forestry and Rural Development, Nova Scotia Department of Agriculture and Marketing, and Municipality of the County of Halifax have jointly sponsored an extensive project for flood protection of farm land adjacent to the river. As a result of this pr,oiect, 15 retardation dams have been or w i l l be constructed on tributary-streams throughout the valley. A by- product of the project w i l l include development of both recreational and wild- l i fe resources of the area.
Agriculture and Soils
With few exceptions, the soils i n the valley are mainly developed on glacial dri f t with the glacial til l strongly reflecting the corn p o s i t i o n of the underlying bedrock (Table 1 ) . I t may also indicate the short distance of trans- portation of the til l during glaciation. Commonly, the granite and quartzite terrains are blanketed by a thinstony t i l l indicating its proximity to the bedrock. Soils developedon this t i l l are often deficient inl ime and suitable only for for- est production. Areas underlain by slate are m a n t I e d by moderately fine- to coarse-textured soils which with the exception of some stony areas, are fair to good croplands.
The soils i n areas underlain b y Windsor Group r o c k s are fine textured and rich i n lime and ore best suited for most crops (MacDougall et al., 1963, p. 25). Frequently, the farming practice on this soil i s severely restricted by poor drainage conditions. For soils developed on glaciofluvial deposits, how- ever, excessive drainage may be a hindrance to land use.
E L E V A T I O N I N F E E T 0 0 0 0 0 0 R : : 0 0 0 in
0 0 LD
SOUTH MUSOUODOBOIT RIVER GL€ASON BROOK
I
z
I- 4 > W 1 W
J 0 a I- z 0
0
L1
0 UPPER MUSOUODOBOIT
FRAS€R BROOK
BEN VIE BROOK
CENTRE MU SOU 0 D O E 0 I T PAINT BROOK
MILLEN BROOK ELMSVALE
MC GAFFREY BROOK
DICKEY BROOK HIGGINS BROOK
I LINDSAY BROOK M U SOU 0 DO BO1 T M I DD'LE
STOREY BROOK
OUA RRY BROOK
OGILVIE BROOK
MEAGHERS GRANT
CRAWFORD BRIDGE
I
BAYER LAKE 4 MUSOUODOBOIT HARBOUR -
6
Table 1 . Soils and their suitability for agriculture i n the Musquodoboit River valley*
Parent Materia I Soi I Classes of Land Limitations
quartzite and sandy loam forestry and stoniness, steep or granite t i l l s w i Id1 i fe shallow soils
slaty til l sandy loam fair cropland topography and stoniness
till developed on sandy clay loam good to fair poor drainage Windsor Group rocks cropland
glaciofluvial sandy loam fair to poor excessive deposits cropland drai nage
alluvial deposits silty loam good cropland flooding
organic remains peat and muck unsuitable poor drainage
* modified from MacDougaII et al. (1963, Figure 12).
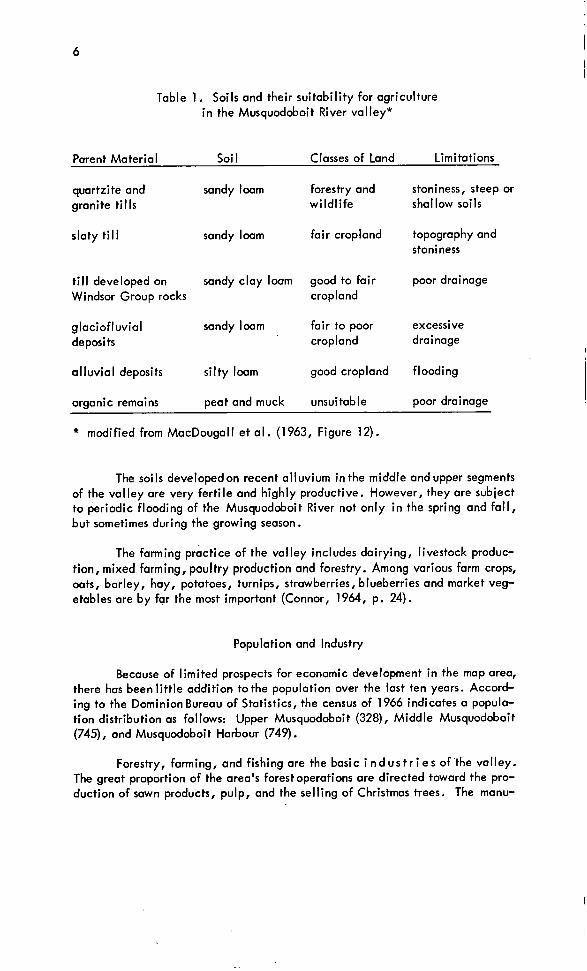
The soils developedon recent alluvium in the middle and upper segments of the valley are very fertile and highly productive. However, they are subject to periodic flooding of the Musquodoboit River not only i n the spring and fall, but sometimes during the growing season.
The farming practice of the valley includes dairying, livestock produc- tion, mixed farming, poultry production and forestry. Among various farm crops, oats, barley, hay, potatoes, turnips, strawberries, blueberries and market veg- etables are by far the most important (Connor, 1964, p. 24).
Population and Industry
Because of limited prospects for economic development i n the map area, there has been l i t t le addition to the population over the last ten years. Accord- ing to the Dominion Bureau of Statistics, the census of 1966 indicates a popula- tion distribution as follows: Upper Musquodoboit (328), Middle Musquodoboit (743, and Musquodoboi t Harbour (749).
Forestry, farming, and fishing are the basic i n d us t r i e s of 'the valley. The great proportion of the area's forest operations are directed toward the pro- duction of sawn products, pulp, and the selling of Christmas trees. The manu-
7 1
I facturing of the agricultural l ime at Upper Musquodoboit i s the l a r g e s t single enterprise having a reasonably secure future. The socio-economic study conduc- ted by Connor (1964, p. 47) reveals that cash incomes of the valley are lower than those expected i n nearby urban societies and that employment opportunities within the valley are often lacking i n security. Furthermore, the farming prac- tice i s mostly t ied to a well established family experience and tradition.
As far as recreation and conservation are concerned, much of the pc- tential wildlife resources and fishing activitiesafforded by the valley s t i l l awaits future improvement and sound management.
C!imate
The climate of the valley i s temperate and humid typical of Nova Scotia. The proximity of the ocean tends to prevent the climate of the area from reaching extremes. The so-called "Atlantic Upland" modifies considerably the climate of the valley. In other words, the physiography of the valley dictatesthe local climatic pattern.
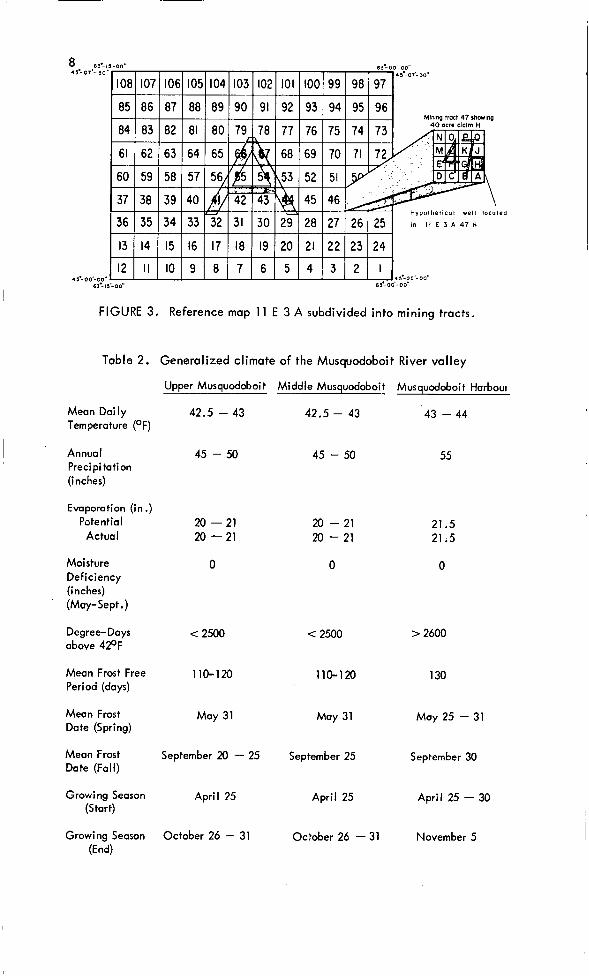
Climatic records of short duratior? are available for Middle Musquodoboit and recently Upper Musquodoboit. However, they are believed to be typical only for the I ow I a n d region. To get a true picture of the entire valley, i t i s therefore necessary to extrapolate records from meteorological stations adjacent to the valley (Chapman and Brown, 1966). Table 2 i s the summary of the result.
Land Survey System
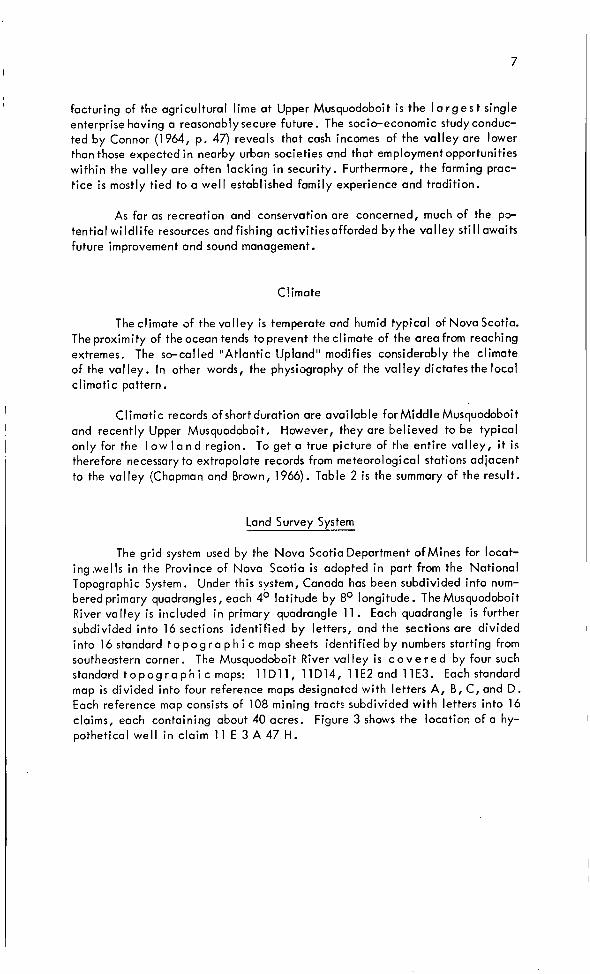
The grid system used by the Nova Scotia Department ofMines for locat- ing,weIls i n the Province of Nova Scotia i s adopted i n part from the National Topographic System. Under this system, Canada has been subdivided into num- bered primary quadrangles, each 4' latitude by 8' longitude. The Musquodoboit River valley i s included in primary quadrangle 11 . Each quadrangle i s further subdivided into 16 sections identified by letters, and the sections are divided into 16 standard t o p o g r a p h i c map sheets identified by numbers starting from southeastern corner. The Musquodoboit River Val ley i s c o v e r e d by four such standard t o p o g r a p h i c maps: 11D11, l lD14, l l E 2 and l lE3 . Each standard map is divided into four reference maps designated with letters A, B, C, and D. Each reference map consists of 108 mining tracts subdivided with letters into 16 claims, each containing about 40 acres. Figure 3 shows the locotior: of a hy- pothetical well i n claim 1 1 E 3 A 47 H.
1 1 E 3 pi 47 H
12 I
II IO 9 8 7 6 5 4 3 1 2 I
FIGURE 3. Reference map 1 1 E 3 A subdivided into mining tracts.
Table 2. Generalized climate of the Musquodoboit River valley
Upper Musquodoboit Middle Musquodoboit Musquodoboit Harbour
Mean Daily 42.5 - 43 42.5 - 43 43 - 44 Temperature (OF)
Annual 45 - 50 45 - 50 Precipi tation (inches)
55
Evuporation (in .) Potential 20 - 21 20 - 2 1 21.5
Actual 20 -21 20 - 21 21.5
Moisture 0 Deficiency (inches) (May-Sept.)
0 0
Degree-Days < 2500 < 2500 > 2600 above 420F
Mean Frost Free 110-120 110-120 1 30 Period (days)
Mean Frost May 31 May 31 May 25 - 31 Date (Spring)
Mean Frost September 20 - 25 September 25 September 30 Date (Fall)
Growing Season April 25 April 25 April 25 - 30 (Start)
Growing Season October 26 - 31 October 26 - 31 November 5 (End)
9
Previous investigations
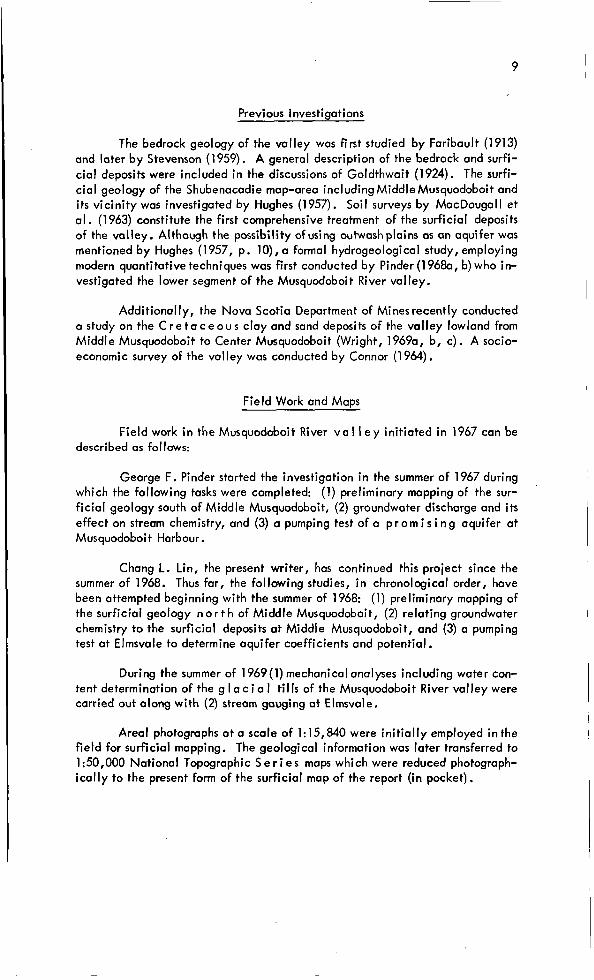
The bedrock geology of the valley was first studied by Faribault (1913) and later by Stevenson (1 959). A general description of the bedrock and surfi- cia1 deposits were included in the discussions of Goldthwait (1924). The surfi- cia1 geology of the Shubenacadie map-area including Middle Musquodoboit and i t s vicinity was investigated by Hughes (1957). Soil surveys by MacDougaII et al. (1963) constitute the first comprehensive treatment of the surficial deposits of the valley. Although the possibility of using outwash plains as an aquifer was mentioned by Hughes (1957, p. lo), a formal hydrogeological study, employing modern quantitative techniques was first conducted by Pinder (1968a, b) who in- vestigated the lower segment of the Musquodoboit River valley.
Additionally, the Nova Scotia Department of Mines recently conducted a study on the C r e t a c e o u s clay and sand deposits of the valley lowland from Middle Musquodoboit to Center Musquodoboit (Wright, 19690, b, c). A socio- economic survey of the valley was conducted by Connor (1 964).
Field Work and Mom
Field work i n the Musquodoboit River v a I I e y initiated i n 1967 can be described as follows:
George F. Pinder started the investigation i n the summer of 1967 during which the following tasks were completed: (1) preliminary mapping of the sur- f icial geology south of Middle Musquodoboit, (2) groundwater discharge and i t s effect on stream chemistry, and (3) a pumping test of a p r o m i s i n g aquifer at Musquodoboi t Harbour.
Chang L. Lin, the present writer, has continued this project since the summer of 1968. Thus far, the following studies, i n chronological order, have been attempted beginning with the summer of 1968: (1) preliminary mapping of the surficial geology n o r t h of Middle Musquodoboit, (2) relating groundwater chemistry to the surficial deposits a t Middle Musquodoboit, and (3) a pumping test at Elmsvale to determine aquifer coefficients and potential.
During the summer of 1969(1) mechanical analyses including water con- tent determination of the g I a c i a I t i l l s of the Musquodoboit River valley were carried out along with (2) stream gauging at Elmsvale.
Areal photographs at a scale of 1:15,840 were in i t ia l ly employed inthe field for surficial mapping. The geological information was later transferred to 1:50,000 National Topographic S e r i e s maps which were reduced photograph- ical ly to the present form of the surficial map of the report (in pocket).
10
Acknow I edgments
This investigation, under the direction of John F. Jones, Chief, Ground- water Section, Nova Scotia Department of Mines, was in i t ia l ly a joint under- taking between the Canada Department of Forest and Rural Development and the Province of Nova Scotia (ARDA project no. 22042). Recently the administration of the ARDAAct was transferred to the Canada Department of Regional Economic Expansion.
The Department of Mines provided f ie ld vehicles, power aguer, portable chemical Hach kit, aerial photographs, topographic maps, and other equipment necessary for this study. Very able assistance was received during thesurnrners, 1967and 1969from David Stonehouse, the summer of 1968 from Gary Grove and Stewart Hattie and part of the summer of 1970 from Lynn B.. Thomas. The effort contributed by the Department ofMines rotary dr i l l crew in the test dri l l ing and pump testing was deeply appreciated. The map and illustrations i n this report were prepared by D. Bernasconi and his staff of the Cartographic Section, Nova Scotia Department of Mines. Without the cooperation and help of the residents of the valley and many others too n u m e r o u s to mention, this study would not have been possible.
,
1 1
GEOLOGY
Introduction
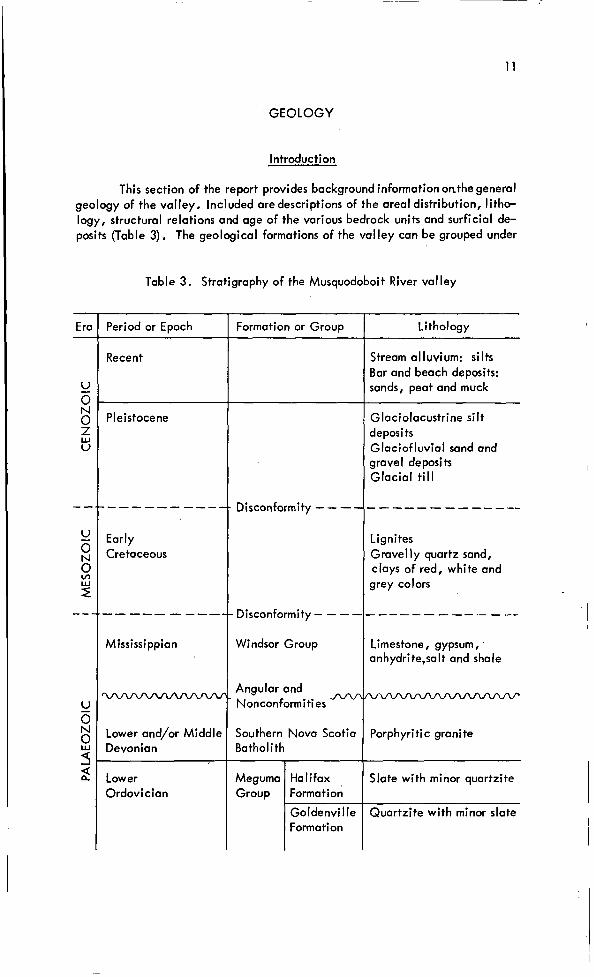
This section of the report provides background information onthe general geology of the valley. Included are descriptions of the areal distribution, litho- logy, structural relations and age of the various bedrock units and surficial de- posits (Table 3). The geological formations of the valley can be grouped under
Table 3. Stratigraphy of the Musquodoboit River valley
- Era Period or Epoch
Recent
Pleistocene
Early Cretaceous
Lower and/or Middle Devonian
Lower Ordovician
Formation or Group
Disconformity - - -
Disconformity - - - Windsor Group
Angular and Nonconformities
JW-
Southern Nova Scoti Ba tho1 i th
Meguma Group
Ha I ifax Format ion
Goldenvill Forma ti on
Lithology
Stream alluvium: s i l t s Bar and beach deposits: sands, peat and muck
Glaciolacustrine s i l t deposits Glaciofluvial sand and gravel deposits Glacial till
Lignites Gravelly quartz sand, clays of red, white and grey colors
Limestone, gypsum, anh ydri te,sa It and shale
Porphyritic granite
Slate with minor quartzite
Quartzite with minor slate
12
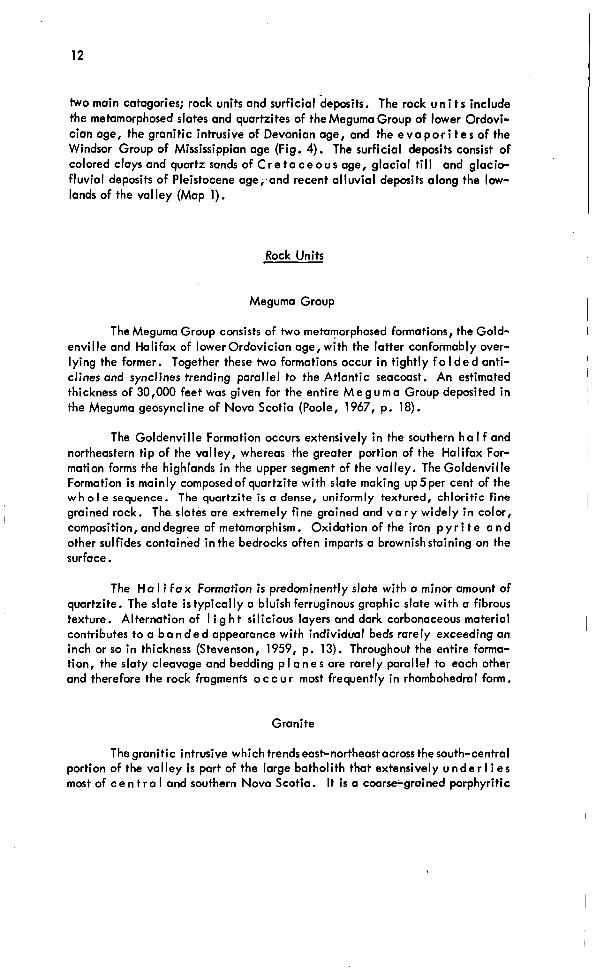
two main catagories; rock units and surficial deposits. The rock u n i t s include the metamorphosed slates and quartzites of the Meguma Group of lower Ordovi- cian age, the granitic intrusive of Devonian age, and the e v a p o r i t e s of the Windsor Group of Mississippian age (Fig. 4). The surficial deposits consist of colored clays and quartz sands of C r e t a c e o u s age, glacial ti l l and g l a c i e fluvial deposits of Pleistocene age;-and recent a l l w i a l deposits along the low- lands of the valley (Map 1).
Rock Units
Meguma Group
The Meguma Group consists of two metamorphosed formations, the Gold- enville and Halifax of lowerOrdovician age, with the latter conformably over- lying the former. Together these two formations occur i n tightly f o I d e d anti- clines and synclines trending parallel to the Atlantic seacoast. An estimated thickness of 30,000 feet was given for the entire M e g u m a Group deposited i n the Meguma geosyncline of Nova Scotia (Poole, 1967, p. 18).
The Goldenville Formation occurs extensively i n the southern h a I f and northeastern tip of the valley, whereas the greater portion of the Halifax For- mation forms the highlands i n the upper segment of the valley. The Goldenville Formation i s mainly composedofquartzite with slate making up5per cent of the w h o I e sequence. The quartzite is a dense, uniformly textured, chloritic fine grained rock. Theslates are extremely fine grained and v a r y widely i n color, composition, anddegree of metamorphism. Oxidation of the iron p y r i t e a n d other sulfides contained i n the bedrocks often imparts a brownish staining on the surface.
The H a I i f a x Formation i s predominently slate with a minor amount of quartzite. The slate i s typically a bluish ferruginous graphic slate with a fibrous texture. Alternation of I i g h t silicious layers and dark carbonaceous material contributes to a b a n d e d appearance with individual beds rarely exceeding an inch or so i n thickness (Stevenson, 1959, p. 13). Throughout the entire forma- tion, the slaty cleavage and bedding p l a n e s are rarely parallel to each other and therefore the rock fragments o c c u r most frequently i n rhombohedral form.
Granite
The granitic intrusive which trends east-northeast across the south-central portion of the valley i s part of the large batholith that extensively u n d e r 1 i e s most of c e n t r a I and southern Nova Scotia. It i s a coarse-grained porphyritic
FIGURE 4. Bedrock geology of the Musquodoboit River valley, Nova Scotia.
14
granite with large whitish or pinkish feldspar as the phenocrysts. Both r a d i o - active dating and field occurrence suggests that large scale intrusion took place i n Nova Scotia during lower Devonian age (Smitheringale, 1960, p. 25; edito- rial note i n Crosby, 1962, p. 31). Furthermore, because l i t t le or no disturbance has been done to the structure of the host rocks, mainly the Megumo Group, the granitic intrusion i s considered to be a quiet one, although, locally, contact metamorphism i s common near contact zones.
Windsor Group
Overlying the Meguma Group and the granitic intrusive with an angular unconformity, are rocks of the Windsor Group, of late Mississippian age. Pres- ent only i n the valley lowlands, the youngerwindsor rocks are mainly composed of flat-lying limestone interbedded with gypsum, anhydrite and salt. Available exposures on valley sides indicate that W i n dso r Group once occupied a much larger area and possessed a thicker sequence. Lithologically, the limestone of thevalley i s mostlydolomitic i n composition, andof lower Windsor age (Steven- son, 1959, p. 25, 73).
Surficial Deposits
Cretaceous Quartz Sands and Clays
Unconsolidated interbedded red, grey and white clay, quartz sand, and lignite deposits are known to occur for a distance of at least 7 miles b e t w e e n Middle and Centre M u s q u o d o b o i t. Similar deposits with lignite located at Shubenacadie have been dated as early Cretaceous i n age (Stevenson, 1959, p. 35; Stevenson and McGregor, 1963, p. 355).
In Department of Mines, Groundwater Section Test Hole #404, located at Elmsvale, carbonaceous material, was encountered i n the following log of the bore hole:
Depth, feet Well Log
0 - 41 Fine outwash gravel 41 - 58 White clay 5 8 - 282 Grey and red clays interbedded with
gravelly quartz sands (Carbonaceous material at 247'-255') Alternation of red and grey clays (Carbonaceous material at 460'-510') Alternation of red and grey clays or shales (?) (Carbonaceous material a t 570'-592')
282 - 520
520 - 592
592- 597 Limestone (Windsor Group?)
15
Two carbonaceous samples recovered from the 480' to 490' and 570' to 580' in- tervals were forwarded to the Coal R e s e a r c h Section*, Geological Survey of Canada. They reported the following assemblage of microspores from both sam- ples which were identified and dated as early Cretaceous in age.
Cyathidites (Leiotriletes) australis Couper Cicatricosisporites dorogensis R. Potonih and Gelletich GI eichen i idi tes senoni cus Ross Lygodioispo;ites sp. cf. Trilobosporites bernissariensis (Delcourt and Sprumont)
Abietineaepollenites spp. Appendicisporites sp. Cycadopi tes sp. Eucommiidites sp. De I toi dospora (Lei otri I etes) spp , Lycopodiumspori tes sp.
R. Potonie-
As a result of this evidence, these unconsolidated deposits i n the M u s - quodoboit River valley are considered to be early Cretaceous in age. Available data at the present time are not sufficient e n o u g h to accurately delineate the full areal extent and thickness of the deposit.
To the south of Elmsvale, quartz sand i s exposed on or n e a r the ground surface. A thick quartz sand bed of more than 156feet was encountered, under- lain by 55 feet of red-brown till, i n Department of Mines Groundwater Section T.H. #380, north of Elmsvale. Recently test dri l l ing south of Elmsvale suggests that the quartz sand i s a depression-filling d e p o s i t on the surface of the clay (Wright, 1969a, p. 6). According to Wright (1969c, p. 7), some of the sections intersected i n test dri l l ing indicate a high grade silica, but others require ben- eficiation to upgrade the silica content for industrial uses.
Most of the clay deposits contain iron o x i d e s , silica and micas as im- purities and require some type of beneficiation to make them suitable for high- and super-duty refractory products. However, a large-tonnage of clay w o u 1 d be available i f the removal of the iron o x i d e s by hydrochloric acid bleaching could be economically feasible (Wright, 19690, p. 14).
Glacial T i l l
Except for outcrops of bedrock, the e n t i r e valley i s mantled by a thin blanket of Wisconsin glacial til l (Hughes, 1953, varying i n thickness from less
* Both samples are recorded at C o a I Research Section, Geol. Surv. Can., as CRS No. 1376/B1219and CRS No. 1377/81220.
16
than 1 foot to more than one hundred feet. The till i s generally believed to be thicker i n the valley lowland than over u p l a n d a r e a . Because of the thin till cover, the type of bedrock strongly influences the composition and characteris- tics of the overlying t i l l . No gumbotils, paleosols, orvtopographic unconformi- ties were found a m o n g the various tills, suggesting a possible lack of multiple glaciation.
Based upon the nature of the composition and the conditions of fieldout- crops, the til l can be subdivided into four main units: re6brown or silty, slaty, sandy, and bouldery t i I I s (Map 1).
The red-brown s i l ty t i l l i s a clayey, compacted lodgement til l consisting mainly of sandstone, granite, and slate fragments. It i s plastic when wet, and very dense and hard when dry. This ti l l i s most extensive throughout the valley especiallyin the upper and middle segments of the valley lowland where Windsor Group rocks form the bedrock. The color i s a very diagnostic property for this basal till.
The s a n d y till i s less cohesive, less compacted, and contains less clay than the red-brown till. It i s a thin ablation till, resulting from the final down- wasting of the ice. Stratigraphically, the sandy til l always lies above the r e 6 brown till.
Slaty til l i s mainly a red-brown till mixed with a large amount of slate fragments locally derived from the Meguma slate. Occasionally, i t may also be a separate till unitunderlain by red-brown till. However, the latter type of the slaty till i s generally too small to be mappable. A good contact between i t and the red-browntill can be seen in a road cut half way between Wyse Corner and M e a g h e r Grant. The abundance of slaty fragments causes the til l to become grey or dark i n color.
Bouldery t i l l i s very sandy having a high percentage of boulders of v a r ious sizes. It occurs extensively i n the southern h a I f and northeastern portion of the valley where the bedrock i s either granite or quartzite.
The o c c u r r e n c e of the bouldery, slaty, and red-brown silty t i l l s can generally be related to the bedrock geology of the valley (Fig. 4). To further understand the regional variation of the red-brown basal till, mechanical anal- yses including water content* determination of 108 till samples have been at- tempted (Fig. 5). There seems no significant deviation from the apparent trend of the cumulative c u r v e s suggesting a possible lack of multiple g l a c i a t i o n (Flint, 1957, p. 116). However, i t i s a surprise to note that the percentage of
* The water content of a soil i s defined as the ratio of the weight of water to the dry weight of the aggregate and i s usually expressed as a percentage.
17
,
0 0
ONlSSVd I N 3 3 t13d "
18
clay and s i l t c o n t e n t of the t i l I i s consistantly low. Geologically speaking, high s i l t and clay content i s generally confined within or not too distant from the slate and granite terrains. This may also account for the high water content of the till (Fig. 6). However, both the sand and gravel content vary consider- ably (Fig, 7). The region having a sand and gravel ratio less than unity closely matches with the slate, quartzite and granite bedrock areas. The middle seg- ment o f the valley i s transversed by,a"sandy zonel'with a sand and gravel ratio greater than 3. The presence of the sandy zone i n t i l l s i s not clear a t the pres- ent time and geological implication m u s t await further results from a regional study of glacial t i l l s .
Glaciofl uvial Deposits
The glaciofluvial sand and gravel s t r a t i f i e d deposits such as outwash plains, kames, and valley train result from the transportation and deposition of me1 t waters.
Outwash plains are most common in the upper segment of the valley and occur mainly along the Musquodoboit River a t the mouths -of tributary-streams. The areal extent of each outwash plain i s less than one square mile. Most fre- quently, the sand and gravel are rudely bedded and not well sorted.
Most kame deposits are small and randomly scattered along the v a I I e y lowland. The main sand and gravel body at MiddleMusquodoboit i s a kame de- posit. Along the sides of the &shaped granite valley below Wyse Corner, nu- merous kame deposits of a n g u l a r, medium to coarse so n d and fine gravel are present. Additionally, the sand and gravel d e p o s i t s i n the bottom of the U- shaped granite valley can be considered as valley trains. The best example of such an origin i s the sand and gravel deposit a t Musquodoboit Harbour.
Along the valley, seven main glaciofluvial deposits have been delinea- ted. Detailed studies have been made of these deposits located at Elmsvale and Musquodoboit Harbour (see discussions in hydrostratigraphic u n i t s) and Middle Musquodoboit (see discussions i n local properties of the groundwater i n the SUI-
f icial aquifers).
Glaciolacustrine Deposits
In an area immediately south of Middle Musquodoboit, there i s a rela- tively large deposit of glaciolacustrine s i l t and clay whichis quite plastic when wet.
19
- ens
S!iT 8 CLAY CONTENT
,:.:.,... <lo./.
1 0 - 2 0 ’ ~
20-30%
0 > 30Y.
- 2 0 - WATER CONTENT 20%
0 SAMPLE LOCATION
WATER 8 SILT-CLAY CONTENT OF THE GLACIAL TILL
MUSPUODOBOIT RIVER VALLEY, NOVA SCOTIA
FIGURE 6. Water content and silt and clay content of the glacial ti l ls .
20
I L E G E N D
SAND 8 GRAVEL RATIO
< I O
1-0-2.0
20 -3.0
> 3 0
0 SAMPLE UXATION
FIGURE 7. The sand and gravel ratio of the glacial t i l ls.
I
21
Recent Beach and Salt Marsh
- There are several recent beach and bar deposits along the Atlantic coast
port of the valley at Martinique Beach and Nauffts Point. The deposits are grey i n color and vary i n t e x t u r e from fine sand to coarse gravel. Also, two sa I t marshes are present along the coast as t i d a I deposits. The salt marshes consist of grey s i l t or silt loam and are subject to tidal flood periodically (MacDougall et al., 1963, p. 37).
Stream Alluvium
Recent silty alluvium derived from seasonal flooding blankets the valley lowland adjacent to the main streams. A particularly well developed deposit i s found immediately south of Middle Musquodoboit. The presence of an alluvial blanket often masks the areal extentof the underlying outwash deposits i n many parts of the valley bottom.
Peat and Muck
Swampydeposits of muck and peat are found in many depressionsboth i n Presence of extensive swampy areas sug- the lowland and on the upland areas.
gests poor drainage conditions.
Structure
The structure of the a r e a i s a part of the A p pa I a c h i a n folded belt (Stevenson, 1959, p. 37; Poole, 1967, p. 33). The Meguma rocks are charac- terized by high angle, tight folds which parallel the Atlantic sea coast and by low grade of metamorphism. An a n g u I a r unconformity separates the Meguma Group rock from the o v e r I y i n g Windsor Group which forms a brood syncline along the valley lowland.
The studies of the fault systems are severely limited by the e x t e n s i v e covering of the glacial drift of the area. According to Stevenson (1959, p. 39), the Meguma Group i s generally dissected by two distinctive sets of faults: the northwest- and northeast-striking faults. The slaty c I e a v a g e i n the Meguma slate generally strikes parallel with the fold axis of the rocks and are s t e e p l y inclined.
Available i n f o r m a t i o n suggests that the fault systems i n the Meguma Group may also be related to the regional joint (or fracture) systems developed in granite intrusive. There seems l i t t le doubt that a l l the structures of the val- ley are resulted from the unique r e g i o n a I tectonics of Nova Scotia (Brunton, 1926).
22
Geomorphology
The h i g h I a n ds of the valley are. remnants of the "Atlantic Upland" (Goldthwait, 1924), a peneplain formed during early Cretaceous age or earlier. Subsequent uplift of t h i s surface resulted i n an active erbsion and downcutting (Fig. 8).
The o r i g i n of the Musquodoboit River has been discussed at length by Goldthwait (1924, p. 46). Above Wyse Corner, the stretch of r i v e r i s subse- quent, developed by headword growth of a lateral stream through the soft Wind- sor bedrock area. Near Wyse Corner, the river makes a sharp bend and enters a deep narrow gorge cutting through the granitic bedrock. Goldthwait (1924, p. 46) speculates that the Musquodoboit River may have had i t s headwaters north of the Minas Basin and that the old Musquodoboit River was pirated by the de- veloping Minas Basin.
The presence of extensive Cretaceous clays and quartz sands along the upper segment of the Val ley lowland, strongly suggests that the upper Musquodo- boit River was indeed a tributary-stream of the Shubenacadie River discharging into the Minas B a s i n to the north. It appears that the Shubenacadie drainage s,ystem was well established long before Pleistocene glaciation under the guid- ance of the less-resistant Windsor rock units.
Pleistocene glaciation has actually done l i t t le modification to the pre- glacial landform. Mapping of glacial erratics and striations indicates that the main front of the ice sheetmainly moved in a southeastern direction (Goldthwait, 1924). During early stages of glaciation, the local ice front was heldstationary by the existing highlands around the Windsor Basin i n the Shubenacadie drainage system. When the ice sheet was thicker, the stationary ice mass was forced to find an outlet. Naturally the existing lowland along the lower Musquodoboit River dictated the m o v e m e n t of the feelers' ice longue. The present narrow, rugged &shaped granite v a I I e y was thus enlarged and modified from an ordi- nary small channel such as those commonly found along the Atlantic coastof the Province. When the entire area was covered by ice, the local topography was no longer important.
When the ice s h e e t started to retreat, deposition of glacial till i n the form of recessional moraines (Pinder, 1968b, p. 10) resulted i n partial damming of the tributaries of the IowerMusquodoboit RvieratWyse Corner and the south- westward extension of the u p p e r Musquodoboit River near Chaswood. Again, the local topography became important and dictated the course and direction of melt waters. Available information suggests that during active stages of degla- ciation, the melt waters discharged not only intoMusquodoboit Harbour, via the granite valley near Wyse Corner but into the Minas Basin, via Cook Brook, and the Shubenacadie River. When the glacial ice finally became very thin, dam- ming near Chaswood resulted i n an effective barrier diverting the discharge of the upper Musquodoboit River into the Atlantic Ocean. This long, complicated
:...
I
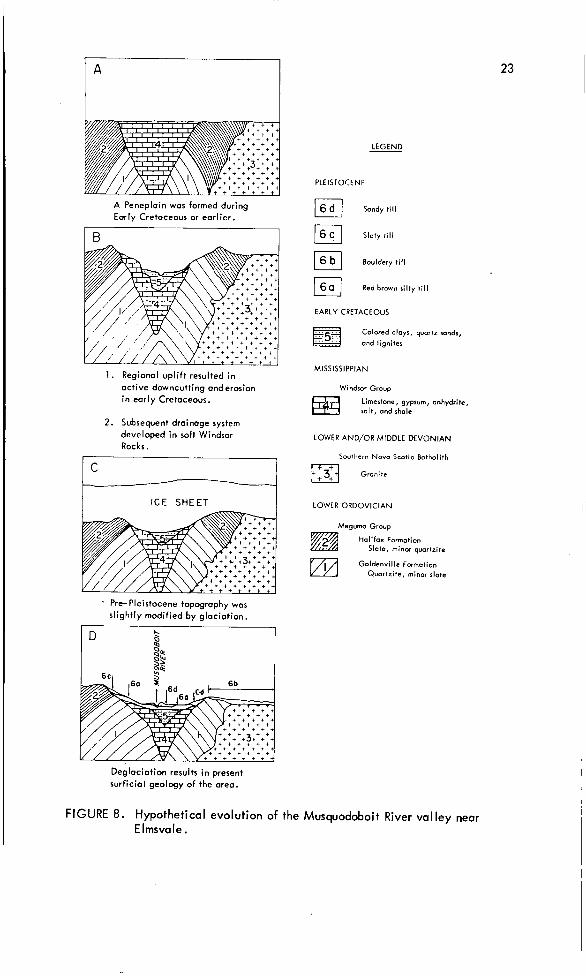
A Peneplain was formed during Eorly cretaceous or earlier.
Bouldery t i l l
Red brown silty t i l l
EARLY CRETACEOUS
Colored cloys, quartz sondr,
ond lignites
1 . Regional uplift resulted in active downcutting and erosion in early Cretaceous.
2 . Subsequent drainage system developed in soft Windsor Rocks.
ICE SHEET
7 Pre-Pleistocene topogrophy was slightly modified by glaciation.
D
Deglociation results in present surficial geology of the area.
23
LEGEND
PLEISTOCENF
Sondyti l l
MISSISSIPPIAN
Windsor Grovo
Limestone, gypsum, anhydrite, salt, and shale
LOWER AND/OR MIDDLE D E V O N I A N
Southern Novo Scotia Batholith
Gronite
LOWER O R D O V I C I A N
mMegumo Group
Halifax Formotion Slots. minor quartrite
Goldenville Formotion Quartzite, minor slate
FIGURE 8. Hypothetical evolution of the Musquodoboit River valley near E lmsvale .
24
geomorphological evolution of the v a I I e y was highlighted by the birth of the Musquodoboit River. It i s l ikely that the continuous headword e r o s i o n of the Shubenacadie drainage system w i l l eventually recapture the upper Musquodoboit River.
The presence of the offshore beaches and bars today i s the result of the regional isostatic readjustment of land mass after glaciation.
I
HYDROSTRATIGRAPHIC UNITS
Introduction
25
A hydrostratigraphic unit i s defined as a g r o u p of geological materials which have similar water-storage and -transmitting properties (Trescott, 1968). Only interconnected or continuous interstices, pores, or pore space in e a r t h materials can serve as conduits for groundwater movement. A l l interstices fall into two main systems: primary and secondary. The primary (or original) inter- stices were formed by g e o I o g i c a I processes which governed the origin of the geological units and are f o u n d i n sedimentary and igneous rocks (Todd, 1959, p. 15). Secondary i n t e r s t i c e s such as joints, fractures, foliations, solution channels, and openings formed by plants and animals, were developed after the rock was formed. In general, the number and the aperature of interstices de- crease with depth, resulting from the increasing confining pressure of the over- burden materials.
The main hydraulic properties of geological m a t e r i a Is art! the water- transmitting and water-storage p r o p e r t i es, corresponding respectively to the coefficient of permeability and the coefficient of storage. The coefficient of the f ie ld permeability e x p r e s s e d in gallons per day per square foot or ft/sec can be defined as the rate of flow in gallons per day through a cross-section of an aquifer one foot thick. The permeability (K) values of various sizes of material can be generalized as follows:
Size Grave I Sand S i l t Clay K > 10-2 10- 10-4 10-5- 10-7 < 10-8
ft/sec
In practical applications, the coefficient of transmissibility, expressed in terms of imperial gallons per day per foot, i s frequently employed and equals the product of the coefficient of permeability and the saturated thickness of the aquifer. The coefficient of storage i s defined as the volume of water an aquifer releases from or takes into s t o r a g e per unit surface area of a q u i f e r per unit change in the component of the head n o r m a I to that surface. Under confined conditions, the coefficient of storage equals that part of the water contributed from the elastic e x pans i o n of water itself and the compression of the aquifer matrix. None of the porosity under confined conditions contributes to the refi l l- ing or dewatering of the aquifer because the s a t u r a t e d thickness remains un- changed. Therefore,, the coefficientof s t o r a g e i s small and generally ranges in value from 1 .O x to 1 .O x lom3 (Ferris et al., 1962, p. 76). However, under unconfined conditions, a third source of water i s the specific yield which i s a major one. The specific yield i s d e f i n e d as that portion of porosity con- tributing directly to the refi l l ing or dewatering of the aquifer under unconfined
26
conditions. When dewatering processes become effective, the volume of water derived from gravity drainage overshadows the volume of water d e r i v e d from elastic behavior. Typical values of the coefficient of storage range from 5.0 x
to 0.30 (Ferris et al., 1962, p. 78).
The aquifer constants, namely, the coefficients of storage and transmis- sibility (and permeability) can be determined from a properly run field pumping test. They are used to evaluate the long-term rate of f luid withdrawal and asso- ciated drawdowns, with time and space from aquifers and allow for better water management, be i t for individual, municipal or industrial use. Pumping test data from which the coefficients of transmissibility and storage were determined are available for the surficial aquifers located at Elmsvale andMusquodoboit Harbour (see p. 27-30).
Bedrock H ydros tra t igra p hi c Units
Slate, Quartzite and Granite
Practically speaking, solid dense slate, quartzite and granite yield no water i f they are unfractured. However, interstices of either primary or secon- dary or of both are present i n these rocks. For the extremelyfine-grained slate, the significant interstices are the slaty cleavages and the relic bedding planes, i n addition to the jointsystems related to the regional structure of Nova Scotia. O w i n g to the preponderance of the solitary orientation of the slaty cleavage, the permeability of the rock mass as a whole may tend to be anisotropic (Davis and De Wiest, 1966, p. 320). The granular interlocking of mineral particles i s the ma i n reason effectively preventing the fluid passage through quartzite and granite. However, similar to slate, quartzite and granite commonly are dissec- ted by several systems of joints which make permeability i n these rocks less an- isotropic.
Subsequent removal of the overburden materials and surficial weathering w i l l increase the permeability of the upper fractured z o n e of the bedrock. As the confining pressure increases with depth, the apertures of most fractures be- c o m e tighter and eventually prohibiting the fluid flow through them. Hence, chancesfor locating a satisfactory well water supply diminish with depthand i t i s doubtful that satisfactory water supply w i I I easily be obtained at depths below 250 feet (Trescott, 196%, p. 26).
According to data obtained from well drillers' logs, the a v e r a g e well yield for 10 wells i n slate was around 6 igpm, r a n g i n g from 2 to 15 igpm. In q u a r t z i t e and granite areas, the recorded average was about 8 igpm, ranging from 1 to 26 igpm. In another part of the Province, Trescott (l969b, p. 26) re- ported an estimatedaverage of 1.5 to 2igpm for Windsor-Hantsport-Walton area.
27
As the drillers' bail test generally i s of short duration, the well-yield would be less than the bail-test data when local boundary c o n d i t i o n s are considered. However, for d o m e s t i c purpose where the pumping i s intermittent, the writer believes that 2 or 3 igpm should be a fair estimate for a well depth of 100 feet or more.
Windsor Group
Fractures, joints and solution openings are i m p or t o n t i n most typical limestone aquifers. Besides, diagenetic change of calcite into dolomite also results in an additional 13 per cent of void s p a c e (Davis and De Wiest, 1966, p. 353). All of these, theoretically tend to increase the bulk porosity and per- meability of the rock. However, yields i n limestone usually are not h i g h de- spite the fact that solution channels are frequently cited in literature as a typ- ical feature associated with I i m e s t o n e aquifers. Two drillers' bail tests from Windsor Group of the valley give an average yield of 6 igpm. Also, relatively thick sequences of glacial drift are usuallyassociatedwith the limestoneaquifers i n the lowland portion of the valley, creating an additional factor tobe consid2 ered when exploiting the limestone aquifer.
Surficial Hydrostratigraphic Units
Cretaceous Quartz Sands and Clays
The Cretaceous sand bed encountered at the Department of Mines T.H. #380 i s a well sorted, coarse sand to fine gravel. If the areal distribution could be proven to be extensive, i t would be a considerable asset to the groundwater resources of the valley. Because of the c o v e r i n g of the Pleistocene till, the underlying Cretaceous sand deposit occurs mostly under c o n f i n e d conditions. Hydrogeologically, the stratified nature of the Cretaceous colored clays are for practi'cal purposes impermeable to water and this limits their use as an aquifer.
N o hydrogeological study has been made on the enitre deposit.
G laciofluvial Deposits
Elmsvale Sand and Gravel Aquifer - The Elmsvale aquifer i s a NE-SW trending outwash deposit with a max-
imum length of one mile and a width of three quarters of a m i I e. The average saturated thickness of the aquifer at the well f ield i s about 50 feet.
28
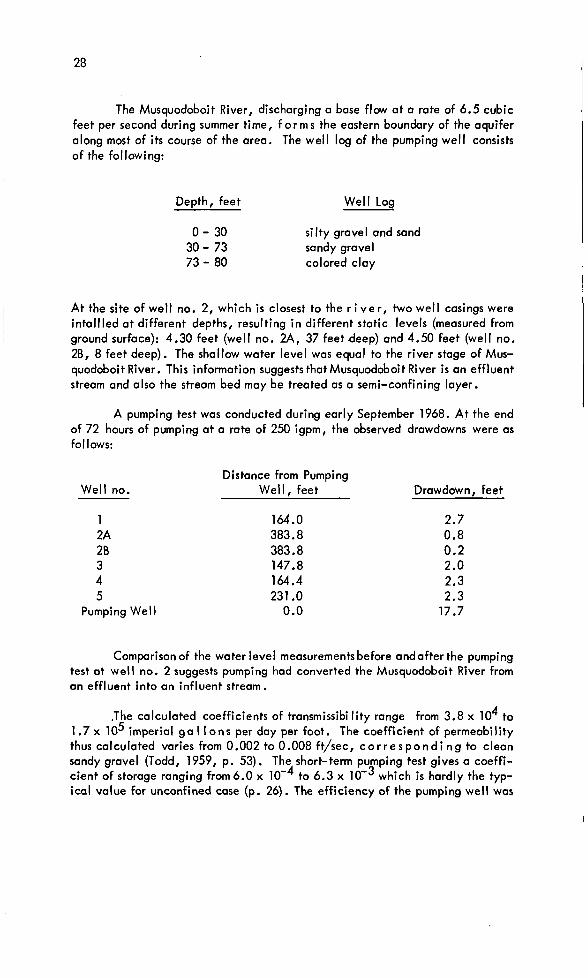
The Musquodoboit River, discharging a base flow at a rate of 6.5 cubic feet per second during summer time, f orms the eastern boundary of the aquifer along most of i t s course of the area. The well log of the pumping well consists of the following:
Depth , feet Well Log
0 - 30 silty gravel and sand 30 - 73 sandy gravel 73 - 80 colored clay
A t the site of well no. 2, which i s closest to the r i v e r, two well casings were intall led at different depths, resulting i n different static levels (measured from ground surface): 4.30 feet (well no. 2A, 37 feet deep) and 4.50 feet (well no, 28, 8 feet deep). The shallow water level was equal to the river stage of Mus- quodoboit River. This information suggests that Musquodoboit River i s an effluent stream and also the stream bed may be treated as a semi-confining layer.
A pumping test was conducted during early September 1968. A t the end of 72 hours of pumping at a rate of 250 igpm, the observed drawdowns were as follows:
Distance from Pumping Wel l no. Wel l , feet Drawdown, feet
1 2A 28 3 4 5
Pumping Well
164.0 383.8 383.8 147.8 164.4 231 .O 0.0
2.7 0.8 0.2 2.0 2.3 2.3 17.7
Comparison of the water level measurements before and after the pumping test at wel l no. 2 suggests pumping had converted the Musquodoboit River from an effluent into an influent stream.
.The calculated coefficients of transmissibi l i ty range from 3.8 x 10 4 to
1.7 x lo5 imperial g o I I o n s per day per foot. The coefficient of permeability thus calculated varies from 0.002 to 0.008 ft/sec, c o r r e s p o n d i n g to clean sandy gravel (Todd, 1959, p. 53). The short-term pumping test gives a coeffi- cient of storage ranging from 6.0 x lom4 to 6.3 x which i s hardly the typ- ical value for unconfined case (p. 26). The efficiency of the pumping well was
29
calculated from a step-drawdown test conducted after the end of pumping test. The well loss thus calculated i s equal to 33%. Litemlly, i t means only 67% of the observed drawdown i s the real formation loss at pumping well.
Digital simulation studies of this aquifer (Lin, 1970) indicate that the system would approach the apparent steady state condition at the end of &day duration of pumping. An intimate interconnection between the aquifer system and the superposing Musquodoboit River was revealed. The vertical permeability of the stream bed, assuming a thickness of 4 feet, was calculated to be at least 5.0 x ft/sec. Under a given set of conditions, the steady state drawdown i s a function mainly of the distance to and the rate of recharge from the Musquo- doboit River. A slight c h a n g e i n hydraulic conductivity of the stream bottom w i l l result i n a pronounced effect on the drawdown curve.
Overall information suggests that a properly constructed well would be capable of yielding at least 1,200flOoigpd which i s roughly 800 igpm for a 20- year period. If a larger supply i s needed in the future, a multiple well system can be employed.
As p o i n t e d out by Trescott et 0 1 . (1970), seasonal variation i n stream discharge i s probably an important factor contributing to'the silting of a stream bottom. In the Musquodoboit River valley, another important element should be considered. As f i f t e e n retardation dams for flood protection have been bui l t along the valley, the stream velocity wi l l undoubtly be slowed down, causing the settling of finer particles which originally were present as a suspended load of the river. This may be detrimental to a well f ield i f the infiltration capacity of the stream bed i s reduced by some future siltation.
Musquodoboit Harbour Sand and Gravel Aquifer
The outwash aquifer at Musquodoboit Harbour was investigated by Pinder (19690, b). The following descriptions are based essentially on his study.
The Musquodoboit Harbour aquifer i s approximately 4800 feet wide and extends along the river about 5700 feet. The areal extent and basal configura- tion are almost,entirely delimited by g r a n i t e bedrock. The only exception i s found at the southern end where slate and glacial t i l l predominate. The aquifer i s f a i r I y uniform in thickness near the river. At the pumping well, 75 feet of interbeddedmedium sand to fine gravel was encountered. The static water level was 4 feet below the ground surface.
The aquifer constants, based on a 36hour duration of pumping at a rate of 350 igpm, are 150,000 igpd/ft (coefficient of transmissibility) and 7 x (coefficient of storage). This coefficient of transmissibility i s the highest aver- age value yet determined for a glaciofluvial aquifer i n Nova Scotia. Results of
30
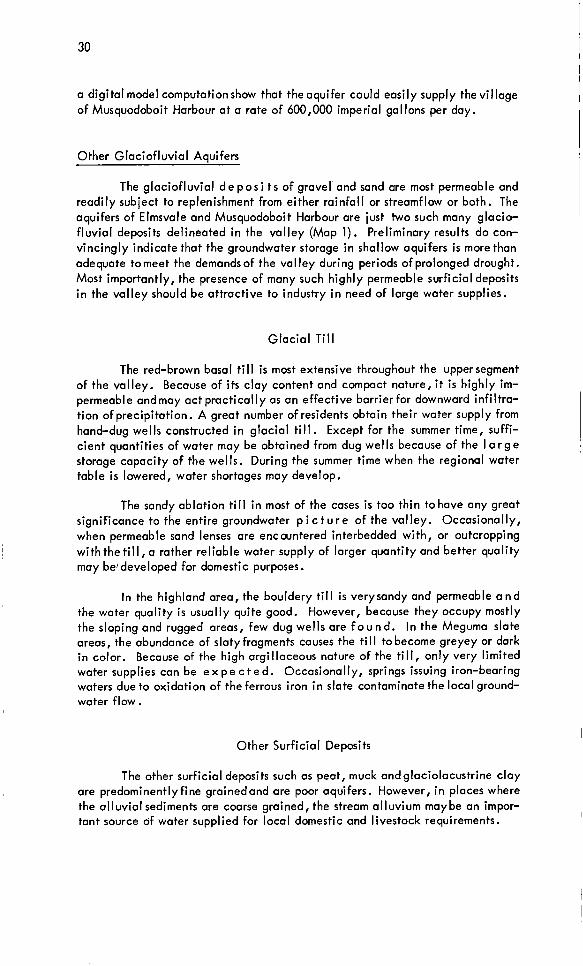
a digital model computationshow that the aquifer could easily supply the village of Musquodoboit Harbour at a rate of 600,000 imperial gallons per day.
Other Glaciofluvial Aquifers
The glaciofluvial d e p o s i t s of gravel.and sand are most permeable and readily subject to replenishment from either rainfall or streamflow or both. The aquifers of Elmsvale and Musquodoboit Harbour are just two such many glacio- fluvial deposits delineated i n the valley (Map 1). Preliminary results do con- vincingly indicate that the groundwater storage in shallow aquifers i s more than adequate tomeet the demandsof the valley during periods of prolonged drought. Most importantly, the presence of many such highly permeable surficial deposits i n the valley should be attractive to industry i n need of large water supplies.
Glacial T i l l
The red-brown basal till i s most extensive throughout the upper segment of the valley. Because of i t s clay content and compact nature, i t i s highly im- permeable andmay act practically as an effective barrier for downward infiltra- tion of precipitation. A great number of residents obtain their water supply from hand-dug wells constructed i n glacial till. Except for the summer time, suffi- cient quantities of water may be obtained from dug wells because of the I a r g e storage capacity of the wells. During the summer time when the regional water table i s lowered, water shortages may develop.
The sandy ablation till i n most of the cases i s too thin to have any great significance to the entire groundwater p i c t u r e of the valley. Occasionally, when permeable sand lenses are encountered interbedded with, or outcropping with the till, a rather reliable water supply of larger quantity and better quality may be/developed for domestic purposes.
In the highland area, the bouldery t i l l i s verysandy and permeable a n d the water quality i s usually quite good. However, because they occupy mostly the sloping and rugged areas, few dug wells are f o u n d . In the Meguma slate areas, the abundance of slatyfragments causes the till to become greyey or dark i n color. Because of the high argillaceous nature of the till, only very limited water supplies can be e x p e c t e d . Occasionally, springs issuing iron-bearing waters due to oxidation of the ferrous iron i n slate contaminate the local ground- water flow.
Other Surficial Deposits
The other surficial deposits such as peat, muck and glaciolacustrine clay are predominentlyfine grainedand are poor aquifers. However, i n places where the alluvial sediments are coarse grained, the stream alluvium maybe an impor- tant source of water supplied for local domestic and livestock requirements.
31
CHEMICAL QUALITY OF GROUNDWATER
I Introduction
I The chemical, physi,cal, and bacteriological qualities of groundwater
depend u p o n the types of porous media through which the water passes and the length of time the water i s i n contact with these environments. A I t h o u g h i n d e t a i I the chemistry of groundwater can be exceedingly complex, the number of major dissolved constituents and the no t u r a I variations in groundwater are actually quite limited (Davis and De Wiest, 1966, p. 97).
The cations and anions commonly found in groundwater t o g e t h e r with minor constituents are as follows (Todd, 1959, Table 7.1, p. 180):
Cations Anions Minor Constituents
Calcium (Ca) Carbonate (CO3) Iron (Fe) Magnesium (Mg) Bicarbonate (HCO3) Aluminum (AI) Sodium (No) Sulfate (SO4) Silica (Si02) Potassium (K) Chloride (CI) Boron (B)
Nitrate (NO3) Fluoride (F) Selenium (Se)
The dissolved solids i n groundwater are conventionally expressed in parts per mill ion (ppm) and i n equivalents per m i I I i o n (epm). One ppm means one part by weight of d i s s o l v e d matter in a mill ion parts by weight of solution. Water quality standards are generally c i ted in ppm. Equivalents per m i I I i o n are calculated by dividing the parts per mill ion by the equivalent weight of the respective ion under consideration. This provides a us e f u I means in checking the relative abundance of various ions and the completeness of the analyses.
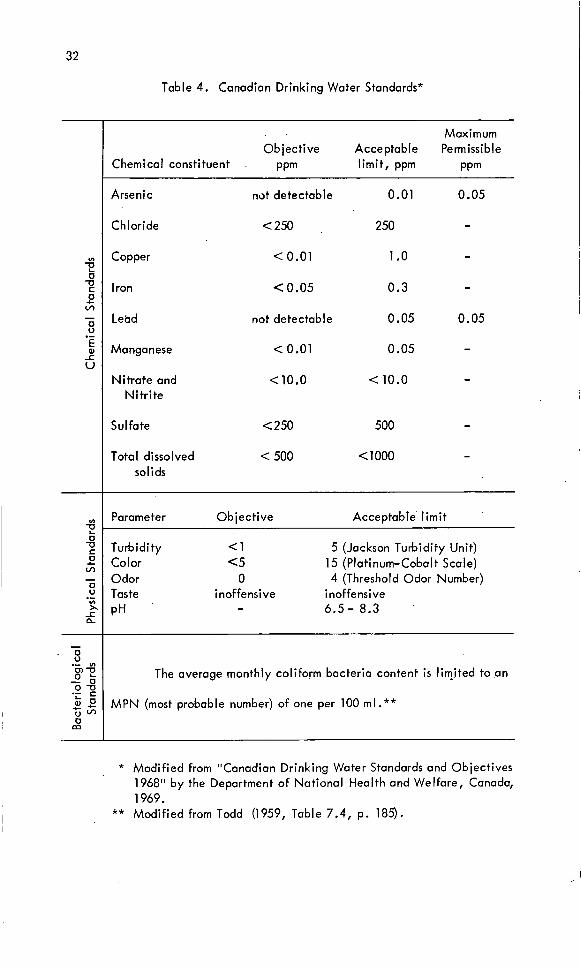
The quality criteria required of a groundwater supply vary w i d e I y ac- cordingto i t s purposes. As most groundwater pumped in the valley i s for domes- tic use, the "Canadian Drinking Water Standards" (Table 4) recommended by the Department of National Health and Welfare, Canada (1969) should be met.
For various other uses, t h e quality standards are readily available from moststandard textbooks. In other parts of the Province of Nova Scotia, Trescott (1968, 1969a, b) and Hennigar (1968) have discussed at l e n g t h the quality of groundwater i n various hydrostratigmphic units and their use. Information pre- sented therein i s mostly applicable to the Musquodoboit River valley. Interested readers are referred to their publications for further details.
32
Table 4. Canadian Drinking Water.Standards*
. . Maximum Objective Acceptable Permissible
Chemical constituent . ppm l imit, ppm PPm
Arsenic not. detectable 0.01 0.05
C h I oride < 250 250 - Copper < 0.01 1 .o - Iron < 0.05 0.3 - Lebd not detectable 0.05 0.05
Mango nese < 0.01 0.05 -
Nitrate and < 10.0 < 10.0 - Nitr i te
Su I fa te < 250 500 - Total dissolved < 500 < 1000 -
solids
Parameter Objective Acceptable l i m i t
Turbidity <1 5 (Jackson Tutbidity Unit) Color e5 15 (Platinum-Cobalt Scale) Odor 0 4 (Threshold Odor Number) Taste inoffensive inoffensive PH - 6.5- 8.3
The average monthly coliform bacteria content i s limited to ,an
MPN (most probable number) of one per 100 ml.**
* Modified from "Canadian Drinking Water Standards and Objectives 1968" by the Department of National Health and Welfare, Canada, 1969.
** Modified from Todd (1959, Table 7.4, p. 185).
33
The complete analyses of 102 groundwater samples collected i n theMus- quodoboit valley are given in Appendix A. Discussed below are those constit- uents of groundwater quality having significant bearing on the domestic use in the valley.
Relationship of Groundwater Qualitv to Use
Hardness
Hardness i s causedalmost entirely by compounds of calcium and magne- sium. According to U. S. G e o I o g i c a I Survey's classification (Swenson and Baldwin, 1965, p. 13, the hardness of water may be rated as follows:
Hardness, pprn
61 - 120 ............................. Moderately hard 0 - 60 ............................. Soft
121 - 180 ............................. Hard 180 ............................. Very hard
Soft water i s suitable for many domestic purposes without further treat- However, for ment. Water of moderately hard may not seriously affect its use.
water with hardness greater than 120 pprn, often proper softening i s required.
Iron and Manganese
Both iron andmanganese when present i n excessive amount wi l l produce a brownish color staining i n laundered goods and impairs the taste of beverages including coffee and tea. The h i g h e s t iron concentration encountered i n the valley i s 15 pprn from slate. Generally speaking, the iron concentration i s less than 0.3 ppm, the recommended l i m i t for domestic use without treatment.
Su I fa te
The presence of an excessive amount of su I f a t e i n drinking water may contribute to a laxative effect. Calcium and magnesiumsulfates are very soluble and hence, boiling of water w i l l not cause the sulfates to precipitate. F o r - tunately, most of the water samples i n the valley hasa sulfate ionconcentration much lower than the upper l i m i t of 250 ppm.
34
Nitrate
The occurrence of excessive amount of nitrate i n groundwater may gen- erally be attributed to agriculturai fertilization. Locally, i t may also be traced to pollution from barnyards and similar sources (Hem, 1970, p. 182). High con- centration of nitrate ( > 10 ppmj may be poisonous to children, especially re- s p o n s i b l e for the methemoglobinemia i n new born babies and their m o t h e r s (Swenson and Baldwin, 1965, p. 16). The nitrate content i s very low i n bedrock units. A few water samplestaken from the surficial aquifers show a nitrate con- centration in excess of 10 ppm, but none of them exceeds the practical l imit of 45 ppm (U. S. Public Health Service, 1962).
Total Dissolved Solids
Theoretically, the total dissolved solids are the nume r i c a I sum of a i l chemical constituents i n groundwater, with exception of suspended sediments, colloids, or dissolved gases. However, only limited number of constituents are reported i n routine analyses. In practice, the total dissolved solids i n solution are approximated from the specific conductance by:
Total dissolved solids (ppm) 2 Specific conductance ( /u mhos) xA
where A i s an experimental constant generally ranging from0.55 to 0.75(Hem, 1970, p. 99).
Excessive amounts of total dissolved solids w i l l give to the water a bad taste and may be harmful to a n i m a I and plants (Trescott, 1968, p. 94). With the exception of a few deep wells tapping the Windsor Group rocks , the total dissolved solids reported are less than the recommended l i m i t of 500 ppm.
Chemical Quality of Groundwater in the HvdrostrotiwaDhic Units
Slate, Quartzite and Granite
Groundwaters i n slate, quartzite and granite are typically low i n hard- ness and total dissolved solids. In slate terrain, waters are deteriorated by an excessive amount of iron. The average content of iron from eight samples ij as high as 4.5 ppm (Fig. 9) and water from slate may have to be treated.
N o analyses of waterfrom granite are available i n the map-area. How- ever, according to Trescott (1968, 19690), w a t e r s from granite are usually of
I 800 a a z V 400- z 0 0 200-
600 -
a 300 z
Iron
-
-
B C D E
0 v 100
k A B
Hardness Nitrate
Sulfate
35 38 - D
35 -
I
D
NOTE: A Slate B Quartzite C D Glacial ti l l E Glaciofluvial sand and gravel 35 Number of samples
Windsor Group-limestone, gypsum and anhydrite
FIGURE 9 . Bar graphs of the average iron, sulfate, hardness and nitrate content for water samples collected from wells in different hydro- stratigraphic units.
36
good quality although some of them are moderately hard. The, concentration of sulfate i s i n the order of 20 ppm which i s too low to have any e f f e c t on water qua I i t y .
c? Windsor Group
The quality of groundwater from Windsor Group of the valley i s usually characterized by the presence of high concentrations of total hardness, sulfate, total dissolved solids as well as iron (Fig. -9 ) . Only i n the cases where a w e I I i s tapping sandstone and shale associated with the evuporates, w a t e r of better quality may be encountered. The occurrence of high concentrations of sulfate and hardness results from the fact that the Windsor I i m e s t o n e of the valley i s dolimitic i n composition and interbedded with anhydrite and gypsum. If salt i s present, the water w i l l possess high concentrations of both sodium and chloride (for example, sample WD20 Appendix A). The high iron content of waters from Windsor Groupcould at least i n part be syngenetic with the evaporites, although
plumbing fixtures. \ \
I Trescott (196%, p. 36) attributes i t mainly to the corrosion of well casing and
Cretaceous Sand and Gravel Deposits
There are onlytwo wells tapping the quartz sand ofCretaceous age. The water has a moderate hardness of 145 ppm. lnterbedded with colored clays, the water from quartz sand bed contains a relatively high iron concentrotidn (0.55 ppm). The average sulfate concentration i s 27 ppm. It i s anticipated that water of b e t t e r quality i n terms of iron and hardness may be obtainable from thicker deposits such as that encountered at Elmsvale (Dept. of Mines T.H. #380).
Glaciof luvia I Deposits
Waters from glaciofluvial deposits are low in hardness, sulfate, and total dissolved solids (Fig. 9). The hardness i s g e ne r a I I y less than 100 ppm. The closeness of the glaciofluvial deposit to the ground surface may have two dif- ferent effects on its water supply potential: (1) the aquifer i s easily accessible atshallow depth, (2) i n a densely populated area, i t may be subject to pollution from sewage effluent and other similar sources of discharge, i f the proper pre- cautions are not taken.
Occasionally, a relatively high concentration of iron resulting from cor- rosion of casing and iron fixtures may be encountered i f water i s allowed to s i t too long in improperly protected plumbing and other fixtures. As far as overall quality i s concerned, the glaciofluvial sand and gravel d e p o s i t s are the most promising aquifers of the valley.
Other Surficial Deposits
A great number of residents obtain their water supply from dug wells con- structed i n red-brown til I which widely occurs throughout the middle and upper segments of the valley. The water from this basal til l i s usually low in sulfate, and has a hardness slightly greater than 100 ppm. Where the till outcrops on a slope, slope wash w i l l increase the permeability of the till and dilute the con- centration of the dissolved solids, including hardness. The concentration of iron i n till i s more consistant than that i n the glaciofluvial deposits. The reason for this may be due in pa r t to the relatively higher pH of the groundwater and the homogeneity of the basal red-brown till. Because of their closeness to the ground s u r f a c e the concentration of nitrate i n b o t h glaciofluvial and ti II deposits i s higher than that i n other hydrostratigraphic units (Fig. 9).
38
LOCAL PROPERTIES OF THE GROUNDWATER IN THE SURFICIAL AQUIFERS
Introduction
As the glaciofluvial deposits are potential sources of water supply i n the valley, a particular effort has been attempted to relate the physical and chem- ical characteristics of the groundwater to the surficial deposit at Middle Mus- quodoboit. On a l l surficial maps published prior to this work (Hughes, 1952 MacDougall et al., 1963), a glaciofluvial d e p o s i t with dimensions one m i l e long and 1/3 mile wide was shown at the center of the village of Middle Mus- quodoboit. During the summer of 1968, a long drought r e s u I t e d i n failure of numerous shallow wells and water had to be hauled by truck from other sources. This was unexpected, as the aquifer was considered to be fairly extensive i n the vicinity of the village and the village's water needs were not excessive.
Results of remapping anda careful examination of well logs revealed that the areal extent of the g r a v e I and sand deposit was much more restricted than previously thought, especially at the center of the v i I r a g e (Fig. 10). Along route 24 west of the village, the gravel and sand mound i s actually a kame de- posit. The sand.and gravel deposit b e comes a very narrow wedge toward the center of the village. Near the Fino Station, a measurement along a diversion ditch indicated that i t was only 70 feet wide.
To assist i n the investigation of the groundwater situation atMiddleMus- quodoboit an extensive groundwater sampli,ng program was undertaken. This in- cluded measurements of temperature, pH, turbidity, iron, silica, SUI f a t e and hardness made in the field by means of a portable Hach Ki t" . Selected w a t e r samples were also submitted for complete analyses to the Chemical Laboratory of the N o v a Scotia Agricultural College at Truro. The purpose of the laboratory analyses was two-fold: (1) to check the consistency of the field measurements, and (2) to evaluate the deviation between laboratory and field results. During the entire course of study, i t was necessary to assume that the errors introduced in f ie ld determinations were small and consistent.
Variation of Temperature with Depth
Although the regional relief of Nova Scotia i s quite small (Goldthwait, 1924), a local relief of more than 300 feet i s not uncommon in the volley. The steep local relief togetherwith a narrow valley favors the development of a local flow system (Toth, 1962). In many parts of the valley, therefore, the ground- water circulation i s relatively rapid. The perennial Musquodoboit River collects the groundwater discharge from both sides of'the vulley.
~
* Portable field kit, DR-EL, Hach Chemical Co., Ames, Iowa.
FIG
UR
E 10
. S
urf
icia
l geo
logy
nea
r th
e vi
lla
ge
of
Mid
dle
Mus
quod
oboi
t
40
68
643
6 0 -
Correlation of the field temperatures w i t h the depth to the water table suggests a control other than that of geothermal gradient (Fig. 11). The differ- erence was found to be as great as 14OF, ranging from 45OF to 5 P F . The tem- perature generally decreases with depth and becomes s t e a d y at about 30 feet. The temperature distribution of the water samples taken from both sandandgravel deposit and glacial till i s u n i q u e and essentially follows an identical pattern. Furthermore, an extrapolation of the temperature curve g i v.e s for zero depth a temperature of U0F, which closely corresponds to the temperature of the surface water ofMusquodoboit River during summer months. As.most of the shallow wells rarely exceed 30 feet, Figure 11 strongly suggests that the temperatures of sur- face waters and shallow aquifers are l ikely related to the heat transfer from the g r o u n d surface. In addition, available information fails to realistically show whetherthis thermal profile i s affected by local flow systems at a l l .
-
Qoo8
A m o d e l study of the local flow sys tem taking into consideration the thermal properties of shallow flow would seem desirable i n order to understand the flow system i n the valley.
LL 5 6 -
W a
5 52 W
I W
I- 4 8 -
44
40
L
-
-
-
o WATER FROM GLACIOFLUVIAL SAND a GRAVEL DEPOSIT
A WATER FROM G L A U A l TILL 0 MUSOUODOBOIT RIVER
FIGURE 11. Field temperature of groundwater i n relation to the depth to the water table. I
p H Values
A discussion of the change of pH in groundwater can be found i n papers dealing with chemistry and thermodynamics of groundwater (Back, 1961; Roberson e t al., 1963; Trescott, 1968; Hem, 1970).
Silica Concentration
I The silica concentration i s usually r e p o r t e d as silicon dioxide i n the groundwater analyses. Under normal temperatures and pH ranges of groundwater, silica' i s probably present as monomeric silica acid, HqSi04and essentiallydoes not ionize (Krauskorpf, 1956, Davis and De Wiest, 1966, p. 100). Theoreti- cally, the solubility of silica i s directly proportional to pH i n solution (Correns, 1949). However, b e c a u s e most of the silicate compounds are very insoluble, high concentrations of silica i s therefore rarely found in groundwater.
The pH isdefined as the negative logarithm of the hydrogen ion concen- tration. For pure water where the concentrations of hydrogen and hydroxyl ions are both equal to 10'' mole/liter, the pH value i s 7. Obviously, the more hy- drogen ions present, the less the pH w i l l be.
Field measurements indicate that allwater contained i n the gravel a n d sand deposit have a pH varying from 5.5 to 6.0, whereas water from t i l l s and other less permeable materials, such as silty and clayey alluvium, have a pH greater than 6.0.
AS an approximation, the 6.0 contour line provides a useful boundary separating the permeable gravel and sand deposit from other deposits at Middle Musquodoboit (Fig. 12). The possible reasons .for this include: (1) the gravel and sand d e p o s i t s are more permeable, and (2) the gravel and sand deposit i s readily subjected to recharge from precipitation where the supply of carbon di- oxide i s abundant. Again, i t isreminded that material of reasonable permeabil- i t y can also be develo-ped from t i l l s on slopes through the processes of weather- ing and erosion.
41
I A comparison of f ield pH with laboratory values shows an average ab-
solute difference of 1.4. Seventy-six out of 80 comparisons indicate that f ield pH i s less than laboratory pH by an. amount varying from 0.1 up to 2.7, wi th an average of 1.4. Only four pH values were found to be higher t h a n laboratory pH by an amount varying from 0.1 to 0.4. The observed discrepancies between
. .- . , the . . .. . laboratory . and f i e 1 . d .- measurements ._ - may be attributed to the'following:, (1) the pH value i n groundwater sample has a significant tendencyio .. ~~ . .. ~. become.neutral ....
with time because of the change i n temperature and the loss of gases (Trescott, 1968, p. 83),and(2) the great majority of water samples available for this com- parison were taken from sand ond gravel deposits where the pH i s usually low.
,
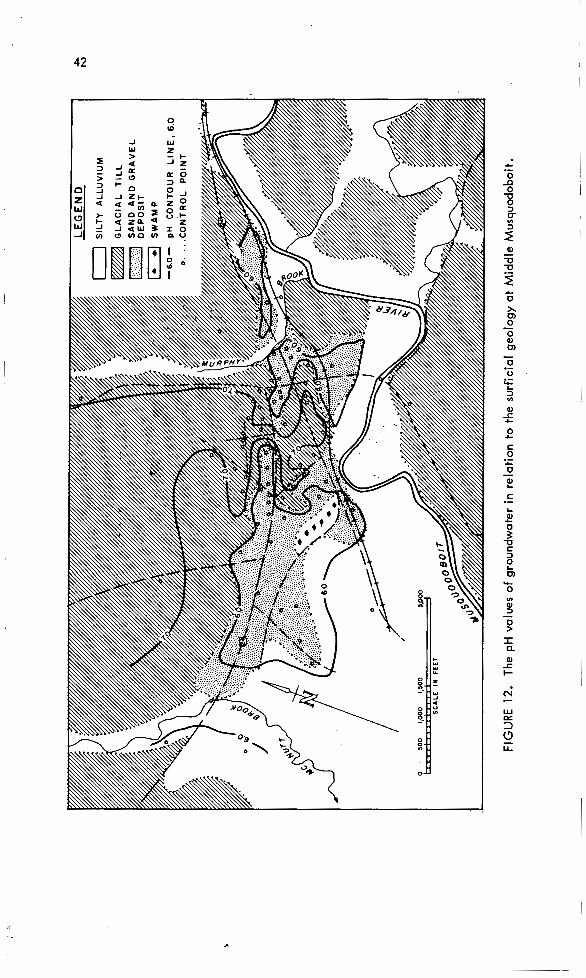
P
h)
FIG
UR
E 12
. Th
e pH
val
ues
of g
roun
dwat
er i
n r
elat
ion
to
the
surf
icia
l g
eolo
gy
at
Mid
dle
Mu
squ
od
ob
oit
.
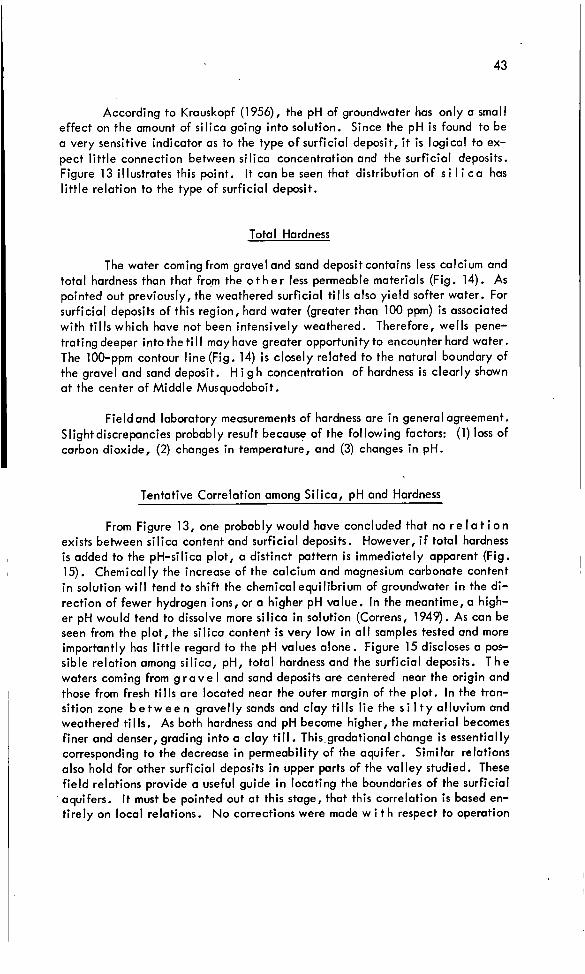
43
According to Krauskopf (1956), the pH of groundwater has only a small effect on the amount of silica going into solution. Since the pH i s found to be a very sensitive indicator as to the type o f surficial deposit, i t i s logical to ex- pect l i t t le connection between silica concentration and the surficial deposits. Figure 13 illustrates this point. It can be seen that distribution of s i I i c a has l i t t le relation to the type of surficial deposit.
Total Hardness
The water coming from gravel and sand deposit contains less calcium and total hardness than that from the o t h e r less permeable materials (Fig. 14). As pointed out previously, the weathered surficial t i l l s also yield softer water. For surficial deposits of this region, hard water (greater than 100 ppm) i s associated with t i l l s which have not been intensively weathered. Therefore, wells pene- trating deeper into the til I may have greater opportunity to encounter hard water. The 100-ppm contour line (Fig. 14) i s closely related to the natural boundary of the gravel and sand deposit. H i g h concentration of hardness i s clearly shown at the center of Middle Musquodoboit.
Field and laboratory measurements of hardness are i n general agreement. Slight discrepancies probably result because of the following factors: (1) loss of carbon dioxide, (2) changes i n temperature, and (3) changes in pH.
Tentative Correlation among Silica, pH and Hardness
From Figure 13, one probably would have concluded that no r e I a t i o n exists between silica content and surficial deposits. However, i f total hardness i s added to the pH-silica plot, a distinct pattern i s immediately apparent (Fig. 15). Chemically the increase of the calcium and magnesium carbonate content i n solution w i l l tend to shift the chemical equilibrium of groundwater i n the di- rection of fewer hydrogen ions, or a higher pH value. In the meantime, a high- er pH would tend to dissolve more silica i n solution (Correns, 1949). As can be seen from the plot, the silica content i s very low in a l l samples tested and more importantly has l i t t l e regard to the pH values alone. Figure 15 discloses a pos- sible relation among silica, pH, total hardness and the surficial deposits. The waters coming from g r a v e I and sand deposits are centered near the origin and those from fresh t i l l s are located near the outer margin of the plot. In the tran- sition zone b e t w e e n gravelly sands and clay t i l l s l i e the s i I t y alluvium and weathered t i l l s . As both hardness and pH become higher, the material becomes finer and denser, grading into a clay till. This,gradational change i s essentially corresponding to the decrease in permeability of the aquifer. Similar relations also hold for other surficial deposits i n upper parts of the valley studied. These field relations provide a useful guide i n locating the boundaries of the surficial aquifers. It must be pointed out at this stage, that this correlation i s based en- tirely on local relations. No corrections were made w i t h respect to operation
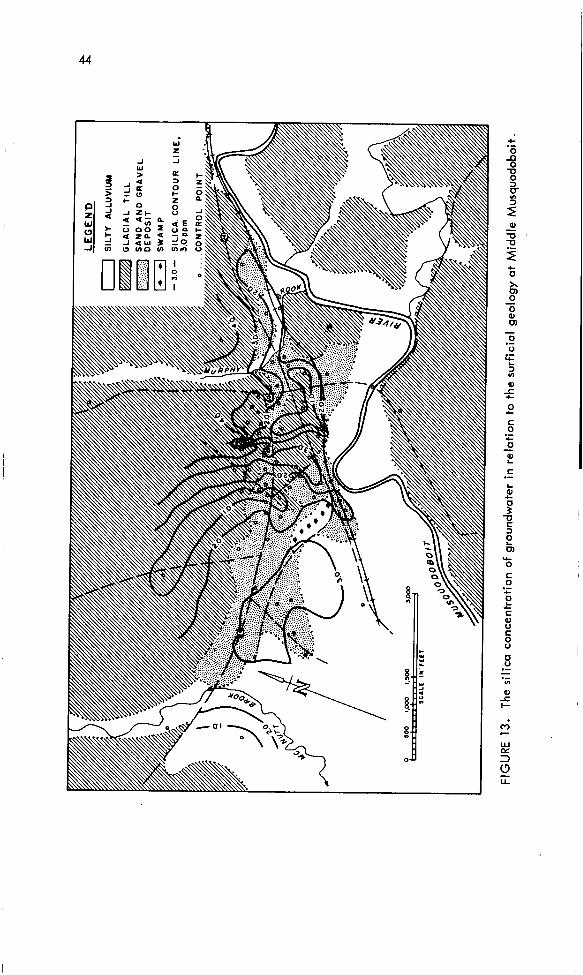
44
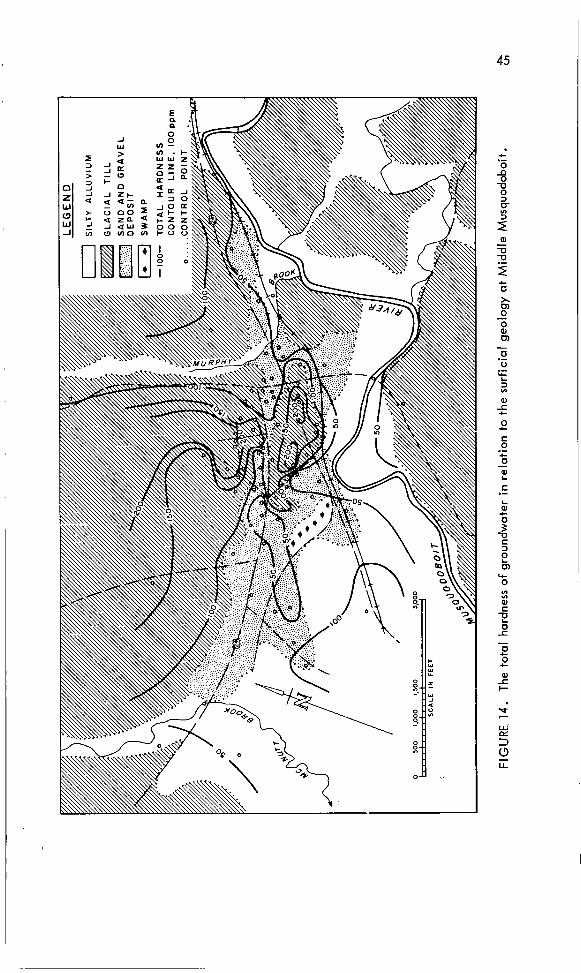
FIG
UR
E. 1
4.
The
tota
l ha
rdne
ss o
f gr
ound
wat
er i
n r
elat
ion
to
the
surf
icia
l g
eolo
gy
at
Mid
dle
Mus
quod
oboi
t.
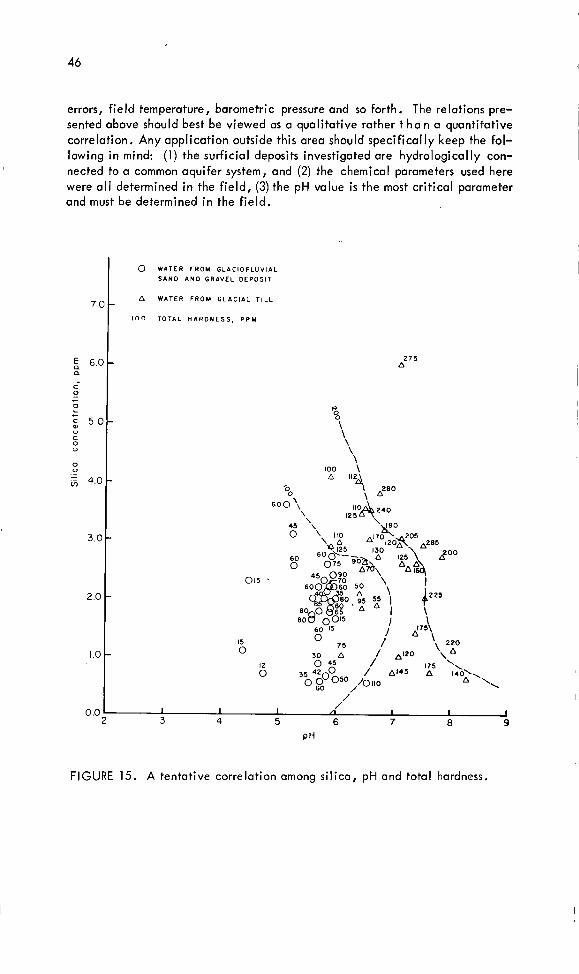
46
c 0 - 0 L +
5 0 - U t 0 u
0 U - 4 0 -
3 0 -
2 0 -
10-
errors, f ield temperature, barometric pressure and so forth. The relations pre- sented above should best be viewed as a qualitative rather t ha n a quantitative correlation. Any application outside this area should specifically keep the fol- lowing i n mind: (1) the surficial deposits investigated are hydrologically con- nected to a common aquifer system, and (2) the chemical parameters used here were a l l determined i n the field, (3) the pH vulue i s the most crit ical parameter and must be determined i n the field.
0 WATER r R O M GLACIDFLUVIAL SAND A N D GRAVEL DEPOSIT
A WATER FROM GLACIAL T I L L
I 100 TOTAL H A R D N E S S , P P U
7.0 t t E 6.0 a
2 1 5 A
% \
\ \\
\ 100 \ A s “3 ,280
SOO‘, ‘.
0 1 5 ’
15 0
12 0
/ I I I /
0 .o 1 I I 2 3 4 5 6 7 8 9
FIGURE 15. A tentative correlation among silica, pH and total hardness.
47
GROU NDWATE R UTI L l ZATl ON AND DEVELOPMENT
Introduction
The use of groundwater rather than surface water for water supply often has the following advantages: (1) the y i e I d from groundwater i s more reliable with seasonal variations having l i t t l e effect, (2) the chemical and bacteriolog- ical qualities of groundwater are more consistant and predictable, whereas i n the Musquodoboit valley the presence of many mucky and swampy a r e as often impairs the color of the surface water, especially during and immediately after storms, and (3) the groundwater i s present and available almost e v e r y w h e r e, whereas the surface water occurs only along stream channels. Additionally, the increasing hazard of pollution (Stephemrl, 1964) often makes i t necessary that surface waters be treated (coagulation, filtration and chlorination, etc.) before use. Consequently, future development and growth of the valley w i l l depend i n part on the availability of adequate fresh water supplies, especially ground- water, for municipal, industrial, and irrigation use.
Domestic and Livestock Water Supplies
The estimated requirements for dai ly domestic and livestock consumptions 1 are as follows (Anderson, 1963, p. 38):
each member of a family 100 gallons per day each horse 10
12 each milk-producing cow 25-30 I '
I, II II
I 1 11 II
II I,
II I1 II
II I ,
I, I , I I
each steer or dry cow
each hog 2 each sheep 1.5 I'
each 100 chickens 4
The typical figures on the a m o u n t of water necessary for certain home operations are as follows (Leopold and Langbein, 1960, p. 32):
flush a toilet 3 gallons per day II I,
II I 1
I, I 1
II II
tub bath 30 - 40 'I
shower bath 20 - 30 "
wash dishes 10 run a washing machine 20 - 30 'I
Generally speaking, a well capable of yielding 1 to 3 igpm on a long- term basis would be. sufficient for average domestic and livestock requirements,
48
provided t h o t adequate water storage i s available. There should be l itt le dif- ficulty to construct d r i I I e d wells with such capacities almost anywhere in the valley. Actually, i n many instances, hand-dug wells are sufficient enough to meet domestic needs.
'
Chemical as well as bacteriological qualities ofwater are important con- siderations for dom e s t i c and livestock water requirements. For example, the groundwaters from Windsor rocks are mostly unsuitable for domestic and livestock consumptions because of the high concentrations of total hardness, sulfate, total dissolved solids and iron.
A great number of the domestic supplies i n the valley are obtained from shallow hand-dug wells. As a result, wells of proper construction and Iccation are necessary i n order to preventpollution from septic tanks, barnyardsand other sources of pollutants. This i s particularlyimportant i n highly permeable surficial aquifers such as the glaciofluvial sand and gravel deposits i n densely populated vi1 loges such as Middle 'Musquodoboi t and Musquodoboi t Harbour. For proper protection of both hand-dug and drilled we1 Is, exercising the precautions issued by the Department of Public H e a I t h and complying with regulations under the Wel l Dril l ing Act i s the best guide.
Irrigation Water Supplies
Irrigation i s hardly a common practice i n the valley with lawn watering the most important irrigation use of water. If larger quantities of water are re- quired, damming of the surface runoff is probably the most economical and prac- tical. However, because of the localization of the highly transmissive deposits along the valley bottom t o g e t h e r with steep local relief of the valley sides, large scale and continued pumping of groundwater for irrigation i s restricted to those areas not too distant from the valley floor.
Municipal and Industrial Water Supplies
There are no central supply systems from either groundwater or surface water sources for a l l the v i I l o g e s along the valley. This section outlines the potential groundwater supplies for the future development and growth of t h r e e important communities: Musquodoboit Harbour, Middle Musquodoboit, and Up- per Musquodoboit.
Musquodoboit Harbour
Musquodoboit Harbour i s underlain by rocks of the M e guma Group of Lower Ordovician age which largelyhave a thin covering of boulderytill along with glaciofluvial sand and gravel deposits. The d o m e s t i c waters are mostly
49
from bedrock wells constructed i n the Meguma Group and which often contain an excessive iron content (Pinder, 19680, p. 43). Some residents obtain their water supply from shallow dug wells i n bouldery t i l lw i th the shallow drift wells often susceptible to depletion during periods of prolonged drought (Jones, 1967, p. 271).
One of the importantresults of this proiectwas the delineation andeval- uation of a highly permeable glaciofluvial sand and gravel deposit located near the northwestern end of the village. Well logs, surficial m a p p i ng, chemical data as well as the results of both electrical analog and digital studies indicate that this unconsolidated aquifer i s capable of providing an adequate supply of very good quality of water. The Musquodoboit River i n this area would provide a constant source of replenishment to this aquifer i f a large well f ield were de- veloped i n i t (Pinder, 1968a, b).
Since the overlying s u r f i c i a I alluvium i s very thin, the glaciofluvial outwashdeposit i s easily subject to pollutionif exploitation i s notwell planned. It i s therefore quite feasible to develop a central water supp I y for the village from this aquifer. A reliable water supply system would undoubtly be attractive toindustry i n need of large water supplies, i n addition to alleviating theground- water problems of the villagers.
I
Middle Musquodoboit
Middle Musquodoboit, the second largest community i n the v a I I e y, i s u n d e r I a i n by rocks of the Windsor Group of Mississippian age. The Windsor Group in the valley consists mainly of limestone, gypsum, anhydrite and pos- sibly salt. The groundwaters associated with bedrock aquifer are usually of in-
~ ferior quality.
The hydrogeology at Middle Musquodoboit i s complicated by the follow- ing factors: (1) the highly permeable glaciofluvial s a n d and gravel deposit i s more restricted than previously thought, especially n e a r the central portion of the vi1 lage, (2) the Windsor bedrock as we1 I as Cretaceous c o I o r e d clays are present at shallow d e p t h , and (3) during the summer months when the regional water table i s lowered, s h a I I ow wells constructed i n glacial t i l l often fail to provide an adequate supply even for domestic needs.
In light of the presentknowledge of the water supply sources of the vil- lage, several suggestions are offered as a guide for future development:
(1) It seems very unlikely that larger quantity of water of,good quality can be obtained from deep wells i n the center of the village; (2) future devel- opment of groundwater supply should be concentrated within the glaciofluvial sand and gravel deposit west of the village; (3) a detailed study on t h e subsur- face stratigraphy i s necessary inthe area west of the village, as it i s verylikely
50
that a buried channel of Cretaceous age extends f r o m Middle Musquodoboit to Cook Brook. Along this buried valley floor, i t i s possible to encounter a highly permeable and thick quartz sand aquifer, and (4) the groundwater shortage dur- ingthe summer months may be alleviatedat least i n part by enlarging anddeep- ening the existing shallow wells constructed i n glacial till.
Upper Musquodoboi f
UpperMusquodoboit, the third largest community i n the valley i s under- lain by rocks of the Windsor. Group of Mississippian age. The waters from these Windsor aquifers are of inferior quality largely unsuitable for most purposes.
Most of the residents obtain their water s u p p l y from shallow dug wells constructed i n glacial ti l l. Surficial mapping indicates that there are no high- l y permeable or thick glaciofluvial sand and gravel d e p o s i t s i n or nearby the village of Upper Musquodobait; hence, production of large quantities of water from wells i s not very likely.
Others
There are many other sma I I communities such as Centre Musquodoboit, Elmsvale, Meagher Grant, Elderbank, and etc., i n the valley. As water sup- plies are mainly for domestic and livestock needs, there has been but l i t t le dif- f iculty regarding water supplies for these communities.
Many of the permeable glaciofluvial sandand gravel depositsdelineated i n or near these c om m u n i t i e s have not been fully utilized and are potential aquifers for additional water supplies and immediate expansion of these commu- nities.
Additionally, at Elmsvale, i n addition to outwash sand ond gravel de- posits, there i s a thick sequence of gravelly quartz sand ofCretaceous age. The lateral extension and vertical variation of the deposit should be thoroughly in- vestigated further before any hydrogeological appraisal i s made.
\
51
SUMMARY AND CONCLUSIONS
Farming, forestation and fishing are the main economic activities of the Musquodoboit River valley. Because of the lack of otherforms and prospects for economicdevelopment, the valley has shared very l i t t le i n the growth and pros- perity of modern Nova Scotia during the last decade.
The soils developed on Meguma Group and granite r e g i o n s are mostly very stony and are suitable only for forestry. In areas u n d e r I a i n by Windsor rocks, the soils are fine textured and very productive croplands. However, they are often subject to poor drainage conditions and periodic flooding. The situa- tion maybe improved at least i n part by the recent flood-alleviation projects i n the valley.
The pre-Pleistocene unconsolidated d e p o s i t s of the valley have been dated to be Early Cretaceous i n age based on an assemblage of microspore fossils. The important i m p I i c a t i o n s of the finding are stated as follows: (1) prior to Pleistocene glaciation, the upper segment of the Musquodoboit River valley wqs probably a tributary-stream of the Shubenacadie drainage system discharging in- to the Minas Basin, (2) the Cretaceous deposits including both the pottery clays and permeable quartz sands of the valley oppear to be much more extensive than previously thought and furfher investigation to delineate the areal extent of the buried channel should be undertaken.
Studiesof the grossmechanical composition of the red-brown till indicate that i t reflects the lithology of the underlying bedrock which i n turn has an im- portant effect on the permeability of the till. Further studies of the gross me- chanical composition of the till should be carried out because many dug w e I 1 s are constructed i n the till throughout the valley.
The significance of the fractured zones in dense quartzite, slate, and granite i s practically limited to relatively shallow depth. Adequate water sup- plies from drilled wells should be obtained from depths less than 250 feet. The chemical quality of groundwater from granite and quartzite i s generally good. However, water from slate i s often deteriorated by excessive concentrations of iron .
The c h e m i c a I quality i s the main concern on the water sup p I y from Windsor Group rocks. For practical purpose, waters from rocks of the Windsor Group i n the valley are largely unsuitable for domestic and livestock consump- tion because of the high concentrations of toto1 dissolved solids, total hardness, sulfate, and iron.
Numerous isolatedglaciofluvial deposits covering an area of slightly less than one square mile have been delineated along the valley. Detailed studies have been made on two such deposits located at E 1 m sva I e and Musquodoboit
52
Harbour. Preliminary results indicate that these glaciofluvial sand and gravel aquifers are promising and capable of yielding large quantities of good quality water. Additionally, the superposing Musquodoboit River can provide a con- stant s o u r c e of recharge by induced infiltration to these aquifers when a well f ield i s developed. Along the valley, many of these deposits have not yet been effectively utilized for water supply.
A great number of residents obtain their water supply f r o m shallow dug wells constructed i n glacial tlil. During the summer time when the r e g i o n a I water table i s lowered, numerous dug wells often fail to p r o v i d e an adequate yield even fur domestic uses. To improve the situation, the permeable glacio- fluvial gravel and sand deposits should be more fully utilized. Available data suggest that groundwater resources i n the valley are more than adequate to meet the demands for the immediate future.
The preliminary correlations between the groundwater chemistry and the surficial deposits at Middle Musquodoboit res u I t in the following conclusions: (1) the local groundwater chemistry i s indicative of its environment and can be very useful i n the delineating areas of high permeability, (2) many post-sampling changes can a f f e c t the true chemistry of groundwater. Field measurements of certain chemical and physical properties of groundwater, especially the temper- ature, pH, silica, and hardness are recommended for additional study.
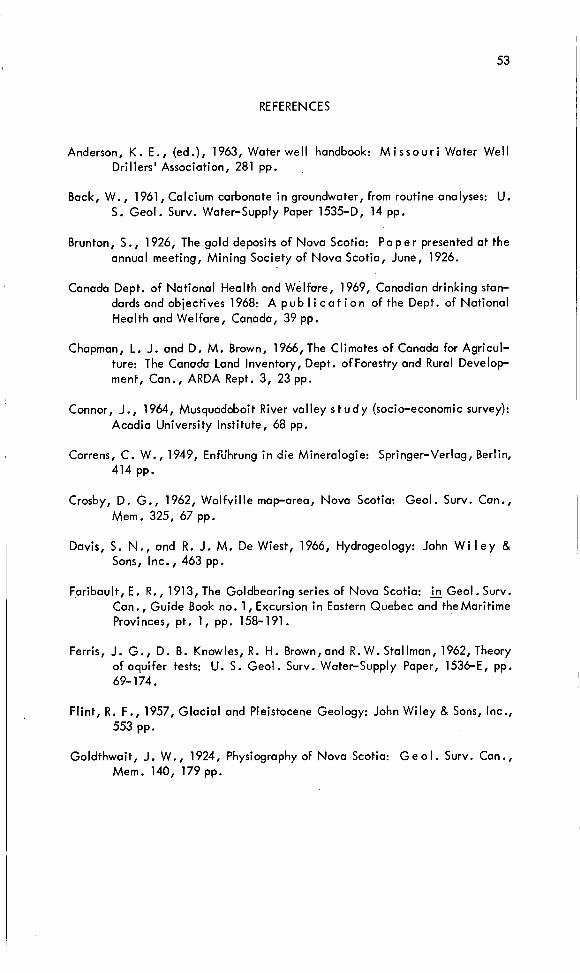
53
REFERENCES
Anderson, K. E., (ed.), 1963, Water well handbook: M i s s o u r i Water Well Drillers' Association, 281 pp. .
Back, W., 1961, Calcium carbonate i n groundwater, from routine analyses: U. S. Geol. Surv. Water-Supply Paper 1535-D, 14 pp.
Brunton, S., 1926, The gold deposits of Nova Scotia: Pap e r presented at the annual meeting, Mining Society of Nova Scotia, June, 1926.
Canada Dept. of National Health and Welfare, 1969, Canadian drinking stan- dards and objectives 1968: A p u b I i c a t i o n of the Dept. of National Health and Welfare, Canada, 39 pp.
Chapman, L. J. and D. M. Brown, 1966,The Climates of Canada for Agricul- ture: The Canada Land Inventory, Dept. of Forestry and Rural Develop- ment, Can., ARDA Rept. 3, 23pp.
Connor, J., 1964, Musquodoboit River valley s t u d y (socio-economic survey): Acadia University Institute, 68 pp.
Correns, C. W., 1949, Enfdhrung i n die Mineralogie: Springer-Verlag, Berlin, 414 pp.
Crosby, D. G., 1962, Wolfville map-area, Nova Scotia: Geol. Surv. Can., Mem . 325, 67 pp.
Davis, S. N., and R. J. M. De Wiest, 1966, Hydrogeology: John W i l e y & Sons, Inc., 463 pp.
Fpribault, E. R., 1913, The Goldbearing series of Nova Scotia: Geol. Surv. Can., Guide Book no. 1, Excursion i n Eastern Quebec and the Maritime Provinces, pt. 1, pp. 158-191.
Ferris, J. G., D. B. Knowles, R. H. Brown, and R. W. Stallman, 1962, Theory of aquifer tests: U. S. Geol. Surv. Water-Supply Paper, 1536E, pp. 69- 174.
Flint, R. F., 1957, Glacial and Pleistocene Geology: John Wiley & Sons, Inc., 553 pp.
Goldthwait, J. W., 1924, Physiography of Nova Scotia: Ge o I. Surv. Can., Mem. 140, 179pp.

54
Hem, J. D., 1970, Study and interpretation of the chamicol characteristics of natural water: U. S. Geol. Surv. WaterSupply Paper 1473, 2nd ed., 363 pp.
Hennigar, T. W., 1968, Hydrogeology of the Salmon River and adjacent water- sheds, Colchester County, Nova Scotia: M.S. thesis, Dept. of Geology, Dalhousie University, Halifax, Nova Scotia, 191 pp.
Hughes, 0. L., 1957, S u r f i c i a l geology of Shubenacadie map-area, Nova Scotia: Geol. Surv. Can., Paper 563, 10 pp.
Jones, J. F., (ed.), 1967, Nova Scotia Water Resources Study; a compilation of existing data: Atlantic Development Board.
Krauskopf, K. B., 1956, Dissolution and precipitation of silica at low temper- atures: Geochem. et Cosmochim. Acto,,~. 10, pp. 1-26.
Lin, C. L., 1970, Digital simulation of a stream-aquifer system: Univ. of Illi- nois, Ph.D. thesis, 68 pp. ,
M a c D o u g a l l , J. I . , D. B. Cann, and J. D. Hilchey, 1963, Soil survey of Halifax County, Nova Scotia: Nova Scotia Dept. of Agric. and Canada Dept. of Agric., Rept. 13, 53 pp.
M . M . R .A. (The Mari t i me Marsh land Re hob i I i to t ion Administration), 1 964, Mus- quodoboit River Study: Canada Dept. of Forestry, Amherst, Nova Scotia, 11 PP.
Pinder, G. F., 19680, A numerical technique for aquifer evaluation: Univ. of Illinois, Ph.D. thesis, 73 pp.
, 1968b, Hydrogeology of the lower Musquodoboit River valley, Nova Scotia: Nova Scotia Dept. of Mines, Groundwater Section,Rept. 68-2, 21 pp.
Poole; W. H., 1967, Tectonic evolution of Appalachian region of Canada: Neale, E. R. W. and H. Williams, (ed.), Geology of the Atlantic re- gion: Geol. Assoc. Can. Special Paper 4, pp. 9-51.
Roberson, C. E., J. H. Fe t h, P. R. Seaber, and P. Anderson, 1963, Differ- ences b e t w e e n field and laboratory determinations of pH, alkalinity, and s p e c i f i c conductivity of natural water: U. S. Geol. Surv. Prof.
2 Paper 475-C, pp. 212-217.
Smitheringale, W. G., 1960, G e o l o g y of Nictaux-Torbrook map-area, An- napolis and Kings Counties, Nova Scotia: Geol. Surv. Can. Paper 6& 13, 32 pp.
55
Stephenson, A. D., 1964, Pollution Report,b Connor, J., Musquodoboit River valley study: Acadia University Institute, pp. 51-59.
Stevenson, 1 . M., 1959, Shubenacadie and Kennetcook map-area, Colchester, Hants, and Halifax Counties, Nova Scotia: Geol. Surv. Can., Mem. 302, 85 pp.
Stevenson, I . M. , and D. C. McGregor, 1963, Cretaceous sediments i n central Nova Scotia, Canada: Geol. SOC. Am. Bull., v. 74, pp. 355-356.
Swenson, H. A., and H. L. Baldwin, 1965, A primer on water quality: U. S. Geol. Surv., 27 pp.
Todd, D. K., 1959, Ground Water Hydrology: John Wiley 8, Sons, Inc., 336 PP.
Toth, J., 1963, A theory of groundwater motion i n small d r a i n a g e basins i n Central Alberta, Canada: Jour. Geophys. Res., v. 67, pp. 4375-4387.
Trescott, P. C., 1968, Groundwater r e s o u r c e s and h y d r o g e o l o g y of the Annapolis-CornwallisValley, Nova Scotia: Nova Scotia Dept. ofMines, Mem. 6, 159pp.
, 196% , Groundwater resources and hydrogeology of the western Annapolis valley, Nova Scotia: Nova Scotia Dept. of Mines, Graund- water Section, Rept. 69-1, 47 pp.
, 196%, Groundwater resourcesand hydrogeology of the Windsor- Hantsport-Walton area, Nova Scotia: Nova S c o t i a Dept. of Mines, Groundwater Section, Rept. 69-2, 58 pp.
Trescott, P. C., G. F. Pinder,and J. F. Jones, 1970, Digitalmodelof alluvial aquifer: Am. SOC. Civ. Eng. Proc., v. 95, Paper 7264, pp. 1 1 15-1 128.
United States Public Health Service, 1962, Drinking Water Standards: Publica- tion 956, 61 pp.
Wright, J. D., 19690, K a o l i n i t e clay deposits i n the Musquodoboit valley, Halifax County, Nova Scotia: Paper presented at the 71st Annual Gen- eral Meeting of the Canadian Institute of Mining and Metallurgy, Mon- treal, April 1969; also Nova Scotia Dept. of Mines, Open File Rept. , 21 PP.
, 1969b, Clay exploration i n the Musquodoboit valley, Halifax County, NovaScotia (exclusive of thedeposits at Paint Brook, Elmsvale, Murphy Brook, and Stewart P roper t y ) : Nova Scotia Dept. of Mines, Open File Rept. , 15 pp.

56
Wright, J . D., 1 9 6 9 ~ , Silica sand deposits of the Musquodoboit valley,.Halifax County, and specifications and uses of silica sand: Nova Scotia Dept. of Mines, Open File Rept., 16 pp.
6
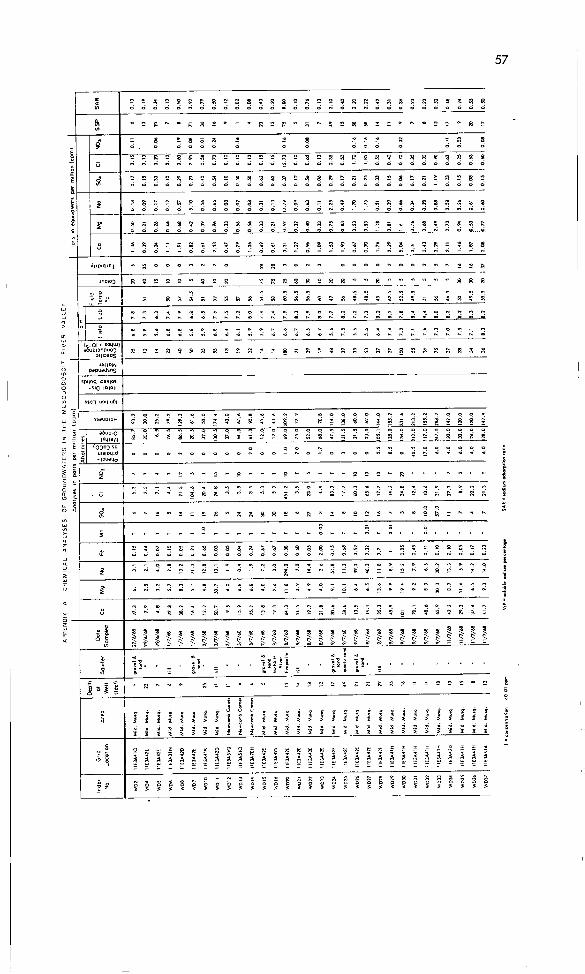
57
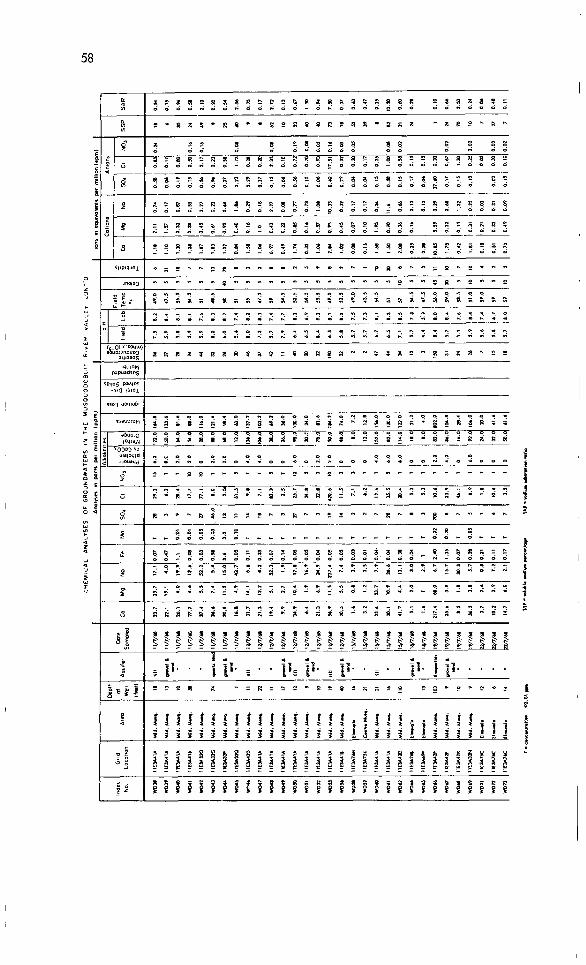
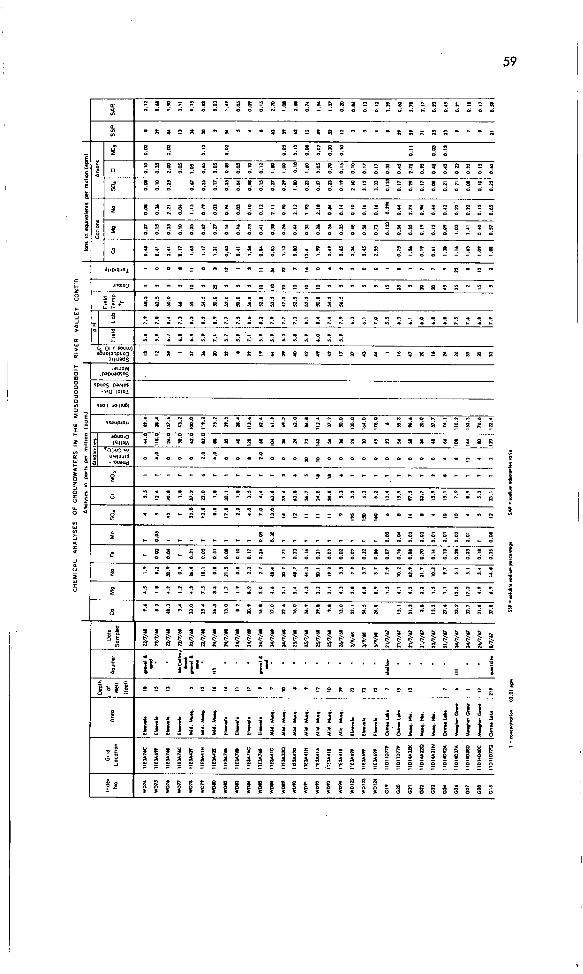
CH
EM
ICA
L
AN
AL
YS
ES
O
F G
RO
UN
DW
AT
ER
S
IN T
VC
M
uso
uo
oo
eo1T
RIV
ER
V
AL
LE
Y
tow
n
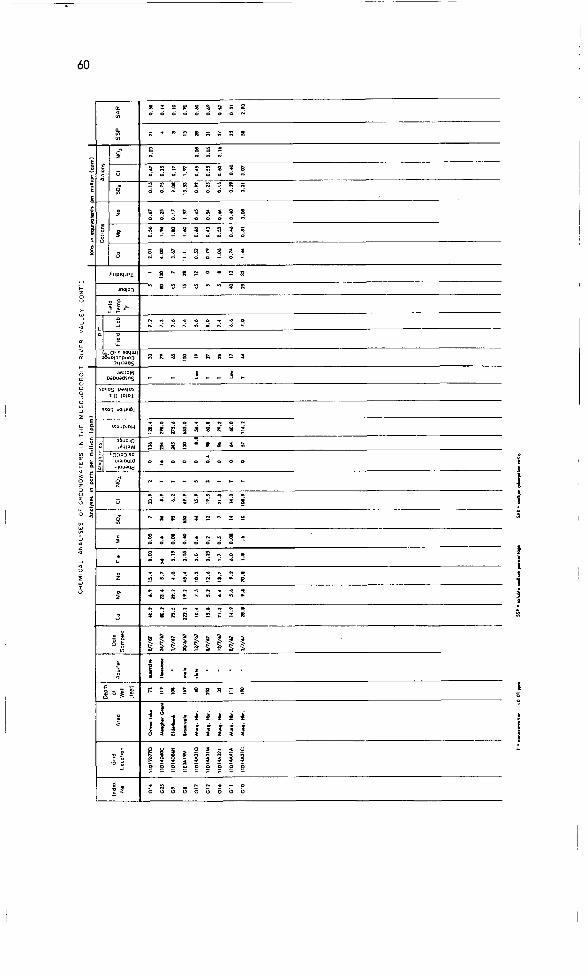
0 0 0 0 0
'I,
I 0 0
-
'ffi -