Embed Size (px)
Citation preview
NRLS national patient safety incident reports: commentary September 2021
1 | Contents
Contents
1. Summary ................................................................................... 2
2. Introduction ................................................................................ 3
3. Incidents reported up to June 2021 ........................................... 9
4. Incidents reported as occurring from April 2020 to March 2021 ..................................................................................................... 11
5. Final remarks ........................................................................... 19
6. Contact us for help ................................................................... 20
2 | NaPSIR workbook commentary
1. Summary
Reporting to the National Reporting and Learning System (NRLS) is largely
voluntary, to encourage openness and continual increases in reporting to facilitate
learning from error.
Increases in the number of incidents reported reflects an improved reporting culture
and should not be interpreted as a decrease in the safety of the NHS. Equally, a
decrease cannot be interpreted as an increase in the safety of the NHS.
This report covers the early stages of the COVID-19 pandemic in England, from
April 2020 through to the end of March 2021, when cases had declined rapidly. The
number of incidents reported from April 2020 to March 2021 was 2,109,057, and
represent a small decrease of 6.1% compared to April 2019 to March 2020
(2,246,622).
Nationally there are peaks in reporting every six months when organisations submit
large batches of data at the cut-off for the six-monthly official statistics publications.
Nationally, the overall profile of incident characteristics (incident type, degree of
harm, care setting where the incident occurred) was consistent between April 2019
to March 2020 and April 2020 to March 2021. Most incidents are reported as
causing no harm (69.3%) or low harm (27.1%). Fewer than 4% of incidents reported
caused higher degrees of harm
We revised our publishing schedule for this data, as a result it is now published
annually rather than biannually. This report is the first publication to cover a 12-
month reporting period, based on fiscal years running from April – March.
Comparisons are made against previously unpublished 12-month period, formed by
combining data from the two previous six-month publications.
Responsible statistician: Chris Mainey
For queries relating to this document or our statistics, please contact:
3 | NaPSIR workbook commentary
2. Introduction
2.1 Impact of COVID-19
This commentary interprets the data published in the national patient safety incident
reports (NaPSIR) for April 2020 to March 2021 for English NHS organisations. This
covers the period from the start of the COVID-19 pandemic in England, through to
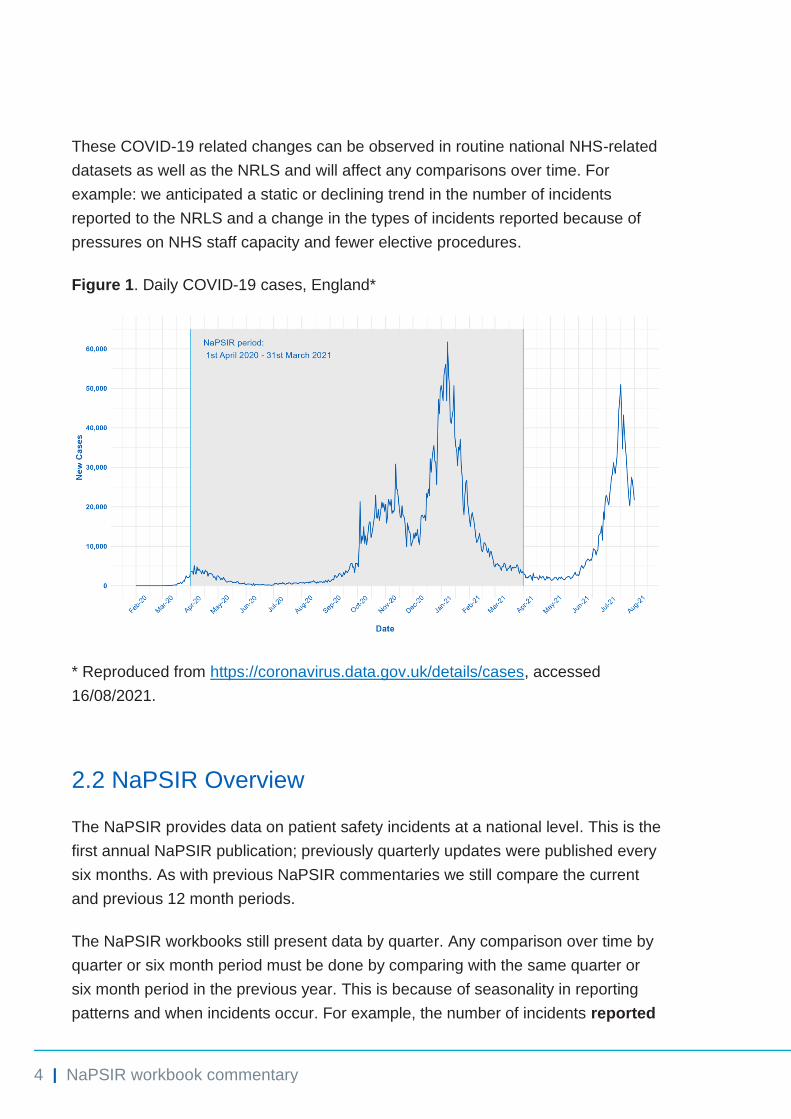
the peak at the end of 2020 (Figure 1), and ending in March 2021. The pandemic
has had a profound and far-reaching impact on society and health provision
globally.
To protect the NHS and release capacity in hospitals for COVID-19 patients, the
NHS in England underwent rapid changes to the types of services provided (Health
Foundation, 20201). For example: non-urgent elective procedures were postponed
and patients who were “medically ready” were discharged with support packages;
primary care services were modified to include virtual appointments, allow for social
distancing, and to support the subsequent roll out of the COVID-19 vaccine (Health
Foundation, 20212).
Responding to COVID-19 placed considerable extra burden on healthcare staff.
The NHS England and NHS Improvement National Patient Safety Team’s position
was that NHS staff should continue to report anything that concerned them and that
they felt others needed to know. It was also made clear there should be no criticism
of staff for incident reporting decisions during this time.
The team also provided advice to regional teams to support providers by clarifying
expectations related to hospital-onset healthcare associated COVID-19 infections in
October 2020, and again in March 2021. This advice reiterated existing definitions
of ‘hospital-onset probable or definite healthcare acquired infections’, and that these
also meet the definition of a patient safety incident. This has contributed to a sharp
rise in infection control incidents related to COVID-19, notably in the acute setting
and infection control categories (see section 4).
1 Health Foundation, November 2020. Elective care in England. Assessing the impact of COVID-19 and where next.
Accessed 20 Sep. 21 < Elective care in England - The Health Foundation> 2 Health Foundation, May 2021. How has the COVID-19 pandemic impacted primary care? Accessed 20 Sep. 21 < How has the COVID-19 pandemic impacted primary care? (health.org.uk)>
4 | NaPSIR workbook commentary
These COVID-19 related changes can be observed in routine national NHS-related
datasets as well as the NRLS and will affect any comparisons over time. For
example: we anticipated a static or declining trend in the number of incidents
reported to the NRLS and a change in the types of incidents reported because of
pressures on NHS staff capacity and fewer elective procedures.
Figure 1. Daily COVID-19 cases, England*
* Reproduced from https://coronavirus.data.gov.uk/details/cases, accessed
16/08/2021.
2.2 NaPSIR Overview
The NaPSIR provides data on patient safety incidents at a national level. This is the
first annual NaPSIR publication; previously quarterly updates were published every
six months. As with previous NaPSIR commentaries we still compare the current
and previous 12 month periods.
The NaPSIR workbooks still present data by quarter. Any comparison over time by
quarter or six month period must be done by comparing with the same quarter or
six month period in the previous year. This is because of seasonality in reporting
patterns and when incidents occur. For example, the number of incidents reported
5 | NaPSIR workbook commentary
has historically peaked every May and November around the cut-offs for
organisations to submit data for two of our routine data publications. Therefore,
comparing consecutive periods may be misleading if, for example, the previous
period included a known reporting peak. Any comparisons against other time
periods should also consider the effects for COVID-19, described in section 2.1.
The data and this commentary are part of a range of official statistics on patient
safety incidents reported to the NRLS. Our other statistic outputs are:
• organisation patient safety incident reports (OPSIR)
• monthly summary data on patient safety incident reports.3
This document should be read alongside the NaPSIR data tables. The data
contained in NaPSIR and OPSIR differs for the reasons listed in Table 1. Therefore,
the statistics are not comparable and numbers should not be expected to match.
Detailed information on how we manage data quality and revisions and corrections
is available on the NaPSIR webpage.
3 Although not formally an official statistic, this output is included here due to its similarity to the
OPSIR and NaPSIR.
6 | NaPSIR workbook commentary
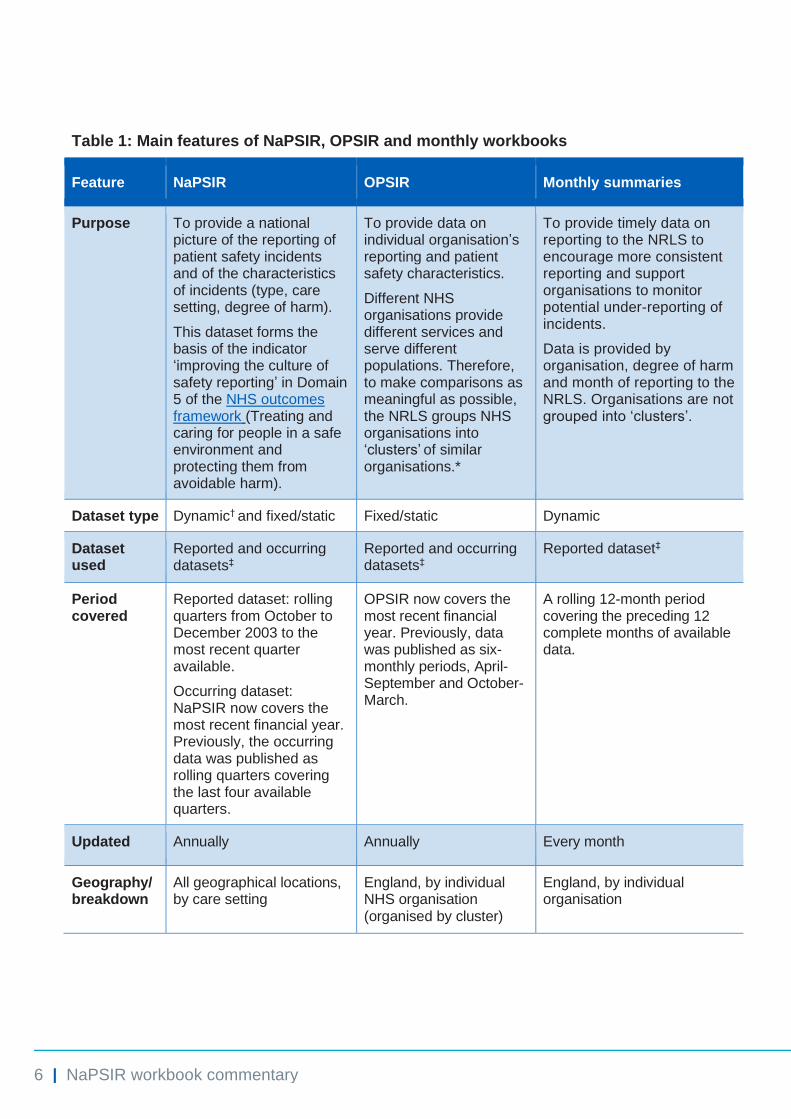
Table 1: Main features of NaPSIR, OPSIR and monthly workbooks
Feature NaPSIR OPSIR Monthly summaries
Purpose To provide a national picture of the reporting of patient safety incidents and of the characteristics of incidents (type, care setting, degree of harm).
This dataset forms the basis of the indicator ‘improving the culture of safety reporting’ in Domain 5 of the NHS outcomes framework (Treating and caring for people in a safe environment and protecting them from avoidable harm).
To provide data on individual organisation’s reporting and patient safety characteristics.
Different NHS organisations provide different services and serve different populations. Therefore, to make comparisons as meaningful as possible, the NRLS groups NHS organisations into ‘clusters’ of similar organisations.*
To provide timely data on reporting to the NRLS to encourage more consistent reporting and support organisations to monitor potential under-reporting of incidents.
Data is provided by organisation, degree of harm and month of reporting to the NRLS. Organisations are not grouped into ‘clusters’.
Dataset type Dynamic† and fixed/static Fixed/static Dynamic
Dataset used
Reported and occurring datasets‡
Reported and occurring datasets‡
Reported dataset‡
Period covered
Reported dataset: rolling quarters from October to December 2003 to the most recent quarter available.
Occurring dataset: NaPSIR now covers the most recent financial year. Previously, the occurring data was published as rolling quarters covering the last four available quarters.
OPSIR now covers the most recent financial year. Previously, data was published as six-monthly periods, April-September and October-March.
A rolling 12-month period covering the preceding 12 complete months of available data.
Updated Annually Annually Every month
Geography/ breakdown
All geographical locations, by care setting
England, by individual NHS organisation (organised by cluster)
England, by individual organisation
7 | NaPSIR workbook commentary
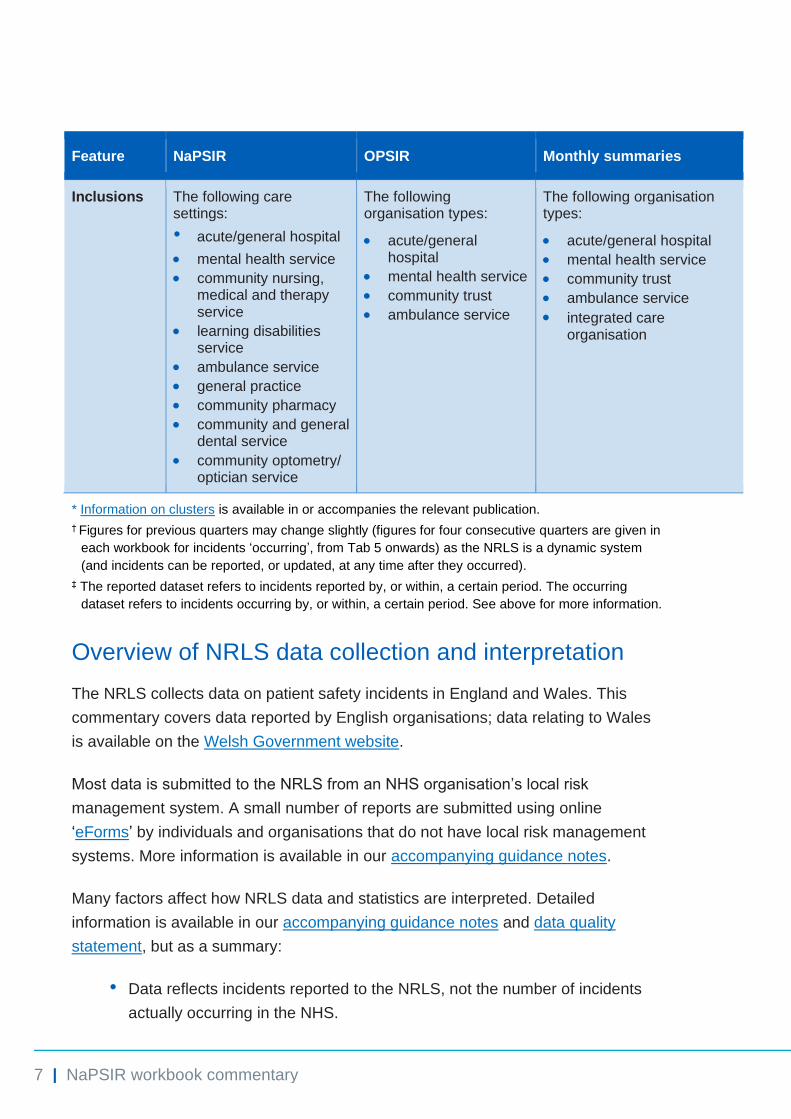
Feature NaPSIR OPSIR Monthly summaries
Inclusions
The following care settings:
• acute/general hospital
• mental health service
• community nursing, medical and therapy service
• learning disabilities service
• ambulance service
• general practice
• community pharmacy
• community and general dental service
• community optometry/ optician service
The following organisation types:
• acute/general hospital
• mental health service
• community trust
• ambulance service
The following organisation types:
• acute/general hospital
• mental health service
• community trust
• ambulance service
• integrated care organisation
* Information on clusters is available in or accompanies the relevant publication.
† Figures for previous quarters may change slightly (figures for four consecutive quarters are given in
each workbook for incidents ‘occurring’, from Tab 5 onwards) as the NRLS is a dynamic system
(and incidents can be reported, or updated, at any time after they occurred).
‡ The reported dataset refers to incidents reported by, or within, a certain period. The occurring
dataset refers to incidents occurring by, or within, a certain period. See above for more information.
Overview of NRLS data collection and interpretation
The NRLS collects data on patient safety incidents in England and Wales. This
commentary covers data reported by English organisations; data relating to Wales
is available on the Welsh Government website.
Most data is submitted to the NRLS from an NHS organisation’s local risk
management system. A small number of reports are submitted using online
‘eForms’ by individuals and organisations that do not have local risk management
systems. More information is available in our accompanying guidance notes.
Many factors affect how NRLS data and statistics are interpreted. Detailed
information is available in our accompanying guidance notes and data quality
statement, but as a summary:
• Data reflects incidents reported to the NRLS, not the number of incidents
actually occurring in the NHS.
8 | NaPSIR workbook commentary
• There can be a delay between an incident occurring and when it is reported
to the NRLS, so we publish data based on the occurring dataset (the date
when an incident is reported to have occurred) and the reported dataset
(the date when the incident is reported to the NRLS). For any given period,
the number of incidents occurring and incidents reported is unlikely to
match.
• Reporting error and bias affect trends in the number of incidents reported to
the NRLS; known sources include: the type of organisations that report to
us; the type of incidents reported; changes in policy; seasonality in when
incidents are reported and when incidents occur (as detailed above); delays
in reporting incidents to us.
It is important to consider these factors when interpreting or comparing any NRLS
data over time.
Changes to patient safety data outputs
The Learn from Patient Safety Events service (LFPSE; formerly Patient Safety
Information Management System (PSIMS)) will fully replace the NRLS. It will
change the way information is collected to make it easier to record and learn from
patient safety events, including patient safety incidents. These improvements mean
any output using the patient safety data currently collected on the NRLS will also
change, including the NaPSIR data tables and associated outputs in future years.
From July 2021 patient safety events have been reported to LFPSE by individuals
and organisations that previously used the ‘eForm’ reporting method. This currently
represents a minority of incidents that would have been reported to the NRLS. We
are currently developing new LFPSE-related outputs. However as most incidents
are still reported via the NRLS we anticipate that NRLS outputs will remain
unchanged until the volume of events recorded via LFPSE increases.
9 | NaPSIR workbook commentary
3. Incidents reported up to June 2021
This section analyses incidents reported to the NRLS using the ‘reported dataset’,
the dataset used to look at patterns in reporting, such as frequency and timeliness.
It contains incidents reported to the NRLS within a specified period (in this case up
to the end of June 2021) and reflects seasonality in when incidents are reported to
the NRLS.
Reported number of incidents
Patient safety incidents have been reported to the NRLS since October 2003
(Figure 2), with all NHS organisations being able to access the system from 2005.
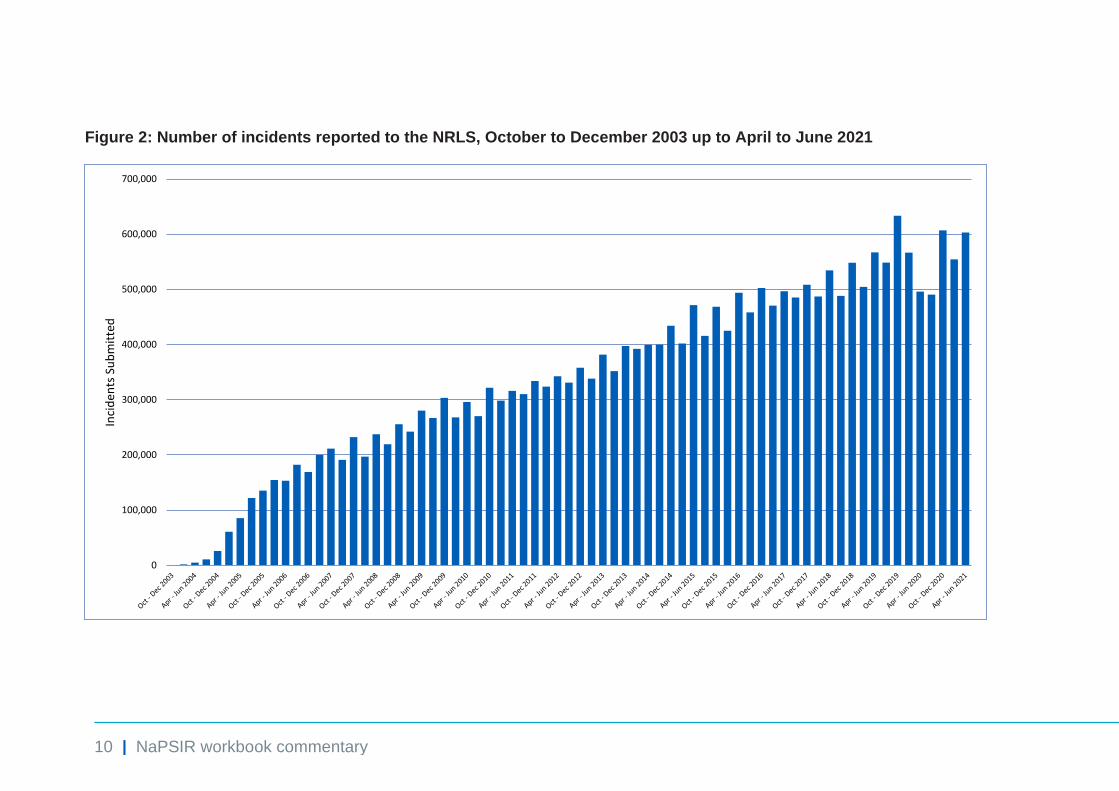
From April to June 2021, a total of 602,975 incidents were reported to the NRLS
from England. This represents a 21.5% increase when compared to April to June
2020. This likely reflects changes to the provision of services during the COVID-19
pandemic period in 2020 which resulted in reported incidents being comparatively
low, as well as a constantly improving reporting culture in the NHS where staff are
more likely to report incidents to support patient safety improvement.
The peaks in the number of incidents reported (Figure 2) reflect when many
organisations submit large batches of incidents to the NRLS close to the cut-offs for
the NaPSIR and OPSIR publications, contributing to both the natural fluctuation and
the seasonality.
10 | NaPSIR workbook commentary
Figure 2: Number of incidents reported to the NRLS, October to December 2003 up to April to June 2021
0
100,000
200,000
300,000
400,000
500,000
600,000
700,000
Inci
den
ts S
ub
mit
ted
11 | NaPSIR workbook commentary
4. Incidents reported as occurring from April 2020 to March 2021
This section analyses incidents using the ‘occurring dataset’ to look at patient
safety incident characteristics. This dataset contains incidents reported as happening
(occurring) in a specific period and reflects seasonality in when incidents occur.
Analysis based on it may be biased by numbers fluctuating over time due to
reporting delays.
This report includes analysis of incidents reported to have occurred from April 2020
to March 2021 and reported to the NRLS by 31 May 2021. This cut-off allows time
for quality assurance and analysis.
The number of incidents reported as occurring for any period will differ from the
number of incidents reported in the same period because they capture different
data. For example, incidents reported from October 2018 to September 2019 will
include those that occurred in this period and those occurring before October 2018
because of delays in reporting.
From April 2020 to March 2021, English NHS organisations reported 2,109,057
incidents as occurring. This represents a 6.1% reduction when compared with April
2019 to March 2020 (2,246,622).
Incident characteristics
When submitting incidents to the NRLS, users enter information describing the
incident in more detail. For example, we collect information on the type of incident
and where it occurred. This helps us learn more about the types of incidents
occurring in the NHS and focus our efforts to reduce harm to patients. Key incident
characteristics are described below.
Incident category
Incident category is important because it helps us understand if certain types of
incidents are more common than others, so we can target our learning. Many factors
12 | NaPSIR workbook commentary
can affect the types of incidents different organisations report, with resulting variation
within and between different care settings.
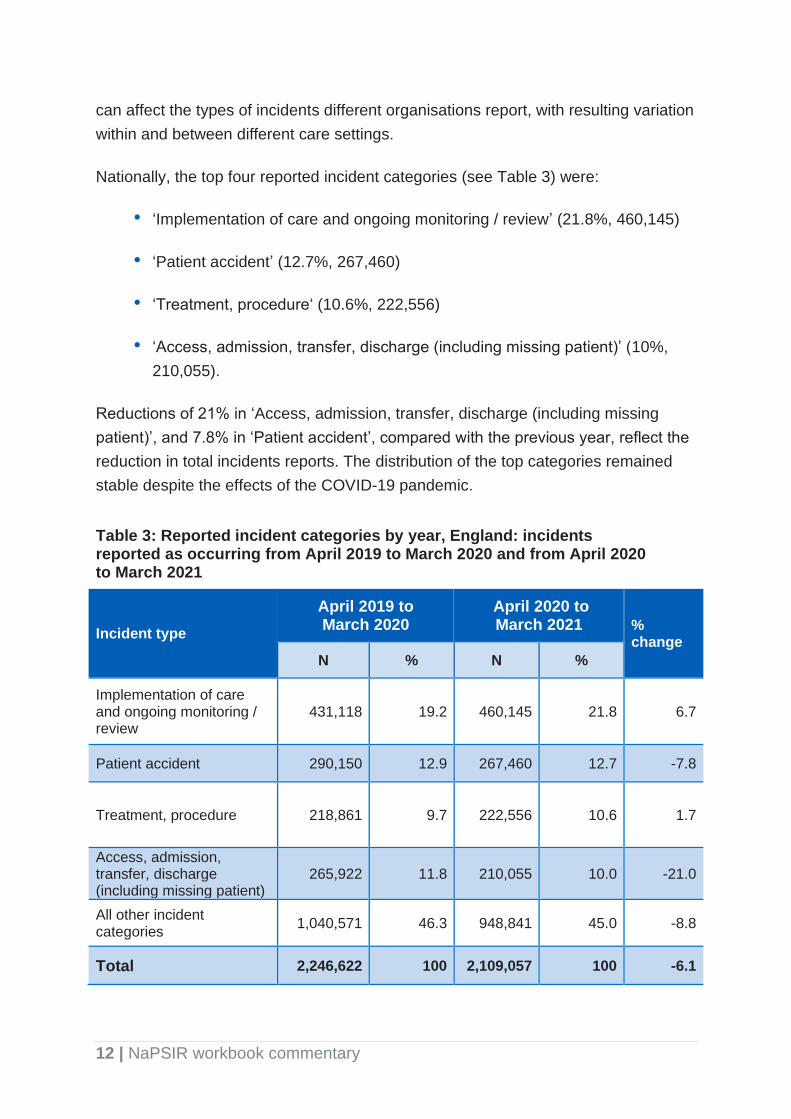
Nationally, the top four reported incident categories (see Table 3) were:
• ‘Implementation of care and ongoing monitoring / review’ (21.8%, 460,145)
• ‘Patient accident’ (12.7%, 267,460)
• ‘Treatment, procedure‘ (10.6%, 222,556)
• ‘Access, admission, transfer, discharge (including missing patient)’ (10%,
210,055).
Reductions of 21% in ‘Access, admission, transfer, discharge (including missing
patient)’, and 7.8% in ‘Patient accident’, compared with the previous year, reflect the
reduction in total incidents reports. The distribution of the top categories remained
stable despite the effects of the COVID-19 pandemic.
Table 3: Reported incident categories by year, England: incidents reported as occurring from April 2019 to March 2020 and from April 2020 to March 2021
Incident type
April 2019 to March 2020
April 2020 to March 2021 %
change
N % N %
Implementation of care and ongoing monitoring / review
431,118 19.2 460,145 21.8 6.7
Patient accident 290,150 12.9 267,460 12.7 -7.8
Treatment, procedure 218,861 9.7 222,556 10.6 1.7
Access, admission, transfer, discharge (including missing patient)
265,922 11.8 210,055 10.0 -21.0
All other incident categories
1,040,571 46.3 948,841 45.0 -8.8
Total 2,246,622 100 2,109,057 100 -6.1
13 | NaPSIR workbook commentary
Care setting of occurrence
This information helps us understand where reported incidents have occurred and is
needed because any organisation can report an incident, even one that occurred at
another organisation.
Nationally, the top four reported care settings of incident occurrence (see Table 4)
were:
• ‘Acute / general hospital’ (70.1%, 1,478,287)
• ‘Mental health service’ (14.3%, 300,703)
• ‘Community nursing, medical and therapy service (incl. community hospital)’
(13.1%, 19,305)
• ‘Ambulance service’ (0.9%, 19,305).
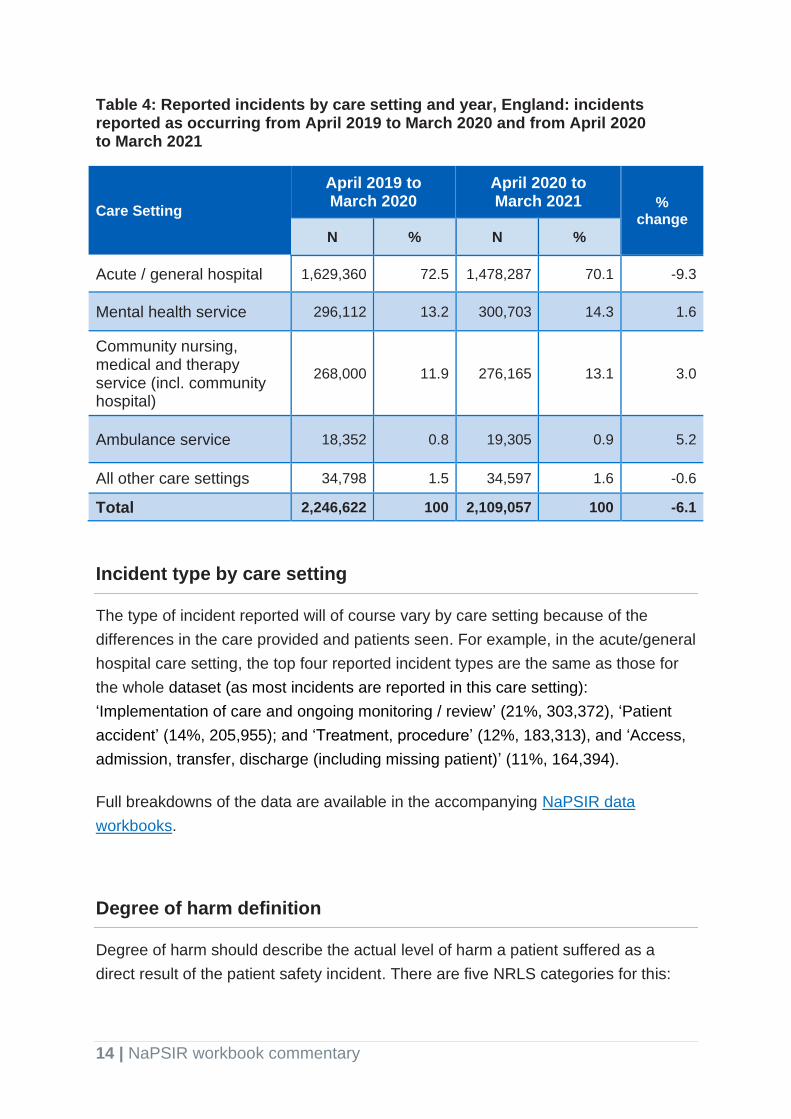
The reduction in reports (9.3%) in ‘Acute / general hospital’, an increase in ‘Mental
health service’ (1.6%), ‘Community nursing, medical and therapy service (incl.
community hospital)’ (3%) and ‘Ambulance services’ (5.2%) are consistent with
service changes related to COVID-19.
14 | NaPSIR workbook commentary
Table 4: Reported incidents by care setting and year, England: incidents reported as occurring from April 2019 to March 2020 and from April 2020 to March 2021
Care Setting
April 2019 to March 2020
April 2020 to March 2021 %
change
N % N %
Acute / general hospital 1,629,360 72.5 1,478,287 70.1 -9.3
Mental health service 296,112 13.2 300,703 14.3 1.6
Community nursing, medical and therapy service (incl. community hospital)
268,000 11.9 276,165 13.1 3.0
Ambulance service 18,352 0.8 19,305 0.9 5.2
All other care settings 34,798 1.5 34,597 1.6 -0.6
Total 2,246,622 100 2,109,057 100 -6.1
Incident type by care setting
The type of incident reported will of course vary by care setting because of the
differences in the care provided and patients seen. For example, in the acute/general
hospital care setting, the top four reported incident types are the same as those for
the whole dataset (as most incidents are reported in this care setting):
‘Implementation of care and ongoing monitoring / review’ (21%, 303,372), ‘Patient
accident’ (14%, 205,955); and ‘Treatment, procedure’ (12%, 183,313), and ‘Access,
admission, transfer, discharge (including missing patient)’ (11%, 164,394).
Full breakdowns of the data are available in the accompanying NaPSIR data
workbooks.
Degree of harm definition
Degree of harm should describe the actual level of harm a patient suffered as a
direct result of the patient safety incident. There are five NRLS categories for this:
15 | NaPSIR workbook commentary
• no harm – a situation where no harm occurred: either a prevented patient
safety incident or a no harm incident
• low harm – any unexpected or unintended incident that required extra
observation or minor treatment and caused minimal harm to one or more
persons
• moderate harm – any unexpected or unintended incident that resulted in
further treatment, possible surgical intervention, cancelling of treatment or
transfer to another area, and which caused short-term harm to one or more
persons
• severe harm – any unexpected or unintended incident that caused
permanent or long-term harm to one or more persons
• death – any unexpected or unintended event that caused the death of one
or more persons.
The degree of harm helps us learn about the impact of incidents on patients and
identify those causing most harm (severe harm and death) so we can prioritise their
clinical review. Clinical review uses NRLS data to identify new or emerging issues
that may need national action, such as issuing a National Patient Safety Alert. It is
still important that incidents causing all degrees of harm are reported to the NRLS as
breadth of information is fundamental to improving patient safety.
Sometimes reporters give an incident’s potential degree of harm instead; for
example, coding the degree of harm as ‘severe’ for a ‘near miss’ even though no
harm was caused because preventative action was taken. This needs to be
considered when interpreting the degree of harm data.
Reported degree of harm
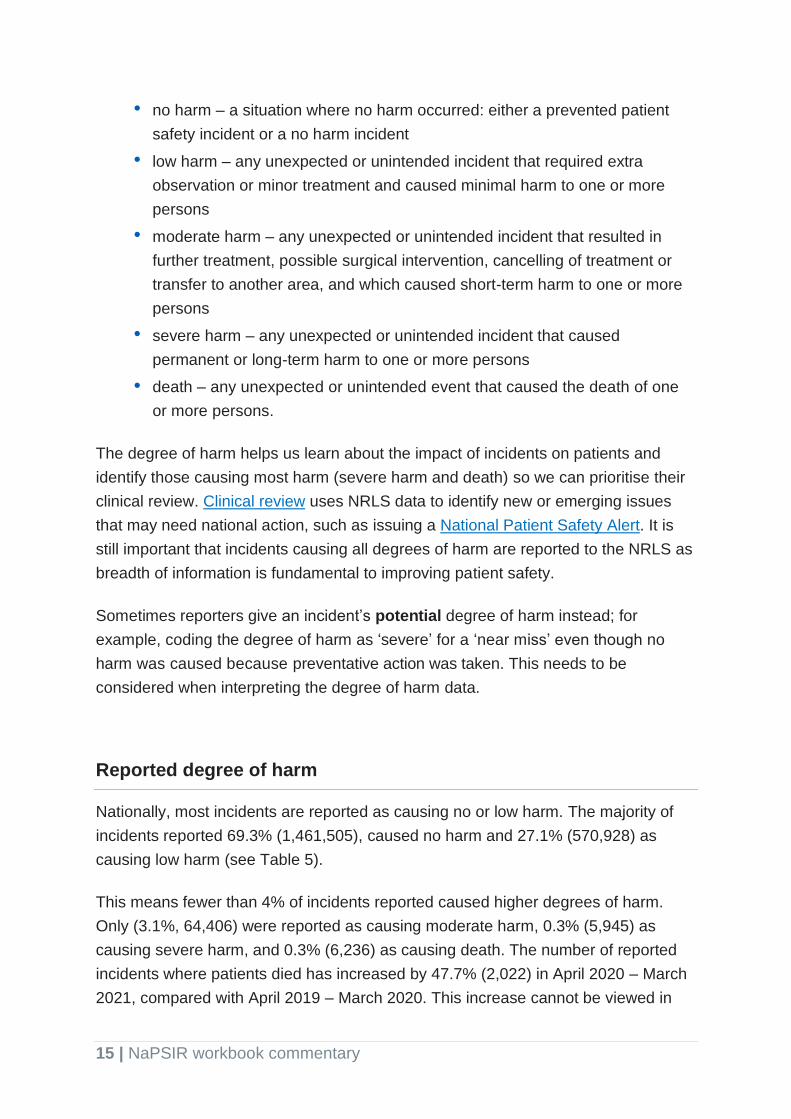
Nationally, most incidents are reported as causing no or low harm. The majority of
incidents reported 69.3% (1,461,505), caused no harm and 27.1% (570,928) as
causing low harm (see Table 5).
This means fewer than 4% of incidents reported caused higher degrees of harm.
Only (3.1%, 64,406) were reported as causing moderate harm, 0.3% (5,945) as
causing severe harm, and 0.3% (6,236) as causing death. The number of reported
incidents where patients died has increased by 47.7% (2,022) in April 2020 – March
2021, compared with April 2019 – March 2020. This increase cannot be viewed in
16 | NaPSIR workbook commentary
the same way it would during a ‘normal year.’ The context of the COVID-19
pandemic, the rapid and dramatic changes to services, and associated deaths in
hospital (Figure 3), must also be considered. All death and severe harm incidents
are rapidly reviewed by clinical teams to learn from error and are used to issue
guidance where emerging risks are identified.
Table 5: Reported incidents by degree of harm and year, England: incidents reported as occurring from April 2019 to March 2020 and from April 2020 to March 2021 *
Reported degree of harm
April 2019 to March 2020
April 2020 to March 2021 %
change N % N %
No harm 1,609,520 71.6 1,461,505 69.3 -9.2
Low 567,323 25.3 570,928 27.1 0.6
Moderate 59,594 2.7 64,406 3.1 8.1
Severe 5,919 0.3 5,945 0.3 0.4
Death 4,241 0.2 6,263 0.3 47.7
Total 2,246,597 100 2,109,047 100 -6.1
*Excludes incidents where the degree of harm was not reported.
Reported degree of harm by care setting
The reported degree of harm caused by incidents reported in all care settings follows
a similar pattern to the national-level data, with ‘no harm’ being the most commonly
reported. However, the relative proportion of each degree of harm varied by care
setting. For example, the percentage of incidents reported as causing ‘no harm’
ranged from 91.8% (3,483/3,794) in the community pharmacy care setting to 47.9%
(132,246/276,165) in the community nursing, medical and therapy service (incl.
community hospital) care setting.
The number, and proportion, of incidents reported as death was higher than ‘severe’
harm in April 2020 – March 2021. This differs from previous years (and NaPSIR
publications) where reported deaths were the smallest group. This represents a
47.7% increase (2,022) in incidents reported as death incidents compared to April
2019 – March 2020. Given the reduction in total incident reporting of 6.1%, this is a
17 | NaPSIR workbook commentary
large increase, but should be considered in the context of high COVID-19 related
deaths (Figure 3), some of which will be reported to the NRLS.
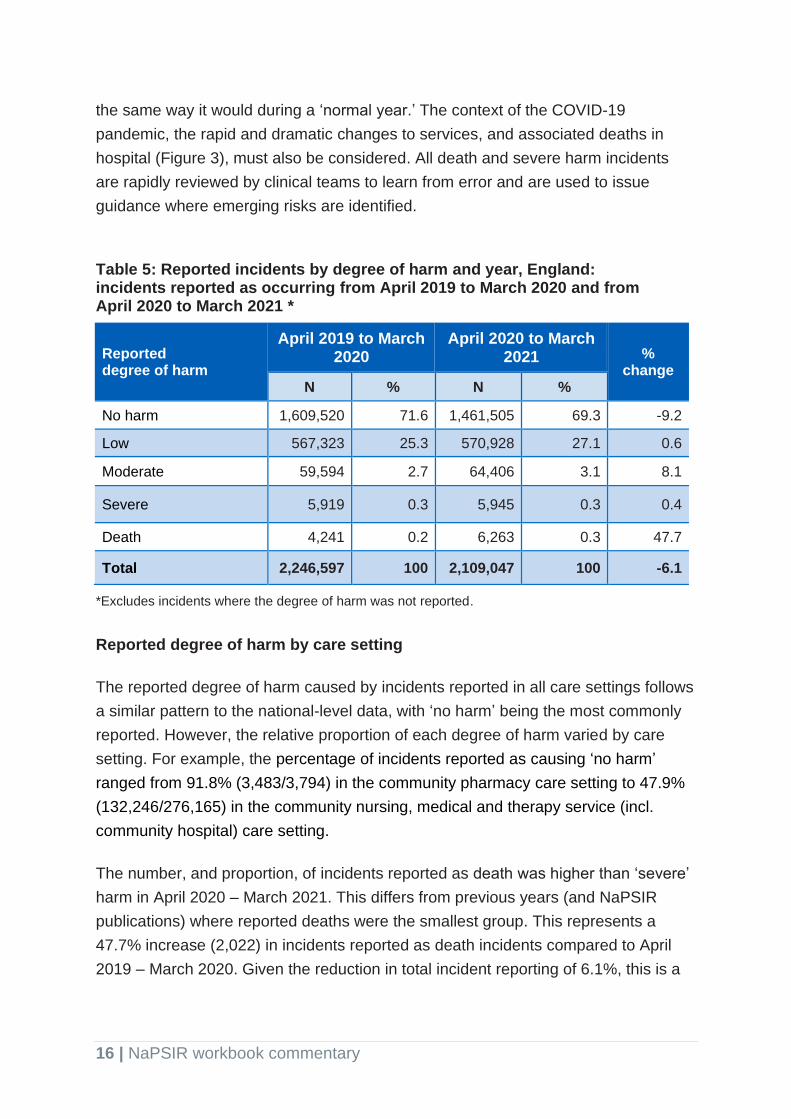
Figure 3:. In-hospital COVID-19 deaths during NaPSIR period, England*
*Reproduced from NHS England daily COVID death data, 22nd September 2021:
https://www.england.nhs.uk/statistics/statistical-work-areas/covid-19-daily-deaths/
The large increase in incidents reported as death, seen at national level, was
focussed in the ‘Acute / general hospital’ setting, which showed a 122% increase
(from 1348, to 2993) when compared to the previous year. This is likely linked to
COVID-19 related service changes.
Full breakdowns of the data are available in the accompanying NaPSIR data
workbook.
Reported degree of harm by incident type
When degree of harm is broken down by incident type, the patterns are generally the
same as those at a national level, with most incidents being reported as ‘no harm’.
The ‘infection control incident’ category saw an increase in incidents at all harm
levels, compared to the previous year. ‘Infection control incident’ also had the
18 | NaPSIR workbook commentary
highest reported harm percentage of incidents reported as death (2.19%,
1,561/71,392); this is a substantial increase on the previous year and is likely driven
by the COVID-19 pandemic. The lowest percentage of ‘no harm’ was seen in
‘implementation of care’ category at 45.1% (207,725/460,145).
Full breakdowns of the data are available in the accompanying NaPSIR data
workbook.
When both reported incident location and type are considered, the effects of the
COVID-19 pandemic have been most visible in incident reporting data as an
increase in incidents reported as death in the ‘infection control’ category in the acute
trust setting. Compared against the previous year, April 2020 – March 2021 has
seen an increase of 2,141% (from 63 to 1,412) in ‘infection control’ incidents. The
national patient safety team’s advice (see section 2.1) was to encourage reporting of
‘hospital-onset probable or definite healthcare acquired infections’ for COVID-19 and
the increase in reported incidents (particularly deaths) reflects this.
19 | NaPSIR workbook commentary
5. Final remarks
The NRLS is a system designed to support learning. The incidents collected reflect
what is reported to us and the reporting culture. The system is not designed to
count the actual number of incidents occurring in the NHS. Therefore, the general
trend of increases in incidents reported to the NRLS indicates a constantly
improving reporting culture. These increases, together with the reduction in the time
between an incident occurring and it being reported, have provided more
opportunity for us to learn and reduce the risk of harm to patients. The total number
of incident reports has reduced in April 2020 – March 2021, and the distribution of
incident types has changed; these are likely related to the COVID-19 pandemic and
its effects on health services.
We rely on the quality and accuracy of information submitted to focus our learning
and interventions to reduce harm. We continue to use this information to identify
which incidents are clinically reviewed and how we should work to improve patient
safety. We also encourage all users to review their own patient safety incidents
locally, to understand more about their reporting culture and areas where local
improvements in safety culture and patient safety can be made.
The recently launched LFPSE service will replace the NRLS. This will affect the sort
of data we collect, and national incident reporting will span two systems during the
implementation and roll out. As a result, our statistical outputs are anticipated to
change in future years. More information is available online.
The COVID-19 pandemic has drastically affected people’s health, healthcare needs
and healthcare delivery across the world. The pressures on NHS hospital care and
ambulance services, the reduction in elective case provision, and the transition to
digital-first delivery methods will all have affected incident reporting. NRLS data
continues to be used to learn about emerging patient safety issues and improve
safety, but the data in this publication cannot be used to compare against pre-
COVID-19 time periods in any meaningful way.
We thank all staff, patients and members of the public who have taken the time to
report incidents. This information is essential in helping us all improve patient safety
and protect our patients from harm.
20 | NaPSIR workbook commentary
6. Contact us for help
If you have any questions about the NRLS data collection, the published data or your
organisation’s data please contact the NRLS team: [email protected]
This publication can be made available in a number of formats on request.

![Genesis, Commentary to Chapter 6-8 - Torah - · PDF fileGenesis, Commentary to Chapter 6-8 Everett Fox ... angelic sin and that Psalm 82:1, 6, 7 are references to this incident [37]](https://img.pdfslide.us/doc/110x75/5a7a46af7f8b9a6c3c8d7e86/genesis-commentary-to-chapter-6-8-torah-commentary-to-chapter-6-8-everett-fox.jpg)