Embed Size (px)
Citation preview

NPDES Compliance Inspection Manual
Appendix O
EPA Publication Number: 305-K-17-001 Interim Revised Version, January 2017

U.S. EPA Interim Revised NPDES Inspection Manual | 2017
Appendix O – Page 585
Appendix O – Supplemental Flow
Measurement Information
U.S. EPA Interim Revised NPDES Inspection Manual | 2017
Appendix O – Page 586
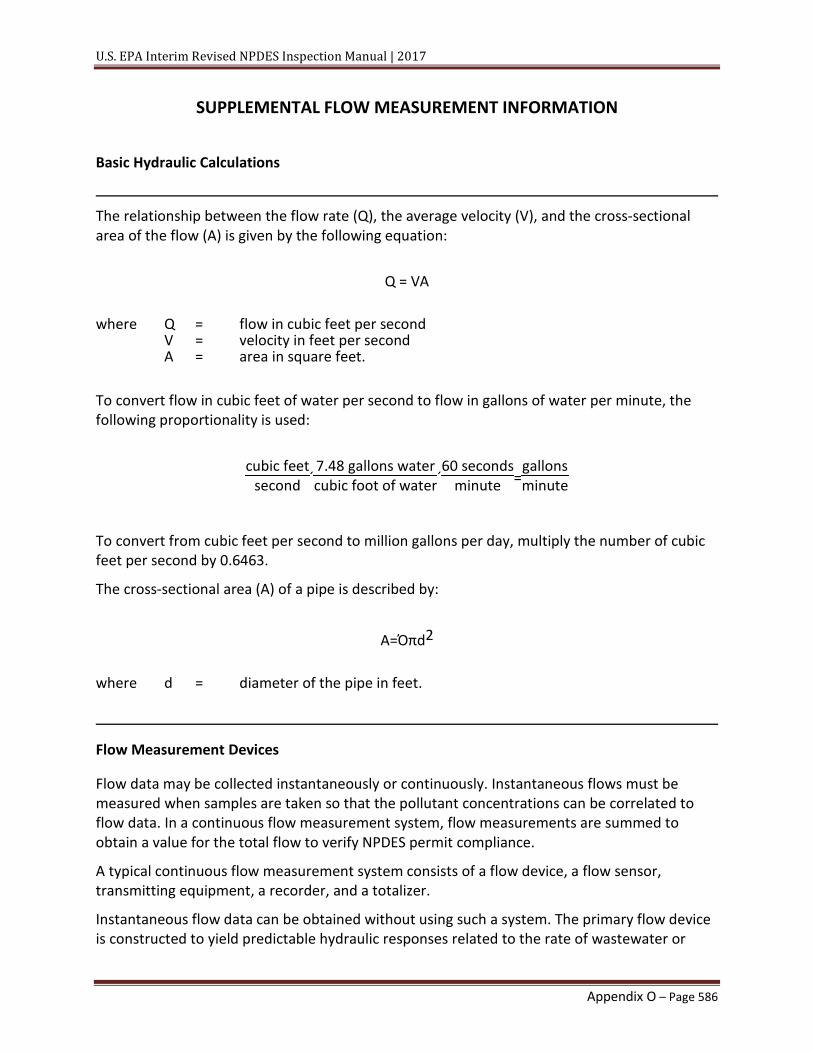
SUPPLEMENTAL FLOW MEASUREMENT INFORMATION
Basic Hydraulic Calculations The relationship between the flow rate (Q), the average velocity (V), and the cross-sectional area of the flow (A) is given by the following equation:
where Q = flow in cubic feet per second
V = velocity in feet per second A = area in square feet.
To convert flow in cubic feet of water per second to flow in gallons of water per minute, the following proportionality is used:
To convert from cubic feet per second to million gallons per day, multiply the number of cubic feet per second by 0.6463.
The cross-sectional area (A) of a pipe is described by:
where d = diameter of the pipe in feet.
Flow Measurement Devices Flow data may be collected instantaneously or continuously. Instantaneous flows must be measured when samples are taken so that the pollutant concentrations can be correlated to flow data. In a continuous flow measurement system, flow measurements are summed to obtain a value for the total flow to verify NPDES permit compliance.
A typical continuous flow measurement system consists of a flow device, a flow sensor, transmitting equipment, a recorder, and a totalizer.
Instantaneous flow data can be obtained without using such a system. The primary flow device is constructed to yield predictable hydraulic responses related to the rate of wastewater or
EEA Q = V
AA
cubic feetsecond ´
7.48 gallons waterEEcubic foot of water´
60 secondsminute =
gallonsminuteEE
AAA=Όπd2 EE

U.S. EPA Interim Revised NPDES Inspection Manual | 2017
Appendix O – Page 587
water flowing through the device. As previously mentioned, examples of such devices include weirs and flumes, which relate water depth (head) to flow; Venturi meters, which relate differential pressure to flow; and electromagnetic flowmeters, which relate induced electric voltage to flow. In most cases, a standard primary flow device has undergone detailed testing and experimentation and its accuracy has been verified.
Flow is measured by many methods; some are designed to measure open channel flows, and others are designed to measure flows in pipelines. A complete discussion of all available flow measurement methods, their supporting theories, and the devices used are beyond the scope of this manual. The most commonly used flow measurement devices and procedures for inspecting them will be described briefly in the following paragraphs. For more detail, inspectors should consult the publications listed in References at the end of this chapter.
Primary Devices
Weirs. A weir consists of a thin vertical plate with a sharp crest that is placed in a stream, channel, or partly filled pipe. Figure O-1 shows a profile of a sharp-crested weir and indicates the appropriate nomenclature. Four common types of sharp-crested weirs are shown in Figure O-2. This figure illustrates the difference between suppressed and contracted rectangular weirs and illustrates Cipolletti (trapezoidal) and V-notch (triangular) weirs.
To determine the flow rate, it is necessary to measure the hydraulic head (height) of water above the crest of the weir. For accurate flow measurements, the crest must be clean, sharp, and level. The edge of the crest must not be thicker than 1/8 inch.
The rate of flow over a weir is directly related to the height of the water (head) above the crest at a point upstream of the weir where the water surface is level. To calculate the discharge over a weir, the head must first be measured by placing a measuring device upstream of the weir, at a distance of at least 4 times an approximate measurement of the head. A measurement can be taken at the weir plate to approximate the head. However, if this measurement is used to calculate the discharge, this value will provide only a rough estimate of the discharge.
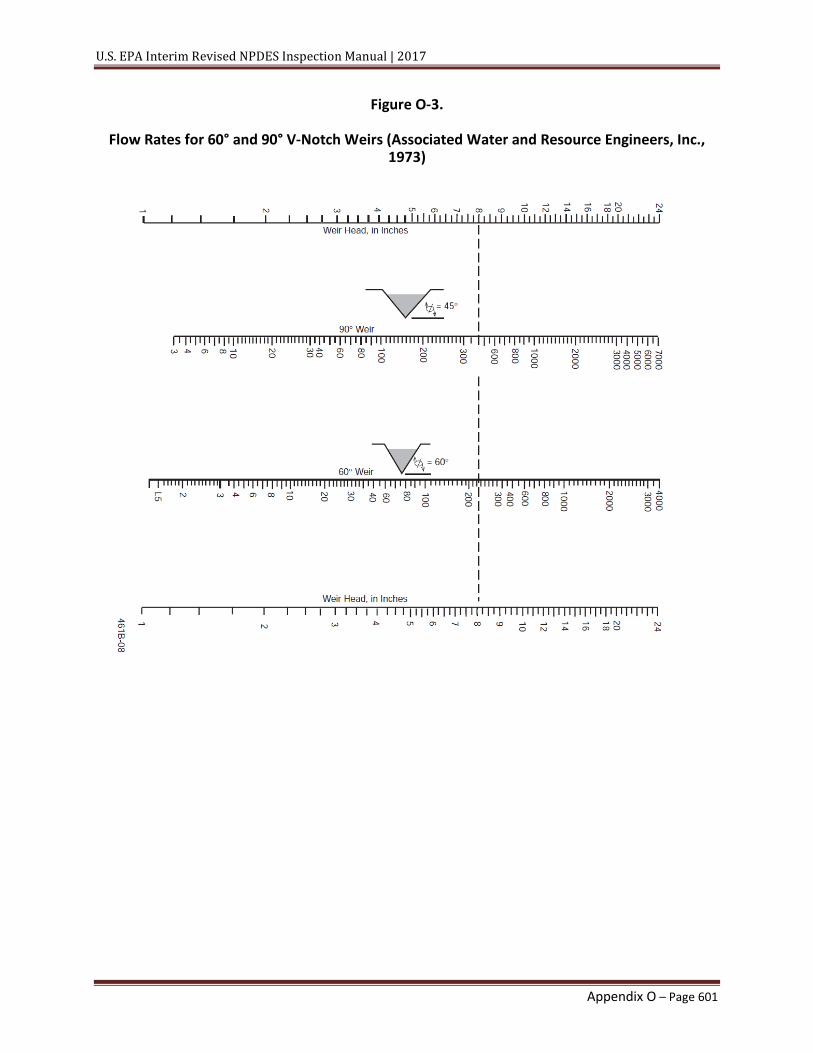
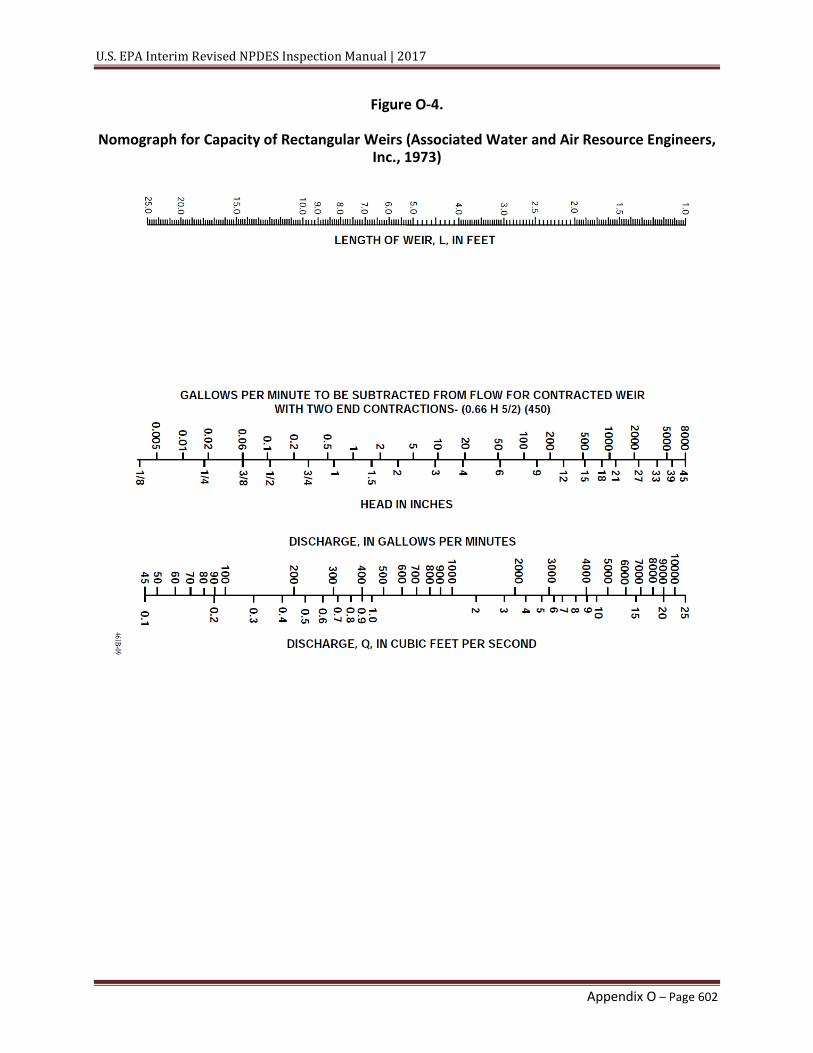
The head-discharge relationship formulas for nonsubmerged contracted and suppressed rectangular weirs, Cipolletti weirs, and V-notch weirs are provided in Table O-1. Discharge rates for the 90-degree V-notch weir (when the head is measured at the weir plate) are included in Table O-2. Flow rates for 60- and 90-degree V-notch weirs can be determined from the graph in Figure O-3. Minimum and maximum recommended flow rates for Cipolletti weirs are provided in Table O-3. Figure O-4 is a nomograph for flow rates for rectangular weirs using the Francis formulas.
Parshall Flume. The Parshall flume is composed of three sections: a converging upstream section, a throat or contracted section, and a diverging or dropping downstream section. When there is free fall out of the throat of a Parshall flume, no diverging downstream section is required. It operates on the principle that when open channel water flows through a constriction in the channel, it produces a hydraulic head at a certain point upstream of the constriction that is proportional to the flow. The hydraulic head is used to calculate the flow.

U.S. EPA Interim Revised NPDES Inspection Manual | 2017
Appendix O – Page 588
Flow curves are shown in Figure O-5 to determine free flow through 3 inches to 50 feet Parshall flumes.
The Parshall flume is good for measuring open channel waste flow because it is self-cleaning; therefore, sand or suspended solids are unlikely to affect the operation of the device. The flume is both simple and accurate.
The flume size is given by the width of the throat section. Parshall flumes have been developed with throat widths from 1 inch to 50 feet. The configuration and standard nomenclature for Parshall flumes are provided in Figure O-6. Strict adherence to all dimensions is necessary to achieve accurate flow measurements. Figure O-6 provides Parshall flume dimensions for various throat widths, and Table O-4 provides the minimum and maximum flow rates for free flow through Parshall flumes.
For free nonsubmerged flow in a Parshall flume of throat and upstream head (Ha in feet), the discharge relationship for flumes of 8 feet or less is given by the general equation Q = CWHan, where Q = flow.
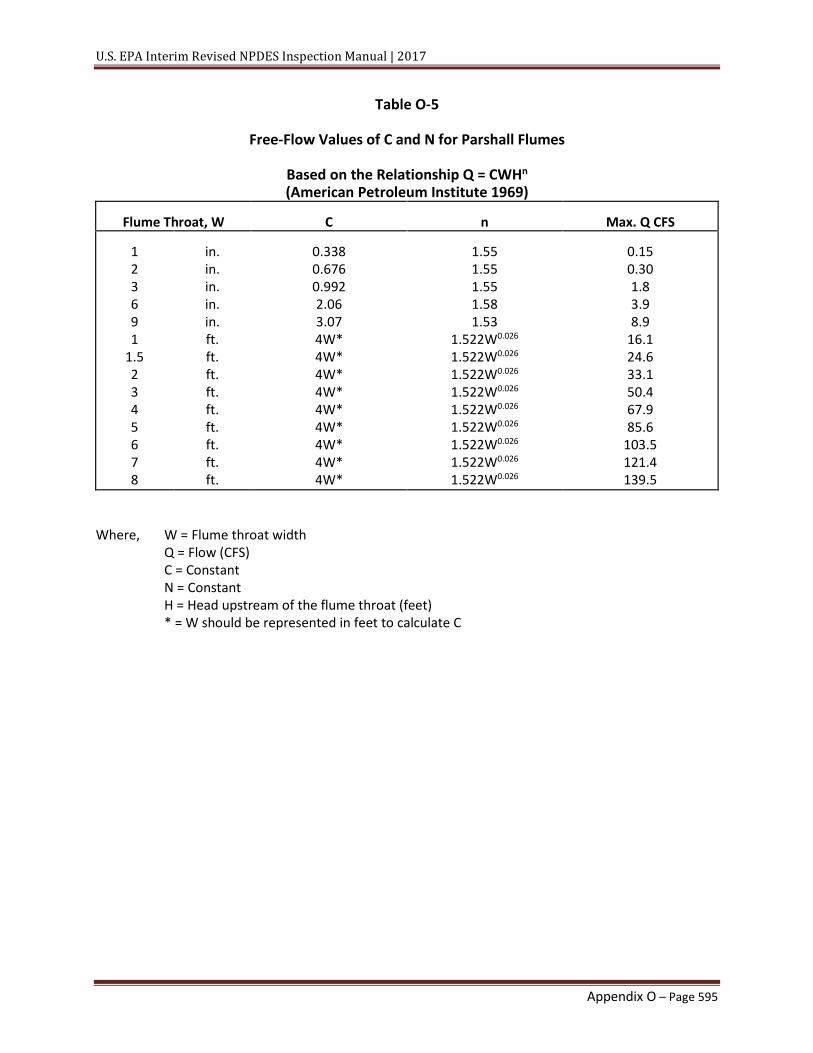
Table O-5 provides the values of C, n, and Q for different sizes (widths) of the Parshall flumes. Nomographs, curves, or tables are readily available to determine the discharge from head observations.
Flow through a Parshall flume may also be submerged. The degree of submergence is indicated by the ratio of the downstream head to the upstream head (Hb/Ha), which is the submergence ratio. Hb is the height of water measured above the crest. The flow is submerged if the submerged ratio is:
• Greater than 0.5 for flumes under 3 inches
• Greater than 0.6 for flumes 6 to 9 inches
• Greater than 0.7 for flumes 1 to 8 feet
• Greater than 0.8 for flumes larger than 8 feet.
If submerged conditions exist, the inspector should apply a correction factor to the free flow determined using the relationship Q= CWHn. These correction factors are shown in Figure O-7 for different sizes of the Parshall flume.
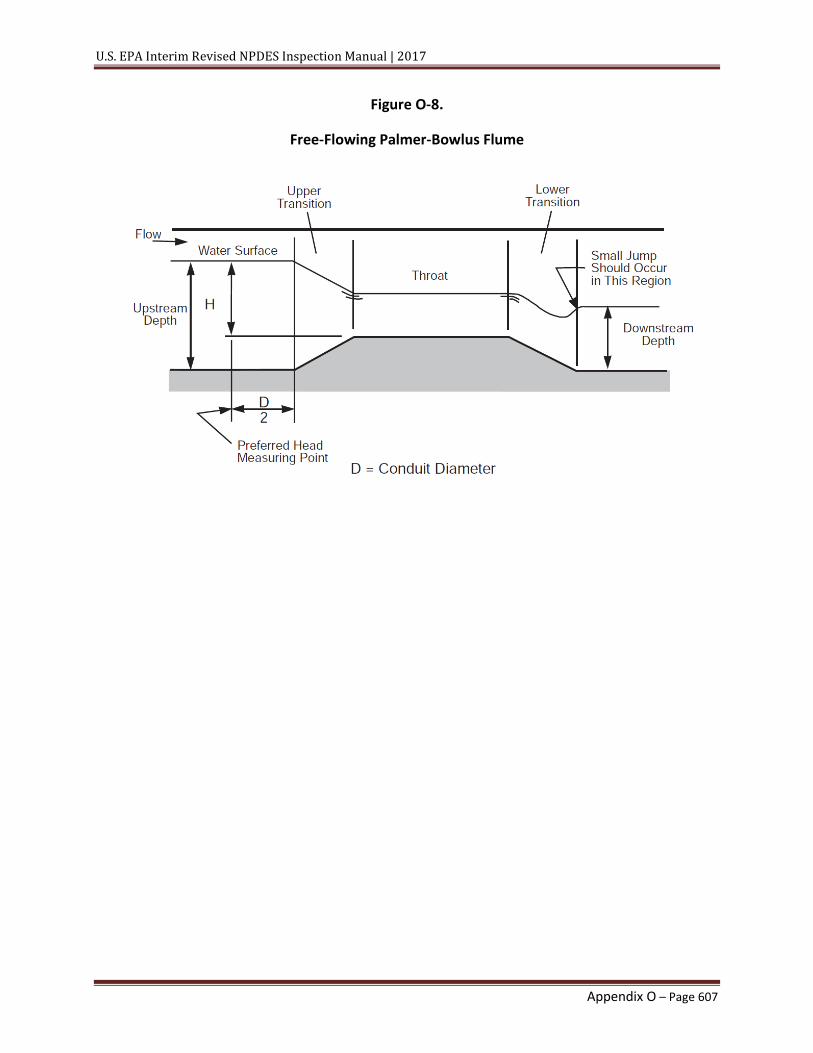
Palmer-Bowlus Flume. The Palmer-Bowlus flume is also composed of three sections: a converging upstream section, a contracted section or throat, and a diverging downstream section (Figure O-8). The upstream depth of the water (head) above the raised step in the throat is related to the discharge rate. The head should be measured at a distance d/2 upstream of the throat where d is the size (width) of the flume. The height of the step is usually unknown until the manufacturer's data are consulted, it is difficult to manually measure the height of water above the step at an upstream point. The dimensions for Palmer-Bowlus flumes are not standardized as they are for Parshall flumes. Therefore, no standard flow equation exists. Instead, rating curves are provided by manufacturers of Palmer-Bowlus flumes to relate the head to the discharge rate.

U.S. EPA Interim Revised NPDES Inspection Manual | 2017
Appendix O – Page 589
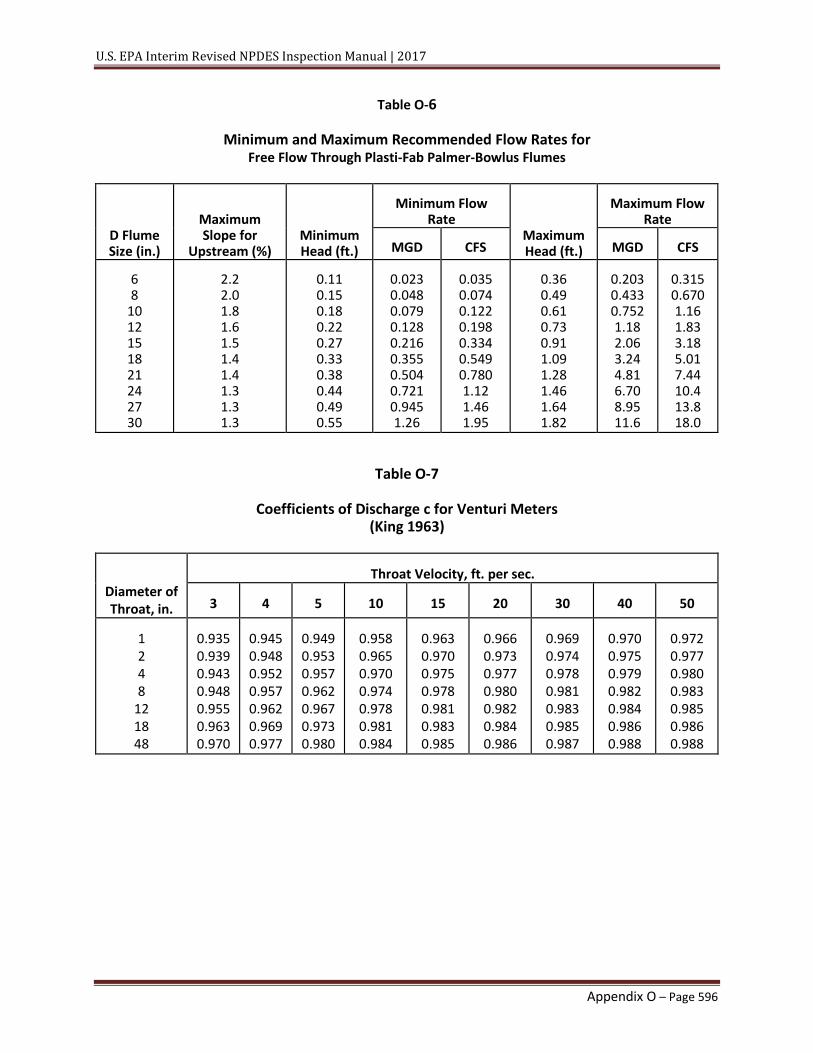
The flume must be installed with a minimum channel slope downstream to maintain critical flow through the flume and prevent the flume from becoming submerged. A small jump or rise in the water surface below the throat indicates that critical flow through the flume has probably occurred and submerged conditions do not exist. Accurate flow measurements can usually be obtained with upstream depths that are up to 95 percent of the pipe diameter. Table O-6 provides a table of the maximum slopes recommended for installation of Palmer-Bowlus flumes. Advantages of this type of flow measurement device are the following:
• It is easily installed in existing systems. • Head loss is insignificant. • Unit is self-cleaning.
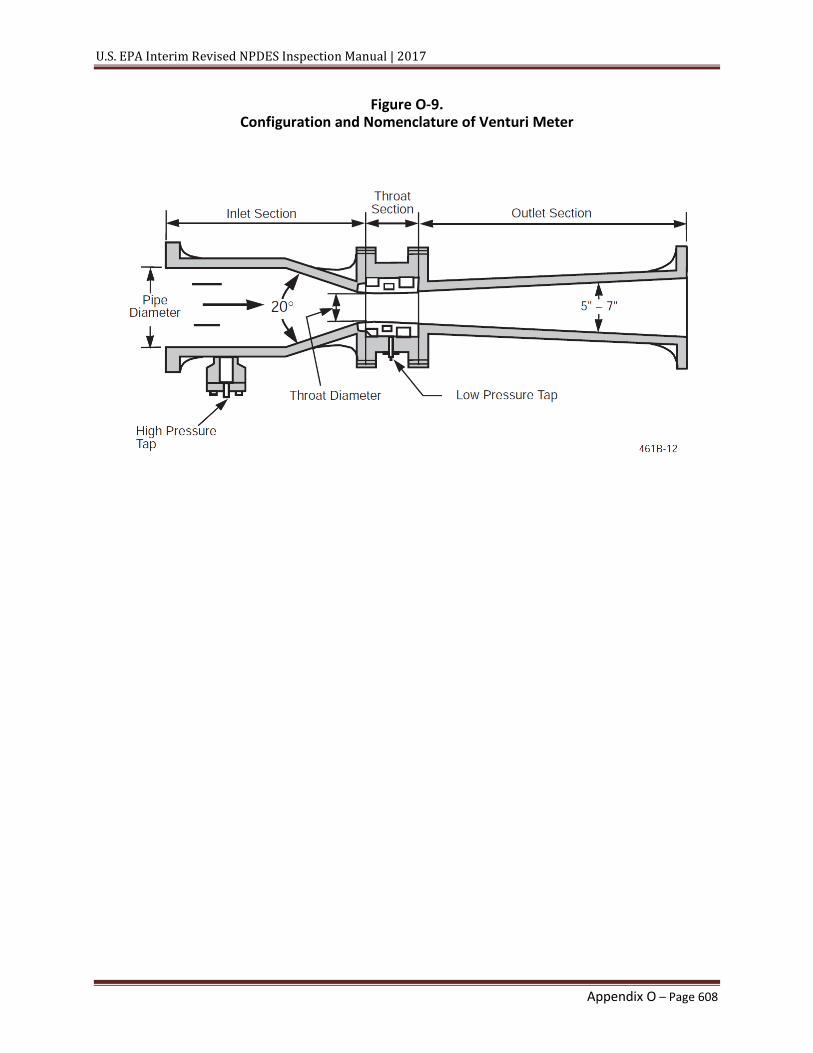
Venturi Meter. The Venturi (differential pressure) meter is one of the most accurate primary devices for measuring flow rates in pipes. The Venturi meter is basically a pipe segment consisting of an inlet section, a converging section, and a throat, along with a diverging outlet section as illustrated in Figure O-9. The water velocity is increased in the constricted portion of the inlet section resulting in a decrease in the static pressure. The pressure difference between the inlet pipe and the throat is proportional to the square of the flow. The pressure difference can easily be measured very accurately, resulting in an accurate flow measurement. An advantage of the Venturi meter is that it causes little pressure (head) loss. The formula for calculating the flow in a Venturi meter is as follows:
where Q = volume of water, in cubic feet per second
c = discharge coefficient, obtain from Table O-7. C varies with Reynold's number, meter surfaces, and installation
h1 = pressure head at center of pipe at inlet section, in feet of water h2 = pressure head at throat, in feet of water K = constant which relates d2 to d1 for Venturi meters. Obtain values of K
from Table O-8 or calculate according to the formula
where d2 = throat diameter, in feet
d1 = diameter of inlet pipe, in feet
Electromagnetic Flowmeter. The electromagnetic flowmeter operates according to Faraday's Law of Induction: the voltage induced by a conductor moving at right angles through a
AAQ = cKd22 h1 - h2 (King1963EE)
AAK = 4 2g
EE1 - [
d2d1
]4
EE
U.S. EPA Interim Revised NPDES Inspection Manual | 2017
Appendix O – Page 590
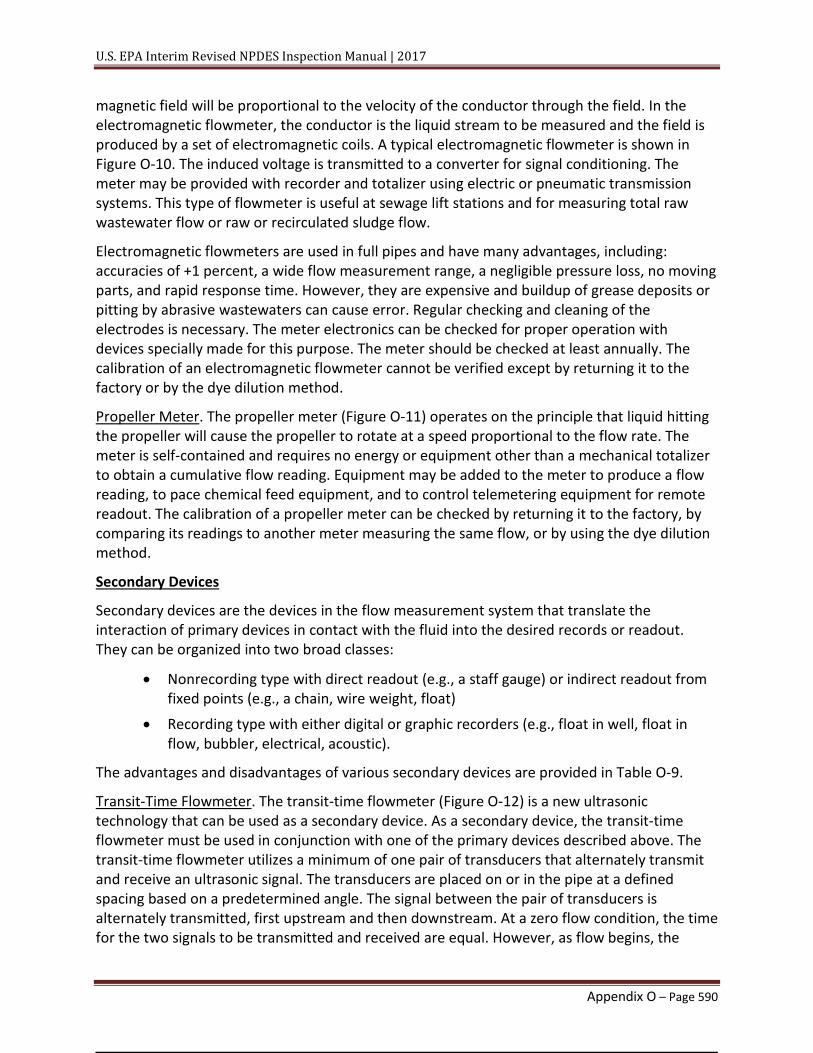
magnetic field will be proportional to the velocity of the conductor through the field. In the electromagnetic flowmeter, the conductor is the liquid stream to be measured and the field is produced by a set of electromagnetic coils. A typical electromagnetic flowmeter is shown in Figure O-10. The induced voltage is transmitted to a converter for signal conditioning. The meter may be provided with recorder and totalizer using electric or pneumatic transmission systems. This type of flowmeter is useful at sewage lift stations and for measuring total raw wastewater flow or raw or recirculated sludge flow.
Electromagnetic flowmeters are used in full pipes and have many advantages, including: accuracies of +1 percent, a wide flow measurement range, a negligible pressure loss, no moving parts, and rapid response time. However, they are expensive and buildup of grease deposits or pitting by abrasive wastewaters can cause error. Regular checking and cleaning of the electrodes is necessary. The meter electronics can be checked for proper operation with devices specially made for this purpose. The meter should be checked at least annually. The calibration of an electromagnetic flowmeter cannot be verified except by returning it to the factory or by the dye dilution method.
Propeller Meter. The propeller meter (Figure O-11) operates on the principle that liquid hitting the propeller will cause the propeller to rotate at a speed proportional to the flow rate. The meter is self-contained and requires no energy or equipment other than a mechanical totalizer to obtain a cumulative flow reading. Equipment may be added to the meter to produce a flow reading, to pace chemical feed equipment, and to control telemetering equipment for remote readout. The calibration of a propeller meter can be checked by returning it to the factory, by comparing its readings to another meter measuring the same flow, or by using the dye dilution method.
Secondary Devices
Secondary devices are the devices in the flow measurement system that translate the interaction of primary devices in contact with the fluid into the desired records or readout. They can be organized into two broad classes:
• Nonrecording type with direct readout (e.g., a staff gauge) or indirect readout from fixed points (e.g., a chain, wire weight, float)
• Recording type with either digital or graphic recorders (e.g., float in well, float in flow, bubbler, electrical, acoustic).
The advantages and disadvantages of various secondary devices are provided in Table O-9.
Transit-Time Flowmeter. The transit-time flowmeter (Figure O-12) is a new ultrasonic technology that can be used as a secondary device. As a secondary device, the transit-time flowmeter must be used in conjunction with one of the primary devices described above. The transit-time flowmeter utilizes a minimum of one pair of transducers that alternately transmit and receive an ultrasonic signal. The transducers are placed on or in the pipe at a defined spacing based on a predetermined angle. The signal between the pair of transducers is alternately transmitted, first upstream and then downstream. At a zero flow condition, the time for the two signals to be transmitted and received are equal. However, as flow begins, the

U.S. EPA Interim Revised NPDES Inspection Manual | 2017
Appendix O – Page 591
liquid’s flow velocity speeds up the signal in the up to downstream direction while slowing the signal in the down to upstream direction. The difference in time between the two signals is proportional to the liquid’s velocity. Knowing the liquid’s flow velocity and the pipe inner diameter area provides the instantaneous flow rate. The flowmeter provides analog and discrete outputs for remote recorder and totalization of flow.
Transit-time flowmeters are suitable for the typical range of liquids found in full pipe applications. The clamp-on nature of the meter allows for its installation without the need to shut down the existing line. Transit-time flowmeters are available in both permanent and portable configurations.
Pumps
Some wastewater facilities may need to measure flow by means of pumps in which discharge-versus-power relationships have been determined from measurements of the average output or input during a period in which discharge measurements were made. Suitable curves may be developed from these test data. When readily available from the manufacturer, pump curves may be used by the inspector to estimate flow.
Because of wear on pumps and uncertainty regarding actual discharge heads, pump curves at best only provide an estimate of the flow. Pump curves are not normally accurate enough to be used for NPDES permit discharge flow measurements. Pump curves have been used for determining large flows, such as the cooling water discharge from large steam electric power plants, where a high degree of accuracy was not necessary.

U.S. EPA Interim Revised NPDES Inspection Manual | 2017
Appendix O – Page 592
Table O-1
Head-Discharge Relationship Formulas for Nonsubmerged Weirs*
Weir Type
Contracted
Suppressed
Remarks
Reference
Rectangular
Francis formulas
Q = 3.33 (L - 0.1 nH)H1.5
Q = 3.33 L H1.5
Approach velocity neglected
King 1963
Q = 3.33 ((H + h)1.5-h1.5)(L - 0.1nH)
Q = 3.33 L((H + h)1.5 - h1.5)
Approach velocity considered
King 1963
Cipolletti
Q = 3.367 L H1.5
NA
Approach velocity neglected
King 1963
Q = 3.367 L (H + h)1.5 - h1.5
NA
Approach velocity considered
EPA 1973
V-notch
Formula for 90° V-notch only
Q = 2.50 H2.5
NA
Not appreciably affected by approach velocity
King 1963
Q = 3.01 HW2.48
NA
Head measured at weir plate
Eli and Peterson 1979 (EPA-61809A-2B)
Q = discharge in cubic feet
H = head in feet NA = not applicable HW = head in feet at weir plate n = number of end contractions
L = crest length in feet h = head in feet due to the approach velocity =
v2/2g V = approach velocity g = gravity (32.2 ft/sec2)
*Selection of a formula depends on its suitability and parameters under consideration.

U.S. EPA Interim Revised NPDES Inspection Manual | 2017
Appendix O – Page 593
Table O-2 Discharge of 90° V-Notch Weir—Head Measured at Weir Plate
Head@ Weir
in Feet
Flow Rate
in CFS
Head@
Weir in Feet
Flow Rate
in CFS
Head@
Weir in Feet
Flow Rate
in CFS
0.06 0.07 0.08 0.09 0.10
0.003 0.004 0.006 0.008 0.010
0.46 0.47 0.48 0.49 0.50
0.439 0.463 0.488 0.513 0.540
0.86 0.87 0.88 0.89 0.90
2.071 2.140 2.192 2.255 2.318
0.11 0.12 0.13 0.14 0.15
0.013 0.016 0.019 0.023 0.027
0.51 0.52 0.53 0.54 0.55
0.567 0.595 0.623 0.653 0.683
0.91 0.92 0.93 0.94 0.95
2.382 2.448 2.514 2.582 2.650
0.16 0.17 0.18 0.19 0.20
0.032 0.037 0.043 0.049 0.056
0.56 0.57 0.58 0.59 0.60
0.715 0.747 0.780 0.813 0.848
0.96 0.97 0.98 0.99 1.00
2.720 2.791 2.863 2.936 3.010
0.21 0.22 0.23 0.24 0.25
0.063 0.070 0.079 0.087 0.097
0.61 0.62 0.63 0.64 0.65
0.883 0.920 0.957 0.995 1.034
1.01 1.02 1.03 1.04 1.05
3.085 3.162 3.239 3.317 3.397
0.26 0.27 0.28 0.29 0.30
0.107 0.117 0.128 0.140 0.152
0.66 0.67 0.68 0.69 0.70
1.074 1.115 1.157 1.199 1.243
1.06 1.07 1.08 1.09 1.10
3.478 3.556 3.643 3.727 3.813
0.31 0.32 0.33 0.34 0.35
0.165 0.178 0.193 0.207 0.223
0.71 0.72 0.73 0.74 0.75
1.287 1.333 1.379 1.426 1.475
1.11 1.12 1.13 1.14 1.15
3.889 3.987 4.076 4.166 4.257
0.36 0.37 0.38 0.39 0.40
0.239 0.256 0.273 0.291 0.310
0.76 0.77 0.78 0.79 0.80
1.524 1.574 1.625 1.678 1.730
1.16 1.17 1.18 1.19 1.20
4.349 4.443 4.538 4.634 4.731
0.41 0.42 0.43 0.44 0.45
0.330 0.350 0.371 0.393 0.415
0.81 0.82 0.83 0.84 0.85
1.785 1.840 1.896 1.953 2.012
1.21 1.22 1.23 1.24 1.25
4.829 4.929 5.030 5.132 5.235
Equation Q = 3.01 Hw2.48,where Hw, head, is in feet at the weir and Q is in cubic feet per second.

U.S. EPA Interim Revised NPDES Inspection Manual | 2017
Appendix O – Page 594
Table O-3 Minimum and Maximum Recommended Flow Rates for Cipolletti Weirs
Crest
Length, ft.
Minimum Head, ft.
Minimum Flow Rate
Maximum Head, ft.
Maximum Flow Rate
MGD
CFS
MGD
CFS
1
1.5 2
2.5 3 4 5 6 8
10
0.2 0.2 0.2 0.2 0.2 0.2 0.2 0.2 0.2 0.2
0.195 0.292 0.389 0.487 0.584 0.778 0.973 0.17 0.56 1.95
0.301 0.452 0.602 0.753 0.903 1.20 1.51 1.81
2.413.01
0.5
0.75 1.0
1.25 1.5 2.0 2.5 3.0 4.0 5.0
0.769 2.12 4.35 7.60 12.0 24.6 43.0 67.8
139.0 243.0
1.19 3.28 6.73 11.8 18.6 38.1 66.5
105.0 214.0 375.0
Table O-4 Minimum and Maximum Recommended Flow Rates for Free Flow Through Parshall Flumes
Throat Width,
W
Minimum Head, ft.
Minimum Flow Rate
Maximum Head, ft.
Maximum Flow Rate
MGD
CFS
MGD
CFS
1 2 3 6 9 1
1.5 2 3 4 5 6 8
10 12
in. in. in. in. in. ft. ft. ft. ft. ft. ft. ft. ft. ft. ft.
0.07 0.07 0.10 0.10 0.10 0.10 0.10 0.15 0.15 0.20 0.20 0.25 0.25 0.30 0.33
0.003 0.007 0.018 0.035 0.05
0.078 0.112 0.273 0.397 0.816 1.00 1.70 2.23 3.71 5.13
0.005 0.011 0.028 0.054 0.091 0.120 0.174 0.423 0.615 1.26 1.55 2.63 3.45 5.74 7.93
0.60 0.60 1.5 1.5 2.0 2.5 2.5 2.5 2.5 2.5 2.5 2.5 2.5 3.5 4.5
0.099 0.198 1.20 2.53 5.73 10.4 15.9 21.4 32.6 43.9 55.3 66.9 90.1 189 335
0.153 0.306 1.86 3.91 8.87 16.1 24.6 33.1 50.4 67.9 85.6 103 139 292 519
U.S. EPA Interim Revised NPDES Inspection Manual | 2017
Appendix O – Page 595
Table O-5 Free-Flow Values of C and N for Parshall Flumes Based on the Relationship Q = CWHn (American Petroleum Institute 1969)
Flume Throat, W
C
n
Max. Q CFS
1 2 3 6 9 1
1.5 2 3 4 5 6 7 8
in. in. in. in. in. ft. ft. ft. ft. ft. ft. ft. ft. ft.
0.338 0.676 0.992 2.06 3.07 4W* 4W* 4W* 4W* 4W* 4W* 4W* 4W* 4W*
1.55 1.55 1.55 1.58 1.53
1.522W0.026 1.522W0.026 1.522W0.026 1.522W0.026 1.522W0.026 1.522W0.026 1.522W0.026 1.522W0.026 1.522W0.026
0.15 0.30 1.8 3.9 8.9
16.1 24.6 33.1 50.4 67.9 85.6
103.5 121.4 139.5
Where, W = Flume throat width
Q = Flow (CFS) C = Constant N = Constant H = Head upstream of the flume throat (feet) * = W should be represented in feet to calculate C
U.S. EPA Interim Revised NPDES Inspection Manual | 2017
Appendix O – Page 596
Table O-6
Minimum and Maximum Recommended Flow Rates for Free Flow Through Plasti-Fab Palmer-Bowlus Flumes
D Flume Size (in.)
Maximum Slope for
Upstream (%)
Minimum Head (ft.)
Minimum Flow
Rate
Maximum Head (ft.)
Maximum Flow
Rate
MGD
CFS MGD
CFS
6 8
10 12 15 18 21 24 27 30
2.2 2.0 1.8 1.6 1.5 1.4 1.4 1.3 1.3 1.3
0.11 0.15 0.18 0.22 0.27 0.33 0.38 0.44 0.49 0.55
0.023 0.048 0.079 0.128 0.216 0.355 0.504 0.721 0.945 1.26
0.035 0.074 0.122 0.198 0.334 0.549 0.780 1.12 1.46 1.95
0.36 0.49 0.61 0.73 0.91 1.09 1.28 1.46 1.64 1.82
0.203 0.433 0.752 1.18 2.06 3.24 4.81 6.70 8.95 11.6
0.315 0.670 1.16 1.83 3.18 5.01 7.44 10.4 13.8 18.0
Table O-7
Coefficients of Discharge c for Venturi Meters (King 1963)
Diameter of Throat, in.
Throat Velocity, ft. per sec.
3
4
5
10
15
20
30
40
50
1 2 4 8
12 18 48
0.935 0.939 0.943 0.948 0.955 0.963 0.970
0.945 0.948 0.952 0.957 0.962 0.969 0.977
0.949 0.953 0.957 0.962 0.967 0.973 0.980
0.958 0.965 0.970 0.974 0.978 0.981 0.984
0.963 0.970 0.975 0.978 0.981 0.983 0.985
0.966 0.973 0.977 0.980 0.982 0.984 0.986
0.969 0.974 0.978 0.981 0.983 0.985 0.987
0.970 0.975 0.979 0.982 0.984 0.986 0.988
0.972 0.977 0.980 0.983 0.985 0.986 0.988

U.S. EPA Interim Revised NPDES Inspection Manual | 2017
Appendix O – Page 597
Table O-8 Values of K in Formula for Venturi Meters (King 1963)
AA
d2
EEd1EE
K AA
d2
EEd1EE
K AA
d2
EEd1EE
K AA
d2
EEd1EE
K AA
d2
EEd1EE
K
0.20 0.21 0.22 0.23 0.24 0.25 0.26 0.27 0.28 0.29 0.30 0.31 0.32
6.31 6.31 6.31 6.31 6.31 6.31 6.31 6.32 6.32 6.32 6.33 6.33 6.33
0.33 0.34 0.35 0.36 0.37 0.38 0.39 0.40 0.41 0.42 0.43 0.44 0.45
6.34 6.34 6.35 6.35 6.36 6.37 6.37 6.38 6.39 6.40 6.41 6.42 6.43
0.46 0.47 0.48 0.49 0.50 0.51 0.52 0.53 0.54 0.55 0.56 0.57 0.58
6.45 6.46 6.47 6.49 6.51 6.52 6.54 6.54 6.59 6.61 6.64 6.66 6.69
0.59 0.60 0.61 0.62 0.63 0.64 0.65 0.66 0.67 0.68 0.69 0.70 0.71
6.72 6.75 6.79 6.82 6.86 6.91 6.95 7.00 7.05 7.11 7.17 7.23 7.30
0.72 0.73 0.74 0.75 0.76 0.77 0.78 0.79 0.80 0.81 0.82 0.83 0.84
7.37 7.45 7.53 7.62 7.72 7.82 7.94 8.06 8.20 8.35 8.51 8.69 8.89

U.S. EPA Interim Revised NPDES Inspection Manual | 2017
Appendix O – Page 598
Table O-9 Advantages and Disadvantages of Secondary Devices
Device
Advantages
Disadvantages Hook Gauge
Common
Requires training to use, easily damaged
Stage Board
Common
Needs regular cleaning, difficult to read top of meniscus
Pressure Measurement a. Pressure Bulb b. Bubbler Tube
Since no compressed air is used, source can be linked directly to sampler Self-cleaning, less expensive, reliable
Openings can clog, expensive Needs compressed air or another air source
Float
Inexpensive, reliable
Catches debris, requires frequent cleaning to prevent sticking and changing buoyancy, and corroding hinges
Dipper
Quite reliable, easy to operate
Oil and grease foul probe, causing possible sensor loss
Ultrasonic
No electrical or mechanical contact
Errors from heavy turbulence and foam, calibration procedure is more involved than for other devices

U.S. EPA Interim Revised NPDES Inspection Manual | 2017
Appendix O – Page 599
Figure O-1.
Profile and Nomenclature of Sharp-Crested Weirs
(Associated Water and Air Resource Engineers, Inc., 1973)

U.S. EPA Interim Revised NPDES Inspection Manual | 2017
Appendix O – Page 600
Figure O-2.
Three Common Types of Sharp-Crested Weirs (Associated Water and Air Resource Engineers, Inc., 1973)
U.S. EPA Interim Revised NPDES Inspection Manual | 2017
Appendix O – Page 601
Figure O-3.
Flow Rates for 60° and 90° V-Notch Weirs (Associated Water and Resource Engineers, Inc., 1973)
U.S. EPA Interim Revised NPDES Inspection Manual | 2017
Appendix O – Page 602
Figure O-4.
Nomograph for Capacity of Rectangular Weirs (Associated Water and Air Resource Engineers, Inc., 1973)

U.S. EPA Interim Revised NPDES Inspection Manual | 2017
Appendix O – Page 603
Figure O-5.
Flow Curves for Parshall Flumes (Associated Water and Air Resource Engineers, Inc., 1973)

U.S. EPA Interim Revised NPDES Inspection Manual | 2017
Appendix O – Page 604
Figure O-6.
Dimensions and Capacities of Parshall Measuring Flumes for Various Throat Widths (Associated Water and Air Resource Engineers, Inc., 1973)

U.S. EPA Interim Revised NPDES Inspection Manual | 2017
Appendix O – Page 605
Figure O-6. Dimensions and Capacities of Parshall Measuring Flumes for Various Throat Widths
(continued)

U.S. EPA Interim Revised NPDES Inspection Manual | 2017
Appendix O – Page 606
Figure O-7.
Effect of Submergence on Parshall Flume Free Discharge (Civil Engineering, ASCE)
U.S. EPA Interim Revised NPDES Inspection Manual | 2017
Appendix O – Page 607
Figure O-8.
Free-Flowing Palmer-Bowlus Flume
U.S. EPA Interim Revised NPDES Inspection Manual | 2017
Appendix O – Page 608
Figure O-9. Configuration and Nomenclature of Venturi Meter

U.S. EPA Interim Revised NPDES Inspection Manual | 2017
Appendix O – Page 609
Figure O-10. Electromagnetic Flowmeter

U.S. EPA Interim Revised NPDES Inspection Manual | 2017
Appendix O – Page 610
Figure O-11. Propeller Flowmeter

U.S. EPA Interim Revised NPDES Inspection Manual | 2017
Appendix O – Page 611
Figure O-12. Transit-Time Flowmeter