Embed Size (px)
Citation preview

April 30, 2011
Page 1 of 66
Toby Hansen’s
April 2011 Newsletter

April 30, 2011
Page 2 of 66
Table of Contents Page 1. QE3 or not QE3: That is the Question. 3 2. Dow, NASDAQ and S&P 500 Charts 9 3. Precious Metals Market 13 4. Precious Metal Stock Analysis 20 5. Suggested Stocks 24 A. Gold Producer 25 B. Silver Producers 26 C. Junior Explorers 28 E. Stock Deletions 29 5. Reader Recommended Stocks 32 6. Final Thoughts 62 7. Appendix
I. Buying Physical Gold & Silver 64 II. Recommended Investment Books 66

April 30, 2011
Page 3 of 66
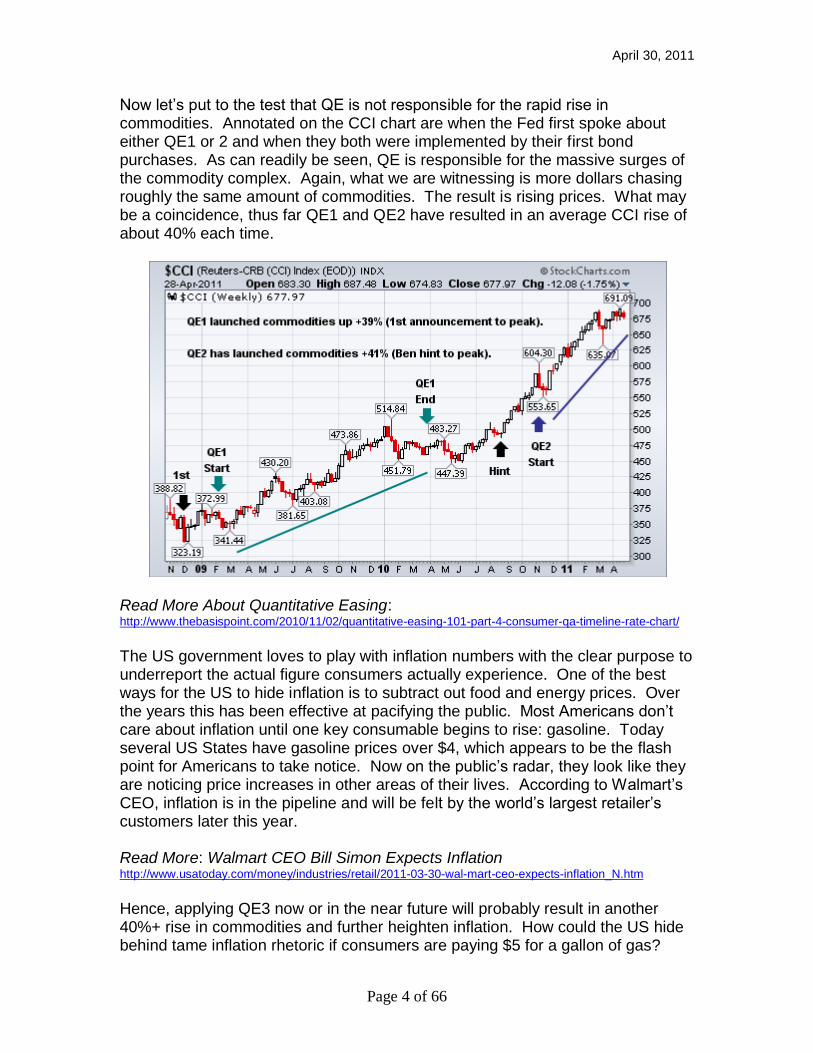
QE3 or not QE3: That is the Question. In the December Newsletter, it was pointed out the actions of the US Federal Reserve are more important than market fundamentals; for the moment. We now see from hindsight that when the US stock market gets to a point of a serious pull back that the US Fed is there to print money. Bernanke‟s well timed hint at the end of August of last year of QE2 has underscored the massive rallies in both stocks and commodities to date. The US economy has certainly improved from the abyss in early 2009 due to the first two rounds of quantitative easing. However, in light of the $700 Billion Tarp program, the $1.4 Trillion QE 1 and QE2 bond purchases, and the $2.5 Trillion in US government borrowing to maintain and increase spending for the last two years at a near zero percent Fed funds rate environment; Is this the best the US economy can do? Economic data ranging from consumer confidence to manufacturing indexes to GDP are now softening. Last week US Q1, GDP was reported at 1.8% with the usual under-reported price index of 1.9%. The number is supposed to reflect an inflation rate that is subtracted from the gross GDP figure to arrive at the reported real GDP. GDP had significantly dropped from the 3.1% figure of Q4, 2010. There is no question that the US Fed will have to continue money printing to buoy the US economy and provide artificial demand to cover the enormous US budget deficit running at roughly ~$1.5 Trillion. The big question is when the third QE program will take place. Some pundits and stock market bulls are clamoring for QE3 to take place soon so the stock market rally will continue unabated. We will argue that QE3 will not be hinted at by the US Fed as Bernanke did last August or executed into action until late 2011 or the first quarter of 2012. The primary reasons are two-fold: inflation and the US dollar. One nasty side effect of money printing as many countries have experienced is inflation. Simply put, more currency in circulation chasing the same number of goods and services results in a price rise of those goods and services. The US Fed has long held that inflation would be little impacted by its campaign of printing money for the purchase of US Treasury debt. This is the same Fed that says the rapid rise in commodity prices is not a result of their money printing scheme. The following chart is the Continuous Commodity Index from late 2009. The index comprises of 17 commodities having an equal weighting of 5.88%. It gives the observer a general idea of how commodities have been impacted by various events over the years. Read More: Understanding the Continuous Commodity Index http://commodities.about.com/od/understandingthebasics/a/cci-index.htm
April 30, 2011
Page 4 of 66
Now let‟s put to the test that QE is not responsible for the rapid rise in commodities. Annotated on the CCI chart are when the Fed first spoke about either QE1 or 2 and when they both were implemented by their first bond purchases. As can readily be seen, QE is responsible for the massive surges of the commodity complex. Again, what we are witnessing is more dollars chasing roughly the same amount of commodities. The result is rising prices. What may be a coincidence, thus far QE1 and QE2 have resulted in an average CCI rise of about 40% each time.
Read More About Quantitative Easing: http://www.thebasispoint.com/2010/11/02/quantitative-easing-101-part-4-consumer-qa-timeline-rate-chart/
The US government loves to play with inflation numbers with the clear purpose to underreport the actual figure consumers actually experience. One of the best ways for the US to hide inflation is to subtract out food and energy prices. Over the years this has been effective at pacifying the public. Most Americans don‟t care about inflation until one key consumable begins to rise: gasoline. Today several US States have gasoline prices over $4, which appears to be the flash point for Americans to take notice. Now on the public‟s radar, they look like they are noticing price increases in other areas of their lives. According to Walmart‟s CEO, inflation is in the pipeline and will be felt by the world‟s largest retailer‟s customers later this year. Read More: Walmart CEO Bill Simon Expects Inflation http://www.usatoday.com/money/industries/retail/2011-03-30-wal-mart-ceo-expects-inflation_N.htm
Hence, applying QE3 now or in the near future will probably result in another 40%+ rise in commodities and further heighten inflation. How could the US hide behind tame inflation rhetoric if consumers are paying $5 for a gallon of gas?
April 30, 2011
Page 5 of 66
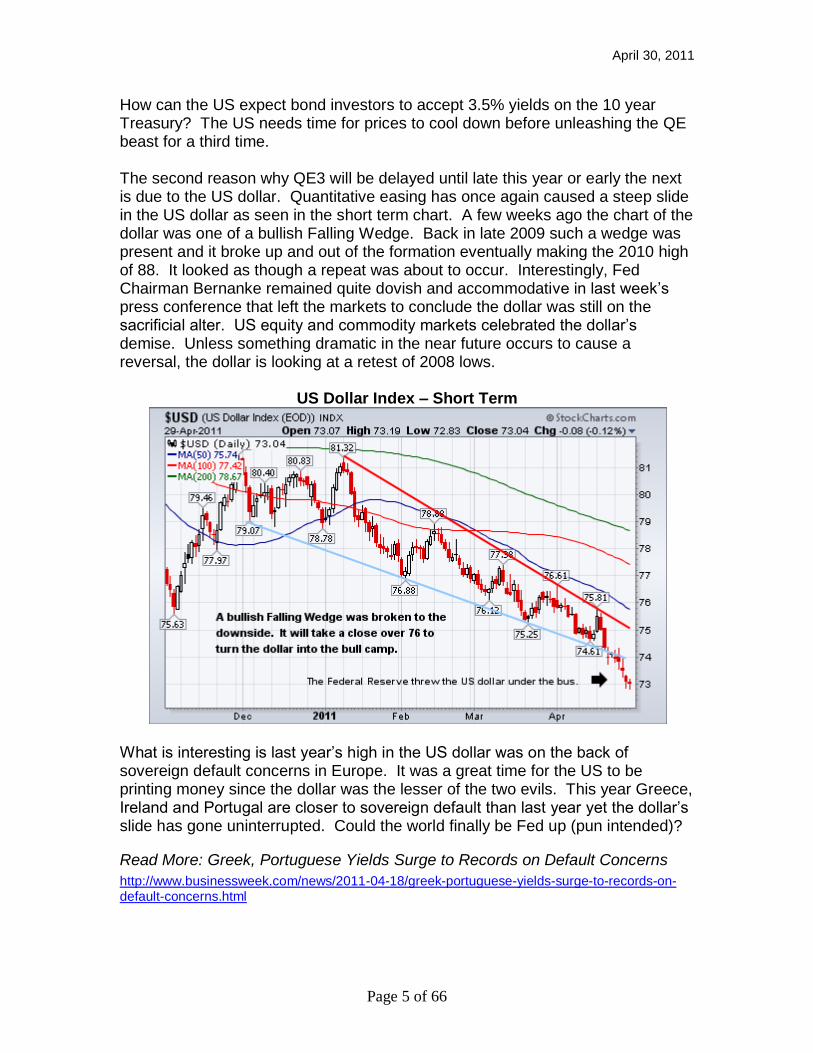
How can the US expect bond investors to accept 3.5% yields on the 10 year Treasury? The US needs time for prices to cool down before unleashing the QE beast for a third time. The second reason why QE3 will be delayed until late this year or early the next is due to the US dollar. Quantitative easing has once again caused a steep slide in the US dollar as seen in the short term chart. A few weeks ago the chart of the dollar was one of a bullish Falling Wedge. Back in late 2009 such a wedge was present and it broke up and out of the formation eventually making the 2010 high of 88. It looked as though a repeat was about to occur. Interestingly, Fed Chairman Bernanke remained quite dovish and accommodative in last week‟s press conference that left the markets to conclude the dollar was still on the sacrificial alter. US equity and commodity markets celebrated the dollar‟s demise. Unless something dramatic in the near future occurs to cause a reversal, the dollar is looking at a retest of 2008 lows.
US Dollar Index – Short Term
What is interesting is last year‟s high in the US dollar was on the back of sovereign default concerns in Europe. It was a great time for the US to be printing money since the dollar was the lesser of the two evils. This year Greece, Ireland and Portugal are closer to sovereign default than last year yet the dollar‟s slide has gone uninterrupted. Could the world finally be Fed up (pun intended)?
Read More: Greek, Portuguese Yields Surge to Records on Default Concerns
http://www.businessweek.com/news/2011-04-18/greek-portuguese-yields-surge-to-records-on-default-concerns.html

April 30, 2011
Page 6 of 66
The next two charts are medium and long term durations of the US dollar index. The last two times the US Fed has either announced or hinted at quantitative easing the USDX was above 80. Following the actual execution of purchasing US debt with printed money the dollar fell strongly. Announcing QE3 or hinting of its arrival where the US dollar resides today would easily push the US dollar to all-time lows below 70.
US Dollar Index – Medium Term
US Dollar Index – Long Term
April 30, 2011
Page 7 of 66
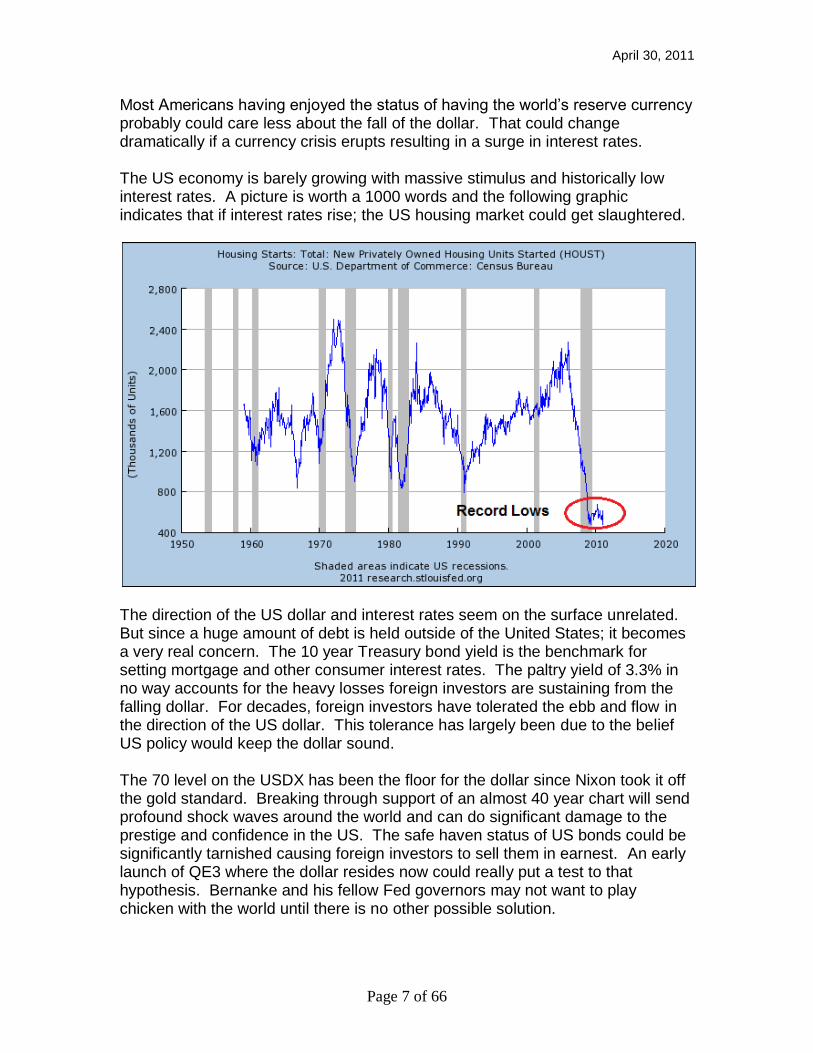
Most Americans having enjoyed the status of having the world‟s reserve currency probably could care less about the fall of the dollar. That could change dramatically if a currency crisis erupts resulting in a surge in interest rates. The US economy is barely growing with massive stimulus and historically low interest rates. A picture is worth a 1000 words and the following graphic indicates that if interest rates rise; the US housing market could get slaughtered.
The direction of the US dollar and interest rates seem on the surface unrelated. But since a huge amount of debt is held outside of the United States; it becomes a very real concern. The 10 year Treasury bond yield is the benchmark for setting mortgage and other consumer interest rates. The paltry yield of 3.3% in no way accounts for the heavy losses foreign investors are sustaining from the falling dollar. For decades, foreign investors have tolerated the ebb and flow in the direction of the US dollar. This tolerance has largely been due to the belief US policy would keep the dollar sound. The 70 level on the USDX has been the floor for the dollar since Nixon took it off the gold standard. Breaking through support of an almost 40 year chart will send profound shock waves around the world and can do significant damage to the prestige and confidence in the US. The safe haven status of US bonds could be significantly tarnished causing foreign investors to sell them in earnest. An early launch of QE3 where the dollar resides now could really put a test to that hypothesis. Bernanke and his fellow Fed governors may not want to play chicken with the world until there is no other possible solution.

April 30, 2011
Page 8 of 66
The next chart is a reminder of what the 10 year yield looks like over the last four years. Artificial demand created by the US Fed has kept interest rates under 4%; out of the danger zone of pushing up consumer interest rates.
It is almost a universal consensus that QE3 must happen. The timing of its occurrence is essential in determining what direction markets will take between now and then. The case has been laid out for why the US Fed will not announce QE3 in the near term. Should they resume QE3 or hint at it shortly after QE2 is finished it will stoke the flames of inflation and place the US dollar in unknown territory. Pausing quantitative easing until late this year will give the markets time to cool off commodities, inflationary pressures and allow the US dollar to gain strength before the third round. A long pause between QE2 and QE3 has a good chance of resulting in a pull back in stocks and commodities; the beneficiaries of QE. A falling market will get the masses to scream for the need of QE3 and hence, give the Fed cover that their actions were needed. Since markets seem to rise for a good year after QE is announced (or hinted), a late 2011 early 2012 announcement could have the markets rallying strongly through the important November 2012 election.

April 30, 2011
Page 9 of 66
Dow, NASDAQ and S&P 500 Charts
It is quite obvious that the US strategy to fight deflationary forces that were unleashed in 2008 is by inflating asset prices. The printing of money has been able to keep bond yields low and sustain the flow of money into paper assets. The so called “Bernanke Put” has given Wall Street near zero risk environment as they can rely on the Fed to print when equities get in trouble. The case in point was the “hint” of QE2.0 last August, which turned a tired, ready to fall market into the rampant bull we see today. As mentioned earlier, there appears to be cracks in the money printing scheme in that the US dollar is falling even though the EU has 2 – 4 members closing in on sovereign default. The willingness of foreign investors to hang on to their US investments, whether they are stocks or bonds, depends on investment gains exceeding foreign exchange losses. The next chart is the Dow Jones adjusted for the strength of the Euro. Note that a European investor has not made money invested in the Dow in 2011 yet their US equivalent is up 12%.
Dow Jones in Euros
Managed markets limit the usefulness of technical (chart) analysis. However, charts do show key price levels that must be respected in their importance. This section contains charts showing specific levels where the markets should find support or resistance.
April 30, 2011
Page 10 of 66
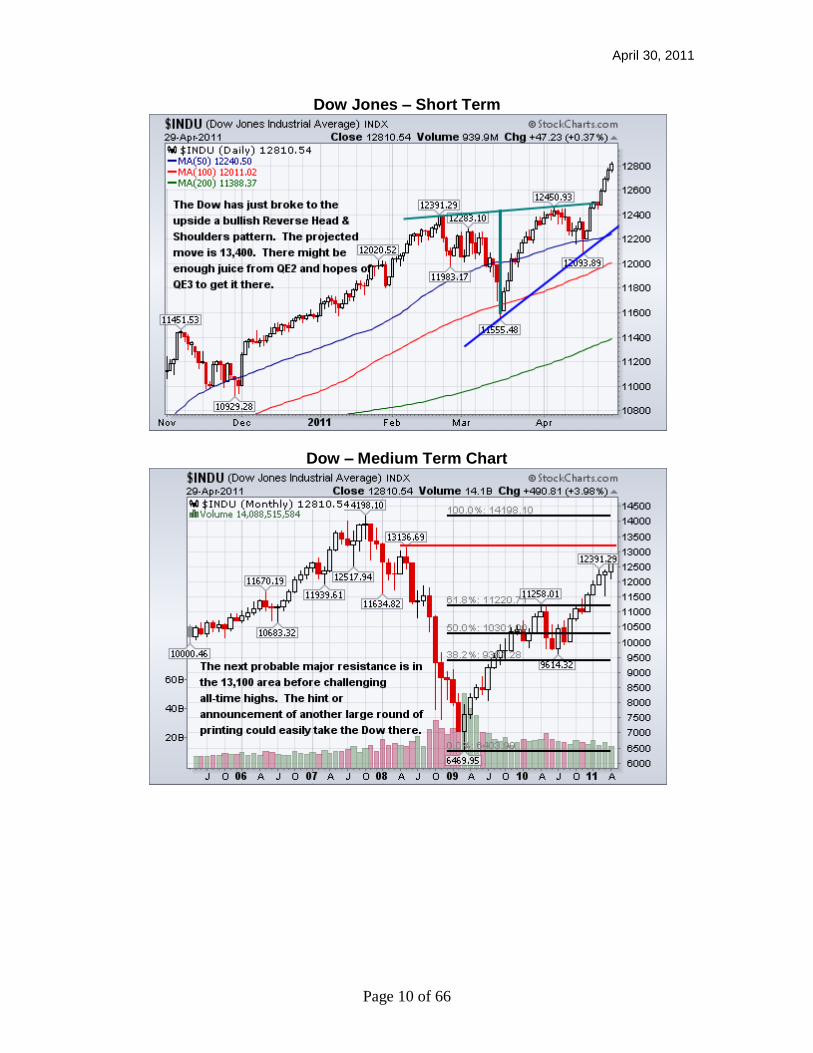
Dow Jones – Short Term
Dow – Medium Term Chart
April 30, 2011
Page 11 of 66
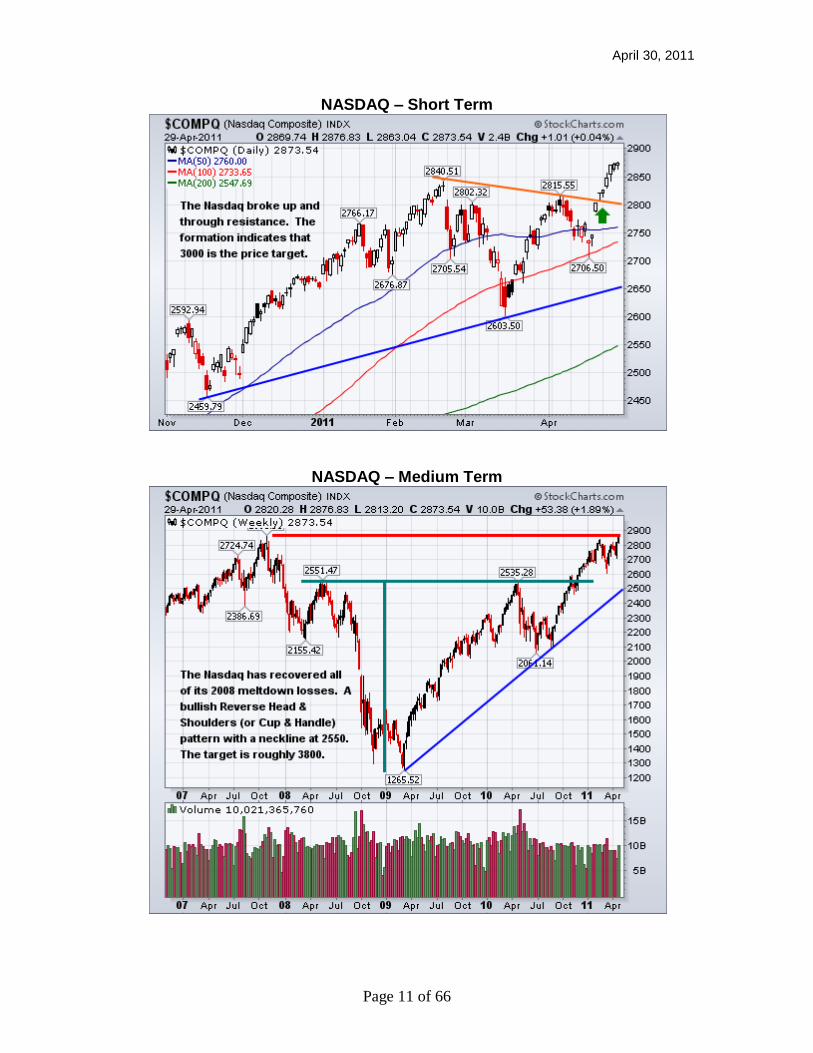
NASDAQ – Short Term
NASDAQ – Medium Term
April 30, 2011
Page 12 of 66
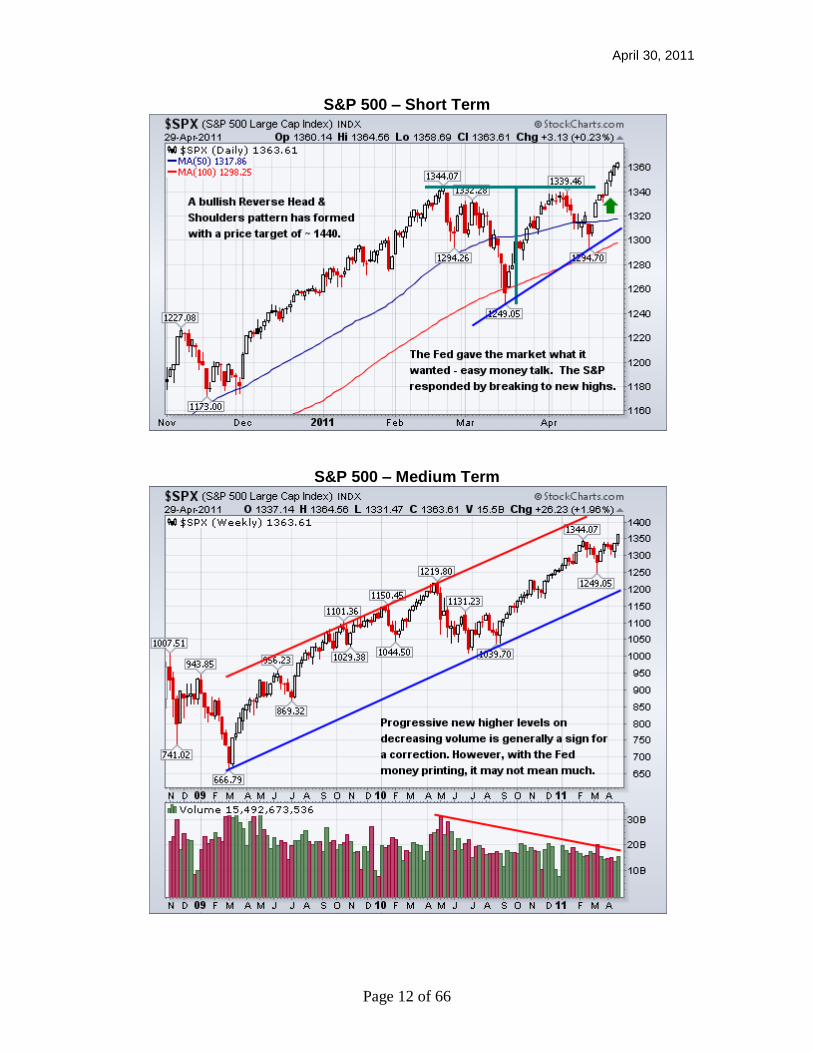
S&P 500 – Short Term
S&P 500 – Medium Term

April 30, 2011
Page 13 of 66
Precious Metals Market Last time it was suspected that the PM market was over-extended and was due for a correction, which we saw in January. Gold promptly fell from $1420 to a low of $1310 and almost reached its 200 dma. This is just what the doctor ordered as it allowed the market to cool off its over-heated condition and create an environment for the bulls to take over. Gold managed to recoup its early losses for the year then ran into tough resistance to early April. In classic trading fashion gold surged through that resistance, retested it and then soared.
Gold Futures – Short Term
There was a powerful mixture of the US dollar declining steeply and silver rocketing in the month of April that resulted in gold surging an astounding $130. Gold now is again in over-bought territory and in the early stages of having its price chart turn from healthy push, consolidate, repeat to one of parabolic features. Parabolic price moves are not sustainable and often result in spectacular gains but also bull psychology shattering declines. History is replete with examples of commodities, stocks and market indexes “going parabolic” with their destructive aftermath (e.g. 1980 gold/silver, Nasdaq year 2000).
April 30, 2011
Page 14 of 66
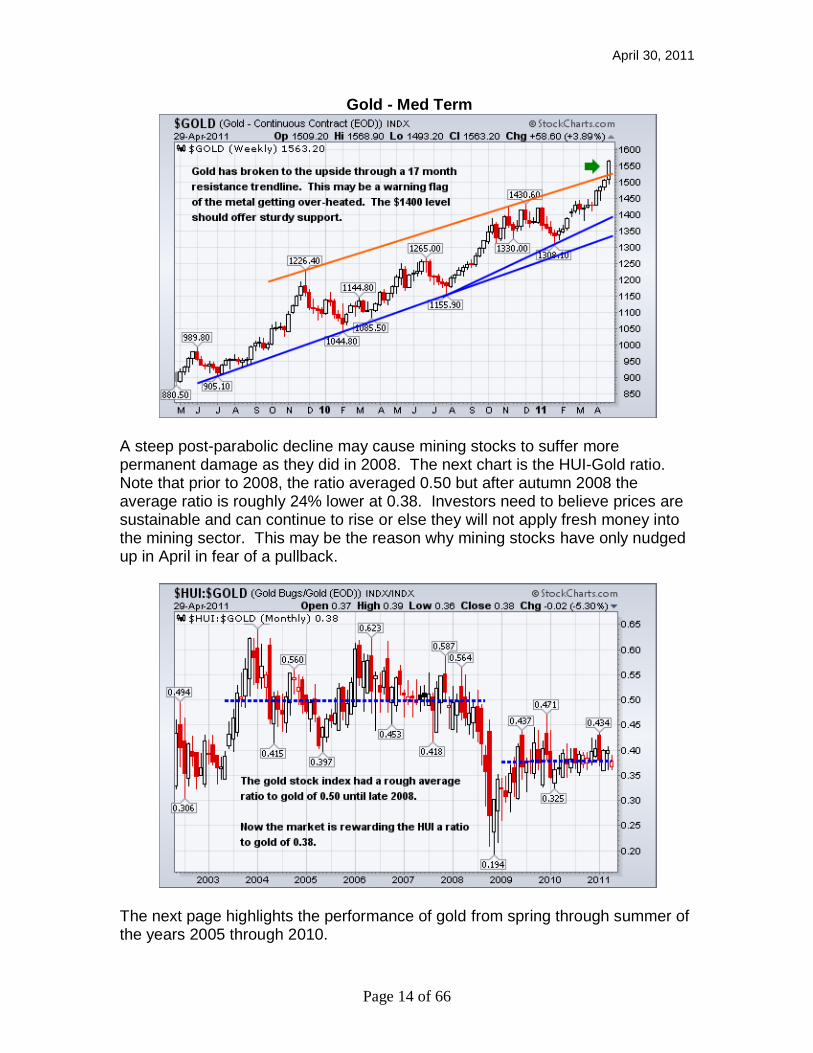
Gold - Med Term
A steep post-parabolic decline may cause mining stocks to suffer more permanent damage as they did in 2008. The next chart is the HUI-Gold ratio. Note that prior to 2008, the ratio averaged 0.50 but after autumn 2008 the average ratio is roughly 24% lower at 0.38. Investors need to believe prices are sustainable and can continue to rise or else they will not apply fresh money into the mining sector. This may be the reason why mining stocks have only nudged up in April in fear of a pullback.
The next page highlights the performance of gold from spring through summer of the years 2005 through 2010.

April 30, 2011
Page 15 of 66
Gold Seasonal Performance: April – August 31.
April 30, 2011
Page 16 of 66
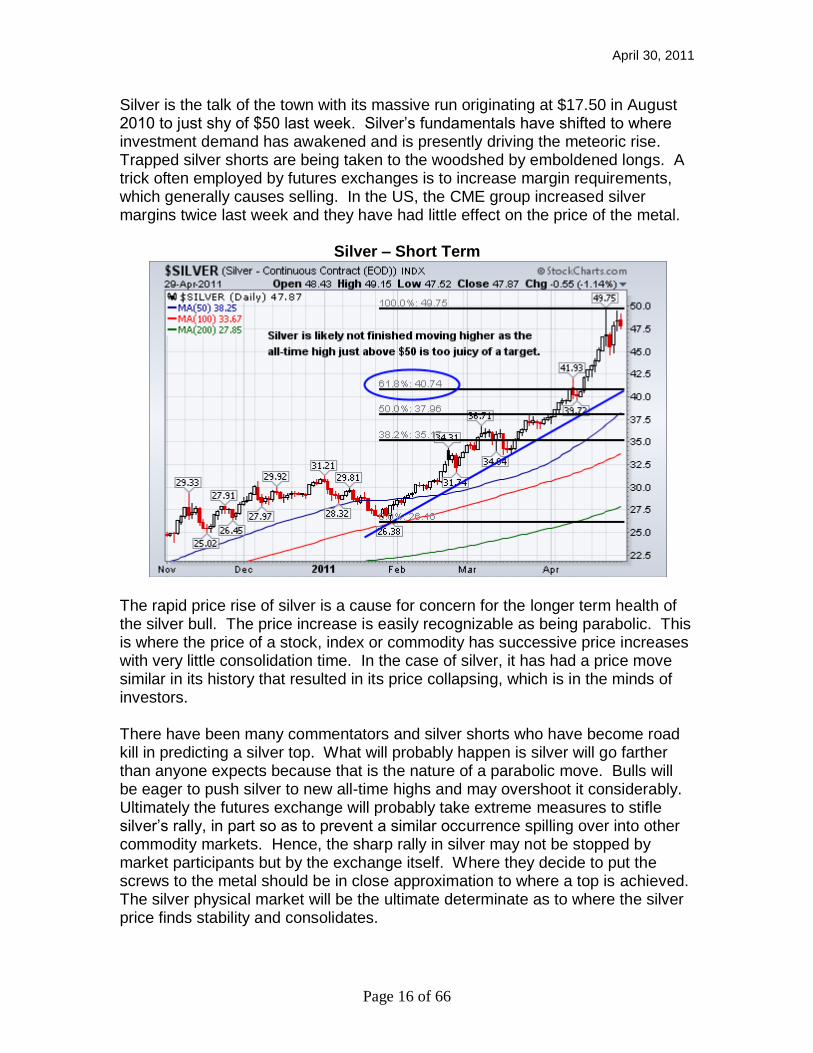
Silver is the talk of the town with its massive run originating at $17.50 in August 2010 to just shy of $50 last week. Silver‟s fundamentals have shifted to where investment demand has awakened and is presently driving the meteoric rise. Trapped silver shorts are being taken to the woodshed by emboldened longs. A trick often employed by futures exchanges is to increase margin requirements, which generally causes selling. In the US, the CME group increased silver margins twice last week and they have had little effect on the price of the metal.
Silver – Short Term
The rapid price rise of silver is a cause for concern for the longer term health of the silver bull. The price increase is easily recognizable as being parabolic. This is where the price of a stock, index or commodity has successive price increases with very little consolidation time. In the case of silver, it has had a price move similar in its history that resulted in its price collapsing, which is in the minds of investors. There have been many commentators and silver shorts who have become road kill in predicting a silver top. What will probably happen is silver will go farther than anyone expects because that is the nature of a parabolic move. Bulls will be eager to push silver to new all-time highs and may overshoot it considerably. Ultimately the futures exchange will probably take extreme measures to stifle silver‟s rally, in part so as to prevent a similar occurrence spilling over into other commodity markets. Hence, the sharp rally in silver may not be stopped by market participants but by the exchange itself. Where they decide to put the screws to the metal should be in close approximation to where a top is achieved. The silver physical market will be the ultimate determinate as to where the silver price finds stability and consolidates.
April 30, 2011
Page 17 of 66
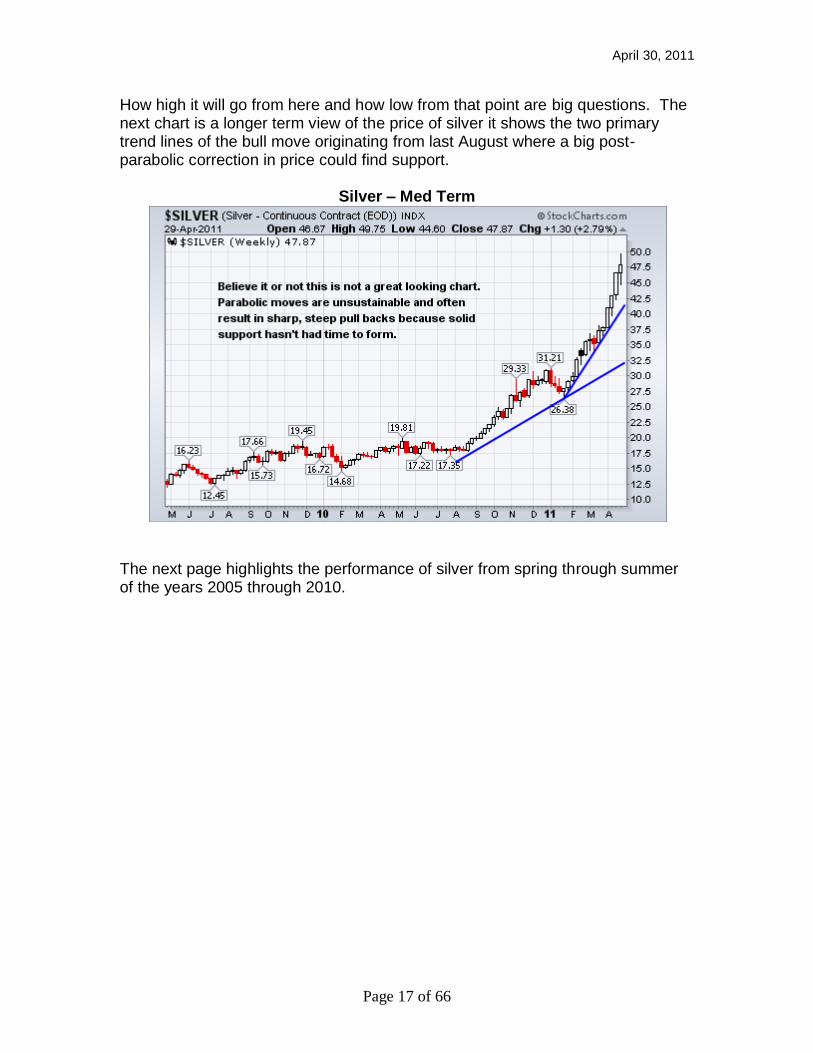
How high it will go from here and how low from that point are big questions. The next chart is a longer term view of the price of silver it shows the two primary trend lines of the bull move originating from last August where a big post-parabolic correction in price could find support.
Silver – Med Term
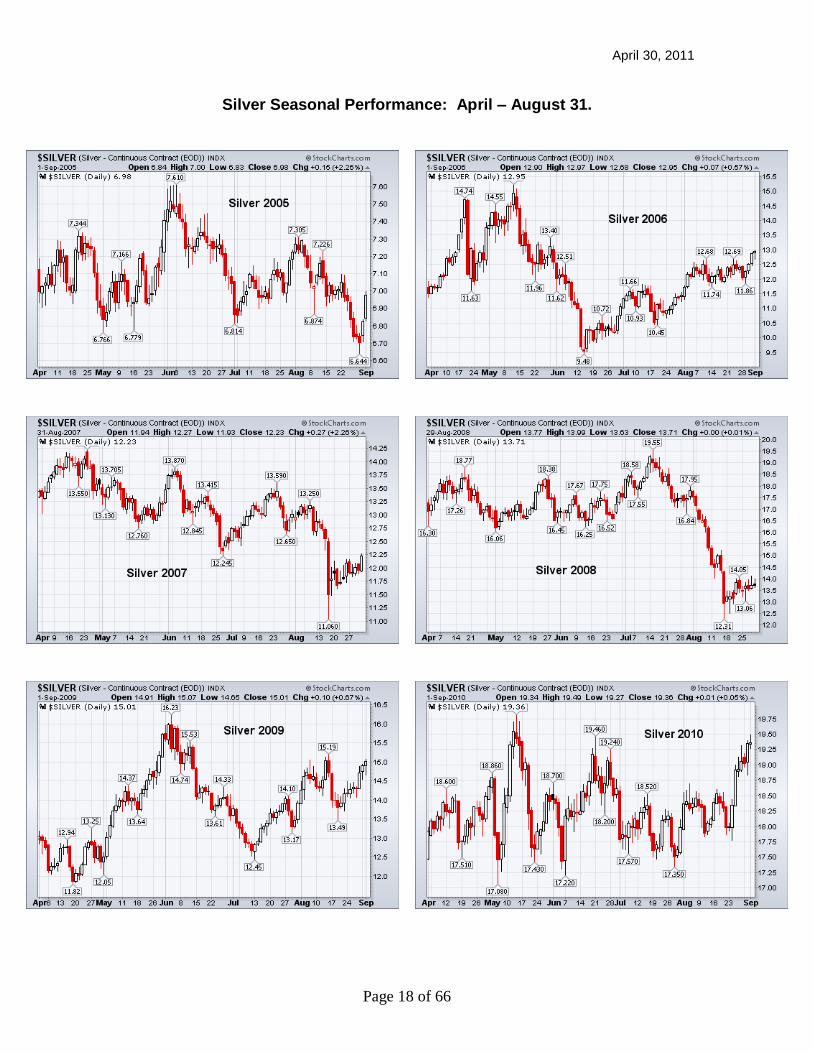
The next page highlights the performance of silver from spring through summer of the years 2005 through 2010.
April 30, 2011
Page 18 of 66
Silver Seasonal Performance: April – August 31.

April 30, 2011
Page 19 of 66
Platinum has been relatively uninspired since January 2010. The recent massive surges are getting the metal‟s attention. This precious metal is highly dependent upon the automotive market, which could be negatively impacted by Japan‟s reduced supply of parts due to the recent Tsunami.
Palladium last year was the red hot precious metal but this year‟s underperformer. Palladium had a bearish Rising Wedge formation Q4, 2010 indicating a correction was coming. The metal has now corrected working off its over-bought condition and is looking very healthy contained in a bullish Channel. A close over $860 could mean palladium wants to find $1000.
April 30, 2011
Page 20 of 66
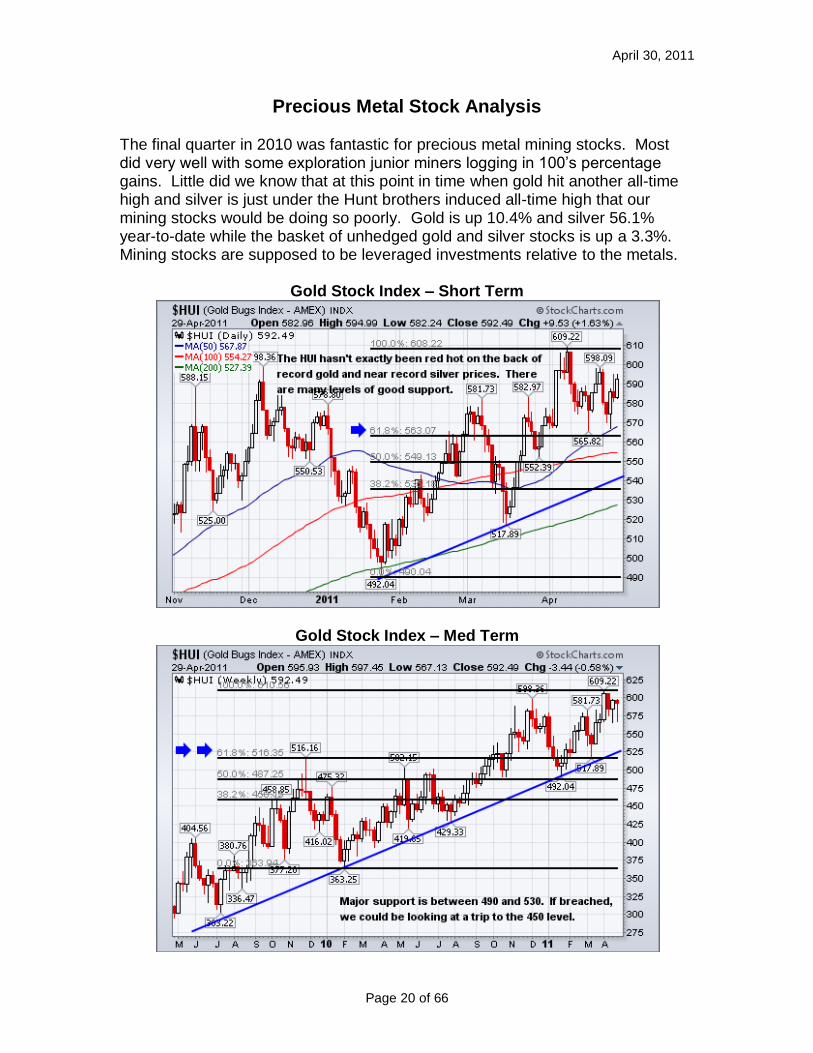
Precious Metal Stock Analysis
The final quarter in 2010 was fantastic for precious metal mining stocks. Most did very well with some exploration junior miners logging in 100‟s percentage gains. Little did we know that at this point in time when gold hit another all-time high and silver is just under the Hunt brothers induced all-time high that our mining stocks would be doing so poorly. Gold is up 10.4% and silver 56.1% year-to-date while the basket of unhedged gold and silver stocks is up a 3.3%. Mining stocks are supposed to be leveraged investments relative to the metals.
Gold Stock Index – Short Term
Gold Stock Index – Med Term

April 30, 2011
Page 21 of 66
The following long term chart of the HUI shows quite starkly the muted response of the index relative to a 50% move higher in gold. The index has only risen 1/3rd as much. One interesting observation is that most senior gold producer stocks have been stagnant since gold crossed $600. Now it appears that even mid-tier producers are having a tough time attracting investor interest. It appears that only small cap miners with aggressive production profiles or undiscovered explorers who find valuable ore bodies are poised to reward investors handsomely.
Gold Stock Index – Long Term
Junior exploration resource companies as a group had a spectacular Q4, 2010. Unfortunately just like the gold and silver producer crowd, 2011 has been a bust for the group. The following chart is the primary index for the junior explorer sector. Junior resource companies are actually down YTD. The index has been stopped cold at the last major Fibonacci retracement line. It looks like investors are unwilling to risk capital.

April 30, 2011
Page 22 of 66
Canadian Venture Exchange Index
On the next page is the 2011 YTD performance of selected gold and silver miners. The tables have either the gold or silver performance highlighted. The primary reason we invest in mining stocks is we are willing to accept all of the operational risks miners have with the expectation a higher capital investment return will be realized. What the data shows for both gold and silver producing mining stocks is that few yield returns in excess of the metal. In fact, the majority of the miners have lagged behind. Hence in 2011, investors in the gold and silver sector largely have been better off sticking with the metal. There are two points to be made by presenting the YTD data for both gold and silver miners. The first is that we have to be highly selective in what stocks we chose to invest in. The second is the mining equities sector looks poised to fall significantly if the underlying metals undergo a strong correction. Over the years of commenting on mining stocks, those stocks that are weak in a positive environment usually fall precipitously when the environment turns south.
April 30, 2011
Page 23 of 66
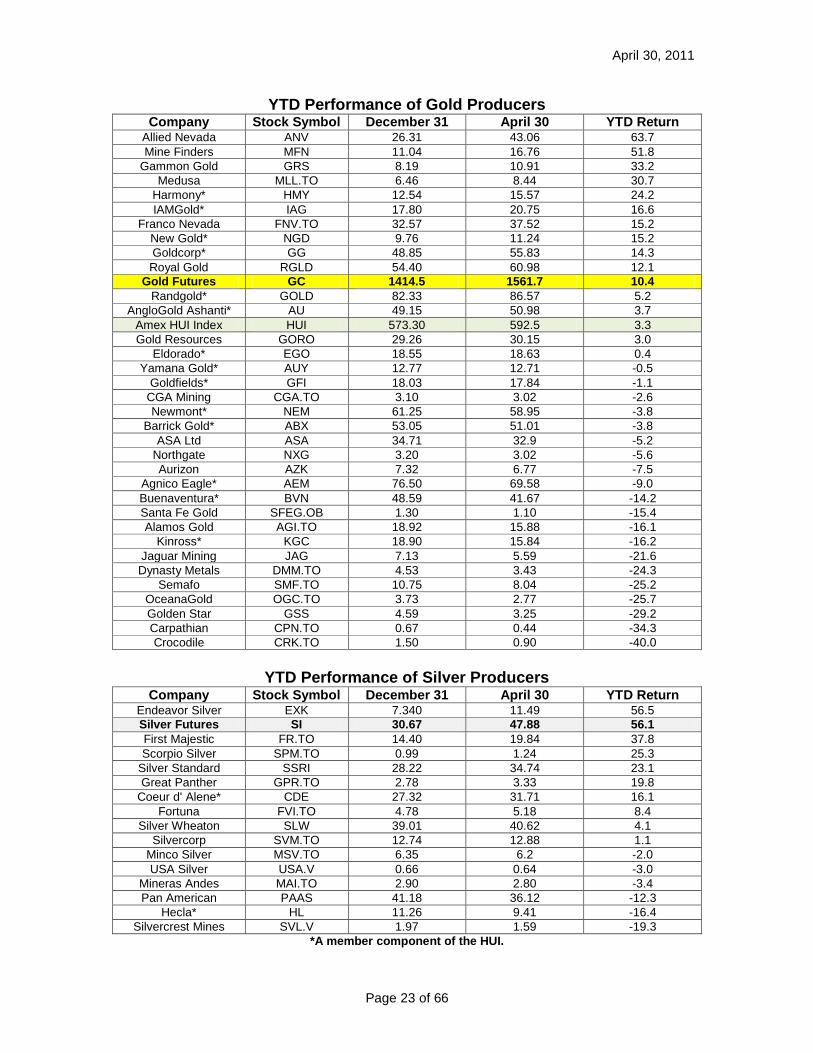
YTD Performance of Gold Producers Company Stock Symbol December 31 April 30 YTD Return
Allied Nevada ANV 26.31 43.06 63.7
Mine Finders MFN 11.04 16.76 51.8
Gammon Gold GRS 8.19 10.91 33.2
Medusa MLL.TO 6.46 8.44 30.7
Harmony* HMY 12.54 15.57 24.2
IAMGold* IAG 17.80 20.75 16.6
Franco Nevada FNV.TO 32.57 37.52 15.2
New Gold* NGD 9.76 11.24 15.2
Goldcorp* GG 48.85 55.83 14.3
Royal Gold RGLD 54.40 60.98 12.1
Gold Futures GC 1414.5 1561.7 10.4
Randgold* GOLD 82.33 86.57 5.2
AngloGold Ashanti* AU 49.15 50.98 3.7
Amex HUI Index HUI 573.30 592.5 3.3
Gold Resources GORO 29.26 30.15 3.0
Eldorado* EGO 18.55 18.63 0.4
Yamana Gold* AUY 12.77 12.71 -0.5
Goldfields* GFI 18.03 17.84 -1.1
CGA Mining CGA.TO 3.10 3.02 -2.6
Newmont* NEM 61.25 58.95 -3.8
Barrick Gold* ABX 53.05 51.01 -3.8
ASA Ltd ASA 34.71 32.9 -5.2
Northgate NXG 3.20 3.02 -5.6
Aurizon AZK 7.32 6.77 -7.5
Agnico Eagle* AEM 76.50 69.58 -9.0
Buenaventura* BVN 48.59 41.67 -14.2
Santa Fe Gold SFEG.OB 1.30 1.10 -15.4
Alamos Gold AGI.TO 18.92 15.88 -16.1
Kinross* KGC 18.90 15.84 -16.2
Jaguar Mining JAG 7.13 5.59 -21.6
Dynasty Metals DMM.TO 4.53 3.43 -24.3
Semafo SMF.TO 10.75 8.04 -25.2
OceanaGold OGC.TO 3.73 2.77 -25.7
Golden Star GSS 4.59 3.25 -29.2
Carpathian CPN.TO 0.67 0.44 -34.3
Crocodile CRK.TO 1.50 0.90 -40.0
YTD Performance of Silver Producers
Company Stock Symbol December 31 April 30 YTD Return Endeavor Silver EXK 7.340 11.49 56.5
Silver Futures SI 30.67 47.88 56.1
First Majestic FR.TO 14.40 19.84 37.8
Scorpio Silver SPM.TO 0.99 1.24 25.3
Silver Standard SSRI 28.22 34.74 23.1
Great Panther GPR.TO 2.78 3.33 19.8
Coeur d' Alene* CDE 27.32 31.71 16.1
Fortuna FVI.TO 4.78 5.18 8.4
Silver Wheaton SLW 39.01 40.62 4.1
Silvercorp SVM.TO 12.74 12.88 1.1
Minco Silver MSV.TO 6.35 6.2 -2.0
USA Silver USA.V 0.66 0.64 -3.0
Mineras Andes MAI.TO 2.90 2.80 -3.4
Pan American PAAS 41.18 36.12 -12.3
Hecla* HL 11.26 9.41 -16.4
Silvercrest Mines SVL.V 1.97 1.59 -19.3
*A member component of the HUI.

April 30, 2011
Page 24 of 66
Suggested Stocks
New recommendations will have the Company name highlighted in green. A short description of each stock with a chart is presented. Red is used to denote resistance and blue is generally used to highlight support. To the right of each Canadian listed stock, is the symbol US investors use for the stock. The brevity of many descriptions is to encourage the reader to do his or her own due diligence. Many companies that have appeared in the Newsletter are now being deleted. Most are being removed because of their stock‟s poor relative performance to the underlying primary metal they produce. With the potential for a summertime correction due to either seasonality, the end of QE2 or a highly probable plunge in silver in response to its parabolic rise, mining stocks that are weak in a bullish environment can get creamed in a correction.
April 30, 2011
Page 25 of 66
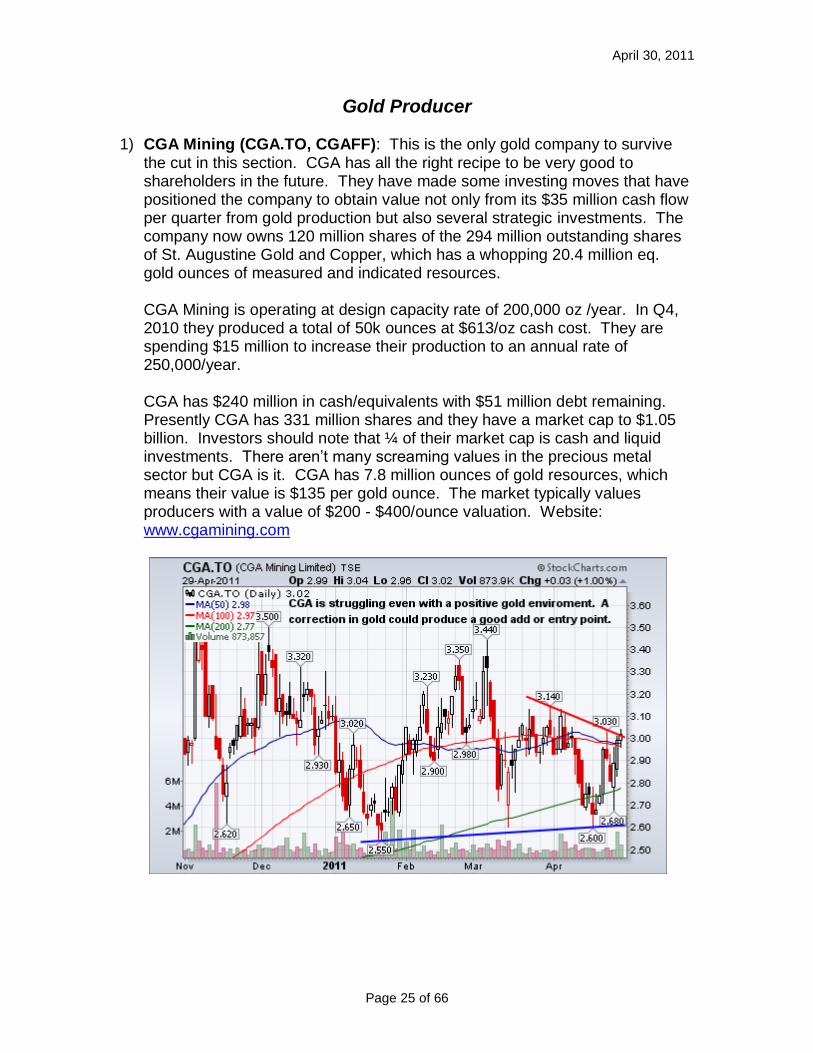
Gold Producer 1) CGA Mining (CGA.TO, CGAFF): This is the only gold company to survive
the cut in this section. CGA has all the right recipe to be very good to shareholders in the future. They have made some investing moves that have positioned the company to obtain value not only from its $35 million cash flow per quarter from gold production but also several strategic investments. The company now owns 120 million shares of the 294 million outstanding shares of St. Augustine Gold and Copper, which has a whopping 20.4 million eq. gold ounces of measured and indicated resources.
CGA Mining is operating at design capacity rate of 200,000 oz /year. In Q4,
2010 they produced a total of 50k ounces at $613/oz cash cost. They are spending $15 million to increase their production to an annual rate of 250,000/year.
CGA has $240 million in cash/equivalents with $51 million debt remaining.
Presently CGA has 331 million shares and they have a market cap to $1.05 billion. Investors should note that ¼ of their market cap is cash and liquid investments. There aren‟t many screaming values in the precious metal sector but CGA is it. CGA has 7.8 million ounces of gold resources, which means their value is $135 per gold ounce. The market typically values producers with a value of $200 - $400/ounce valuation. Website: www.cgamining.com
April 30, 2011
Page 26 of 66
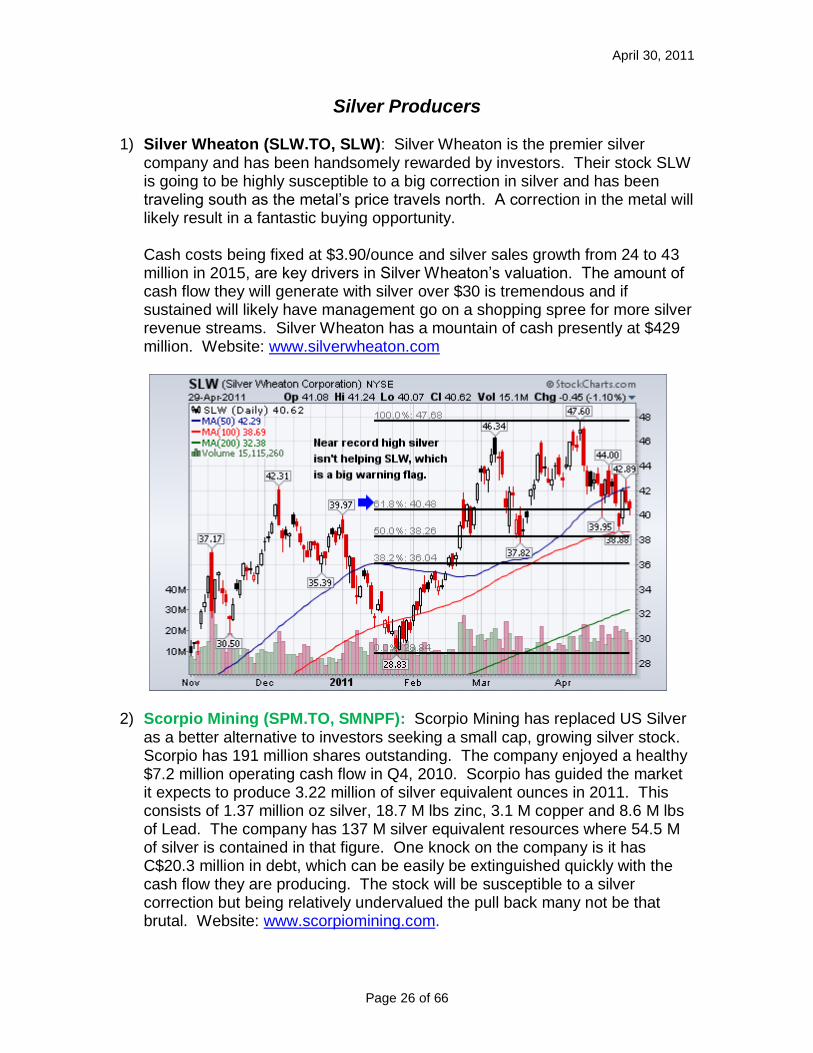
Silver Producers 1) Silver Wheaton (SLW.TO, SLW): Silver Wheaton is the premier silver
company and has been handsomely rewarded by investors. Their stock SLW is going to be highly susceptible to a big correction in silver and has been traveling south as the metal‟s price travels north. A correction in the metal will likely result in a fantastic buying opportunity.
Cash costs being fixed at $3.90/ounce and silver sales growth from 24 to 43 million in 2015, are key drivers in Silver Wheaton‟s valuation. The amount of cash flow they will generate with silver over $30 is tremendous and if sustained will likely have management go on a shopping spree for more silver revenue streams. Silver Wheaton has a mountain of cash presently at $429 million. Website: www.silverwheaton.com
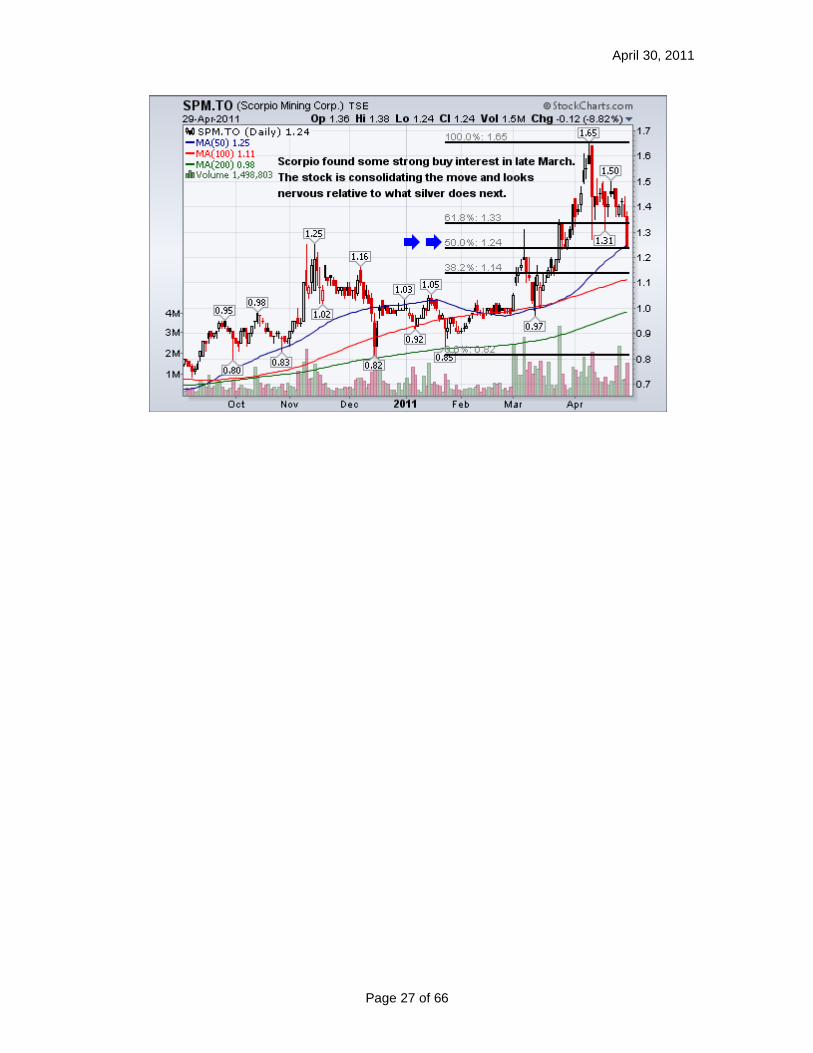
2) Scorpio Mining (SPM.TO, SMNPF): Scorpio Mining has replaced US Silver as a better alternative to investors seeking a small cap, growing silver stock. Scorpio has 191 million shares outstanding. The company enjoyed a healthy $7.2 million operating cash flow in Q4, 2010. Scorpio has guided the market it expects to produce 3.22 million of silver equivalent ounces in 2011. This consists of 1.37 million oz silver, 18.7 M lbs zinc, 3.1 M copper and 8.6 M lbs of Lead. The company has 137 M silver equivalent resources where 54.5 M of silver is contained in that figure. One knock on the company is it has C$20.3 million in debt, which can be easily be extinguished quickly with the cash flow they are producing. The stock will be susceptible to a silver correction but being relatively undervalued the pull back many not be that brutal. Website: www.scorpiomining.com.
April 30, 2011
Page 27 of 66
April 30, 2011
Page 28 of 66
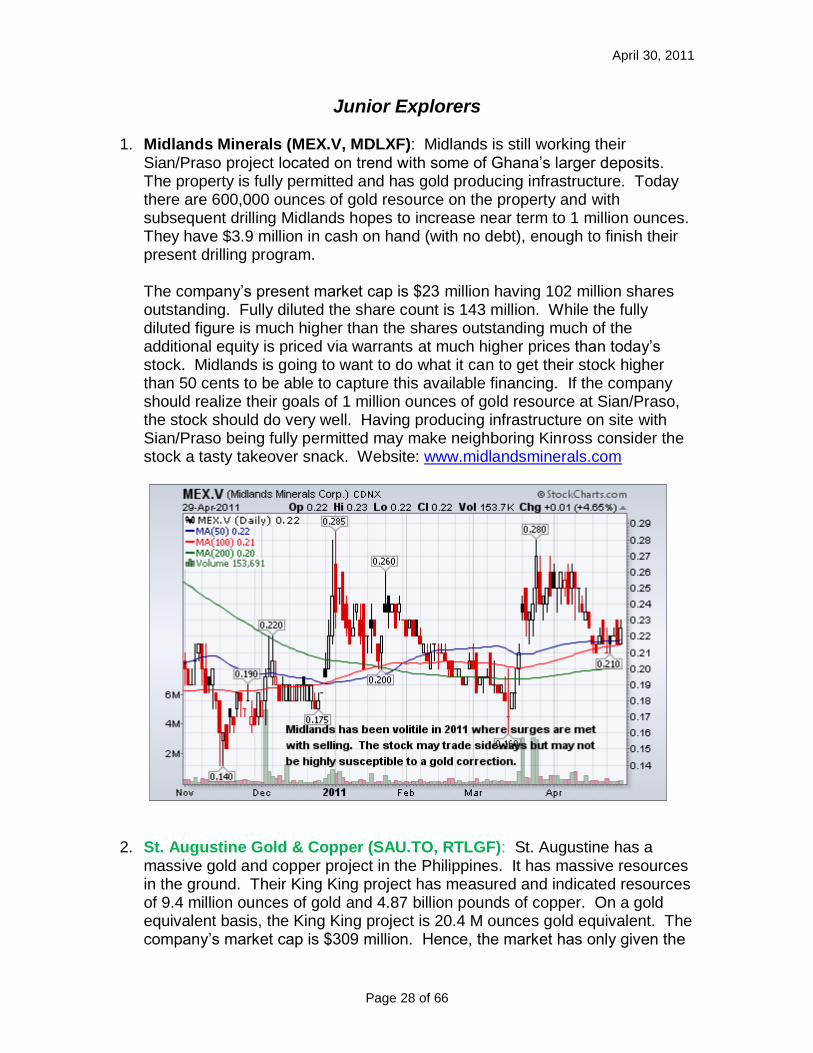
Junior Explorers 1. Midlands Minerals (MEX.V, MDLXF): Midlands is still working their
Sian/Praso project located on trend with some of Ghana‟s larger deposits. The property is fully permitted and has gold producing infrastructure. Today there are 600,000 ounces of gold resource on the property and with subsequent drilling Midlands hopes to increase near term to 1 million ounces. They have $3.9 million in cash on hand (with no debt), enough to finish their present drilling program. The company‟s present market cap is $23 million having 102 million shares outstanding. Fully diluted the share count is 143 million. While the fully diluted figure is much higher than the shares outstanding much of the additional equity is priced via warrants at much higher prices than today‟s stock. Midlands is going to want to do what it can to get their stock higher than 50 cents to be able to capture this available financing. If the company should realize their goals of 1 million ounces of gold resource at Sian/Praso, the stock should do very well. Having producing infrastructure on site with Sian/Praso being fully permitted may make neighboring Kinross consider the stock a tasty takeover snack. Website: www.midlandsminerals.com
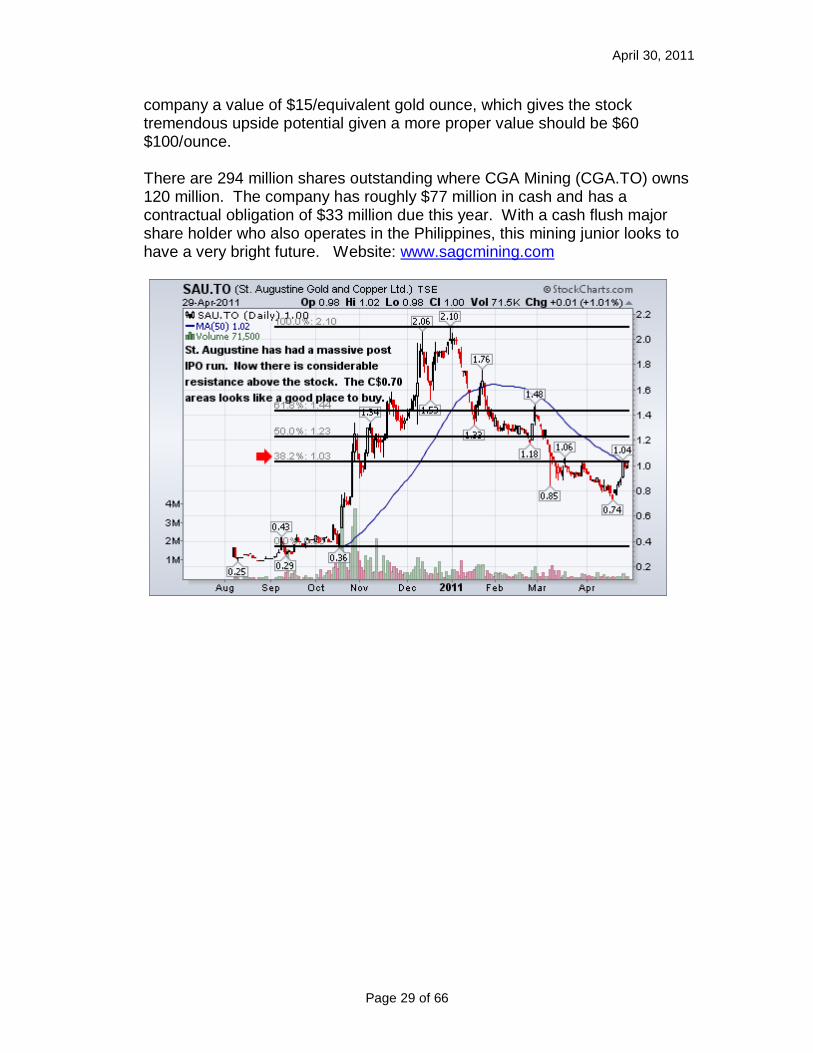
2. St. Augustine Gold & Copper (SAU.TO, RTLGF): St. Augustine has a
massive gold and copper project in the Philippines. It has massive resources in the ground. Their King King project has measured and indicated resources of 9.4 million ounces of gold and 4.87 billion pounds of copper. On a gold equivalent basis, the King King project is 20.4 M ounces gold equivalent. The company‟s market cap is $309 million. Hence, the market has only given the
April 30, 2011
Page 29 of 66
company a value of $15/equivalent gold ounce, which gives the stock tremendous upside potential given a more proper value should be $60 $100/ounce. There are 294 million shares outstanding where CGA Mining (CGA.TO) owns 120 million. The company has roughly $77 million in cash and has a contractual obligation of $33 million due this year. With a cash flush major share holder who also operates in the Philippines, this mining junior looks to have a very bright future. Website: www.sagcmining.com
April 30, 2011
Page 30 of 66
Stock Deletions
I put in this section because at times, company progress does not go the way you‟d like. The majority of the information I obtain is from public sources and found via the internet. One of the most basic assumptions is that guidance and performance of management will be within reason. In general, nearly all mining companies miss guidance. It takes time to see what companies miss a little or to see those that miss a lot. There are cases where management teams continually miss guidance. Those stocks are to be avoided until proven otherwise. Stocks removed from suggested lists: 1. Carpathian (CPN.TO, CPNFF): Carpathian continues to operationally
perform by proving up gold and developing their mine. Quite normally, a company who hasn‟t disappointed the market would be rewarded. Today Carpathian‟s stock has lost about a 1/3rd of its share price since December. This has occurred as gold has raced off to new all-time highs. The big discrepancy indicates that investor excitement is gone from the stock. When a stock is weak when gold is rising, it will likely get hammered upon a gold correction. Investors should keep this one on their radar screen.
2. Coeur D’ Alene (CDM.TO, CDE): Coeur has rewarded HMI investors well but it appears further appreciable stock gains will be very difficult. CDE has lagged the price of silver and Bolivia is making noises about nationalizing the country‟s mines. Coeur has large exposure to Bolivia as their San Bartolome mine produces roughly 7 million ounces of silver. Uncertainty always hurts a stock and Coeur‟s underperformance to silver makes other silver investment instruments such as ETF‟s or other miners much more appealing. Just a little factoid, CDE‟s present day price is the same as when silver was under $10.
3. OceanaGold (OGC.TO, OCANF): Oceana has been orphaned in the gold mining sector with its stock significantly underperforming gold in 2011. They continue to generate large amounts of cash flow. One issue rose up in January when locals next to their Philippine developmental mine Didipio wanted Oceana‟s license revoked. It is hard to tell how much of their recent underperformance is a result. What is blatantly obvious despite strong operating results in a bullish gold market, that the market simply will not reward Oceana investors. A common theme has arisen over the last several months that gold producers with flat gold production growth have been underperforming. Oceana‟s production will essentially be flat from 2011 and 2012. Starting 2013 they will increase gold production as management has guided Didipio will begin commercial production. Oceana will return to this Newsletter in the future but it may be up to a year until either its stock begins to show signs of life or when it looks like Didipio is on track to begin production.
April 30, 2011
Page 31 of 66
4. Crocodile Gold (CRK.TO, CROCF): What a reversal of fortune for
Crocodile. It was the HMI top pick. Crocodile was hit hard by the heavy flooding in northern Australia. The market could handle misfortune from Mother Nature but not plainly dumb decisions by management. Crocodile decided to raise $80+ million at an equity price near yearly lows of C$1.05; a 30% discount to market. Now anyone who has purchased Crocodile shares for the last 18 months has a loss. CRK has slumped since the announcement and has seen no life even from gold trading at all-time highs. What their management has done is nearly guaranteed a stagnant to downward seeking stock price for up to 18 months. Unfortunately, Crocodile appears to have entered the perennial underperformer class of Golden Star and Jaguar Mining. The only silver lining here is at the height of tax loss selling this year (early to mid-December) savvy investors may be able to buy the stock at about 1/3rd of its present price.
5. Pan American Silver (PAA.TO, PAAS): Pan American has the same recipe for less than stellar share price gains as Coeur. They too have exposure to Bolivia as Coeur, but at a much smaller extent of 3 million ounces of silver. The company is well managed, has no debt and a large pile of cash. The fundamental problem right now is its stock is badly lagging the price of silver recently and is susceptible for a large downward plunge once silver corrects out of the stratosphere.
6. U. S. Silver (USA.V, USSIF): US Silver will be susceptible to a silver
correction just like its peers but that is not the reason for its removal. Their Q4, 2010 operating results were quite weak. Cash costs rose, yet again, to $15.50 and this is after by-product credits. The company guided last year of getting those cash costs below $10. Surprisingly, operating cash flow was a very small $1.9 million for Q4, which is too weak for a $200 million market cap. Their Q1 revenues should soar with the price of silver but the market has probably priced it in already.
April 30, 2011
Page 32 of 66
Reader Recommended Stocks
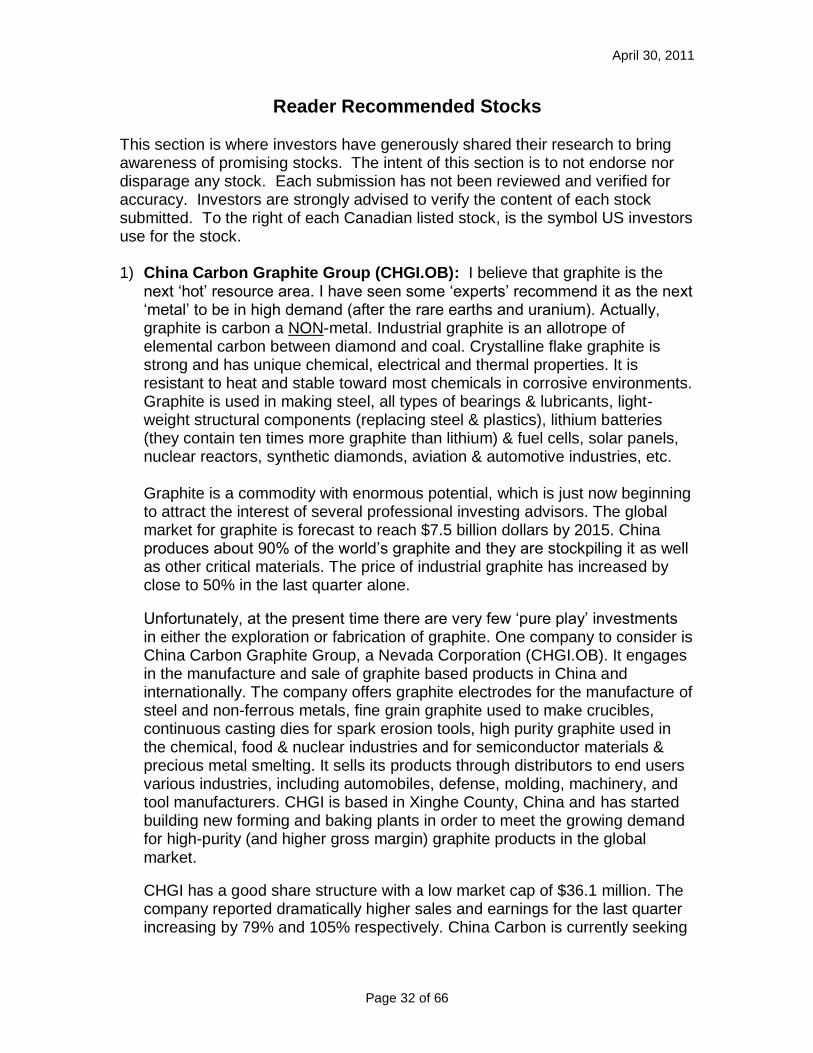
This section is where investors have generously shared their research to bring awareness of promising stocks. The intent of this section is to not endorse nor disparage any stock. Each submission has not been reviewed and verified for accuracy. Investors are strongly advised to verify the content of each stock submitted. To the right of each Canadian listed stock, is the symbol US investors use for the stock. 1) China Carbon Graphite Group (CHGI.OB): I believe that graphite is the
next „hot‟ resource area. I have seen some „experts‟ recommend it as the next „metal‟ to be in high demand (after the rare earths and uranium). Actually, graphite is carbon a NON-metal. Industrial graphite is an allotrope of elemental carbon between diamond and coal. Crystalline flake graphite is strong and has unique chemical, electrical and thermal properties. It is resistant to heat and stable toward most chemicals in corrosive environments. Graphite is used in making steel, all types of bearings & lubricants, light-weight structural components (replacing steel & plastics), lithium batteries (they contain ten times more graphite than lithium) & fuel cells, solar panels, nuclear reactors, synthetic diamonds, aviation & automotive industries, etc.
Graphite is a commodity with enormous potential, which is just now beginning to attract the interest of several professional investing advisors. The global market for graphite is forecast to reach $7.5 billion dollars by 2015. China produces about 90% of the world‟s graphite and they are stockpiling it as well as other critical materials. The price of industrial graphite has increased by close to 50% in the last quarter alone.
Unfortunately, at the present time there are very few „pure play‟ investments in either the exploration or fabrication of graphite. One company to consider is China Carbon Graphite Group, a Nevada Corporation (CHGI.OB). It engages in the manufacture and sale of graphite based products in China and internationally. The company offers graphite electrodes for the manufacture of steel and non-ferrous metals, fine grain graphite used to make crucibles, continuous casting dies for spark erosion tools, high purity graphite used in the chemical, food & nuclear industries and for semiconductor materials & precious metal smelting. It sells its products through distributors to end users various industries, including automobiles, defense, molding, machinery, and tool manufacturers. CHGI is based in Xinghe County, China and has started building new forming and baking plants in order to meet the growing demand for high-purity (and higher gross margin) graphite products in the global market.
CHGI has a good share structure with a low market cap of $36.1 million. The company reported dramatically higher sales and earnings for the last quarter increasing by 79% and 105% respectively. China Carbon is currently seeking
April 30, 2011
Page 33 of 66
to initiate an acquisition, with the objective of becoming a vertically integrated leader in the Chinese graphite industry.
“While some investors are wary of investing in Chinese companies due to the risks and volatility in China‟s economy, CHGI represents a compelling speculation in the rapidly expanding global graphite industry.” Refer to Jack Lifton‟s recent article http://ree-investor.com/jack-lifton/1340-jack-lifton-graphite-a-diamond-in-the-rough-for-investors.html Chicago Dave submitted this stock recommendation.
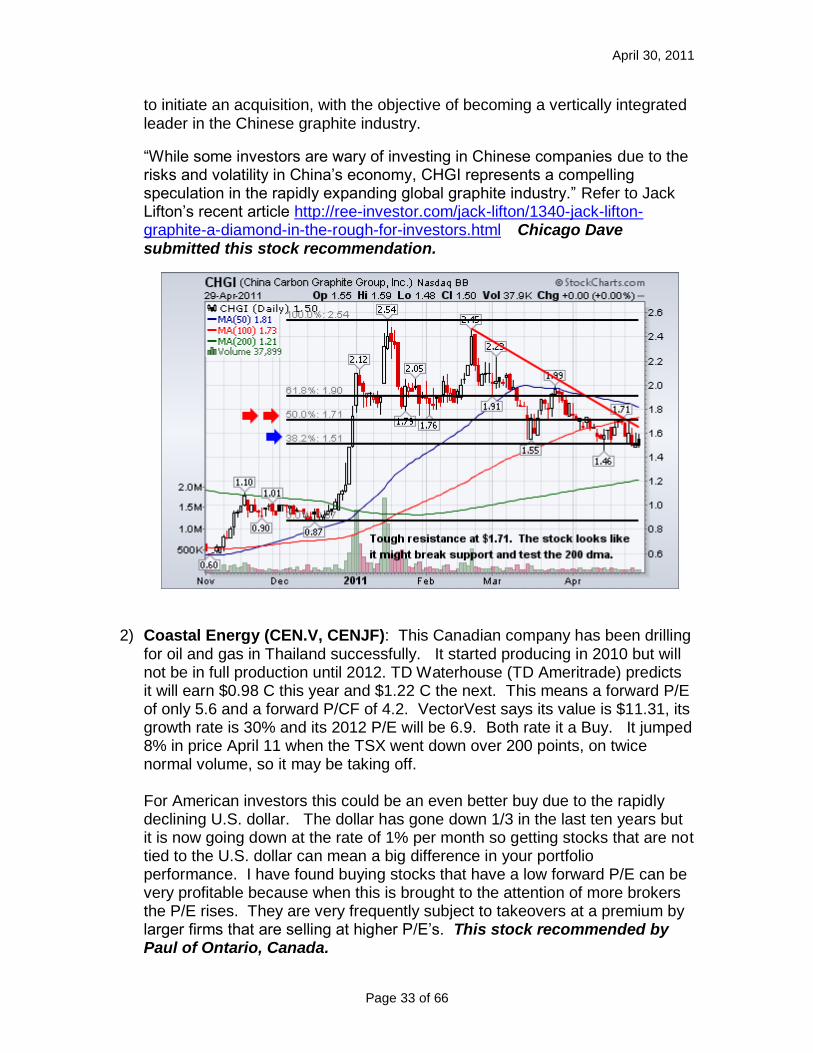
2) Coastal Energy (CEN.V, CENJF): This Canadian company has been drilling
for oil and gas in Thailand successfully. It started producing in 2010 but will not be in full production until 2012. TD Waterhouse (TD Ameritrade) predicts it will earn $0.98 C this year and $1.22 C the next. This means a forward P/E of only 5.6 and a forward P/CF of 4.2. VectorVest says its value is $11.31, its growth rate is 30% and its 2012 P/E will be 6.9. Both rate it a Buy. It jumped 8% in price April 11 when the TSX went down over 200 points, on twice normal volume, so it may be taking off. For American investors this could be an even better buy due to the rapidly declining U.S. dollar. The dollar has gone down 1/3 in the last ten years but it is now going down at the rate of 1% per month so getting stocks that are not tied to the U.S. dollar can mean a big difference in your portfolio performance. I have found buying stocks that have a low forward P/E can be very profitable because when this is brought to the attention of more brokers the P/E rises. They are very frequently subject to takeovers at a premium by larger firms that are selling at higher P/E‟s. This stock recommended by Paul of Ontario, Canada.
April 30, 2011
Page 34 of 66
3) Comstock Mining (LODE.OB): Why I bought a starter position: http://idahosilver.blogspot.com/2011/03/comstock-mining-lodeob-why-i-bought.html Every "precious metals bug" and student of the history of the Western USA has heard of the Comstock Lode in Nevada. A few months ago I read the fascinating story of Comstock Mining's painstaking assembly of a wide swath of this historic mining district on http://www.321gold.com. After waiting-out the "Bob Moriarty-induced" price spike, I entered a position around $2.60, which has since moved up. http://www.321gold.com/editorials/moriarty/moriarty102910.html http://www.comstockmining.com/ I really started liking my position even more now that they've started announcing some impressive drill results. How does 135 feet of 7 gpt gold, plus some silver, sound to you? http://www.comstockmining.com/corporate/ceo-blog I also like the management, which is a huge factor, besides the property. The CEO has a lot of personal skin in the game. He's not sitting in some fancy office in Canada milking PP investors without getting his hands dirty. IN FACT, they don't have a Canadian listing, which insulates them from some of the alleged shorting and financing shenanigans that I've heard stories of.

April 30, 2011
Page 35 of 66
Recently cashed-up and thinking about production THIS YEAR (though my gut and experience tells me that it may be a bit aggressive). http://www.comstockmining.com/files/comstockmining-overview-20101116.pdf If any of this sounds interesting, study the maps, read the website, maybe even give them a call and see if they sound like the real deal. If so, consider a small amount of SPECULATIVE money. If the price drops, remember that you're in Nevada and you can either double-down or fold and run. Only you can make those decisions. I own a small amount. Note that I am not stating what I think the MC is or should be. The complicated structure in the 321Gold.com article above I do not understand and has me a bit puzzled, so I'm being cautious. This stock recommended by Karl from the Silicon Valley.
4) CuOro Resources (CUA.V): Two 100% owned drill ready Assets: Santa
Elena: Copper/Gold asset (Colombia, 1.1 Billion lbs of 1.9% Cu). We are the only Copper focused junior in Colombia. 2) Barranco De Loba: an exceptional drill ready Gold/Silver asset. (Hydrothermal vein system with 26 vein structures identified to-date up to 6m wide, with values of up to 52.4 g/t Au and 242 g/t Ag).
Management: CEO - Robert Sedgemore -ex Head of Mining Division of the IFC and chief engineer for BHP at Escondida). Nick Demare (Batero Gold, Mirasol Resources and Tasman Metals) John Seaman (ex Wolfden Resources, Premier Gold and Pediment Gold), Dave Doherty (Astur Gold).
April 30, 2011
Page 36 of 66
Infrastructure: Infrastructure is excellent including paved road access to the property gate, two hydroelectric plants within 5 km, and abundant water supply. The Antioquia district and CuOro's project (140km NE of Medellin) is considered socially stable and mining-friendly.
Shareholders include: Insiders and Management: 30% Hudbay Minerals - 10% Dundee Precious Metals Fund: 5% Gran Tierra Energy Management and other funds 15%.
Treasury: $10.5 million
Ventana Gold recently bought out by 63X (Eike Batista).
Mining majors heading to Colombia at a rapid pace:, Codelco, IamGold, Rio Tinto, Anglogold, Antofagasta, Soros, Paulson, and Electrum have recently invested in the country.
China: Chinese officials confirmed this week that their country has agreed to invest in the $7.6 billion project, which would stretch about 140 miles (220 km) from Colombia's northern Caribbean region, near Cartagena, to an as-yet undesignated site on its western Pacific coast, mainly to ferry Colombia's abundant minerals to Asia) both Colombia and China seem to think it's worth the risk. China sees the country "as a good strategic opportunity," says Shifter, "a good location for conveying a lot of South American commodities but also a place with more sophisticated governance today."
In the past 10 years, annual Latin American exports to China have gone from negligible to more than $40 billion as the Asian giant reaches for commodities like oil, copper and soy beans to fuel its roaring economic growth (10% last year).
Market cap fully diluted: $36 million vs Batero Gold, Continental Gold and others who are all trading between 250 million to over $1 billion caps.
Company strictly follows Equator Principles. Analyst upgrades and new coverage could further enhance share values. Brett Allan – Investor Relations
for CuOro Resources submitted this stock recommend. Website: www.cuororesources.com
< No Chart Available from StockCharts.com >
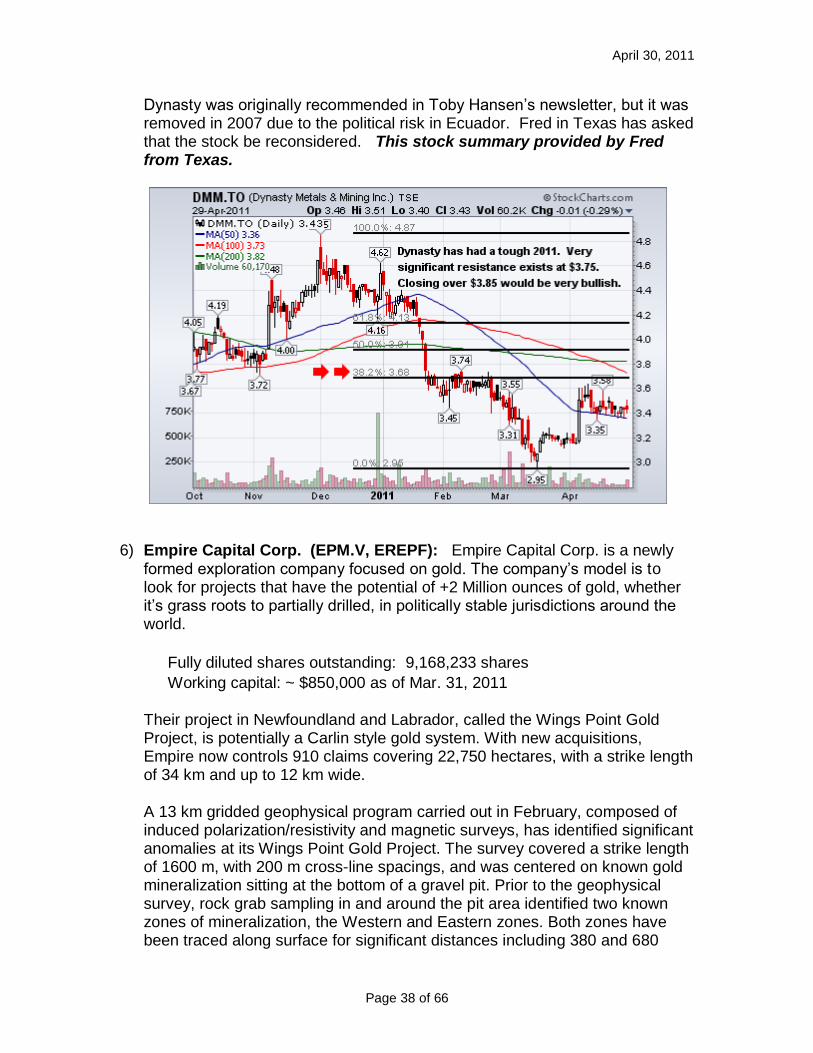
5) Dynasty Mining (DMM.TO, DMMIF): Dynasty tops my list of value gold stocks. They have a mine in Ecuador that is in development stage and is currently producing at breakeven. No mining company in Ecuador can begin commercial production until they negotiate exploitation contracts. There has

April 30, 2011
Page 37 of 66
been a long delay in awarding any exploitation contracts, but Ecuador is finally moving forward. Dynasty expects to have their contract by July. Dynasty has an agreement with the government to allow enough development stage mining to cover expenses so that further dilution can be avoided. Dynasty is the only company currently doing any mining in Ecuador. Dynasty's flagship mine is Zaruma. It is expected to produce 100k ounces per year at full production. It only cost the company $35M to develop this mine. Dynasty has 2 other undeveloped properties, Dynasty Goldfield and Jerusalem. These properties could potentially add 100k ounces each when developed. Dynasty stock is currently a waiting game. The stock has been harshly punished. No one trusts Ecuador, and the wait for an exploitation contract seems endless. Dynasty has been slowly developing their mine and their workforce during the last 2 years while they have been waiting for the government to get their act together. When commercial production finally begins, the numbers could be amazing. Here are my estimates based only on Zaruma: Share price: $3.20 Shares fully diluted: 48.5M Market cap: $155M Company estimated production: 100k ounces My estimated production: 90k ounces Company estimated cash cost per ounce: $200 My estimated total cost per ounce including overhead & depreciation: $500 Price of gold: $1400 Profit margin per ounce: $900 Total profits before tax: $81M Tax rate: 50% Total profits: $40M EPS = $.82 P/E = 3.9 Given the profitability, there should be plenty of cash to develop the Dynasty Goldfield and Jerusalem properties. That should significantly increase the value of the company. I would not be surprised to see a stock price in the $10 to $20 range within 2 years. Website: http://www.dynastymining.com/
April 30, 2011
Page 38 of 66
Dynasty was originally recommended in Toby Hansen‟s newsletter, but it was removed in 2007 due to the political risk in Ecuador. Fred in Texas has asked that the stock be reconsidered. This stock summary provided by Fred from Texas.
6) Empire Capital Corp. (EPM.V, EREPF): Empire Capital Corp. is a newly formed exploration company focused on gold. The company‟s model is to look for projects that have the potential of +2 Million ounces of gold, whether it‟s grass roots to partially drilled, in politically stable jurisdictions around the world.
Fully diluted shares outstanding: 9,168,233 shares
Working capital: ~ $850,000 as of Mar. 31, 2011
Their project in Newfoundland and Labrador, called the Wings Point Gold Project, is potentially a Carlin style gold system. With new acquisitions, Empire now controls 910 claims covering 22,750 hectares, with a strike length of 34 km and up to 12 km wide.
A 13 km gridded geophysical program carried out in February, composed of induced polarization/resistivity and magnetic surveys, has identified significant anomalies at its Wings Point Gold Project. The survey covered a strike length of 1600 m, with 200 m cross-line spacings, and was centered on known gold mineralization sitting at the bottom of a gravel pit. Prior to the geophysical survey, rock grab sampling in and around the pit area identified two known zones of mineralization, the Western and Eastern zones. Both zones have been traced along surface for significant distances including 380 and 680

April 30, 2011
Page 39 of 66
metres, respectively. The widths of the zones, based on rock grab surface sampling, was difficult to determine due to cover, however, indicated the Western Zone to be between 100 and 120 m wide in one location, and the Eastern Zone is up to 50 m wide. The Western Zone appears to the more intensely altered and mineralized of the two zones, with several samples in a newly uncovered area assaying up to 2.46, 2.83 and 6.92 g/t gold.
The company has been moving the project forward aggressively with the aim to start drilling during the spring.
Management is led by Terry Christopher, Ph.D. who has over 15 years experience in mineral exploration in Canada, Mexico and the US, as well as several years in grass roots oil and gas exploration. From 2007 to 2010 he was Chief Geoscientist for Nayarit Gold, which was been taken over by Capital Gold Corp. Prior to 2007, Terry spent three years at Linear Gold (now Brigus Gold) in the dual position of Chief Geoscientist and Manager of Investor Relations. Terry has a Ph.D. in Geochemistry and a BSc. (Hons) in Geology from the Department of Earth Sciences, Memorial University of Newfoundland.
A subscriber-only newsletter writer recently wrote the following about EPM: “The size is there and if drilling proves up you could easily see this stock run to $10 - $20 because there are so few shares outstanding. I expect another few million dollars of additional dilution to finance a drill program.” Website: www.empirecapitalcorp.ca This stock submitted by Karl from British Columbia, Canada.
April 30, 2011
Page 40 of 66
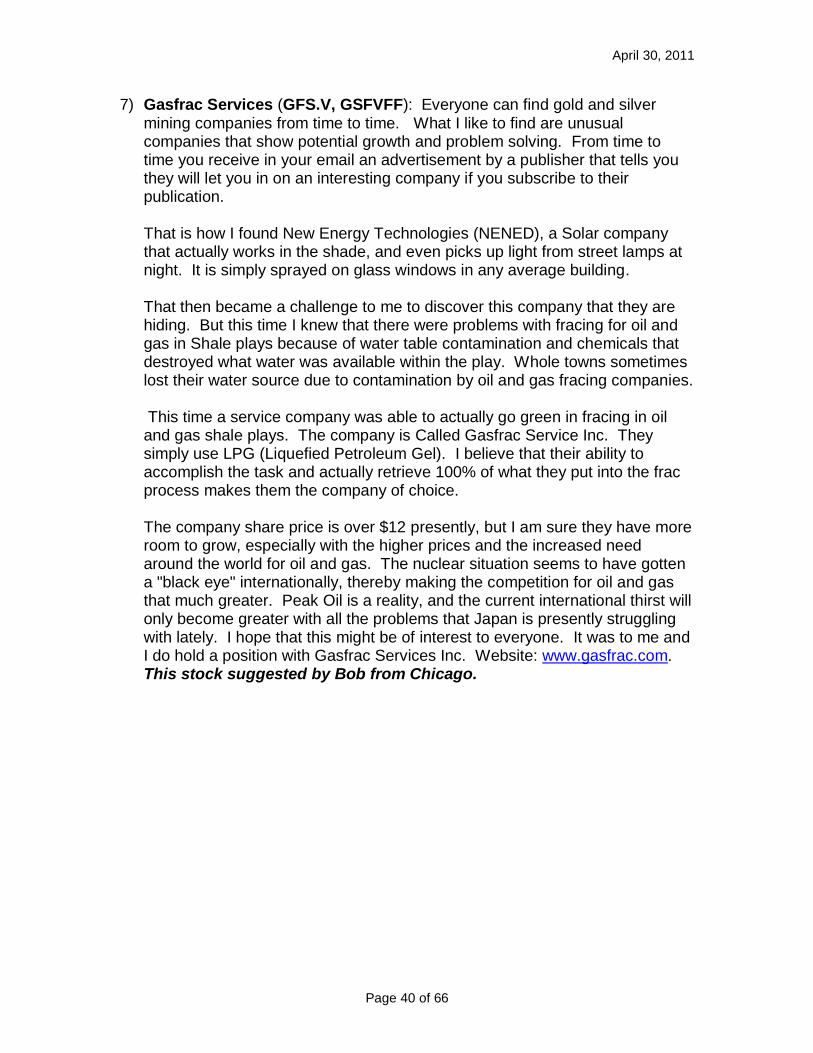
7) Gasfrac Services (GFS.V, GSFVFF): Everyone can find gold and silver mining companies from time to time. What I like to find are unusual companies that show potential growth and problem solving. From time to time you receive in your email an advertisement by a publisher that tells you they will let you in on an interesting company if you subscribe to their publication. That is how I found New Energy Technologies (NENED), a Solar company that actually works in the shade, and even picks up light from street lamps at night. It is simply sprayed on glass windows in any average building. That then became a challenge to me to discover this company that they are hiding. But this time I knew that there were problems with fracing for oil and gas in Shale plays because of water table contamination and chemicals that destroyed what water was available within the play. Whole towns sometimes lost their water source due to contamination by oil and gas fracing companies. This time a service company was able to actually go green in fracing in oil and gas shale plays. The company is Called Gasfrac Service Inc. They simply use LPG (Liquefied Petroleum Gel). I believe that their ability to accomplish the task and actually retrieve 100% of what they put into the frac process makes them the company of choice. The company share price is over $12 presently, but I am sure they have more room to grow, especially with the higher prices and the increased need around the world for oil and gas. The nuclear situation seems to have gotten a "black eye" internationally, thereby making the competition for oil and gas that much greater. Peak Oil is a reality, and the current international thirst will only become greater with all the problems that Japan is presently struggling with lately. I hope that this might be of interest to everyone. It was to me and I do hold a position with Gasfrac Services Inc. Website: www.gasfrac.com. This stock suggested by Bob from Chicago.
April 30, 2011
Page 41 of 66
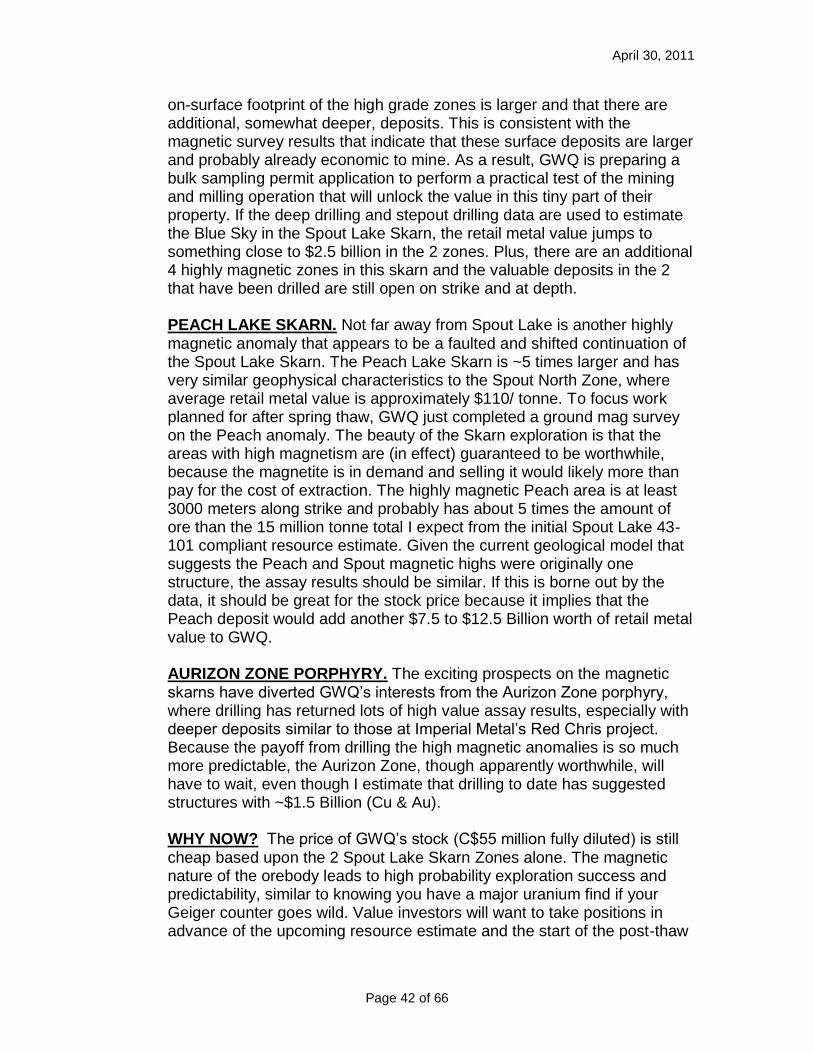
8) GWR RESOURCES (GWQ.V, GWRRF). In the last issue I outlined the known porphyry (Cu & Au) and magnetic skarn (Cu-Au-Ag-Magnetite) deposits on GWQ‟s Lac La Hache property, in the prolific Quesnel Trough in British Columbia. The company has made good progress since then, but its share price (now 39.5 cents, up from 27 at yearend 2010, having hit 58 in February) is still far below a rational discount to the retail value of the metal in the ground. The upside potential is still huge and should be realized as the market gets convinced of the metal value and the low-risk characteristics of the exploration program.
SPOUT LAKE SKARN. GWQ has completed the first drilling program on part of this (Cu-Au-Ag-magnetite) skarn. An initial 43-101 compliant resource number should be out in Q2, 2011, covering only shallow drilling on part of 2 of the 6 skarn zones (both open in strike and at depth) in this area. This resource estimate is going to cover only a small portion of the magnetic anomaly at Spout Lake and, based upon the drilling plan and assay results, is likely to come up with ~15 million metric tonnes of ore with ~$1.5 billion in retail metal value. Based upon the assay results, the retail metal value in the rock should average about $400/m3. Independent metallurgical tests on multiple ore samples were very favorable and metal recovery should be relatively simple and relatively cheap. GWQ has been in preliminary talks with large mining companies about exploiting this high value, low extraction cost, deposit. The 2 drilled zones are larger than the parametric drilling indicates. GWQ drilled a few 250 meter stepouts and some deeper holes (but still open pit minable) to asses the quality of the Blue Sky. The assays indicate that the
April 30, 2011
Page 42 of 66
on-surface footprint of the high grade zones is larger and that there are additional, somewhat deeper, deposits. This is consistent with the magnetic survey results that indicate that these surface deposits are larger and probably already economic to mine. As a result, GWQ is preparing a bulk sampling permit application to perform a practical test of the mining and milling operation that will unlock the value in this tiny part of their property. If the deep drilling and stepout drilling data are used to estimate the Blue Sky in the Spout Lake Skarn, the retail metal value jumps to something close to $2.5 billion in the 2 zones. Plus, there are an additional 4 highly magnetic zones in this skarn and the valuable deposits in the 2 that have been drilled are still open on strike and at depth. PEACH LAKE SKARN. Not far away from Spout Lake is another highly magnetic anomaly that appears to be a faulted and shifted continuation of the Spout Lake Skarn. The Peach Lake Skarn is ~5 times larger and has very similar geophysical characteristics to the Spout North Zone, where average retail metal value is approximately $110/ tonne. To focus work planned for after spring thaw, GWQ just completed a ground mag survey on the Peach anomaly. The beauty of the Skarn exploration is that the areas with high magnetism are (in effect) guaranteed to be worthwhile, because the magnetite is in demand and selling it would likely more than pay for the cost of extraction. The highly magnetic Peach area is at least 3000 meters along strike and probably has about 5 times the amount of ore than the 15 million tonne total I expect from the initial Spout Lake 43-101 compliant resource estimate. Given the current geological model that suggests the Peach and Spout magnetic highs were originally one structure, the assay results should be similar. If this is borne out by the data, it should be great for the stock price because it implies that the Peach deposit would add another $7.5 to $12.5 Billion worth of retail metal value to GWQ. AURIZON ZONE PORPHYRY. The exciting prospects on the magnetic skarns have diverted GWQ‟s interests from the Aurizon Zone porphyry, where drilling has returned lots of high value assay results, especially with deeper deposits similar to those at Imperial Metal‟s Red Chris project. Because the payoff from drilling the high magnetic anomalies is so much more predictable, the Aurizon Zone, though apparently worthwhile, will have to wait, even though I estimate that drilling to date has suggested structures with ~$1.5 Billion (Cu & Au). WHY NOW? The price of GWQ‟s stock (C$55 million fully diluted) is still cheap based upon the 2 Spout Lake Skarn Zones alone. The magnetic nature of the orebody leads to high probability exploration success and predictability, similar to knowing you have a major uranium find if your Geiger counter goes wild. Value investors will want to take positions in advance of the upcoming resource estimate and the start of the post-thaw
April 30, 2011
Page 43 of 66
drilling season, while the stock is still undervalued. Those that require more hard evidence in addition to the logic and inferences drawn from the copious data (all available on the company website), will want to monitor the news so that they can take a position when enough additional data is available to make them comfortable. Alan from Panama sent in this stock recommendation.
9) Home Capital Group (HCG.TO, HMCBF): This company is truly outstanding in my opinion. As a Trust company it does not offer the sizzle that resource companies do but it can offer very acceptable returns. From Dec. 2001 to Dec. 2010 $1,000 invested would have turned into $20,000 (a 20 bagger). This would be 30 for American investors due to the decline in the U.S. dollar. Last year its net income increased 25.2%, its earnings per share 24.3% and its return on equity was 27.2%. Its yield is 1.23%. It does what Canadian banks do but does it better. It is rated a buy by TD Waterhouse (TD Ameritrade) and VectorVest. Projected earnings for 2012 by TD are $6.60, giving it a forward P/E of 8.9. This makes it real buy to me. This stock was submitted by Paul from Ontario.

April 30, 2011
Page 44 of 66
10) Mesa Exploration Corp. (MSA.V, MSAJF): is a growth focused mineral exploration company, exploring a portfolio of premier metal properties. Shares outstanding: 12.6 million, trading at $1.00, $12.6 million market cap. Mesa is an early stage explorer with a portfolio of premier mineral properties in the United States. Management has over 100 years of combined experience in exploration, finance, permitting and operations in the mining industry. All projects are within proven mining districts in mine-friendly jurisdictions with excellent access and infrastructure. The company was formerly known as Mesa Uranium Corp.
Green Energy Lithium Potash Project, Utah The Project is a large brine deposit containing 40% dissolved metals, the brine contains Lithium, Potash, Magnesium, Boron, Bromine and other potentially valuable minerals. Historical reports on the brine occurrence suggested a potential for at least 15 million barrels with an upside of hundreds of millions of barrels of brine, these reference are found in an independent 43-101 report from March 14 which can be viewed at: www.mesaexploration.com
This project has world-class potential and could move Mesa from an early stage explorer to a developer and miner. Brine mines are more economic to mine and process and can be put into production faster and with less CAPEX than conventional open-pit or underground mines.
Potash Projects, Utah Five projects totaling 119 square miles of exploration permit applications with the Bureau of Land Management. The 56 square mile White Cloud project is
April 30, 2011
Page 45 of 66
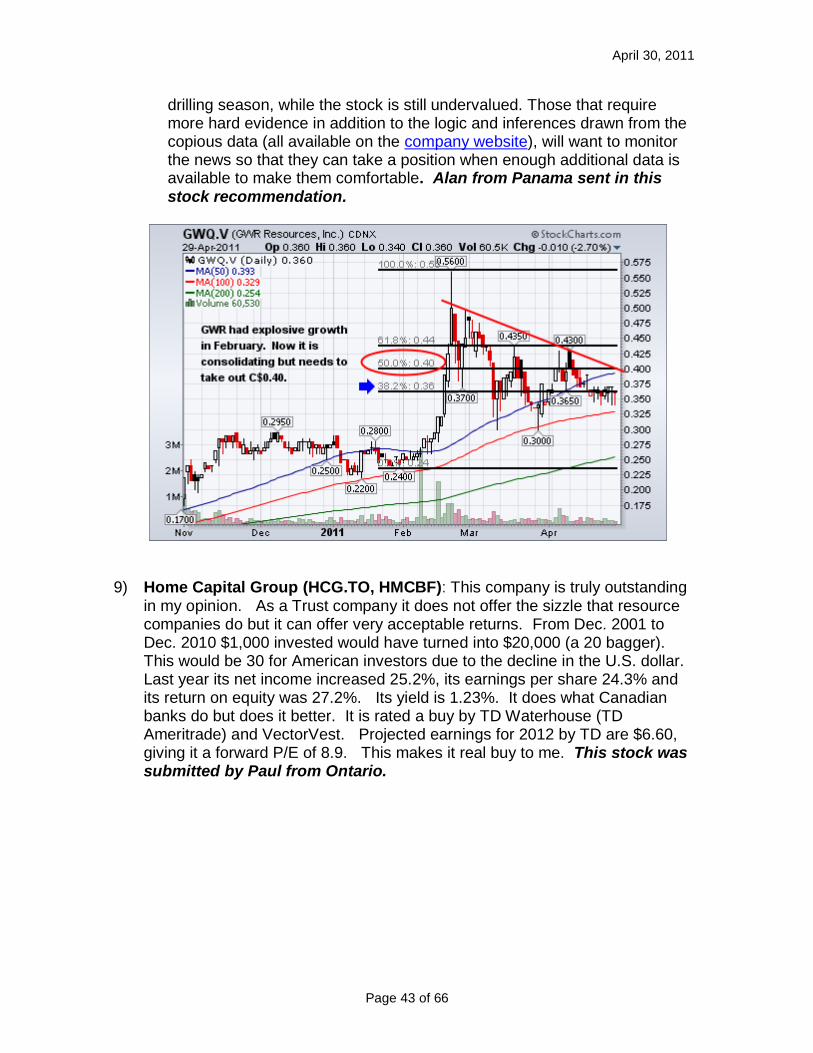
four miles north of Intrepid Potash's Cane Creek mine which produces 80,000 tons of potash annually. The two potash beds Intrepid is mining occur on the White Cloud project. On April 7th Mesa added 2 alunite projects in Utah; alunite is an ore of potash, aluminum and sulphur. Holbrook Potash Project, Arizona Mesa announced on 9/2/2010 that it has joint-ventured the project to Passport Potash (PPI). Passport is the operator of the JV and is currently conducting geophysical surveys and a multi-phase drilling program. Lisbon Valley Uranium Project, Utah Mesa controls a dominant land position in the Lisbon Valley Mining District with historic production of 100 million pounds of U3O8. Mesa intersected a zone grading 1.1% U3O8 over 17 feet in drilling in an area with no previous drilling. Moonshine Springs Uranium Project, Arizona Mesa has drilled significant U3O8 mineralization on the project: 7.5 feet grading 0.21% U3O8 and 4 feet grading 0.47% U3O8. Mesa believes that the Moonshine Springs Project has the potential to host 4 to 8 million pounds of U3O8. Mesa Exploration recommended by Jim from Arizona.
11) North Bay Resources (NBRI): Junior Mining Gold Companies offer the best chance for huge gains in the near future. The most promising Junior Gold Mining company that I could find in the small cap sector is NBRI. The profile below speaks for itself. For more information visit the web site.

April 30, 2011
Page 46 of 66
North Bay Resources Inc. (NBRI) Company Profile
1. North Bay Resources Inc. (OTCBB: NBRI) is a fully-reporting junior mining company, transitioning from an exploration company to a gold producer in 2011.
2. Low O/S, low float, majority owned by insiders. 3. Acquiring the historic Ruby Gold Mine in the Motherlode District of
Northern California. Total resource is estimated to contain up to 500,000 ounces of gold. Fully-permitted and ready to resume production this year. The Ruby Mine is famous for its jewelers-grade gold nuggets, the largest of which (so far) weighs 201 ounces.
4. Revenue from on-going Joint-Ventures in Canada. 5. Owns over 150 mineral and placer claims encompassing approximately
60,000 acres throughout British Columbia, Canada. Properties contain deposits of precious metals, including gold, silver, platinum, and palladium, as well as base metals, including copper, zinc, lead, molybdenum, vanadium, and rare earth elements (REE).
6. $3 million in work commitments from JV partners in Canada
7. Business plan based on the Generative Business Model, designed to
leverage properties into near-term revenue streams even during the earliest stages of exploration and development.
8. $5 million equity credit line in place; $7.5 million in non-dilutive EB-5 funding in the pipeline.
Company Website: www.northbayresources.com/ruby/. This stock recommended by Brian from Pennsylvania.

April 30, 2011
Page 47 of 66
12) Northern Graphite (NGC.V): Working capital: approx. $4 million upon completion of the IPO on April 18, 2011-04-10; Fully diluted shares outstanding: 44,092,496 shares Northern Graphite Corporation received conditional approval from the TSX Venture Exchange for the listing of its common shares on or about April 18, 2011.
Northern will become the first public company solely focused on graphite production. The proceeds of the Offering will enable it to continue advancing the Bissett Creek project and will be used to complete metallurgical and bench scale pilot plant testing, a prefeasibility study, environmental studies and mine permitting and a follow up drill program, as well as for general corporate purposes. It expects the pre-feasibility study to be completed in the next couple months and environmental and mine permitting are expected to be completed later in 2011 or the first part of 2012. At that time, the Company will be in position to initiate construction, subject to positive results from the prefeasibility study and the availability of financing.
Graphite prices have almost tripled from their lows in 2005 due to the ongoing modernization of China, India and other emerging economies which have resulted in strong demand from traditional uses in the steel and automotive industries. In addition, new applications such as lithium ion batteries, fuel cells and nuclear power have the potential to create significant incremental demand growth. There is over 10 times more graphite than lithium, in a lithium ion battery. China, which produces 70% of the world‟s graphite, has instituted export taxes and a licensing system and its production and exports are expected to decline at a time when demand is growing rapidly. High growth, high value graphite applications require large flake and/or high purity graphite

April 30, 2011
Page 48 of 66
which is expected to represent 100% of Bissett Creek production.
Management and Board of Directors is extremely strong: Gregory Bowes B.Sc (geology), MBA CEO and Director Formerly Senior VP, Orezone Gold Corporation Don Baxter P. Eng President Formerly President, Ontario Graphite Corporation Stephen Thompson CA CPA (Illinois) Chief Financial Officer Formerly Vice President Finance, Ottawa Hydro Limited Ron Little P. Eng Director President and CEO, Orezone Gold Corporation (ORE:TSX) Iain Scarr B.Sc (geology), MBA Director Former Commercial Director, Rio Tinto industrial minerals division, VP Corp. Development, Lithium One Jay Chmelauskas P.Eng Director President/Director, Western Lithium Corp. K. Sethu Raman PhD Director Independent Mining Consultant and Founder, Lakeshore Gold Don Christie CA Director Former CFO, Continental Gold John Rogers P.Eng, M.Sc Senior Project Advisor Formerly Manager of Detour Lake and Nanisivik mines, Director of Operations Saudi Arabia Mining Company.
This stock recommended by Karl of British Columbia, Canada.
< No Chart Available From Stockcharts.com >
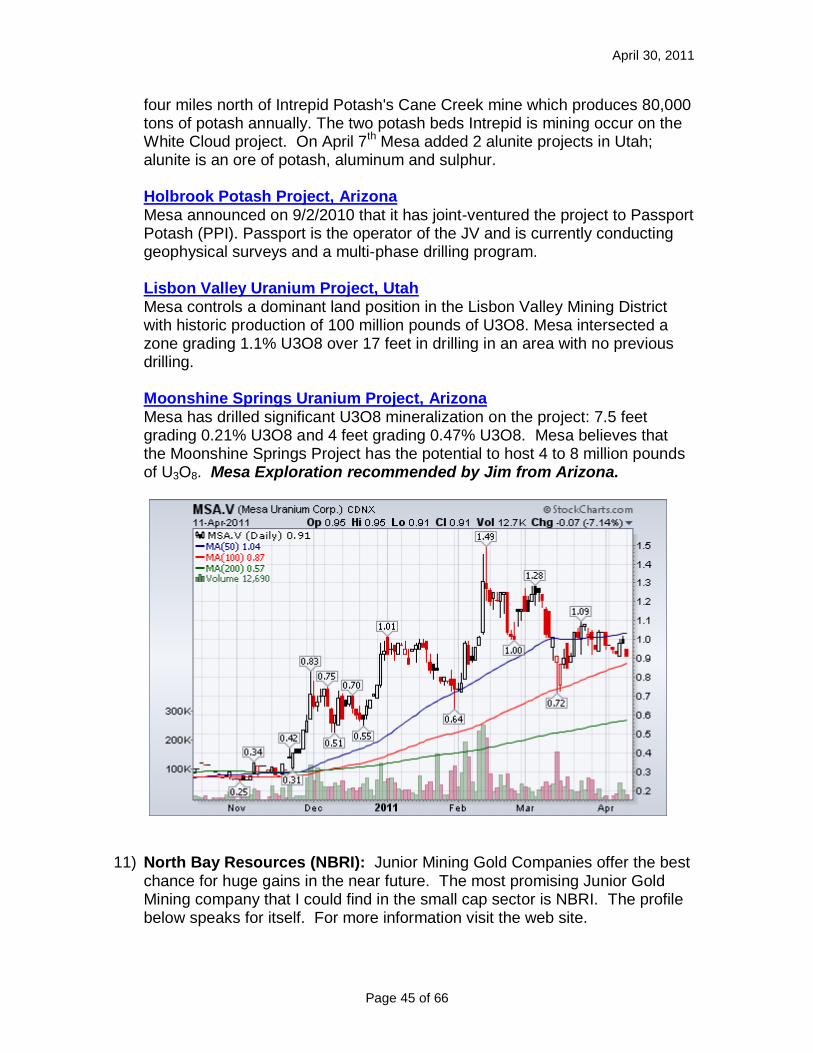
13) Premium Exploration (PEM.V, PMMEF): This will be an exciting summer
drill season in many areas of the planet. One of the most anticipated drill pro Why I have a big position http://idahosilver.blogspot.com/2011/02/why-i-am-buying-pem-premium-exploration.html Idaho doesn't just have silver, lead and zinc, but also has GOLD! I've been accumulating a moderately-sized speculative position of Premium Exploration shares. http://www.premiumexploration.com/ It's a huge district-sized play, with a current MC of around $60M and a huge upside. (FD warrants would add about 30% to the share count) http://tmx.quotemedia.com/quote.php?qm_symbol=pem&locale=EN This includes a recent drill result of 1.5gpt over 134 meters, which is quite good for a potential open pit. (I made some money recently in NGD‟s buyout of Richfield (RVC.V) for the same reason: long profitable drill results that should make a big mining company lick their lips, after a long stretch of under
April 30, 2011
Page 49 of 66
investinging exploration. http://tmx.quotemedia.com/article.php?newsid=38000302&qm_symbol=PEM They have 100% ownership of a 95 sq km area with historical mines and an existing 43-101 of 500K ounces, inferred. Good BNN video, corporate presentation, and interactive 3-D model on their home page. http://www.premiumexploration.com/ Sprott and RBC own shares, and I trust their Due Diligence as much (or more) than my own! If you really want to crank-up the risk / reward scenario, also take a look at Velocity Minerals (VLC.V). They own property adjoining Premium‟s large holding. http://www.velocityminerals.com/i/maps/PEM-VLC-ClaimsMap.jpg Caveat Emptor, do your own research and be sure not to invest too much. If this stock goes to zero, I will not be sleeping under a freeway overpass! This submission by Karl of Silicon Valley.
14) PRETIUM Resources (PVG.TO, PXZRF): This will be an exciting summer
drill season in many areas of the planet. One of the most anticipated drill programs this spring however is that of Pretivm Resources.
Identified as the 5th largest gold deposit located in North America, the resource at Snowfield/Brucejack is quickly expanding to these current published levels.
April 30, 2011
Page 50 of 66
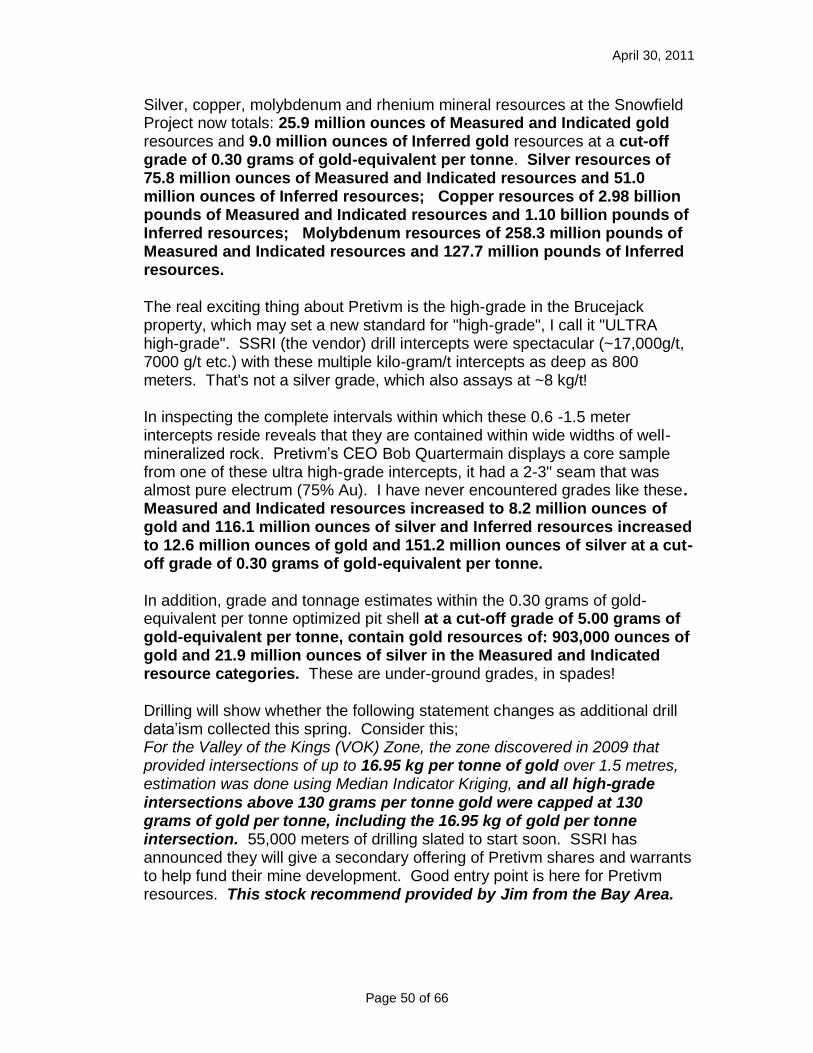
Silver, copper, molybdenum and rhenium mineral resources at the Snowfield Project now totals: 25.9 million ounces of Measured and Indicated gold resources and 9.0 million ounces of Inferred gold resources at a cut-off grade of 0.30 grams of gold-equivalent per tonne. Silver resources of 75.8 million ounces of Measured and Indicated resources and 51.0 million ounces of Inferred resources; Copper resources of 2.98 billion pounds of Measured and Indicated resources and 1.10 billion pounds of Inferred resources; Molybdenum resources of 258.3 million pounds of Measured and Indicated resources and 127.7 million pounds of Inferred resources.
The real exciting thing about Pretivm is the high-grade in the Brucejack property, which may set a new standard for "high-grade", I call it "ULTRA high-grade". SSRI (the vendor) drill intercepts were spectacular (~17,000g/t, 7000 g/t etc.) with these multiple kilo-gram/t intercepts as deep as 800 meters. That's not a silver grade, which also assays at ~8 kg/t! In inspecting the complete intervals within which these 0.6 -1.5 meter intercepts reside reveals that they are contained within wide widths of well-mineralized rock. Pretivm‟s CEO Bob Quartermain displays a core sample from one of these ultra high-grade intercepts, it had a 2-3" seam that was almost pure electrum (75% Au). I have never encountered grades like these. Measured and Indicated resources increased to 8.2 million ounces of gold and 116.1 million ounces of silver and Inferred resources increased to 12.6 million ounces of gold and 151.2 million ounces of silver at a cut-off grade of 0.30 grams of gold-equivalent per tonne. In addition, grade and tonnage estimates within the 0.30 grams of gold-equivalent per tonne optimized pit shell at a cut-off grade of 5.00 grams of gold-equivalent per tonne, contain gold resources of: 903,000 ounces of gold and 21.9 million ounces of silver in the Measured and Indicated resource categories. These are under-ground grades, in spades!
Drilling will show whether the following statement changes as additional drill data‟ism collected this spring. Consider this; For the Valley of the Kings (VOK) Zone, the zone discovered in 2009 that provided intersections of up to 16.95 kg per tonne of gold over 1.5 metres, estimation was done using Median Indicator Kriging, and all high-grade intersections above 130 grams per tonne gold were capped at 130 grams of gold per tonne, including the 16.95 kg of gold per tonne intersection. 55,000 meters of drilling slated to start soon. SSRI has announced they will give a secondary offering of Pretivm shares and warrants to help fund their mine development. Good entry point is here for Pretivm resources. This stock recommend provided by Jim from the Bay Area.
April 30, 2011
Page 51 of 66
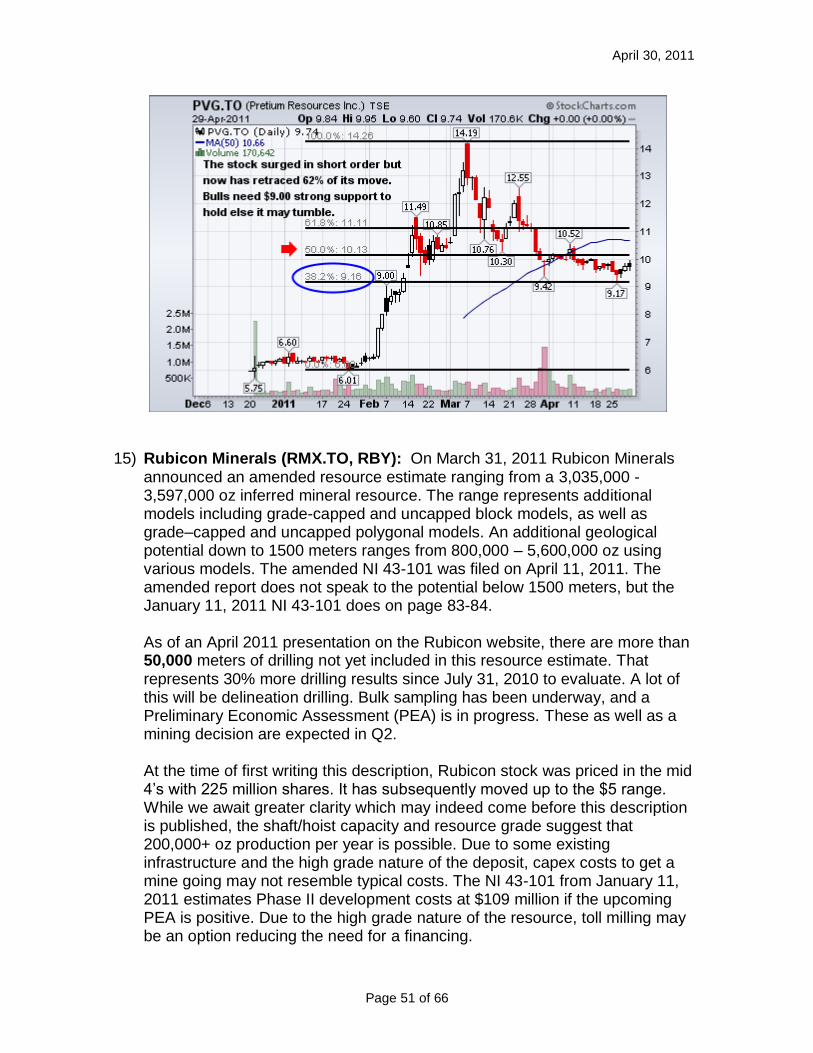
15) Rubicon Minerals (RMX.TO, RBY): On March 31, 2011 Rubicon Minerals
announced an amended resource estimate ranging from a 3,035,000 - 3,597,000 oz inferred mineral resource. The range represents additional models including grade-capped and uncapped block models, as well as grade–capped and uncapped polygonal models. An additional geological potential down to 1500 meters ranges from 800,000 – 5,600,000 oz using various models. The amended NI 43-101 was filed on April 11, 2011. The amended report does not speak to the potential below 1500 meters, but the January 11, 2011 NI 43-101 does on page 83-84. As of an April 2011 presentation on the Rubicon website, there are more than 50,000 meters of drilling not yet included in this resource estimate. That represents 30% more drilling results since July 31, 2010 to evaluate. A lot of this will be delineation drilling. Bulk sampling has been underway, and a Preliminary Economic Assessment (PEA) is in progress. These as well as a mining decision are expected in Q2.
At the time of first writing this description, Rubicon stock was priced in the mid 4‟s with 225 million shares. It has subsequently moved up to the $5 range. While we await greater clarity which may indeed come before this description is published, the shaft/hoist capacity and resource grade suggest that 200,000+ oz production per year is possible. Due to some existing infrastructure and the high grade nature of the deposit, capex costs to get a mine going may not resemble typical costs. The NI 43-101 from January 11, 2011 estimates Phase II development costs at $109 million if the upcoming PEA is positive. Due to the high grade nature of the resource, toll milling may be an option reducing the need for a financing.
April 30, 2011
Page 52 of 66
Rubicon may be producing very large earnings quickly due to a compressed mine development timeline. Shares purchased now may be at a very deep discount to future earnings. Website: www.rubiconminerals.com Rubicon is recommended by Peter from Texas.
16) Ruby Creek Resources (RBYC.OB): Ruby Creek is a relatively new gold
development ( and soon to be producer ) company, with a very small market cap ( approximately $40 million ), but, very large gold prospective land holdings ( over 800 sq. km currently owned or under sale agreement and soon to be settled ). Their main project is the Gold Plateau, comprising four large adjacent properties. The Gold Plateau is a very large placer deposit formed millions of years ago, it is thought the area was a very large lake. Placer deposit experts have been over much of the property and believe it to almost entirely prospective for gold production. Artisan miners have been hand mining the area for many years and will continue to do so as employees of Ruby, but with large equipment designed for extracting even the finest flake gold from placer deposits. Rather than expend a great deal of capital on exploration, and delaying production, Ruby has adopted a business plan , under which it will start production ( relatively very shallow mining is required, with extraction depths at a maximum of 10 meters or so, which results in a much lower mining cost ). The production revenues will then be used to finance further exploration and production, rather than additional equity raises, which most gold companies are required to do. This keeps dilution at the bare minimum, and obviously, results in much greater profits to each shareholder of Ruby.

April 30, 2011
Page 53 of 66
Recently, at the Chicago Resource Expo, Ruby's management said that they hope to achieve gold production, starting this quarter. I strongly encourage, all possible investors, to read Ruby's latest news release of April 12, wherein Ruby lists 12 goals for 2011, half to develop production and half to enhance their corporate development. Ruby's management expects to leave 2011 with positive cash flow operations. Operating a mining operation cash flow positive, within only 2 or so years of beginning, is nothing short of amazing. Regarding exploration, some think Ruby's Gold Plateau could easily hold 5 to 10 million ozs. of recoverable gold. My very rough estimation easily exceeds 20 million ozs. In my opinion, Ruby Creek Resources is by far the most undervalued gold development company, on the verge of gold production, available for investing in the markets today. Do your own due diligence and invest accordingly. I have ! This stock submitted by Andrew of the USA.
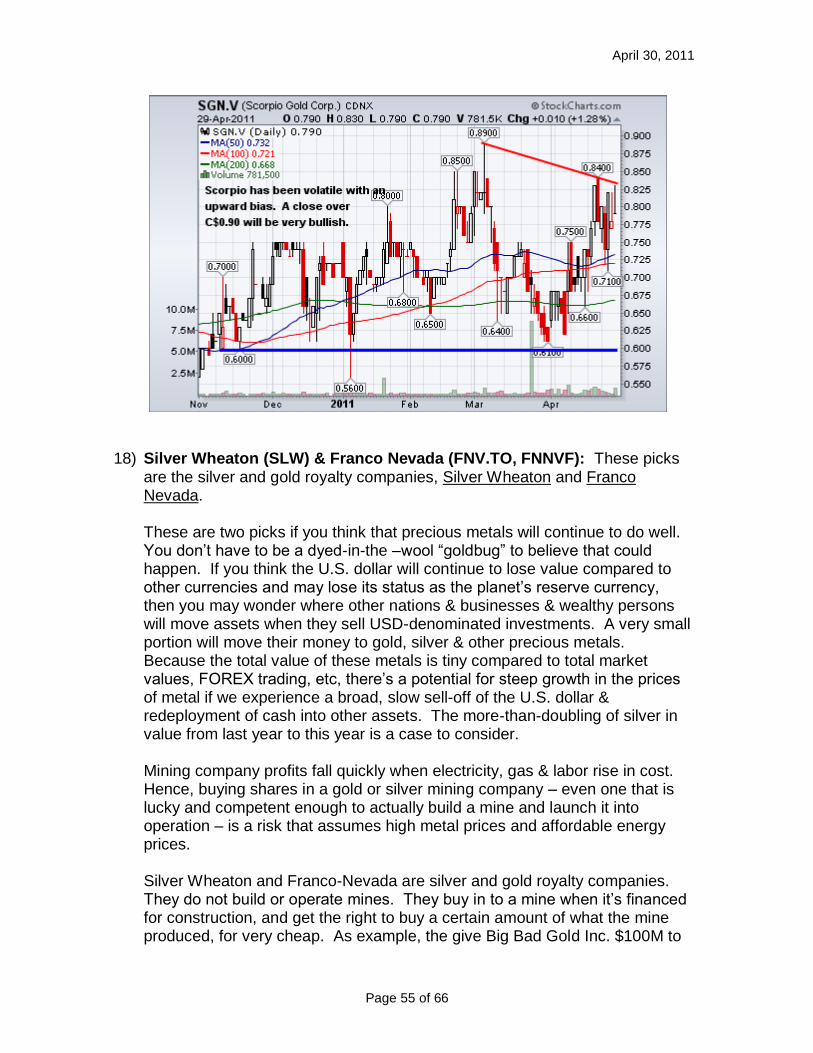
17) Scorpio Gold (SGN.V, SRCRF): Scorpio Gold is a major “sleeper” stock that
I believe is about to wake up. In June 2009, it was spun off from Scorpio Mining (SPM.T), an emerging Mexican gold and silver producer, amidst the chaos of the global financial crisis, and didn‟t acquire its key project, Mineral Ridge, in Western Nevada, until March 2010.
Scorpio Gold‟s CEO, Peter Hawley, is one of the most well-respected operators in the business, having built Scorpio Mining from nothing into a 2+ million oz. silver producer in 2010. And he intends to do the same thing with
April 30, 2011
Page 54 of 66
Scorpio Gold, which owns 70% of the Mineral Ridge project and options to acquire the remaining 30% (the minority interest is held by Golden Phoenix Minerals – GPXM.OB).
Nearly 600,000 ozs. of gold have been produced at Mineral Ridge historically (both open pit and underground), most recently in 2005, and the company aims to re-commence production THIS MONTH (April), targeting production of roughly 42,000 ozs. of gold in 2011 and 60,000-80,000 ozs. in 2012.
Following an $11.6 million equity offering in January (at C$0.60 with NO WARRANTS), the Company is ready to start production, and recently commenced an aggressive 2011 drilling campaign. An initial Mineral Ridge 43-101 report in early 2011 showed resources of 357,000 ozs. of gold, but the 2011 exploration campaign, entailing 13,000+ meters of drilling, is targeting a significant increase in this figure, to perhaps more than one million ounces. Moreover, nearly 100,000 meters of historical drilling near the leach pad and operating pits have yet to be incorporated into 43-101 compliant resources/reserves.
Drilling results from the 2010 program were very encouraging, particularly as nearly all the major intercepts, such as 10.7 meters of 31.39 g/t Au, were discovered just below the surface. While production ramps up in the second half of 2011, the drilling program will be ongoing, targeting an increase in existing resources, additional resources from adjacent pits (some of which already have historical resources), and exploration of the remainder of the property for additional discoveries.
Scorpio has three other properties in Canada, one of which (Cochrane Hill, Nova Scotia) is optioned to Atlantic Gold, which can earn 60% ownership over a 4-year period by paying $100,000 of royalties and spending $4.75 million in exploration. However, the main area of focus for investors will clearly be Mineral Ridge, which has the potential to turn Scorpio Gold into a 100,000+ oz. gold producer, in one of the best mining jurisdictions in the world, in the not too distant future.
Currently, there are roughly 102 million fully-diluted shares outstanding, so the market cap is approximately US $80 million, and it is a very tightly held stock. The recent $11.6 million offering was, in essence, a rights deal, as eight institutions own more than 60% of the stock, including major buy-side groups such as Toqueville, Sprott, and RBC. Andy from Colorado wrote this stock recommendation.
April 30, 2011
Page 55 of 66
18) Silver Wheaton (SLW) & Franco Nevada (FNV.TO, FNNVF): These picks
are the silver and gold royalty companies, Silver Wheaton and Franco Nevada.
These are two picks if you think that precious metals will continue to do well. You don‟t have to be a dyed-in-the –wool “goldbug” to believe that could happen. If you think the U.S. dollar will continue to lose value compared to other currencies and may lose its status as the planet‟s reserve currency, then you may wonder where other nations & businesses & wealthy persons will move assets when they sell USD-denominated investments. A very small portion will move their money to gold, silver & other precious metals. Because the total value of these metals is tiny compared to total market values, FOREX trading, etc, there‟s a potential for steep growth in the prices of metal if we experience a broad, slow sell-off of the U.S. dollar & redeployment of cash into other assets. The more-than-doubling of silver in value from last year to this year is a case to consider.
Mining company profits fall quickly when electricity, gas & labor rise in cost. Hence, buying shares in a gold or silver mining company – even one that is lucky and competent enough to actually build a mine and launch it into operation – is a risk that assumes high metal prices and affordable energy prices. Silver Wheaton and Franco-Nevada are silver and gold royalty companies. They do not build or operate mines. They buy in to a mine when it‟s financed for construction, and get the right to buy a certain amount of what the mine produced, for very cheap. As example, the give Big Bad Gold Inc. $100M to
April 30, 2011
Page 56 of 66
help it build it‟s mine and they get the right to buy 20% of all gold produced from the mine at $400 per ounce. This insulates them from rising fuel & labor costs, the costs of mine expansion, etc. Silver Wheaton trades on the NYSE (SLW) and correlates highly to the price of silver. It may be the most “pure play” on silver other than silver ETFs. It‟s definitely a “buy on the dip with a limit order” stock because it‟s fairly volatile. Its URL is http://www.silverwheaton.com/. Its advantage is the diversity of projects it gets royalties from, the fact that it‟s insulated from mine operation costs, and its growth. It has also recently begun to pay a small dividend. Don‟t buy it if you think the high prices in silver in the last few months are the top! Franco-Nevada is completing a merger with smaller Gold Wheaton, a mostly-gold royalty company. http://www.franco-nevada.com/ It‟s been less volatile than SLW lately, but so has the price of gold. FNNVF is not a pure gold play – it has some ~20% royalty income from platinum and related metals and about 15% royalty income from petroleum hydrocarbons. Like SLW, FNNVF insulates itself from mine operating costs (and mine development overruns) by buying in up-front. Same warning here – don‟t buy this if you think gold prices have peaked. Both SLW and FNNVF also have warrants. A warrant is typically more volatile than the common share and is like a call option – it‟s the right to buy a share at a certain price, expiring on a certain date. Warrants are not for beginners and if you‟re a U.S. citizen there are a few additional rules and “don‟ts” – but they are legally tradable in the U.S. One place to start learning about warrants is http://canadianwarrants.com/values/current.htm. These stocks are recommended by Dan from Sacramento, California.

April 30, 2011
Page 57 of 66
19) Tag Oil (TAO.V, TAOIF): TAG is a smallish ($400m diluted market cap) Canadian-based oil-and-gas exploration-and-development company, operating entirely on the North Island of New Zealand, where they have two distinct prospect areas, one on the West Coast and the other on the East Coast. These are the two sides to TAG's "personality", as it were, and should be examined separately.
TAG's West Coast operations consist of some operating wells (recently drilled) and a number of prospects, in oil, gas and gas condensates. They
April 30, 2011
Page 58 of 66
have a 20% interest in the offshore Kaheru gas/oil prospect, and a sizable onshore oil prospect at Cheal, next to a gas/condensate prospect at Cardiff.
The real story on the West Coast, at least for now, is the Sidewinder discovery farther north. They have drilled two wells in the last few months, both of which have been more successful than expected. Both, also, were expected to produce largely gas, but have in fact turned up much more oil than expected. Sidewinder will require more wells to be drilled this year to take advantage of the windfall. TAG is talking about producing 2,500 boe/day by the end of 2011, but there's a very strong chance they will do somewhat better. Sometimes, oil properties are valued on a "dollars per flowing barrel" basis. At $60k/flbbl, this would value Sidewinder at $150m+. Add in a possible 1k boe/day from Cheal for $200m+ total. It should be noted that reserve size for Cheal and Sidewinder has not yet been established, and a valuation based on theoretical recoverable reserves would be somewhat lower.
Thus, it can be seen that the value of TAG's various West Coast properties backstops much of their market cap. It's not altogether unlikely that the West Coast will turn out to be worth a good deal more. However, the West Coast is not what makes TAG's story so interesting. In fact, it has usually been viewed as just a place for the company to establish cash flow so that it can go after the real prize, which is on the other side of the island.
On the East Coast, TAG has 100% control of two properties, totaling about two million acres. Third-party "mid-case" estimates of the oil "in place" on those properties give 1.7 billion barrels of "conventional" oil (both deep and shallow) and 12.6 billion barrels of "unconventional" oil, that is, "shale oil". Until a few years ago, it would have been uneconomical to extract the unconventional oil, but newer technology (horizontal wells with multi-stage fracturing) in the Barnett (Texas) and Bakken (North Dakota) shale oil deposits have shown that $billions are to made there. TAG believes that its shale oil deposits are comparable, if not superior, to the Bakken in a number of ways.
If TAG can get even 5% of the East Coast conventional oil out of the ground, and 1% of the 12.6 billion barrels unconventional, valued at $10/bbl (low), the results would be worth over six times current market cap. Assuming higher recovery rates and higher per-barrel value will result in much higher multiples than that. A further consideration is that only 10% of TAG's property was included in the resource estimates.
The company is well cashed-up from a recent private placement, and should be generating positive cash flow from the West Coast later this year. This will enable exploration drilling of the East Coast, starting this year, and later development.

April 30, 2011
Page 59 of 66
I view my TAG position as something of a lottery ticket, in that it can make me rich for a relatively small investment. Unlike a lottery ticket, though, the chances of success are fairly strong and, I believe, out of all proportion to the potential reward. Mark from Colorado and Bob from New Mexico submitted this stock recommendation.
20) Teuton (TUO.V, TEUTF): I have held a position with Silver Standard for a
long time and just in the last months Pretium came into existence. It is managed by Bob Quartermaine who had been the CEO of Silver Standard since I first purchased the stock. The project in B.C. that he is managing has 35 million ozs of gold and 127 million ozs of silver. That does not even count the copper, Moly, or Rhenium. It lies alongside the Seabridge project, which is even bigger. The attached Map tells the whole story. And of course Teuton Resources is just south of Pretium and Seabridge. See this link for the map: http://postimage.org/image/20h22j5qc/
The trend for Pretium flows into Teuton‟s High Property. It is their contention that to expand what Pretium is drilling they will have to buy out Teuton. In one year Teuton went from $0.07/shr to $0.70/shr. It has a long way to go and is still cheap. Teuton also is looking for other companies to JV with them on other projects that they own. They are a project generator company, and that is what Rick

April 30, 2011
Page 60 of 66
Rule looks for when it comes to investments. Company Website: http://www.teuton.com/. Teuton is recommended by Bob from Chicago.
21) U. S. Silver (USA.V, USSIF): United States Silver produces about 2.5 M
ounces of silver, 6 M pounds of lead and 1.2 M pounds of copper per year. The mine is located in the silver valley in Idaho. It is one of the largest silver producing mines in the history of the United States. U.S. Silver is currently working on a second mine (Coeur) that should start producing 500,000 ounces of silver at the end of the year. U.S. Silver should earn close to $40M in 2011 or .13 per share if silver is in the $35 area. They have $16M in tax loss carry forwards so they should not be paying any taxes for at least eighteen months. They have no debt and $8M in cash on hand as of September 30, 2010. Their 2011 cash flow should be about $50M with Capex expenses of about $15M. They have 20% of their 2011 production hedged at $27.50 which is a slight negative. No silver is hedged beyond 2011. They had a mine accident that killed a worker last June that has hampered production. December production was the second biggest month ever so production seems back on track. This stock is selling at about 5X 2011 earnings and IMHO is one of the most undervalued stocks I have ever seen. This stock recommend provided by Roger from Florida.
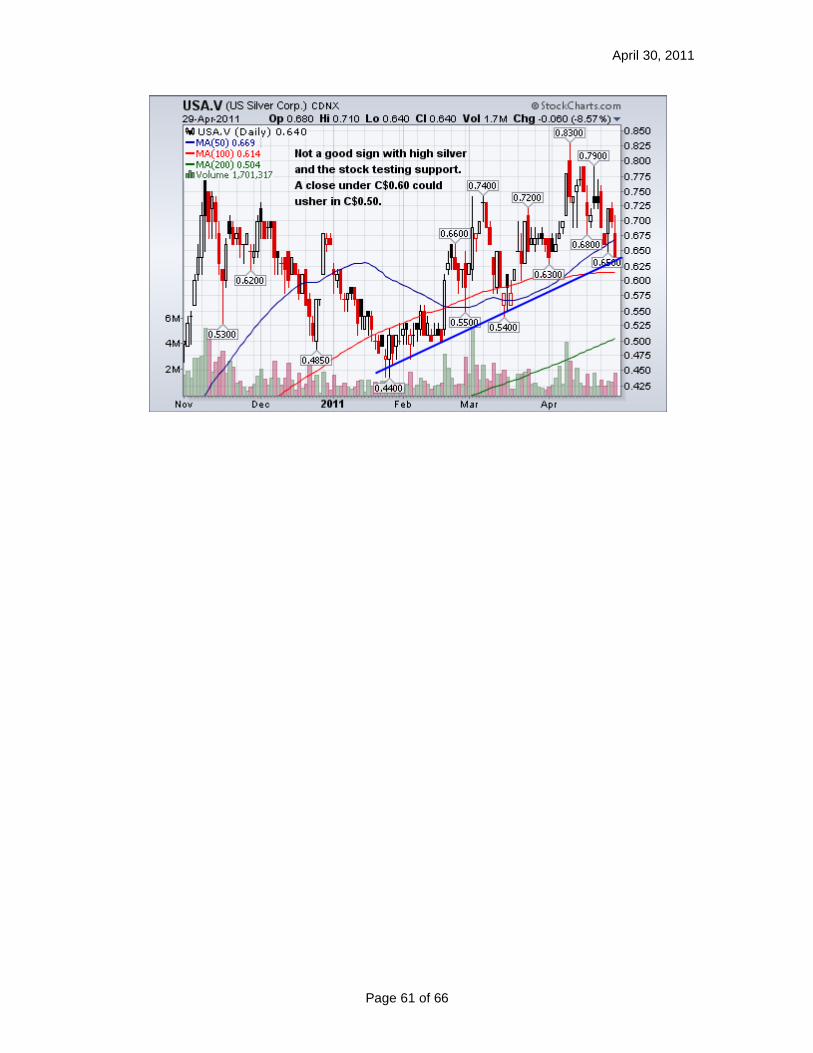
April 30, 2011
Page 61 of 66
April 30, 2011
Page 62 of 66
Final Thoughts The second round of Quantitative Easing has been good to stocks, bonds and commodities. History shows that no one has been able to create long term money printing nirvana without severe consequences. There are some cracks showing up in the QE campaign. Inflation is picking up and the US dollar is now just 3 points away from a place where a currency crisis can erupt. I thought eventually QE would show up in the US as inflation but not as quickly as it has. There‟s a belief that so long as the labor market struggles, inflation cannot take root and grow. The problem as we see from the late 1970‟s is high unemployment and inflation can coexist. The US Fed must continue printing to be the buyer of last resort to fund the massive $1.5 Trillion US deficit. However, in my opinion, QE3 will not be hinted at or implemented by the Fed until late this year or early next year. The US dollar is too close to a cliff, commodity inflation has to subside and QE3‟s premature introduction will have much less effect in getting US incumbents elected again in November 2012. If I am right that the US Fed takes the QE punch bowl away as planned at the end of June, we should see a correction in many asset classes. This will certainly negatively impact commodities. Should a correction occur, please use the opportunity to buy physical gold and/or silver (see Appendix I). Best of luck, Toby www.heavymetalinvestor.com
April 30, 2011
Page 63 of 66
Disclosure: The author has not been paid to write this report, nor received any other incentive to do so. The author holds positions in many of the companies mentioned in this report and will benefit from their increase in stock prices. Disclaimer: The author‟s objective in writing this article is to promote potential investor interest in these stocks to the point where they are encouraged to conduct their own research. Neither the information, nor the opinions expressed should be construed as a solicitation to buy or sell these stocks. Investors are recommended to obtain the advice of a qualified investment advisor before entering into any positions. While every effort has been undertaken to supply the most accurate information possible, errors will exist and each reader is responsible for verifying the information presented in this report. About the Author: Toby Hansen began writing a Newsletter in 2003 with a dozen readers. The popularity of his work has now grown to nearly 1700 readers worldwide. He publishes quarterly with a review and analysis of economic trends, addresses commodity markets with emphasis of the precious metal sector, suggests stocks for further due diligence and shares reader recommended stocks. Mr. Hansen‟s Newsletter includes extensive technical analysis on the broad markets, key currency movements, base & precious metals and all equities mentioned. Mr. Hansen presently works for Ruby Creek Resources (RBYC.OB) and was formerly a R&D Engineer. Over an engineering career spanning 18 years he holds five US Patents (#6,012,521, #6,227,853, #6,624,539, #6,909,666 & #7,864,015) and has three additional patents pending. He has earned a bachelor in Mechanical Engineering at the University of Utah and a Masters Degree in Engineering Mechanics at Iowa State University being awarded several academic honors. His free Newsletter is published quarterly during the months of March, June, September and December. To subscribe for recent and future editions, please email him at [email protected] (tobinator zero zero @yahoo.com).
April 30, 2011
Page 64 of 66
Appendix I
Buying Physical Gold & Silver I have led many into the precious metals market. Most begin severely gun shy at first but then begin to realize that gold isn‟t some bizarre investment that most mainstream advisors proclaim. We are currently witnessing a credit market meltdown that has no other parallel since the 1930‟s. I have found no one who clearly knows where the present crisis leads but, there is now the possibility of the entire credit market going into complete disarray. The reason is the shaky financial instruments in question are many times larger than the world‟s GDP. This section is to allow you the means to protect yourself from a financial collapse. I have done this in the spirit of hope for the best but prepare for the worst. There are many ways to own exposure to the precious metals sector. The most popular is to buy gold stocks or to buy shares in exchange traded funds (ETF‟s). If a financial meltdown were to occur, neither gold stocks nor an ETF may offer you protection. The reason is both investment vehicles are held by third parties. How do you know how safe your investments are when your stock broker or those who are custodians of the ETF go bankrupt? If you do get 100% of your investment back, how many months or years might it be before you can get at the funds? This is where owning physical metal offers the best form of financial protection. The first objection you always hear is about storage. I will tell you storage is no problem. One million dollars worth of gold or platinum can fit in a standard $30/year safety deposit box at your bank. Pretty cheap considering the value of wealth you are storing. Silver, on the other hand, is a completely different story. How does one go about buying gold? I prefer to go to online vendors to get the best prices. The two I have had good luck with are American Precious Metals and Bullion Direct. Their websites are:
American Precious Metals: http://www.apmex.com/ Bullion Direct: http://www.bulliondirect.com I have no financial relationship with either of them except as a satisfied customer. Gold can be purchased via bullion bars or coins. The advantage of buying bullion bars is the amount of premium over the spot price is lower than with coins. One issue with bullion bars is there has to be some proof that they are genuine containing the gold they say they do. Many gold bars come with some form of official certification. I would recommend buying only those bars that are certified. Coins traditionally are anywhere $20 - $50 higher than gold‟s spot price. Most coins are 1 Troy ounce (31.1 grams) with some coin series in half, quarter and one tenth sizes. The smaller the size the higher the premium associated with the
April 30, 2011
Page 65 of 66
price. There is one 1 ounce coin that has very little premium over spot: the South African Kruggerand. Kruggerands are about the cheapest way to own gold. They are fairly ugly coins but beauty isn‟t much of a concern in times of crisis. Coins do enjoy a slight edge over bullion in that there is less question they are genuine gold containing instruments. While Kruggerands offer the cheapest way to own gold, I would recommend buying gold denominated in your own currency such as Maple Leafs for Canadians and Eagle for Americans, though having any gold in a time of crisis will give you some protection.
April 30, 2011
Page 66 of 66
Appendix II
Recommended Investment Books The following books are some of the best texts I have found and have helped me to identify stocks and understand technical analysis. I have no financial ties to Amazon.com or any of the Authors. 1. How to make money in Stocks by Bill O‟Neil http://www.amazon.com/How-Make-Money-Stocks-Winning/dp/0071373616/ref=pd_bbs_sr_1/104-1116007-6138357?ie=UTF8&s=books&qid=1178390763&sr=8-1
2. Japanese Candlestick Charting Techniques by Steve Nisson http://www.amazon.com/Japanese-Candlestick-Charting-Techniques-Second/dp/0735201811/ref=pd_bbs_sr_1/104-1116007-6138357?ie=UTF8&s=books&qid=1178391278&sr=1-1 3. The Visual Investor: How to spot market trends, by John Murphy http://www.amazon.com/Visual-Investor-Spot-Market-Trends/dp/0471144479/ref=pd_bbs_sr_1/104-1116007-6138357?ie=UTF8&s=books&qid=1178391374&sr=1-1 4. Technical Analysis from A to Z, by Steven Achelis http://www.amazon.com/Technical-Analysis-2nd-Steven-Achelis/dp/0071363483/ref=sr_1_1/105-2238205-6313213?ie=UTF8&s=books&qid=1192396454&sr=1-1 5. Technical Analysis of Stock Trends, Ninth Edition by Edwards & McGee http://www.amazon.com/Technical-Analysis-Stock-Trends-Ninth/dp/0814408648/ref=pd_bbs_1/104-1116007-6138357?ie=UTF8&s=books&qid=1178391495&sr=1-1


![Date: 20170419 Chemical Company and... · Page: 3 I. Overview [1] In these reasons, I refer to the plaintiffs Dow Chemical Company, Dow Global Technologies Inc and Dow Chemical Canada](https://img.pdfslide.us/doc/110x75/5b6414c47f8b9af5448ccff3/date-chemical-company-and-page-3-i-overview-1-in-these-reasons-i-refer.jpg)